Indian e grocery market
24
Build together Win together Indian e grocery market FY18 Reporting 20 th June, 2018
Transcript of Indian e grocery market
Build together
Win together
Indian e grocery market
FY18 Reporting
20th June, 2018

Table of Contents
2©Praxis Global Alliance |
S. No ContentPage
No.
1 Executive summary 3
2 PGA e grocery players MIBEX competitiveness index 4
3 Online grocery market definition 5
4 e grocery market growth and growth drivers 6
5 Key trends 7
6 e grocery market split by – player, category, brand and model 8
7 e grocery players competitive landscape- FY18 10
8 Private label brand by players 12
9 Flipkart and Amazon grocery selling channels 14
10 e grocery players marketplace , inventory and private label margins 15
11 Online grocery buyers behavior 16
12 Key imperatives 18
13 Sources of input 19
14 Glossary 20
15 About 22

Executive summary
3© Praxis Global Alliance |
• e grocery market is riding the internet wave and is growing rapidly
o Sized at ~USD 600 M in FY17 and ~USD 900 M in FY18, e grocery market is expected to grow @~70% CAGR to reach USD 7.5 B by 2022
o The strong growth is being driven by increased investments in the space, FDI through large players, emergence of more successful inventory based models, improved
consumer understanding by players, higher consumer awareness and comfort level with shopping grocery online, increasing order values, and better service levels
through supply chain innovation, and private label sales
• BigBasket is the leading player in the Indian e grocery market (~$300M GMV) with a market share of almost 35%, followed by Amazon and Grofers at 20% and 17%
respectively
o Large investment in ‘private label brands’ and better supply chain control driving BigBasket’s profitability
o BigBasket is also driving ~20% of their GMV through HoReCa channel – selling directly to B2B customers
o Amazon sells groceries through 4 different channels – Amazon Prime Now, Amazon Prime 3P, Amazon Pantry and Amazon.in. 63% of Amazon’s grocery is sold
through Amazon.in
o Grofers shift from ‘marketplace’ model to ‘inventory’ model removed their dependency on sellers and improved margins. Further, Grofers has shown 100%+ growth in
FY17-18 to grow to $150M+ GMV in FY18
• At 60%, ‘packed food & beverages’ is the biggest category in e grocery space, followed by ‘non-food FMCG’ and ‘fresh food’ contributing 25% and 15% market
share respectively. ‘Private label brands’ as a model offer higher margins (7-15% higher depending upon category) and better supply chain control as compared
to ‘marketplace’ and ‘inventory’ and online players are betting big to drive profitability through this
• Online grocery customers are more sticky – 80% of online grocery shoppers buy 1-2 times a month online and >50% of their monthly grocery spend is online
• >50% in metros buy from vertical focused players but in smaller towns, grocery is still bought through horizontals majorly
• Typically, online share of wallet even in the high spenders has capped at ~70% of total monthly spend, where consumers prefer to spend the remainder 30% offline
• Discounts, quality, and variety are the top three reasons to buy grocery online
• There is strong habit forming – even after comparing prices, customers order from the portal they are comfortable with
• Three reasons offline purchase happens is handpicking of fresh items, offline store experience with family and urgent / immediate needs
• Margins in the category still remains a challenge – no player is currently profitable, and all are making losses of up to 10-30% of their GMV
• Typically, at an AOV of $20, at best total buy-sell margins are ~15-20%, but $1.5 is the average delivery cost and $2 is the average fulfillment cost per order – and this
varies less by order size / value.
• Further, there is a $2-3 fixed cost per order (marketing, G&A, etc.). This makes driving positive economics tough for players
• Driving increase in AOV, selling higher ticket size products, increased penetration of private label, supply chain cost efficiency, and bringing in ancillary revenue
streams have been some measures players are using to improve economics at a unit level
Note: All data and references from this report should be attributed to ‘Praxis Global Alliance -Indian e grocery market FY18 Reporting’

Summary: BigBasket leads PGA MIBEX with 77 points followed by Grofers and Amazon with 75 and 43 points respectively
4© Praxis Global Alliance | Source: PGA MIBEX model
Momentum in business 6 6 24
Investor optimism 8 7 8
Brand equity 12 8 14
Economics 8 5 14
Customer eXperience 12 12 15
46 38 75PGA MIBEX
PGA MIBEX
is out of 100
points.
MIBEX
denotes a
composite
score
showing the
business
strength
and
momentum
of a
business in
its space
12
8
12
8
14
54
19
10
16
18
16
79

Online grocery market definition: Grocery is not a category, it is a sum of multiple categories
5© Praxis Global Alliance |
Online grocery
Sold online - Web / mobile
Fresh Food: FnV, Meat, dairy and
breadsPackaged food and beverages Non food
Source: Primary research, Secondary research , IBEF report and Praxis analysis
FMCG
Non- FMCG
Fruits
Vegetables
Fresh Meat
Fresh dairy
Staple Spices
Frozen meat &
Seafood
Edible oil
DairyBiscuits Eggs
Personal care
Cleaning essentials
Plastics
Juice
Soft drinks
ChipsSauce, Jam
& picklesTea & CoffeeCereals Dry fruits
Health food

Indian e grocery market is currently sized at ~USD 900M (FY18); expected to grow at a CAGR of ~70% to reach ~USD 8B in 2022
6© Praxis Global Alliance |
600 900
7,500
-
2,000
4,000
6,000
8,000
FY17 FY18 FY22(P)
Mark
et siz
e (
$ M
)
Indian e grocery market size (M)
CAGR
50%
CAGR
70%
Market growth driversMarket growth
Better economics and supply chain control on private label
products
More than $800M investment in e grocery market in 2018
Improved customer experience by same day and next day
delivery
Increasing internet penetration – 21% in FY14 to 36% in FY18
Increasing GMV share of Tier II and Tier III cities
Government support- 100% FDI in marketplace model under
automatic route
Supply chain and private label
Investment and infrastructure development
Source: Primary research, Secondary research , IBEF report and Praxis analysis
Note: For Flipkart grocery - regular Flipkart and Flipkart supermarket are both included; For Flipkart grocery - Amazon Now, Amazon 3P and Amazon pantry are considered ; For Amazon and Flipkart regular personal care
is not included

Key trends we are observing in the market
7© Praxis Global Alliance |
Supply side trends Demand side trends
Private label: Amazon, Flipkart, BigBasket and Grofers all are increasing
private label brands given their profitability
Multiple channels of selling: Amazon is selling groceries through
Amazon Now, Amazon 3P, Amazon Pantry and Amazon.in. Flipkart is
selling groceries through Flipkart Supermart and Flipkart.com.
Supply chain experimentation: All e grocery players are experimenting
with supply chain. Flipkart Supermart has a single fulfillment center and
multiple cross docks . BigBasket is consolidating all small warehouses.
Grofers is also trying to consolidate fresh food, non fresh food and non
food warehouses. Amazon has a dedicated Now channel.
Move towards inventory model: While Grofers has moved from
marketplace model to inventory model, Amazon Pantry, Amazon Prime
Now, BigBasket and Flipkart Supermart have always followed the
inventory model with respective shares of 80%, 100% (excluding 3P),
92%, and 100%.
Focus on customer value proposition: BigBasket and Grofers both
have launched their loyalty programs to provide additional discounts,
better offers and flexible delivery timings. Grofers’ subscription-based
loyalty program reached 1.5L members in just 90 days.
Improving share of HoReCa in GMV: BigBasket and Grofers are doing
institutional sales and continuously increasing their share- BigBasket and
Grofers HORECA contribution to GMV is 20% and 10% respectively.
Increasing AOV driving profitability: Increase in AOV is reducing the
variable cost per order and thus driving profitability. Grofers has doubled
its AOV to INR 1,400 this year by focusing on monthly sales.
Improving customer repeat rates: Customer repeat rate is improving
and is between 2-3x for all players in the vertical category.
Increasing share of wallet: Online grocery buyers spend 50% of their
grocery budget in online grocery purchase and this is increasing.
Metro vs non metro buyers: >50% online grocery buyers in metros
purchase their groceries from vertical players whereas in smaller town its
still purchased through horizontals
Online capping of penetration: Online share of wallet even in the high
spenders has capped at ~70% of total monthly spend, where consumers
prefer to spend the remainder 30% offline
Drivers to buy grocery online: Discounts, Quality, and Variety are the
top 3 reasons to buy grocery online
Habit forming category: There is strong habit forming – even after
comparing prices, customers order from the portal they are comfortable
with
Reason people shop offline: Three reasons offline purchase happens is
handpicking of fresh items, offline store experience with family and urgent /
immediate needs
Source: Primary research, Secondary research , IBEF report and Praxis analysis

Overall segmentation of e grocery market on the basis of player, category, model and brand - FY18
8© Praxis Global Alliance |
Bigbasket, 34%
Amazon, 20%
Grofers, 17%
Paytm, 7%
Flipkart, 4%
Packaged food & beverages, 60%
Non food, 25%
Fresh food, 15%
Inventory, 74%
Marketplace, 26%
Other brands, 77%
Private label, 23%Others, 18%
0%
10%
20%
30%
40%
50%
60%
70%
80%
90%
100%
Player Category Model Brand
% G
MV
Indian e grocery FY18 GMV (100%)
Source: Primary research, Secondary research , IBEF report and Praxis analysis
Note: For Flipkart grocery – Flipkart.com and Flipkart supermarket are both included in calculation; Amazon grocery- Amazon Now, Amazon 3P, Amazon Pantry and Amazon.in are considered for calculation

Grofers has demonstrated strong growth in FY18 growing at >100%
9© Praxis Global Alliance | Source: Primary research, Secondary research , IBEF report and Praxis analysis
Note: For Flipkart grocery – Flipkart.com and Flipkart supermarket are both included in calculation; Amazon grocery- Amazon Now, Amazon 3P, Amazon pantry and Amazon.in are considered for calculation
2035 35
6070
150
120
180 185
310
0
50
100
150
200
250
300
350
FY17 FY18 FY17 FY18 FY17 FY18 FY17 FY18 FY17 FY18
GM
V (
M)
Grocery GMV growth from FY17 to 2018
~75%~70
~110%
~50%
67%

%HORECA
GMV
N/A
N/A
N/A
20%
10%
Fresh
food
Packaged
food and
beverages
Non
food
# of
SKUs
N/A 25% 75% 25k+
10% 50% 40% 25k+
N/A 45% 55% 25k+
25% 65% 10% 22k
10% 80% 10% 6k+
e grocery players competitive landscape- FY18
10© Praxis Global Alliance |
Ho
rizo
nta
lsV
ert
ica
ls
Overall economics
FY 18
GMV
($M)
FY 18 #
of
orders
per day
(‘000)
FY 18
AOV ($)
# of PL
brandsMarketplace Inventory
35 ~15 ~7 1 70% 30%
180 ~50 ~10 1 45% 55%
60 ~15 ~10 N/A 100% N/A
310 ~35 ~20 11 5% 95%
155 ~20 ~20 6 10% 90%
Assortment
Note: *Includes HoReCa; ^Excludes HoReCa; Grofers has reduced the # of SKUs from 12,000 to 6,000; Bigbasket has increased the number of SKUs from 18k to 22k ; * SKUs under Amazon now and Pantry, # of SKUs
exclusively under Amazon now- 6K
Source: Primary research, Secondary research , IBEF report and Praxis analysis
HORECA
April
2018
monthly
RR ($
M)
April
2018
daily
orders
(‘000)
April
2018
AOV ($)
6 ~20 8
21 ~60 11
6 17 12
~30 ~40^ 22
23 ~30^ 21
April 2018 economics

Indian e grocery market competitive landscape
11© Praxis Global Alliance |
Ho
rizo
nta
lsV
ert
ica
ls
Recent activities Future plans
• Started Flipkart Supermart for employees on Aug 2017
• Currently active in only 1 city - Bengaluru
• Has one dedicated warehouse for groceries in Bangalore
• Launched Flipkart Supermart at Bangalore on November
• Planning to expand Flipkart Supermart to other metro cities
• Flipkart is planning to enter into fresh category and also trying to
increase its private label contribution
• Plan to service through existing FCs for time being
• Gradually increased the number of SKUs under Amazon now to
8,000 within “rush” delivery
• Current growth of Amazon Now is 5% week on week
• Opened 15 new FC specifically dedicated to groceries
• Rebranded Amazon Now as Prime Now
• Planning to increase products under Amazon Now
• Amazon has got the legal permission to own inventory and will
be migrating from Cloudtail to ARIPL and a lot of technologies
under Amazon.in (e.g., ARS, forecasting etc.) will be available for
Now Prime and Pantry
• Paytm started offline to online model which allowed customers to
get the online discounts and now moved to seller model
• Deliver 99% of grocery orders within 3 days
• Paytm is integrating BigBasket with its Paytm mall app, where
BigBasket will be able to sell like other sellers and provide a
basic margin to PayTM
• No plans at all to own inventory and setup a supply chain
• Transiting from three layer supply chain to two layer supply
chain
• Increased HoReCa contribution to GMV to ~20%
• Consolidating small warehouses of 10-40 k Sqft to >1L Sqft
• Planning to sell groceries through Paytm mall
• BigBasket is planning to launch a vendor portal in few month
where vendors will be able to see the real time inventory status
of BigBasket
• Aggressively push the high margin Private Label business
• Scraped the express delivery model and shifted to next day
delivery
• Completed the 10 month long transition from marketplace model
to inventory model
• Started grocery stores in societies in Gurgaon to increase
customer outreach but has to close down shortly
• Pivoted to “monthly purchase” positioning model
• Planning to transiting from three layer supply chain model to
two layer supply chain like BigBasket
• Opening 1L sqft warehouse for fresh and non fresh in places like
Delhi NCR
• Planning to double the warehousing capacity to almost 2M Sqft
Source: Primary research, Secondary research , IBEF report and Praxis analysis
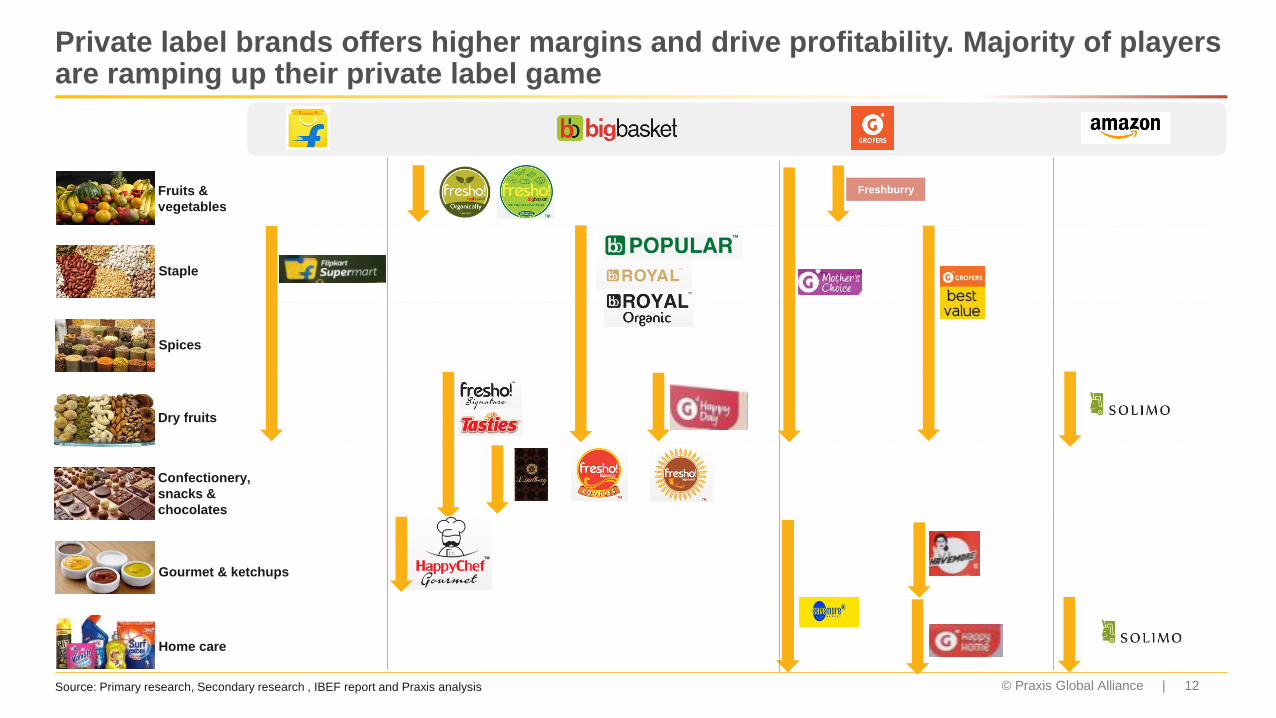
Private label brands offers higher margins and drive profitability. Majority of players are ramping up their private label game
12© Praxis Global Alliance |
Staple
Home care
Confectionery,
snacks &
chocolates
Spices
Dry fruits
Gourmet & ketchups
Fruits &
vegetables
Freshburry
Source: Primary research, Secondary research , IBEF report and Praxis analysis
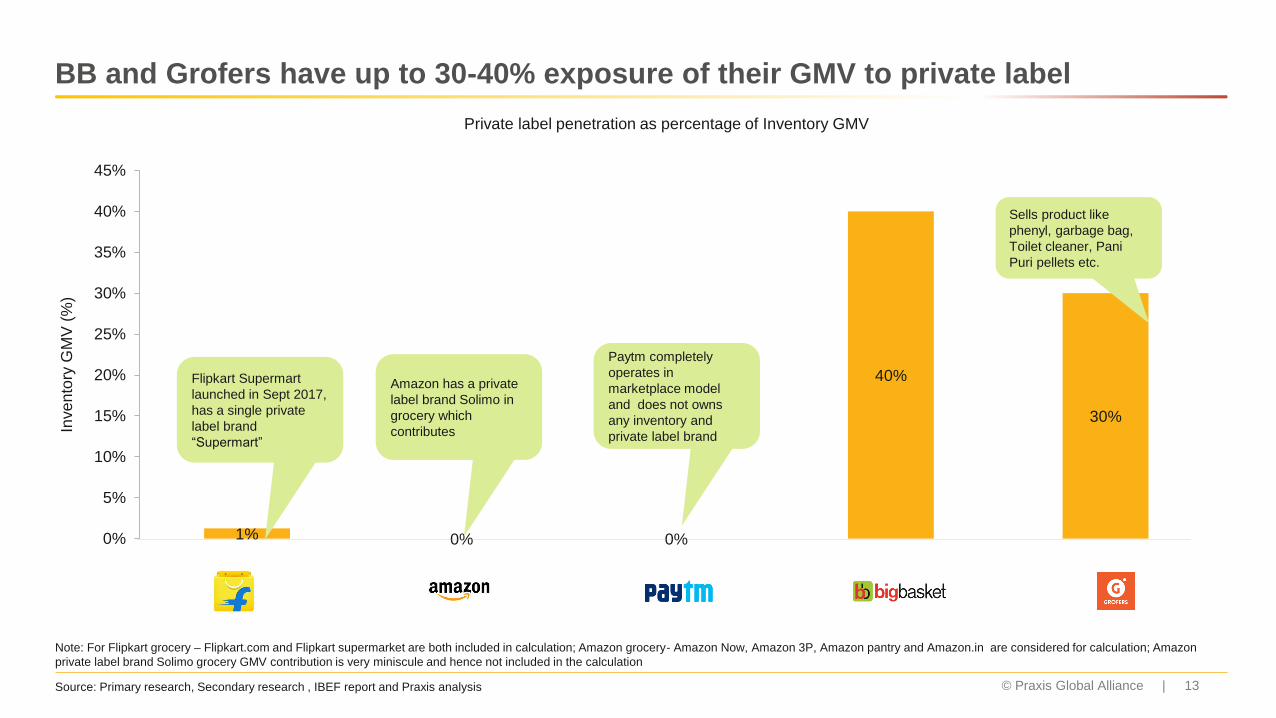
1% 0% 0%
40%
30%
0%
5%
10%
15%
20%
25%
30%
35%
40%
45%
Inve
nto
ry G
MV
(%
)BB and Grofers have up to 30-40% exposure of their GMV to private label
13© Praxis Global Alliance | Source: Primary research, Secondary research , IBEF report and Praxis analysis
Note: For Flipkart grocery – Flipkart.com and Flipkart supermarket are both included in calculation; Amazon grocery- Amazon Now, Amazon 3P, Amazon pantry and Amazon.in are considered for calculation; Amazon
private label brand Solimo grocery GMV contribution is very miniscule and hence not included in the calculation
Sells product like
phenyl, garbage bag,
Toilet cleaner, Pani
Puri pellets etc.
Private label penetration as percentage of Inventory GMV
Amazon has a private
label brand Solimo in
grocery which
contributes
Paytm completely
operates in
marketplace model
and does not owns
any inventory and
private label brand
Flipkart Supermart
launched in Sept 2017,
has a single private
label brand
“Supermart”

Flipkart and Amazon sell groceries through multiple channels
14© Praxis Global Alliance |
Amazon 3P
Other info
# of SKUs 8,000 10,000 12,000
Model InventoryInventory Marketplace
Logistics Own- Primarily by
bikes
Own- Primarily by
vans
Own- Primarily by
bikes
• Orders are
promised to be
delivered within
2 hours
• Delivered
through Now
stores
• Orders are
fulfilled locally
• Contains a pantry
box which needs to
be filled for
minimum order
(Rs.1k)
• Orders are fulfilled
locally, regionally
and nationally
• Now 3P is
marketplace model
• Amazon
representatives are
stationed at the
brand stores –
packers and
delivery personnel's
CategoriesNon fresh & Non
grocery
Fresh ,Non fresh
& Non groceryFresh, Non fresh &
Non grocery
Non fresh & Non
grocery
25,000+
Hybrid
Own- Primarily by
bikes
• Amazon.in offers
services throughout
the country
• It is a mix of both
marketplace sellers
and inventory model
• If orders are to be
delivered in remote
areas- 3P delivery
services are also
used
FY18 GMV ($ M) 6 31 30 113
Source: Primary research, Secondary research , IBEF report and Praxis analysis
Note: For Flipkart grocery – Flipkart.com and Flipkart supermarket are both included in calculation; Amazon grocery- Amazon Now, Amazon 3P, Amazon pantry and Amazon.in are considered for calculation
Non fresh and non
groceries
Non fresh and non
groceries
-- 25,000+
Inventory Hybrid
Own logistic – Generally
delivered by van
Own logistic and 3P in
case of remote areas
3 33
• Generally the order
is delivered next day
• Minimum order value
is INR 500 and free
delivery is in order
above INR 1,000
• Customer can check
the order by opening
box at the time of
delivery
Traditional Flipkart
channel , majority is
personal care and home
care. Few marketplace
sellers also sell Non fresh
grocery
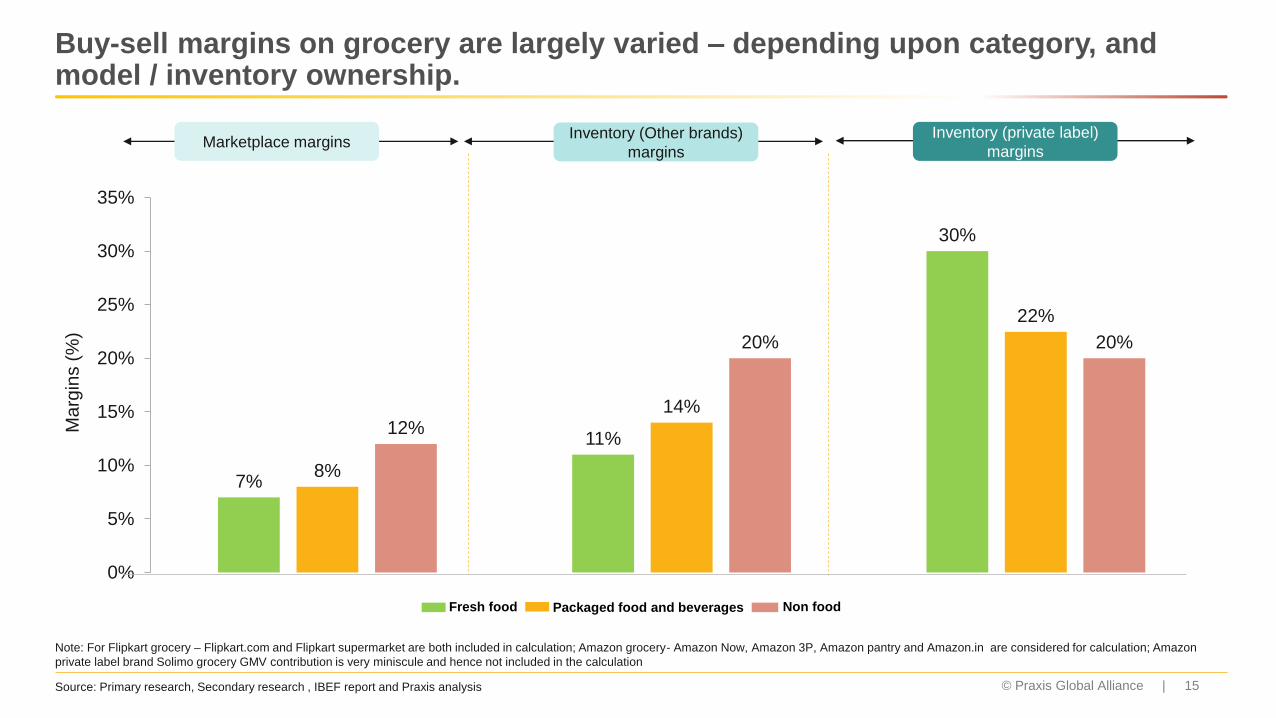
Buy-sell margins on grocery are largely varied – depending upon category, and model / inventory ownership.
15© Praxis Global Alliance |
Marketplace marginsInventory (Other brands)
margins
Inventory (private label)
margins
7%
11%
30%
8%
14%
22%
12%
20% 20%
0%
5%
10%
15%
20%
25%
30%
35%
Ma
rgin
s (
%)
Fresh food Packaged food and beverages Non food
Source: Primary research, Secondary research , IBEF report and Praxis analysis
Note: For Flipkart grocery – Flipkart.com and Flipkart supermarket are both included in calculation; Amazon grocery- Amazon Now, Amazon 3P, Amazon pantry and Amazon.in are considered for calculation; Amazon
private label brand Solimo grocery GMV contribution is very miniscule and hence not included in the calculation

Online grocery shoppers shop 66% of monthly groceries online
16© Praxis Global Alliance |
Among online grocery shoppers, 60-72%
spend on groceries is done online (n=862)
Q. [Asked to Online shoppers only] How much in INR did you spend
on ONLINe grocery across the below mentioned
stores/websites/apps in the last month?
Online share of monthly
grocery spendCity type
72% Metro
60% Tier 1
66% Overall
49% of online grocery shoppers have used
more than one apps/websites for placing order
in last one month
Source: Praxis grocery consumer database and survey
13%6%
45%
32%
41%
47%
1%
14%
0%
20%
40%
60%
80%
100%
Metro (n=445) Tier 1 (n=417)
% o
f re
sp
on
de
nts
More than once a week Once a weekOnce in 15 days Once a monthLess than once a month
Average
orders / month1.8 1.5
Q. How frequently do you purchase grocery online ?
Note: More than once a week is taken as 1.25 times a week; Less than once a month is taken as 0.6 times a month; One month is considered to be same as 4 weeks

Price & Quality are the most important reasons for people to buy groceries online
17© Praxis Global Alliance |
48%
65%
60%
62%
76%
70%
59%
63%
63%
68%
72%
83%
No need to walk down the storeaisles to find and pick out items
Convenience (saves time, parkinghassles, doorstep delivery)
No need to carry items
Good variety of products online
Good quality/Fresh products
Good Discounts/Offers/Deals
% of respondents
Household income upto INR 5 lacs ($7.7k)/year (n=494)
Household income INR 5+ lakhs ($7.7k+)/year (n=368)
Most
Important
Least
Important
Average
Rank
1.9
2.1
2.7
3.1
3.2
3.6
Q. Please rank your reasons to shop groceries online. Most important reason should get Rank1
Source: Praxis grocery consumer database and survey

Key imperatives for grocery players
18© Praxis Global Alliance |
Contact us on [email protected]
to schedule a tailored discussion
• There are three types of purchases in grocery in India – monthly, bi weekly for fresh, and instant. These three are different
categories and need differentiated focus to success in each
• There are multiple opportunities to drive growth in scale – B2B segment / HoReCa, new categories (e.g., Meat), new regions (Tier
II+), shopping formats (instant vs monthly), higher ticket items etc.
• Variable and fixed cost structure does not linearly much with order size (both, # items and value), hence driving higher AOVs is
very critical to demonstrate economic success
• Private label drives profitability – companies can make 7-15% higher margins through private label products. Some specific
categories where private label products have been successful are cereals, F&V, meat, non-traditional food items, dry fruits, and
homecare
• Having wider range of SKUs, loyalty program, express delivery for immediate needs, reasonable cost and better quality of fresh produce
will enable players to increase their share of wallet with online grocery buyers
• Supply chain costs can go up to 20-30% of an order value, typically ranging from $3-5/ order. Driving efficiency in supply chain is
critical through levers like warehouse automation, multiple order picking, efficient replenishment, delivery planning etc.
• Loyalty program, faster delivery, low rate of order mismatch / item missing, product availability and better prices are some of the key
parameter for increasing customer repeat rate and stickiness. Best in class repeat rates are average 3x / month.
• Finally, online grocery buyer is typically a more loyal customer – so companies can focus on optimizing their marketing spends on
acquisition of customers and less on retention – retention is ensures through good quality of service
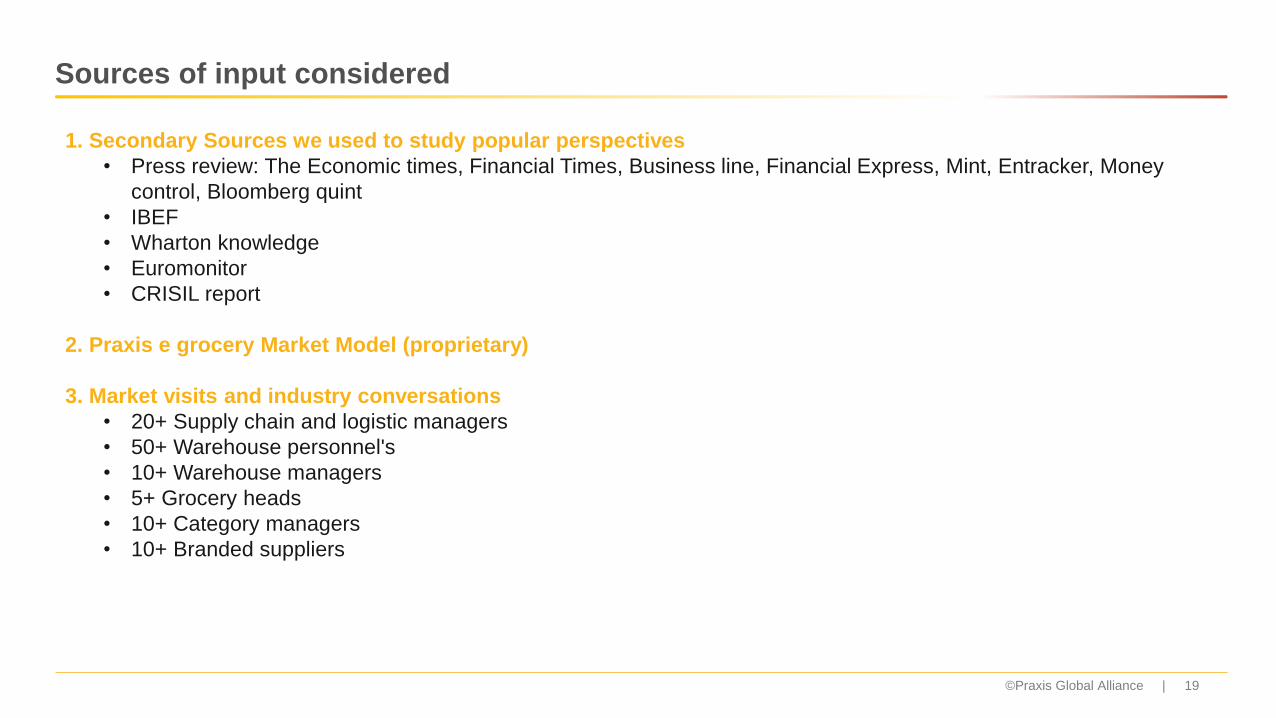
Sources of input considered
19©Praxis Global Alliance |
1. Secondary Sources we used to study popular perspectives
• Press review: The Economic times, Financial Times, Business line, Financial Express, Mint, Entracker, Money
control, Bloomberg quint
• IBEF
• Wharton knowledge
• Euromonitor
• CRISIL report
2. Praxis e grocery Market Model (proprietary)
3. Market visits and industry conversations
• 20+ Supply chain and logistic managers
• 50+ Warehouse personnel's
• 10+ Warehouse managers
• 5+ Grocery heads
• 10+ Category managers
• 10+ Branded suppliers

Glossary of terms
20© Praxis Global Alliance |
Term Description
Industry related
GMV Sports, Fitness and Wellness
Fresh food Fruits , vegetables , fresh meat and dairy
Non fresh food Staples , packaged meat , cereals , spices , edible oils etc
Non food Plastic and personal care products
PL Private label
AOV Average order value
HORECA Hotel / restaurant / cafe
Units
CAGR Compounded Annual Growth Rate
SKU Stock keeping unit
FY Indian Financial Year starting April 1st of one year and ending on 31st March of the next year
M Million
B Billion
Cr Crore = 10 million
INR Indian Rupees
Note: 1 USD is assumed as INR 65 in all calculations

About the authors
21©Praxis Global Alliance |
Praxis Global Alliance is a global business analytics, research and advisory firm. We believe that clients should get a very high ROI on research and advisory
spends. We do this by combining domain experts, technology and ‘lean cost’ delivery approaches.
Our Consumer practice covers the full basket (goods and services) of the consumer to bring most meaningful and current insights to our work with Financial
investors and Consumer companies. We do this by:
• Conducting proprietary research on various market sub-segments
• Tracking brand stories of legacy brand leaders and emerging winners (online, offline)
• Building comprehensive on-ground IP that enables us to deliver insight at the ground level (e.g. distribution retail network mapped across the country)
• Leveraging innovative web analytics to draw actionable insight
• Combining ‘on-ground’ practitioner experience with analytics to create ‘superior outcomes’
Aryaman Tandon
Leader – Consumer and Digital
Director (Praxis Global Alliance)
Ex-Manager at Bain & Co
• Strong experience in FMCG, grocery, supply
chain, online grocery
• Decade of business consulting experience
across the globe (India, Australia)
B.Tech. (IIT Delhi)
Madhur Singhal
Leader – Consumer and Digital
Managing Director (Praxis Global Alliance)
Ex-Partner at Bain & Co, BCG
• Deep experience with growth strategy, Go-to-market
and overall Digital/Analytics implementation
• >14+ years of experience in creating value for
financial investors and family-run businesses
MBA (IIM Ahmedabad, Schulich School), B.Tech. (IIT
Delhi)

About Praxis Global Alliance™
Praxis Global Alliance is a global business analytics, research and
advisory firm. We believe that clients should get a very high ROI on
research and advisory spends. We do this by combining domain experts,
technology and ‘lean cost’ delivery approaches.
Praxis is ‘Practical’
We work with agility, flexibility and
embed with your teams to enable
SUPERIOR OUTCOMES
We bring the best domain expertise (deep
pool of industry practitioners) and
implementation teams as two-in-a-box
We leverage technology deeply to enable higher-
ROI on your consulting/analytics spend
Financial Investors Group (FIG)
PGA Labs™
PraxDigital™
Business Excellence &
Transformation (BET)
Pre-deal support, Commercial DD, Post-
acquisition value creation
Next-gen business advisory (lean-cost,
long duration engagement)
Data engineering and analytics, AI,
OpenData and Visualizations
Cutting edge business research and tools
Our expertise:

23© Praxis Global Alliance |
Contact usWe will be happy to share perspectives
Madhur Singhal
Leader – Consumer and Digital, Mumbai
Disclaimer:
This material has been prepared by Praxis Global Alliance, which is the trade name of Praxian Global Private Limited (“Praxis”) with the intent to showcase our capability and disseminate learnings to potential partners/clients. This material can
be referred to by the viewers on the internet but should be referenced to Praxis Global Alliance, if reused or adapted in any form or in any forum. The frameworks, approaches, tools, analysis and opinions are solely Praxis’s intellectual property
and are a combination of collection of best data we could find publicly, and Praxis team’s own experiences and observations.
We make no representation or warranty, express or implied, that such information is accurate or complete, and nothing contained in here can be construed as definitive predictions or forecasts. Before reading further, the Recipient expressly
agrees that this might not address any and all risks and challenges facing Recipient, its business and the markets within which it operates, nor all possible market conditions. No responsibility or liability whatsoever is accepted by any person
including Praxis or its Business partners and affiliates and their respective officers, employees or agents for any errors or omissions in this document.
This document is not complete without an accompanying oral discussion and presentation by Praxis though Praxis is not obligated to do so. Praxis does not have any duty to update or supplement any information in this document. Praxis shall
not be responsible for any loss sustained by any person who relies on this presentation.
Build together.
Win together.
New Delhi I Mumbai I Bengaluru I Singapore | …and growing.
Twitter Linkedin
www.praxisga.com I www.insights.praxisga.com
Share your thoughts with us using the hashtags #PraxGlobal #PraxInsights
+91 908 221 8254
Aryaman Tandon
Leader – Consumer and Digital, New Delhi
+91 11 4932 3564

Build together
Win together
THANK YOU
© Praxis Global Alliance |
24