Indian Creek Watershed Management Plan - IN.gov · Technical Committee: The technical committee...
95
Indian Creek Watershed Management Plan Prepared by: Indian Creek Watershed Steering Committee Sponsored by: Historic Hoosier Hills 1981 South Industrial Park Drive Versailles, IN 47042 (812) 689-6410
Transcript of Indian Creek Watershed Management Plan - IN.gov · Technical Committee: The technical committee...

Indian Creek Watershed Management Plan
Prepared by: Indian Creek Watershed Steering Committee
Sponsored by: Historic Hoosier Hills 1981 South Industrial Park Drive Versailles, IN 47042 (812) 689-6410
2
Table of Contents Section One – Project Introduction ............................................................................................. 6
1.1 Background ........................................................................................................................... 6 1.2 Partnerships .......................................................................................................................... 6 1.3 Committees ............................................................................................................................ 7
Section Two: Watershed Description ......................................................................................... 8 2.1 Physical Description ............................................................................................................. 8 2.2 Topography and Hydrology .................................................................................................. 8 2.3 Temperature .......................................................................................................................... 9 2.4 Precipitation ......................................................................................................................... 9 2.5 Natural History ..................................................................................................................... 9 2.6 Land Use ............................................................................................................................... 9 2.7 Population ........................................................................................................................... 10 2.8 Wildlife ................................................................................................................................ 10 2.9 Soils ..................................................................................................................................... 12 2.10 Water Supply ..................................................................................................................... 12 2.11 Historical Land Use .......................................................................................................... 12 2.12 Land Use Trends ............................................................................................................... 13
Section Three: Testing Parameters .......................................................................................... 14 3.1 Testing Parameters ............................................................................................................. 14
3.1.1 E.coli ............................................................................................................................ 14 3.1.2 Biological Oxygen Demand ......................................................................................... 14 3.1.3 Dissolved Oxygen ........................................................................................................ 14 3.1.4 pH ................................................................................................................................. 14 3.1.5 Conductivity ................................................................................................................. 15 3.1.6 Salinity ......................................................................................................................... 15 3.1.7 Temperature Change .................................................................................................... 16 3.1.8 Total Suspended Solids and Turbidity ......................................................................... 16 3.1.9 Nitrogen ....................................................................................................................... 16 3.1.10 Total Phosphorus ....................................................................................................... 17
3.2 Water Quality Indexes......................................................................................................... 17 Section Four – Establishing Benchmarks ................................................................................. 18
4.1 Fish Consumption Advisory ................................................................................................ 18 4.2 Unified Water Assessments ................................................................................................. 18 4.3 Indian Creek Diagnostic Study ........................................................................................... 19
4.3.1 Total Phosphorus ......................................................................................................... 19 4.3.2 Nitrate Nitrogen/Ammonia Nitrogen/Nitrite Nitrogen ................................................ 19 4.3.3 Turbidity ...................................................................................................................... 20 4.3.4 Total Suspended Solids ................................................................................................ 20 4.3.5 Biological Oxygen Demand ......................................................................................... 20 4.3.6 pH ................................................................................................................................. 20 4.3.7 E.coli ............................................................................................................................ 20 4.3.8 Dissolved Oxygen ........................................................................................................ 20 4.3.9 Water Quality Indexes ................................................................................................. 21
4.3.10 Macroinvertebrate Organisms……………………………………………………….22 4.4 IDEM previous watershed basin surveys ............................................................................ 22
3
4.5 Watershed Inventory………………………………………………………………………22 Section Five – Identifying Problems, Causes and Stressors .................................................... 23
5.1 Stakeholder Concerns ......................................................................................................... 23 5.2 Problem Statements ............................................................................................................ 25
Section Six: Identifying Sources and Critical Areas ............................................................... 28 6.1 Sedimentation Sources ........................................................................................................ 28
6.1.1 Livestock Access to the Creek ..................................................................................... 28 6.1.2 Lack of Conservation Tillage ....................................................................................... 29 6.1.3 Improper Development ................................................................................................ 30
6.2 E.Coli Sources..................................................................................................................... 30 6.2.1 Failing Septic Systems ................................................................................................. 30 6.2.2 Livestock Access to the Creek ..................................................................................... 32
6.3 Nutrient Sources.................................................................................................................. 33 6.3.1 Improper Nutrient Management .................................................................................. 33 6.3.2 Lack of Riparian Buffers ............................................................................................. 33
6.3.3 Livestock Access to Creek……………………………………………………………33 6.3.4 Failing Septic Systems………………………………………………………………..33
6.4 Hazardous Chemical Sources ............................................................................................. 34 6.4.1 Application of Agricultural Chemicals ........................................................................ 34 6.4.2 Lack of Riparian Buffers ............................................................................................. 35
6.5 Trash Sources...................................................................................................................... 35 6.5.1 Improper Disposal ........................................................................................................ 35 6.5.2 Lack of Drop-off Sites ................................................................................................. 36
6.6 Recreational Sources .......................................................................................................... 36 6.6.1 Lack of Public Access Sites ......................................................................................... 36
Section Seven: Calculating Loads and Load Reductions ...................................................... 43 7.1. E.Coli Load Reductions ..................................................................................................... 44 7.2 Nutrientand Total Suspended Solids Load Reductions ....................................................... 46
Section Eight: Choosing Measures to Apply…………………………………………………50 8.1 Best Management Practices……………………………………………………………….50 8.1.1 Goal 1 - Reduce level of E.Coli in stream to state standard of 235 colonies or below by implementing the following BMP's………………...………………………………….50 8.1.2 Goal 2 - Decrease level of sedimentation loading by 2500 tons by the 2013……….50 8.1.3 Goal 3 - Decrease the level of nutrient and chemical runoff entering into the waterbodies of the Indian Creek Watershed……………………………………………….51 8.2 Educational Techniques……………………………………………………………………51 8.2.1 Field Days and Workshops…………………………………………………………..52 8.2.2 Literature……………………………………………………………………………..52 8.2.3 Presentations…………………………………………………………………………52 Section Nine: Identifying Critical Areas, Setting Goals and Selecting Indicators ............... 53
9.1 – E.Coli Goal: Reduce level of E.Coli in stream to state standard of 235 colonies or below during normal flow within 5 years ................................................................................. 53 9.2 – Sedimentation Goal: Decrease level of sedimentation loading by 2500 tons by the year 2013........................................................................................................................................... 54 9.3 Hazardous Chemical Goal: ................................................................................................ 56 9.4 Nutrient Goal : .................................................................................................................... 57
4
9.5 Illegal Dumping Goal – Reduce the amount of roadside garbage in watershed by 80 cubic yards per year ......................................................................................................................... 588 9.6 Recreation Goal – Increase the number of Public Access Points on Indian Creek by 2018.................................................................................................................................................... 59
Section Ten – Future PlansSection Eleven – Monitoring Indicators………………………..60 Section Eleven – Monitoring Indicators ................................................................................... 61
11.1 Social Indicators ............................................................................................................... 61 11.2 Environmental Indicators ................................................................................................. 61 11.3 Administrative Indicators.................................................................................................. 61 11.4 Monitoring Plan ................................................................................................................ 62
Section Twelve – Evaluating and Adapting Plan ..................................................................... 63
Appendix A - Test Sites………………………………………………………………………...64 Appendix B - Rain fall totals for testing dates (One Week Prior to Testing)……………….70 Appendix C – Windshield Survey Results…………………………………………………….72 Appendix D – Record of Meetings and Activities…………………………………………….76 Appendix E – Indian Creek Watershed Project Committees………………………………..83 Appendix F – Water Testing Results………………………………………………………….84
List of Tables Table 1: Indian Creek Subwatersheds ............................................................................................. 8 Table 2: Indian Creek Land Use ..................................................................................................... 9 Table 3: Water Quality Standards/Targets ……………………………..……… ..…………….19 Table 4: IDEM Testing Results, 2000 & 2005..............................................................................22 Table 5: Stressors, Causes, and Problems………………………………………………………..26 Table 6: Livestock and Sedimentation Concerns………………………………………………...28 Table 7: Cultivated Cropland in Subwatersheds…………………………………………………29 Table 8: Tillage Data for Switzerland County…………………………………………………...29 Table 9: Tillage Cropland in Indian Creek………………………………………………………29 Table 10: Developed Areas within the Indian Creek Watershed .................................................. 30 Table 11: Indian Creek Watershed Soil Ratings for Septic Systems…………………………….31 Table 12: Livestock within the Watershed………………………………………………………32 Table 13: Livestock with Access to Tributary…………………………………………………..32 Table 14: Estimated Fertilizer Applied to Agricultural Land……………………………………33 Table 15: Estimated Pesticides Applied in Watershed…………………………………………..35 Table 16: Dump Sites Located in Subwatersheds……………………………………………….36 Table 17: Water Quality Standards/Targets ……………………………………………………43 Table 18: Indian Creek Flow Rate (ft/sec) ………………………………………………………43 Table 19: E Coli Concentrations (cfu/ml)..................................................................................... 44 Table 20: E.Coli Current Loads (cfu/year) ................................................................................... 44 Table 21: Percent E.Coli Reduction Needed per Watershed…………………………………….45 Table 22: E.Coli Load Reduction Needed per Site (cfu/year) …………………………………..45 Table 23: Nutrient Concentrations and Total Suspended Solids(mg/L)………………………...46 Table 24: Nutrient and Total Suspended Solids Current Loads (tons/year)…………………….47 Table 25: Percent Nutrient and Total Suspended Solids Reduction Needed…………………….48 Table 26: Nutrient and Total Suspended Solids Load Reduction Needed (tons/year)…………..49 Table 27: Estimate Load Reduction per Practice .......................................................................... 51 Table 28: Future Plans…………………………………………………………………………...60

5
VISION
A watershed with a healthy natural resource base that will improve the quality of life within our
community
MISSION
To lead efforts to better the natural resources of the Indian Creek Watershed for present and future generations
6
Section One – Project Introduction 1.1 Background The Indian Creek watershed project has an interesting history. In the spring of 2001, Switzerland County Environmental Science students, under the direction of Mrs. Bonnie Fancher, developed a strong concern regarding the presence of E.coli bacteria in Indian Creek water sampling. The E.coli bacterium that was found from student sampling from Indian Creek was well above standard levels. Student concerns were taken seriously and immediately addressed by community officials from the Switzerland County Health Department, Soil and Water Conservation District and Purdue Extension Service. An Indian Creek watershed task force of local officials, concerned citizens and students was formed to discuss and further study the water quality of Indian Creek. Numerous meetings were held over a two-year period. Additional Indian Creek water sampling was completed and data evaluated. The Indian Creek watershed task force decided that action was necessary to address concerns about Indian Creek water quality. Terry Stephenson, coordinator for Historic Hoosier Hills Resource Conservation and Development, Inc., led the group in developing a Section 319 water quality grant application. The purpose for applying for the grant was to attain assistance in studying the Indian Creek watershed as well as to develop a watershed management plan for the watershed area. Also instrumental in the grant writing process were Joe Spiller of the Switzerland County Health Department; Tim Schwipps and Casie Auxier of the Soil and Water Conservation District (SWCD); Bonnie Fancher, Switzerland County High School; and Switzerland County Council member John Keeton. The grant was finalized in December, 2003. The watershed task force was notified by the Indiana Department of Environmental Management (IDEM) of the grant approval by the United States Environmental Protection Agency (USEPA) in the spring of 2004 and grant activities officially began in late November of 2004. 1.2 Partnerships Immediately work began to introduce the watershed project to Switzerland County. An introductory article was published in the local paper detailing the project as well as inviting citizens to participate in steering committee meetings. Steering committee meeting locations and times were also advertised on local radio, in newsletters, through door to door visits by committee members and by word of mouth. Partnerships were built with the Switzerland County Health Department, Highway Department, Soil and Water Conservation District (SWCD), Natural Resource Conservation Service (NRCS), Purdue Extension and the Vevay-Switzerland County Community Foundation by having a representative of each organization sit on the steering committee. Several meetings were held to determine a vision and mission for the group and to plan a large public meeting to gather stakeholder concerns for the watershed. The Indian Creek Watershed Steering Committee was formed to ensure that local views, values and concerns were taken into account during all aspects of the project. Over the course of the project, the steering committee formed two sub committees to assist with the assessment phase as well as the writing of the
7
watershed management plan. Again, it was important for these two sub committees to take into account local values and concerns while completing their specific tasks.
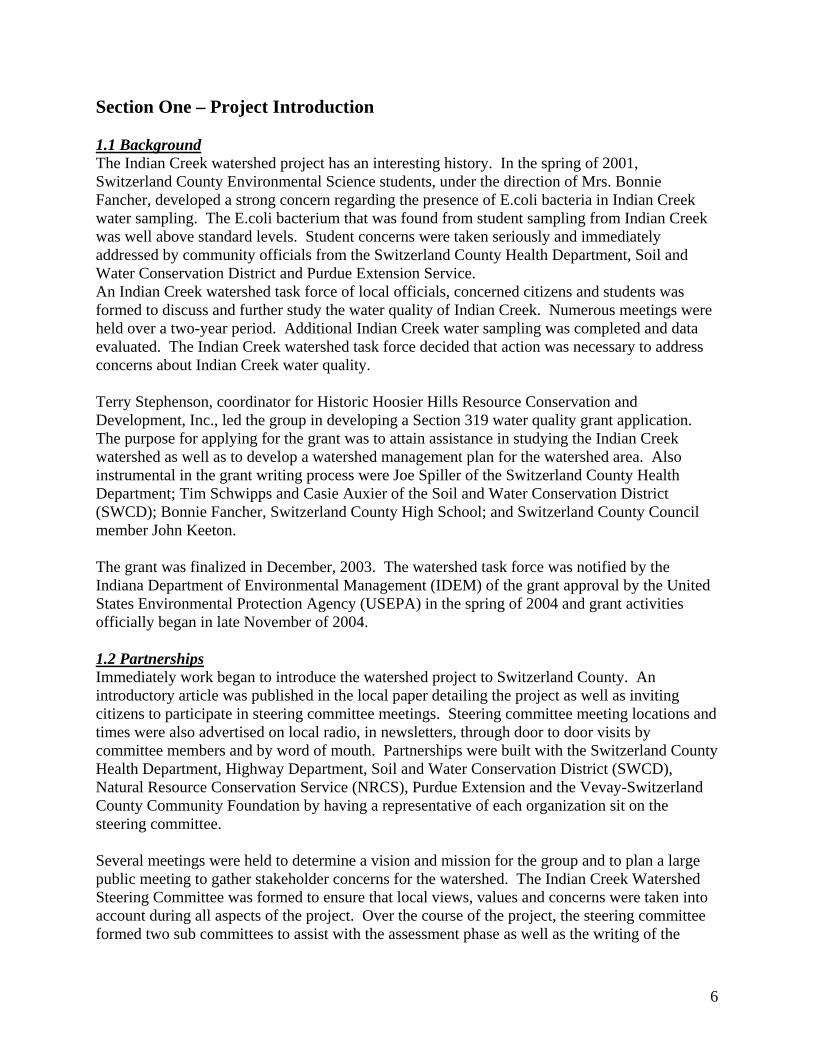
1.3 Committees Steering Committee: The job of the steering committee is to make decisions, to plan, to broadly represent the interests and citizens in the watershed, and to maintain close ties with the sponsor, usually through the watershed coordinator. Technical Committee: The technical committee analyzes data and provides technical assistance when needed. Members of this committee also assisted with the selection of the twelve water monitoring sites as well as contract lab that conducted the chemical and biological water monitoring. This committee is made up of community residents and agency personnel. Management Plan Committee: The management plan committee assists with the writing and editing of the watershed management plan. This committee is also made up of community residents and agency personnel.
Project Sponsor Historic Hoosier Hills
RC&DCo-Sponsor
Switzerland County Soil and Water
Conservation District
Watershed Coordinator
Steering Committee
Technical Committee
Management Plan Committee
8
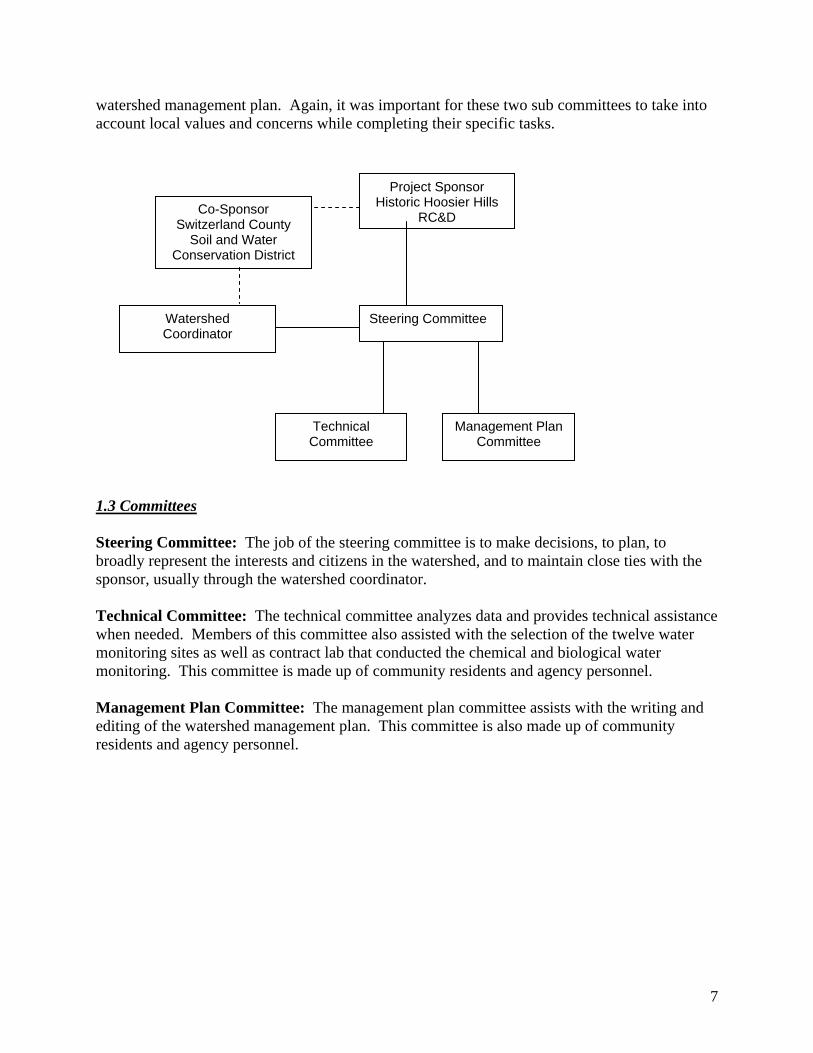
Section Two: Watershed Description A watershed is the area of land that catches rain and snow and drains into a marsh, stream, river, lake or groundwater. Homes, farms, forests, small towns and big cities can make up watersheds. Watersheds come in all shapes and sizes. Hydrologic Unit Codes (HUC) are a way of identifying drainage basins or a region of land that catches precipitation that falls within an area and funnels to a particular creek, stream or river until the water drains into the ocean. Hydrologic Unit Codes are used to catalog portions of a landscape according to its drainage (Indiana Watershed Planning Guide). The 11-digit HUC for the Indian Creek watershed is part of the larger watershed Middle Ohio-Laughery. The 11-digit Hydrologic Unit Code for the Indian Creek watershed is 05090203200. There are seven sub watersheds for Indian Creek. These sub watersheds are named and can also be referenced by their 14-digit Hydrologic Unit Code (HUC).
Table 1: Indian Creek Subwatersheds 14 Digit Hydrologic Unit Code Subwatershed Name 05090203200010 Indian Creek Headwaters 05090203200020 Northwest Tributary Indian Creek 05090203200030 Tumblebug 05090203200040 Upper Indian Creek 05090203200050 Pendleton Branch 05090203200060 Long Run 05090203200070 Indian Creek 2.1 Physical Description The Indian Creek Watershed area and all of Switzerland County was covered in continental ice sheets two or three times in the last 1 million years. These glaciers left deposits of drift and outwash, which are important parent materials. The watershed area is underlain with Ordovician-age shale and limestone. Eden and Switzerland soils are dominant on summits and slopes and are easily eroded in the valleys of Indian Creek and its tributaries. In the higher elevation of the northwest portion of the watershed Switzerland, Weisburg and Cincinnati soils are present. These soils were formed by loess and glacial drift deposits. Illinoian drift and loess on the uplands of the watershed contain a high amount of clay. The drift and loess are the parent material for the Cincinnati, Avonburg, Cobbsfork and Bonnell soils that are present in the watershed. Huntington soils formed from the organic-rich silty alluvium on the flood plains along the Ohio River. These soils are present along the lower reach of Indian Creek. (Switzerland County Soil Survey)

9
2.2 Topography and Hydrology The terrain of the watershed is 46% strongly sloping to very steep ridges and hillsides, 36% gently sloping to moderately steep ridges and plateaus, 10% is nearly level to gently sloping uplands in the northern portion of the watershed, and 8% is bottomland and terrace positions. Indian Creek serves as a major tributary of the Ohio River in Switzerland County and drains the western half of the county. Indian Creek and its tributaries flow through four townships within Switzerland County; Jefferson, Craig, Pleasant and Cotton. (Soil survey of Switzerland County). 2.3 Temperature The average daily maximum temperature for Switzerland County is 67.1 degrees Fahrenheit. The warmest month is July with an average temperature of 85.3 degrees. The average daily minimum temperature for the county is 45.1 degrees Fahrenheit.
The coldest month is January with an average temperature of 42.0 degrees. Every two out of ten years, Switzerland County could experience temperatures in July and August in excess of 98 degrees. The county may also experience frigid temperatures below -3 degrees in January every two years in ten. 2.4 Precipitation The average yearly precipitation in Switzerland County is 41.97 inches. The precipitation totals within the county range from 2.60 inches in October to 4.48 inches in both March and May. Within a 10 year period, there may be two years when the maximum precipitation in the county reaches 48.16 inches or is as low as 35.26 inches. 2.5 Natural History Deciduous trees were the main native vegetation in Switzerland County. The well drained upland soils of Eden and Cincinnati were covered by sugar maple, hickory, white oak and red oak. Wetter soils such as Avonburg and Cobbsfork were covered by beech, sweetgum, blackgum and pin oak. 2.6 Land Use The Indian Creek Watershed is located on the western side of Switzerland County. The headwater area begins near the town of Avonburg. It flows approximately 15 miles before it reaches the Ohio River, just west of Vevay. The watershed covers approximately 43,840 acres.

10
Table 2: Indian Creek Land Use
*010 *020 *030 *040 *050 *060 *070 Total Bare Rock/Sand/Clay 1.15 0 0.82 0 1.37 0.76 0 4.1 Cultivated Crops 1348.89 612.85 0 1009.24 144.68 0 58.96 3174.62 Deciduous Forest 4720.08 4389.30 1499.71 2781.30 3847.90 4533.15 1034.24 22805.68 High Den. Urban 1.24 2.48 1.42 0.09 0.85 0.63 8.62 15.33 Low Den. Urban 11.68 6.50 2.45 12.23 15.93 9.16 67.03 124.98 Medium Den Urban 2.68 3.23 0 0.81 1.47 0.89 28.36 37.44 Open Space 322.06 337.81 77.27 297.08 268.86 239.32 154.11 1696.51 Emergent Herbaceous Wetlands
3.33 1.84 0 0.89 5.09 0.83 4.93 16.91
Evergreen Forest 632.14 520.05 235.21 155.18 505.95 595.95 27.36 2671.84 Grasslands 123.72 196.86 139.64 68.49 277.60 363.13 66.41 1235.85 Mixed Forest 75.05 23.81 16.75 27.50 46.79 39.39 6.85 236.14 Open Water 25.44 22.74 4.96 27.14 2.64 6.13 0 89.05 Pasture/Hay land 1714.96 1822.10 636.50 1772.26 1884.40 1217.11 175.15 9222.48 Shrub/Scrub 89.20 4.58 17.42 74.93 71.61 52.07 6.86 316.67 Woody Wetlands 0 0 0 0 62.59 13.25 89.76 165.6 TOTAL 9071.61 7944.15 2632.15 6227.14 7137.74 7071.77 1728.66 41813.22
11
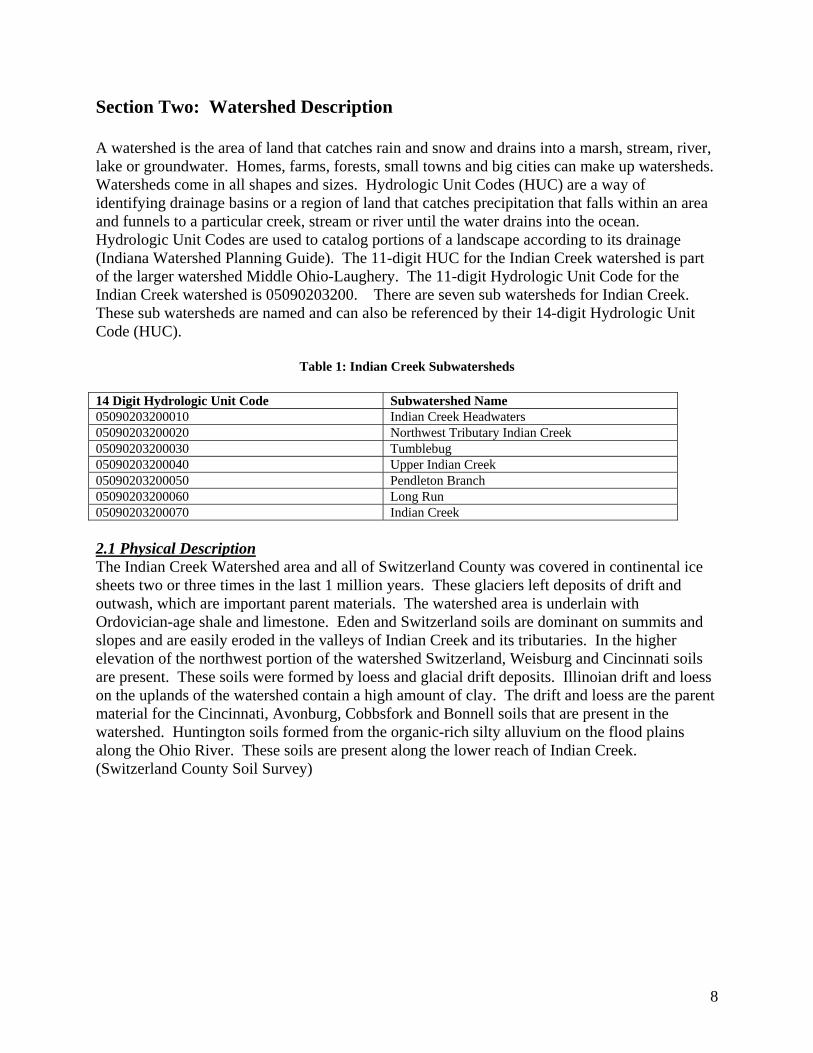
2.7 Population The total population living within the Indian Creek watershed area was estimated using the population statistics from the 2000 Census. The total population within the watershed is estimated at 2,520. The following shows how the population breaks down within the four township areas within the watershed. Craig Township – 388 Cotton Township – 221 Jefferson Township – 777 Pleasant Township - 1,134 These numbers do not, however, represent the exact population within the Indian Creek watershed area. These numbers were estimated based upon the number of acres of each township that lies within the watershed as well as a slight increase to account for the five years that have passed since the 2000 Census. 2.8 Wildlife The Indian Creek Watershed has a wide variety of habitats. Steep wooded hillsides, upland agriculture, and Indian Creek and its tributaries provide diverse habitat and extensive edge habitat for wildlife. The agriculture of the area includes soybean, corn, and hay fields. Switzerland County is recognized for its abundant wild turkey and Virginia Whitetail Deer harvests. The 2007 Spring Turkey Harvest was 467 turkeys for Switzerland County, the highest of any Indiana Counties, according to the Indiana Department of Natural Resources. The total harvest for the State of Indiana for 2007 was 11, 163. (Figure 1: 2007 Spring Turkey Harvest) Many wild turkeys are observed in the Indian Creek Watershed.
The deer population and harvest is also extensive in Switzerland County. In 2006, the county had the fourth largest deer harvest in Indiana with 2,821 deer taken. This included 929 antlered and 1892 antlerless deer. In 2005, Switzerland County had the third largest deer harvest in Indiana with 3,135 deer taken. This included 1,038 antlered and 2,097 antlerless deer. Information is from the Indiana Department of Natural Resources.
The Indian Creek Watershed has been part of a priority block for the Indiana Breeding Bird Atlas Project. Seventy species of birds have been recorded in the Indian Creek Block during April-July, 2005-7. The diverse habitats provide for a rich variety of bird species. It is likely that endangered Barn Owls, Black-crowned Night-herons and Yellow-crowned Night-herons are present in this priority block although they have not yet been recorded. Switzerland County is known to support a population of Barn Owls and night-herons have been observed and recorded in similar habitat in Southeastern Indiana. Suitable habitat for many endangered species and species of special concern is provided by the Indian Creek Watershed. Birds of special concern, such as the Great egret and the Red-shouldered hawk have been observed in the Indian Creek watershed.

12
2.9 Soils According to the soil survey for Switzerland County there are four predominant soil classifications within the Indian Creek Watershed. “Huntington-Wheeling soils are best suited for cultivated crops and pasture. The main hazards are flooding on the bottom land and erosion on the more sloping terraces. It is unsuited for urban uses because the flooding is a severe hazard. The suitability for the more intensive recreational uses is good. “Avonburg-Cobbsfork soils have a seasonal high water table making wetness a severe limitation. Areas with this soil type are best suited for cultivated crops. It is generally unsuited for urban uses because of the wetness. An adequate drainage system should be the first management consideration of the area is to be used for urban development. The suitability for the more intensive recreation uses is poor because of the wetness. “Cincinnati-Weisburg-Bonnell soils are best suited for cultivated crops in the more level areas and pasture and hay in the steeper areas. Erosion is the main hazard. It is such a severe hazard on the steeper slopes that growing cultivated crops is impractical. The suitability for urban uses is good in the more nearly level areas and in areas where public sewer systems can be installed. The suitability for the more intensive recreation uses is only fair because of slow permeability and slope. “Eden-Switzerland soils are suited for pastures or woodlands. Some small areas are used for hay or cultivated crops. Tobacco is the main crop in these small areas. The slope is the main limitation, and erosion is the main hazard. Erosion is such a severe hazard on the steeper slopes that growing cultivated crops is impractical. Slope generally restricts the area making it unsuited to urbanization and recreational uses.” (Switzerland County Soil Survey). 2.10 Water Supply Public or private utilities provide water to half of the occupied housing units in Switzerland County. This water is pumped from deep wells located in deposits of sand and gravel in the valley of the Ohio River. In areas of the county where water is not available through public water lines, water is obtained from wells, springs, cisterns, ponds, creeks or the Ohio River. (Switzerland County Soil Survey) 2.11 Historical Land Use Switzerland County, Indiana is located along the beautiful Ohio River in the southeastern corner of Indiana. Vevay is the county seat and largest town in Switzerland County, and is situated on State Road 56/156, which is part of the Nationally Designated "Ohio River Scenic Byway". Vevay traces its beginning back to a group of Swiss-French settlers who migrated from the town of Vevey, Switzerland in 1802. With the hopes of introducing viticulture to America, John Francis Dufour led the settlers to the area. The rolling hills and access to the Ohio River attracted the Swiss immigrants to settle in the area. Dufour and the party of settlers plotted out the town of Vevay in 1813 and Switzerland County was formally organized on October 1, 1814.
13
The wine making industry did not flourish and was abandoned in the middle 1800’s as the town of Vevay became more commercially oriented. Farming and commerce became the way of life and Vevay became a trading center and busy river port with grains, soybeans, tobacco and livestock becoming the mainstays of the county’s agriculture. 2.12 Land Use Trends Acreage in Switzerland County used for agricultural purposes has been gradually on the decline as more land is developed for residential and commercial areas. Land for these residential and commercial development areas has been increasing at approximately 14 acres per year. Since 1990 land in farms has declined in Switzerland County by 50%. However, land in farms still account for 48% of Switzerland County according to the census from the year 2000.
14
Section Three: Testing Parameters 3.1 Testing Parameters A one year diagnostic study of Indian Creek and its tributaries was conducted as a part of this project. Below is a description of the testing parameters of this study.
3.1.1 E.coli Fecal coliform bacteria are found in the feces of warm-blooded animals, including humans, livestock and waterfowl. These bacteria are naturally present in the digestive tracts of animals, but are rare or absent in unpolluted waters. Fecal coliform bacteria typically enter water via combined sewer over flows (CSOs), poor septic systems, and runoff from agricultural feedlots. The bacteria can enter the body through the mouth, nose, eyes, ears or cuts in the skin. Escherichia coli bacteria (E.coli) is a specific species of fecal coliform bacteria used in Indiana’s state water quality standards. Some strains of E.coli can lead to illness in humans. While not all strains of E.coli are pathogenic themselves, they occur with other intestinal tract pathogens that may be dangerous to human health.
3.1.2 Biological Oxygen Demand Biological Oxygen Demand (BOD5) is the measure of the amount of oxygen used by aerobic (oxygen-consuming) bacteria as they break down organic wastes over five days. Polluted streams, or streams with a lot of plant growth (and decay), generally have high (BOD5) levels. High levels indicate that large amounts of organic matter are present in the stream. Streams that are relatively clean and free from excessive plant growth typically have low BOD5 levels. In slow moving and polluted waters, much of the available dissolved oxygen (DO) is consumed by bacteria, which rob other aquatic organisms of the oxygen needed to live. Streams with higher DO levels, such as fast-moving, turbulent, cold water streams, can process a greater quantity of organic material. Therefore, interpretation of BOD5 levels depends upon the conditions of the stream sampled, as some streams can handle more waste than others. However, in general, a healthy stream has high DO levels and low BOD5 levels.
3.1.3 Dissolved Oxygen The amount of oxygen found in water is called the dissolved oxygen (DO) concentration. Oxygen dissolves readily into the water from the atmosphere until the water is saturated. Aquatic plants, algae and phytoplankton also produce oxygen as a by-product of photosynthesis. DO is an important measure of stream health. Presence of oxygen in water is a positive sign, while absence of oxygen from water is often a sign that the water is polluted. Aquatic organisms require different levels of DO. However, dissolved oxygen levels below 3ppm are stressful to most aquatic organisms. DO levels below 2 or 1ppm will not support fish. Levels of 5 to 6 ppm are usually required for growth and activity of aquatic life. Extremely high levels of DO or supersaturation can be harmful to aquatic organisms by causing gas bubble disease.
3.1.4 pH The pH test is one of the most common analyses in water testing. Water contains both hydrogen ions and hydroxide ions. The relative concentrations of these ions determine whether a solution
15
is acidic or basic. The activity of the hydrogen ions is expressed in pH units (pH = power of Hydrogen). The pH scale ranges from 1 (most acidic) to 14 (most basic), with 7 being neutral. The pH level is an important measure of water quality because aquatic organisms are sensitive to pH, especially during reproduction. A pH range of 6.5 to 8.2 is optimal for most organisms. Many natural processes affect pH. Waterbodies with higher temperatures have slightly lower pH values. Also, algae blooms remove carbon dioxide from the water during photosynthesis, which may raise pH to 9 or more.
3.1.5 Conductivity Conductivity is the measurement of the ability of water to carry an electrical current. Negatively and positively charged ions including chloride, nitrate, sulfate, phosphate, sodium, magnesium, calcium, iron, and aluminum are strong conductors in water while oils, alcohol, and sugars are not considered good conductors.1 Conductivity is a beneficial test to perform because it can indicate a discharge or source of pollutant in the water. Because streams have a relatively constant conductivity rate, when significant changes appear in testing, we can make the assumption that a pollutant has entered the waterbody. Discharges from failing sewage can increase the conductivity of water because it contains a chloride, phosphate and nitrate load, while oil spills can reduce conductivity since it is a poor conductor. Additionally, temperature may affect conductivity. As the temperature increases, so does conductivity. Conductivity is affected by the geology of the area. Streams that run though granite bedrock have a lower conductivity while those that run through clay soils, such as the Indian Creek landscape, have a higher conductivity because of the presence of materials that ionize when washed into the water.2 Studies show that inland freshwaters, like lakes, rivers, and streams, have healthy fish diversity when conductivity ranges are between 150-500 micromhos per centimeter. Outside this range could indicate water not suitable for certain fish. Conductivity rates in national rivers range from 50-1500 micromhos per centimeter. Industrial waters can range as high as 10,000 micromhos per centimeter3.
3.1.6 Salinity Salinity is the measurement of concentrated salts in water. All natural waters, including freshwater, contain dissolved salts at various concentrations. This is because dissolved salts originated primary from the chemical and physical weathering of rocks and minerals contained in the Earth’s crust.4 Rocks and minerals are dissolved by precipitation and can be transferred to lakes, rivers and oceans.
Freshwater salinity < 0.5ppt Estuary salinity > 0.5 and < 30ppt
Ocean salinity > 30ppt
1 U.S. EPA , “Monitoring and Assessing Water Quality – 5.9 Conductivity,” 9 September 2003, http://www.epa.gov/owow/monitoring/volunteer/stream/vms59.html (1 November 2005). 2 U.S. EPA , “Monitoring and Assessing Water Quality – 5.9 Conductivity,” 9 September 2003, http://www.epa.gov/owow/monitoring/volunteer/stream/vms59.html (1 November 2005). 3 U.S. EPA , “Monitoring and Assessing Water Quality – 5.9 Conductivity,” 9 September 2003, http://www.epa.gov/owow/monitoring/volunteer/stream/vms59.html (1 November 2005). 4 http://www3.csc.noaa.gov/scoysters/html/elearn/pdf/understanding/Understanding_Salinity.pdf
16
The concentration of salinity in water is important because it not only affects where aquatic animals can live, but it also can affect dissolved oxygen levels. As the salinity in water increases, dissolved oxygen decreases.5
3.1.7 Temperature Change Temperature plays a vital role in water quality. The amount of dissolved oxygen in the water, the rate of photosynthesis by aquatic plants and the sensitivity of organisms to toxic wastes, parasites and disease are all affected by temperature. Colder water can hold more dissolved oxygen than warmer water. Therefore, colder water normally has a higher macroinverterbrate diversity. Warmer water has less dissolved oxygen which can weaken fish and aquatic insects.
3.1.8 Total Suspended Solids and Turbidity Total suspended solids (TSS) and turbidity are similar in that they both indicate the amount of solids suspended in water, but they differ in how they are measured. While turbidity is measured by the amount of light scattered in a water sample, TSS is measured by the weight of the solids in the sample. Turbidity is a measure of cloudiness in water which is caused by suspended matter including clay, silt, organic matter, plankton, and microscopic organisms.6 This matter interferes with the passage of light through the water by absorbing and scattering it, rather than allowing it to shine through the water column in a straight line7. When light is unable to shine through water, photosynthesis can be limited. Additionally, water temperature can increase as the floating particles absorb heat from the sun. Heating of the water will lower dissolved oxygen levels, making it difficult for aquatic organisms to survive. Likewise, particles can kill fish and aquatic invertebrates by clogging their gills and smothering their habitat. Turbidity should not be confused with color since darkly colored water can still be clear and not turbid. Water can become turbid through a number of methods including:
Erosion and runoff of soils from fields, parking lots, or streambanks; Construction activities where proper erosion control measures are not utilized; Effluent from wastewater treatment centers; Bottom-feeding fish stirring up sediments as they remove vegetation; and Algal blooms
3.1.9 Nitrogen
Nitrogen occurs in water as nitrate, nitrite and ammonia. It enters the water from human and animal waste, decomposing organic matter, and runoff of fertilizer from lawns and crops. Nitrates are an essential nutrient for plant growth. Similar to phosphates, these are main ingredient in fertilizers and can lead to increased aquatic plant growth when transported into aquatic systems. Unpolluted waters generally have a nitrate level below 4 parts per million (ppm) (mg/L). Nitrate levels above 10 ppm (mg/L) are considered unsafe for drinking water.
5 http://www3.csc.noaa.gov/scoysters/html/elearn/pdf/understanding/Understanding_Salinity.pdf 6 Shelia Murphy, “General information on Turbidity,” n.d., http://bcn.boulder.co.us/basin/data/NUTRIENTS/info/Turb.html (1 November 2005) 7 Hartman and Burk, 62
17
3.1.10 Total Phosphorus Phosphorus is essential to plant and animal life, and its presence in the environment is natural. Problems with phosphorus as a water pollutant result not from its presence, but from the addition of excessive amounts. Aquatic ecosystems develop with very low levels of phosphorus. The addition of seemingly small amounts of phosphorus that would have little-to-no effect on terrestrial systems can lead to problematic algal blooms when added to aquatic systems. Phosphorus enters surface waters in organic matter (dead plants and animals, animal waste), attached or adsorbed to soil particles, or in a number of man-made products (detergents, fertilizers, industry wastes). Phosphorus is an important nutrient in fertilizer because it increases terrestrial plant growth. When transported into aquatic systems, phosphorus increases aquatic plant growth as well. When phosphorus levels are too high, excess plant and algal growth creates water quality problems. Plants begin to die and decompose, depleting the dissolved oxygen supply in the water. This can ultimately lead to fish kills in some cases. Phosphorus is also released from the decomposing plants back into the water, continuing the cycle. The reaction of the aquatic system to an overloading of nutrients is known as eutrophication. 3.2 Water Quality Indexes The advanced Chemical Monitoring Data Sheet from the Hoosier Riverwatch Manual was used to determine the water quality indexes for each of the 12 testing sites. The Water Quality Index is a picture of the overall health of each test site when all required testing parameters are examined. All water monitoring data is available for public viewing at the Switzerland County Soil and Water Conservation Office.

18
Section Four – Establishing Benchmarks 4.1 Fish Consumption Advisory Although Indian Creek is not listed on the Indiana State Department of Health’s “Indiana Fish Consumption” Report, Indian Creek and its tributaries still must abide by the carp advisory for all counties in Indiana. The advisory states that “women of child bearing years, nursing mothers, and children under the age of 15 should NOT eat carp over 15 inches in length. All other populations may eat one carp meal per month if the carp is between 15 and 20 inches, one meal per two months if the carp is between 20 and 25 inches, and no carp if the fish is over 25 inches long.” A meal is considered an 8 ounce, uncooked fish for a 150 pound person or a 2 ounce uncooked fish for a 40 pound child. 4.2 Unified Water Assessments According to the Environmental Protection Agency’s (EPA) Surf Your Watershed website, the Middle-Ohio Laughery watershed (MOLW) is listed as having serious problems in the following Condition Indicators (indicators designed to show existing watershed health):
I. Designated Use Attainment – States adopt water quality standards that include designated uses and criteria to protect those uses including: drinking water supplies, aquatic life use support, fish and shellfish consumption, primary and secondary contact recreation and agriculture.
II. Fish and Wildlife Consumption Advisories – Recommendations by the state to restrict
consumption of locally harvested fish or game due to the presence of contaminants.
III. Ambient Water Quality Data: Four Conventional Pollutants – Ambient water quality data showing an accession of national criteria levels, over a six year period of Ammonia, Dissolved Oxygen, Phosphorus, and pH.
IV. Wetland Loss Index – Percentage losses of wetlands over a historic period and more
recently The EPA also listed the MOLW as “High Vulnerability” in the following Vulnerability Indicators (indicators designed to indicate where pollution discharges and other activities put pressure on the watershed).
I. Urban Runoff Potential – Potential for urban runoff impacts based on percentage of impervious surface in the watershed.
II. Index of Agriculture Runoff – Composite index comprised of nitrogen runoff potential,
modeled sediment delivery to rivers, and pesticide runoff potential.
III. Air Deposition – Information from the National Atmospheric Deposition Program/National Trends Network depicting nitrogen deposition estimates.

19
Although the Indian Creek watershed is a component of the MOLW, these indicators may not illustrate the condition of the Indian Creek watershed. For a more accurate depiction of the current water quality, please refer to the Indian Creek Diagnostic Study found below. 4.3 Indian Creek Diagnostic Study The chemical and biological water monitoring was contracted to Environmental Labs in Madison, Indiana in the spring of 2005 (see appendix F for complete water quality data). The contract laboratory conducted sampling at 12 sites within the watershed for one year to assess water quality. The laboratory also conducted a quarterly macroinvertebrate study to assess the ecological health of the creek. Fourteen tests were conducted at each of the 12 sites. Tests that were performed include flow rate, temperature, pH, conductivity, salinity, turbidity, total suspended solids, dissolved oxygen, E.coli, biological oxygen demand, ammonia, nitrate, nitrite and phosphorus. The water testing results were analyzed at Environmental Labs. Volunteers used the chemical monitoring data sheet from the Hoosier Riverwatch Volunteer Stream Monitoring Training Manual to interpret the results and calculate water quality ratings. Per the Indiana Administrative Code (327 IAC2), the following water quality standards exist for most of the state’s rivers and streams:
Table 3: Water Quality Standards/Targets
4.3.1 Total Phosphorus
During the summer months of June, July, August and September 2005, total phosphorus was in the fair range of .17 to .58 mg/L as established by the Guide for Water Quality Ranges of Hoosier Riverwatch at all twelve Indian Creek sampling sites. All twelve sampling sites exceeded the 0.3 mg/L target during the June and August 2005 sampling events.During other sampling months of 2005-06, all sampling sites were within the good range of .16 mg/L and below with the exception of site six located in subwatershed 05090203200040 on October 19, 2005, when a value of 1.6 mg/L was recorded.
Parameter Target Concentration Reference TSS < 80 mg/L Concentrations above 80 mg/L are
generally considered to be harmful to aquatic life (Waters, 1995)
N < 10 mg/L State standard for nitrate nitrogen in drinking water
P < 0.3 mg/L Draft nutrient benchmark for state E. Coli < 235 cfu/ml State standard (single sample)
20
4.3.2 Nitrate Nitrogen/Ammonia Nitrogen/Nitrite Nitrogen At all twelve sampling sites for all twelve months, nitrate nitrogen values were within the good to excellent range of 1.76 mg/L and below as established by Hoosier Riverwatch. All of the samples were below the 10 mg/L state standard for nitrate in drinking water. Most values were within the excellent range of 1.32 mg/L and below, with graphed data and data analyses showing the majority of the data at 0.4 mg/L and below. Ammonia Nitrogen and Nitrite Nitrogen were also sampled at all twelve sites during all twelve months to see if recent pollution had occurred. During water testing, four Ammonia Nitrogen samples were above .5 mg/L. All nitrite nitrogen values were at .04 mg/L or below.
4.3.3 Turbidity All twelve sample sites for all twelve months had turbidity values in the good range of 10.1 to 40 NTU as established by Hoosier Riverwatch with the single exception of site 11 during the January 26th, 2006 sample date. The value for that site was 160 NTU. Reconstruction of Highway 129 with heavy land movement was occurring at that site.
4.3.4 Total Suspended Solids All twelve sample sites for all twelve months had total suspended solids values in the good to excellent range of 100 mg/L and below as established by Hoosier Riverwatch. Most values were in the excellent range of less than 100 mg/L. With the exception of a single value of 310 mg/L was recorded at site 12 on July 27th, 2005, although the turbidity value at site 12 was only 17 NTU all the sampling sites were below the 80 mg/L target.
4.3.5 Biological Oxygen Demand All values were in the good range of 2.0 to 4.0 mg/L with the exception of five single values in the fair range of 4.1 to 10 mg/L as established by Hoosier Riverwatch.
4.3.6 pH All values are within the good range of 6.0 to 8.0 as established by Hoosier Riverwatch with the exception of several values that slightly exceeded 8.0 due to the limestone bedrock and calcareous soils of the hills and floodplains of the Indian Creek Watershed.
4.3.7 E.coli All twelve sampling sites had a low value for E.coli of less than 235 colonies per 100 mL
at some time during the twelve sampling months. All twelve sampling sites had a high value for E.coli of greater than 235 colonies per 100
mL at some time during the twelve sampling months. High values for E.coli at each site seemed to coincide with rainfall events and “flushing”
of the watershed. High values from 750-2380 colonies per 100 mL occurred at seven sites following rainfall events. These sites were sites one and two located in the 05090203200020 subwatershed, site number four located in the 05090203200010 subwatershed, sites six, seven and eight located in the 05090203200040 subwatershed and site nine located in the 05090203200050 subwatershed.
High values of 235 to 750 colonies per 100 mL occurred at five sites following rainfall events. These sites were site three located in the 05090203200030 subwatershed, site five located in the 05090203200010 subwatershed, site ten located in the
21
05090203200050 subwatershed and sites eleven and twelve located in the 05090203200060 subwatershed.
4.3.8 Dissolved Oxygen
During the twelve month sampling period, 87% of the dissolved oxygen values fell between 51% and 110% saturation, the fair to excellent range as established by Hoosier Riverwatch. 10% of the dissolved oxygen values exceeded the 110% saturation mark with the highest value registering at 155% saturation at test site one on sampling date June 30th, 2005. The remaining 3% of dissolved oxygen values fell below 51% saturation with the lowest value registering at 29% saturation at test site five on sampling date July 27th, 2005.
4.3.9 Water Quality Indexes The advanced Chemical Monitoring Data Sheet from the Hoosier Riverwatch Manual was used to determine the water quality indexes for each of the 12 testing sites. The Water Quality Index is a picture of the overall health of each test site when all required testing parameters are examined. All water monitoring data is available for public viewing at the Switzerland County Soil and Water Conservation Office. All twelve testing sites for the twelve month sampling period had water quality indexes in the medium to excellent range as established by Hoosier Riverwatch. 94% of the water quality index ratings fell in the good to excellent range of 70% to 100%. The highest water quality index registered at 91% at test site eight on sampling date February 14th, 2005, while the lowest water quality index was 64% at test site nine on sampling date July 27th, 2005.
4.3.10 Macroinvertebrate Organisms A study of the macroinvertebrate organisms of the Indian Creek Watershed was conducted, through the Indian Creek Project, by Environmental Laboratories of Madison, Indiana. Twelve sites on the watershed were sampled quarterly. (The resulting tables of data are from September 1, 2005, December 1, 2005, February 1, 2006, and April 11, 2006.) A variety of pollution intolerant species indicate good to excellent water quality at all twelve sample sites on each sample date. Data from February and April of 2006 show seven species of mayflies (Ephemeroptera species), four species of stoneflies (Plecoptera), seven species of caddisflies (Tricoptera), and other macroinvertebrate species. The Ephemeroptera, Plecoptera, and Tricoptera are pollution intolerant species. These organisms are present throughout the Indian Creek Watershed and indicate water quality not impacted by heavy metals or chemical pollution.
22
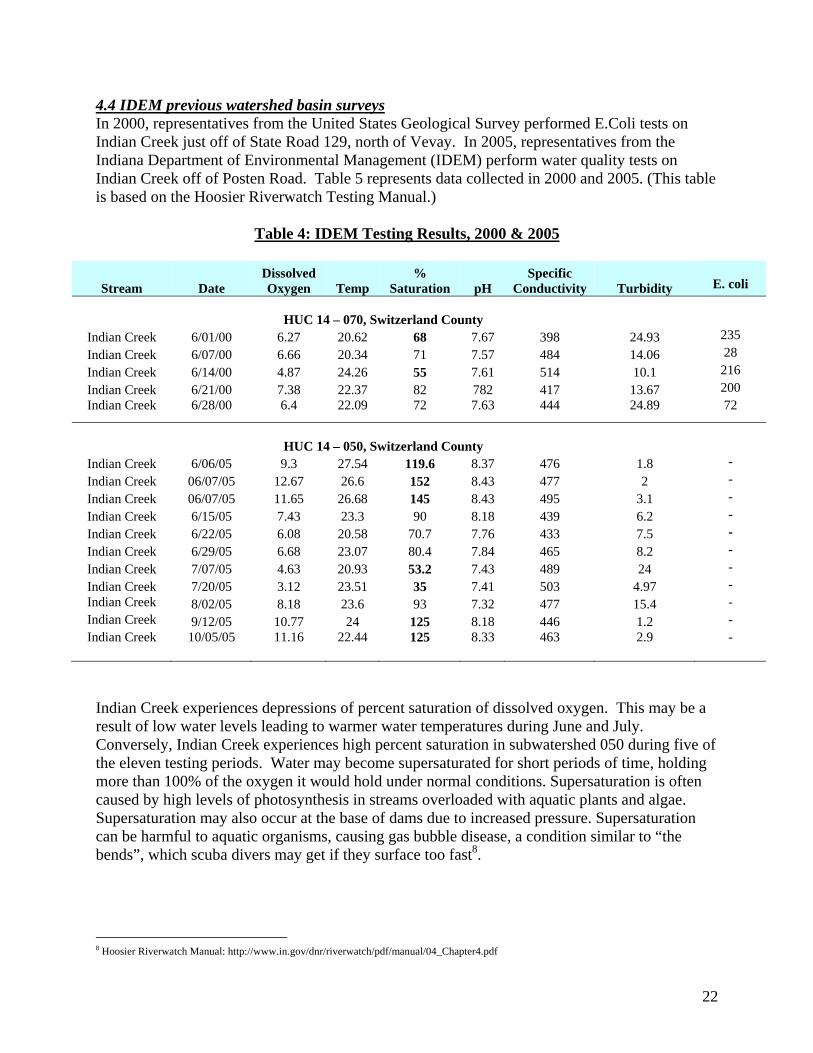
4.4 IDEM previous watershed basin surveys In 2000, representatives from the United States Geological Survey performed E.Coli tests on Indian Creek just off of State Road 129, north of Vevay. In 2005, representatives from the Indiana Department of Environmental Management (IDEM) perform water quality tests on Indian Creek off of Posten Road. Table 5 represents data collected in 2000 and 2005. (This table is based on the Hoosier Riverwatch Testing Manual.)
Table 4: IDEM Testing Results, 2000 & 2005
Stream Date Dissolved Oxygen Temp
% Saturation pH
Specific Conductivity Turbidity
E. coli
HUC 14 – 070, Switzerland County
Indian Creek 6/01/00 6.27 20.62 68 7.67 398 24.93 235
Indian Creek 6/07/00 6.66 20.34 71 7.57 484 14.06 28
Indian Creek 6/14/00 4.87 24.26 55 7.61 514 10.1 216
Indian Creek 6/21/00 7.38 22.37 82 782 417 13.67 200 Indian Creek 6/28/00 6.4 22.09 72 7.63 444 24.89 72
HUC 14 – 050, Switzerland County
Indian Creek 6/06/05 9.3 27.54 119.6 8.37 476 1.8 -
Indian Creek 06/07/05 12.67 26.6 152 8.43 477 2 -
Indian Creek 06/07/05 11.65 26.68 145 8.43 495 3.1 -
Indian Creek 6/15/05 7.43 23.3 90 8.18 439 6.2 -
Indian Creek 6/22/05 6.08 20.58 70.7 7.76 433 7.5 -
Indian Creek 6/29/05 6.68 23.07 80.4 7.84 465 8.2 -
Indian Creek 7/07/05 4.63 20.93 53.2 7.43 489 24 -
Indian Creek 7/20/05 3.12 23.51 35 7.41 503 4.97 - Indian Creek 8/02/05 8.18 23.6 93 7.32 477 15.4 - Indian Creek 9/12/05 10.77 24 125 8.18 446 1.2 - Indian Creek 10/05/05 11.16 22.44 125 8.33 463 2.9 -
Indian Creek experiences depressions of percent saturation of dissolved oxygen. This may be a result of low water levels leading to warmer water temperatures during June and July. Conversely, Indian Creek experiences high percent saturation in subwatershed 050 during five of the eleven testing periods. Water may become supersaturated for short periods of time, holding more than 100% of the oxygen it would hold under normal conditions. Supersaturation is often caused by high levels of photosynthesis in streams overloaded with aquatic plants and algae. Supersaturation may also occur at the base of dams due to increased pressure. Supersaturation can be harmful to aquatic organisms, causing gas bubble disease, a condition similar to “the bends”, which scuba divers may get if they surface too fast8.
8 Hoosier Riverwatch Manual: http://www.in.gov/dnr/riverwatch/pdf/manual/04_Chapter4.pdf

4.5 Watershed Inventory In April of 2005 steering committee members traveled 68 miles throughout the watershed to conduct windshield surveys. The group observed farming practices taking place within the watershed as well as the occurrence of litter and illegal dumping. The group also detailed livestock within the watershed as well as occurrences of livestock with access to Indian Creek and its tributaries. As the project progressed, steering committee members felt that more windshield surveys needed to be completed in order to better asses the number of livestock within the watershed. Steering committee members spent two days in
February of 2006 in the watershed covering all areas to compose an in depth watershed inventory. The windshield surveys were split into the seven subwatershed areas. Every accessible road was covered in order to have an accurate count of homes and the number of head of livestock. Numerous sites were documented with the following observations: Several outhouses noted due to lifestyle preferences Livestock with direct access to Indian Creek and its tributaries Overgrazing of pastures New construction of homes spotted throughout watershed High percentage of no-till was observed (The detailed results of the windshield surveys can be found in Appendix C). Section Five – Identifying Problems, Causes and Stressors 5.1 Stakeholder Concerns A large stakeholder meeting was held on March 15, 2005 at the Moorefield Community Fire Department. The meeting was organized by steering committee members to gather concerns about the Indian Creek watershed from stakeholders as well as to initiate more involvement from stakeholders. The steering committee used several media outlets to notify the public of the meeting. An article ran in the local paper detailing the agenda as well as the watershed coordinator spoke on the local radio station to invite all community members to attend. Mailings were sent out to landowners and stakeholders within the watershed in addition to steering committee members going door to door promoting the meeting and the watershed project. There were 44 people in attendance. A neutral facilitator was present to conduct the meeting. Concern cards were passed out to everyone as they entered the meeting room. Those in attendance were asked to write their concerns on the card and then give them to the facilitator when finished. This approach was used

24
to give the facilitator a way to start discussion in case people did not readily want to throw out their concerns in front of the group. Once a few concerns were read by the facilitator, the group became more at ease and began to discuss their concerns without hesitation. All concerns put forth by stakeholders were written on a flip chart and posted around the room. After all concerns were drawn out by the facilitator, the group was asked if any of the concerns were similar or the same and should be combined. After combining several concerns, the following list was posted in the front of the room and discussed by the group.
Addressing E.coli issues o Source of E.coli? Try to define the source o Physical symptoms of E.coli contact
Water Quality o Soil Erosion – flooding, tillage, development o Vegetation o Aquatic life/wildlife – is the abundance of wildlife causing high E.coli
counts? o Green water – what is the nutrient source causing this? o Ground water – could there be mercury contamination from the old
landfill? Wildlife Concerns
o Dumping of carcasses in creek during hunting season o High population of Canadian Geese and Deer o Fishing quality – Lack of fish
Trash o Damages wildlife o West Nile o Illegal dumping o Location of old landfill
Septic Concerns o Could improper septic care be causing increased E.coli levels?
Livestock Access o Fencing – Many use creek for livestock water source o Stream Crossing – Lack of access to other parts of the farm without
stream crossings. o Need to attain an accurate count of the number of livestock/types
(hogs, cattle, etc.) o Lack of buffers and filter strips
Recreation o Lack of Fishing – No public access sites o Swimming – No public access sites o Lack of recreation – No public access sites
Industry o Largest industry in watershed is agriculture o What is the number of acres of row crops in watershed?
Air Pollution o Direct flight zone in and out of Cincinnati airport
25
After much discussion, the group came to a consensus that the E.coli and trash issues
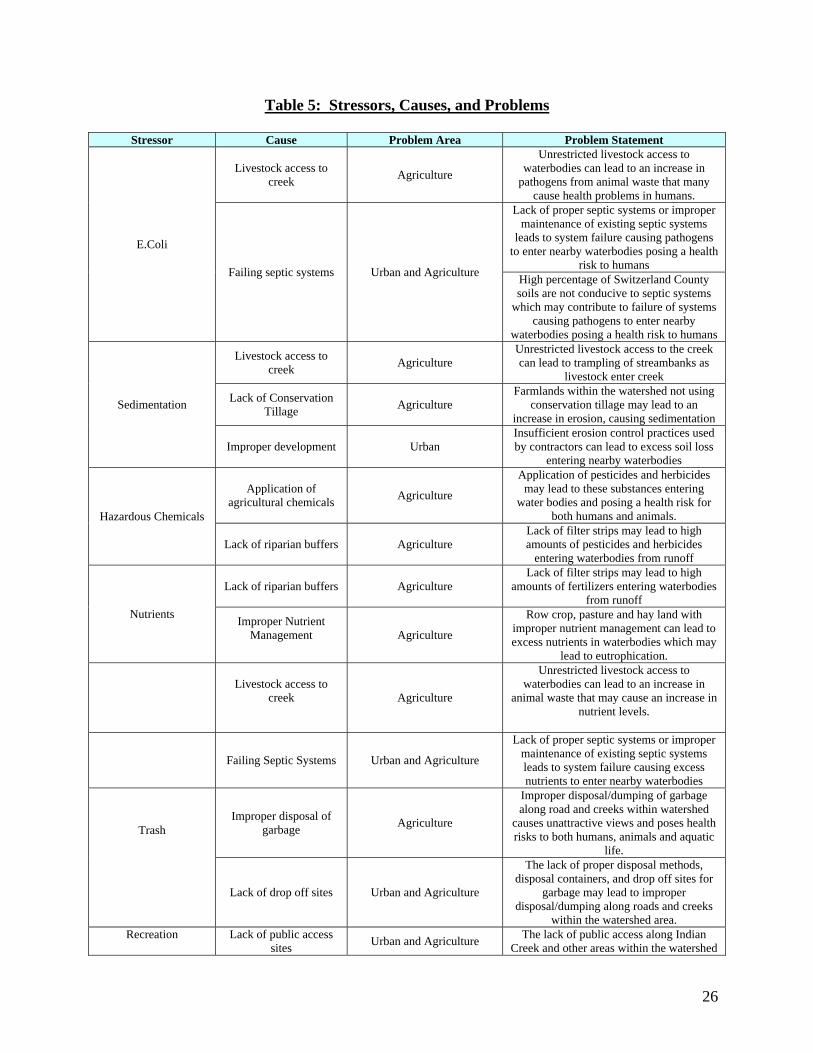
were the most important to address at this time. They felt that while figuring out the source of the E.coli is important, it will take a long amount of time. The group felt where they could make a huge improvement in the watershed right away was to have a trash pickup. Everyone agreed that this would be a way to promote the watershed project and to let the community see the positive effects of the grant right away. The list of concerns were taken back to the next steering committee meeting and used to create the problem statements. 5.2 Problem Statements Stakeholder concerns were brought back to steering committee members for discussion and identification of problems within the watershed. Five steering committee meetings were used to discuss concerns and develop problem statements. Steering committee members used several items to help in the development of the problem statements for the watershed project. Concerns voiced by stakeholders were first taken into account and then windshield surveys conducted by steering committee members and the watershed coordinator were used to see if the concerns were justifiable. (A complete list of the detailed windshield surveys can be found in Appendix C.)A facilitator was brought in for meetings to help the steering committee in the development of concise problem statements. First, group members identified stressors and causes within the watershed. Then the steering committee members identified three priority areas to focus on. Those areas are agriculture, urbanization and recreation. After much discussion and many revisions the following list of problem statements were agreed upon for the Indian Creek watershed project.
26
Table 5: Stressors, Causes, and Problems
Stressor Cause Problem Area Problem Statement
E.Coli
Livestock access to creek
Agriculture
Unrestricted livestock access to waterbodies can lead to an increase in
pathogens from animal waste that many cause health problems in humans.
Failing septic systems Urban and Agriculture
Lack of proper septic systems or improper maintenance of existing septic systems
leads to system failure causing pathogens to enter nearby waterbodies posing a health
risk to humans High percentage of Switzerland County soils are not conducive to septic systems
which may contribute to failure of systems causing pathogens to enter nearby
waterbodies posing a health risk to humans
Sedimentation
Livestock access to creek
Agriculture Unrestricted livestock access to the creek can lead to trampling of streambanks as
livestock enter creek
Lack of Conservation Tillage
Agriculture Farmlands within the watershed not using
conservation tillage may lead to an increase in erosion, causing sedimentation
Improper development Urban Insufficient erosion control practices used by contractors can lead to excess soil loss
entering nearby waterbodies
Hazardous Chemicals
Application of agricultural chemicals
Agriculture
Application of pesticides and herbicides may lead to these substances entering
water bodies and posing a health risk for both humans and animals.
Lack of riparian buffers Agriculture Lack of filter strips may lead to high amounts of pesticides and herbicides
entering waterbodies from runoff
Nutrients
Lack of riparian buffers Agriculture Lack of filter strips may lead to high
amounts of fertilizers entering waterbodies from runoff
Improper Nutrient Management
Agriculture
Row crop, pasture and hay land with improper nutrient management can lead to excess nutrients in waterbodies which may
lead to eutrophication.
Livestock access to
creek
Agriculture
Unrestricted livestock access to waterbodies can lead to an increase in
animal waste that may cause an increase in nutrient levels.
Failing Septic Systems Urban and Agriculture
Lack of proper septic systems or improper maintenance of existing septic systems leads to system failure causing excess nutrients to enter nearby waterbodies
Trash
Improper disposal of garbage
Agriculture
Improper disposal/dumping of garbage along road and creeks within watershed
causes unattractive views and poses health risks to both humans, animals and aquatic
life.
Lack of drop off sites Urban and Agriculture
The lack of proper disposal methods, disposal containers, and drop off sites for
garbage may lead to improper disposal/dumping along roads and creeks
within the watershed area. Recreation
Lack of public access
sites Urban and Agriculture
The lack of public access along Indian Creek and other areas within the watershed

27
severely limits the recreational opportunities available
E.Coli Recreation Water contamination indicated by E.Coli may pose health risks to humans that have
full body contact with waterbodies

28
Section Six: Identifying Sources and Critical Areas 6.1 Sedimentation Sources
6.1.1 Livestock Access to the Creek Direct access of livestock to streams can be a problem if the streambank is not well vegetated. Not only do cattle and hogs cause problems by "direct depositing" manure into the water, they can also overgraze and trample streambanks, leading to erosion problems. Trampled banks damage fish habitat, destroying overhangs used for shelter and compacting stream bottoms that are used for spawning and feeding. Heavy Grazing removes vegetation that covers the soil. Vegetation protects the soil from the erosive energy of raindrops and acts as a sediment trap. Likewise, vegetation increases the infiltration rate, getting water into the ground where it can replenish aquifers rather than running off, leading to the erosion of land. Sediment is detached in the uplands by surface runoff and may eventually find its way to a stream, or it may settle out in a new location and be stabilized by vegetation. Sediment is also detached from streambanks by the erosive force of flowing water or the collapse of unstable banks. Hoof impacts can destroy streambank vegetative cover and physically breakdown streambanks. These impacts occur when livestock concentrate repeatedly or in large numbers in a small area for water, shade, or other streamside attractions. Unstable streambanks may slough off into the stream channel. In addition to adding sediment to the waterbody, this may lead to channel widening or down cutting. Channel widening and down cutting can result in shallower and warmer streams degrading aquatic habitat and destroying important streamside wildlife habitat. While the exact number and location of livestock with access to the creek is unknown and continually changing, visual observations noted livestock with access to a tributary 38% of the time.
Table 6: Livestock and Sedimentation Concerns
Hydrologic Unit Number # of farms with livestock sited
# of farms with livestock access to tributary
010 9 3 020 8 4 030 5 1 040 9 5 050 5 1 060 4 1 070 0 0
TOTAL 40 15
29
6.1.2 Lack of Conservation Tillage The rolling topography of Southeastern Indiana and the thin fragile layer of top soil covering most crop fields, make conservation tillage an important part of a successful cropping system. Typically a conservation tillage system is defined as any system that leaves at least 30% residue on the surface after planting. This can be somewhat misleading, if slope or length of slope is too high, 30% residue will not be sufficient to prevent soil erosion from occurring. To be certain a residue level is adequate for erosion control, a Soil Conservationist will complete a computation using the Revised Universal Soil Loss Equation. Another important factor for residue to be effective in erosion control is that it needs to be evenly distributed over the surface and not left in piles.
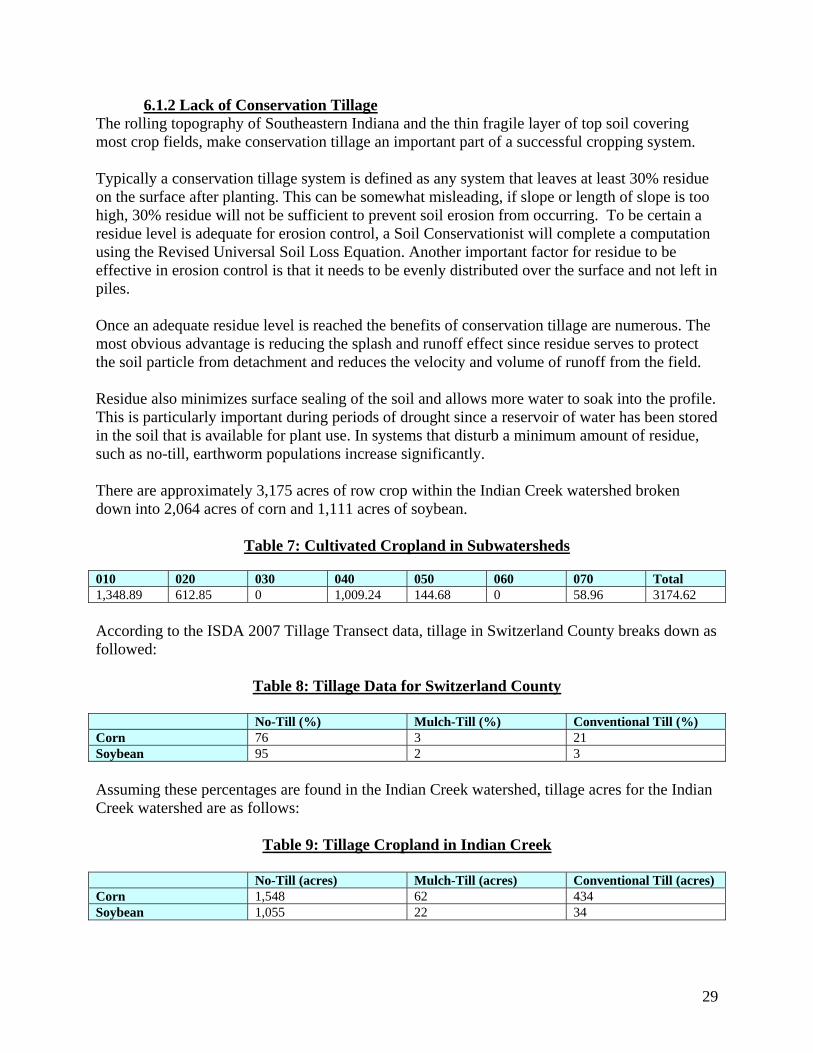
Once an adequate residue level is reached the benefits of conservation tillage are numerous. The most obvious advantage is reducing the splash and runoff effect since residue serves to protect the soil particle from detachment and reduces the velocity and volume of runoff from the field. Residue also minimizes surface sealing of the soil and allows more water to soak into the profile. This is particularly important during periods of drought since a reservoir of water has been stored in the soil that is available for plant use. In systems that disturb a minimum amount of residue, such as no-till, earthworm populations increase significantly. There are approximately 3,175 acres of row crop within the Indian Creek watershed broken down into 2,064 acres of corn and 1,111 acres of soybean.
Table 7: Cultivated Cropland in Subwatersheds
According to the ISDA 2007 Tillage Transect data, tillage in Switzerland County breaks down as followed:
Table 8: Tillage Data for Switzerland County
No-Till (%) Mulch-Till (%) Conventional Till (%) Corn 76 3 21 Soybean 95 2 3
Assuming these percentages are found in the Indian Creek watershed, tillage acres for the Indian Creek watershed are as follows:
Table 9: Tillage Cropland in Indian Creek No-Till (acres) Mulch-Till (acres) Conventional Till (acres) Corn 1,548 62 434 Soybean 1,055 22 34
010 020 030 040 050 060 070 Total 1,348.89 612.85 0 1,009.24 144.68 0 58.96 3174.62

30
6.1.3 Improper Development While construction projects provide jobs, homes, recreation, education and safer roads, they can also have a significant negative impact on water quality if not properly managed. As storm water flows over a construction site, it picks up pollutants like sediment, debris and chemicals. As this polluted storm water runs into a nearby waterbody, it can harm or kill fish and other wildlife. These environmental effects have led to the formation of “Rule 5” by the USEPA. The stormwater program requires operators of constructions sites with one acre or larger (including smaller sites that are part of a larger common plan of development) to obtain authorization to discharge storm water under an NPDES construction storm water permit. In Indiana, the NPDES program is implemented by IDEM, with the help of the IDNR and the local Soil & Water Conservation Districts. This permit requires the developer to write a Storm Water Pollution Prevention Plan (SWPPP) and then implement the plan in the field. This plan is designed to keep all forms of pollutants that come from construction to remain on the construction site. It also requires that there be structures in place to collect pollution on site after the construction site is finished and in operation. While development in the Indian Creek watershed is low, the committee believes that proper conservation practices at construction sites will prevent sedimentation within nearby waterbodies. The table below illustrates developed areas broken within subwatersheds.
Table 10: Developed Areas within the Indian Creek Watershed 010 020 030 040 050 060 070 Total
Acres High Density
1.24 2.48 1.42 0.09 0.85 0.63 8.62 15.33
Medium Density
2.68 3.23 0 0.81 1.47 0.89 28.36 37.44
Low Density
11.68 6.5 2.45 12.23 15.93 9.16 67.03 124.98
TOTAL ACRES
15.6 12.21 3.87 13.13 18.25 10.68 104.01 177.75
6.2 E.Coli Sources 6.2.1 Failing Septic Systems A septic system is a natural method of treatment and disposal of household wastes for those homeowners who are not part of a municipal sewage system. A septic system works by allowing waste water to separate into layers and begin the process of decomposition while being contained within the septic tank. Bacteria, which are naturally present in all septic systems, begin to digest the solids that have settled to the bottom of the tank, transforming up to 50 percent of these solids into liquids and gases9. When liquids within the tank rise to the level of the outflow pipe, they enter the drainage system. This outflow, or effluent, is then distributed throughout the drain
9 “Septic System Maintanence” October 1996. Virginia Cooperative Extension, October 26, 2006, http://www.ext.vt.edu/pubs/housing/448-400/448-400.html#L1

31
field through a series of subsurface pipes. Final treatment of the effluent occurs here as the soil absorbs and filters the liquid and microbes break down the rest of the waste into harmless material. Septic systems cannot dispose of all the material that enters the system. Solids that are not broken down by bacteria begin to accumulate in the septic tank and eventually need to be removed. The most common reason for system failure is not having these solids removed on a regular basis10. When the holding tank is not pumped out frequently enough, the solids can enter the pipes leading to and from the tank. This can cause sewage to back up into the house or cause the drainage system to fail as the pipes and soil become congested. These problems are often costly to fix, pose a danger to public health, and are a significant source of water pollution. Seepage from inadequate or failing septic systems can contaminate both ground and surface waters. In addition to proper maintenance, there are two very important considerations when installing a septic system: proper soil type and adequate separation distance from water tables and/or impermeable soil. According to Joe Spiller, Switzerland County Health Department Inspector, the best soils for a leach field are those that are deep, well-drained, and strong to moderate structured soils such as silt loam or loam soil types. The Switzerland County Soil Survey indicates that each of the soil associations found in the Indian Creek watershed are not suitable for septic tank absorption fields. Placing septic systems in soils unsuitable for leach fields have a high chance of malfunctioning, leading to the contamination of both land and water.
Table 11: Indian Creek Watershed Soil Ratings for Septic Systems
Soil Type Rating Reason Avonburg Severe Wetness, percolates slowly Bonnell Severe Percolates slowly, slope Cincinnati Severe Wetness, percolates slowly Cobbsfork Severe Ponding Eden Severe Depth to rock, slope Huntington Severe Flooding Switzerland Severe Percolates slowly Weisburg Severe Percolates slowly Wheeling Severe Poor Filter, slope
There are approximately 800,000 septic systems in Indiana, and the Indiana State Department of Health (ISDH) estimates that approximately 200,000 of these residential wastewater disposal systems are inadequate and have failed or are failing to protect human and environmental health11. The most commonly reported cause of septic system failures is soil wetness (seasonally high water table), according to a survey of Indiana county sanitarians and environmental health specialists12. Other common causes were undersized systems, system age, and limited space for the soil absorption field. 10 “Septic System Maintanence” October 1996. Virginia Cooperative Extension, October 26, 2006, http://www.ext.vt.edu/pubs/housing/448-400/448-400.html#L1 11 “Septic System Failure” Brad Lee, Don Jones, Heidi Peterson, September, 2005 12 Taylor, C., J. Yahner, and D. Jones. 1997. An Evaluation of Onsite Technology in Indiana. A report to the Indiana State Department of Health. Purdue University, West Lafayette, IN.
32
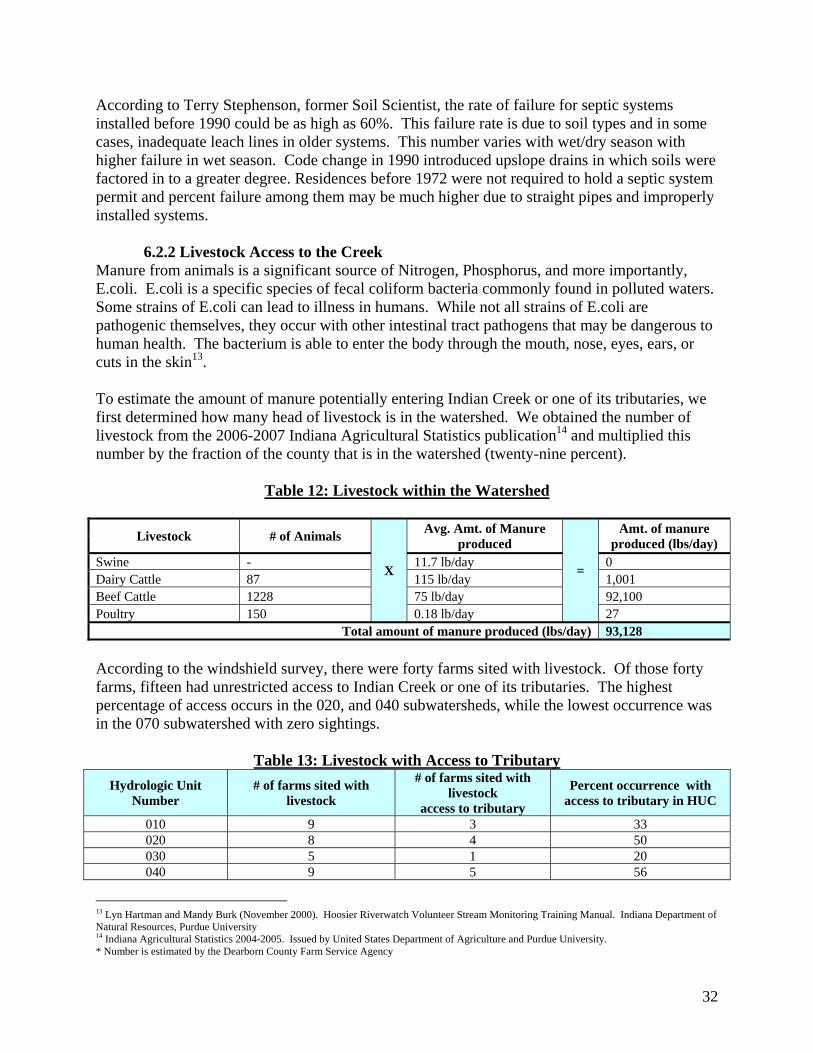
According to Terry Stephenson, former Soil Scientist, the rate of failure for septic systems installed before 1990 could be as high as 60%. This failure rate is due to soil types and in some cases, inadequate leach lines in older systems. This number varies with wet/dry season with higher failure in wet season. Code change in 1990 introduced upslope drains in which soils were factored in to a greater degree. Residences before 1972 were not required to hold a septic system permit and percent failure among them may be much higher due to straight pipes and improperly installed systems. 6.2.2 Livestock Access to the Creek Manure from animals is a significant source of Nitrogen, Phosphorus, and more importantly, E.coli. E.coli is a specific species of fecal coliform bacteria commonly found in polluted waters. Some strains of E.coli can lead to illness in humans. While not all strains of E.coli are pathogenic themselves, they occur with other intestinal tract pathogens that may be dangerous to human health. The bacterium is able to enter the body through the mouth, nose, eyes, ears, or cuts in the skin13. To estimate the amount of manure potentially entering Indian Creek or one of its tributaries, we first determined how many head of livestock is in the watershed. We obtained the number of livestock from the 2006-2007 Indiana Agricultural Statistics publication14 and multiplied this number by the fraction of the county that is in the watershed (twenty-nine percent).
Table 12: Livestock within the Watershed
Livestock # of Animals
X
Avg. Amt. of Manure produced
=
Amt. of manure produced (lbs/day)
Swine - 11.7 lb/day 0 Dairy Cattle 87 115 lb/day 1,001 Beef Cattle 1228 75 lb/day 92,100 Poultry 150 0.18 lb/day 27
Total amount of manure produced (lbs/day) 93,128
According to the windshield survey, there were forty farms sited with livestock. Of those forty farms, fifteen had unrestricted access to Indian Creek or one of its tributaries. The highest percentage of access occurs in the 020, and 040 subwatersheds, while the lowest occurrence was in the 070 subwatershed with zero sightings.
Table 13: Livestock with Access to Tributary
Hydrologic Unit Number
# of farms sited with livestock
# of farms sited with livestock
access to tributary
Percent occurrence with access to tributary in HUC
010 9 3 33 020 8 4 50 030 5 1 20 040 9 5 56
13 Lyn Hartman and Mandy Burk (November 2000). Hoosier Riverwatch Volunteer Stream Monitoring Training Manual. Indiana Department of Natural Resources, Purdue University 14 Indiana Agricultural Statistics 2004-2005. Issued by United States Department of Agriculture and Purdue University. * Number is estimated by the Dearborn County Farm Service Agency

33
050 5 1 20 060 4 1 25 070 0 0 0
TOTAL 40 15 38 6.3 Nutrient Sources 6.3.1 Improper Nutrient Management Fertilizers are generally defined as "any material, organic or inorganic, natural or synthetic, which supplies one or more of the chemical elements required for the plant growth"15. Most fertilizers that are commonly used in agriculture contain the three basic plant nutrients: nitrogen, phosphorus, and potassium. Some fertilizers also contain certain "micronutrients," such as zinc and other metals that are necessary for plant growth. Fertilizers are applied to replace the essential nutrients for plant growth to the soil after they have been depleted. Over fertilization of tobacco and pasture/hay land is known to occur in the watershed. Excess amounts of fertilizers may enter streams creating sources of nonpoint pollution. An important characteristic of phosphorus that has significant implications for water quality is its tendency to bind to soil particles. Because of this, when phosphorus is applied to fields it stays relatively immobilized and stable on land as long as the soil remains intact. However, when land suffers from erosion, soil is washed into waterways and the phosphorus attached to it is then released into the water. Once phosphorus enters the water, the algae bloom cycle begins. Because of this process, erosion and runoff are key issues that need to be addressed for good phosphorus management. Fertilizers potentially entering Indian Creek are estimated using “The Watershed Inventory Tool for Indiana.” The fraction of acres treated in the state and average rate of application are recorded by the Indiana Agricultural Statistics Service.
Table 14: Estimated Fertilizer Applied to Agricultural Land
Crop Acres
X
Fertilizer Type
Fraction of acres
treated in state
X
Average rate of
application (lbs/acre)
=
Estimated amt. of
fertilizer applied (lbs)
Corn 2064 Nitrogen 1.00 145 299,280 Phosphorus 0.97 59 118,123
Soybean 1111 Nitrogen 0.15 29 4,833 Phosphorus 0.26 46 13,288
Total amount of nitrogen 304,113 Total amount of phosphorus 131,411
6.3.2 Lack of Riparian Buffers Riparian buffers are defined as strips of grass, shrubs, and/or trees along the banks of river and streams which filter polluted runoff and provide a transition zone between water and human land use. They provide several benefits to water quality such as preserving a streams natural
15 Utah State University Extension, “Fertilizer Management.” N.d., http://extension.usu.edu/cooperative/waterquality/index.cfm/cid.813/tid.2148/ (July 18, 2006).
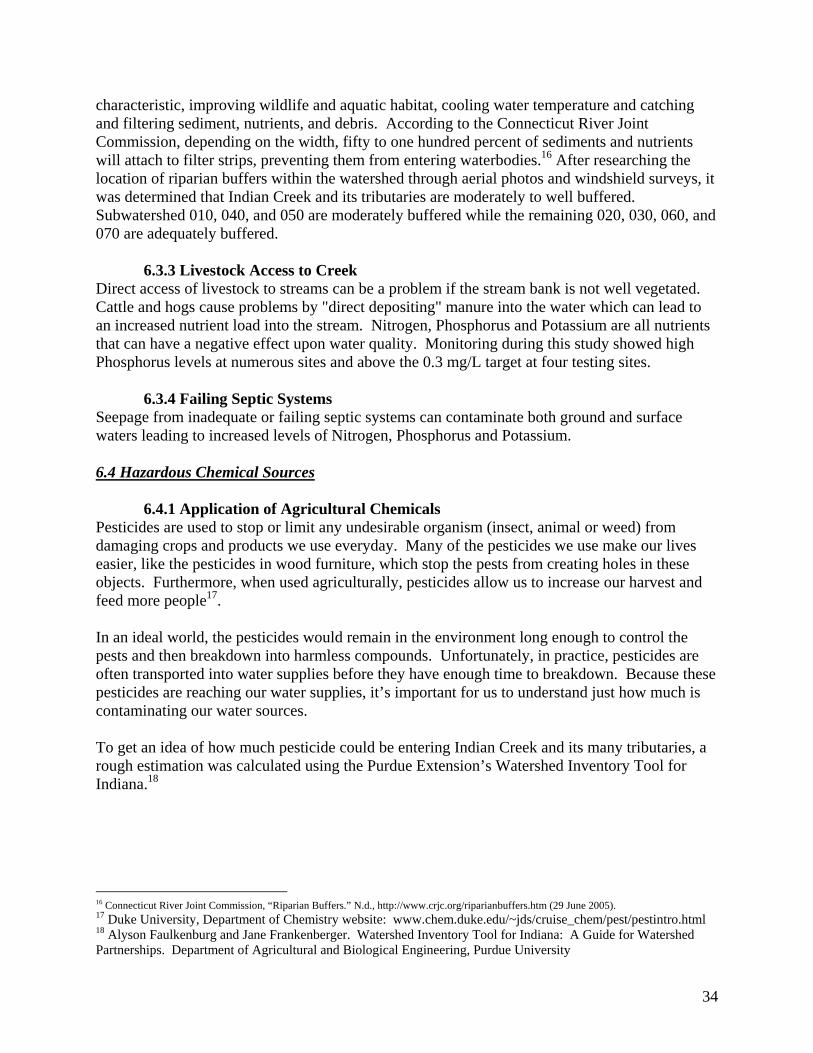
34
characteristic, improving wildlife and aquatic habitat, cooling water temperature and catching and filtering sediment, nutrients, and debris. According to the Connecticut River Joint Commission, depending on the width, fifty to one hundred percent of sediments and nutrients will attach to filter strips, preventing them from entering waterbodies.16 After researching the location of riparian buffers within the watershed through aerial photos and windshield surveys, it was determined that Indian Creek and its tributaries are moderately to well buffered. Subwatershed 010, 040, and 050 are moderately buffered while the remaining 020, 030, 060, and 070 are adequately buffered.
6.3.3 Livestock Access to Creek
Direct access of livestock to streams can be a problem if the stream bank is not well vegetated. Cattle and hogs cause problems by "direct depositing" manure into the water which can lead to an increased nutrient load into the stream. Nitrogen, Phosphorus and Potassium are all nutrients that can have a negative effect upon water quality. Monitoring during this study showed high Phosphorus levels at numerous sites and above the 0.3 mg/L target at four testing sites.
6.3.4 Failing Septic Systems Seepage from inadequate or failing septic systems can contaminate both ground and surface waters leading to increased levels of Nitrogen, Phosphorus and Potassium. 6.4 Hazardous Chemical Sources 6.4.1 Application of Agricultural Chemicals Pesticides are used to stop or limit any undesirable organism (insect, animal or weed) from damaging crops and products we use everyday. Many of the pesticides we use make our lives easier, like the pesticides in wood furniture, which stop the pests from creating holes in these objects. Furthermore, when used agriculturally, pesticides allow us to increase our harvest and feed more people17. In an ideal world, the pesticides would remain in the environment long enough to control the pests and then breakdown into harmless compounds. Unfortunately, in practice, pesticides are often transported into water supplies before they have enough time to breakdown. Because these pesticides are reaching our water supplies, it’s important for us to understand just how much is contaminating our water sources. To get an idea of how much pesticide could be entering Indian Creek and its many tributaries, a rough estimation was calculated using the Purdue Extension’s Watershed Inventory Tool for Indiana.18
16 Connecticut River Joint Commission, “Riparian Buffers.” N.d., http://www.crjc.org/riparianbuffers.htm (29 June 2005). 17 Duke University, Department of Chemistry website: www.chem.duke.edu/~jds/cruise_chem/pest/pestintro.html 18 Alyson Faulkenburg and Jane Frankenberger. Watershed Inventory Tool for Indiana: A Guide for Watershed Partnerships. Department of Agricultural and Biological Engineering, Purdue University
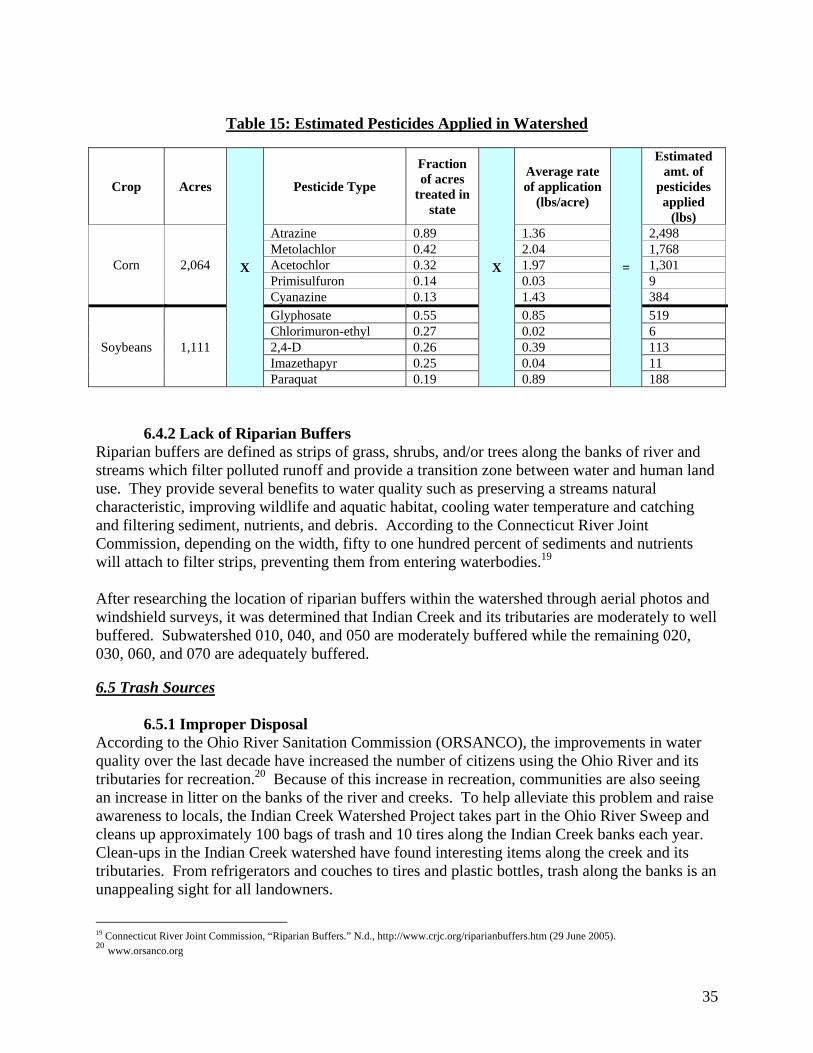
35
Table 15: Estimated Pesticides Applied in Watershed
Crop Acres
X
Pesticide Type
Fraction of acres
treated in state
X
Average rate of application
(lbs/acre)
=
Estimated amt. of
pesticides applied
(lbs)
Corn 2,064
Atrazine 0.89 1.36 2,498 Metolachlor 0.42 2.04 1,768 Acetochlor 0.32 1.97 1,301 Primisulfuron 0.14 0.03 9 Cyanazine 0.13 1.43 384
Soybeans 1,111
Glyphosate 0.55 0.85 519 Chlorimuron-ethyl 0.27 0.02 6 2,4-D 0.26 0.39 113 Imazethapyr 0.25 0.04 11 Paraquat 0.19 0.89 188
6.4.2 Lack of Riparian Buffers Riparian buffers are defined as strips of grass, shrubs, and/or trees along the banks of river and streams which filter polluted runoff and provide a transition zone between water and human land use. They provide several benefits to water quality such as preserving a streams natural characteristic, improving wildlife and aquatic habitat, cooling water temperature and catching and filtering sediment, nutrients, and debris. According to the Connecticut River Joint Commission, depending on the width, fifty to one hundred percent of sediments and nutrients will attach to filter strips, preventing them from entering waterbodies.19 After researching the location of riparian buffers within the watershed through aerial photos and windshield surveys, it was determined that Indian Creek and its tributaries are moderately to well buffered. Subwatershed 010, 040, and 050 are moderately buffered while the remaining 020, 030, 060, and 070 are adequately buffered. 6.5 Trash Sources
6.5.1 Improper Disposal According to the Ohio River Sanitation Commission (ORSANCO), the improvements in water quality over the last decade have increased the number of citizens using the Ohio River and its tributaries for recreation.20 Because of this increase in recreation, communities are also seeing an increase in litter on the banks of the river and creeks. To help alleviate this problem and raise awareness to locals, the Indian Creek Watershed Project takes part in the Ohio River Sweep and cleans up approximately 100 bags of trash and 10 tires along the Indian Creek banks each year. Clean-ups in the Indian Creek watershed have found interesting items along the creek and its tributaries. From refrigerators and couches to tires and plastic bottles, trash along the banks is an unappealing sight for all landowners.
19 Connecticut River Joint Commission, “Riparian Buffers.” N.d., http://www.crjc.org/riparianbuffers.htm (29 June 2005). 20 www.orsanco.org

36
6.5.2 Lack of Drop-off Sites There is currently only one recycling drop-off site in Switzerland County, located in East Enterprise. While watershed residents can drop off items such as refrigerators, tires, and other common recyclables, some residents feel it is too inconvenient to travel that far. This can result in people dumping old appliances and tires in secluded areas, typically in ravines that drain to the creek. During a windshield survey performed on April 25, 2005, committee members witnessed several areas throughout the watershed that were illegal dump sites. The table below shows how many dump sites were located in each subwatershed.
Table 16: Dump Sites Located in Subwatersheds
010 020 030 040 050 060 070 Total Dump Sites
3 4 2 1 0 1 1 12
6.6 Recreational Sources
6.6.1 Lack of Public Access Sites
According to the 2006-2010 Statewide Comprehensive Outdoor Recreation Plan (SCORP), benefits are endless when it comes to outdoor recreation; people have better health and qualities of life, crime can be reduced because individuals can expel energy and emotion while performing outdoor activities, property values may increase because there are ample outdoor leisure opportunities, the economy benefits by providing an attraction for tourism, and awareness of the environment is heightened because people are spending more time in nature. The Division of Outdoor Recreation (DOR) believes assessing local outdoor recreation acres at the county level may be the best way to identify counties that need more assistance in improving their outdoor recreation supply. The DOR assessed the critical counties within Indiana that do not have the recommended outdoor recreation supply acreage of 55 acres per 1,000 population and has a population growth rate that is higher than the 2000-2005 population growth rate of 3.1% for county21. While Switzerland County meets the needs of the current population, access to the creek for fishing and boating is limited. There are currently no access sites to Indian Creek with the exception of the Ohio River through the Vevay boat launch.
21 Indiana Statewide Outdoor Recreation Plan 2006-2010

37
The critical areas for sedimentation from livestock sources were determined using the windshield survey results. Subwatersheds with more than 50% occurrence of livestock with access to the creek received a high priority. Those that had between 10-50% occurrence received a medium priority, and those under 10% received a low priority.
The critical areas for sedimentation from conventional tillage were determined using the total acreage of cultivated cropland in each subwatershed. Subwatersheds with more than 1,000 acres of cultivated cropland received a high priority. Those that had between 100 – 999 acres received a medium priority, and those under 100 acres received a low priority.
The critical areas for sedimentation from urban areas were determined using the total acreage of developed land in each subwatershed. Subwatersheds with more than 100 acres of developed land received high priority. Subwatersheds with 11-99 acres of developed land received medium priority. Development in these areas is likely to continue which will require implementation of urban erosion control methods to maintain or improve water quality. Subwatersheds with 10 acres or less of developed
land received low priority. The critical areas for E.coli from livestock sources were determined using the windshield survey results. Subwatersheds with more than 50% occurrence of livestock with access to the creek received a high priority. Those that had between 10-50% occurrence received a medium priority, and those under 10% received a low priority.

38
According to Joe Spiller, Switzerland County Health Department Inspector, the best soils for a leach field are those that are deep, well-drained, and strong to moderate structured soils such as silt loam or loam soil types. The Switzerland County Soil Survey indicates that each of the soil associations found in the Indian Creek watershed are not suitable for septic tank absorption fields. Placing septic systems in soils unsuitable for leach fields have a high chance of malfunctioning, leading to the contamination of both land and water. In addition, the critical areas for E.coli
from septic system sources were also determined by using the water testing results taken throughout the year. Subwatersheds that averaged more than the state standard of 235 colonies per 100 mL received a high priority. Those that were below the state standard received a low priority.
The critical areas for nutrients from agricultural land were determined using the total acreage of cultivated cropland and pasture/hayland. Subwatersheds that have more than the 2,000 acres of combined pasture/hayland and cropland received a high priority. Those that have between 1,000 – 2,000 acres of combined cropland and pasture/hayland received a medium priority, and those that have less than 1,000 acres of combined cropland and pasture/hayland were given a low priority.
The critical areas for nutrients from lack of riparian buffers were determined using windshield surveys and aerial photographs. Subwatersheds 010, 040, and 050 had moderately buffered streams and were given a medium priority. Subwatersheds 020, 030, 060, and 070 had sufficiently buffered streams and were given a low priority. Because the watershed is adequately buffered, no areas were given a high priority.

39
The critical areas for chemicals from chemical application were determined using the total acreage of cultivated cropland in each subwatershed. Subwatersheds with more than 1,000 acres of cultivated cropland received a high priority. Those that had between 100 – 999 acres received a medium priority, and those under 100 acres received a low priority.

40
The critical areas for chemicals from lack of riparian buffers were determined using windshield surveys and aerial photographs. Subwatersheds 010, 040, and 050 had moderately buffered streams and were given a medium priority. Subwatersheds 020, 030, 060, and 070 had sufficiently buffered streams and were given a low priority. Because the watershed is adequately buffered, no areas were given a high priority.
The critical areas for dumping were determined using windshield surveys and field days. Subwatersheds where more than one illegal dump site was found or a clean-up field day was performed received high priority. Areas where only one illegal dump was found were given a medium priority, and the 050 subwatershed with no dump sites was given a low priority.
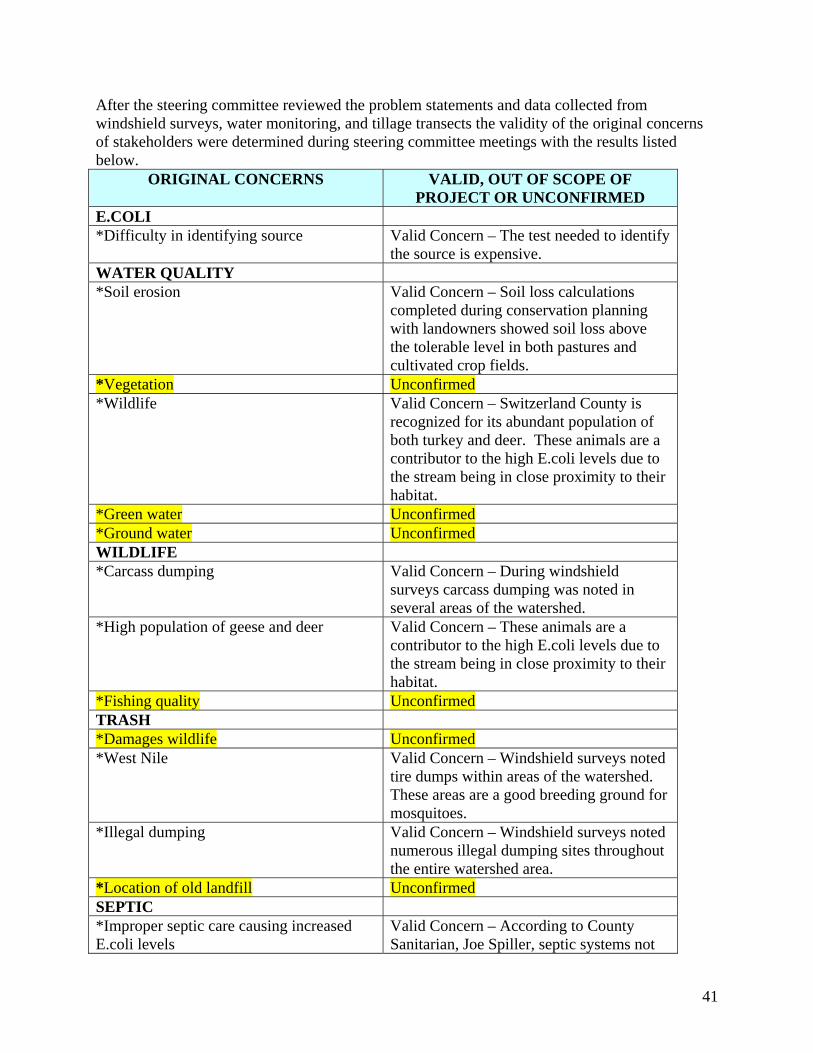
41
After the steering committee reviewed the problem statements and data collected from windshield surveys, water monitoring, and tillage transects the validity of the original concerns of stakeholders were determined during steering committee meetings with the results listed below.
ORIGINAL CONCERNS VALID, OUT OF SCOPE OF PROJECT OR UNCONFIRMED
E.COLI *Difficulty in identifying source Valid Concern – The test needed to identify
the source is expensive. WATER QUALITY *Soil erosion Valid Concern – Soil loss calculations
completed during conservation planning with landowners showed soil loss above the tolerable level in both pastures and cultivated crop fields.
*Vegetation Unconfirmed *Wildlife Valid Concern – Switzerland County is
recognized for its abundant population of both turkey and deer. These animals are a contributor to the high E.coli levels due to the stream being in close proximity to their habitat.
*Green water Unconfirmed *Ground water Unconfirmed WILDLIFE *Carcass dumping Valid Concern – During windshield
surveys carcass dumping was noted in several areas of the watershed.
*High population of geese and deer Valid Concern – These animals are a contributor to the high E.coli levels due to the stream being in close proximity to their habitat.
*Fishing quality Unconfirmed TRASH *Damages wildlife Unconfirmed *West Nile Valid Concern – Windshield surveys noted
tire dumps within areas of the watershed. These areas are a good breeding ground for mosquitoes.
*Illegal dumping Valid Concern – Windshield surveys noted numerous illegal dumping sites throughout the entire watershed area.
*Location of old landfill Unconfirmed SEPTIC *Improper septic care causing increased E.coli levels
Valid Concern – According to County Sanitarian, Joe Spiller, septic systems not
42
being properly maintained which can result in septic failure and an increased level of E.coli entering the streams.
LIVESTOCK ACCESS *Using creek as water source Valid Concern – Windshield surveys noted
numerous sites where the creek was the only water source for livestock.
*Lack of stream crossings Valid Concern – Sites noted for using the creek as a water source showed livestock having access to the entire stream without a specific crossing.
*High count of livestock with access to waterbodies
Valid Concern – Windshield surveys noted numerous sites where the creek was the only water source for livestock.
*Lack of buffer and filter strips Valid Concern – Reviewing area photographs and windshield surveys noted lack of buffer strips away from the main water body.
RECREATION *Lack of Fishing - no public access sites Valid Concern – There are no public access
sites along the entire creek. *Swimming – no public access sites Valid Concern – There are no public access
sites along the entire creek. Swimming after rain events is unadvisable due to the high E.coli levels found during water monitoring.
INDUSTRY *Agriculture is largest industry in watershed
Valid Concern – If improperly applied pesticides and chemicals used within the watershed could lead to water impairment.
*Large acreage of pasture/hay land within watershed
Valid Concern – Overgrazed pastures have been noted by conservationist through planning with landowners.
AIR POLLUTION *Direct flight zone from Cincinnati Airport Out of scope of project
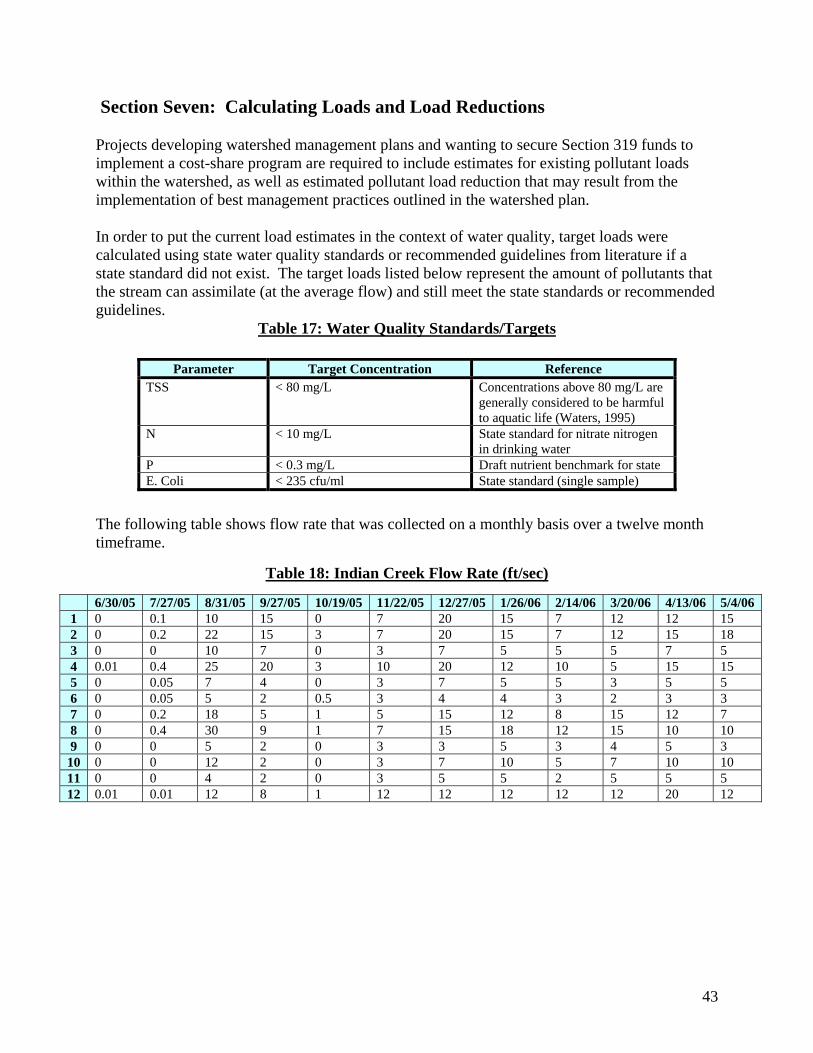
43
Section Seven: Calculating Loads and Load Reductions Projects developing watershed management plans and wanting to secure Section 319 funds to implement a cost-share program are required to include estimates for existing pollutant loads within the watershed, as well as estimated pollutant load reduction that may result from the implementation of best management practices outlined in the watershed plan. In order to put the current load estimates in the context of water quality, target loads were calculated using state water quality standards or recommended guidelines from literature if a state standard did not exist. The target loads listed below represent the amount of pollutants that the stream can assimilate (at the average flow) and still meet the state standards or recommended guidelines.
Table 17: Water Quality Standards/Targets
The following table shows flow rate that was collected on a monthly basis over a twelve month timeframe.
Table 18: Indian Creek Flow Rate (ft/sec)
6/30/05 7/27/05 8/31/05 9/27/05 10/19/05 11/22/05 12/27/05 1/26/06 2/14/06 3/20/06 4/13/06 5/4/06 1 0 0.1 10 15 0 7 20 15 7 12 12 15 2 0 0.2 22 15 3 7 20 15 7 12 15 18 3 0 0 10 7 0 3 7 5 5 5 7 5 4 0.01 0.4 25 20 3 10 20 12 10 5 15 15 5 0 0.05 7 4 0 3 7 5 5 3 5 5 6 0 0.05 5 2 0.5 3 4 4 3 2 3 3 7 0 0.2 18 5 1 5 15 12 8 15 12 7 8 0 0.4 30 9 1 7 15 18 12 15 10 10 9 0 0 5 2 0 3 3 5 3 4 5 3
10 0 0 12 2 0 3 7 10 5 7 10 10 11 0 0 4 2 0 3 5 5 2 5 5 5 12 0.01 0.01 12 8 1 12 12 12 12 12 20 12
Parameter Target Concentration Reference TSS < 80 mg/L Concentrations above 80 mg/L are
generally considered to be harmful to aquatic life (Waters, 1995)
N < 10 mg/L State standard for nitrate nitrogen in drinking water
P < 0.3 mg/L Draft nutrient benchmark for state E. Coli < 235 cfu/ml State standard (single sample)
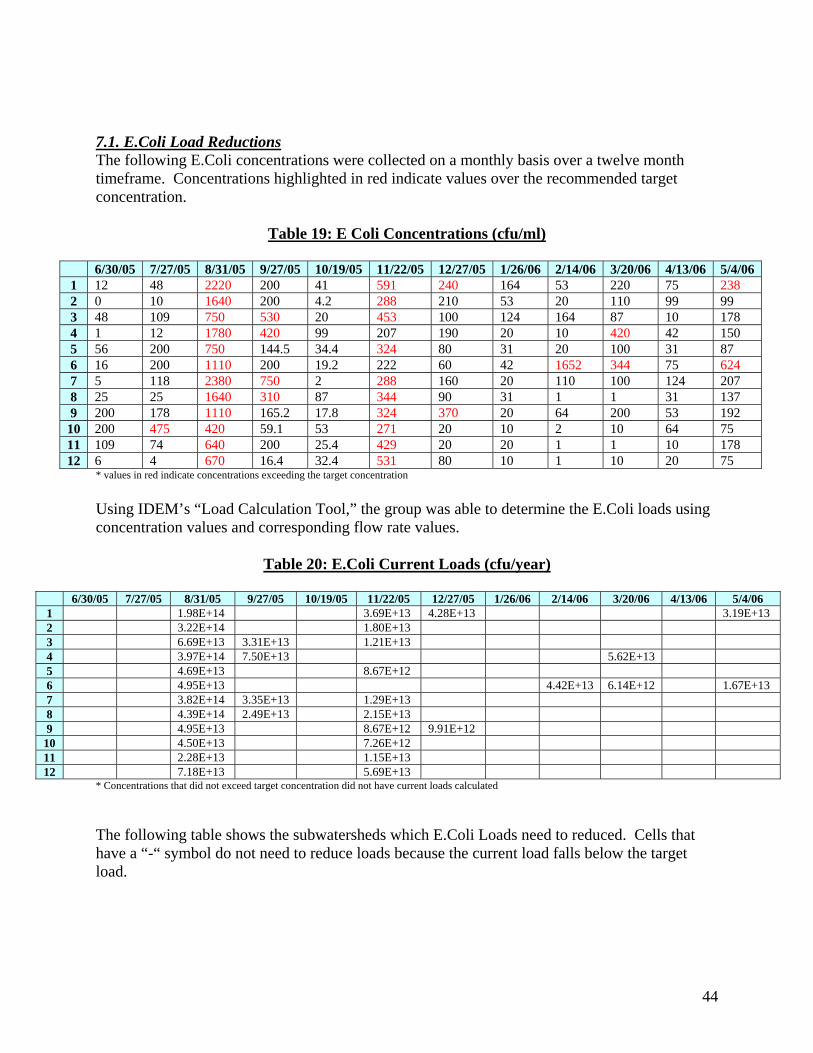
44
7.1. E.Coli Load Reductions The following E.Coli concentrations were collected on a monthly basis over a twelve month timeframe. Concentrations highlighted in red indicate values over the recommended target concentration.
Table 19: E Coli Concentrations (cfu/ml)
6/30/05 7/27/05 8/31/05 9/27/05 10/19/05 11/22/05 12/27/05 1/26/06 2/14/06 3/20/06 4/13/06 5/4/06 1 12 48 2220 200 41 591 240 164 53 220 75 238 2 0 10 1640 200 4.2 288 210 53 20 110 99 99 3 48 109 750 530 20 453 100 124 164 87 10 178 4 1 12 1780 420 99 207 190 20 10 420 42 150 5 56 200 750 144.5 34.4 324 80 31 20 100 31 87 6 16 200 1110 200 19.2 222 60 42 1652 344 75 624 7 5 118 2380 750 2 288 160 20 110 100 124 207 8 25 25 1640 310 87 344 90 31 1 1 31 137 9 200 178 1110 165.2 17.8 324 370 20 64 200 53 192
10 200 475 420 59.1 53 271 20 10 2 10 64 75 11 109 74 640 200 25.4 429 20 20 1 1 10 178 12 6 4 670 16.4 32.4 531 80 10 1 10 20 75
* values in red indicate concentrations exceeding the target concentration
Using IDEM’s “Load Calculation Tool,” the group was able to determine the E.Coli loads using concentration values and corresponding flow rate values.
Table 20: E.Coli Current Loads (cfu/year)
6/30/05 7/27/05 8/31/05 9/27/05 10/19/05 11/22/05 12/27/05 1/26/06 2/14/06 3/20/06 4/13/06 5/4/06 1 1.98E+14 3.69E+13 4.28E+13 3.19E+13 2 3.22E+14 1.80E+13 3 6.69E+13 3.31E+13 1.21E+13 4 3.97E+14 7.50E+13 5.62E+13 5 4.69E+13 8.67E+12 6 4.95E+13 4.42E+13 6.14E+12 1.67E+13 7 3.82E+14 3.35E+13 1.29E+13 8 4.39E+14 2.49E+13 2.15E+13 9 4.95E+13 8.67E+12 9.91E+12
10 4.50E+13 7.26E+12 11 2.28E+13 1.15E+13 12 7.18E+13 5.69E+13
* Concentrations that did not exceed target concentration did not have current loads calculated
The following table shows the subwatersheds which E.Coli Loads need to reduced. Cells that have a “-“ symbol do not need to reduce loads because the current load falls below the target load.
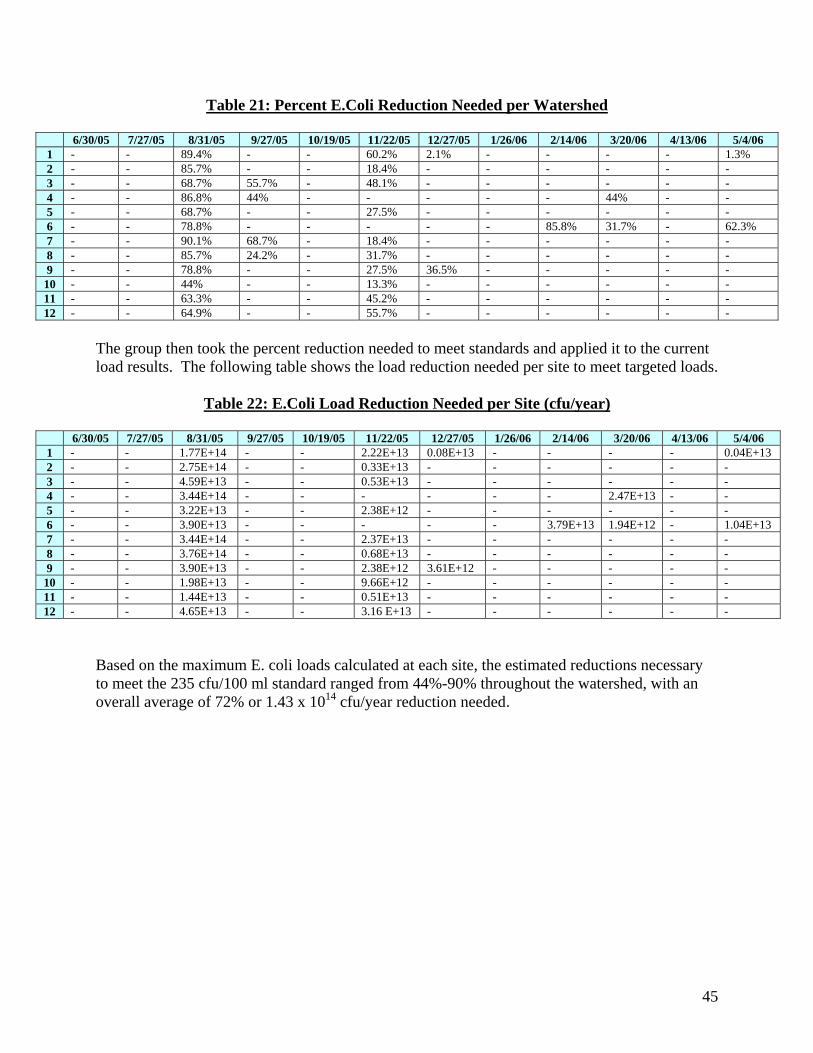
45
Table 21: Percent E.Coli Reduction Needed per Watershed
6/30/05 7/27/05 8/31/05 9/27/05 10/19/05 11/22/05 12/27/05 1/26/06 2/14/06 3/20/06 4/13/06 5/4/06 1 - - 89.4% - - 60.2% 2.1% - - - - 1.3% 2 - - 85.7% - - 18.4% - - - - - - 3 - - 68.7% 55.7% - 48.1% - - - - - - 4 - - 86.8% 44% - - - - - 44% - - 5 - - 68.7% - - 27.5% - - - - - - 6 - - 78.8% - - - - - 85.8% 31.7% - 62.3% 7 - - 90.1% 68.7% - 18.4% - - - - - - 8 - - 85.7% 24.2% - 31.7% - - - - - - 9 - - 78.8% - - 27.5% 36.5% - - - - -
10 - - 44% - - 13.3% - - - - - - 11 - - 63.3% - - 45.2% - - - - - - 12 - - 64.9% - - 55.7% - - - - - -
The group then took the percent reduction needed to meet standards and applied it to the current load results. The following table shows the load reduction needed per site to meet targeted loads.
Table 22: E.Coli Load Reduction Needed per Site (cfu/year)
6/30/05 7/27/05 8/31/05 9/27/05 10/19/05 11/22/05 12/27/05 1/26/06 2/14/06 3/20/06 4/13/06 5/4/06 1 - - 1.77E+14 - - 2.22E+13 0.08E+13 - - - - 0.04E+13 2 - - 2.75E+14 - - 0.33E+13 - - - - - - 3 - - 4.59E+13 - - 0.53E+13 - - - - - - 4 - - 3.44E+14 - - - - - - 2.47E+13 - - 5 - - 3.22E+13 - - 2.38E+12 - - - - - - 6 - - 3.90E+13 - - - - - 3.79E+13 1.94E+12 - 1.04E+13 7 - - 3.44E+14 - - 2.37E+13 - - - - - - 8 - - 3.76E+14 - - 0.68E+13 - - - - - - 9 - - 3.90E+13 - - 2.38E+12 3.61E+12 - - - - -
10 - - 1.98E+13 - - 9.66E+12 - - - - - - 11 - - 1.44E+13 - - 0.51E+13 - - - - - - 12 - - 4.65E+13 - - 3.16 E+13 - - - - - -
Based on the maximum E. coli loads calculated at each site, the estimated reductions necessary to meet the 235 cfu/100 ml standard ranged from 44%-90% throughout the watershed, with an overall average of 72% or 1.43 x 10¹⁴ cfu/year reduction needed.

7.2 Nutrient and Total Suspended Solids Load Reductions The following Phosphorus and Total Suspended Solids concentrations were collected on a monthly basis over a twelve month timeframe. Concentrations highlighted in red indicate values over the recommended target concentration.
Table 23: Nutrient Concentrations and Total Suspended Solids (mg/L)
6/30/05 7/27/05 8/31/05 9/27/05 10/19/05 11/22/05 12/27/05 1/26/06 2/14/06 3/20/06 4/13/06 5/4/06
1 P 0.37 0.2425 0.3578 0.1165 0.2254 0.1204 0.0847 0.0515 0.0512 0.077 0.086 0.108
TSS 22 30 0.01 6 16 11 29 3 5 2 5 14
2 P 0.34 0.1867 0.4454 0.0701 0.0852 0.588 0.3979 0.0571 0.0513 0.11 0.108 0.121
TSS 12 15 0.01 14 10 8 4 1 2 1 3 3
3 P 0.45 0.2529 0.4131 0.1291 0.2817 0.1731 0.867 0.1231 0.114 0.128 0.149 0.204
TSS 10 25 2 6 32 6 2 1 1 2 4 5
4 P 0.34 0.2383 0.3235 0.1937 0.1048 0.1055 0.455 0.1426 0.46 0.096 0.093 0.161
TSS 8 10 10 10 20 13 3 2 3 2 3 11
5 P 0.54 0.3327 0.393 0.1479 0.2355 0.142 0.1742 0.1123 0.4 0.142 0.141 0.201
TSS 10 1 0.01 10 14 5 1 3 2 2 4 8
6 P 0.49 0.2695 0.4446 0.4119 1.646 0.2185 0.1877 0.1591 0.1109 0.183 0.163 0.199
TSS 20 15 8 46 22 33 6 6 9 5 12 13
7 P 0.57 0.3652 0.3798 0.1094 0.1428 0.1675 0.2144 0.1647 0.37 0.192 0.117 0.173
TSS 20 10 12 12 4 6 2 4 4 3 6 8
8 P 0.49 0.2402 0.4194 0.0987 0.1234 0.1555 0.2048 0.1547 0.137 0.124 0.156 0.158
TSS 12 20 6 18 18 6 4 3 4 4 5 4
9 P 0.44 0.2995 0.4396 0.1313 0.1691 0.1811 0.2352 0.1937 0.1371 0.14 0.18 0.325
TSS 16 35 1 8 22 5 1 21 2 2 7 9
10 P 0.59 0.2616 0.4491 0.1306 0.1278 0.238 0.2504 0.1649 0.1232 0.216 0.199 0.255
TSS 8 15 8 8 1 5 8 4 2 11 1 41
11 P 0.79 0.03 0.3409 0.148 0.2433 0.2248 0.2438 0.543 0.1669 0.172 0.369 0.05
TSS 12 10 4 16 4 6 2 63 2 3 12 5
12 P 0.31 0.56 0.4812 0.03 0.1387 0.1834 0.2384 0.1478 0.1203 0.127 0.211 0.195
TSS 12 310 6 12 34 6 7 1 1 4 25 9
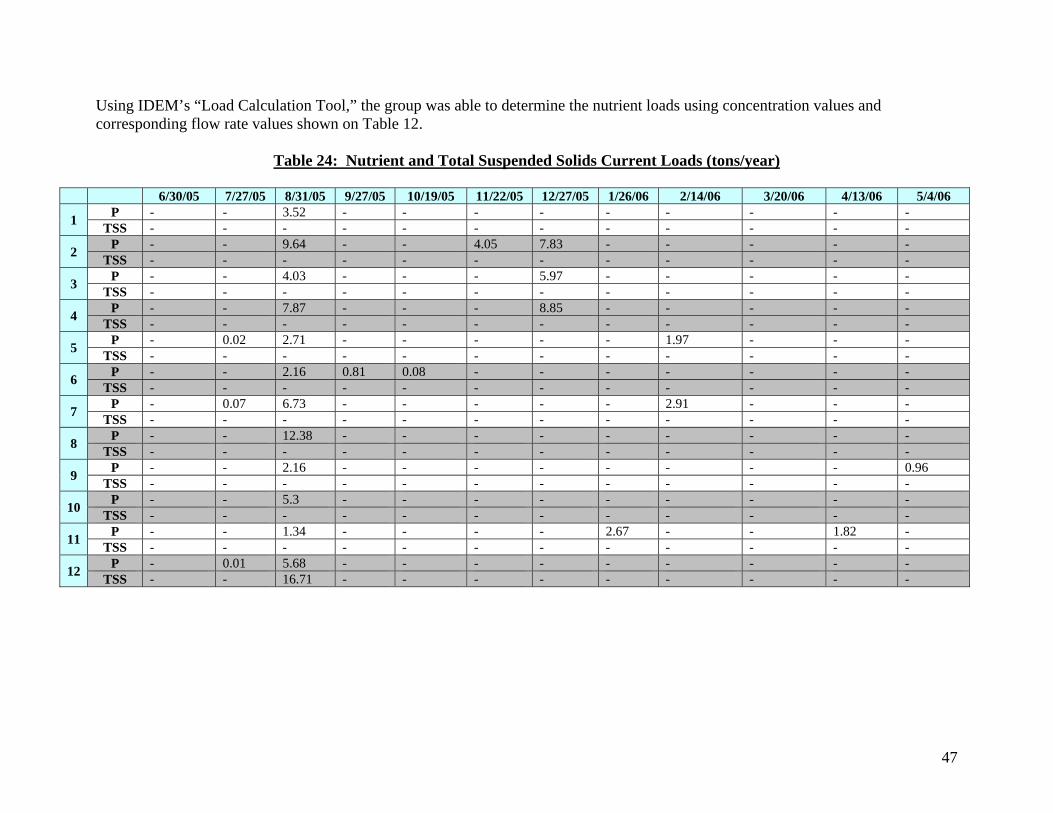
47
Using IDEM’s “Load Calculation Tool,” the group was able to determine the nutrient loads using concentration values and corresponding flow rate values shown on Table 12.
Table 24: Nutrient and Total Suspended Solids Current Loads (tons/year)
6/30/05 7/27/05 8/31/05 9/27/05 10/19/05 11/22/05 12/27/05 1/26/06 2/14/06 3/20/06 4/13/06 5/4/06
1 P - - 3.52 - - - - - - - - -
TSS - - - - - - - - - - - -
2 P - - 9.64 - - 4.05 7.83 - - - - -
TSS - - - - - - - - - - - -
3 P - - 4.03 - - - 5.97 - - - - -
TSS - - - - - - - - - - - -
4 P - - 7.87 - - - 8.85 - - - - -
TSS - - - - - - - - - - - -
5 P - 0.02 2.71 - - - - - 1.97 - - -
TSS - - - - - - - - - - - -
6 P - - 2.16 0.81 0.08 - - - - - - -
TSS - - - - - - - - - - - -
7 P - 0.07 6.73 - - - - - 2.91 - - -
TSS - - - - - - - - - - - -
8 P - - 12.38 - - - - - - - - -
TSS - - - - - - - - - - - -
9 P - - 2.16 - - - - - - - - 0.96
TSS - - - - - - - - - - - -
10 P - - 5.3 - - - - - - - - -
TSS - - - - - - - - - - - -
11 P - - 1.34 - - - - 2.67 - - 1.82 -
TSS - - - - - - - - - - - -
12 P - 0.01 5.68 - - - - - - - - -
TSS - - 16.71 - - - - - - - - -
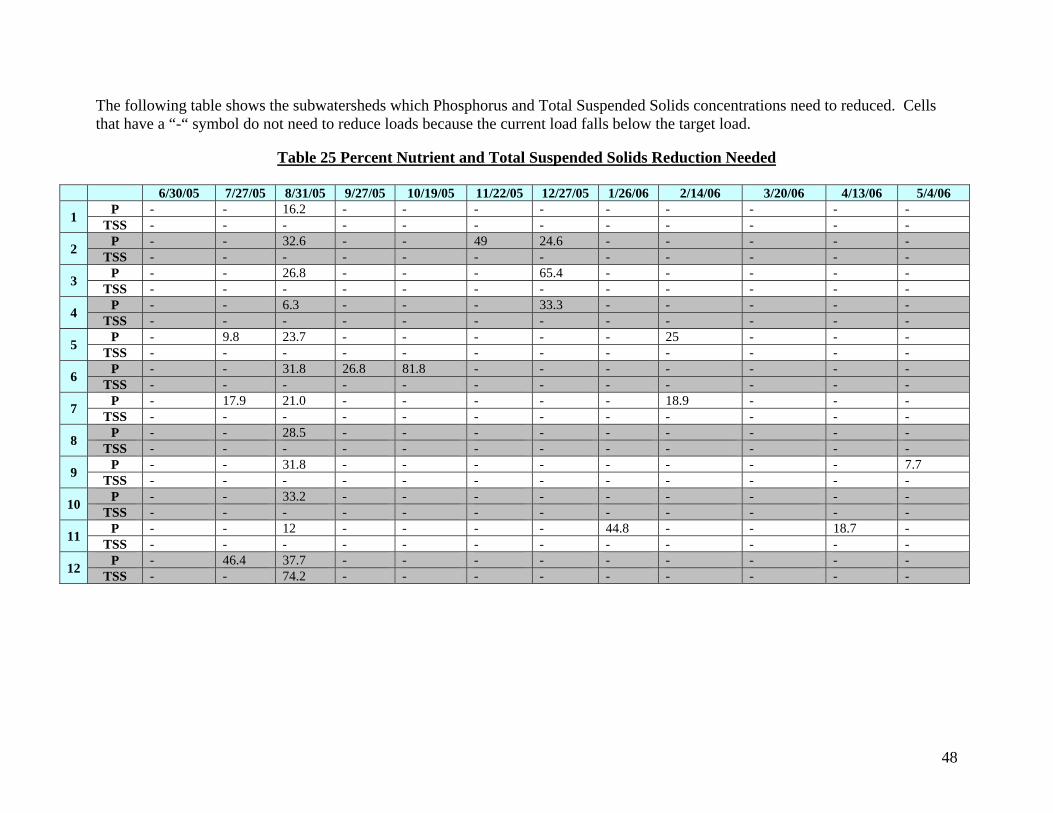
48
The following table shows the subwatersheds which Phosphorus and Total Suspended Solids concentrations need to reduced. Cells that have a “-“ symbol do not need to reduce loads because the current load falls below the target load.
Table 25 Percent Nutrient and Total Suspended Solids Reduction Needed
6/30/05 7/27/05 8/31/05 9/27/05 10/19/05 11/22/05 12/27/05 1/26/06 2/14/06 3/20/06 4/13/06 5/4/06
1 P - - 16.2 - - - - - - - - -
TSS - - - - - - - - - - - -
2 P - - 32.6 - - 49 24.6 - - - - -
TSS - - - - - - - - - - - -
3 P - - 26.8 - - - 65.4 - - - - -
TSS - - - - - - - - - - - -
4 P - - 6.3 - - - 33.3 - - - - -
TSS - - - - - - - - - - - -
5 P - 9.8 23.7 - - - - - 25 - - -
TSS - - - - - - - - - - - -
6 P - - 31.8 26.8 81.8 - - - - - - -
TSS - - - - - - - - - - - -
7 P - 17.9 21.0 - - - - - 18.9 - - -
TSS - - - - - - - - - - - -
8 P - - 28.5 - - - - - - - - -
TSS - - - - - - - - - - - -
9 P - - 31.8 - - - - - - - - 7.7
TSS - - - - - - - - - - - -
10 P - - 33.2 - - - - - - - - -
TSS - - - - - - - - - - - -
11 P - - 12 - - - - 44.8 - - 18.7 -
TSS - - - - - - - - - - - -
12 P - 46.4 37.7 - - - - - - - - -
TSS - - 74.2 - - - - - - - - -
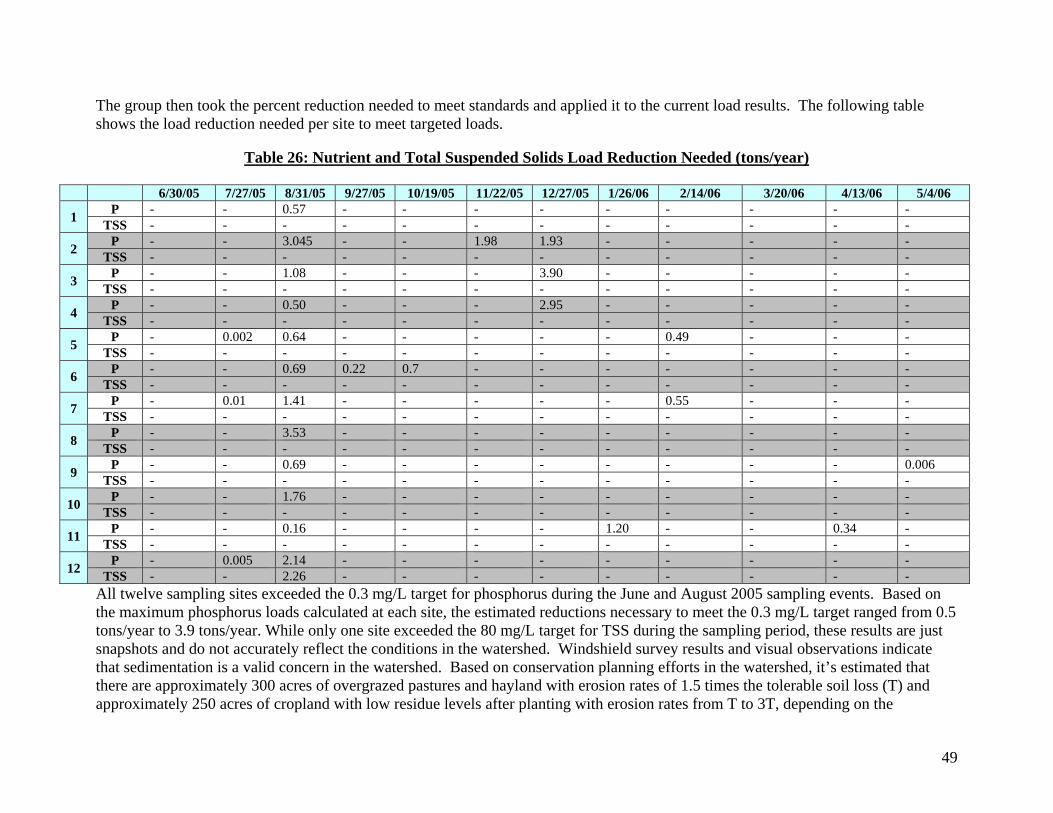
49
The group then took the percent reduction needed to meet standards and applied it to the current load results. The following table shows the load reduction needed per site to meet targeted loads.
Table 26: Nutrient and Total Suspended Solids Load Reduction Needed (tons/year)
6/30/05 7/27/05 8/31/05 9/27/05 10/19/05 11/22/05 12/27/05 1/26/06 2/14/06 3/20/06 4/13/06 5/4/06
1 P - - 0.57 - - - - - - - - -
TSS - - - - - - - - - - - -
2 P - - 3.045 - - 1.98 1.93 - - - - -
TSS - - - - - - - - - - - -
3 P - - 1.08 - - - 3.90 - - - - -
TSS - - - - - - - - - - - -
4 P - - 0.50 - - - 2.95 - - - - -
TSS - - - - - - - - - - - -
5 P - 0.002 0.64 - - - - - 0.49 - - -
TSS - - - - - - - - - - - -
6 P - - 0.69 0.22 0.7 - - - - - - -
TSS - - - - - - - - - - - -
7 P - 0.01 1.41 - - - - - 0.55 - - -
TSS - - - - - - - - - - - -
8 P - - 3.53 - - - - - - - - -
TSS - - - - - - - - - - - -
9 P - - 0.69 - - - - - - - - 0.006
TSS - - - - - - - - - - - -
10 P - - 1.76 - - - - - - - - -
TSS - - - - - - - - - - - -
11 P - - 0.16 - - - - 1.20 - - 0.34 -
TSS - - - - - - - - - - - -
12 P - 0.005 2.14 - - - - - - - - -
TSS - - 2.26 - - - - - - - - - All twelve sampling sites exceeded the 0.3 mg/L target for phosphorus during the June and August 2005 sampling events. Based on the maximum phosphorus loads calculated at each site, the estimated reductions necessary to meet the 0.3 mg/L target ranged from 0.5 tons/year to 3.9 tons/year. While only one site exceeded the 80 mg/L target for TSS during the sampling period, these results are just snapshots and do not accurately reflect the conditions in the watershed. Windshield survey results and visual observations indicate that sedimentation is a valid concern in the watershed. Based on conservation planning efforts in the watershed, it’s estimated that there are approximately 300 acres of overgrazed pastures and hayland with erosion rates of 1.5 times the tolerable soil loss (T) and approximately 250 acres of cropland with low residue levels after planting with erosion rates from T to 3T, depending on the

topography and soil type. Based on this information and RUSLE calculations conducted as part of conservation planning, the group set a sediment reduction target of 2500 tons for the watershed. Section Eight: Choosing Measures to Apply The following section will discuss management practices and how they contribute to the overall well being of Indian Creek and its tributaries. An ad hoc technical committee was formed to determine the most important best management practices that will be offered to landowners throughout the watershed. 8.1 Best Management Practices
8.1.1 Goal 1 – Reduce level of E.coli in stream to state standard of 235 colonies or below by implementing the following BMP’s
8.1.1a Roof Run-Off Structures These systems prevent roof runoff water from flowing across concentrated waste areas and barnyards to reduce pollution from livestock, improve water quality, and protect the waterbodies.
8.1.1b Livestock exclusion The fencing of livestock at least 30 feet from waterbodies will reduce loafing areas in and around streambeds. This reduction in access may lead to lower levels of nutrients and E.Coli.
8.1.1c Alternative Watering Systems
Water will be conveyed from a source of supply to points of use other than waterbodies.
8.1.1d Waste Management Storage and application of animal waste according to an approved NRCS Nutrient Management Plan.
8.1.2 Goal 2 Decrease level of sedimentation loading by 2,500 tons by the year 2013
8.1.2a Conservation tillage By increasing conservation tillage throughout the watershed, residue amounts will increase to a significant level to reduce sediment load into nearby waterbodies.
8.1.2b Fencing of livestock (exclusion/rotational grazing) and prescribed grazing Fencing out livestock will have an impact on streambank erosion by reducing trampling of banks. In addition, interior fencing will allow better management of pastures preventing overgrazing which, in turn, will lead to a reduction in sediment loading.
8.1.2c Filter strips and riparian buffers Nutrients and sediments will be filtered by establishing or widening stream buffers.
8.1.2d Establishment/Renovation of hay/pasture Conversion of cropland to hayland and the renovation of existing grasslands will aid in infiltration and decrease sedimentation.
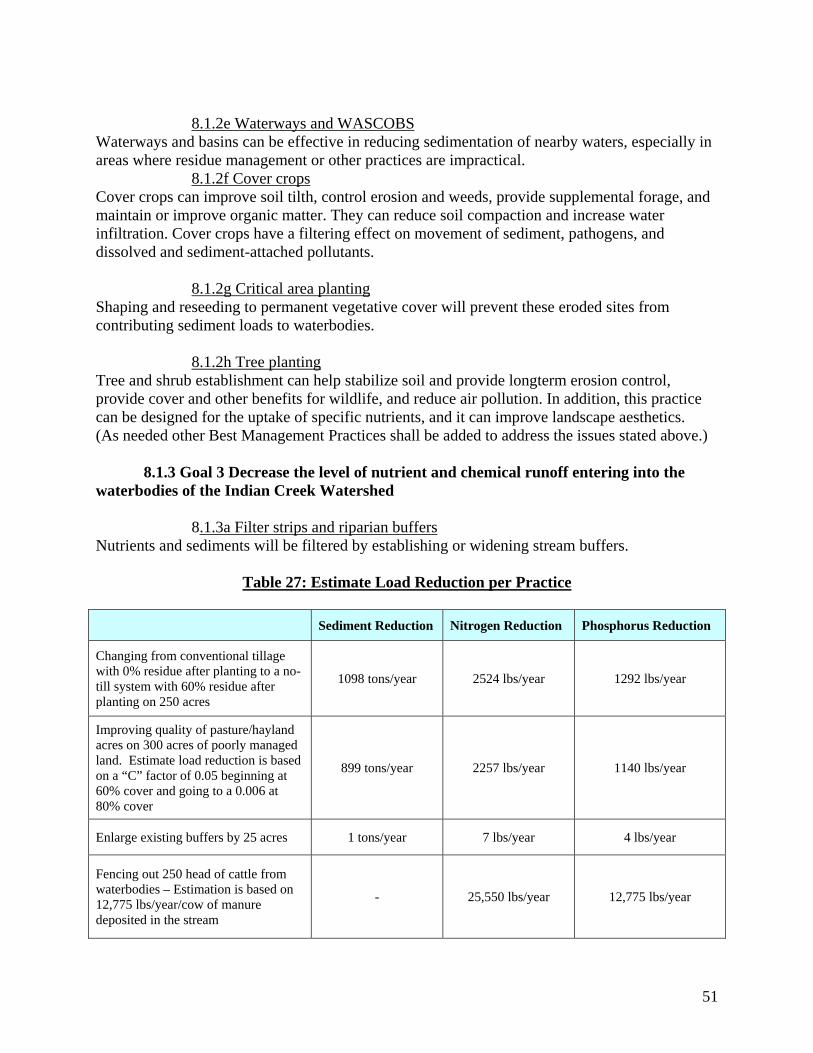
51
8.1.2e Waterways and WASCOBS
Waterways and basins can be effective in reducing sedimentation of nearby waters, especially in areas where residue management or other practices are impractical.
8.1.2f Cover crops Cover crops can improve soil tilth, control erosion and weeds, provide supplemental forage, and maintain or improve organic matter. They can reduce soil compaction and increase water infiltration. Cover crops have a filtering effect on movement of sediment, pathogens, and dissolved and sediment-attached pollutants.
8.1.2g Critical area planting Shaping and reseeding to permanent vegetative cover will prevent these eroded sites from contributing sediment loads to waterbodies.
8.1.2h Tree planting Tree and shrub establishment can help stabilize soil and provide longterm erosion control, provide cover and other benefits for wildlife, and reduce air pollution. In addition, this practice can be designed for the uptake of specific nutrients, and it can improve landscape aesthetics. (As needed other Best Management Practices shall be added to address the issues stated above.)
8.1.3 Goal 3 Decrease the level of nutrient and chemical runoff entering into the
waterbodies of the Indian Creek Watershed 8.1.3a Filter strips and riparian buffers Nutrients and sediments will be filtered by establishing or widening stream buffers.
Table 27: Estimate Load Reduction per Practice
Sediment Reduction Nitrogen Reduction Phosphorus Reduction
Changing from conventional tillage with 0% residue after planting to a no-till system with 60% residue after planting on 250 acres
1098 tons/year 2524 lbs/year 1292 lbs/year
Improving quality of pasture/hayland acres on 300 acres of poorly managed land. Estimate load reduction is based on a “C” factor of 0.05 beginning at 60% cover and going to a 0.006 at 80% cover
899 tons/year 2257 lbs/year 1140 lbs/year
Enlarge existing buffers by 25 acres 1 tons/year 7 lbs/year 4 lbs/year
Fencing out 250 head of cattle from waterbodies – Estimation is based on 12,775 lbs/year/cow of manure deposited in the stream
- 25,550 lbs/year 12,775 lbs/year
52
8.2 Educational Techniques The group will use the following techniques to enhance public understanding of best management practices and encourage participation in implementing the chosen measures. These outreach efforts, with the exception of literature, will be used as forums for citizens to express their concerns for watershed issues. All issues discussed during outreach efforts will be taken back to the Steering Committee for further discussion and development of action items.
8.2.1 Field Days/Workshops The committee will hold annual field days and workshops including pond clinics, conservation field days, creek clean-ups, septic system workshops and more to help the public understand important issues going on in the watershed and best management practices that can assist with these issues. These field days/workshops will provide essential information from local experts and offer valuable literature for participants to take home. Field days/workshops are announced in newspapers, newsletters, public service announcements, and through personal contact.
8.2.2 Literature
The group will generate and distribute an array of publications about the watershed to spark interest in citizens with diverse backgrounds. These publications will be free to the public and made available during field days/workshops, fairs, meetings, or through personal mailings.
8.2.3 Presentations
The watershed coordinator will attend public meetings for many local organizations to discuss the watershed project and how it can assist in helping local communities. Presentations will free and can be catered to the different needs of each organization.
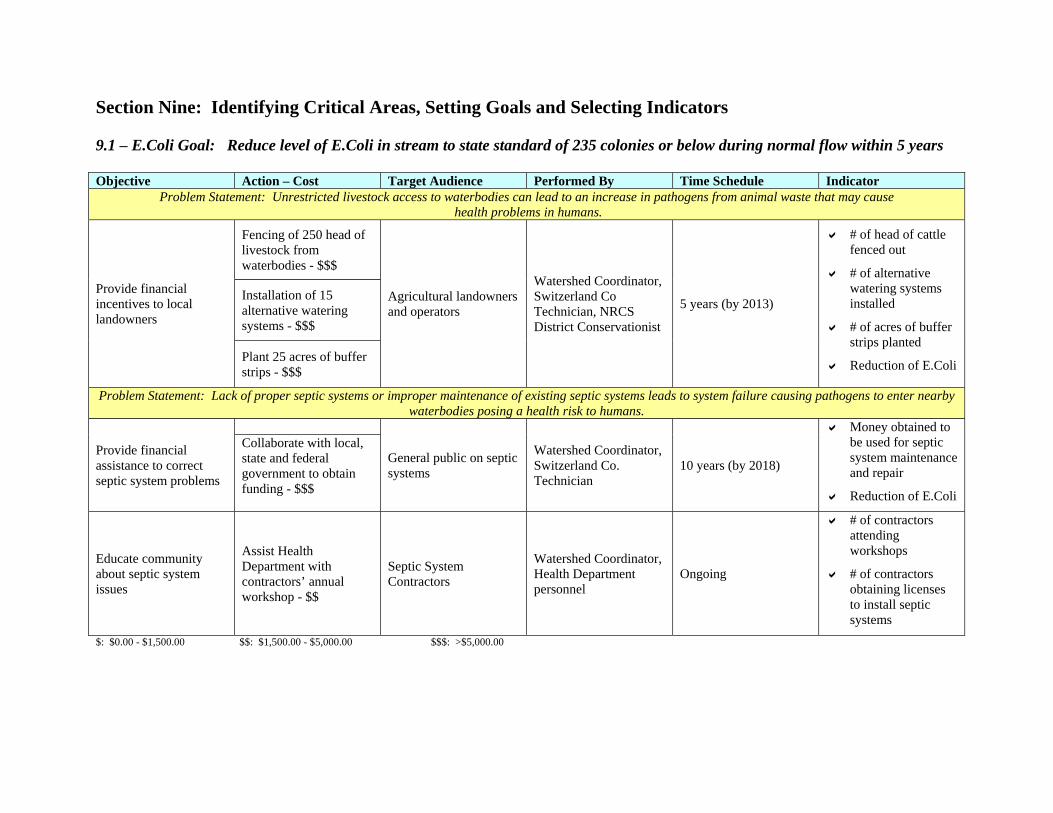
Section Nine: Identifying Critical Areas, Setting Goals and Selecting Indicators 9.1 – E.Coli Goal: Reduce level of E.Coli in stream to state standard of 235 colonies or below during normal flow within 5 years Objective Action – Cost Target Audience Performed By Time Schedule Indicator
Problem Statement: Unrestricted livestock access to waterbodies can lead to an increase in pathogens from animal waste that may cause health problems in humans.
Provide financial incentives to local landowners
Fencing of 250 head of livestock from waterbodies - $$$
Agricultural landowners and operators
Watershed Coordinator, Switzerland Co Technician, NRCS District Conservationist
5 years (by 2013)
# of head of cattle fenced out
# of alternative watering systems installed
# of acres of buffer strips planted
Reduction of E.Coli
Installation of 15 alternative watering systems - $$$
Plant 25 acres of buffer strips - $$$
Problem Statement: Lack of proper septic systems or improper maintenance of existing septic systems leads to system failure causing pathogens to enter nearby waterbodies posing a health risk to humans.
Provide financial assistance to correct septic system problems
General public on septic systems
Watershed Coordinator, Switzerland Co. Technician
10 years (by 2018)
Money obtained to be used for septic system maintenance and repair
Reduction of E.Coli
Collaborate with local, state and federal government to obtain funding - $$$
Educate community about septic system issues
Assist Health Department with contractors’ annual workshop - $$
Septic System Contractors
Watershed Coordinator, Health Department personnel
Ongoing
# of contractors attending workshops
# of contractors obtaining licenses to install septic systems
$: $0.00 - $1,500.00 $$: $1,500.00 - $5,000.00 $$$: >$5,000.00

54
9.2 – Sedimentation Goal: Decrease level of sedimentation loading by 2,500 tons by the year 2013 Objective Action – Cost Target Audience Performed By Time Schedule Indicator
Problem Statement: Farmland within watershed not using conservation tillage may lead to an increase in erosion causing sedimentation in waterbodies
Provide financial incentives to local landowners
Reseed 300 acres of overgrazed pasture within the watershed - $$$
Agricultural landowners and operators
Watershed Coordinator, Switzerland Co Technician, NRCS District Conservationist
5 years (by 2013)
Acres of pasture reseeded
Acres of conventional tillage converted to conservation tillage
Acres enrolled in CP33 program
Acres enrolled in classified forest program
# of heavy use protection areas installed
# of times equipment is rented
Reduction in sediment
Enlist 250 acres within watershed into no-till farming - $$$ Plant 10 acres in CP33 program - $$$ Enlist 100 acres into Certified Forests and Wildlife Habitat programs - $$$ Install heavy use protection areas around watering systems - $$$
Utilize conservation equipment rentals available through Switzerland County SWCD office - $
Educate landowners about the effects of sedimentation on local waterbodies
Co-sponsor annual No-Till breakfast with SWCD - $$
General Public Watershed Coordinator Ongoing
# of people attending field days
# of articles submitted
# of people viewing displays
Positive change in attitude about conservation tillage
Utilize SWCD website to promote conservation efforts and field days - $ Submit articles to local newspapers - $ Use annual meetings/ field days/county fair to display the savings that can be attained for proper conservation no-till practices - $

55
Problem Statement: Insufficient erosion control practices used by contractors on construction sites can lead to excess soil loss entering nearby waterbodies
Provide financial assistance to contractors/developers
Straw blankets - $$$
Contractors and Developers
Watershed Coordinator, Switzerland County Technician, IDEM Rule 5 personnel
5 years (by 2013)
Feet of straw blankets installed
Acres of seeding
Reduction of sediment
Seeding - $$$
Educate urban community about effects of sedimentation from construction sites
Hold urban workshops - $$
Contractors, Developers, and General Public
Watershed Coordinator, Switzerland County Technician, IDEM Rule 5 personnel
Ongoing
# of people attending workshops
# of brochures distributed
Positive change in attitude about erosion control practices
Post information on Switzerland Co SWCD website - $
Develop brochures to be distributed throughout watershed - $
Provide technical assistance to county officials
Partner with Health Department , Planning and Zoning, and Rule 5 personnel to enforce erosion control measures - $
Contractors and Developers
Watershed Coordinator, Switzerland Co. Technician, Health Department, Planning and Zoning Department
Ongoing
Enforcement of erosion control practices
Increase in erosion control practice use
Problem Statement: Unrestricted livestock access to the creek can lead to trampling of streambanks as livestock enter creek
Provide financial incentives to local landowners
Fencing of 250 head of livestock from waterbodies - $$$
Agricultural landowners and operators
Watershed Coordinator, Switzerland Co Technician, NRCS District Conservationist
5 years (by 2013)
# of head of cattle fenced out
# of alternative watering systems installed
# of acres of buffer strips planted
Reduction of sediment
Installation of 15 alternative watering systems - $$$
Plant 25 acres of buffer strips - $$$
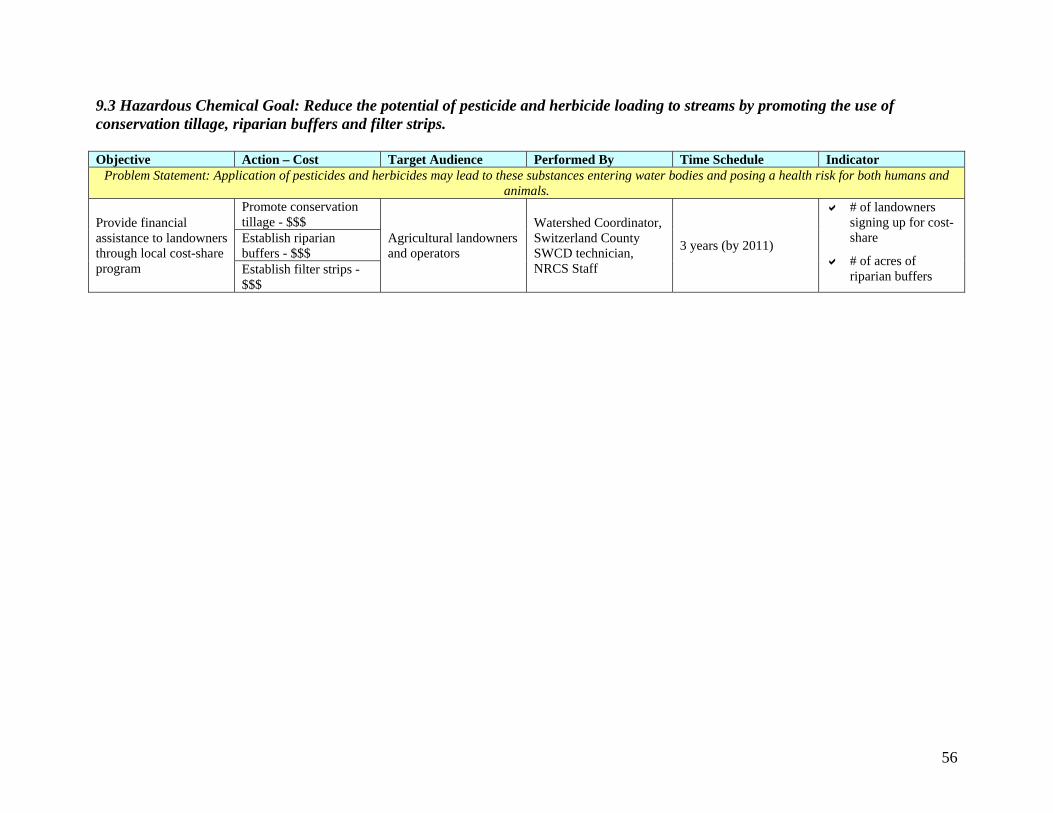
56
9.3 Hazardous Chemical Goal: Reduce the potential of pesticide and herbicide loading to streams by promoting the use of conservation tillage, riparian buffers and filter strips. Objective Action – Cost Target Audience Performed By Time Schedule Indicator
Problem Statement: Application of pesticides and herbicides may lead to these substances entering water bodies and posing a health risk for both humans and animals.
Provide financial assistance to landowners through local cost-share program
Promote conservation tillage - $$$
Agricultural landowners and operators
Watershed Coordinator, Switzerland County SWCD technician, NRCS Staff
3 years (by 2011)
# of landowners signing up for cost-share
# of acres of riparian buffers
Establish riparian buffers - $$$ Establish filter strips - $$$

57
9.4 Nutrient Goal – Decrease level of Phosphorus in stream to the 0.3 mg/L Target. Reduce Phosphorus loading by 15,000 pounds by 2013. Objective Action – Cost Target Audience Performed By Time Schedule Indicator
Problem Statement: Farmland within subwatersheds 010, 040 and 050 with improper nutrient management can lead to excess nutrients in waterbodies which may lead to eutrophication.
Offer financial assistance to landowners through local cost-share program
Implement rotational grazing systems - $$$
Agricultural landowners and operators
Watershed Coordinator, Switzerland County SWCD technician, NRCS staff
3 years (by 2011) # of landowners signing up for cost share # of acres of riparian buffers Increase in conservation tillage # of acres of tree establishment # of feet of interior fencing installed
Establish riparian buffers - $$$ Promote conservation tillage - $$$
Install heavy use protection areas - $$$
Tree establishment - $$$
Establishment of filter strips

58
9.5 Illegal Dumping Goal – Reduce the amount of roadside garbage in watershed by 80 cubic yards per year Objective Action – Cost Target Audience Performed By Time Schedule Indicator
Problem Statement: Improper disposal/dumping of garbage along road and creeks within watershed causes unattractive views and poses health risks to both humans, animals and aquatic life.
Educate community about effects of littering
Partner with community organizations to hold spring and fall clean-up - $$
General Public Watershed Coordinator, Civic Organizations
Ongoing
# of people participating in clean-up days
# of cubic yards of trash cleaned up
# of roads adopted
Positive change in attitude of not littering
Coordinate an “Adopt-A-Road program - $
Provide financial assistance to landowners
Collaborate with local recycling center to help pay for appliance recycling - $$$
General Public Watershed Coordinator, Switzerland/Ohio Co. Recycling Center
Ongoing
Money received
Increase in recycled appliances
Problem Statement: The lack of proper disposal methods, disposal containers, and drop off sites for garbage may lead to improper disposal/dumping along roads and creeks within the watershed area.
Provide additional “drop-off” spots for watershed residents
Work with Switzerland/Ohio Co Recycling Center to install roll-off bins - $$$
General Public Watershed Coordinator, Switzerland/Ohio Co. Recycling Center
Ongoing # of roll-off bins
installed

59
9.6 Recreation Goal – Increase the number of Public Access Points on Indian Creek by 2018. Objective Action – Cost Target Audience Performed By Time Schedule Indicator
Problem Statement: The lack of public access along Indian Creek and other areas within the watershed severely limits the recreational opportunities available
Collaborate with local and state organizations to introduce new access points on Indian Creek
Work with organizations to pinpoint where access points should be placed - $ General Public
Watershed Coordinator, IDNR, local environmental organizations
10 years (by 2018)
# of public access points installed
# of people using public access points
# of organizations involved in process
Design and construct access points throughout the watershed. - $$$

60
Section Ten – Future Plans This section describes the planned order of implementation, the time requirements for implementing the plan, who is responsible for carrying out tasks, and what milestones the committee will be checking.
Table 28: Future Plans
Task Time Required
Person Responsible Milestones Financial Assistance
1. Develop and submit 319 Implementation Grant
2 months Watershed Coordinator
Receiving implementation grant
Switzerland County SWCD
2. Develop Indian Creek Watershed Cost-share Program highlighting BMPs introduced in this plan
1 month Indian Creek Technical Committee Watershed Coordinator
Developing cost-share program that addresses resource concerns outlined in plan
Switzerland County SWCD 319 Grant
3. Implement cost-share program
On-going Switzerland County SWCD technician Watershed Coordinator
Number of landowners applying for cost-share
Number of conservation
practices installed within the watershed community
Nitrogen, Phosphorus and
Sediment saved from entering Indian Creek
Need for additional
funding
319 Grant EQIP WHIP LARE Switzerland County SWCD
4. Develop and Implement Education Program
On-going Indian Creek Education Committee Watershed Coordinator
Increased participation during events
Distribution of
publications
319 Grant Switzerland County SWCD Local Grants Individual Donations
5. Reapply, as needed, for additional funding for education and cost-share programs
On-going Watershed Coordinator
Receiving additional funding
319 Grants Switzerland County SWCD Local Grants Individual Donations

61
Section Eleven – Monitoring Indicators 11.1 Social Indicators Social indicators are measures that describe the context, capacity, skills, knowledge, values, beliefs, and behaviors of individuals, households, organizations, and communities at various geographic scales22. Social indicators are typically used to assess current conditions or attainment of social goals related to human health, housing, education levels, recreational opportunities, social equity issues and the like. For our purposes, they will most often be used to measure intermediate outcomes that we anticipate will lead to the goal of improved water quality. Intermediate social outcomes reflect a set of NPS program activities that influence social change, such efforts that emphasize building awareness, supporting watershed organizations, and building local capacity for planning and problem solving. Social Indicators will be used to monitor:
increased knowledge of watershed issues; increased concern of watershed issues; increased knowledge of conservation practice importance Changed attitudes of taking action to improve water quality
11.2 Environmental Indicators Environmental indicators are measurements of water quality, habitat or some other criterion that tells you something about the health of the environment23. Indicators may include levels of a contaminant found in water, species population, or mercury content in fish tissue. Although these indicators require more time than social or administrative indicators, the are often more accurate and better for evaluating progress of watershed actions. Environmental Indicators will be used to monitor:
reduction of sediment entering waterbodies by installing conservation practices; reduction of E. Coli entering waterbodies by installing conservation practices; reduction of phosphorus and nitrogen entering waterbodies by installing conservation
practices; change in pollutant concentrations in waterbodies; change in macroinvertebrate diversity
11.3 Administrative Indicators Administrative Indicators are measurements in which the committee can easily quantify. They may include number of people attending a function, feet of fence installed along a stream, number of acres converted to a no-till system, and so on. These indicators are useful when reporting increased participation in programs, but are often indirect indicators of more useful information, such as a decrease in nutrient loading.
22 Great Lakes Regional Water Program “Developing a Social Component for the NPS Evaluation Framework”, July 27, 2006. http://www.uwex.edu/ces/regionalwaterquality/Flagships/Indicators.htm. (December 11, 2006). 23 Indiana Department of Environmental Management. “Indiana Watershed Planning Guide” August 2003.

62
Administrative Indicators will be used to track: attendance at education field days; distribution of publications; news article submitted to newspaper and newsletters; number of conservation practices installed; and volunteer recruitment numbers
11.4 Monitoring Plan The Watershed Coordinator will develop a database to track social and administrative indicators. This database will be updated after each event or survey. The information will be compiled at the end of each calendar year and reviewed by the steering committee to make sure the group is having a positive effect within the watershed. In addition to the social and administrative indicator database, a separate database will be compiled with environmental indicators. This database will updated after best management practices are applied within each subwatershed. It will be reviewed every six months to ensure best management practices are being installed in critical subwatersheds.

Section Twelve – Evaluating and Adapting Plan A master copy of the current watershed plan will be located at the Historic Hoosier Hills RC&D office located in Versailles, Indiana. In addition, the plan will be distributed to these locations:
Switzerland County SWCD Office 104 East Pike
Vevay, IN 47043
Switzerland Public Library 205 Ferry Street Vevay, IN 47043
Switzerland County High School
Bonnie Fancher 1020 West Main Street
Vevay, IN 47043 The Indian Creek Water Management Plan will be evaluated at the end of each calendar year during a quarterly steering committee meeting. Each member of the committee will receive a copy of the plan in which they will be encouraged to evaluate with the current focus of the group. Members will be asked to bring revisions to the quarterly meeting where each revision will be discussed and voted upon. If any revisions are necessary, the coordinator will be responsible for making changes to the management plan and distributing change to individuals and organizations who received original copies of the plan. For future reference, all management plan records and documents will be kept at the Historic Hoosier Hills RC&D office. If you would like additional information about the Indian Creek Watershed Project or its Management Plan, please contact:
Historic Hoosier Hills RC&D 1981 South Industrial Park Road
PO Box 407 Versailles, IN 47042
Phone: 812-689-6410 ext 5 Fax: 812-689-3141
Website: www.hhhills.org

64
Test Sites: Test site 1: Long Run Road Subwatershed 0509020320060
Test site 2: Hall’s Branch at Highway 129 Subwatershed 05090203200060
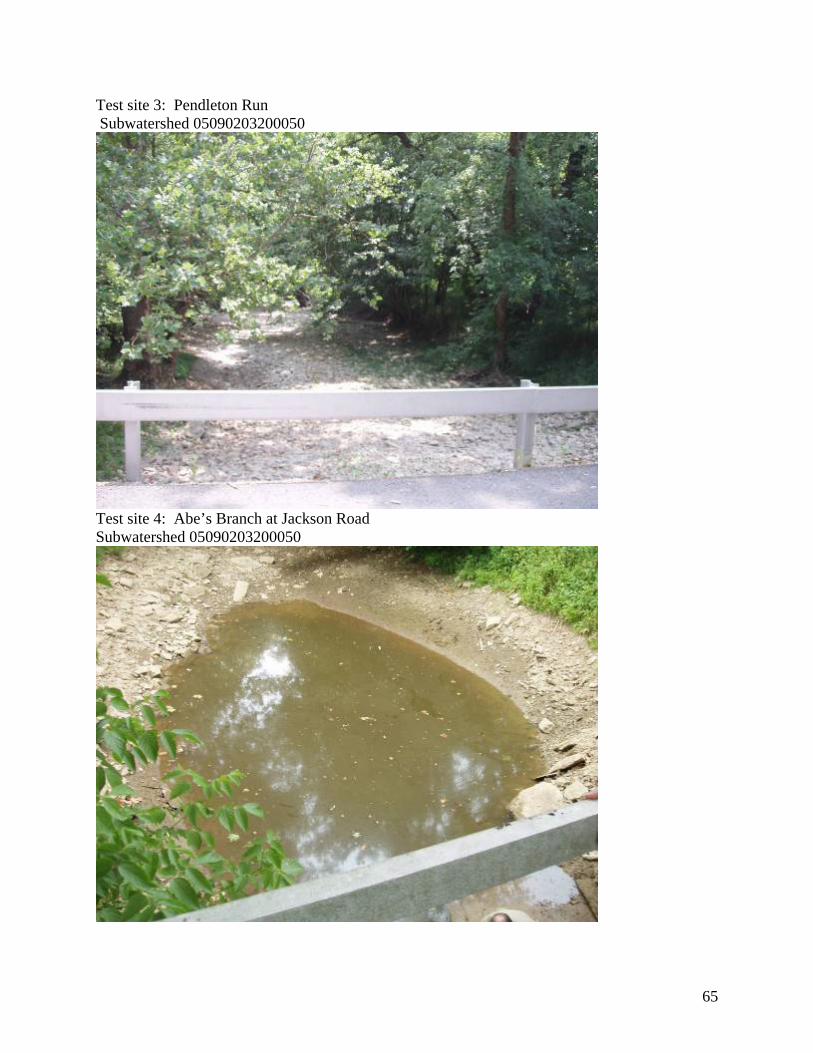
65
Test site 3: Pendleton Run Subwatershed 05090203200050
Test site 4: Abe’s Branch at Jackson Road Subwatershed 05090203200050

66
Test site 5: Upper Indian Creek at Culbertson Road Subwatershed 05090203200040
Test site 6: Tumblebug at Smith’s Ridge Road Subwatershed 05090203200030

67
Test site 7: West Fork Indian Creek Bennington Pike Subwatershed 05090203200020
Test site 8: West Fork Indian Creek at Kelly Road Subwatershed 05090203200020
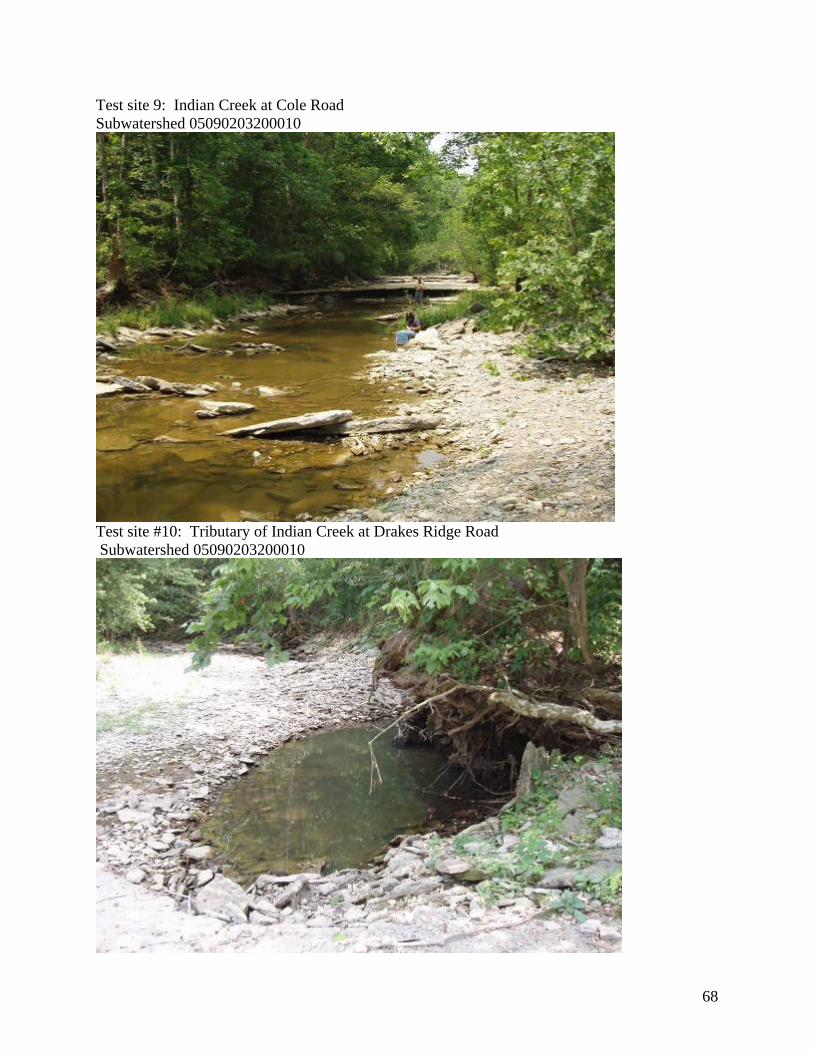
68
Test site 9: Indian Creek at Cole Road Subwatershed 05090203200010
Test site #10: Tributary of Indian Creek at Drakes Ridge Road Subwatershed 05090203200010

69
Test site #11: Tributary of Upper Indian Creek at Fairview Road Subwatershed 05090203200040
Test site #12: Upper Indian Creek at Fairview Road (Bridge) Subwatershed 05090203200040

70
RAINFALL TOTALS FOR TESTING DATES – One Week Prior to Testing June 27th - .15 inches Testing date June 28th – .01 inches – 90 degrees Total: .16 inches July 22 - .25 inches July 23 - .01 inches Testing date July 27th - .01 inches – 84 degrees Total: .27 inches August 26 - .41 inches August 28 - .01 inches August 29 - .04 inches August 30 – 3.06 inches Testing date August 31st - .43 inches – 82 degrees Total: 3.95 inches September 21 - .01 inches September 22 - .01 inches September 23 - .18 inches September 25 - .10 inches September 26 - .32 inches Testing date September 27th - .01 inches – 78 degrees Total: .63 inches October 13 - .01 inches October 14 - .01 inches October 16 - .01 inches Testing date October 19th - .01 inches – 82 degrees Total: .04 inches November 16 - .01 inches Testing date November 22nd – 0 inches – 42 degrees Total: .01 inches December 25 - .32 inches December 26 - .01 inches Testing date December 27th – 0 inches – 55 degrees Total: .33 inches January 21 - .01 inches January 22 - .56 inches January 23 - .29 inches January 24 - .02 inches Testing date January 26th – 0 inches – 43 degrees
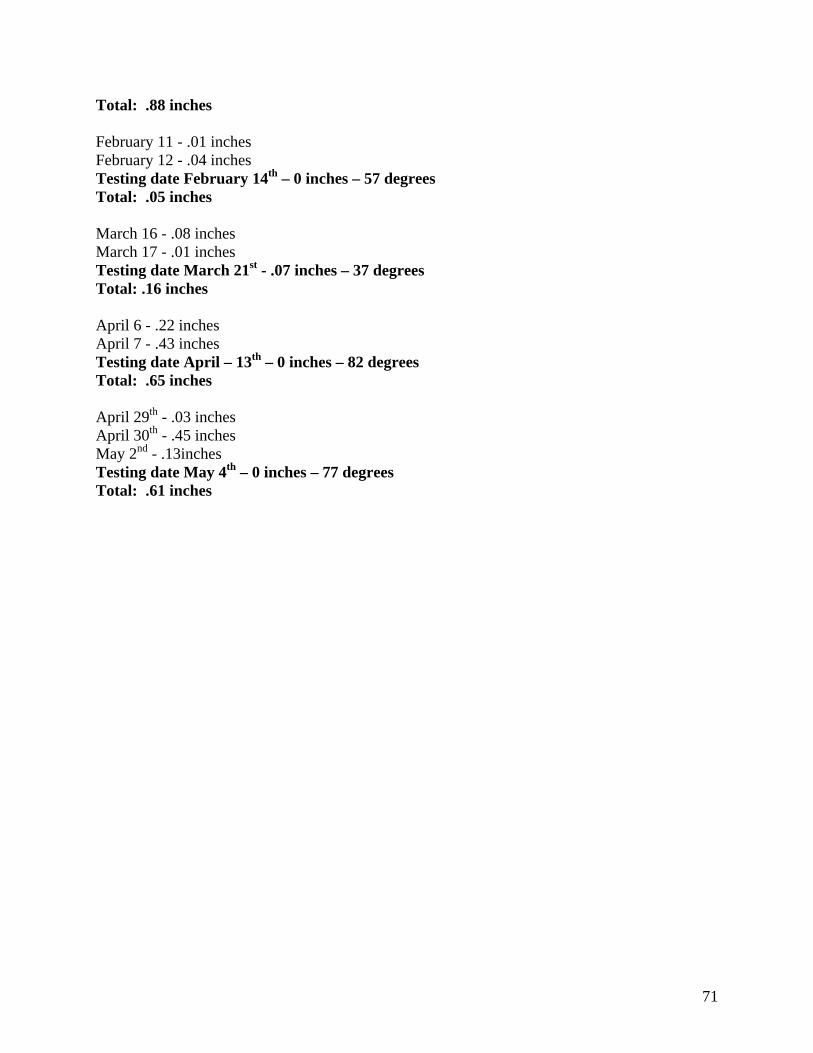
71
Total: .88 inches February 11 - .01 inches February 12 - .04 inches Testing date February 14th – 0 inches – 57 degrees Total: .05 inches March 16 - .08 inches March 17 - .01 inches Testing date March 21st - .07 inches – 37 degrees Total: .16 inches April 6 - .22 inches April 7 - .43 inches Testing date April – 13th – 0 inches – 82 degrees Total: .65 inches April 29th - .03 inches April 30th - .45 inches May 2nd - .13inches Testing date May 4th – 0 inches – 77 degrees Total: .61 inches
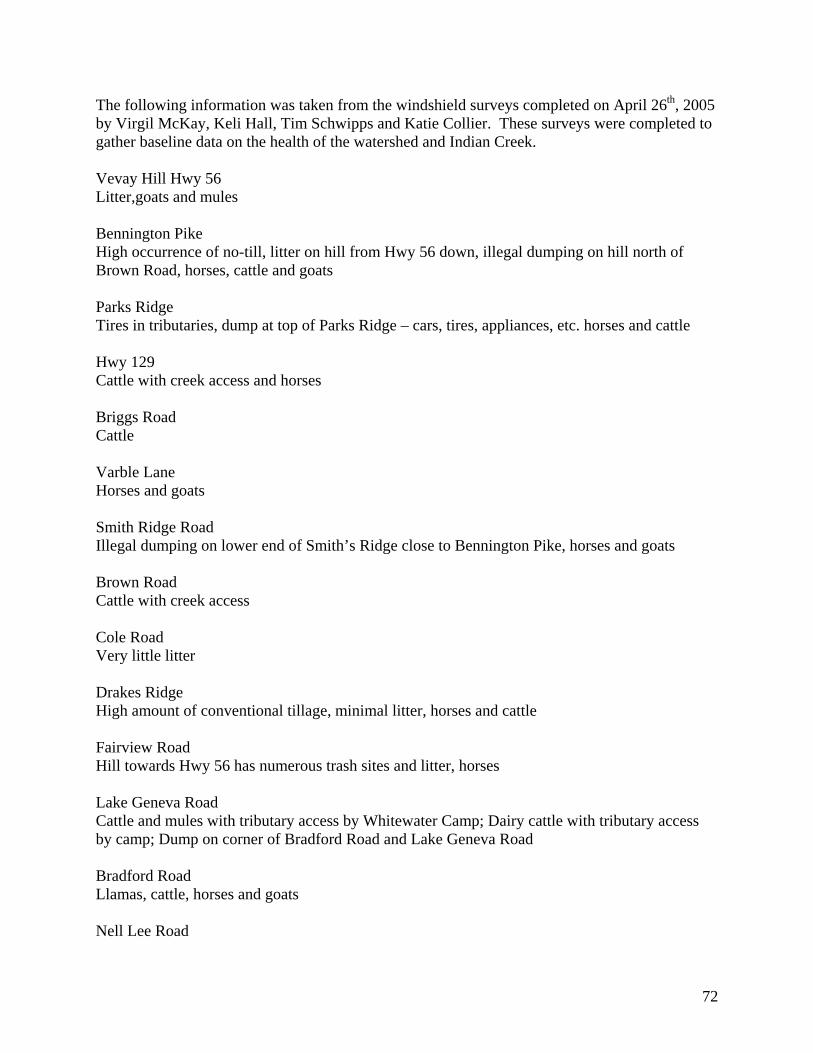
72
The following information was taken from the windshield surveys completed on April 26th, 2005 by Virgil McKay, Keli Hall, Tim Schwipps and Katie Collier. These surveys were completed to gather baseline data on the health of the watershed and Indian Creek. Vevay Hill Hwy 56 Litter,goats and mules Bennington Pike High occurrence of no-till, litter on hill from Hwy 56 down, illegal dumping on hill north of Brown Road, horses, cattle and goats Parks Ridge Tires in tributaries, dump at top of Parks Ridge – cars, tires, appliances, etc. horses and cattle Hwy 129 Cattle with creek access and horses Briggs Road Cattle Varble Lane Horses and goats Smith Ridge Road Illegal dumping on lower end of Smith’s Ridge close to Bennington Pike, horses and goats Brown Road Cattle with creek access Cole Road Very little litter Drakes Ridge High amount of conventional tillage, minimal litter, horses and cattle Fairview Road Hill towards Hwy 56 has numerous trash sites and litter, horses Lake Geneva Road Cattle and mules with tributary access by Whitewater Camp; Dairy cattle with tributary access by camp; Dump on corner of Bradford Road and Lake Geneva Road Bradford Road Llamas, cattle, horses and goats Nell Lee Road
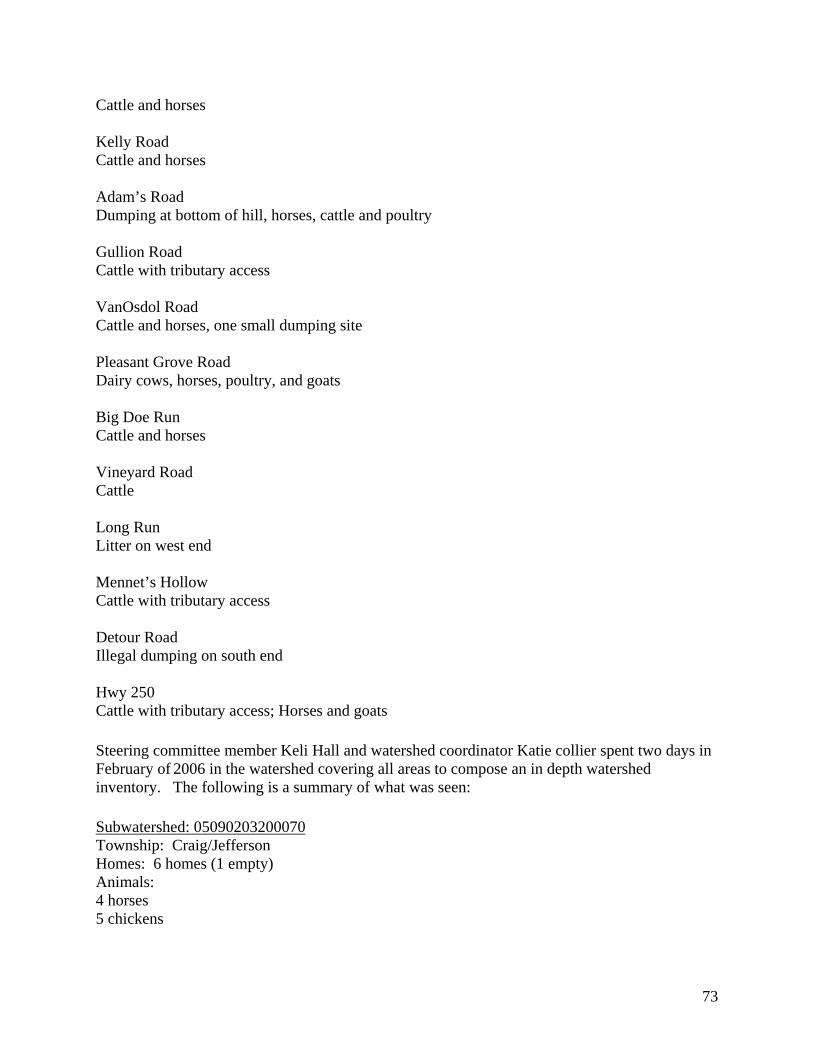
73
Cattle and horses Kelly Road Cattle and horses Adam’s Road Dumping at bottom of hill, horses, cattle and poultry Gullion Road Cattle with tributary access VanOsdol Road Cattle and horses, one small dumping site Pleasant Grove Road Dairy cows, horses, poultry, and goats Big Doe Run Cattle and horses Vineyard Road Cattle Long Run Litter on west end Mennet’s Hollow Cattle with tributary access Detour Road Illegal dumping on south end Hwy 250 Cattle with tributary access; Horses and goats Steering committee member Keli Hall and watershed coordinator Katie collier spent two days in February of 2006 in the watershed covering all areas to compose an in depth watershed inventory. The following is a summary of what was seen: Subwatershed: 05090203200070 Township: Craig/Jefferson Homes: 6 homes (1 empty) Animals: 4 horses 5 chickens

74
Subwatershed: 05090203200060 2 test sites Township: Craig Homes: 100 homes (2 new construction, 14 are hunting/weekend homes and 14 are empty) Animals: 25 goats 30 chickens 60 cattle 16 horses 5 guineas Subwatershed: 05090203200050 2 test sites Township: Craig/Jefferson Homes: 147 (3 are alternative lifestyles without septic systems, 2 are empty, 4 are campers) Animals: 38 horses 44 chickens 3 peacocks 160 cattle 10 donkeys 5 Guineas 5 goats Subwatershed: 05090203200030 1 test site Township: Craig/Pleasant Homes: 42 homes (1 is a hunting cabin, 3 campers) Animals: 150 cattle 30 goats 1 donkey 4 horses Subwatershed: 05090203200020 2 test sites Township: Pleasant Homes: 165 (14 are alternative lifestyle without septic systems, 2 are empty and 2 are campers) Animals: 367 cattle 50 horses 12 goats 1 donkey 3 ponies 4 chickens

75
Subwatershed: 05090203200010 2 test sites Township: Pleasant Homes: 91 (3 are alternative lifestyles without septic systems) Animals: 41 horses 150 cattle 8 sheep Goats, geese and chickens Camp Livingston Subwatershed: 05090203200040 3 test sites Township: Cotton/Jefferson Homes: 131 (2 are alternative lifestyles without septic systems, 30+ are cabins/trailers on Lake Geneva) Animals: 2 ponies 23 horses 10 miniature goats 25 goats 4 mules 205 cattle 20 chickens Rabbits 3 geese 2 donkeys

76
Record of Meetings and Activities November 2004 29 – First day for Watershed Coordinator 29 – Hoosier River Watch – water sampling at Ogle Park December 2004 3 – Project WET 8 – ORSANCO presentation at SCHS 9 – Meeting with IDEM 13 – Indian Creek Watershed Steering Committee Meeting 13 – South Laughery Creek Steering Committee Meeting 16 – Introductory article published in Vevay paper January 2005 10-11 – IASWCD Annual Conference Indianapolis, Indiana 12– 4-H fair board presentation 18 – RC&D Conservation Education Committee meeting 18 – Envirothon Committee meeting 18 – ICW Steering Committee meeting 19 – Meeting with Switzerland County Health Department 20 – Meeting with FFA and Community Foundation at SCHS 21 – Meeting with INDOT 25 – SLC meeting February 2005 1 - Switzerland County SWCD Board Meeting 2 – Project WILD meeting 4 – Field Day Meeting 7,8,9 – Teaching Watershed Lesson A.P. Environmental Science Class 8 – Ag. Day Meeting – Coyote Creek Farm 9 – Kiwanis Presentation 10 – Watershed Network Meeting Bedford, Indiana 10 – Hanover River Institute 11 – Field Day Meeting 15 – County Council/County Commissioners Presentation 17 – Agronomy Training at North Vernon 18 – Project WILD – Belterra 22-23 – Ohio River Valley Marketing Seminar – Mason, Ohio March 2005 1 – SLC Creek Sweep Meeting 1 – ICW Steering Committee Meeting 3 – Ripley County Conservation Tillage Breakfast 7 – Watershed Recruitment 8 – SLC Meeting
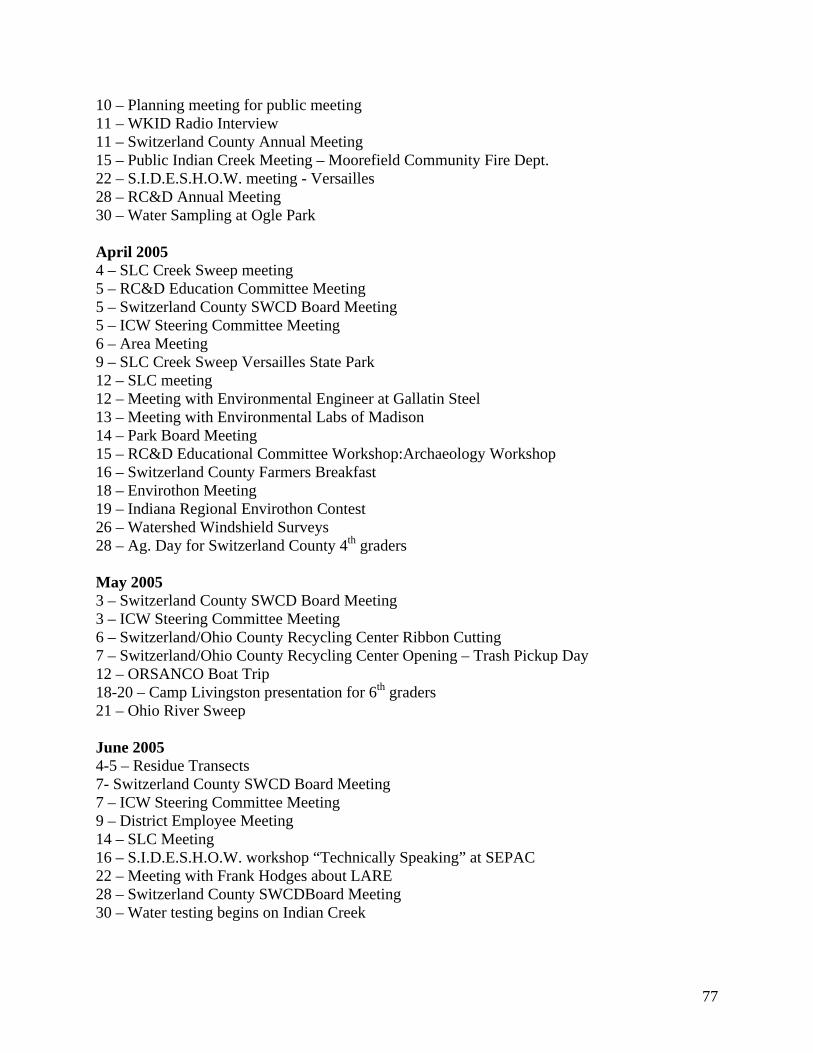
77
10 – Planning meeting for public meeting 11 – WKID Radio Interview 11 – Switzerland County Annual Meeting 15 – Public Indian Creek Meeting – Moorefield Community Fire Dept. 22 – S.I.D.E.S.H.O.W. meeting - Versailles 28 – RC&D Annual Meeting 30 – Water Sampling at Ogle Park April 2005 4 – SLC Creek Sweep meeting 5 – RC&D Education Committee Meeting 5 – Switzerland County SWCD Board Meeting 5 – ICW Steering Committee Meeting 6 – Area Meeting 9 – SLC Creek Sweep Versailles State Park 12 – SLC meeting 12 – Meeting with Environmental Engineer at Gallatin Steel 13 – Meeting with Environmental Labs of Madison 14 – Park Board Meeting 15 – RC&D Educational Committee Workshop:Archaeology Workshop 16 – Switzerland County Farmers Breakfast 18 – Envirothon Meeting 19 – Indiana Regional Envirothon Contest 26 – Watershed Windshield Surveys 28 – Ag. Day for Switzerland County 4th graders May 2005 3 – Switzerland County SWCD Board Meeting 3 – ICW Steering Committee Meeting 6 – Switzerland/Ohio County Recycling Center Ribbon Cutting 7 – Switzerland/Ohio County Recycling Center Opening – Trash Pickup Day 12 – ORSANCO Boat Trip 18-20 – Camp Livingston presentation for 6th graders 21 – Ohio River Sweep June 2005 4-5 – Residue Transects 7- Switzerland County SWCD Board Meeting 7 – ICW Steering Committee Meeting 9 – District Employee Meeting 14 – SLC Meeting 16 – S.I.D.E.S.H.O.W. workshop “Technically Speaking” at SEPAC 22 – Meeting with Frank Hodges about LARE 28 – Switzerland County SWCDBoard Meeting 30 – Water testing begins on Indian Creek
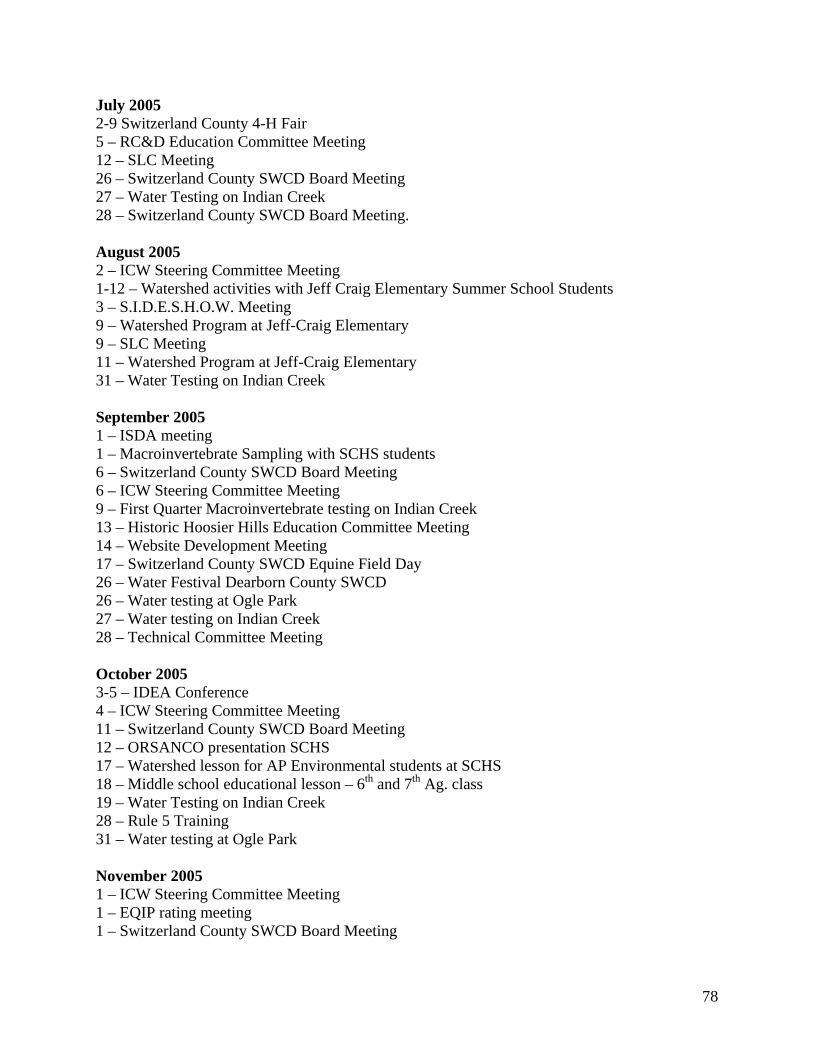
78
July 2005 2-9 Switzerland County 4-H Fair 5 – RC&D Education Committee Meeting 12 – SLC Meeting 26 – Switzerland County SWCD Board Meeting 27 – Water Testing on Indian Creek 28 – Switzerland County SWCD Board Meeting. August 2005 2 – ICW Steering Committee Meeting 1-12 – Watershed activities with Jeff Craig Elementary Summer School Students 3 – S.I.D.E.S.H.O.W. Meeting 9 – Watershed Program at Jeff-Craig Elementary 9 – SLC Meeting 11 – Watershed Program at Jeff-Craig Elementary 31 – Water Testing on Indian Creek September 2005 1 – ISDA meeting 1 – Macroinvertebrate Sampling with SCHS students 6 – Switzerland County SWCD Board Meeting 6 – ICW Steering Committee Meeting 9 – First Quarter Macroinvertebrate testing on Indian Creek 13 – Historic Hoosier Hills Education Committee Meeting 14 – Website Development Meeting 17 – Switzerland County SWCD Equine Field Day 26 – Water Festival Dearborn County SWCD 26 – Water testing at Ogle Park 27 – Water testing on Indian Creek 28 – Technical Committee Meeting October 2005 3-5 – IDEA Conference 4 – ICW Steering Committee Meeting 11 – Switzerland County SWCD Board Meeting 12 – ORSANCO presentation SCHS 17 – Watershed lesson for AP Environmental students at SCHS 18 – Middle school educational lesson – 6th and 7th Ag. class 19 – Water Testing on Indian Creek 28 – Rule 5 Training 31 – Water testing at Ogle Park November 2005 1 – ICW Steering Committee Meeting 1 – EQIP rating meeting 1 – Switzerland County SWCD Board Meeting
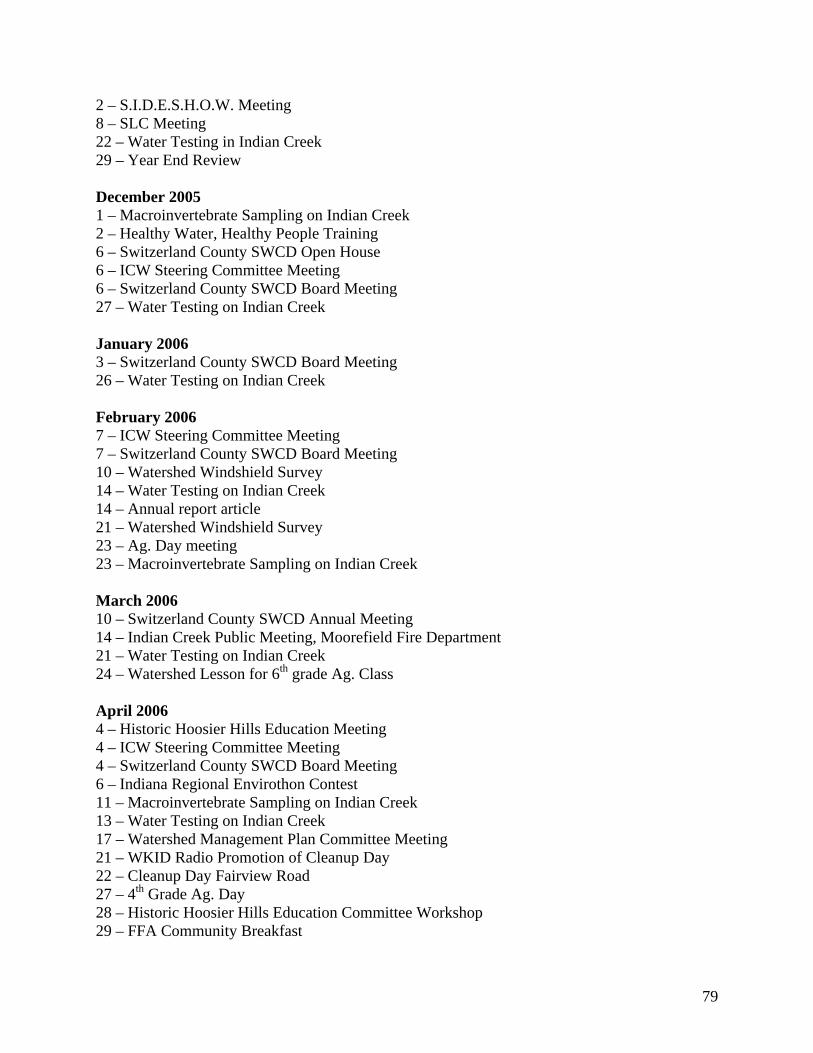
79
2 – S.I.D.E.S.H.O.W. Meeting 8 – SLC Meeting 22 – Water Testing in Indian Creek 29 – Year End Review December 2005 1 – Macroinvertebrate Sampling on Indian Creek 2 – Healthy Water, Healthy People Training 6 – Switzerland County SWCD Open House 6 – ICW Steering Committee Meeting 6 – Switzerland County SWCD Board Meeting 27 – Water Testing on Indian Creek January 2006 3 – Switzerland County SWCD Board Meeting 26 – Water Testing on Indian Creek February 2006 7 – ICW Steering Committee Meeting 7 – Switzerland County SWCD Board Meeting 10 – Watershed Windshield Survey 14 – Water Testing on Indian Creek 14 – Annual report article 21 – Watershed Windshield Survey 23 – Ag. Day meeting 23 – Macroinvertebrate Sampling on Indian Creek March 2006 10 – Switzerland County SWCD Annual Meeting 14 – Indian Creek Public Meeting, Moorefield Fire Department 21 – Water Testing on Indian Creek 24 – Watershed Lesson for 6th grade Ag. Class April 2006 4 – Historic Hoosier Hills Education Meeting 4 – ICW Steering Committee Meeting 4 – Switzerland County SWCD Board Meeting 6 – Indiana Regional Envirothon Contest 11 – Macroinvertebrate Sampling on Indian Creek 13 – Water Testing on Indian Creek 17 – Watershed Management Plan Committee Meeting 21 – WKID Radio Promotion of Cleanup Day 22 – Cleanup Day Fairview Road 27 – 4th Grade Ag. Day 28 – Historic Hoosier Hills Education Committee Workshop 29 – FFA Community Breakfast

80
May 2006 4 – Water Testing on Indian Creek 9 – Historic Hoosier Hills Education Committee Meeting 9 – ICW Steering Committee Meeting 9 – Switzerland County SWCD Board Meeting 20 – River Watch Training 23 – SCES Kindergarten Presentation June 2006 5 – Technical Committee Meeting 6 – Steering Committee Meeting 6 – Switzerland County SWCD Board Meeting 13 – Historic Hoosier Hills Education Committee Meeting 14-15 – Residue Transects 16 – WKID Promotion of the Ohio River Sweep 17 – River Sweep 23 – 319 Grant Proposal Meeting 26-29 – Watershed Activities - Regional Boy Scout Camp at Ripley County Fairgrounds July 2006 2 – 8 Switzerland County 4-H Fair 11 – Historic Hoosier Hills Education Committee Meeting 13 – 319 Grant Proposal Meeting 14 – Wonders of Wetlands Workshop August 2006 1 – ICW Steering Committee Meeting 1 – Switzerland County SWCD Board Meeting 3 – Improving Pasture Productivity Workshop 8 – Historic Hoosier Hills Education Committee Meeting 8 – S.I.D.E.S.H.O.W. Meeting 15 – Management Plan Committee Meeting 17 – Region SWCD Employee Meeting 31 – State Envirothon Meeting September 2006 5 – Switzerland County SWCD Board Meeting 9 – Go FishIN 21 – Ohio County SWCD Field Day 26 – ORSANCO Boat Trip 29 – Radio promotion for Pond Clinic 30 – Switzerland County SWCD Pond Clinic October 2006 3 – ICW Steering Committee Meeting

81
3 – Switzerland County SWCD Board Meeting 5 – Historic Hoosier Hills Education Committee Meeting 6 – Water Festival Grades 4-8 Denver Siekman Environmental Park 18-20 Switzerland County SWCDTree Sale 20 – Radio Promotion of Tree Sale 25 – Water Festival Grades 4 – 8 Denver Siekman Environmental Park November 2006 14 – District Employee Boot Camp 14 – Switzerland County SWCD Board Meeting 28 – River’s Institute Conference on Non-Point Source Pollution December 2006 5 – ICW Steering Committee 6 – Switzerland County SWCD Conservation Tillage Breakfast 12 – Switzerland County SWCD Board Meeting January 2007 4 – Watershed Signs Installed 9 – Historic Hoosier Hills Education Committee Meeting 9 – ICW Steering Committee Meeting 16-18 – IASWCD Annual Conference Indianapolis, Indiana 23 – Switzerland County Community Foundation Meeting 23 – Wastewater Issues Workshop February 2007 12 – Switzerland County SWCD Board Meeting 13 – ICW Steering Committee Meeting 13 – Ag. Day Meeting 23 – Historic Hoosier Hills Education Committee Workshop 27 – Rule 5 Workshop March 2007 2 – Healthy Water/Healthy People Workshop 6 – ICW Steering Committee Meeting 6 – Switzerland County SWCD Board Meeting 10 – Switzerland County Council Meeting 16 – Switzerland County SWCD Annual Meeting 22 – Region Meeting April 2007 3 – HHH Education Committee Meeting 3 – ICW Steering Committee Meeting 3 – Switzerland County SWCDBoard Meeting 5 – Indiana Regional Enivorothon Contest 6 – Holiday

82
19 – HHH Annual Meeting 24 – Watershed Coordinator Meeting 27 – 4th grade Ag. Day 28 – Bennington Pike Cleanup Day
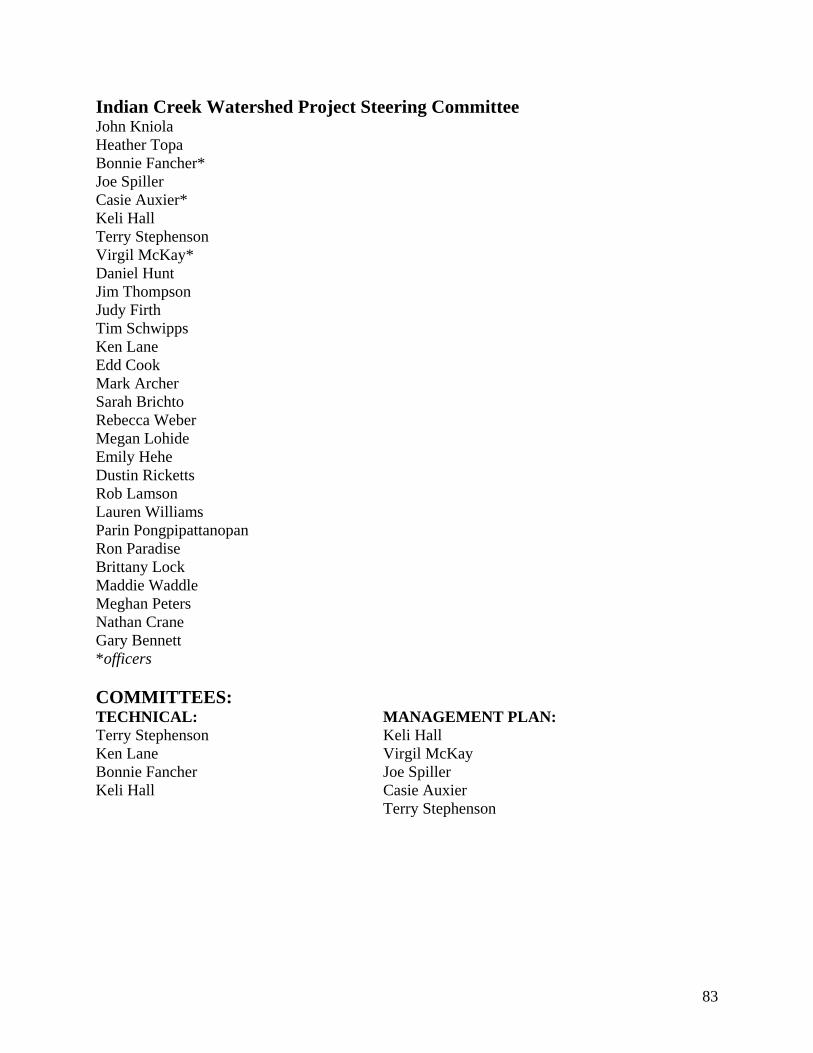
83
Indian Creek Watershed Project Steering Committee John Kniola Heather Topa Bonnie Fancher* Joe Spiller Casie Auxier* Keli Hall Terry Stephenson Virgil McKay* Daniel Hunt Jim Thompson Judy Firth Tim Schwipps Ken Lane Edd Cook Mark Archer Sarah Brichto Rebecca Weber Megan Lohide Emily Hehe Dustin Ricketts Rob Lamson Lauren Williams Parin Pongpipattanopan Ron Paradise Brittany Lock Maddie Waddle Meghan Peters Nathan Crane Gary Bennett *officers COMMITTEES: TECHNICAL: MANAGEMENT PLAN: Terry Stephenson Keli Hall Ken Lane Virgil McKay Bonnie Fancher Joe Spiller Keli Hall Casie Auxier Terry Stephenson
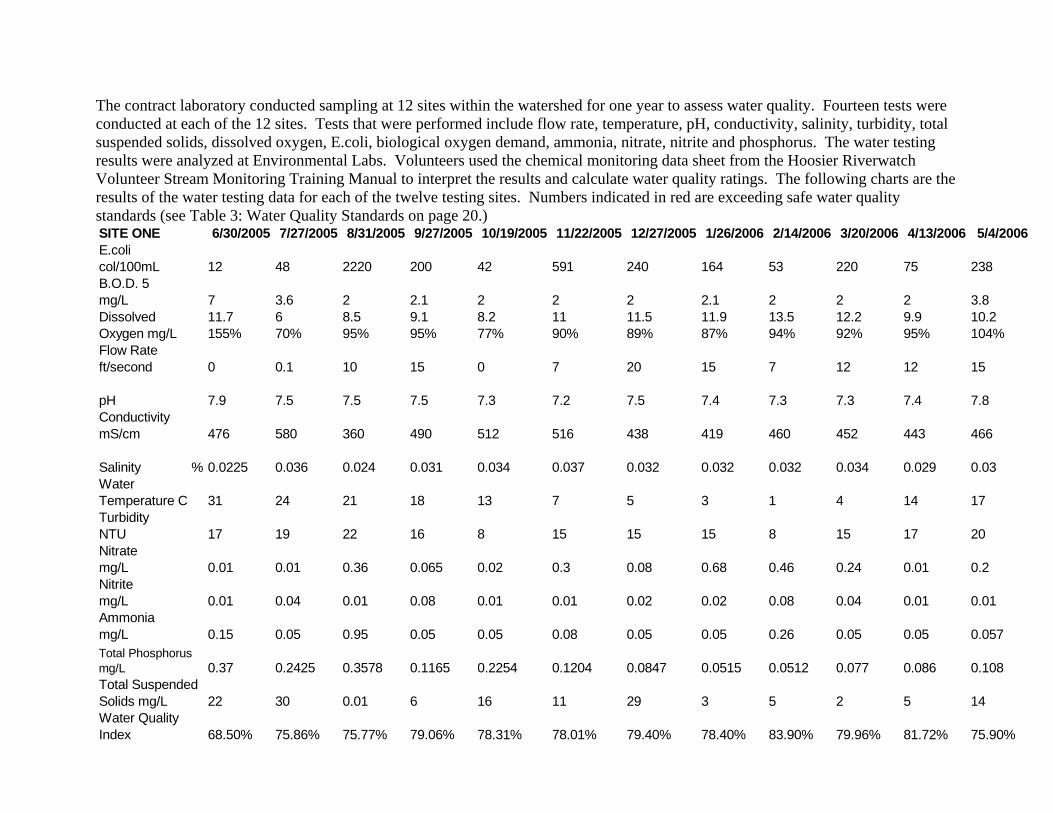
The contract laboratory conducted sampling at 12 sites within the watershed for one year to assess water quality. Fourteen tests were conducted at each of the 12 sites. Tests that were performed include flow rate, temperature, pH, conductivity, salinity, turbidity, total suspended solids, dissolved oxygen, E.coli, biological oxygen demand, ammonia, nitrate, nitrite and phosphorus. The water testing results were analyzed at Environmental Labs. Volunteers used the chemical monitoring data sheet from the Hoosier Riverwatch Volunteer Stream Monitoring Training Manual to interpret the results and calculate water quality ratings. The following charts are the results of the water testing data for each of the twelve testing sites. Numbers indicated in red are exceeding safe water quality standards (see Table 3: Water Quality Standards on page 20.) SITE ONE 6/30/2005 7/27/2005 8/31/2005 9/27/2005 10/19/2005 11/22/2005 12/27/2005 1/26/2006 2/14/2006 3/20/2006 4/13/2006 5/4/2006
75.90%83.90%
2
79.96%
5
81.72%78.31% 78.01% 79.40% 78.40%
0.077 0.086 0.108
16 11 29 3 5 1422
0.2254 0.1204 0.0847
0.05
68.50% 75.86% 75.77%
0.1165
6
79.06%
0.37 0.2425 0.3578
0.05
30 0.01
0.26
0.0515 0.0512
0.01
0.15 0.05 0.95 0.05 0.05 0.0570.05 0.08 0.05
0.02 0.08 0.04 0.01
0.24 0.01 0.2
0.01 0.04 0.01 0.08 0.01 0.01 0.02
20
0.01 0.01 0.36 0.065 0.02 0.3 0.08 0.68 0.46
15 8 15 17
4 14 17
17 19 22 16 8 15 15
0.03
31 24 21 18 13 7 5 3 1
0.032 0.032 0.034 0.029
452 443 466
0.0225 0.036 0.024 0.031 0.034 0.037 0.032
7.8
476 580 360 490 512 516 438 419 460
7.4 7.3 7.3 7.4
12 12 15
7.9 7.5 7.5 7.5 7.3 7.2 7.5
10.2 104%
0 0.1 10 15 0 7 20 15 7
11.9 87%
13.5 94%
12.2 92%
9.9 95%
9.1 95%
8.2 77%
11 90%
11.5 89%
2 2 3.8
200 42 591 240 164 53
Water Temperature C
E.coli col/100mLB.O.D. 5 mg/L
2220
Dissolved Oxygen mg/LFlow Rate ft/second
11.7 155%
6 70%
8.5 95%
12 48
pHConductivity mS/cm
220 75 238
7 3.6 2 2.1 2 2 2 2.1 2
Water Quality Index
Nitrite mg/LAmmonia mg/LTotal Phosphorus mg/LTotal Suspended Solids mg/L
Turbidity NTUNitrate mg/L
Salinity %
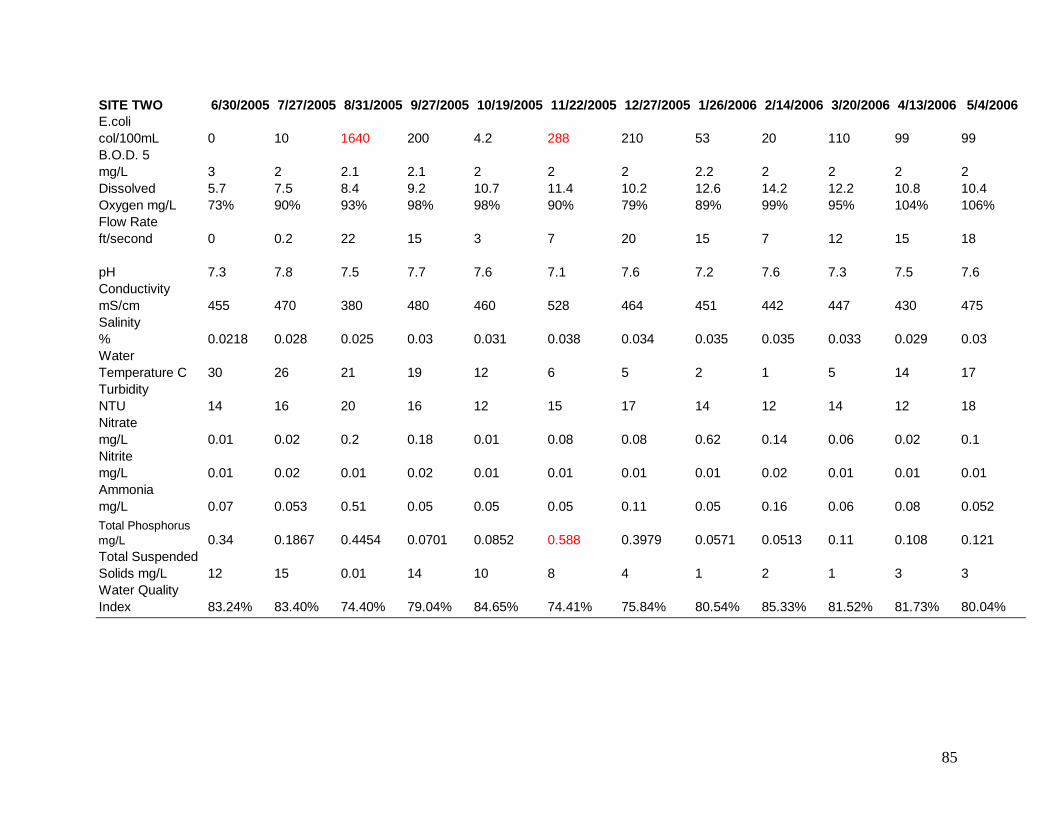
85
SITE TWO 6/30/2005 7/27/2005 8/31/2005 9/27/2005 10/19/2005 11/22/2005 12/27/2005 1/26/2006 2/14/2006 3/20/2006 4/13/2006 5/4/2006
80.04%80.54% 85.33% 81.52% 81.73%79.04% 84.65% 74.41% 75.84%Water Quality Index 83.24% 83.40% 74.40%
2 1 3 3
0.121Total Suspended Solids mg/L 12 15 0.01 14 10 8 4 1
0.0571 0.0513 0.11 0.1080.0701 0.0852 0.588 0.3979Total Phosphorus mg/L 0.34 0.1867 0.4454
0.16 0.06 0.08 0.052
0.01Ammonia mg/L 0.07 0.053 0.51 0.05 0.05 0.05 0.11 0.05
0.01 0.02 0.01 0.010.02 0.01 0.01 0.01Nitrite mg/L 0.01 0.02 0.01
0.14 0.06 0.02 0.1
18Nitrate mg/L 0.01 0.02 0.2 0.18 0.01 0.08 0.08 0.62
14 12 14 1216 12 15 17Turbidity NTU 14 16 20
1 5 14 17
0.03Water Temperature C 30 26 21 19 12 6 5 2
0.035 0.035 0.033 0.0290.03 0.031 0.038 0.034Salinity % 0.0218 0.028 0.025
442 447 430 475
7.6Conductivity mS/cm 455 470 380 480 460 528 464 451
7.2 7.6 7.3 7.57.7 7.6 7.1 7.6pH 7.3 7.8 7.5
7 12 15 18
10.4 106%
Flow Rate ft/second 0 0.2 22 15 3 7 20 15
12.6 89%
14.2 99%
12.2 95%
10.8 104%
9.2 98%
10.7 98%
11.4 90%
10.2 79%
Dissolved Oxygen mg/L
5.7 73%
7.5 90%
8.4 93%
2 2 2 2
99B.O.D. 5 mg/L 3 2 2.1 2.1 2 2 2 2.2
53 20 110 99200 4.2 288 210E.coli col/100mL 0 10 1640
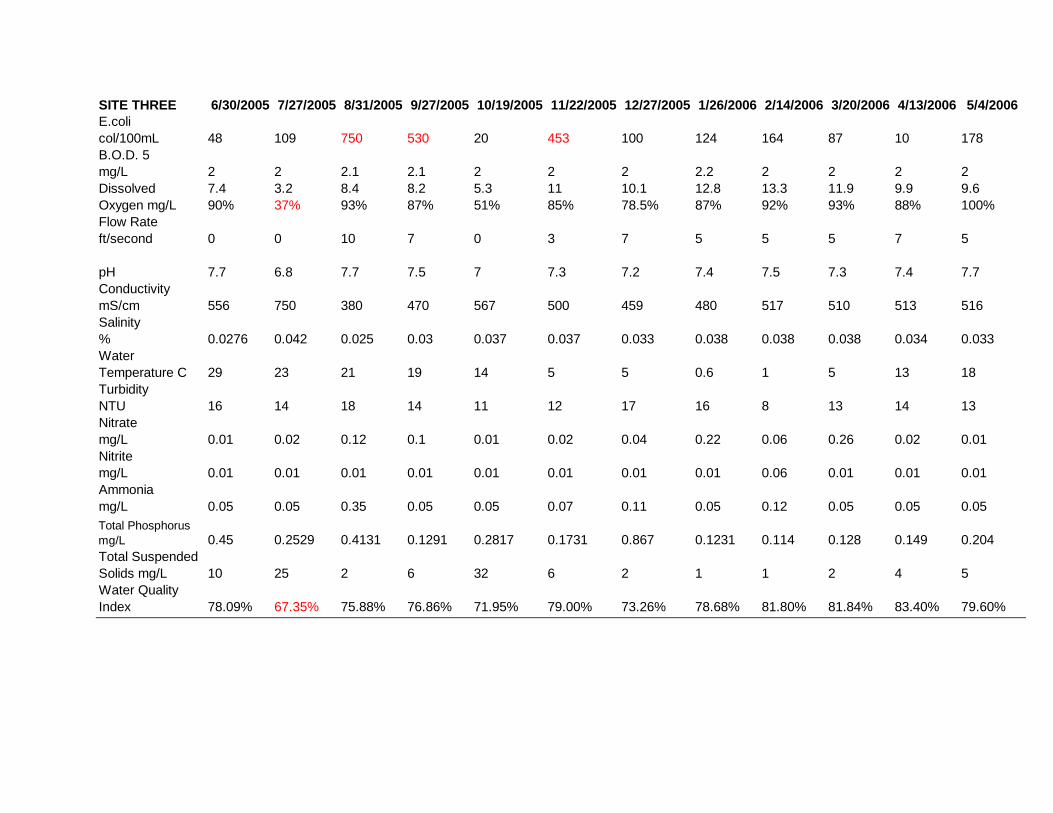
SITE THREE 6/30/2005 7/27/2005 8/31/2005 9/27/2005 10/19/2005 11/22/2005 12/27/2005 1/26/2006 2/14/2006 3/20/2006 4/13/2006 5/4/2006
79.60%78.68% 81.80% 81.84% 83.40%76.86% 71.95% 79.00% 73.26%Water Quality Index 78.09% 67.35% 75.88%
1 2 4 5
0.204Total Suspended Solids mg/L 10 25 2 6 32 6 2 1
0.1231 0.114 0.128 0.1490.1291 0.2817 0.1731 0.867Total Phosphorus mg/L 0.45 0.2529 0.4131
0.12 0.05 0.05 0.05
0.01Ammonia mg/L 0.05 0.05 0.35 0.05 0.05 0.07 0.11 0.05
0.01 0.06 0.01 0.010.01 0.01 0.01 0.01Nitrite mg/L 0.01 0.01 0.01
0.06 0.26 0.02 0.01
13Nitrate mg/L 0.01 0.02 0.12 0.1 0.01 0.02 0.04 0.22
16 8 13 1414 11 12 17Turbidity NTU 16 14 18
1 5 13 18
0.033Water Temperature C 29 23 21 19 14 5 5 0.6
0.038 0.038 0.038 0.0340.03 0.037 0.037 0.033Salinity % 0.0276 0.042 0.025
517 510 513 516
7.7Conductivity mS/cm 556 750 380 470 567 500 459 480
7.4 7.5 7.3 7.47.5 7 7.3 7.2pH 7.7 6.8 7.7
5 5 7 5
9.6 100%
Flow Rate ft/second 0 0 10 7 0 3 7 5
12.8 87%
13.3 92%
11.9 93%
9.9 88%
8.2 87%
5.3 51%
11 85%
10.1 78.5%
Dissolved Oxygen mg/L
7.4 90%
3.2 37%
8.4 93%
2 2 2 2
178B.O.D. 5 mg/L 2 2 2.1 2.1 2 2 2 2.2
124 164 87 10530 20 453 100E.coli col/100mL 48 109 750

87
SITE FOUR 6/30/2005 7/27/2005 8/31/2005 9/27/2005 10/19/2005 11/22/2005 12/27/2005 1/26/2006 2/14/2006 3/20/2006 4/13/2006 5/4/2006
80.70%81.50% 84.13% 79.23% 82.70%76.88% 78.27% 79.49% 76.79%Water Quality Index 85.11% 78.57% 76.58%
3 2 3 11
0.161Total Suspended Solids mg/L 8 10 10 10 20 13 3 2
0.1426 0.46 0.096 0.0930.1937 0.1048 0.1055 0.455Total Phosphorus mg/L 0.34 0.2383 0.3235
0.0672 0.05 0.05 0.05
0.01Ammonia mg/L 0.05 0.11 0.05 0.05 0.05 0.05 0.08 0.05
0.03 0.01 0.01 0.040.01 0.01 0.01 0.01Nitrite mg/L 0.01 0.01 0.01
0.08 0.24 0.04 0.01
14Nitrate mg/L 0.01 0.02 0.2 0.1 0.02 0.1 0.08 0.38
13 7 15 1718 10 15 16Turbidity NTU 14 18 20
2 4 13 18
0.028Water Temperature C 31 27 21 19 15 5 5 2
0.033 0.033 0.039 0.030.03 0.035 0.037 0.032Salinity % 0.0219 0.03 0.024
484 413 450 449
7.8Conductivity mS/cm 465 460 370 480 553 508 428 427
7.5 7.4 7.5 7.47.4 7 7.1 7.5pH 7.6 7.4 7.3
10 15 15 15
10.2 106%
Flow Rate ft/second 0.01 0.4 25 20 3 10 20 12
12.4 89%
13 92%
12.5 95%
9.9 97%
8.5 91%
9 88%
11.2 87%
11.9 92%
Dissolved Oxygen mg/L
10.1 135%
5.2 64%
8.7 96%
2 2 2 2
150B.O.D. 5 mg/L 2 2 2.1 2.3 2 2 2 2.8
20 10 420 42420 99 207 190E.coli col/100mL 1 12 1780

88
SITE FIVE 6/30/2005 7/27/2005 8/31/2005 9/27/2005 10/19/2005 11/22/2005 12/27/2005 1/26/2006 2/14/2006 3/20/2006 4/13/2006 5/4/2006
79.20%81.64% 83.10% 81.03% 83.30%78.87% 79.54% 78.84% 78.79%Water Quality Index 75.77% 64.99% 74.84%
2 2 4 8
0.201Total Suspended Solids mg/L 10 1 0.01 10 14 5 1 3
0.1123 0.4 0.142 0.1410.1479 0.2355 0.142 0.1742Total Phosphorus mg/L 0.54 0.3327 0.393
0.104 0.05 0.05 0.05
0.01Ammonia mg/L 0.05 0.14 0.05 0.09 0.05 0.05 0.19 0.05
0.02 0.02 0.04 0.010.06 0.01 0.01 0.01Nitrite mg/L 0.01 0.02 0.02
0.3 0.44 0.01 0.22
15Nitrate mg/L 0.02 0.04 0.16 0.08 0.04 0.18 0.26 0.56
12 9 15 1613 13 15 17Turbidity NTU 14 14 19
1 4 13 18
0.029Water Temperature C 28 24 21 18 14 6 5 2
0.034 0.034 0.034 0.0310.032 0.041 0.035 0.03Salinity % 0.0357 0.038 0.025
477 450 470 462
7.9Conductivity mS/cm 695 680 380 520 645 480 411 436
7.3 7.4 7.7 7.67.7 7.1 7.4 7.5pH 7.4 7.3 7.4
5 3 5 5
10.7 112%
Flow Rate ft/second 0 0.05 7 4 0 3 7 5
12.6 90%
12.9 89%
12.5 95%
10.4 98%
9 94.5%
9 87%
11.7 88%
9.8 76%
Dissolved Oxygen mg/L
4.4 112%
2.5 29%
8.5 95%
2 2 2 2
87B.O.D. 5 mg/L 3 2.1 2.1 2.6 2 2 2 2.4
31 20 100 31144.5 34.4 324 80E.coli col/100mL 56 200 750
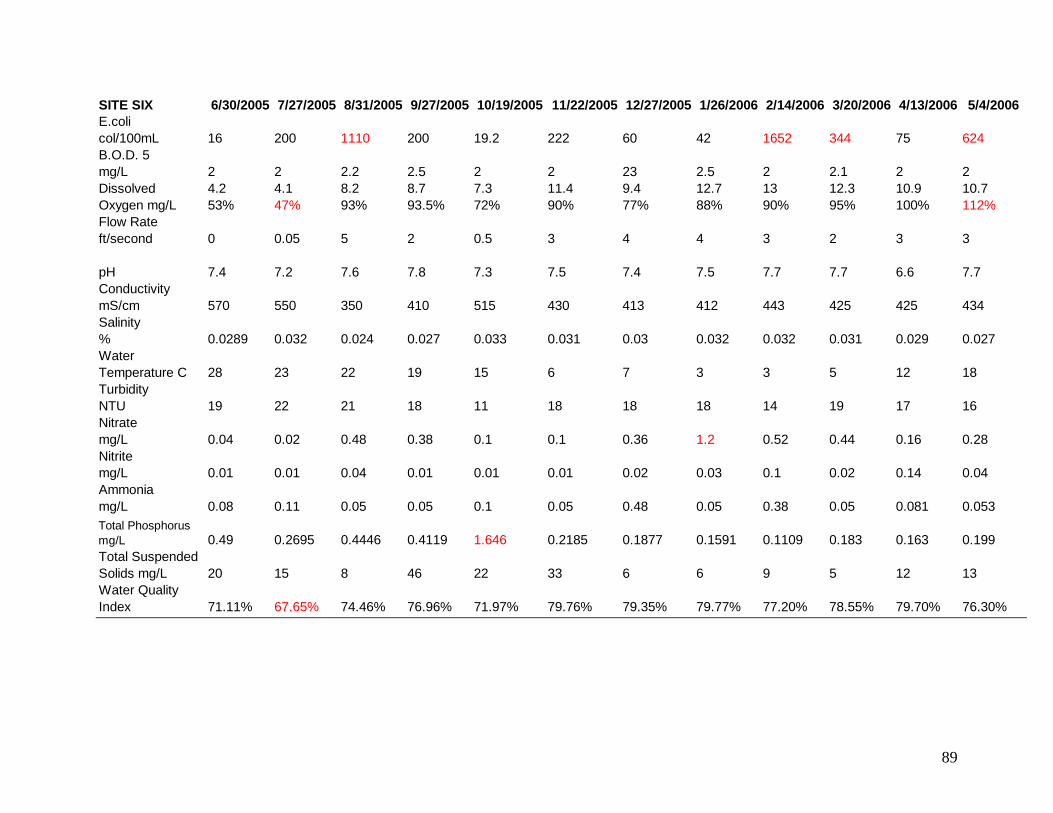
89
SITE SIX 6/30/2005 7/27/2005 8/31/2005 9/27/2005 10/19/2005 11/22/2005 12/27/2005 1/26/2006 2/14/2006 3/20/2006 4/13/2006 5/4/2006
76.30%79.77% 77.20% 78.55% 79.70%76.96% 71.97% 79.76% 79.35%Water Quality Index 71.11% 67.65% 74.46%
9 5 12 13
0.199Total Suspended Solids mg/L 20 15 8 46 22 33 6 6
0.1591 0.1109 0.183 0.1630.4119 1.646 0.2185 0.1877Total Phosphorus mg/L 0.49 0.2695 0.4446
0.38 0.05 0.081 0.053
0.04Ammonia mg/L 0.08 0.11 0.05 0.05 0.1 0.05 0.48 0.05
0.03 0.1 0.02 0.140.01 0.01 0.01 0.02Nitrite mg/L 0.01 0.01 0.04
0.52 0.44 0.16 0.28
16Nitrate mg/L 0.04 0.02 0.48 0.38 0.1 0.1 0.36 1.2
18 14 19 1718 11 18 18Turbidity NTU 19 22 21
3 5 12 18
0.027Water Temperature C 28 23 22 19 15 6 7 3
0.032 0.032 0.031 0.0290.027 0.033 0.031 0.03Salinity % 0.0289 0.032 0.024
443 425 425 434
7.7Conductivity mS/cm 570 550 350 410 515 430 413 412
7.5 7.7 7.7 6.67.8 7.3 7.5 7.4pH 7.4 7.2 7.6
3 2 3 3
10.7 112%
Flow Rate ft/second 0 0.05 5 2 0.5 3 4 4
12.7 88%
13 90%
12.3 95%
10.9 100%
8.7 93.5%
7.3 72%
11.4 90%
9.4 77%
Dissolved Oxygen mg/L
4.2 53%
4.1 47%
8.2 93%
2 2.1 2 2
624B.O.D. 5 mg/L 2 2 2.2 2.5 2 2 23 2.5
42 1652 344 75200 19.2 222 60E.coli col/100mL 16 200 1110

90
SITE SEVEN 6/30/2005 7/27/2005 8/31/2005 9/27/2005 10/19/2005 11/22/2005 12/27/2005 1/26/2006 2/14/2006 3/20/2006 4/13/2006 5/4/2006
74.50%79.90% 79.90% 80.00% 80.49%70.21% 82.88% 79.41% 76.86%Water Quality Index 71.31% 66.45% 75.63%
4 3 6 8
0.173Total Suspended Solids mg/L 20 10 12 12 4 6 2 4
0.1647 0.37 0.192 0.1170.1094 0.1428 0.1675 0.2144Total Phosphorus mg/L 0.57 0.3652 0.3798
0.0988 0.05 0.05 0.05
0.02Ammonia mg/L 0.12 0.18 0.05 0.05 0.05 0.05 0.27 0.05
0.01 0.04 0.04 0.010.01 0.01 0.01 0.02Nitrite mg/L 0.01 0.01 0.01
0.4 0.16 0.01 0.08
15Nitrate mg/L 0.01 0.03 0.18 0.12 0.001 0.12 0.26 0.7
16 14 17 1516 8 15 19Turbidity NTU 16 18 22
1 4 13 18
0.025Water Temperature C 34 25 22 19 15 6 6 2
0.03 0.03 0.034 0.0290.031 0.033 0.035 0.03Salinity % 0.0166 0.026 0.023
438 449 427 400
8.1Conductivity mS/cm 378 400 3300 490 509 477 409 391
7.6 7.8 7.8 7.87.9 7.3 7.6 7.4pH 8.1 7.5 7.2
8 15 12 7
12.3 129%
Flow Rate ft/second 0 0.2 18 5 1 5 15 12
11.4 82.5%
13.3 94%
12.8 96%
11.1 104%
10.2 109%
7.3 72%
11.8 94%
9.3 74%
Dissolved Oxygen mg/L
16.4 140%
3.7 44%
8.6 98%
2 2.3 2 2.7
207B.O.D. 5 mg/L 3 3.2 2.1 2 2 2 2 2.9
20 110 100 124750 2 288 160E.coli col/100mL 5 118 2380
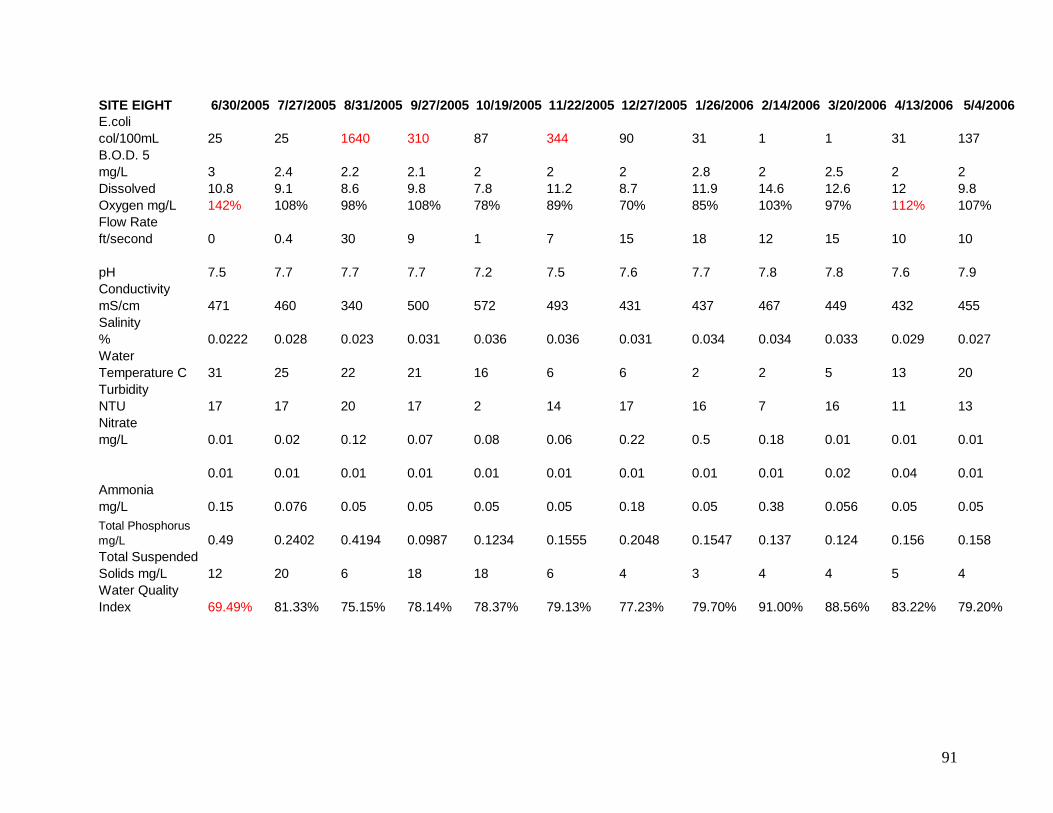
91
SITE EIGHT 6/30/2005 7/27/2005 8/31/2005 9/27/2005 10/19/2005 11/22/2005 12/27/2005 1/26/2006 2/14/2006 3/20/2006 4/13/2006 5/4/2006
79.20%79.70% 91.00% 88.56% 83.22%78.14% 78.37% 79.13% 77.23%Water Quality Index 69.49% 81.33% 75.15%
4 4 5 4
0.158Total Suspended Solids mg/L 12 20 6 18 18 6 4 3
0.1547 0.137 0.124 0.1560.0987 0.1234 0.1555 0.2048Total Phosphorus mg/L 0.49 0.2402 0.4194
0.38 0.056 0.05 0.05
0.01Ammonia mg/L 0.15 0.076 0.05 0.05 0.05 0.05 0.18 0.05
0.01 0.01 0.02 0.040.01 0.01 0.01 0.010.01 0.01 0.01
0.18 0.01 0.01 0.01
13Nitrate mg/L 0.01 0.02 0.12 0.07 0.08 0.06 0.22 0.5
16 7 16 1117 2 14 17Turbidity NTU 17 17 20
2 5 13 20
0.027Water Temperature C 31 25 22 21 16 6 6 2
0.034 0.034 0.033 0.0290.031 0.036 0.036 0.031Salinity % 0.0222 0.028 0.023
467 449 432 455
7.9Conductivity mS/cm 471 460 340 500 572 493 431 437
7.7 7.8 7.8 7.67.7 7.2 7.5 7.6pH 7.5 7.7 7.7
12 15 10 10
9.8 107%
Flow Rate ft/second 0 0.4 30 9 1 7 15 18
11.9 85%
14.6 103%
12.6 97%
12 112%
9.8 108%
7.8 78%
11.2 89%
8.7 70%
Dissolved Oxygen mg/L
10.8 142%
9.1 108%
8.6 98%
2 2.5 2 2
137B.O.D. 5 mg/L 3 2.4 2.2 2.1 2 2 2 2.8
31 1 1 31310 87 344 90E.coli col/100mL 25 25 1640
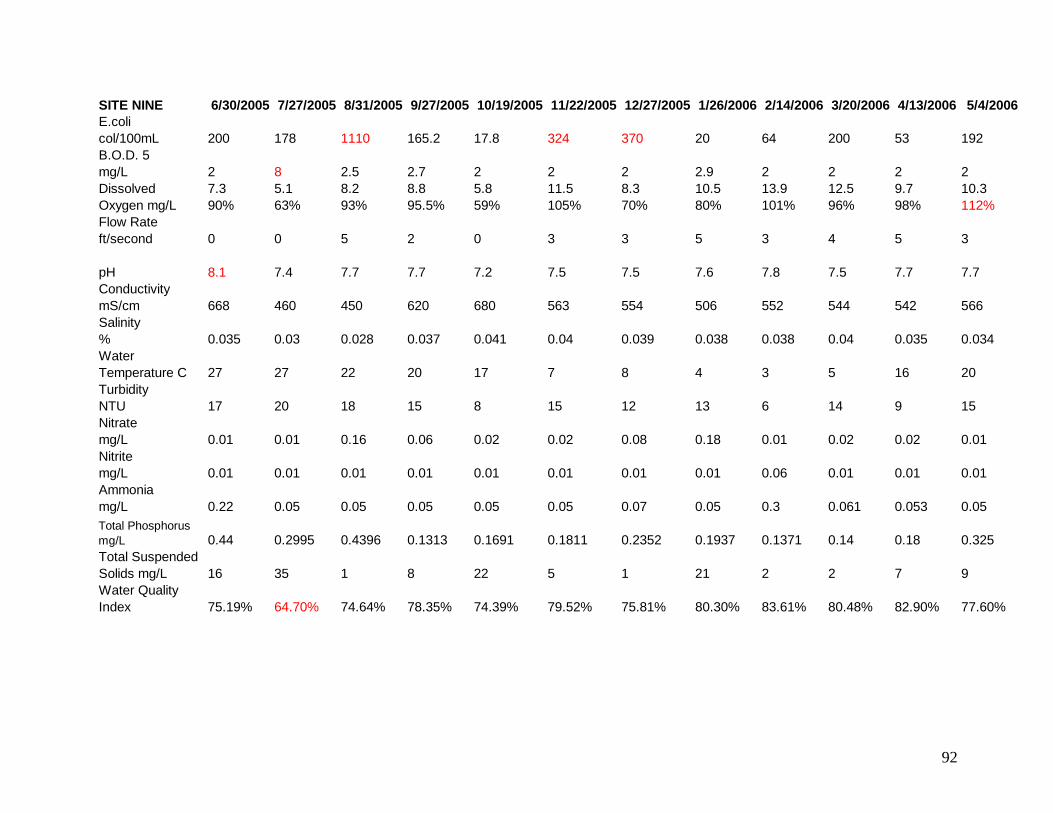
92
SITE NINE 6/30/2005 7/27/2005 8/31/2005 9/27/2005 10/19/2005 11/22/2005 12/27/2005 1/26/2006 2/14/2006 3/20/2006 4/13/2006 5/4/2006
77.60%80.30% 83.61% 80.48% 82.90%78.35% 74.39% 79.52% 75.81%Water Quality Index 75.19% 64.70% 74.64%
2 2 7 9
0.325Total Suspended Solids mg/L 16 35 1 8 22 5 1 21
0.1937 0.1371 0.14 0.180.1313 0.1691 0.1811 0.2352Total Phosphorus mg/L 0.44 0.2995 0.4396
0.3 0.061 0.053 0.05
0.01Ammonia mg/L 0.22 0.05 0.05 0.05 0.05 0.05 0.07 0.05
0.01 0.06 0.01 0.010.01 0.01 0.01 0.01Nitrite mg/L 0.01 0.01 0.01
0.01 0.02 0.02 0.01
15Nitrate mg/L 0.01 0.01 0.16 0.06 0.02 0.02 0.08 0.18
13 6 14 915 8 15 12Turbidity NTU 17 20 18
3 5 16 20
0.034Water Temperature C 27 27 22 20 17 7 8 4
0.038 0.038 0.04 0.0350.037 0.041 0.04 0.039Salinity % 0.035 0.03 0.028
552 544 542 566
7.7Conductivity mS/cm 668 460 450 620 680 563 554 506
7.6 7.8 7.5 7.77.7 7.2 7.5 7.5pH 8.1 7.4 7.7
3 4 5 3
10.3 112%
Flow Rate ft/second 0 0 5 2 0 3 3 5
10.5 80%
13.9 101%
12.5 96%
9.7 98%
8.8 95.5%
5.8 59%
11.5 105%
8.3 70%
Dissolved Oxygen mg/L
7.3 90%
5.1 63%
8.2 93%
2 2 2 2
192B.O.D. 5 mg/L 2 8 2.5 2.7 2 2 2 2.9
20 64 200 53165.2 17.8 324 370E.coli col/100mL 200 178 1110

93
SITE TEN 6/30/2005 7/27/2005 8/31/2005 9/27/2005 10/19/2005 11/22/2005 12/27/2005 1/26/2006 2/14/2006 3/20/2006 4/13/2006 5/4/2006
80.30%82.90% 84.99% 85.57% 81.73%81.80% 73.52% 79.23% 81.02%Water Quality Index 72.21% 62.03% 77.09%
2 11 1 41
0.255Total Suspended Solids mg/L 8 15 8 8 1 5 8 4
0.1649 0.1232 0.216 0.1990.1306 0.1278 0.238 0.2504Total Phosphorus mg/L 0.59 0.2616 0.4491
0.26 0.05 0.071 0.05
0.01Ammonia mg/L 0.05 0.12 0.05 0.05 0.05 0.05 1.9 0.05
0.01 0.02 0.02 0.010.01 0.01 0.01 0.01Nitrite mg/L 0.01 0.04 0.01
0.01 0.08 0.03 0.01
9Nitrate mg/L 0.01 0.04 0.14 0.08 0.01 0.02 0.04 0.08
15 8 15 119 8 14 11Turbidity NTU 15 17 18
3 5 16 19
0.034Water Temperature C 27 23 22 20 21 7 9 5
0.038 0.038 0.041 0.0330.033 0.035 0.039 0.036Salinity % 0.0309 0.037 0.028
558 560 526 553
8.1Conductivity mS/cm 595 650 450 550 600 550 513 511
7.8 7.9 7.7 7.87.7 7.3 7.6 7.6pH 7.2 7.4 7.9
5 7 10 10
10.1 108%
Flow Rate ft/second 0 0 12 2 0 3 7 10
11.1 86%
14.1 102%
12.9 100%
10.6 106%
8.6 94%
6 66%
11 90%
8.3 73%
Dissolved Oxygen mg/L
9.1 112%
2.8 32%
8.4 95%
2 2 2 2
75B.O.D. 5 mg/L 4 4 2.2 2.1 2 2 2 2
10 2 10 6459.1 53 271 20E.coli col/100mL 200 475 420
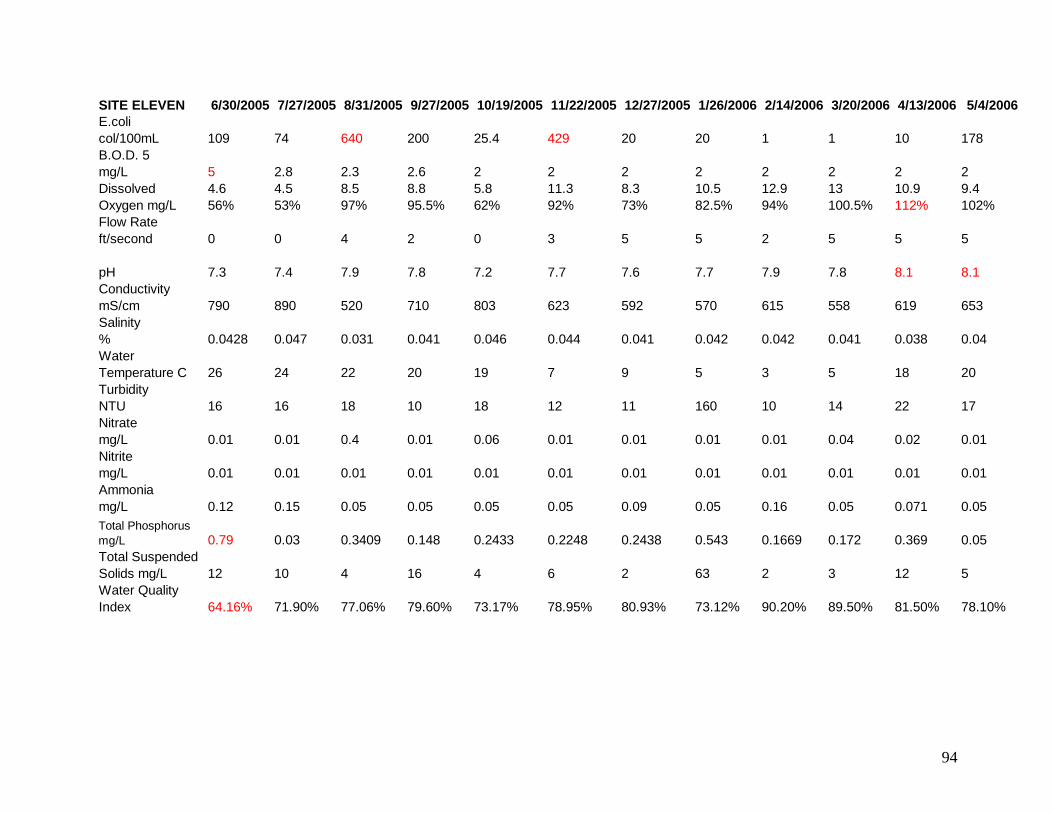
94
SITE ELEVEN 6/30/2005 7/27/2005 8/31/2005 9/27/2005 10/19/2005 11/22/2005 12/27/2005 1/26/2006 2/14/2006 3/20/2006 4/13/2006 5/4/2006
78.10%73.12% 90.20% 89.50% 81.50%79.60% 73.17% 78.95% 80.93%Water Quality Index 64.16% 71.90% 77.06%
2 3 12 5
0.05Total Suspended Solids mg/L 12 10 4 16 4 6 2 63
0.543 0.1669 0.172 0.3690.148 0.2433 0.2248 0.2438Total Phosphorus mg/L 0.79 0.03 0.3409
0.16 0.05 0.071 0.05
0.01Ammonia mg/L 0.12 0.15 0.05 0.05 0.05 0.05 0.09 0.05
0.01 0.01 0.01 0.010.01 0.01 0.01 0.01Nitrite mg/L 0.01 0.01 0.01
0.01 0.04 0.02 0.01
17Nitrate mg/L 0.01 0.01 0.4 0.01 0.06 0.01 0.01 0.01
160 10 14 2210 18 12 11Turbidity NTU 16 16 18
3 5 18 20
0.04Water Temperature C 26 24 22 20 19 7 9 5
0.042 0.042 0.041 0.0380.041 0.046 0.044 0.041Salinity % 0.0428 0.047 0.031
615 558 619 653
8.1Conductivity mS/cm 790 890 520 710 803 623 592 570
7.7 7.9 7.8 8.17.8 7.2 7.7 7.6pH 7.3 7.4 7.9
2 5 5 5
9.4 102%
Flow Rate ft/second 0 0 4 2 0 3 5 5
10.5 82.5%
12.9 94%
13 100.5%
10.9 112%
8.8 95.5%
5.8 62%
11.3 92%
8.3 73%
Dissolved Oxygen mg/L
4.6 56%
4.5 53%
8.5 97%
2 2 2 2
178B.O.D. 5 mg/L 5 2.8 2.3 2.6 2 2 2 2
20 1 1 10200 25.4 429 20E.coli col/100mL 109 74 640
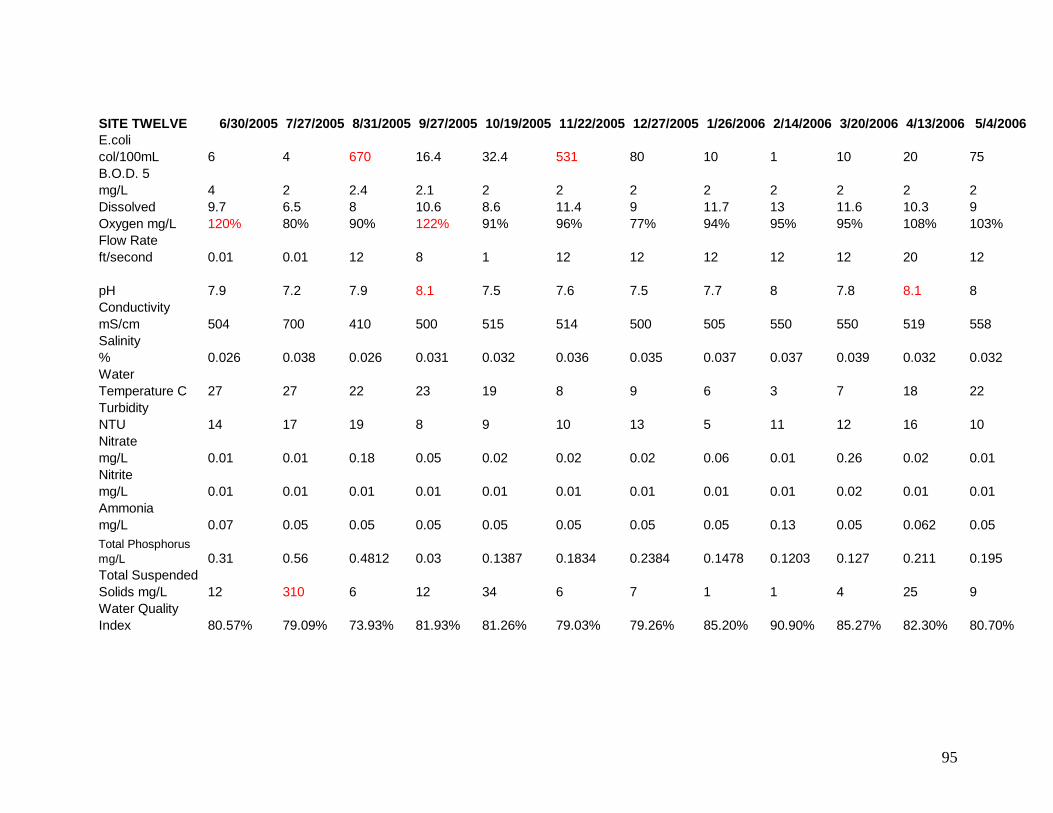
95
SITE TWELVE 6/30/2005 7/27/2005 8/31/2005 9/27/2005 10/19/2005 11/22/2005 12/27/2005 1/26/2006 2/14/2006 3/20/2006 4/13/2006 5/4/2006
1 4Water Quality Index 80.57% 79.09% 73.93% 81.93% 81.26% 79.03% 79.26%
0.195Total Suspended Solids mg/L 12 310 6 12 34 6 7 1
0.03 0.1387 0.1834 0.2384Total Phosphorus mg/L 0.31 0.56 0.4812
0.05 0.05 0.05 0.05Ammonia mg/L 0.07 0.05 0.05
0.01 0.02 0.01 0.01
0.01Nitrite mg/L 0.01 0.01 0.01 0.01 0.01 0.01 0.01 0.01
0.06 0.01 0.26 0.020.05 0.02 0.02 0.02Nitrate mg/L 0.01 0.01 0.18
11 12 16 10
22Turbidity NTU 14 17 19 8 9 10 13 5
6 3 7 1823 19 8 9Water Temperature C 27 27 22
0.037 0.039 0.032 0.032
558Salinity % 0.026 0.038 0.026 0.031 0.032 0.036 0.035 0.037
505 550 550 519500 515 514 500Conductivity mS/cm 504 700 410
8 7.8 8.1 8
12
pH 7.9 7.2 7.9 8.1 7.5 7.6 7.5 7.7
12 12 12 208 1 12 12Flow Rate ft/second 0.01 0.01 12
13 95%
11.6 95%
10.3 108%
9 103%
2Dissolved Oxygen mg/L
9.7 120%
6.5 80%
8 90%
10.6 122%
8.6 91%
11.4 96%
9 77%
11.7 94%
2 2 2 22.1 2 2 2B.O.D. 5 mg/L 4 2 2.4
1 10 20 75E.coli col/100mL 6 4 670 16.4 32.4 531 80 10
9
80.70%
25
85.20% 90.90% 85.27% 82.30%
0.050.05 0.13 0.05 0.062
0.1478 0.1203 0.127 0.211