Indian Country Cultural and Heritage Tourism
53
University of Montana ScholarWorks at University of Montana Institute for Tourism and Recreation Research Publications Institute for Tourism and Recreation Research 7-2019 Indian Country Cultural and Heritage Tourism Jeremy L. Sage University of Montana - Missoula Iree Wheeler University of Montana - Missoula Norma P. Nickerson University of Montana - Missoula Let us know how access to this document benefits you. Follow this and additional works at: hps://scholarworks.umt.edu/itrr_pubs Part of the Social and Behavioral Sciences Commons is Report is brought to you for free and open access by the Institute for Tourism and Recreation Research at ScholarWorks at University of Montana. It has been accepted for inclusion in Institute for Tourism and Recreation Research Publications by an authorized administrator of ScholarWorks at University of Montana. For more information, please contact [email protected]. Recommended Citation Sage, Jeremy L.; Wheeler, Iree; and Nickerson, Norma P., "Indian Country Cultural and Heritage Tourism" (2019). Institute for Tourism and Recreation Research Publications. 392. hps://scholarworks.umt.edu/itrr_pubs/392
Transcript of Indian Country Cultural and Heritage Tourism

University of MontanaScholarWorks at University of MontanaInstitute for Tourism and Recreation ResearchPublications Institute for Tourism and Recreation Research
7-2019
Indian Country Cultural and Heritage TourismJeremy L. SageUniversity of Montana - Missoula
Iree WheelerUniversity of Montana - Missoula
Norma P. NickersonUniversity of Montana - Missoula
Let us know how access to this document benefits you.Follow this and additional works at: https://scholarworks.umt.edu/itrr_pubs
Part of the Social and Behavioral Sciences Commons
This Report is brought to you for free and open access by the Institute for Tourism and Recreation Research at ScholarWorks at University of Montana.It has been accepted for inclusion in Institute for Tourism and Recreation Research Publications by an authorized administrator of ScholarWorks atUniversity of Montana. For more information, please contact [email protected].
Recommended CitationSage, Jeremy L.; Wheeler, Iree; and Nickerson, Norma P., "Indian Country Cultural and Heritage Tourism" (2019). Institute for Tourismand Recreation Research Publications. 392.https://scholarworks.umt.edu/itrr_pubs/392

Indian Country Cultural and Heritage Tourism 2019
Indian Country Cultural and Heritage Tourism
Visitation to and interest in Native American communities in Montana
Jeremy Sage, Ph.D.
Iree Wheeler Norma Polovitz Nickerson, Ph.D.
July, 2019
Photo by Dylan Desrosier, Blackfeet Nation

i
Indian Country Cultural and Heritage Tourism
Prepared by
Jeremy Sage, Ph.D. Iree Wheeler
Norma Polovitz Nickerson, Ph.D.
Institute for Tourism & Recreation Research
College of Forestry and Conservation The University of Montana
Missoula, MT 59812 www.itrr.umt.edu
Research Report 2019-7
July 2019
This study was funded by the Lodging Facility Use Tax
Copyright© 2019 Institute for Tourism and Recreation Research. All rights reserved.

Indian Country Cultural and Heritage Tourism 2019
ii
Abstract Visitors and potential visitors to Montana were surveyed regarding their desire to learn about Native American history and culture in Montana. Respondents were placed into four groups: Montana Residents, Avid Montana Visitors, Potential US/Canadian Visitors, and Potential International Visitors. Across all four groups surveyed, strong majorities indicated that they are interested or even very interested in exploring sites and experiences related to Native American culture and history. However, a quarter to a half of travelers do not stop while passing through a reservation because they don’t know what is available. This disconnect between travelers’ stated preferences for experiences and revealed actions provides an impetus and opportunity to increase the visibility of offerings to travelers throughout their journeys in Montana.
Highlights
Avid Montana travelers express very similar traveling preferences and tastes as that of Montanans.
Strong majorities of survey respondents indicated that they are interested in exploring sites and experiences related to Native American culture and history.
Disconnect exists between traveler interest in Native American cultural sights and activities and actually engaging in those activities. Awareness and visibility are contributors to the disconnect.

Indian Country Cultural and Heritage Tourism 2019
iii
Executive summary Montana is home to numerous Native American tribes that encompass diverse customs and resources. Do visitors to Montana have a desire to learn about our Native American history and culture? Cultural tourism, especially Indian Country tourism, has largely been underdeveloped in Montana, limiting the visitor experiences for tourists and the positive economic aspects of tourism for the Native American tribes. As the tribal communities of Montana make strides in showcasing their histories and cultures to other Montanans and nonresident visitors to the state, it becomes valuable to better understand the interests, values, and traveling preferences of visitors and potential visitors. To begin to meet this need, this project surveyed four groups of potential visitors to the seven Native American reservations found in Montana. These groups consisted of Montanans, frequent visitors to Montana who have been coined ‘Avid Montana Travelers,’ potential domestic (and Canadian) visitors who may or may not have been to Montana, as well as international travelers who also may or may not have been to Montana in the past. Across many of the general traveling preference questions, those identified as Avid Montana Travelers
mirror the preferences of Montanans. Additionally, these two groups were often distinctly different
than the other ‘potential’ travelers in categories that are often thought of as of particular interest to
Montana visitors. For example, Montana Residents and Avid Montana Travelers were more likely to
indicate that they enjoyed visiting small rural towns, visiting cultural and historic sites, eating in local
restaurants, and viewing wildlife in natural settings than were their counterparts.
Montana Native American Reservations Image from:
visitmt.com/places-to-go/indian-country.html
I enjoy viewing wildlife in natural settings I enjoy visiting small, rural towns

Indian Country Cultural and Heritage Tourism 2019
iv
In addition to general traveling preferences, respondents who had been to Montana were asked about
stopping at any of the reservations they had been through and any activities they may have taken part in
or sites visited. Majorities of Montanans surveyed have been through Blackfeet, Crow, Flathead, and
Northern Cheyenne Reservations. As for the Avid Montana Traveler, majorities have been through
Blackfeet, Crow, and Flathead Reservations. For the Potential Montana Travelers, the reservation most
frequently traveled through was Blackfeet for US and Canadian visitors and Flathead for international
travelers. Across each reservation traveled through, a majority of all travelers surveyed indicated that
they did stop. The likelihood of stopping was highest at Blackfeet (73%), followed by Flathead. For those
travelers not stopping, by far the most frequent answer as to why not, was that they did not plan to
stop. Non-trivial proportions of respondents did indicate that one reason for not stopping across all
reservations was they did not see anything of interest.
Summary of Frequency of Stopping
Native American Reservation:
Did You Stop While Traveling Through the
Listed Reservation? If Not, Why Not?
Yes No Did not plan to stop
Blackfeet (Niitsitapi) 73% 27% 87%
Crow (Apsaalooke) 65% 35% 90%
Flathead (Selish Ktunaxa) 70% 30% 85%
Fort Belknap (A'aninin Nakoda) 57% 43% 89%
Fort Peck (Nakoda Dakota) 63% 37% 87%
Northern Cheyenne (Tsetsehesestehase Sotaahe) 58% 42% 92%
Rocky Boy's (Annishinabe Ne-i-yah-wahk) 51% 49% 87%
Each reservation and the surrounding area possesses its own unique set of activities and sites to see.
Travelers who had been to or through a particular reservation and stopped were asked about a set of
sites or activities in which they may have participated on or near the reservations. While most of the
major sites or activities are provided by or directly related to the associated tribes, others take place off
the reservation.

Indian Country Cultural and Heritage Tourism 2019
v
Summary of Frequent Sites Visited
Native American Reservation: Most Frequented Site or Activity Proportion No Activity or
Site Visited
Blackfeet (Niitsitapi)
Glacier National Park Sun Tours 31% 43%
Crow (Apsaalooke)
Realbird's Little Bighorn Reenactment
76% 2%
Flathead (Selish Ktunaxa)
Flathead Lake State Park 57% 25%
Fort Belknap (A'aninin Nakoda)
Mission Canyon/Natural Bridge 24% 55%
Fort Peck (Nakoda Dakota)
Fort Peck Reservoir and Recreation Area
56% 32%
Northern Cheyenne (Tsetsehesestehase Sotaahe)
St. Labre Mission and Cheyenne Museum
19% 62%
Rocky Boy's (Annishinabe Ne-i-yah-wahk) Chippewa-Cree Recreation Area 27% 57%
Across all four groups surveyed, strong majorities indicated that they are interested or even very interested in exploring sites and experiences related to Native American culture and history. Even so, one-quarter to one-half of travelers do not stop while passing through a given reservation. Multiple respondents, in written comments, indicated they weren’t sure if or when they were on a reservation, or they didn’t stop because they didn’t know what was available and it wasn’t on their planned trip. This disconnect between travelers’ stated preferences for experiences and revealed actions provides an impetus and opportunity to increase the visibility of offerings to travelers throughout their journeys in the state.
If I had information on the scenic roads through Native American lands, I would include
this route in my activities

Indian Country Cultural and Heritage Tourism 2019
vi
Table of Contents Abstract ......................................................................................................................................................... ii
Highlights ...................................................................................................................................................... ii
Executive summary ...................................................................................................................................... iii
Table of Contents ......................................................................................................................................... vi
List of Figures and Images ........................................................................................................................... vii
Introduction .................................................................................................................................................. 1
Purpose ..................................................................................................................................................... 1
Objectives ................................................................................................................................................. 1
Methods ........................................................................................................................................................ 2
Survey design ............................................................................................................................................ 2
Limitations ................................................................................................................................................ 2
Response rate ........................................................................................................................................... 2
Results ........................................................................................................................................................... 4
Place of Residence .................................................................................................................................... 4
Demographics ........................................................................................................................................... 4
Travel Preferences .................................................................................................................................... 7
Montana Visitation ................................................................................................................................. 10
Native American Reservation Visitation within Montana ...................................................................... 12
Blackfeet (Niitsitapi) Reservation ........................................................................................................... 14
Activity Participation & Sites Visited ................................................................................................... 15
Crow (Apsaalooke) Reservation .............................................................................................................. 16
Activity Participation & Sites Visited ................................................................................................... 17
Flathead (Selish Ktunaxa) Reservation .................................................................................................... 18
Activity Participation & Sites Visited ................................................................................................... 19
The Fort Belknap (A’aninin Nakoda) Reservation ................................................................................... 20
Activity Participation & Sites Visited ................................................................................................... 21
The Fort Peck (Nakoda Dakota) Reservation .......................................................................................... 22
Activity Participation & Sites Visited ................................................................................................... 23
Northern Cheyenne (Tsetsehesestehase Sotaahe) Reservation ............................................................ 24
Activity Participation & Sites Visited ................................................................................................... 25
Rocky Boy’s (Annishinabe Ne-i-yah-wahk) Reservation ......................................................................... 26
Activity Participation & Sites Visited ................................................................................................... 27
Conclusions & Recommendations .............................................................................................................. 27

Indian Country Cultural and Heritage Tourism 2019
vii
Appendix A: Survey instrument ................................................................................................................. 30
Appendix B: Travel preferences percentages ............................................................................................ 39
List of Figures and Images Figure 1: Place of Residence ......................................................................................................................... 4 Figure 2: Demographics ................................................................................................................................ 6 Figure 3: When traveling… ............................................................................................................................ 7 Figure 4: Interest in Native American sites and activities ............................................................................. 8 Figure 5: Agreement with travel statements ................................................................................................ 9 Figure 6: Participation in guided experiences ............................................................................................. 10 Figure 7: Visitation to Montana .................................................................................................................. 11 Figure 8: Interest in Native American culture and history in Montana ...................................................... 12 Figure 9: Map of Montana-based Native American Reservations .............................................................. 12 Figure 10: Montana Native American Reservation Visitation .................................................................... 13 Figure 11: Number of Reservations Visited ................................................................................................ 13 Figure 12: Blackfeet (Niitsitapi) Stopping ................................................................................................... 14 Figure 13: Blackfeet (Niitsitapi) Activities ................................................................................................... 15 Figure 14: Crow (Apsaalooke) Stopping ...................................................................................................... 16 Figure 15: Crow (Apsaalooke) Activities ..................................................................................................... 17 Figure 16: Flathead (Selish Ktunaxa) Stopping ........................................................................................... 18 Figure 17: Flathead (Selish Ktunaxa) Activities ........................................................................................... 19 Figure 18: Fort Belknap (A’aninin Nakoda) Stopping .................................................................................. 20 Figure 19: Fort Belknap (A’aninin Nakoda) Activities ................................................................................. 21 Figure 20: Fort Peck (Nakoda Dakota) Stopping ......................................................................................... 22 Figure 21: Fort Peck (Nakoda Dakota) Activities ......................................................................................... 23 Figure 22: Northern Cheyenne (Tsetsehesestehase Sotaahe) Stopping .................................................... 24 Figure 23: Northern Cheyenne (Tsetsehesestehase Sotaahe) Activities .................................................... 25 Figure 24: Rocky Boy’s (Annishinabe Ne-i-yah-wahk) Stopping ................................................................. 26 Figure 25: Rocky Boy’s (Annishinabe Ne-i-yah-wahk) Activities ................................................................. 27 Figure 26: Summary of Frequency of Stopping .......................................................................................... 28 Figure 27: Summary of Frequent Sites Visited ............................................................................................ 28
Indian Country Cultural and Heritage Tourism 2019
1
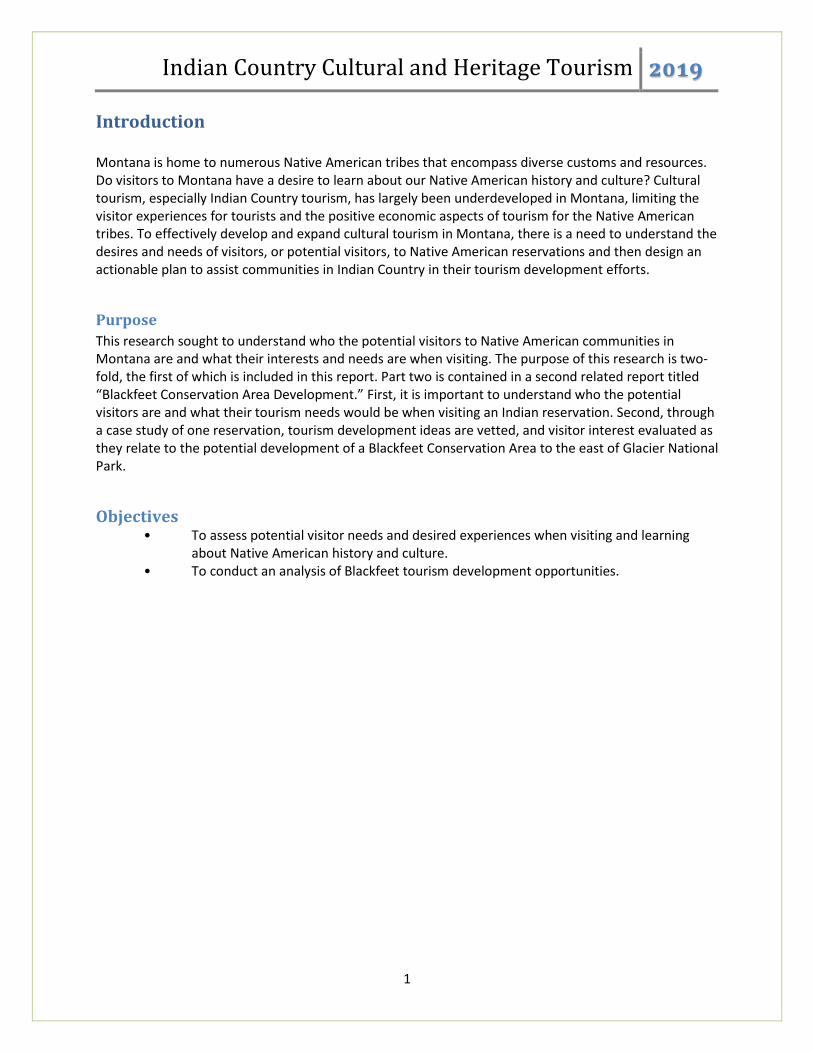
Introduction Montana is home to numerous Native American tribes that encompass diverse customs and resources. Do visitors to Montana have a desire to learn about our Native American history and culture? Cultural tourism, especially Indian Country tourism, has largely been underdeveloped in Montana, limiting the visitor experiences for tourists and the positive economic aspects of tourism for the Native American tribes. To effectively develop and expand cultural tourism in Montana, there is a need to understand the desires and needs of visitors, or potential visitors, to Native American reservations and then design an actionable plan to assist communities in Indian Country in their tourism development efforts.
Purpose
This research sought to understand who the potential visitors to Native American communities in Montana are and what their interests and needs are when visiting. The purpose of this research is two-fold, the first of which is included in this report. Part two is contained in a second related report titled “Blackfeet Conservation Area Development.” First, it is important to understand who the potential visitors are and what their tourism needs would be when visiting an Indian reservation. Second, through a case study of one reservation, tourism development ideas are vetted, and visitor interest evaluated as they relate to the potential development of a Blackfeet Conservation Area to the east of Glacier National Park.
Objectives • To assess potential visitor needs and desired experiences when visiting and learning
about Native American history and culture. • To conduct an analysis of Blackfeet tourism development opportunities.

Indian Country Cultural and Heritage Tourism 2019
2
Methods
Survey design
This survey was developed through a review of studies conducted by other institutions regarding cultural tourism in Indian Country, as well as past Community Tourism Assessment Program (CTAP) reports conducted in Native American communities by ITRR in the past. Question development was conducted in partnership with members of the Blackfeet Nation and Crow Nation involved in tourism development in their communities to ensure survey information collected will meet the interests and needs of tourism development efforts. Many evolutions of the survey questionnaire were distributed for feedback specifically with members of the Blackfeet nation. The survey was conducted using two online panels. The first was a panel of residents of Montana and non-resident visitors to Montana who had been intercepted in the past by surveyors from ITRR and indicated willingness to participate in additional surveys in the future. The second panel was purchased from Qualtrics; the platform utilized for survey deployment. For this panel there was a quota requested of: 200 United States resident responses, 100 Canadian responses, and 50 of each from Australia, United Kingdom, France, and Germany. These countries were chosen based on ITRR non-resident survey data which identified residents of these countries as high visitors to the state of Montana. During the data analysis process, the ITRR Panel was split into two categories: Montana Residents and Avid Montana Travelers. The Qualtrics Panel was divided into: Potential Montana Traveler (only respondents who were residents of the United States and Canada) and Potential International Traveler (respondents who were residents of the four international countries requested in the panel). The potential traveler groups include those that may have been in Montana at some point in the past, but are not as frequent visitors as those considered in the avid group.
Limitations
The ITRR Panel and the Qualtrics Panel were not combined because significance tests indicated there was a statistically significant difference between the two panels on many questions. It is important to note that the ITRR Panel is comprised of past visitors to the state of Montana and is therefore representative of people who have visited Montana, but not necessarily representative of the general population. The Qualtrics Panel is representative of the population more generally, regardless of any previous trip to Montana. Because of these differences in sampling, we do not expect the two panels to necessarily have similar distributions.
Response rate
For the ITRR Panel the survey link was sent to two panel lists. The first was Montana Residents. In this panel 839 valid emails were sent. Five days later a reminder email was sent to all unfinished respondents. There were 210 responses received from this panel for a response rate of 25 percent. The second panel was nonresident visitors to the state of Montana. From this list 5,560 valid emails were sent. This panel also sent a reminder email after five days. From this list 1,438 completed surveys were received for a response rate of 26 percent. There were 6,399 total valid emails sent to the ITRR Panel with a response of 1,648. The response rate for the total ITRR panel was 25 percent. For the Qualtrics Panel, response rates are not calculated. As previously noted, quotas were established based on desired residency. Surveys sent out via Qualtrics-based panels are sent to potential

Indian Country Cultural and Heritage Tourism 2019
3
respondents who have signed up and agreed to routinely answer surveys when they are identified as meeting the population requirements of the surveyor. Once a survey is initiated, Qualtrics opens the survey link to its entire panel and then filters respondents out who do not meet the established criteria. Once 10 percent of the desired sample is collected, the survey is paused to ensure collection is meeting the needs of the surveyor (ITRR). If acceptable, the survey is reopened and completed. Quality control checks are established by Qualtrics to eliminate any respondents who are not fully completing the survey, who don’t meet the requirements, or who have obviously sped through the survey without actually considering the questions as evidenced by response time.
Indian Country Cultural and Heritage Tourism 2019
4
Results
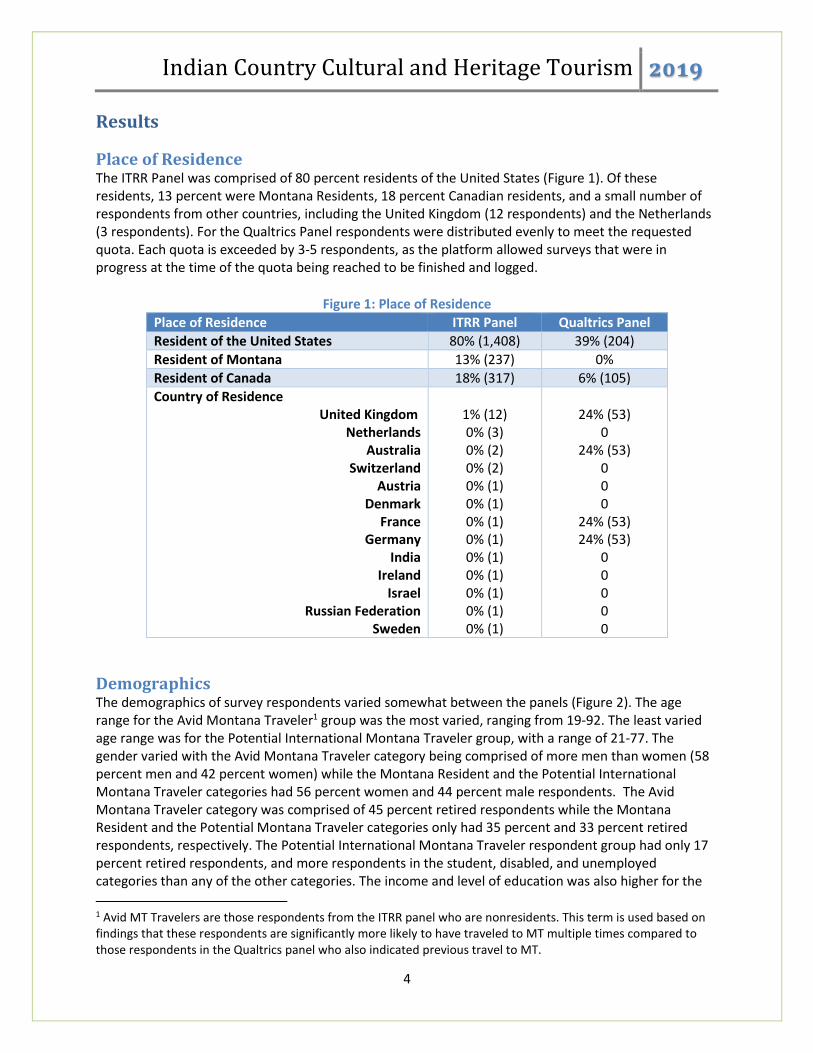
Place of Residence The ITRR Panel was comprised of 80 percent residents of the United States (Figure 1). Of these residents, 13 percent were Montana Residents, 18 percent Canadian residents, and a small number of respondents from other countries, including the United Kingdom (12 respondents) and the Netherlands (3 respondents). For the Qualtrics Panel respondents were distributed evenly to meet the requested quota. Each quota is exceeded by 3-5 respondents, as the platform allowed surveys that were in progress at the time of the quota being reached to be finished and logged.
Figure 1: Place of Residence
Place of Residence ITRR Panel Qualtrics Panel
Resident of the United States 80% (1,408) 39% (204)
Resident of Montana 13% (237) 0%
Resident of Canada 18% (317) 6% (105)
Country of Residence United Kingdom
Netherlands Australia
Switzerland Austria
Denmark France
Germany India
Ireland Israel
Russian Federation Sweden
1% (12) 0% (3) 0% (2) 0% (2) 0% (1) 0% (1) 0% (1) 0% (1) 0% (1) 0% (1) 0% (1) 0% (1) 0% (1)
24% (53)
0 24% (53)
0 0 0
24% (53) 24% (53)
0 0 0 0 0
Demographics The demographics of survey respondents varied somewhat between the panels (Figure 2). The age range for the Avid Montana Traveler1 group was the most varied, ranging from 19-92. The least varied age range was for the Potential International Montana Traveler group, with a range of 21-77. The gender varied with the Avid Montana Traveler category being comprised of more men than women (58 percent men and 42 percent women) while the Montana Resident and the Potential International Montana Traveler categories had 56 percent women and 44 percent male respondents. The Avid Montana Traveler category was comprised of 45 percent retired respondents while the Montana Resident and the Potential Montana Traveler categories only had 35 percent and 33 percent retired respondents, respectively. The Potential International Montana Traveler respondent group had only 17 percent retired respondents, and more respondents in the student, disabled, and unemployed categories than any of the other categories. The income and level of education was also higher for the
1 Avid MT Travelers are those respondents from the ITRR panel who are nonresidents. This term is used based on findings that these respondents are significantly more likely to have traveled to MT multiple times compared to those respondents in the Qualtrics panel who also indicated previous travel to MT.

Indian Country Cultural and Heritage Tourism 2019
5
Avid Montana Traveler category with 44 percent of this group reporting a household income of $100,000 or more compared to 24 percent reporting $100,000 or more for the Montana Resident panel, 23 percent for the Potential Montana Traveler, and 15 percent for the Potential International Montana Traveler. In the Avid Montana Traveler group 70 percent of respondents reported a four-year degree or higher for education compared to 65 percent of Montana Residents, 48 percent of the Potential Montana Traveler, and 46 percent of the Potential International Montana Traveler reporting a four-year degree or higher. The race/ethnicity was similar across the groups, with 93 percent of respondents from the Avid Montana Traveler, 92 percent of Montana Residents, 84 percent of the Potential Montana Traveler, and 89 percent of the Potential International Montana Traveler reporting white.

Indian Country Cultural and Heritage Tourism 2019
6
Figure 2: Demographics
Demographics Avid MT Traveler
MT Resident Potential MT Traveler
Potential International MT Traveler
Male 58% (765) 44% (92) 50% (143) 44% (84)
Female 42% (556) 56% (119) 50% (143) 56% (105)
Age Range: 19-92 Mean: 58
Range: 23-80 Mean: 55
Range: 19-85 Mean: 52
Range: 21-77 Mean: 47
Employment Employed full time
Employed part time Unemployed looking for work
Unemployed not looking for work Retired Student
Disabled
42% (594) 9% (122)
1% (9) 2% (30)
45% (634) 1% (17) 1% (10)
50% (112) 7% ( 16) 2% (5) 3% (6)
35% (79) 0% (0) 3% (6)
41% (127) 14% (43)
3% (9) 5% (17)
33% (104) 2% (5) 2% (7)
46% (97) 15% (31) 8% (16) 7% (15)
17% (36) 3% (7)
5% (10)
Income Less than $50,000
$50,000 to less than $75,000 $75,000 to less than $100,000
$100,000 to less than $150,000 $150,000 to less than $200,000
$200,000 or greater
14% (189) 20% (272) 21% (283) 26% (344) 9% (124) 9% (118)
28% (62) 28% (61) 20% (43) 18% (39) 5% (10) 1% (3)
39% (120) 20% (62) 17% (54) 11% (35) 5% (16) 7% (23)
54% (114) 20% (43) 11% (24) 9% (18) 3% (6) 3% (6)
Education Less than high school
High school graduate Some college
Two-year degree Four-year degree
Professional degree Doctorate
0% (3)
5% (76) 15% (210) 10% (144) 34% (477) 30% (424)
6% (85)
0% (0)
9% (21) 16% (36) 9% (21)
30% (67) 26% (59) 9% (20)
3% (9)
18% (56) 20% (63) 11% (34) 25% (78) 15% (48) 8% (25)
3% (7)
23% (49) 15% (32) 12% (26) 17% (35) 27% (57)
2% (5)
Race/ethnicity White
Black or African American American Indian or Alaska Native
Asian Native Hawaiian or Pacific Islander
Latino/Hispanic Other
93% (1351)
0% (7) 2% (33) 1% (18) 0% (4)
1% (21) 2% (21)
92% (212)
0% (1) 3% (6) 0% (1) 0% (1) 2% (4) 3% (6)
84% (272)
3% (10) 2% (7)
6% (20) 0% (1) 2% (7) 2% (7)
89% (190)
1% (2) 0% (1)
6% (13) 0% (1) 0% (1) 2% (5)

Indian Country Cultural and Heritage Tourism 2019
7
Travel Preferences Respondents were asked four series of questions regarding their travel preferences and interest in different activities in general; not specific to travel in Montana. These questions were asked on 5-point scales. The first series of questions (Figure 3) asked about traveling preferences on a scale from 1 (strongly disagree) to 5 (strongly agree). Strongly disagree indicated low agreement in the described travel statement and strongly agree indicated the importance of that statement in respondents’ travel preferences. A score of ‘3’ indicated the respondent neither agreed nor disagreed with the statement. The preferences with the highest agreement were “I enjoy viewing wildlife in natural settings” with an average agreement of 4.66 for the Avid Montana Traveler, and 4.69 for Montana Residents. Mean agreement with this preference was slightly lower for the two Qualtrics Panel groups: 4.06 for Potential Montana Traveler and 3.96 for Potential International Montana Traveler. The second highest average agreement was “I enjoy visiting cultural and historical sites” with a mean of 4.37 and 4.38 for the Avid Montana Traveler and Montana Residents respectively. In the Qualtrics Panel groups the mean was 3.97 for Potential Montana Travelers and 3.99 for Potential International Montana Travelers. The statement that respondents agreed with the least was “I enjoy camping in primitive campgrounds.” For this preference, Montana Residents were more interested than the other groups with a mean of 3.08, compared to 2.67 for the Avid Montana Traveler, 2.66 for the Potential Montana Traveler, and 2.61 for the Potential International Montana Traveler.
Figure 3: When traveling…
When traveling… Avid MT Traveler
MT Resident
Potential MT
Traveler
Potential International MT Traveler
Mean Mean Mean Mean
I enjoy visiting small, rural towns 4.24 4.32 3.88 3.87
I enjoy (or would enjoy) visiting Native American communities
3.76 3.65 3.67 3.53
I enjoy visiting cultures different from my own 4.18 4.15 3.96 3.84
When choosing to stay in hotels/motels, I tend to stay at those locally owned whenever possible (i.e., non-chain).
3.07 3.02 3.28 3.48
I enjoy staying in rustic accommodations (e.g., cabins, teepees, yurts).
3.23 3.27 3.11 3.12
I enjoy visiting cultural and historical sites 4.37 4.38 3.97 3.99
I typically prefer local restaurants over chains 4.31 4.39 3.81 3.94
I enjoy camping in primitive campgrounds (with limited or no amenities such as bathrooms or running water).
2.67 3.08 2.66 2.61
I enjoy camping in developed campgrounds (with amenities such as showers, RV pads and RV hook-ups).
3.28 3.38 3.28 3.13
I enjoy viewing wildlife in natural settings. 4.66 4.69 4.06 3.96
**5-point scale from 1 (strongly disagree) to 5 (strongly agree)2
2 Appendix B provides percentage distributions of Likert scale questions

Indian Country Cultural and Heritage Tourism 2019
8
The second travel preference question (Figure 4) asked respondents about interests regarding visiting Native American sites and participating in activities in Indian Country. This series used a 5-point scale from 1 (not at all interested) to 5 (extremely interested). The activity with the highest average interest in the ITRR Panel was “Museums/Heritage centers” with an average of 3.70 for the Avid Montana Traveler, and 3.72 for Montana Residents. For the Qualtrics Panel groups, the mean was highest for the Potential Montana Traveler group (3.57). The Potential International Montana Traveler group had a mean of 3.41 in this category: the highest interest in this group was for “restaurants/dining featuring Native American food” with a mean of 3.52. The second highest activities of interest were “Fairs and markets with native crafts to view or purchase” with means of 3.51 in both ITRR Panel groups, and 3.49 in both Qualtrics Panel groups. The activity that respondents indicated the least interest in was “Overnight guided experiences” with an average of 2.49 for the Avid Montana Traveler, and 2.53 for Montana Residents. In the Qualtrics Panel groups, the mean for Potential Montana Traveler group was 3.16 and 3.26 for the Potential International Montana Traveler.
Figure 4: Interest in Native American sites and activities
How interested would you be in visiting or participating in the following Native American sites and activities…
Avid MT Traveler
MT Resident
Potential MT
Traveler
Potential International MT Traveler
Mean Mean Mean Mean
Museums/Heritage centers 3.70 3.72 3.57 3.41
Fairs or markets with native crafts to view or purchase 3.51 3.51 3.49 3.49
Restaurants/dining featuring Native American food 3.45 3.49 3.47 3.52
Special events/festivals related to Native American culture 3.48 3.51 3.15 3.37
Demonstrations/live cultural performances (e.g., cooking, arts, weaponry)
3.51 3.55 3.46 3.38
Oral history of a tribe 3.44 3.51 3.33 3.35
Immersive experience (e.g., powwows, dances) 3.12 3.33 3.26 3.12
Half or full day guided experiences 3.01 2.96 3.45 3.43
Overnight guided experiences 2.49 2.53 3.16 3.26
**5-point scale from 1(not at all interested) to 5 (extremely interested)
The third travel preferences question (Figure 5) asked 5-point scale agreement statements with 1 indicating strong disagreement and 5 indicating strong agreement. The statement with the highest agreement for the ITRR Panel groups was “If I had information on scenic roads through Native American lands, I would include this route in my activities” with an average agreement of 4.06 for the Avid Montana Traveler and 3.93 for Montana Residents. The second highest agreement for the ITRR Panel groups was “I would like to lead myself through interpretive opportunities” with an average of 3.97 for the Avid Montana Traveler and 4.00 for the Montana Residents. The Qualtrics Panel groups highest mean was for “I would like to visit a Native American community for other wildlife viewing opportunities” with 3.69 for the Potential Montana Traveler and 3.68 for the Potential International Montana Traveler. The statement with the least agreement was “I would choose to visit a Native American Reservation or community for gambling opportunities.” This statement had an average of 1.96 for the Avid Montana Traveler and 1.84 for the Montana Resident. Interest in this activity was higher for the Qualtrics Panels with 3.04 for the Potential Montana Traveler and 2.74 for the Potential International MT Traveler.

Indian Country Cultural and Heritage Tourism 2019
9
Figure 5: Agreement with travel statements
Agreement with travel statements… Avid MT Traveler
MT Resident
Potential MT
Traveler
Potential International MT Traveler
Mean Mean Mean Mean
I would seek out a Native American community to visit a native cultural event (e.g., dance, powwow).
3.21 3.24 3.44 3.31
I would like to lead myself through interpretive opportunities (e.g., hiking trail with interpretive signs, driving personal vehicle on roads with interpretive pullouts).
3.97 4.00 3.36 3.25
I would choose to visit a Native American Reservation or community for gambling opportunities.
1.96 1.84 3.04 2.74
I would like to visit a Native American community for bison viewing opportunities.
3.74 3.46 3.53 3.38
I would like to visit a Native American community for other wildlife viewing opportunities.
3.96 3.76 3.69 3.68
If I am participating in an outdoor activity on Native American lands, cultural interpretation of the area is important.
3.89 3.77 3.59 3.48
If I had information on the scenic roads through Native American lands, I would include this route in my activities.
4.06 3.93 3.64 3.55
**5-point scale from 1 (strongly disagree) to 5 (strongly agree) The fourth set of travel preference questions (Figure 6) asked respondents about likelihood to participate in different guided activities on Native American lands using a 5-point scale from 1 (extremely unlikely) to 5 (extremely likely). The guided experience with the highest likelihood of participation for the ITRR Panel groups was “A guided hike of cultural sites with a tribal guide” with a mean of 3.58 for the Avid Montana Traveler group and 3.46 for the Montana Resident group. For the Qualtrics Panel the most likely activity was “A guided horseback trip with a tribal tour guide.” This activity had a mean of 3.57 for the Potential Montana Traveler group and 3.65 for the Potential International Montana Traveler group. The guided experience with the least likelihood of participation for both panels was “A guided hunting trip into the back-country with a tribal guide” with an average of 2.11 and 2.16 for the Avid Montana Traveler group and the Montana Resident group, respectively. In the Qualtrics Panel the mean was 2.79 for the Potential Montana Traveler, and 2.61 for the Potential International Montana Traveler. The likelihood to participate in guided experiences was overall higher for the Qualtrics Panel groups.

Indian Country Cultural and Heritage Tourism 2019
10
Figure 6: Participation in guided experiences
Likelihood to participate in guided experiences… Avid MT Traveler
MT Resident
Potential MT
Traveler
Potential International MT Traveler
Mean Mean Mean Mean
A guided horseback trip with a tribal tour guide. 2.89 2.77 3.57 3.65
A guided interpretive bus tour with a tribal tour guide. 2.90 2.76 3.52 3.36
A guided trip on an Off-Highway Vehicle (OHV) with a tribal tour guide.
3.13 2.90 3.46 3.39
A guided nature hike with a tribal tour guide. 3.48 3.29 3.47 3.50
A guided hike of cultural sites with a tribal guide. 3.58 3.46 3.55 3.50
A guided fishing trip with a tribal guide. 2.76 2.65 3.05 2.87
A guided hunting trip into the back-country with a tribal guide. 2.11 2.16 2.79 2.61
**5-point scale from 1 (extremely unlikely) to 5 (extremely likely)
Montana Visitation When asked about visitation to the state of Montana, 98 percent of the ITRR Panel who were not residents of Montana reported having visited Montana (Figure 7). In the Qualtrics Panel, 39 percent of the Potential Montana Traveler group, and 7 percent of the Potential International Montana Traveler group reported visiting Montana. In the ITRR Panel many of the respondents were frequent visitors to the state of Montana with 29 percent having visited 11-50 times, and 20 percent visiting more than 50 times. In the Potential Montana Traveler group, 55 percent had visited one or two times. In the Potential International Montana Traveler group, 80 percent had only visited one or two times. For the Avid Montana Traveler group and the Potential Montana Traveler group the highest year of most recent visitation was 2018. Fifty-six percent of the Avid Montana Traveler group and 31 percent of the Potential Montana Traveler group visited in that year. There was a larger proportion of respondents in the Qualtrics Panel groups who had visited over 10 years ago: 30 percent for the Potential Montana Traveler group and 14 percent for the Potential International Montana Traveler group had visited before 2009. Only 1 percent of the Avid Montana Traveler group had last visited before this time frame. This could be due to when ITRR began collecting email addresses for the ITRR Panel. Summer was the most common time for visiting with 39 percent of the Avid Montana Traveler group, 35 percent of the Potential Montana Traveler group, and 36 percent of the Potential International Montana Traveler group visiting during that season. 3
3Note: Residents of Montana were screened out and did not receive this series of questions.

Indian Country Cultural and Heritage Tourism 2019
11
Figure 7: Visitation to Montana
Visitation to Montana Avid MT Traveler
Potential MT Traveler
Potential International MT Traveler
Visited MT Yes No
98% (1,424)
2% (26)
39% (121) 61% (192)
7% (15)
93% (197)
Frequency of visitation 1 Time
2 Times 3 Times 4 Times 5 Times 6 Times 7 Times 8 Times 9 Times
10 Times 11-50 Times
More than 50 times
11% (154) 8% (115) 6% (87) 6% (78) 5% (67) 3% (49) 2% (23) 3% (40) 1% (9)
7% (98) 29% (412) 20% (285)
27% (32) 28% (34) 13% (15) 9% (11) 7% (8) 5% (6) 2% (2) 0% (0) 2% (2) 4% (5) 5 (4%) 0% (0)
33% (5) 47% (7) 7% (1) 7% (1) 0% (0) 0% (0) 7% (1) 0% (0) 0% (0) 0% (0) 0% (0) 0% (0)
Year of last visit 2019 2018
2017 2016 2015 2014 2013 2012 2011 2010 2009
Before 2009
13% (185) 56% (788) 16% (228)
6% (88) 3% (46) 2% (26) 1% (11) 1% (14) 0% (4) 0% (3) 0% (5)
1% (14)
2% (3)
31% (37) 12% (14)
5% (6) 8% (10) 3% (4) 1% (1) 3% (4) 1% (1) 3% (4) 1% (1)
30% (36)
0% (0)
20% (3) 33% (5) 7% (1)
20% (3) 0% (0) 7% (1) 0% (0) 0% (0) 0% (0) 0% (0)
14% (2)
Season of last visit Winter
Spring Summer
Fall
24% (332) 10% (143) 39% (547) 26% (366)
24% (29) 25% (30) 35% (43) 16% (19)
24% (1) 25% (5) 36% (8) 16% (1)
All respondents were asked about their interest in Native American culture and history in Montana, including residents of the state and those who said they had not visited Montana in the past. Interest in exploring sites and experiences related to Native American culture and history was highest in the Montana Resident group and the Potential Montana Traveler groups with a mean of 3.58 for each of these groups. The Avid Montana Traveler was slightly lower with a mean of 3.50, and the Potential International Montana Traveler group reported a mean of 3.49.

Indian Country Cultural and Heritage Tourism 2019
12
Figure 8: Interest in Native American culture and history in Montana
How interested would you be in exploring sites and experiences related to Native American culture and history on Native American Reservations in Montana?
Avid MT Traveler
MT Resident
Potential MT
Traveler
Potential International MT Traveler
Very uninterested 10% (138) 10% (23) 10% (31) 9% (20)
Uninterested 7% (106) 5% (12) 9% (28) 5% (10)
Neither interested nor uninterested 24% (343) 23% (52) 18% (55) 32% (67)
Interested 42% (608) 39% (88) 40% (126) 36% (77)
Very interested 17% (244) 23% (51) 23% (73) 18% (38)
Mean 3.50 3.58 3.58 3.49
Native American Reservation Visitation within Montana
Figure 9: Map of Montana-based Native American Reservations4
All respondents were provided with a map of the state with the reservations outlined (Figure 9) and asked which reservations they had passed through or visited. Of those respondents who had visited Montana in the past, 66 percent of the Avid Montana Traveler group had visited or driven through the Blackfeet Reservation and 63 percent had visited or passed through the Flathead Reservation (Figure 10). The reservation with the lowest visitation for the Avid Montana Traveler group was Rocky Boy’s (13 percent). In the Montana Resident group 86 percent had passed through the Flathead Reservation, and
4 https://www.visitmt.com/places-to-go/indian-country.html

Indian Country Cultural and Heritage Tourism 2019
13
82 percent had passed through or visited the Blackfeet Reservation. For the Montana Resident group, the Fort Peck Reservation had the lowest visitation (43 percent). For the Potential Montana Traveler group, the reservation with the highest visitation was the Blackfeet with 30 percent followed by the Crow with 27 percent. The lowest visited reservation in this group was the Flathead (18 percent). In the Potential International Montana Traveler group, the sample size was low: 40 percent of this group (six people) had visited the Flathead Reservation. The second highest visited was the Northern Cheyenne with 33 percent of travelers in this group (five people) traveling through this reservation.
Figure 10: Montana Native American Reservation Visitation
Which Native American Reservation(s) have you ever traveled to or through?
Avid MT Traveler
MT Resident
Potential MT
Traveler
Potential International MT Traveler
Blackfeet (Niitsitapi) 66% (935) 82% (195) 30% ( 36) 20% (3)
Crow (Apsaalooke) 54% (766) 75% (178) 27% (33) 27% (4)
Flathead (Selish Ktunaxa) 63% (901) 86% (204) 18% (22) 40% (6)
Fort Belknap (A’aninin Nakoda) 22% (307) 44% (104) 25% (30) 13% (2)
Fort Peck (Nakoda Dakota) 25% (363) 43% (102) 22% (27) 20% (3)
Northern Cheyenne (Tsetsehesestehase Sotaahe) 32% (452) 54% (127) 26% (32) 33% (5)
Rocky Boy’s (Annishinabe Ne-i-yahwahk) 13% (188) 45% (107) 26% (31) 13% (2)
None of these 13% (185) 0% (0) 22% (27) 7% (1)
With the exception of Montana Residents, most respondents had been to three or fewer Native American reservations in Montana. Nearly a quarter of all Montana respondents have been to all seven (Figure 11).
Figure 11: Number of Reservations Visited
How many Reservations visited?
Avid MT Traveler
MT Resident
Potential MT
Traveler
Potential International MT Traveler
1 17% (205) 4% (9) 44% (41) 60% (9)
2 26% (319) 12% (28) 21% (20) 20% (3)
3 20% (252) 17% (38) 18% (17) 13% (2)
4 16% (194) 17% (38) 9% (8) 7% (1)
5 8% (104) 16% (35) 4% (4) 0% (0)
6 7% (89) 12% (28) 1% (1) 0% (0)
7 6% (69) 22% (49) 3% (3) 0% (0)
The next set of results is based on visitation to each of the seven reservations in Montana. Since a large share of respondents have not visited many reservations, the reader needs to be cognizant of the sample size when viewing these results. Decisions based on small sample sizes are not recommended.

Indian Country Cultural and Heritage Tourism 2019
14
Blackfeet (Niitsitapi) Reservation5
Strong majorities of travelers passing through the Blackfeet Reservation indicate they have stopped on their way through. Led by Montana Residents, 84 percent indicated they stopped while 71 percent of the Avid Montana Traveler group did so. In the Qualtrics Panel groups, 75 percent of the Potential Montana Traveler group had stopped, and 67 percent of the Potential International Montana Traveler group had stopped. Of the 29 percent from the Avid Montana Traveler group who had not stopped, 87 percent of respondents indicated their reason for not stopping was “Did not plan to stop.” In the Montana Resident group, of the 16 percent who did not stop, 90 percent indicated “Did not plan to stop” was their reason. For the Qualtrics Panel group, of the 25 percent of the Potential Montana Traveler group who did not stop, 78 percent indicated their reason for not stopping was also “Did not plan to stop;” however, 44 percent either did not see anything of interest or could not find a place to eat. Only one respondent from the Potential International Montana Traveler group said they had not stopped on the Blackfeet Reservation, this respondent also indicated not planning to stop (Figure 12).
Figure 12: Blackfeet (Niitsitapi) Stopping
Have you stopped on the Blackfeet Reservation for any reason?
Avid MT Traveler
MT Resident
Potential MT Traveler
Potential International MT Traveler
Yes 71% (658) 84% (164) 75% (27) 67% (2)
No 29% (270) 16% (31) 25% (9) 33% (1)
Reasons for not stopping: Did not plan to stop
Did not see anything of interest Could not find a place to eat
Could not find a place to stay Could not find a place to fuel up
Other
87% (235)
7% (20) 0% (0) 0% (0) 0% (0)
11% (31)
90% (28)
3% (1) 0% (0) 0% (0) 3% (1) 6% (2)
78% (7) 22% (2) 22% (2) 0% (0)
11% (1) 0% (0)
100% (1)
0% (0) 0% (0) 0% (0) 0% (0) 0% (0)
5 Image Courtesy of VisitMT: www.visitmt.com/places-to-go/indian-nations.html

Indian Country Cultural and Heritage Tourism 2019
15
Activity Participation & Sites Visited Respondents were provided with a list of sites and activities available on the Blackfeet Reservation and asked to select all the sites and activities they had attended on past trips there. The activity with the highest participation was Glacier National Park Sun Tours with 32 percent of the Avid Montana Traveler group attending one of their tours, and 23 percent of the Montana Resident group attending these tours. In the Potential Montana Traveler group, 67 percent had attended a Glacier National Park Sun Tours trip. The second highest visited site for the ITRR Panel groups was the Museum of the Plains Indian with 27 percent of the Avid Montana Traveler group, 40 percent of the Montana Resident group visiting this site (Figure 13).
Figure 13: Blackfeet (Niitsitapi) Activities
While on the Blackfeet Reservation which of the following activities or areas have you participated in or visited?
Avid MT Traveler
MT Resident
Potential MT
Traveler
Potential International MT Traveler
Blackfeet Cultural History Tours 2% (16) 5% (9) 56% (15) 100% (2)
Blackfeet Outfitters 2% (14) 2% (3) 44% (12) 100% (2)
Glacier National Park Sun Tours 32% (210) 23% (37) 67% (18) 100% (2)
Blackfeet Heritage Center 16% (103) 18% (30) 41% (11) 50% (1)
Museum of the Plains Indian 27% (176) 40% (65) 52% (14) 50% (1)
Blackfeet Trail Tour and Blackfeet Language Sign Tour 1% (6) 2% (3) 30% (8) 0% (0)
Lodgepole Gallery and Tipi Village 6% (38) 6% (10) 22% (6) 0% (0)
Glacier Peaks Casino and Hotel 9% (58) 12% (19) 30% (8) 0% (0)
North American Indian Days 4% (28) 7% (11) 22% (6) 0% (0)
Heart Butte Celebration 1% (6) 4% (6) 7% (2) 0% (0)
None of these activities 45% (296) 44% (72) 4% (1) 0% (0)

Indian Country Cultural and Heritage Tourism 2019
16
Crow (Apsaalooke) Reservation6 Strong majorities of travelers passing through the Crow Reservation indicated they have stopped on their way through. Led by Montana Residents, 75 percent indicated they had stopped on the reservation. Within the Avid Montana Traveler group, 63 percent stopped. In the Potential Montana Traveler group, 73 percent stopped. The Potential International Montana Traveler sample was very small; only four people had visited the Crow Reservation, however, all four of these people had stopped. Across all three groups where travelers had not stopped, most respondents indicated their reason for not stopping was “Did not plan to stop” (Figure 14).
Figure 14: Crow (Apsaalooke) Stopping
Have you stopped on the Crow Reservation for any reason?
Avid MT Traveler
MT Resident
Potential MT Traveler
Potential International MT Traveler
Yes 63% (477) 75% (132) 73% (24) 100% (4)
No 37% (283) 25% (45) 27% (9) 0% (0)
Reason for not stopping: Did not plan to stop
Did not see anything of interest Could not find a place to eat
Could not find a place to stay Could not find a place to fuel up
Other
89% (253)
6% (17) 0% (0) 1% (2) 2% (5)
10% (28)
91% (41) 13% (6) 2% (1) 2% (1) 2% (1) 7% (3)
89% (8)
22% (2) 0% (0)
11% (1) 0% (0) 0% (0)
0% (0) 0% (0) 0% (0) 0% (0) 0% (0) 0% (0)
6 Image Courtesy of VisitMT: www.visitmt.com/places-to-go/indian-nations.html

Indian Country Cultural and Heritage Tourism 2019
17
Activity Participation & Sites Visited Respondents were provided with a list of sites and activities available on the Crow Reservation and asked to select all the sites and activities they had attended on past trips. The activity with the highest participation for the Avid Montana Traveler group was Realbird’s Little Bighorn Reenactment with 39 percent. This was also the highest participated in event for Montana Residents with 86 percent of respondents indicating participation in this event. In the Potential Montana Travelers group, 58 percent had visited Realbird’s Little Bighorn Reenactment. The highest visited activity for the Potential Montana Travelers was the Bighorn Canyon National Recreation Area and Yellowtail Dam. In the Potential Montana Traveler group 83 percent had visited this site. In the Potential International Montana Traveler group 75 percent had visited this site, although that was only three respondents. The Bighorn Canyon National Recreation Area and Yellowtail Dam were visited by 48 percent of Montana Residents, while only 19 percent of the Avid Montana Traveler group had visited these recreation areas (Figure 15).
Figure 15: Crow (Apsaalooke) Activities
While on the Crow Reservation which of the following activities or areas have you participated in or visited?
Avid MT Traveler
MT Resident
Potential MT
Traveler
Potential International MT Traveler
Bighorn Canyon National Recreation Area and Yellowtail Dam
19% (173) 48% (63) 83% (20) 75% (3)
Chief Plenty Coups State Park 6% (52) 39% (52) 21% (5) 50% (2)
Apsaalooke Tours 0% (3) 1% (1) 33% (8) 75% (3)
Crow Fair and Rodeo 2% (22) 14% (18) 38% (9) 75% (3)
Crow Native Days 1% (10) 3% (4) 29% (7) 25% (1)
Custer Battlefield Trading Post and Café 24% (217) 57% (75) 33% (8) 0% (0)
Realbird’s Little Bighorn Reenactment 39% (353) 86% (114) 58% (14) 25% (1)
Indian Battle Tours 1% (7) 7% (9) 13% (3) 25% (1)
Wellknown Buffalo Café and Gift Shop 2% (20) 3% (4) 38% (9) 0% (0)
Apsaalooke Community Market 4% (38) 7% (9) 38% (9) 0% (0)
None of these activities 1% (11) 2% (2) 8% (2) 0% (0)

Indian Country Cultural and Heritage Tourism 2019
18
Flathead (Selish Ktunaxa) Reservation7 Strong majorities across the panels who indicated they had been to or through the Flathead Reservation indicated they stopped. In the Avid Montana Traveler group, 67 percent had stopped, and 85 percent of the Montana Resident group had stopped. In the Potential Montana Traveler group, 64 percent had stopped, and 83 percent of the Potential International Montana Traveler group (five people) had stopped. For the Avid Montana Traveler and Montana Resident group, 86 percent and 87 percent, respectively, indicated their reason for not stopping was “Did not plan to stop.” For the Potential Montana Traveler group, reasons for not stopping was not as concentrated to one reason. The two reasons with the most responses were “Did not plan to stop” with 50 percent and “Did not see anything of interest” with 38 percent. There was only one respondent in the Potential International Montana Traveler group who indicated not stopping (Figure 16).
Figure 16: Flathead (Selish Ktunaxa) Stopping
Have you stopped on the Flathead Reservation for any reason?
Avid MT Traveler
MT Resident
Potential MT
Traveler
Potential International MT Traveler
Yes 67% (600) 85% (172) 64% (14) 83% (5)
No 33% (298) 15% (31) 36% (8) 17% (1)
Reason for not stopping: Did not plan to stop
Did not see anything of interest Could not find a place to eat
Could not find a place to stay Could not find a place to fuel up
Other
86% (256)
7% (21) 0% (1) 0% (1) 1% (4)
14% (41)
87% (27) 10% (3) 0% (0) 3% (1) 3% (1) 3% (1)
50% (4) 38% (3) 13% (1) 13% (1) 13% (1) 13% (1)
0% (0)
100% (1) 100% (1)
0% (0) 0% (0) 0% (0)
7 Image Courtesy of VisitMT: www.visitmt.com/places-to-go/indian-nations.html

Indian Country Cultural and Heritage Tourism 2019
19
Activity Participation & Sites Visited Respondents were provided with a list of sites and activities available on the Flathead Reservation and asked to select all the sites and activities they had attended on past trips. The highest visited site on the Flathead Reservation for both panels was Flathead Lake State Parks with 41 percent of the Avid Montana Traveler group and 71 percent of the Montana Resident group stopping at this location. In addition, 79 percent of the Potential Montana Traveler group and 100 percent of the Potential International Montana Traveler group (5 people) stopped at Flathead Lake State Park. The National Bison Range was the second highest visited site by Avid Montana Travelers with 28 percent and 65 percent of Montana Residents. (Figure 17).
Figure 17: Flathead (Selish Ktunaxa) Activities
While on the Flathead Reservation which of the following activities or areas have you participated in or visited?
Avid MT Traveler
MT Resident
Potential MT
Traveler
Potential International MT Traveler
Flathead Lake State Park 41% (314) 71% (122) 79% (11) 100% (5)
The National Bison Range/ Pablo National Wildlife Refuge
28% (214) 65% (111) 29% (4) 40% (2)
Ninepipe National Wildlife Refuge and State Wildlife Management Area
12% (96) 52% (90) 57% (8) 40% (2)
Mission Mountains Tribal Wilderness 6% (47) 16% (28) 36% (5) 40% (2)
SQELIX'U/AQFSMAKNI-K Cultural Center “the People’s Center”
3% (27) 16% (27) 36% (5) 20% (1)
Fort Connah historic site 3% (22) 7% (12) 43% (6) 20% (1)
St. Ignatius Mission 23% (177) 60% (103) 43% (6) 20% (1)
Kwa TaqNuk Resort Casino 4% (33) 29% (50) 21% (3) 20% (1)
Montana Journeys 2% (16) 1% (2) 29% (4) 20% (1)
Arlee 4th of July Celebration 3% (22) 13% (23) 21% (3) 0% (0)
Standing Arrow Powwow 1% (10) 8% (13) 14% (2) 20% (1)
People's Center Powwow 1% (7) 3% (5) 7% (1) 0% (0)
None of these activities 23% (179) 9% (16) 0% (0) 0% (0)
Indian Country Cultural and Heritage Tourism 2019
20
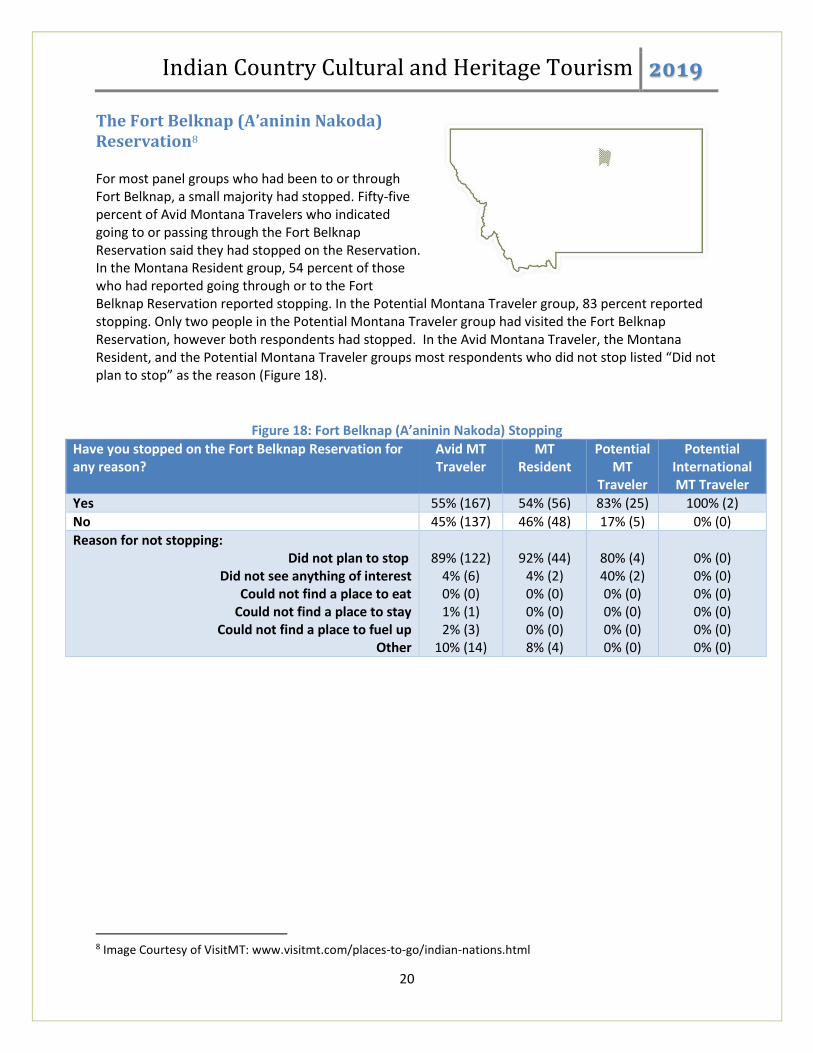
The Fort Belknap (A’aninin Nakoda) Reservation8 For most panel groups who had been to or through Fort Belknap, a small majority had stopped. Fifty-five percent of Avid Montana Travelers who indicated going to or passing through the Fort Belknap Reservation said they had stopped on the Reservation. In the Montana Resident group, 54 percent of those who had reported going through or to the Fort Belknap Reservation reported stopping. In the Potential Montana Traveler group, 83 percent reported stopping. Only two people in the Potential Montana Traveler group had visited the Fort Belknap Reservation, however both respondents had stopped. In the Avid Montana Traveler, the Montana Resident, and the Potential Montana Traveler groups most respondents who did not stop listed “Did not plan to stop” as the reason (Figure 18).
Figure 18: Fort Belknap (A’aninin Nakoda) Stopping
Have you stopped on the Fort Belknap Reservation for any reason?
Avid MT Traveler
MT Resident
Potential MT
Traveler
Potential International MT Traveler
Yes 55% (167) 54% (56) 83% (25) 100% (2)
No 45% (137) 46% (48) 17% (5) 0% (0)
Reason for not stopping: Did not plan to stop
Did not see anything of interest Could not find a place to eat
Could not find a place to stay Could not find a place to fuel up
Other
89% (122)
4% (6) 0% (0) 1% (1) 2% (3)
10% (14)
92% (44)
4% (2) 0% (0) 0% (0) 0% (0) 8% (4)
80% (4) 40% (2) 0% (0) 0% (0) 0% (0) 0% (0)
0% (0) 0% (0) 0% (0) 0% (0) 0% (0) 0% (0)
8 Image Courtesy of VisitMT: www.visitmt.com/places-to-go/indian-nations.html

Indian Country Cultural and Heritage Tourism 2019
21
Activity Participation & Sites Visited Respondents were provided with a list of sites and activities available on the Fort Belknap Reservation and asked to select all the sites and activities they had attended on past trips. Most respondents in the Avid Montana Traveler and Montana Resident groups had not participated in or visited any of the sites and activities listed (65% and 52% respectively). In the Potential Montana Traveler group 72 percent of respondents had visited the Fort Belknap Buffalo and Area Tours and 60 percent had visited the Mission Canyon/Natural Bridge area (Figure 19).
Figure 19: Fort Belknap (A’aninin Nakoda) Activities
While on the Fort Belknap Reservation which of the following activities or areas have you participated in or visited?
Avid MT Traveler
MT Resident
Potential MT
Traveler
Potential International MT Traveler
Mission Canyon/Natural Bridge 19% (31) 23% (13) 60% (15) 50% (1)
St. Paul’s Mission Church 11% (19) 20% (11) 48% (12) 50% (1)
Fort Belknap Buffalo and Area Tours 4% (6) 9% (5) 72% (18) 100% (2)
Fort Belknap Tourism Office and Information Center 13% (22) 16% (9) 20% (5) 50% (1)
Aaniih Nakoda “Discover Fort Belknap” Tours 1% (2) 2% (1) 52% (13) 50% (1)
Fort Belknap Casino 4% (6) 7% (4) 32% (8) 0% (0)
Milk River Indian Days 4% (6) 4% (2) 40% (10) 50% (1)
Wasay Wakpa Wachi Powwow 1% (1) 2% (1) 24% (6) 50% (1)
Hays Community Powwow 3% (5) 2% (1) 20% (5) 50% (1)
Chief Joseph Powwow 2% (4) 11% (6) 16% (4) 0% (0)
Fort Belknap Veteran Powwow 2% (3) 4% (2) 16% (4) 0% (0)
None of these activities 65% (108) 52% (29) 4% (1) 0% (0)

Indian Country Cultural and Heritage Tourism 2019
22
The Fort Peck (Nakoda Dakota) Reservation9 Majorities of all panel groups that traveled through Fort Peck Reservation indicated they stopped while there. Out of the respondents who indicated they had been to or through the Fort Peck Reservation, 60 percent in the Avid Montana Traveler group had stopped, and 66 percent of Montana Residents reported they had stopped. In the Potential Montana Traveler group 78 percent reported they had stopped. The sample for the Potential International Montana Traveler group was small with only three respondents reporting having gone to the Fort Peck Reservation. Two of those three respondents reported having stopped. Of those respondents who had not stopped, most listed their reason as “Did not plan to stop” (Figure 20).
Figure 20: Fort Peck (Nakoda Dakota) Stopping
Have you stopped on the Fort Peck Reservation for any reason?
Avid MT Traveler
MT Resident
Potential MT
Traveler
Potential International MT Traveler
Yes 60% (216) 66% (67) 78% (21) 67% (2)
No 40% (142) 34% (34) 22% (6) 33% (1)
Reason for not stopping: Did not plan to stop
Did not see anything of interest Could not find a place to eat
Could not find a place to stay Could not find a place to fuel up
Other
71% (125)
3% (5) 0% (0) 1% (1) 1% (2)
11% (19)
91% (31) 12% (4) 0% (0) 0% (0) 0% (0) 6% (2)
50% (3) 50% (3) 17% (1) 0% (0) 0% (0)
17% (1)
0% (0) 0% (0)
100% (1) 0% (0) 0% (0) 0% (0)
9 Image Courtesy of VisitMT: www.visitmt.com/places-to-go/indian-nations.html

Indian Country Cultural and Heritage Tourism 2019
23
Activity Participation & Sites Visited Respondents were provided with a list of sites and activities available on the Fort Peck Reservation and asked to select all the sites and activities they had attended. The most visited site was the Fort Peck Reservoir and Recreation Area, 50 percent of the Avid Montana Traveler group, 76 percent of the Montana Resident group, and 62 percent of the Potential Montana Traveler group had visited this site. The Fort Peck Assiniboine and Sioux Culture Center and Museum was the second most visited site for the Potential Montana Traveler group (57%) and the Montana Resident group (21%) (Figure 21).
Figure 21: Fort Peck (Nakoda Dakota) Activities
While on the Fort Peck Reservation which of the following activities or areas have you participated in or visited?
Avid MT Traveler
MT Resident
Potential MT
Traveler
Potential International MT Traveler
Fort Peck Reservoir and Recreation Area 50% (108) 76% (51) 62% (13) 0% (0)
Fort Peck Assiniboine and Sioux Culture Center and Museum 14% (31) 21% (14) 57% (12) 50% (1)
Silverwolf Casino 3% (7) 7% (5) 24% (5) 50% (1)
Dakota Trading Post 15% (32) 9% (6) 33% (7) 0% (0)
Poplar Indian Days 4% (8) 4% (3) 33% (7) 0% (0)
Fort Kipp Celebration 2% (5) 3% (2) 33% (7) 50% (1)
Turns Around Celebration 2% (4) 4% (3) 19% (4) 50% (1)
Wadopana Celebration 1% (2) 6% (4) 29% (6) 0% (0)
Badlands Celebration 3% (7) 4% (3) 10% (2) 50% (1)
Red Bottom Celebration 3% (6) 7% (5) 5% (1) 0% (0)
None of these activities 38% (82) 21% (14) 5% (1) 0% (0)

Indian Country Cultural and Heritage Tourism 2019
24
Northern Cheyenne (Tsetsehesestehase Sotaahe) Reservation10 The majority of most panel groups who had traveled through the Northern Cheyenne Reservation indicated they stopped. Fifty-four percent of the Avid Montana Traveler group and 66 percent of the Montana Resident group indicated they had stopped when passing through the Northern Cheyenne Reservation. In the Potential Montana Traveler group, 72 percent indicated they had stopped when passing through the Northern Cheyenne Reservation. In the Potential International Montana Traveler group, only five respondents had visited; two of these five respondents indicated they had stopped. For three of the four groups, most respondents indicated “Did not plan to stop” as their reason for not stopping. (Figure 22).
Figure 22: Northern Cheyenne (Tsetsehesestehase Sotaahe) Stopping
Have you stopped on the Northern Cheyenne Reservation for any reason?
Avid MT Traveler
MT Resident
Potential MT
Traveler
Potential International MT Traveler
Yes 54% (243) 66% (83) 72% (23) 40% (2)
No 46% (204) 34% (43) 28% (9) 60% (3)
Reason for not stopping: Did not plan to stop
Did not see anything of interest Could not find a place to eat
Could not find a place to stay Could not find a place to fuel up
Other
78% (192)
3% (8) 0% (0) 0% (0) 0% (1)
7% (18)
93% (40)
5% (2) 0% (0) 0% (0) 0% (0) 9% (4)
56% (5) 11% (1) 11% (1) 33% (3) 11% (1) 11% (1)
33% (1) 33% (1) 33% (1) 67% (2) 0% (0) 0% (0)
10 Image Courtesy of VisitMT: www.visitmt.com/places-to-go/indian-nations.html

Indian Country Cultural and Heritage Tourism 2019
25
Activity Participation & Sites Visited Respondents were provided with a list of sites and activities available on the Northern Cheyenne Reservation and asked to select all the sites and activities they had attended on past trips. In the Avid Montana Traveler group, 55 percent of respondents did not participate in any of the provided activities. In the Montana Resident group, 47 percent had not participated in any of these activities. For the Potential Montana Traveler group, a higher percentage of respondents had participated in more activities. The highest participated in activity was the Memorial Day Powwow (61 percent). The Chief Two Moons Monument had also been visited by much of the Potential Montana Traveler group (57 percent) (Figure 23).
Figure 23: Northern Cheyenne (Tsetsehesestehase Sotaahe) Activities
While on the Northern Cheyenne Reservation which of the following activities or areas have you participated in or visited?
Avid MT Traveler
MT Resident
Potential MT
Traveler
Potential International MT Traveler
Chief Two Moons Monument 9% (28) 18% (15) 57% (13) 0% (0)
Northern Cheyenne Chamber of Commerce 2% (7) 8% (7) 35% (8) 100% (2)
St. Labre Mission and Cheyenne Museum 8% (27) 34% (28) 48% (11) 0% (0)
Charging Horse Casino and Restaurant 4% (12) 8% (7) 52% (12) 0% (0)
Warrior Trail Jewelry and Gifts 4% (13) 7% (6) 22% (5) 100% (2)
Northern Cheyenne 4th of July Powwow 2% (5) 5% (4) 43% (10) 0% (0)
Memorial Day Powwow 1% (2) 5% (4) 61% (14) 0% (0)
White River Days Celebration 1% (2) 1% (1) 35% (8) 0% (0)
Ashland Labor Day Powwow 1% (3) 2% (2) 9% (2) 0% (0)
None of these activities 55% (178) 47% (39) 4% (1) 0% (0)

Indian Country Cultural and Heritage Tourism 2019
26
Rocky Boy’s (Annishinabe Ne-i-yah-wahk) Reservation11 Fewer than half (44%) of Avid Montana Travelers indicated they stopped at Rocky Boy’s Reservation while traveling through. Montana Residents were more likely (53%) to indicate they stopped while traveling through. Eighty-four percent of the Potential Montana Traveler group had stopped. Only two respondents from the Potential International Montana Traveler group indicated having been to or through Rocky Boy’s Reservation; both respondents had stopped. Most respondents who had not stopped said their reason was “Did not plan to stop” (Figure 24).
Figure 24: Rocky Boy’s (Annishinabe Ne-i-yah-wahk) Stopping
Have you stopped on Rocky Boy’s Reservation for any reason?
Avid MT Traveler
MT Resident
Potential MT
Traveler
Potential International MT Traveler
Yes 44% (81) 53% (57) 84% (26) 100% (2)
No 56% (102) 47% (50) 16% (5) 0% (0)
Reason for not stopping: Did not plan to stop
Did not see anything of interest Could not find a place to eat
Could not find a place to stay Could not find a place to fuel up
Other
86% (88)
9% (9) 0% (0) 1% (1) 3% (3)
12% (12)
86% (43) 16% (8) 6% (3) 6% (3) 8% (4) 8% (4)
40% (2) 20% (1) 20% (1) 40% (2) 0% (0) 0% (0)
0% (0) 0% (0) 0% (0) 0% (0) 0% (0) 0% (0)
11 Image Courtesy of VisitMT: www.visitmt.com/places-to-go/indian-nations.html

Indian Country Cultural and Heritage Tourism 2019
27
Activity Participation & Sites Visited Respondents were provided with a list of sites and activities available on the Rocky Boy’s Reservation and asked to select all the sites and activities they had attended on past trips. In the Avid Montana Traveler group, 39 percent of respondents had not participated in any of the listed activities. In the Montana Resident group, 70 percent had not participated in any of the activities. All the Potential Montana Traveler group respondents had participated in at least one of the listed activities. The most visited site for this group was the Chippewa-Cree Recreation Area. Eighty-eight percent of the Potential Montana Traveler group had visited this site (Figure 25).
Figure 25: Rocky Boy’s (Annishinabe Ne-i-yah-wahk) Activities
While on the Rocky Boy’s Reservation which of the following activities or areas have you participated in or visited?
Avid MT Traveler
MT Resident
Potential MT
Traveler
Potential International MT Traveler
Chippewa-Cree Recreation Area 9% (13) 16% (9) 88% (23) 0% (0)
Northern Winz Casino and Hotel 11% (15) 12% (7) 58% (15) 50% (1)
Rocky Boy's Powwow 1% (2) 9% (5) 50% (13) 50% (1)
None of these activities 39% (54) 70% (40) 0% (0) 0% (0)
Conclusions & Recommendations As the tribal communities of Montana make strides in showcasing their histories and cultures to other
Montanans and nonresident visitors to the state, it becomes valuable to better understand the
interests, values, and traveling preferences of visitors and potential visitors. To begin to meet this need,
this project surveyed four groups of potential visitors to the seven Native American reservations found
in Montana. These groups consisted of Montanans, frequent visitors to Montana who have been coined
‘Avid Montana Visitors,’ potential domestic (and Canadian) visitors who may or may not have been to
Montana, as well as international travelers who also may or may not have been to Montana in the past.
The four groups have been reported here separately as they have identifiably distinct differences in not
only their frequency of travel in or to Montana, but also in their preferences. They each make up
portions of the Montana visitor or potential visitor.
Across many of the general traveling preference questions, those identified as Avid Montana travelers
mirror the preferences of Montanans. Additionally, these two groups were often distinctly different
than the other ‘potential’ travelers in categories that are often thought of as of particular interest to
Montana visitors. For example, the Montana Resident and Avid Montana Travelers were more likely to
indicate that they enjoyed visiting small rural towns, visiting cultural and historic sites, eating in local
restaurants, and viewing wildlife in natural settings than were their counterparts.
In addition to general traveling preferences, respondents who had been to Montana were asked about
stopping at any of the reservations they had been through and any activities they may have taken part in
or sites visited. The majority of Montanans surveyed have been through Blackfeet, Crow, Flathead, and
Northern Cheyenne Reservations. As for the Avid Montana Traveler, the majority has been through
Blackfeet, Crow, and Flathead Reservations. For the potential Montana Travelers, the reservation most
frequently traveled through was Blackfeet for US and Canadian visitors and Flathead for international
travelers. Across each reservation traveled through, a majority of all travelers surveyed indicated that

Indian Country Cultural and Heritage Tourism 2019
28
they did stop. The likelihood of stopping was highest at Blackfeet (73%) followed by Flathead (70%)
(Figure 26). For those travelers not stopping, by far the most frequent answer as to why not, was that
they did not plan to stop. Non-trivial proportions of respondents across the reservations did indicate
that one reason for not stopping was they did not see anything of interest.
Figure 26: Summary of Frequency of Stopping
Native American Reservation:
Did You Stop While Traveling Through the
Listed Reservation? If Not, Why Not?
Yes No Did not plan to stop
Blackfeet (Niitsitapi) 73% 27% 87%
Crow (Apsaalooke) 65% 35% 90%
Flathead (Selish Ktunaxa) 70% 30% 85%
Fort Belknap (A'aninin Nakoda) 57% 43% 89%
Fort Peck (Nakoda Dakota) 63% 37% 87%
Northern Cheyenne (Tsetsehesestehase Sotaahe) 58% 42% 92%
Rocky Boy's (Annishinabe Ne-i-yah-wahk) 51% 49% 87%
Each reservation and the surrounding area possesses its own unique set of activities and sites to see.
Travelers who had been to or through a particular reservation and stopped were asked about a set of
sites or activities in which they may have participated on or near the reservation (Figure 27). While most
of the major sites or activities are provided by or directly related to the associated tribes, others take
place off the reservation.
Figure 27: Summary of Frequent Sites Visited
Native American Reservation Most Frequented Site or Activity Proportion No Activity or
Site Visited
Blackfeet (Niitsitapi)
Glacier National Park Sun Tours 31% 43%
Crow (Apsaalooke)
Realbird's Little Bighorn Reenactment
76% 2%
Flathead (Selish Ktunaxa)
Flathead Lake State Park 57% 25%
Fort Belknap (A'aninin Nakoda)
Mission Canyon/Natural Bridge 24% 55%
Fort Peck (Nakoda Dakota)
Fort Peck Reservoir and Recreation Area
56% 32%
Northern Cheyenne (Tsetsehesestehase Sotaahe)
St. Labre Mission and Cheyenne Museum
19% 62%
Rocky Boy's (Annishinabe Ne-i-yah-wahk) Chippewa-Cree Recreation Area 27% 57%

Indian Country Cultural and Heritage Tourism 2019
29
Across all four groups surveyed, strong majorities indicated that they are interested or even very interested in exploring sites and experiences related to Native American culture and history. Even so, a quarter to a half of travelers do not stop while passing through a given reservation. Multiple respondents, in written comments, indicated they weren’t sure if or when they were on a reservation, or they didn’t stop because they didn’t know what was available and it wasn’t on their planned trip. This disconnect between travelers stated preferences for experiences and revealed actions provides an impetus and opportunity to increase the visibility of offerings to travelers throughout their journeys in the state.

Indian Country Cultural and Heritage Tourism 2019
30
Appendix A: Survey instrument
Cultural and Heritage Tourism Thank you for taking the time to participate in our survey. This survey is being conducted by the Institute for Tourism and Recreation Research at the University of Montana. In this survey, we are interested in your travel preferences and experiences. Many are related to culture and history. The study is completely anonymous. Your responses are never connected to you or your email. Are you a U.S. resident?
o Yes
o No Select current state of residence
▼ Alabama ... I do not reside in the United States
Please enter Zip Code
________________________________________________________________ Are you a Canadian resident?
o Yes
o No Please enter Province
▼ Alberta ... Yukon
Please enter Country of residence
▼ Afghanistan ... Zimbabwe

Indian Country Cultural and Heritage Tourism 2019
31
Thinking about your own preferences while traveling, please rate your level of agreement with the following statements:
Strongly disagree
Disagree Neither agree nor disagree
Agree Strongly
agree
I enjoy visiting small, rural towns. o o o o o
I enjoy (or would enjoy) visiting Native American communities. o o o o o
I enjoy visiting cultures different from my own. o o o o o
When choosing to stay in hotels/motels, I tend to stay at those locally owned whenever possible (i.e.,
non-chain).
o o o o o
I enjoy staying in rustic accommodations (e.g., cabins,
teepees, yurts). o o o o o
I enjoy visiting cultural and historical sites. o o o o o
I typically prefer local restaurants over chains. o o o o o
I enjoy camping in primitive campgrounds (with limited or no amenities such as bathrooms or
running water)
o o o o o
I enjoy camping in developed campgrounds (with amenities such as showers, RV pads and RV hook-ups).
o o o o o
I enjoy viewing wildlife in natural settings. o o o o o

Indian Country Cultural and Heritage Tourism 2019
32
If you were to travel in the U.S., how interested would you be in visiting or participating in the following Native American sites or activities?
Not at all
interested Slightly
interested Moderately interested
Very interested Extremely interested
Museums/heritage centers o o o o o
Fairs or markets with native crafts to
view or purchase o o o o o
Restaurants/dining featuring Native American food
o o o o o
Special events/festivals
related to Native American culture
o o o o o
Demonstrations/live cultural
performances (e.g., cooking, arts,
weaponry)
o o o o o
Oral history of a tribe o o o o o
Immersive experience (e.g.,
powwows, dances) o o o o o
Half or full day guided experiences o o o o o
Overnight guided experiences o o o o o

Indian Country Cultural and Heritage Tourism 2019
33
Please indicate your agreement with the following statements regarding possible future trips in the United States…
Strongly disagree
Somewhat disagree
Neither agree nor disagree
Somewhat agree
Strongly agree
I would seek out a Native American community to visit a native cultural
event (e.g., dance, powwow). o o o o o
I would like to lead myself through interpretive opportunities (e.g.,
hiking trail with interpretive signs, driving personal vehicle on roads
with interpretive pullouts).
o o o o o
I would choose to visit a Native American Reservation or community
for gambling opportunities. o o o o o
I would like to visit a Native American community for bison viewing
opportunities. o o o o o
I would like to visit a Native American community for other wildlife viewing
opportunities. o o o o o
If I am participating in an outdoor activity on Native American lands,
cultural interpretation of the area is important.
o o o o o
If I had information on the scenic roads through Native American
lands, I would include this route in my activities.
o o o o o

Indian Country Cultural and Heritage Tourism 2019
34
Some experiences on Native American lands may require a guide. How likely would you be to take the following trips?
Extremely
unlikely Somewhat
unlikely Neither likely nor unlikely
Somewhat likely Extremely likely
A guided horseback trip
with a tribal tour guide.
o o o o o
A guided interpretive bus
tour with a tribal tour
guide.
o o o o o
A guided trip on an Off-Highway Vehicle (OHV) with a tribal tour guide.
o o o o o
A guided nature hike with a tribal tour
guide.
o o o o o
A guided hike of cultural sites with a tribal
guide.
o o o o o
A guided fishing trip with a tribal
guide. o o o o o
A guided hunting trip into
the back-country with a
tribal guide.
o o o o o

Indian Country Cultural and Heritage Tourism 2019
35
Have you ever visited Montana (highlighted above) in your adult life?
o Yes
o No How many times have you visited MT as an adult?
▼ 1 ... More than 50
In what year was your last trip to Montana?
▼ 2019 ... Before 1980
In what season was your last trip to Montana?
▼ Winter ... Fall

Indian Country Cultural and Heritage Tourism 2019
36
How interested would you be in exploring sites and experiences related to Native American culture and history on Native American Reservations in Montana? (Select One)
o Very uninterested
o Uninterested
o Neither interested nor uninterested
o Interested
o Very interested
Referring to the map of Montana above, which Native American Reservation(s) have you ever traveled to or through? (Select all that apply.)
▢ Blackfeet
▢ Crow
▢ Flathead
▢ Fort Belknap
▢ Fort Peck
▢ Northern Cheyenne
▢ Rocky Boy's
▢ None of these Statements below repeated for each reservation marked above:

Indian Country Cultural and Heritage Tourism 2019
37
You indicated that you have previously traveled through the [Name] reservation in MT, please answer the following questions with respect to the [Name] reservation. Have you ever stopped for any reason while on the [Name] reservation (e.g. Filled up for gas, spent the night, etc.)?
o Yes
o No Why did you choose not to stop on the [Name] reservation? (Select all that apply)
▢ Did not plan to stop
▢ Did not see anything of interest
▢ Could not find a place to eat
▢ Could not find a place to stay
▢ Could not find a place to fuel up
▢ Other, please specify ________________________________________________ Blackfeet Shown as example: While on the Blackfeet (Niitsitapi) reservation which of the following activities or areas have you ever participated in or visited? (Select all that apply)
▢ Blackfeet Cultural History Tours
▢ Blackfeet Outfitters
▢ Glacier National Park Sun Tours
▢ Blackfeet Heritage Center
▢ Museum of the Plains Indian
▢ Blackfeet Trail Tour and Blackfeet Language Sign Tour
▢ Lodgepole Gallery and Tipi Village
▢ Glacier Peaks Casino and Hotel
▢ North American Indian Days (second week of July)
▢ Heart Butte Celebration (first weekend of September)
▢ None of these activities You indicated that you have not traveled to or through any of the reservations in Montana, why not? (Select all that apply)
▢ Did not pass through any on planned route of travel
▢ Was not aware of activities available in these areas
▢ Was not interested in activities available
▢ Other, please specify ________________________________________________ What is your age (years)?

Indian Country Cultural and Heritage Tourism 2019
38
What is your gender? What is your race/ethnicity (select all that apply)?
▢ White
▢ Black or African American
▢ American Indian or Alaska Native
▢ Asian
▢ Native Hawaiian or Pacific Islander
▢ Latino/Hispanic
▢ Other
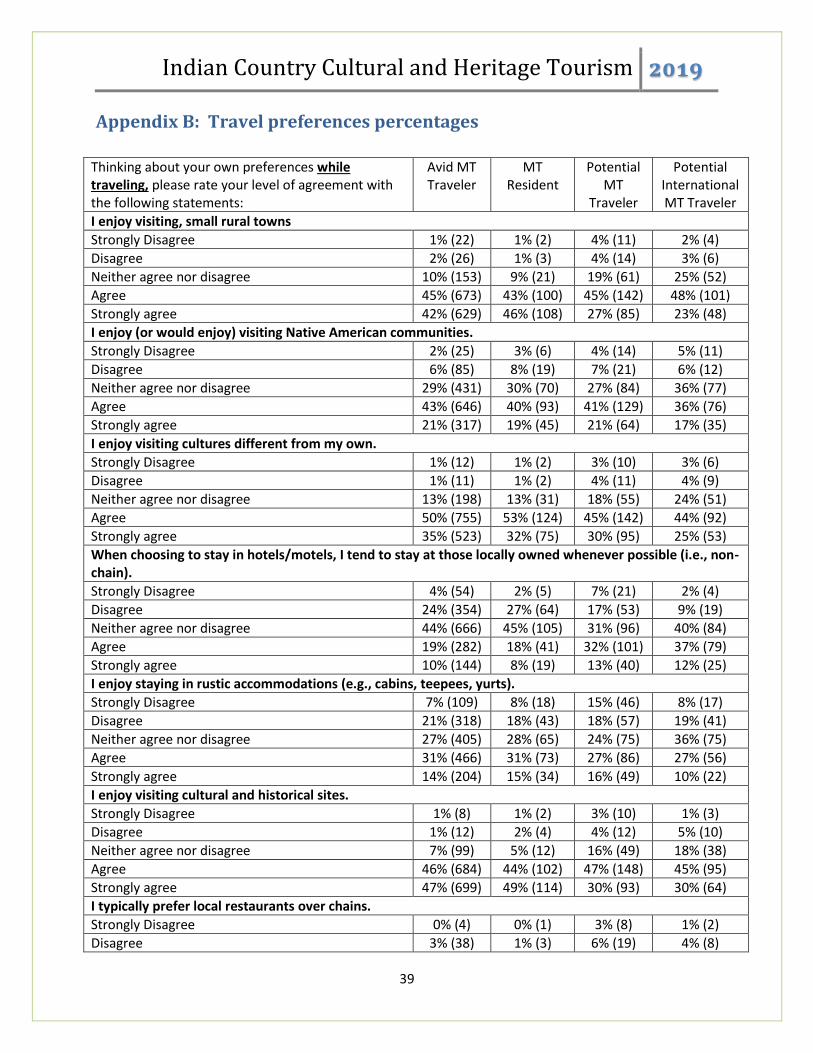
Indian Country Cultural and Heritage Tourism 2019
39
Appendix B: Travel preferences percentages
Thinking about your own preferences while traveling, please rate your level of agreement with the following statements:
Avid MT Traveler
MT Resident
Potential MT
Traveler
Potential International MT Traveler
I enjoy visiting, small rural towns
Strongly Disagree 1% (22) 1% (2) 4% (11) 2% (4)
Disagree 2% (26) 1% (3) 4% (14) 3% (6)
Neither agree nor disagree 10% (153) 9% (21) 19% (61) 25% (52)
Agree 45% (673) 43% (100) 45% (142) 48% (101)
Strongly agree 42% (629) 46% (108) 27% (85) 23% (48)
I enjoy (or would enjoy) visiting Native American communities.
Strongly Disagree 2% (25) 3% (6) 4% (14) 5% (11)
Disagree 6% (85) 8% (19) 7% (21) 6% (12)
Neither agree nor disagree 29% (431) 30% (70) 27% (84) 36% (77)
Agree 43% (646) 40% (93) 41% (129) 36% (76)
Strongly agree 21% (317) 19% (45) 21% (64) 17% (35)
I enjoy visiting cultures different from my own.
Strongly Disagree 1% (12) 1% (2) 3% (10) 3% (6)
Disagree 1% (11) 1% (2) 4% (11) 4% (9)
Neither agree nor disagree 13% (198) 13% (31) 18% (55) 24% (51)
Agree 50% (755) 53% (124) 45% (142) 44% (92)
Strongly agree 35% (523) 32% (75) 30% (95) 25% (53)
When choosing to stay in hotels/motels, I tend to stay at those locally owned whenever possible (i.e., non-chain).
Strongly Disagree 4% (54) 2% (5) 7% (21) 2% (4)
Disagree 24% (354) 27% (64) 17% (53) 9% (19)
Neither agree nor disagree 44% (666) 45% (105) 31% (96) 40% (84)
Agree 19% (282) 18% (41) 32% (101) 37% (79)
Strongly agree 10% (144) 8% (19) 13% (40) 12% (25)
I enjoy staying in rustic accommodations (e.g., cabins, teepees, yurts).
Strongly Disagree 7% (109) 8% (18) 15% (46) 8% (17)
Disagree 21% (318) 18% (43) 18% (57) 19% (41)
Neither agree nor disagree 27% (405) 28% (65) 24% (75) 36% (75)
Agree 31% (466) 31% (73) 27% (86) 27% (56)
Strongly agree 14% (204) 15% (34) 16% (49) 10% (22)
I enjoy visiting cultural and historical sites.
Strongly Disagree 1% (8) 1% (2) 3% (10) 1% (3)
Disagree 1% (12) 2% (4) 4% (12) 5% (10)
Neither agree nor disagree 7% (99) 5% (12) 16% (49) 18% (38)
Agree 46% (684) 44% (102) 47% (148) 45% (95)
Strongly agree 47% (699) 49% (114) 30% (93) 30% (64)
I typically prefer local restaurants over chains.
Strongly Disagree 0% (4) 0% (1) 3% (8) 1% (2)
Disagree 3% (38) 1% (3) 6% (19) 4% (8)

Indian Country Cultural and Heritage Tourism 2019
40
Neither agree nor disagree 11% (170) 9% (22) 24% (75) 25% (51)
Agree 37% (558) 37% (85) 42% (130) 42% (87)
Strongly agree 49% (728) 52% (121) 25% (79) 29% (60)
I enjoy camping in primitive campgrounds (with limited or no amenities such as bathrooms or running water).
Strongly Disagree 23% (337) 15% (35) 27% (85) 22% (47)
Disagree 30% (447) 20% (46) 22% (70) 26% (54)
Neither agree nor disagree 17% (253) 24% (57) 20% (64) 27% (56)
Agree 19% (284) 24% (57) 18% (55) 19% (39)
Strongly agree 12% (175) 17% (39) 12% (39) 7% (14)
I enjoy camping in developed campgrounds (with amenities such as showers, RV pads and RV hook-ups).
Strongly Disagree 9% (139) 10% (23) 16% (49) 14% (29)
Disagree 16% (245) 9% (22) 11% (35) 12% (26)
Neither agree nor disagree 24% (365) 26% (61) 20% (63) 31% (65)
Agree 37% (554) 42% (97) 35% (109) 33% (69)
Strongly agree 13% (196) 13% (30) 18% (55) 10% (21)
I enjoy viewing wildlife in natural settings.
Strongly Disagree 1% (9) 0% (0) 5% (15) 1% (3)
Disagree 0% (5) 0% (0) 4% (11) 3% (7)
Neither agree nor disagree 1% (22) 1% (3) 12% (38) 23% (49)
Agree 28% (415) 28% (66) 40% (125) 41% (87)
Strongly agree 70% (1051)
70% (164) 39% (123) 30% (64)
If you were to travel in the U.S., how interested would you be in visiting or participating in the following Native American sites or activities?
Avid MT Traveler
MT Resident
Potential MT
Traveler
Potential International MT Traveler
Museums/Heritage centers
Not at all interested 2% (35) 4% (9) 5% (17) 7% (15)
Slightly interested 9% (131) 8% (18) 11% (33) 11% (24)
Moderately interested 29% (438) 28% (65) 29% (92) 31% (65)
Very interested 35% (525) 32% (75) 31% (96) 35% (74)
Extremely interested 24% (361) 28% (64) 24% (74) 16% (33)
Fairs or markets with native crafts to view or purchase
Not at all interested 5% (78) 6% (15) 7% (21) 7% (14)
Slightly interested 10% (155) 13% (29) 14% (43) 9% (19)
Moderately interested 32% (471) 28% (64) 24% (76) 31% (66)
Very interested 33% (495) 30% (70) 34% (107) 35% (73)
Extremely interested 19% (290) 23% (54) 21% (66) 18% (39)
Restaurants/dining featuring Native American food
Not at all interested 5% (79) 6% (13) 8% (24) 7% (15)
Slightly interested 13% (194) 16% (38) 14% (44) 8% (17)
Moderately interested 30% (453) 25% (58) 25% (78) 29% (61)

Indian Country Cultural and Heritage Tourism 2019
41
Very interested 34% (513) 29% (67) 30% (93) 37% (79)
Extremely interested 17% (253) 24% (55) 23% (73) 18% (39)
Special events/festivals related to Native American culture
Not at all interested 5% (70) 5% (11) 8% (27) 9% (18)
Slightly interested 14% (210) 15% (35) 13% (44) 13% (27)
Moderately interested 29% (431) 28% (64) 20% (70) 31% (66)
Very interested 33% (498) 30% (69) 31% (106) 27% (58)
Extremely interested 19% (284) 23% (53) 19% (66) 20% (42)
Demonstrations/live cultural performances (e.g., cooking, arts, weaponry)
Not at all interested 5% (70) 5% (12) 9% (28) 9% (18)
Slightly interested 13% (194) 14% (33) 13% (41) 11% (23)
Moderately interested 29% (437) 25% (57) 25% (77) 32% (67)
Very interested 33% (491) 33% (76) 30% (93) 32% (67)
Extremely interested 20% (299) 23% (54) 23% (73) 17% (36)
Oral history of a tribe
Not at all interested 6% (92) 5% (12) 11% (33) 10% (20)
Slightly interested 14% (215) 19% (44) 14% (44) 12% (25)
Moderately interested 28% (421) 19% (45) 24% (76) 29% (60)
Very interested 31% (466) 32% (75) 34% (105) 34% (71)
Extremely interested 20% (298) 24% (55) 17% (54) 16% (34)
Immersive experience (e.g., powwows, dances)
Not at all interested 12% (185) 10% (22) 12% (39) 12% (26)
Slightly interested 18% (275) 16% (37) 15% (48) 19% (40)
Moderately interested 30% (441) 26% (61) 24% (76) 27% (57)
Very interested 24% (356) 28% (64) 30% (93) 27% (58)
Extremely interested 16% (233) 20% (47) 18% (57) 14% (30)
Half or full day guided experiences
Not at all interested 12% (181) 14% (33) 8% (26) 9% (19)
Slightly interested 22% (328) 23% (53) 12% (36) 10% (22)
Moderately interested 30% (454) 29% (68) 26% (80) 27% (57)
Very interested 24% (352) 20% (46) 36% (112) 35% (74)
Extremely interested 12% (176) 14% (32) 19% (58) 18% (38)
Overnight guided experiences
Not at all interested 28% (416) 28% (64) 18% (57) 11% (22)
Slightly interested 25% (373) 24% (55) 14% (45) 16% (34)
Moderately interested 25% (371) 25% (59) 22% (69) 26% (55)
Very interested 14% (206) 14% (33) 24% (75) 31% (64)
Extremely interested 8% (118) 9% (21) 21% (67) 16% (34)

Indian Country Cultural and Heritage Tourism 2019
42
Please indicate your agreement with the following statements regarding possible future trips in the United States…
Avid MT Traveler
MT Resident
Potential MT
Traveler
Potential International MT Traveler
I would seek out a Native American community to visit a native cultural event (e.g., dance, powwow).
Strongly Disagree 10% (149) 11% (25) 12% (38) 8% (16)
Disagree 15% (218) 15% (34) 9% (28) 10% (22)
Neither agree nor disagree 31% (455) 28% (64) 22% (69) 42% (88)
Agree 31% (454) 31% (72) 36% (113)
24% (51)
Strongly agree 13% (186) 15% (34) 21% (64) 16% (34)
I would like to lead myself through interpretive opportunities (e.g., hiking trail with interpretive signs, driving personal vehicle on roads with interpretive pullouts).
Strongly Disagree 3% (44) 3% (8) 10% (32) 8% (17)
Disagree 5% (79) 5% (11) 13% (39) 15% (31)
Neither agree nor disagree 14% (202) 13% (29) 23% (73) 36% (76)
Agree 47% (682) 46% (105) 38% (120)
26% (54)
Strongly agree 31% (455) 33% (76) 15% (48) 15% (32)
I would choose to visit a Native American Reservation or community for gambling opportunities.
Strongly Disagree 53% (772) 59% (134) 24% (75) 25% (52)
Disagree 18% (259) 16% (37) 13% (40) 14% (29)
Neither agree nor disagree 14% (205) 11% (25) 17% (54) 33% (69)
Agree 11% (168) 12% (27) 27% (85) 20% (41)
Strongly agree 4% (58) 3% (6) 19% (59) 9% (19)
I would like to visit a Native American community for bison viewing opportunities.
Strongly Disagree 5% (69) 7% (17) 10% (30) 7% (15)
Disagree 8% (115) 9% (20) 9% (28) 9.6% (50)
Neither agree nor disagree 22% (323) 32% (73) 21% (67) 27.2% (142)
Agree 39% (578) 34% (79) 39% (121)
35.8% (187)
Strongly agree 26% (379) 17% (40) 21% (66) 18.9% (99)
I would like to visit a Native American community for other wildlife viewing opportunities.
Strongly Disagree 3% (49) 5% (11) 9% (27) 5% (11)
Disagree 5% (67) 6% (13) 5% (16) 4% (8)
Neither agree nor disagree 17% (305) 23% (52) 17% (53) 29% (61)
Agree 42% (618) 42% (96) 47% (147)
42% (89)
Strongly agree 33% (476) 25% (56) 22% (70) 20% (42)
If I am participating in an outdoor activity on Native American lands, cultural interpretation of the area is important.
Strongly Disagree 3% (46) 6% (13) 7% (23) 8% (16)
Disagree 6% (89) 7% (16) 9% (29) 6% (12)
Neither agree nor disagree 19% (283) 19% (43) 22% (68) 37% (78)

Indian Country Cultural and Heritage Tourism 2019
43
Agree 42% (608) 41% (95) 41% (127)
30% (64)
Strongly agree 30% (437) 27% (62) 21% (66) 19% (40)
If I had information on the scenic roads through Native American lands, I would include this route in my activities.
Strongly Disagree 3% (42) 4% (9) 7% (22) 6% (12)
Disagree 3% (48) 6% (13) 8% (25) 5% (11)
Neither agree nor disagree 15% (224) 18% (41) 22% (67) 38% (79)
Agree 42% (622) 39% (89) 40% (125)
31% (66)
Strongly agree 36% (529) 34% (77) 23% (72) 20% (42)
Some experiences on Native American lands may require a guide. How likely would you be to take the following trips?
Avid MT Traveler
MT Resident
Potential MT Traveler
Potential International MT Traveler
A guided horseback trip with a tribal tour guide.
Extremely unlikely 24% (351) 25% (56) 25% (57) 22% (24)
Somewhat unlikely 19% (275) 21% (48) 0% (0) 0% (0)
Neither likely nor unlikely 14% (209) 19% (43) 0% (0) 0% (0)
Somewhat likely 28% (405) 23% (52) 42% (93) 45% (48)
Extremely likely 14% (207) 12% (28) 33% (74) 33% (35)
A guided interpretive bus tour with a tribal tour guide.
Extremely unlikely 17% (295) 21% (48) 11% (35) 7% (14)
Somewhat unlikely 23% (335) 23% (52) 8% (24) 11% (23)
Neither likely nor unlikely 21% (301) 22% (49) 20% (61) 36% (77)
Somewhat likely 30% (435) 28% (63) 41% (127) 32% (67)
Extremely likely 9% (127) 7% (15) 21% (65) 14% (30)
A guided trip on an Off-Highway Vehicle (OHV) with a tribal tour guide.
Extremely unlikely 15% (221) 24% (54) 13% (39) 5% (11)
Somewhat unlikely 18% (255) 16% (36) 10% (30) 13% (27)
Neither likely nor unlikely 19% (275) 19% (43) 19% (60) 33% (69)
Somewhat likely 35% (501) 29% (65) 37% (115) 36% (76)
Extremely likely 13% (191) 12% (28) 22% (68) 13% (27)
A guided nature hike with a tribal tour guide.
Extremely unlikely 11% (157) 15% (34) 13% (41) 6% (13)
Somewhat unlikely 12% (176) 12% (28) 10% (31) 11% (23)
Neither likely nor unlikely 17% (239) 18% (40) 15% (47) 28% (60)
Somewhat likely 39% (557) 38% (86) 40% (123) 36% (76)
Extremely likely 22% (316) 17% (38) 22% (67) 18% (39)
A guided hike of cultural sites with a tribal guide.
Extremely unlikely 10% (138) 11% (25) 13% (40) 6% (13)
Somewhat unlikely 11% (157) 12% (28) 8% (26) 11% (23)
Neither likely nor unlikely 15% (212) 14% (31) 17% (51) 28% (59)

Indian Country Cultural and Heritage Tourism 2019
44
Somewhat likely 41% (597) 44% (100) 35% (107) 36% (77)
Extremely likely 23% (338) 18% (41) 28% (85) 18% (39)
A guided fishing trip with a tribal guide.
Extremely unlikely 28% (401) 25% (57) 22% (69) 20% (43)
Somewhat unlikely 18% (262) 25% (57) 14% (43) 18% (37)
Neither likely nor unlikely 18% (265) 19% (42) 17% (52) 29% (62)
Somewhat likely 22% (316) 21% (47) 31% (95) 20% (42)
Extremely likely 14% (201) 10% (23) 16% (51) 13% (27)
A guided hunting trip into the back-country with a tribal guide.
Extremely unlikely 50% (720) 45% (101) 30% (93) 30% (61)
Somewhat unlikely 17% (245) 20% (46) 16% (50) 15% (30)
Neither likely nor unlikely 13% (189) 15% (33) 15% (47) 30% (62)
Somewhat likely 12% (175) 13% (30) 21% (66) 17% (35)
Extremely likely 8% (114) 7% (15) 17% (52) 9% (18)