India’s Urban Infrastructure Development and Opportunities...
28
India’s Urban Infrastructure Development‐ Overview and Opportunities for PPP Dr. Sudhir Krishna Secretary(UD) Ministry of Urban Development
Transcript of India’s Urban Infrastructure Development and Opportunities...
India’s Urban Infrastructure Development‐ Overview and Opportunities for PPP
Dr. Sudhir KrishnaSecretary(UD)
Ministry of Urban Development

Category Population (Million)
Share in %
India‐
Total 1210.2 100
Rural 833.1 68.8
Urban 377.1 31.2
Million+ Cities 160.7 13.3
Between 100K & 1 Mn
104.2 8.6
Towns < 100K 216.4 17.923 April 2012
Demographic Profile of Urban India‐ Census 2011
Trends in Urban Settlements
Rapid
urbanization
– 377
million
urban
population
(31%
of
total)
in
2011
to
grow
to
about
600
million
(40%
of
total) by 2031
Number of cities with 1 million plus population
35 in 2001
50 in 2011
87 by 2031 (expected)
Cities
are
the
engines
of
economic
growth contributing about
60%
(2010)
to
the
‘GDP’
of
the
country
and
contribution is expected to rise to 70% (2030)
Increased
Investment
in
infrastructure
needed
for
spurring growth.
23 April 2012
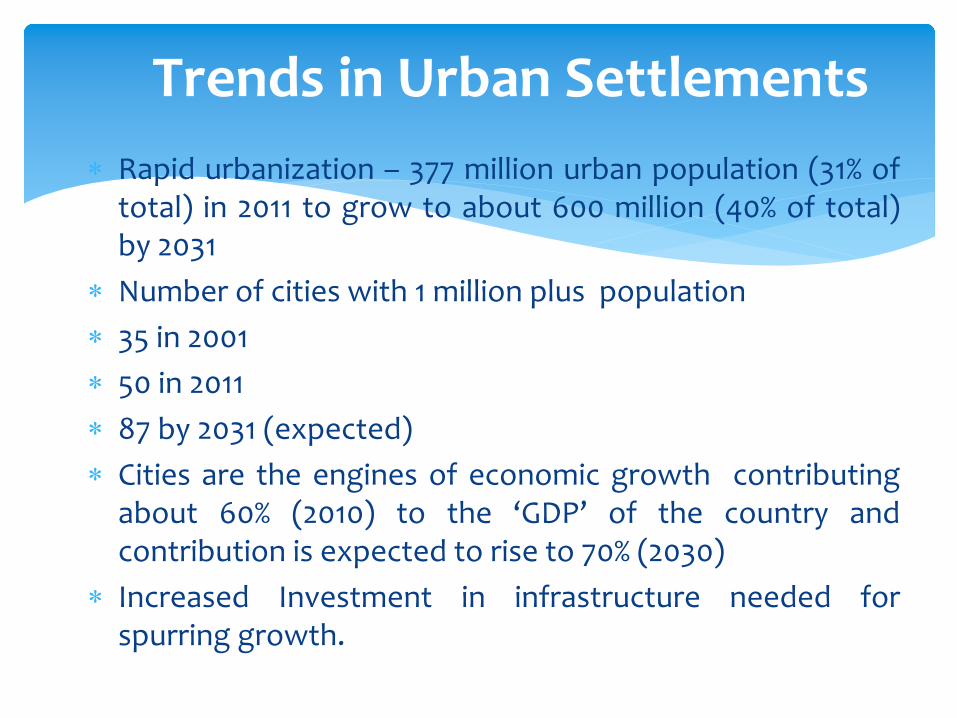
Urban Infrastructure Requirement

Report on Indian Urban Infrastructure and Services 2011
Urban Infrastructure investment requirement of US $ 871 Billion
• Additional US $ 444 Billion for operation and maintenance of assets –
old and new
5
870,81
6
384,20
9
99,872
90,879
71,313
53,931
42,451
22,613
21,774
10,796
4,12
9
68,848
‐100,000 200,000 300,000 400,000 500,000 600,000 700,000 800,000 900,000
1,000,000
Total Expen
diture
Urban R
oads
Urban T
ranspo
rt
Rene
wal an
d Re
developm
ent o
f Slum
s Water Su
pply
Sewerage
Storm W
ater Drains
Capacity Bu
ilding
Traffic Sup
port In
frastructure
Solid
Waste M
anagem
ent
Street Lightin
g
Othe
r Sectors
HPEC Estimates in Urban Infrastructure( US $ Million)

Estimates of Urban Services Backlog
6
• Large Backlogs in :• Water
Supply
– Production
varies
from
18% to
62%,
Distribution
extension ‐
25%
to
51%
and
Distribution upgradation ‐
49% to 75%
• Sewerage
– Network and Treatment varies from 53% to 100%
• Solid
Waste
Management
–
Collection
and Transport‐
13%
to
75%,
Processing
–
88%
to
100%
and
Scientific disposal –
100% • Urban
Transport:
Rail
based
MRTS
– 80%
and
Road
Based MRST 100% in Class –IA and IB

Capital Expenditure Estimates by Size Class of Cities‐
HPEC
City Class‐wise Estimates
Total Capital Investment( in $Billion)
Relative Share( %)
Class IA(> 5 Million) 191.1 27.8 Class IB( 1‐5 Million) 153.4 22.3 Class IC(100,000 ‐ 1 Million) 196.3 28.5 Class II(50,000 ‐ 100,000) 38.7 5.6 Class III(20,000 ‐50,000) 62.3 9.1 Class IV(<20,000) 46.6 6.8 Total 688.5 100.0
HPEC Estimates at 2009‐10 prices

Capital and O&M Expenditure Estimates by HPEC & Investment under JNNURM‐I (US$ Bn)
8
SECTORJNNURM
(2005‐2012)
CAPITAL INVESTMENT(2011‐2031)
OPERATION & MAINTENANCE(2011‐2031)
WATER SUPPLY 6.42 71.31 121.35 SEWERAGE 3.95 53.93 52.66 SOLID WASTE MANAGEMENT 0.53 10.80 60.87 URBAN ROADS 2.11 384.21 83.39 STORM WATER DRAINS 2.00 42.45 7.69 URBAN TRANSPORT 1.34 99.87 67.64 TRAFFIC SUPPORT INFRASTRUCTURE 0.19 21.77 8.15 STREET LIGHTING ‐ 4.13 1.05 OTHER SECTORS 0.03 68.85 40.28 RENEWAL AND REDEVELOPMENT 0.17 90.88 ‐ CAPACITY BUILDING ‐ 22.61 ‐
16.74 870.82 443.09 Note : HPEC Estimates are at 2009‐10 prices, all figures are in $ Billion
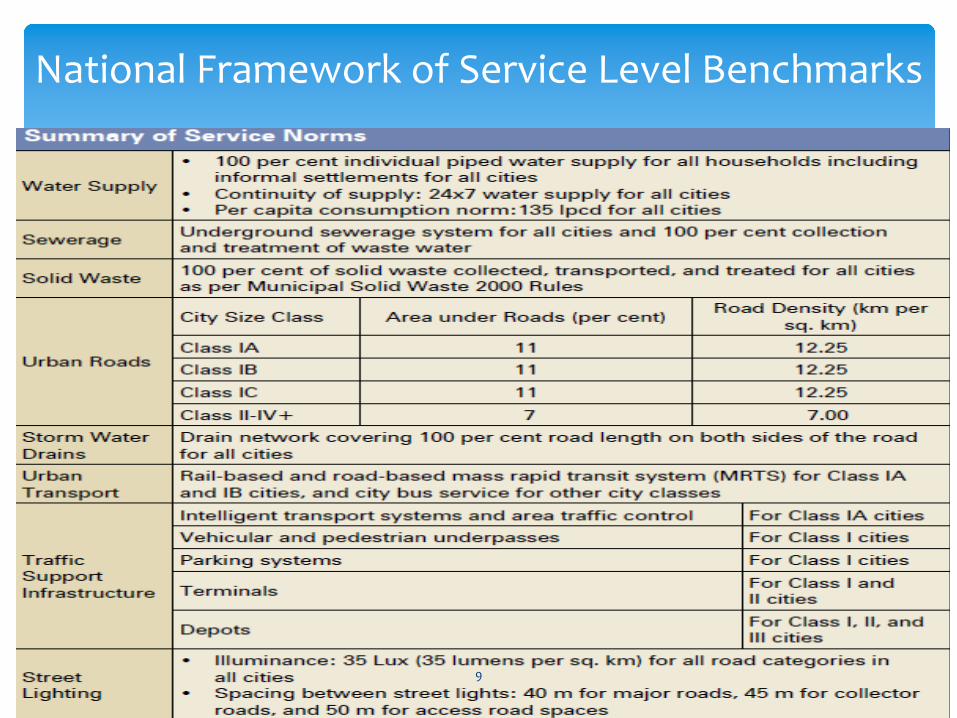
National Framework of Service Level Benchmarks
9

INITIATIVES TO ADDRES SECTOR CHALLENGES
National Framework for Service Level Benchmarking launched in 4 sectors, Water Supply, Sewerage, SWM & Drainage
Steps initiated for improving financial management & accounting system in ULBs thru’
Accrual Accounting
To address rationalization of tariff levels, Water Regulatory Authorities being set up in States
JNNURM Grants require Cities to collect user charges to meet O&M
Reforms focuses on reduction of Non‐revenue water (NRW) in newly sanctioned projects to 20%
10

Opportunities in Urban WatSan
Citizens’
Willingness to pay for better services; the PPP & Bankability of projects
Methodologies of metering‐
water audit & energy audit;
Models of proper Tariff for demand control
Water efficient sanitary fittings
Technology for treatment & reuse of waste water
Rain Water Harvesting; artificial recharge of ground water
11
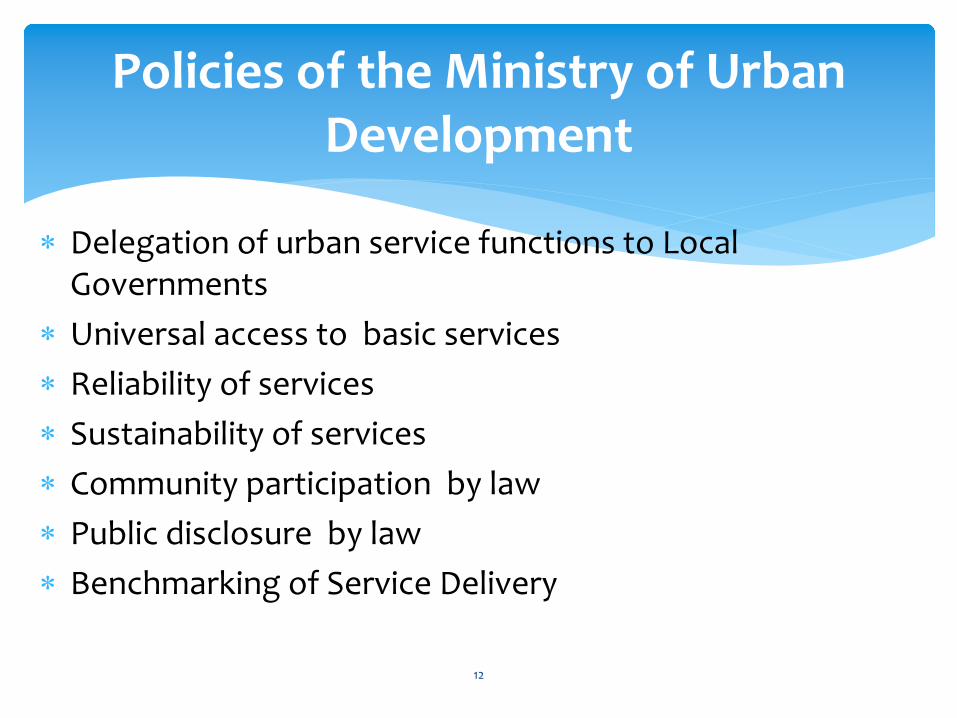
Policies of the Ministry of Urban Development
Delegation of urban service functions to Local Governments
Universal access to basic services
Reliability of services
Sustainability of services
Community participation by law
Public disclosure by law
Benchmarking of Service Delivery
12
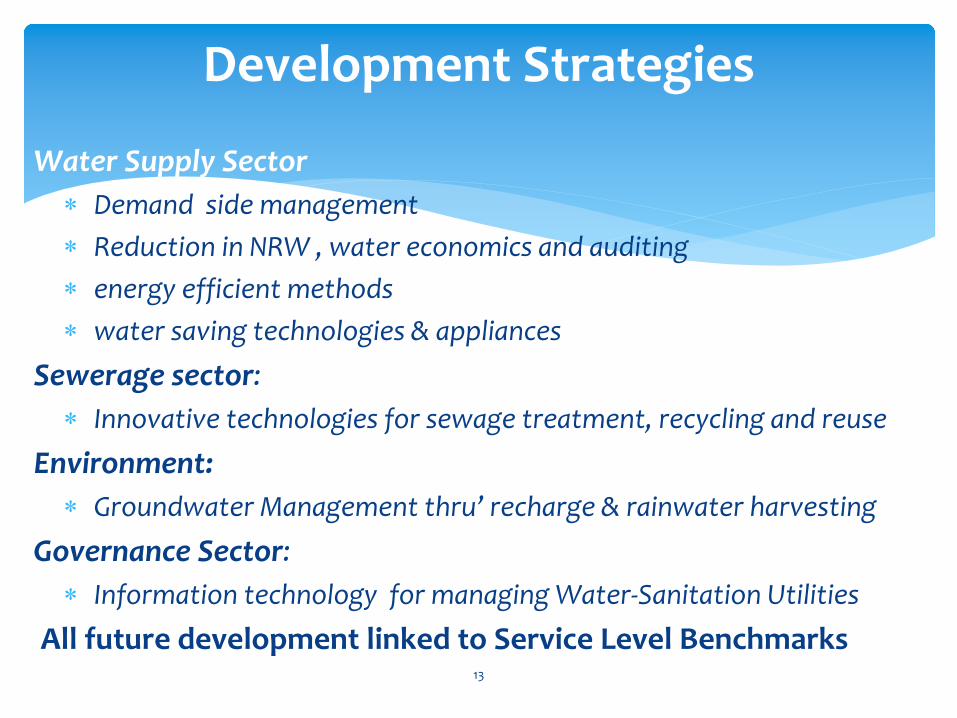
Development Strategies
Water Supply Sector
Demand side management
Reduction in NRW , water economics and auditing
energy efficient methods
water saving technologies & appliances
Sewerage sector:
Innovative technologies for sewage treatment, recycling and reuse
Environment:
Groundwater Management thru’
recharge & rainwater harvesting
Governance Sector:
Information technology for managing Water‐Sanitation Utilities
All future development linked to Service Level Benchmarks13
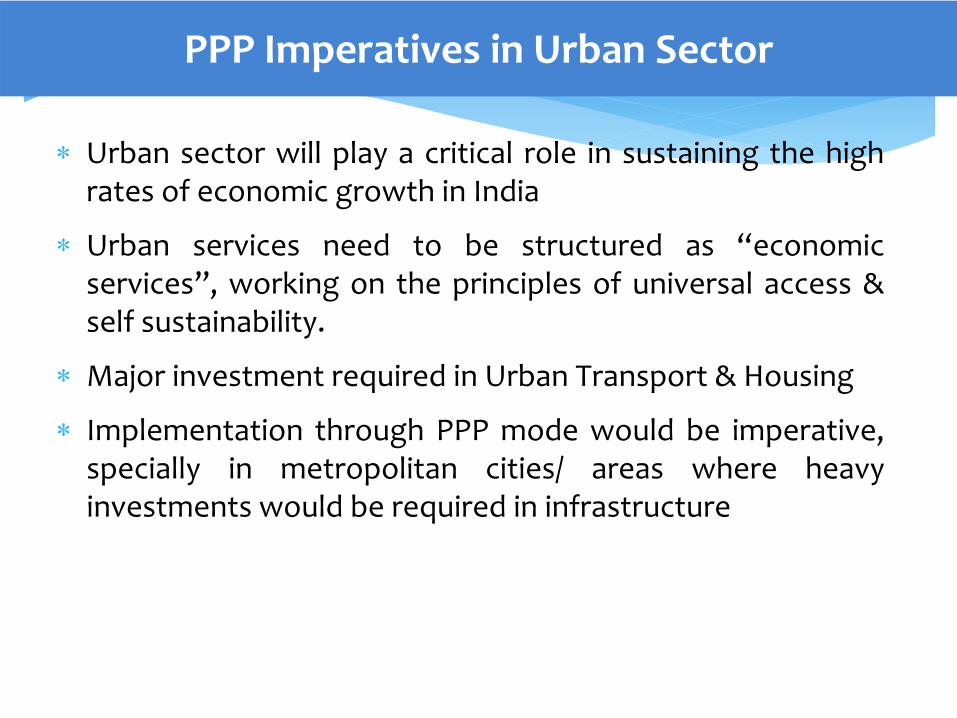
Urban
sector
will
play
a
critical
role
in
sustaining
the
high rates of economic growth in India
Urban
services
need
to
be
structured
as
“economic services”,
working
on
the
principles
of
universal
access
&
self sustainability.
Major investment required in Urban Transport & Housing
Implementation
through
PPP
mode
would
be
imperative, specially
in
metropolitan
cities/
areas
where
heavy
investments would be required in infrastructure
PPP Imperatives in Urban Sector

Growing urbanization => Spurt in travel demand.
Travel demand: 759.82 million passenger km per day in 1991
2001: 1038.8 million passenger km/ day
2021 (Projection):
2511.23
Predominant
modes
of
urban
travel
in
India
are
still
public transport and NMT.
Private ownership of vehicles has increased significantly
Population in 6 major metropolis increased by 1.9 times from 1981 to 2001 but motor vehicles, by 7.75 times.
Many cities are introducing rail–
and bus–
based MRTS.
PPP Imperatives in Urban Sector

Financing Models Urban TransportMode/ component Proposal
Urban Rail Transit Primarily Govt funded except in case of high
density and above ground construction
where PPP may be feasible
Bus Rapid Transit System Infrastructure provisioning by Govt. Bus
provisioning, O&M preferably on PPP with
revenue risk with Government
City Bus Service Bus provisioning, O&M preferably on PPP
with revenue risk with Government
Public Bicycle Scheme Cycle stations and Control centre by
Government, Cycles , O&M by PPP
Bus depots/ Terminal and work
shopsLand by Government, Development
preferably on PPP
Roads and NMT facilities New roads thru self‐financing/ PPP. Existing
roads upgradation by Govt
Source: Recommendations of Working Group on Urban Transport for
12th Five Year Plan

Investment Opportunities in METRO Rail Projects‐
in Kms
S. No.City Metro in
operationMetro under
ImplementationMetro
Planned/Total
Length
1 MUMBAI 0.00 53.90 103.00 156.90
2 KOLKATA 26.20 14.70 73.80 114.70
3 DELHI 189.77 117.00 71.09 377.86
4 CHENNAI 0.00 53.00 0.00 53.00
5 HYDERABAD 0.00 71.16 0.00 71.16
6 BANGALORE 7.00 35.30 75.00 117.30
7 AHMEDABAD 0.00 0.00 58.27 58.27

S. No. City Metro in
operation
Metro under Implementatio n
Metro PlannedTotal
Length
8 PUNE 0.00 0.00 31.51 31.51
9 JAIPUR 0.00 9.25 28.00 37.25
10 LUCKNOW 0.00 0.00 37.20 37.20
11 LUDHIANA 0.00 0.00 28.83 28.83
12 KOCHI 0.00 0.00 25.60 25.60
TOTAL 222.97 354.31 532.30 1109.58
Investment Opportunities in METRO Rail Projects‐
in Kms (contd.)

Kolkata Metro Rail : Work under progressKolkata Metro Rail : Work under progress

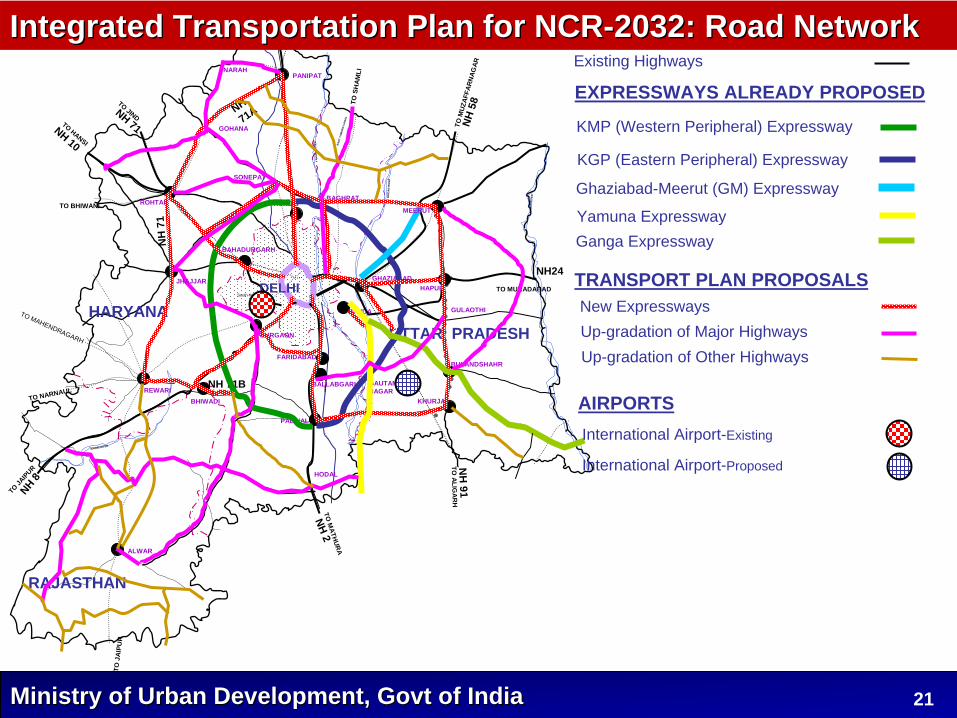
Opportunities for PPP in RRTS proposed in Integrated Opportunities for PPP in RRTS proposed in Integrated Transportation Plan (ITP) for National Capital RegionTransportation Plan (ITP) for National Capital Region‐‐20322032
Road System• Expressways• National Highways• State Highways• Other Roads
Bus System• Bus Fleet &
Infrastructure• Bus Terminals
Rail System• New Rail Lines• RRTS• Mass Rapid Transit
System
Airports• International• Domestic
Others• Logistic Hubs• Integrated Freight
Complexes• Highway Facilities
Centres
ITP for NCR‐2032 proposes following components:
Ministry of Urban Development, Govt of IndiaMinistry of Urban Development, Govt of India 21
Existing Highways
EXPRESSWAYS ALREADY PROPOSED
RAJASTHAN
SONEPAT
GURGAON
BULANDSHAHR
REWARI
ALWAR
NH24
NH 2
TO K
ARN
ALNH
1
TO S
HAM
LI
NH 5
8TO
MUZ
AFFA
RNAG
AR
TO MURADABAD
TO M
ATHURA
NH 8
TO JAIP
UR
TO NARNAUL
TO BHIWANI
TO HANSI
NH 10
AG
RA
CA
NA
L
EAST
YAM
UN
A C
AN
AL
HIN
DA
N R
IVE
R
YA
MU
NA
RIV
ER
SAHIBI RIVER
GA
NG
A R
IVE
R
TO A LI G
AR
HN
H 91
BAHADURGARH
South-West
PANIPAT
GAUTAMBUDHNAGAR
NOIDA
KHURJA
HAPUR
BHIWADI
GHAZIABAD
FARIDABAD
NH
71ANH 71
TO JIND
NH
71
TO J
AIPU
R
NH 71B
KUNDLIROHTAK BAGHPAT
PALWAL
BALLABGARH
TO MAHENDRAGARH
KMP (Western Peripheral) Expressway
KGP (Eastern Peripheral) Expressway
HARYANA UTTAR PRADESH
DELHI
Integrated Transportation Plan for NCRIntegrated Transportation Plan for NCR--2032: Road Network2032: Road Network
Ghaziabad-Meerut (GM) Expressway
New Expressways
Yamuna ExpresswayGanga Expressway
TRANSPORT PLAN PROPOSALS
GOHANA
NARAH
GULAOTHI
HODAL
Up-gradation of Major HighwaysUp-gradation of Other Highways
JHAJJAR
MEERUT
International Airport-Existing
International Airport-Proposed
AIRPORTS

Ministry of Urban Development, Govt of IndiaMinistry of Urban Development, Govt of India 22
TO K
ARN
A
LEGEND
Existing Rail Network
U .P.
RAJASTHAN
HARYANA
MEERUT
BARAUT
SONEPAT
ROHTAK
JHAJJAR
GURGAON
BULANDSHAHR
ALWAR
TO S
HAM
LI
TO MURADABAD
TO M
ATHURA
TO NARNAUL
TO MAHENDRAGARH
TO BHIWANI
R. H
IND
AN
R. Y
AM
UN
A
SAHIBI RIVER
R. G
AN
GA
FARIDABAD
PANIPAT
GAUTAMBUDHNAGAR
KUNDLI
KHURJA
HAPUR
BHIWADI
PALWAL
GHAZIABAD
TO JIND
TO JIND
TO BHIWANI
TO A
LIGAR
H
REWARI
TO HANSI
BALLABAGARH
Jahangirpuri
HolambiKalan
Dwarka
S. Lok
Rithala
Okhla
Dilshad Gn.
Airport
R. Chowk.
Barwala
MundkaShahdara
BAHADURGARH
ShivajiBridge
Badarpur
Dabur Chowk
Kirti nagar
Badli
Sec. 21
Trinagar
NOIDA
22
Integrated Transportation Plan for NCRIntegrated Transportation Plan for NCR--2032: Rail Network2032: Rail Network
DELHI
New Rail Link
Work in Progress- IR Projects
Survey in Progress- IR ProjectsSurvey Sanctioned – IR ProjectsInner Corridor- Proposed Under the Study
RRTS Corridors- Proposed Under the Study
DMRC Corridors -Under State Consideration
RRTS Corridors – Phase I
D.F.C. CORRIDOR
D.F
.C.
CO
RR
IDO
R
D.F.
C. C
ORR
IDO
R
DFC Corridor
DMRC Corridors- Operational
Ministry of Urban Development, Govt of IndiaMinistry of Urban Development, Govt of India 23
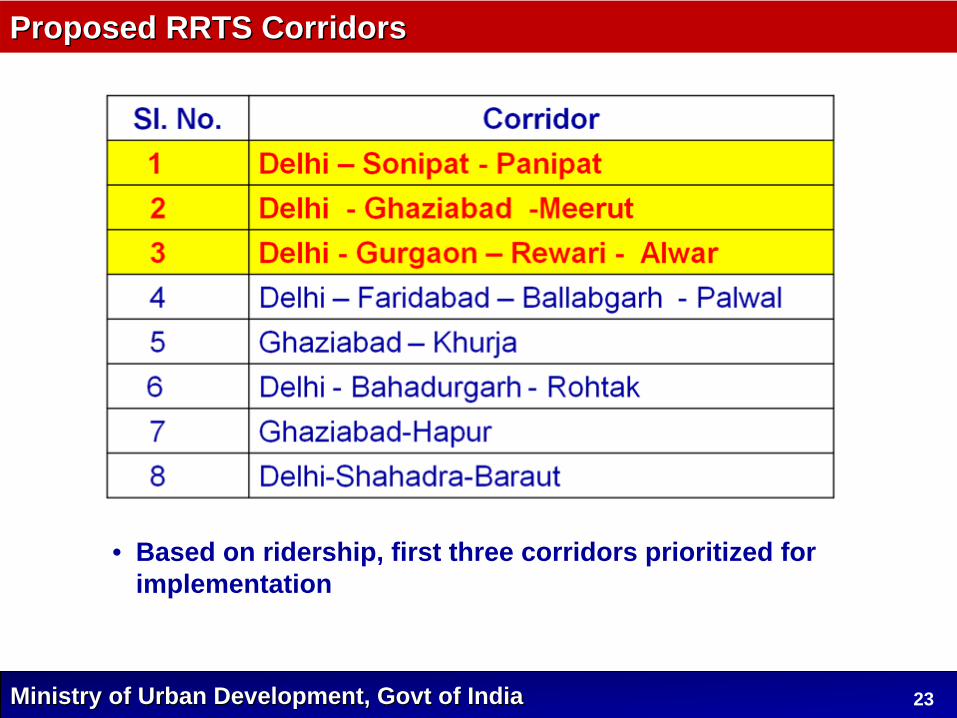
Proposed RRTS Corridors Proposed RRTS Corridors
• Based on ridership, first three corridors prioritized for implementation

Ministry of Urban Development, Govt of IndiaMinistry of Urban Development, Govt of India 24
Capital Cost SummaryCapital Cost Summary
Components Delhi - Panipat
Delhi - Meerut
Delhi - Alwar
Total
Total Base Project Cost including land(without Taxes)
2.93 3.32 4.92 11.17
Total Base Project Cost including land (with central and State Taxes)
3.31 3.82 5.44 12.57
Total Project cost including escalation and IDC (with central and State Taxes)
3.75 4.25 6.43 14.43
US $ Billion

Ministry of Urban Development, Govt of IndiaMinistry of Urban Development, Govt of India 25
Financial Contribution for Financial Contribution for PPRTsPPRTs-- A ModelA Model
Name of Entity Delhi-Panipat Delhi - Meerut Delhi - Alwar Total
% US $ Billion % US $ Billion % US $ Billion
Govt Funding
GoI (MOUD + NCRPB) 15.00% 0.56 15.00% 0.64 15.00% 0.96 15.00% 2.17
GNCTD 3.30% 0.12 2.70% 0.11 5.85% 0.38 4.26% 0.61
Govt of Haryana 11.70% 0.44 - 5.24% 0.34 5.37% 0.78Govt of UP 12.30% 0.52 3.63% 0.52Govt of Rajasthan 3.90% 0.25 1.74% 0.25Total funding by Govt 30.00% 1.13 30% 1.28 30.00% 1.93 30.00% 4.33
Loan - Soft loan, bonds, sub-debt from central & state Govt.
40.00% 1.50 40% 1.70 40.00% 2.57 40.00% 5.77
Investment by PPP partner 30.00% 1.13 30% 1.28 30.00% 1.93 30.00% 4.33
Total investment 100% 3.75 100.00% 4.25 100.00% 6.43 100.00% 14.43

Desalination PPP projects supported by MoUDDesalination PPP projects supported by MoUD
• 100
MLD
desalination
plant
at
Minjur,
Chennai
under DBOOT,
with
Bulk
Water
Purchase
Agreement
with
Chennai Metro Water for a period of 25 years
•Infrastructure
for
Transmission
of
water
from Desalination
Plant
at
KATTUPALLI,
MINJUR
to
City
distribution
network
implemented
under
JNNURM
at
a cost of Rs. 93 crore
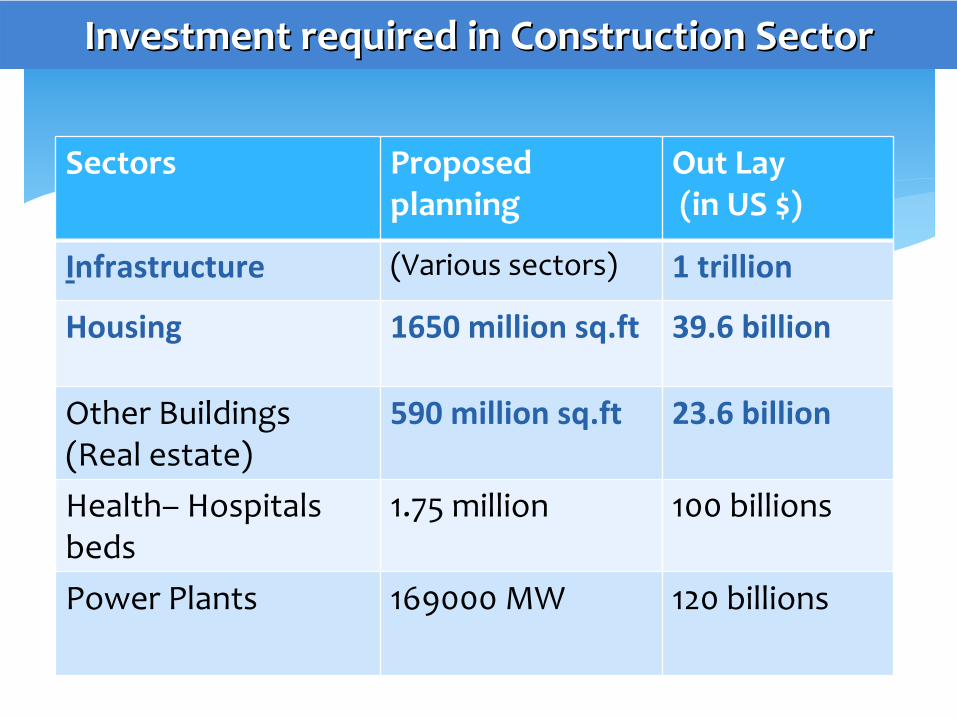
Sectors Proposed planning
Out Lay(in US $)
Infrastructure (Various sectors) 1 trillion
Housing 1650 million sq.ft 39.6 billion
Other Buildings (Real estate)
590 million sq.ft 23.6 billion
Health–
Hospitals beds
1.75 million 100 billions
Power Plants 169000 MW 120 billions
Investment required in Construction SectorInvestment required in Construction Sector

23 April 2012
Thank You
Thank You