EXIM Bank, NABARD, RRBs Group 4. Export Import Bank Of India (EXIM Bank of India)

India’s National Export Credit Agency
Investor Presentation
July 2020
Presentation Outline
Exim Bank: Key Credit Highlights
The India Story
The Exim Bank Story
Appendix
2
1
2
3
4

Exim Bank: Key Credit Highlights
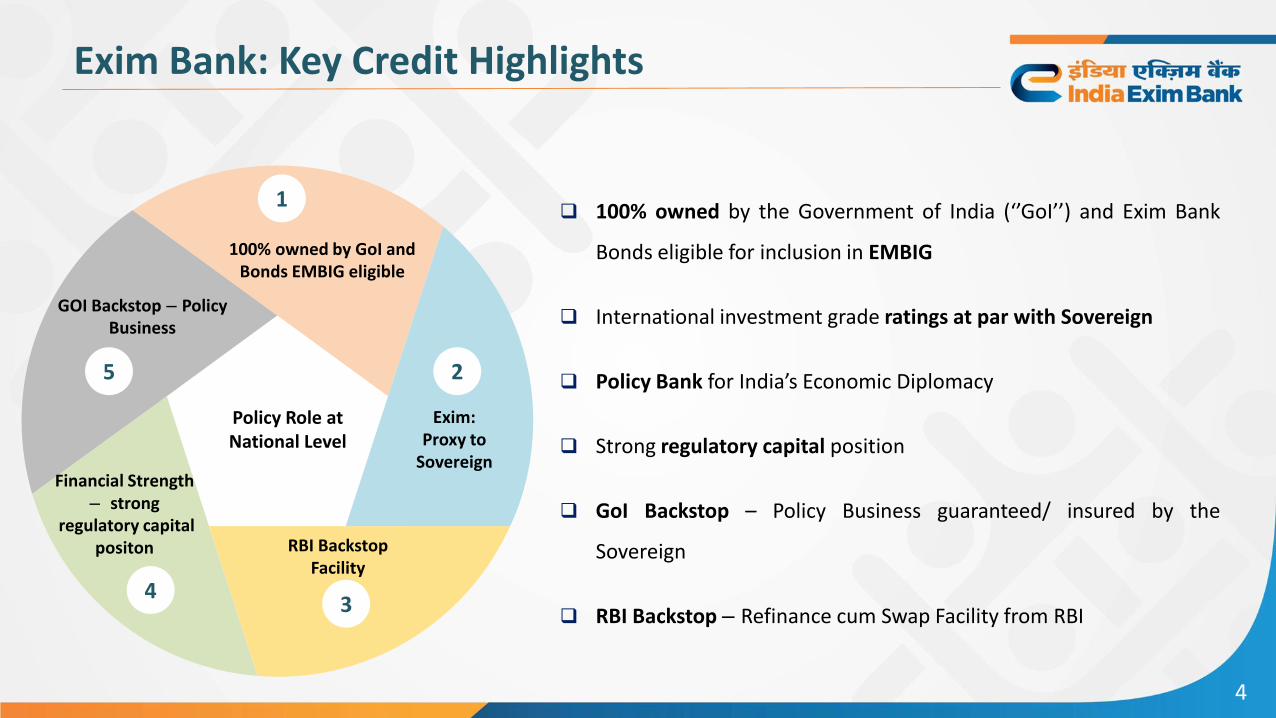
100% owned by the Government of India (‘’GoI’’) and Exim Bank
Bonds eligible for inclusion in EMBIG
International investment grade ratings at par with Sovereign
Policy Bank for India’s Economic Diplomacy
Strong regulatory capital position
GoI Backstop – Policy Business guaranteed/ insured by the
Sovereign
RBI Backstop – Refinance cum Swap Facility from RBI
4
Exim Bank: Key Credit Highlights
GOI Backstop – Policy Business
100% owned by GoI and Bonds EMBIG eligible
Exim: Proxy to
SovereignFinancial Strength
– strongregulatory capital
positon RBI Backstop Facility
1
2
34
5
Policy Role at National Level

The India Story
India: Macroeconomic Overview
Resilient GDP Growth(1,2,3)
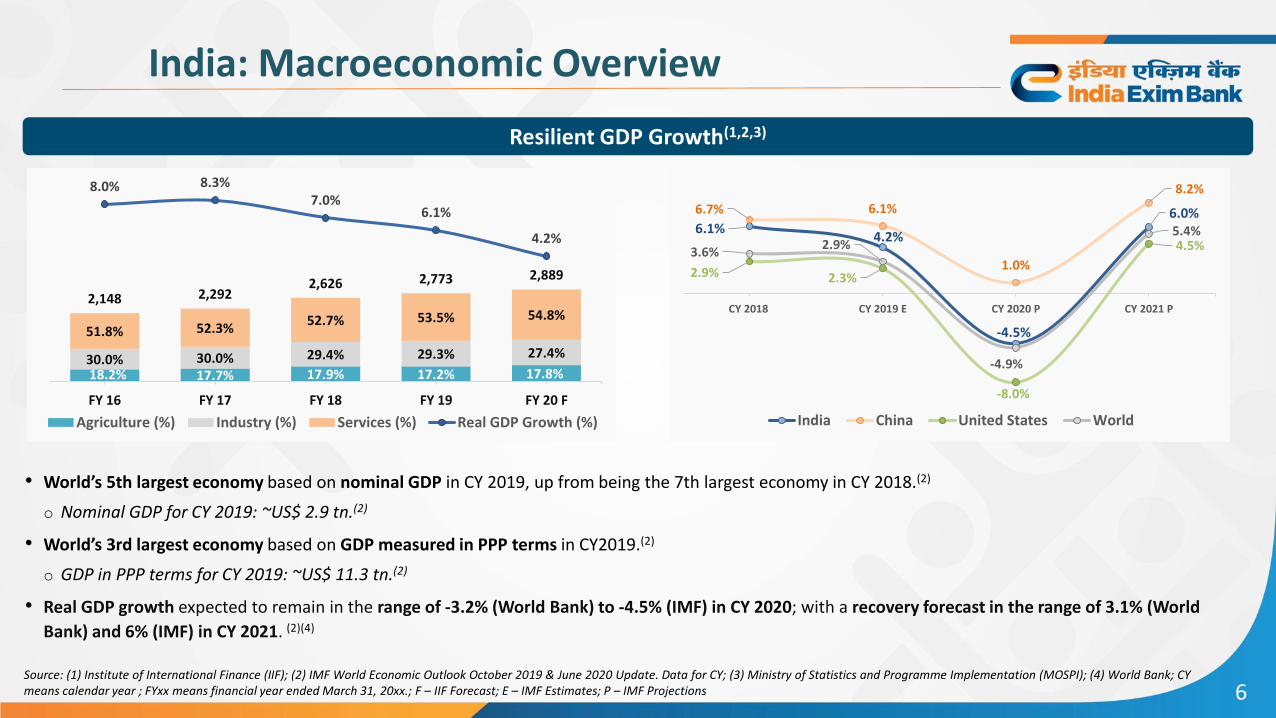
• World’s 5th largest economy based on nominal GDP in CY 2019, up from being the 7th largest economy in CY 2018.(2)
o Nominal GDP for CY 2019: ~US$ 2.9 tn.(2)
• World’s 3rd largest economy based on GDP measured in PPP terms in CY2019.(2)
o GDP in PPP terms for CY 2019: ~US$ 11.3 tn.(2)
• Real GDP growth expected to remain in the range of -3.2% (World Bank) to -4.5% (IMF) in CY 2020; with a recovery forecast in the range of 3.1% (World
Bank) and 6% (IMF) in CY 2021. (2)(4)
Source: (1) Institute of International Finance (IIF); (2) IMF World Economic Outlook October 2019 & June 2020 Update. Data for CY; (3) Ministry of Statistics and Programme Implementation (MOSPI); (4) World Bank; CYmeans calendar year ; FYxx means financial year ended March 31, 20xx.; F – IIF Forecast; E – IMF Estimates; P – IMF Projections 6
18.2% 17.7% 17.9% 17.2% 17.8%30.0% 30.0% 29.4% 29.3% 27.4%
51.8% 52.3%52.7% 53.5% 54.8%
2,148 2,2922,626 2,773 2,889
8.0% 8.3%7.0%
6.1%
4.2%
-5.0%
-3.0%
-1.0%
1.0 %
3.0 %
5.0 %
7.0 %
9.0 %
0
100 0
200 0
300 0
400 0
500 0
600 0
FY 16 FY 17 FY 18 FY 19 FY 20 F
Agriculture (%) Industry (%) Services (%) Real GDP Growth (%)
6.1%4.2%
-4.5%
6.0%6.7% 6.1%
1.0%
8.2%
2.9% 2.3%
-8.0%
4.5%3.6%2.9%
-4.9%
5.4%
CY 2018 CY 2019 E CY 2020 P CY 2021 P
India China United States World
Indian Economy: Key Economic Indicators
Banking Sector Statistics(2)
Key Parameters FY18 FY19 FY20 Change
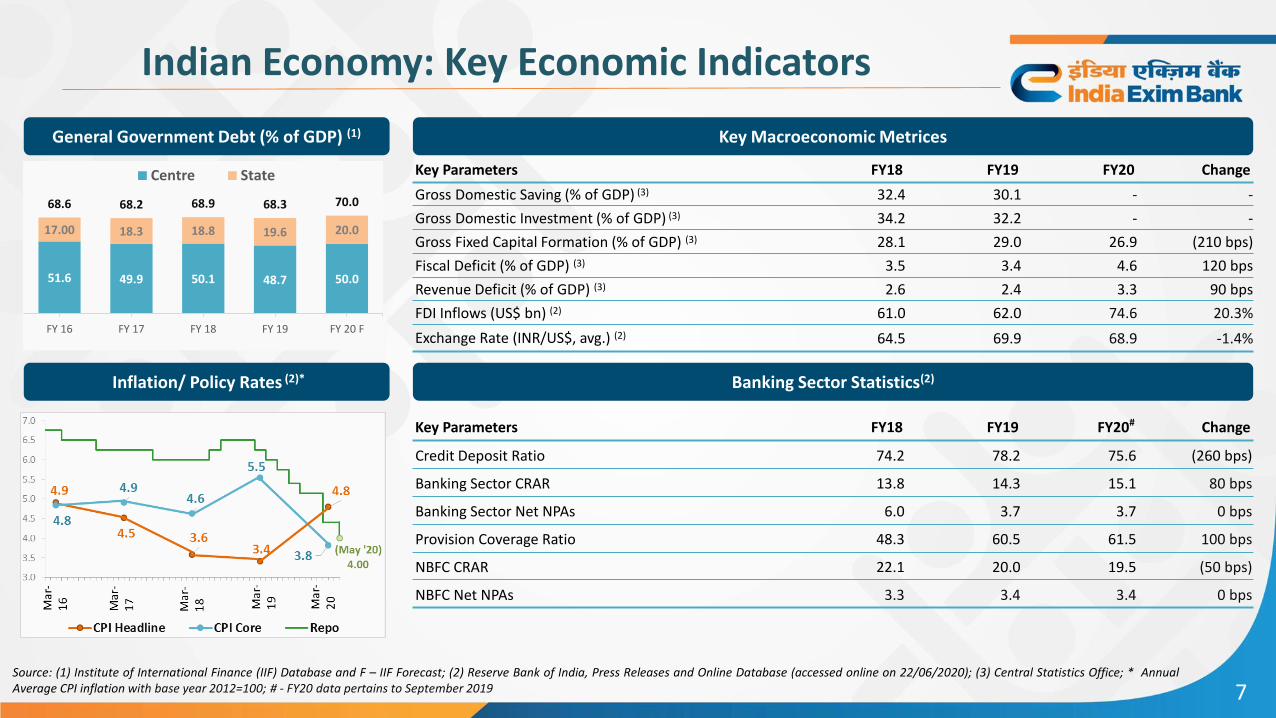
Gross Domestic Saving (% of GDP) (3) 32.4 30.1 - -
Gross Domestic Investment (% of GDP) (3) 34.2 32.2 - -
Gross Fixed Capital Formation (% of GDP) (3) 28.1 29.0 26.9 (210 bps)
Fiscal Deficit (% of GDP) (3) 3.5 3.4 4.6 120 bps
Revenue Deficit (% of GDP) (3) 2.6 2.4 3.3 90 bps
FDI Inflows (US$ bn) (2) 61.0 62.0 74.6 20.3%
Exchange Rate (INR/US$, avg.) (2) 64.5 69.9 68.9 -1.4%
Source: (1) Institute of International Finance (IIF) Database and F – IIF Forecast; (2) Reserve Bank of India, Press Releases and Online Database (accessed online on 22/06/2020); (3) Central Statistics Office; * AnnualAverage CPI inflation with base year 2012=100; # - FY20 data pertains to September 2019
Key Parameters FY18 FY19 FY20# Change
Credit Deposit Ratio 74.2 78.2 75.6 (260 bps)
Banking Sector CRAR 13.8 14.3 15.1 80 bps
Banking Sector Net NPAs 6.0 3.7 3.7 0 bps
Provision Coverage Ratio 48.3 60.5 61.5 100 bps
NBFC CRAR 22.1 20.0 19.5 (50 bps)
NBFC Net NPAs 3.3 3.4 3.4 0 bps
Key Macroeconomic MetricesGeneral Government Debt (% of GDP) (1)
Inflation/ Policy Rates (2)*
7
51.6 49.9 50.1 48.7 50.0
17.00 18.3 18.8 19.6 20.0
68.6 68.2 68.9 68.3 70.0
FY 16 FY 17 FY 18 FY 19 FY 20 F
Centre State

Source: (1) MOCI; (2) Balance of Payment Statistics, RBI; CAD – Current Account Deficit
Composition of CAD(2)
Sound External Sector
Trade Trends(1)(2)
US$ 313 bn
US$ 474 bn
US$ 213 bn
Merchandise Trade Pattern in FY 20(1)
US$ 128 bn
Services Trade Pattern in FY20(2)
8
-48.7-57.2
-24.6
-1.9% -2.1%
-0.9%
-2.5%
-2.0%
-1.5%
-1.0%
-0.5%
0.0%
0.5%
1.0%
1.5%
2.0%
2.5%
-270.0
-220.0
-170.0
-120.0
-70.0
-20.0
30.0
80.0
130.0
FY18 FY19 FY 20
(US$
bill
ion
)
Trade Deficit Services Surplus Primary IncomeSecondary Income Current Account Deficit CAD (% of GDP)
45 41 36 34 29 26 24 24 11 44Exports
131 55 53 45 44 29 27 21 19 51Imports
Petroleum Products Gems & Jewellery Electronics ItemsMachinery Chemicals Base MetalsOres & minerals Transport Equipment Agri & Allied ProductsTextiles Others
499538 526
584640
602
304 330 313466 514 474
FY18 FY19 FY 20
(US$
bn
)
Services Exports Services ImportsMerchandise Exports Merchandise Imports
195 208213
128118126
96 30 21 5 46 15Exports
10 22 24 3 47 22Import
Telecom, computer & info services Travel
Transport Financial services
Other Business services Others
Sound External Sector
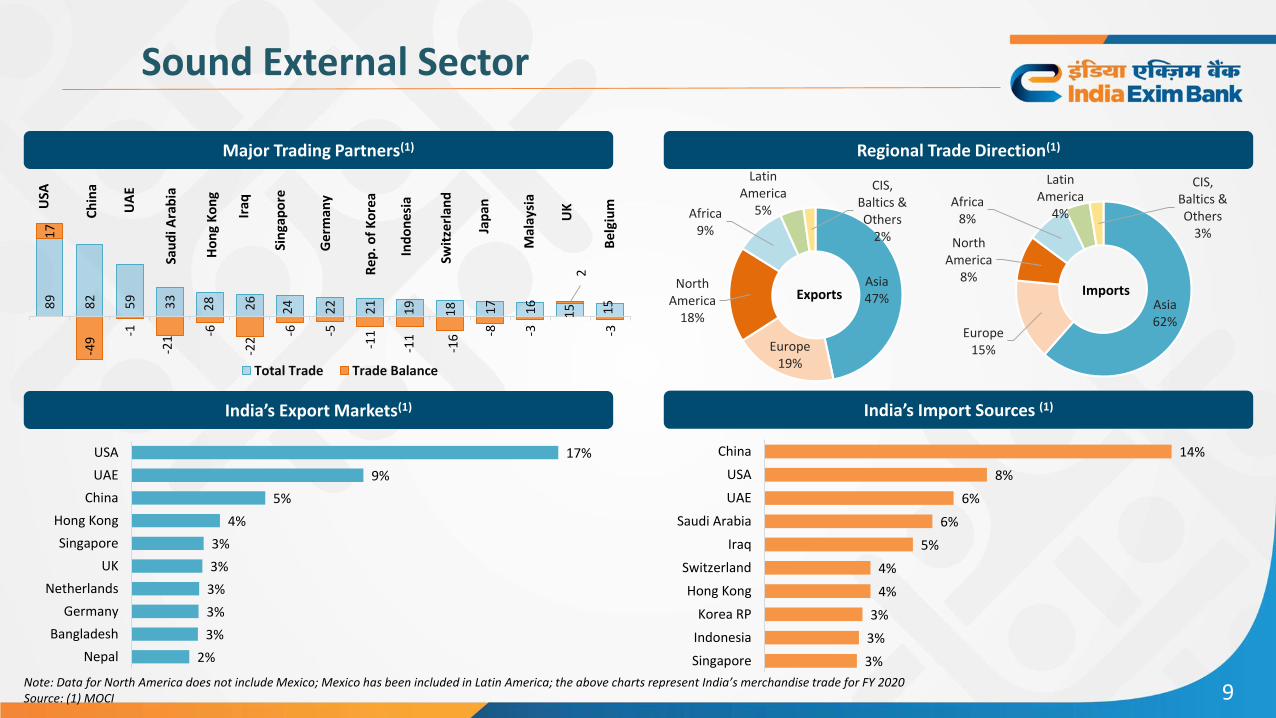
Major Trading Partners(1)
India’s Export Markets(1) India’s Import Sources (1)
Note: Data for North America does not includeMexico; Mexico has been included in Latin America; the above charts represent India’smerchandise trade for FY 2020Source: (1) MOCI
Regional Trade Direction(1)
9
89
82
59
33
28 26
24
22
21
19
18 17
16
15 15
17
-49
-1
-21 -6
-22
-6 -5
-11
-11
-16 -8 -3
2
-3
Total Trade Trade Balance
Ch
ina
USA
UA
E
Sin
gap
ore
Iraq
Ho
ng
Ko
ng
Sau
di A
rab
ia
Ge
rman
y
Be
lgiu
m
UK
Mal
aysi
a
Jap
an
Swit
zerl
and
Ind
on
esi
a
Re
p. o
f K
ore
a
Asia 47%
Europe 19%
North America
18%
Africa 9%
Latin America
5%
CIS, Baltics & Others
2%
Asia 62%
Europe 15%
North America
8%
Africa 8%
Latin America
4%
CIS, Baltics & Others
3%
Imports
2%
3%
3%
3%
3%
3%
4%
5%
9%
17%
Nepal
Bangladesh
Germany
Netherlands
UK
Singapore
Hong Kong
China
UAE
USA
3%
3%
3%
4%
4%
5%
6%
6%
8%
14%
Singapore
Indonesia
Korea RP
Hong Kong
Switzerland
Iraq
Saudi Arabia
UAE
USA
China
Exports
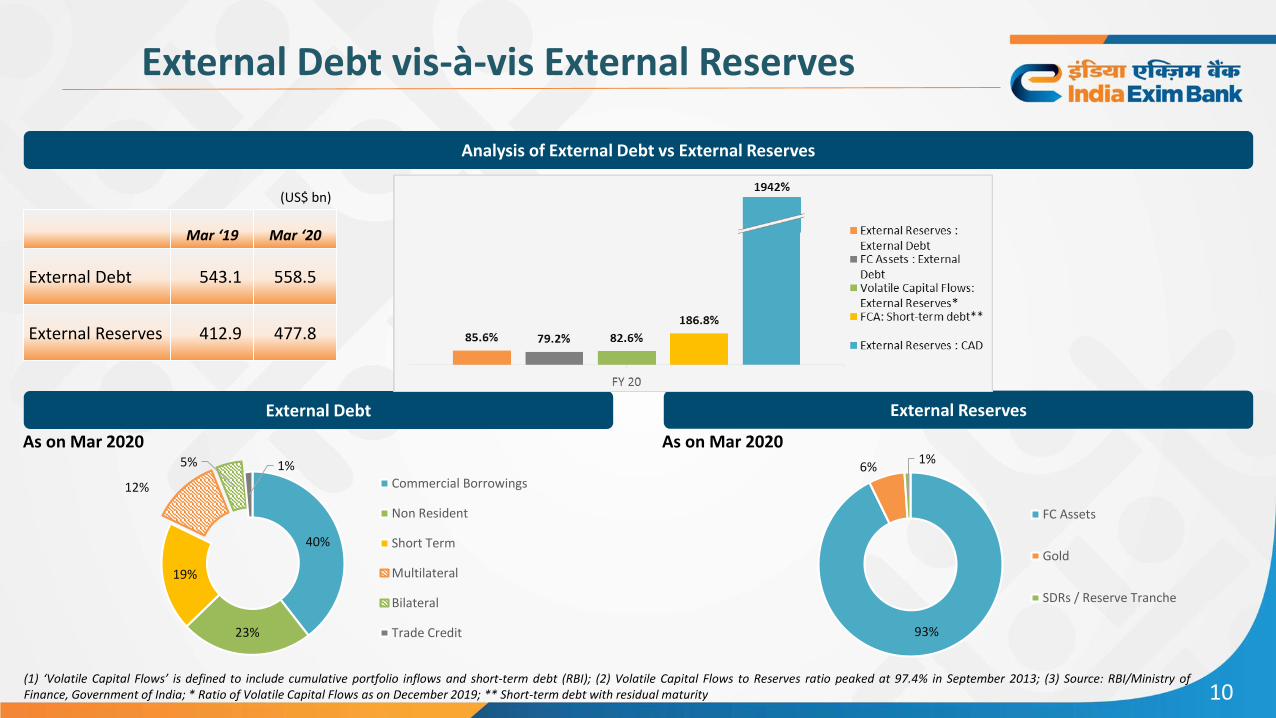
External Debt vis-à-vis External Reserves
(1) ‘Volatile Capital Flows’ is defined to include cumulative portfolio inflows and short-term debt (RBI); (2) Volatile Capital Flows to Reserves ratio peaked at 97.4% in September 2013; (3) Source: RBI/Ministry ofFinance, Government of India; * Ratio of Volatile Capital Flows as on December 2019; ** Short-term debt with residual maturity
Mar ‘19 Mar ‘20
External Debt 543.1 558.5
External Reserves 412.9 477.8
External Debt External Reserves
(US$ bn)
As on Mar 2020 As on Mar 2020
Analysis of External Debt vs External Reserves
10
40%
23%
19%
12%
5% 1%Commercial Borrowings
Non Resident
Short Term
Multilateral
Bilateral
Trade Credit 93%
6%1%
FC Assets
Gold
SDRs / Reserve Tranche
Key Highlights of Recent Policy Announcements
11
‘Atmanirbhar Bharat Abhiyaan’ announced by GoI worth ₹ 20.97 lakh cr (nearly 10% of India’s GDP) to cushion the economy from the
coronavirus blow; these include the monetary policy measures announced by RBI. This package aims at having a self-reliant India, by
focusing on the need to manufacture in India at a quality that is good enough to be exported globally.
Key reforms: Agri-Infrastructure Fund of ₹ 1 lakh cr for farm-gate infrastructure; amendment of the Essential Commodities Act; framework
for free sale of agricultural produce; new definition of MSMEs; privatization of power distribution companies in Union Territories; allowing
commercial coal mining through revenue sharing mechanism; increasing FDI cap for defence manufacturing from 49% to 74%.
o Others: Increasing threshold to initiate insolvency proceedings to ₹ 1 cr (from ₹ 1 lakh); decriminalization of Companies Act defaults;
suspension of IBC proceedings for 1 year; a new comprehensive Public Sector Enterprise (PSE) Policy – strategic sectors to have at least
one PSE and maximum 4 PSEs, and all ‘other’ sectors will be open to private investments; ₹ 90,000 cr liquidity injection for DISCOMs; and
MSME support through collateral free working capital facility of ₹ 3 lakh cr, subordinate debt of ₹ 20,000 cr for stressed MSMEs, and
₹ 50,000 cr equity infusion through MSME fund of funds.
Key announcements for financial institutions: Reduced policy repo rate, along with 6 months moratorium on loans and working capital;
₹ 30,000 cr additional refinance support for crop loan requirement of Rural Co-op Banks & RRBs through NABARD; Special refinance facility
of ₹ 50,000 cr through SIDBI, NABARD and NHB for NBFCs, HFCs and MFIs; Special Refinance Facility of ₹ 15,000 crore to SIDBI for on-
lending/refinancing; Liquidity Facility for Exim Bank of India through a line of credit of ₹ 15,000 crore for a period of 90 days;
₹ 30,000 cr Special Liquidity Scheme for NBFC/HFC/MFIs; and ₹ 45,000 cr Partial Credit Guarantee Scheme for Liabilities of NBFCs/MFIs.
Key Indian sectors to benefit: Agriculture and allied activities, animal husbandry, fisheries, healthcare and related infrastructure,
construction (incl. cement, iron & steel), education (mainly e-learning), power, mining, coal, minerals, defense manufacturing, civil aviation,
space, atomic energy, MSMEs, Banking, NBFC, MFI and HFC.

Exim Bank Story
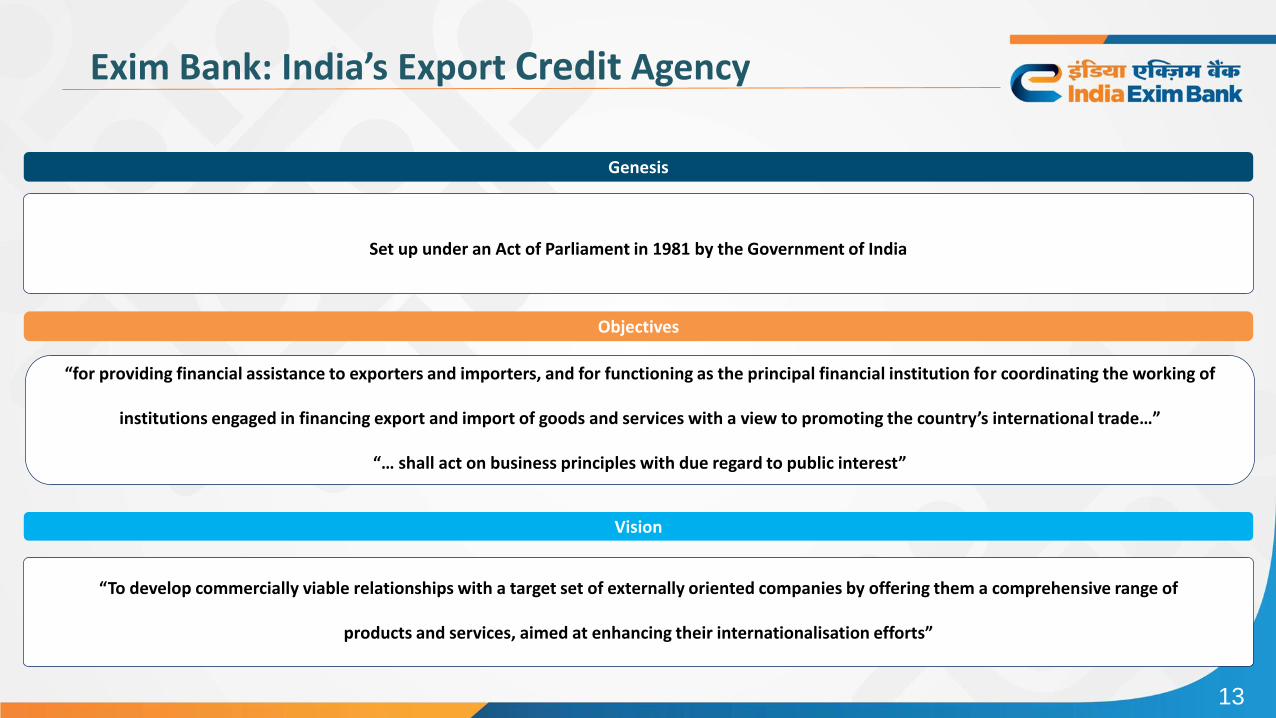
Exim Bank: India’s Export Credit Agency
Genesis
Set up under an Act of Parliament in 1981 by the Government of India
Objectives
“for providing financial assistance to exporters and importers, and for functioning as the principal financial institution for coordinating the working of
institutions engaged in financing export and import of goods and services with a view to promoting the country’s international trade…”
“… shall act on business principles with due regard to public interest”
Vision
“To develop commercially viable relationships with a target set of externally oriented companies by offering them a comprehensive range of
products and services, aimed at enhancing their internationalisation efforts”
13
Exim Bank: Proxy to Sovereign
Strong Government Support
Policy Bank
GoI Backstop:Policy
BusinessProxy to India
Sovereign in InternationalDebt Markets
DirectorsAppointed
by GoI RBI BackstopFacility
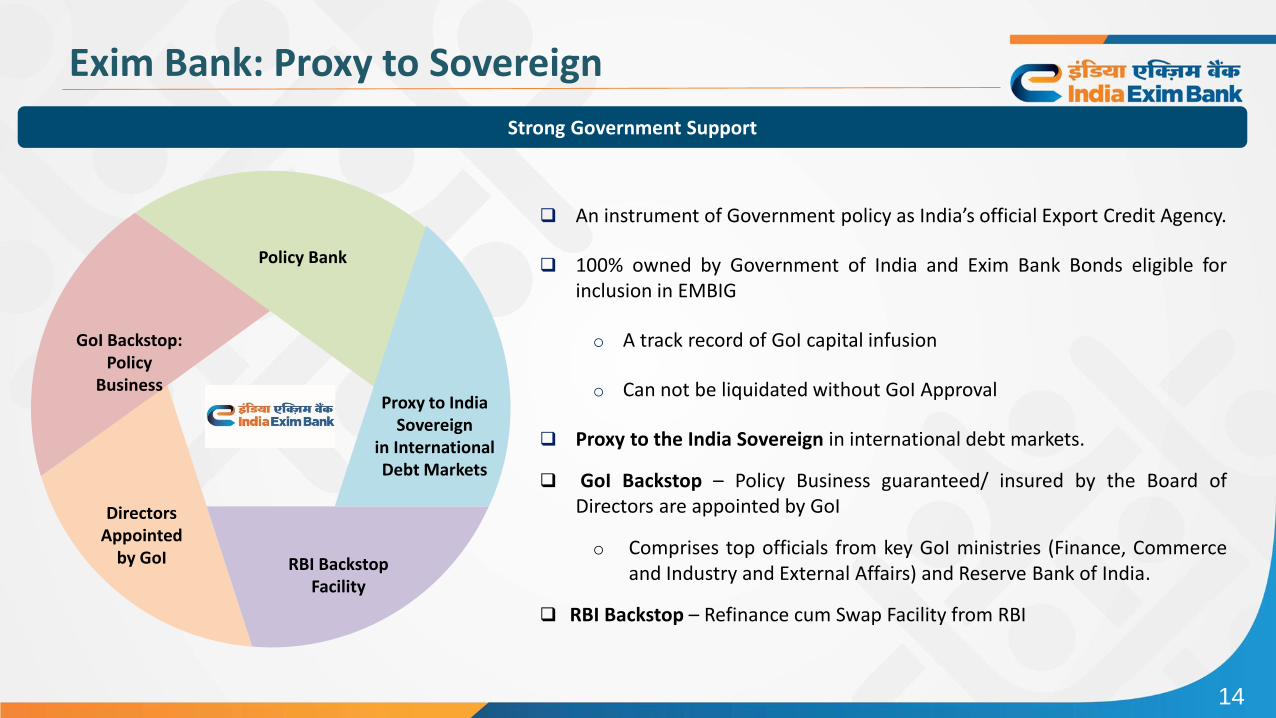
An instrument of Government policy as India’s official Export Credit Agency.
100% owned by Government of India and Exim Bank Bonds eligible forinclusion in EMBIG
o A track record of GoI capital infusion
o Can not be liquidated without GoI Approval
Proxy to the India Sovereign in international debt markets.
GoI Backstop – Policy Business guaranteed/ insured by the Board ofDirectors are appointed by GoI
o Comprises top officials from key GoI ministries (Finance, Commerceand Industry and External Affairs) and Reserve Bank of India.
RBI Backstop – Refinance cum Swap Facility from RBI
14

Exim Bank: Capital Infusion / Proxy to Sovereign
Exim’s credit rating has been on par with India
sovereign rating since its establishment
International Rating is BBB+ (Stable)
Government Capital Infusion
International Rating is Baa3 (Negative)
International Rating is BBB- (Negative)
International Rating is BBB- (Stable)
Domestic Rating is AAA (Stable)
Domestic Rating is AAA (Stable)
15
13
5 5
50
15
FY16 FY17 FY18 FY19 FY20
(INR bn)
Budget allocation of ₹ 13 bn for FY21 from GoI towards capital, received in June 2020.

Exim Bank’s Line of Business
Export Finance
Lines of Credit / CFS
Buyer’s Credit –NEIA
Pre-Shipment Credit
Post-Shipment Credit
Guarantees and L/Cs
Export Capability Creation
Working Capital
Export Product Development
Export Facilitation
Overseas Investment
Finance
Import Finance
Guarantees and L/Cs
Loan Portfolio (1)(3) Non-Funded Portfolio (1)(3)
Risk Exposure (1) Country Exposure (1)(2)(3)
(1) as on March 31, 2020; (2) Excluding 39% Indian exposure; (3) Exposures value of less than 1% are excluded
INR 159 bn
Export Finance 67.18%
Term Loan to Exporters
19.11%
Overseas Investment Finance 7.30%
Import Finance 3.72%
Export Facilitation 2.65%
GOI Risk, 60%
Corporate Risk
Secured, 30%
Bank Risk/ Corporate risk Unsecured, 10%
16
INR 994 bnTerm Loans
Exim Bank: Line of Business
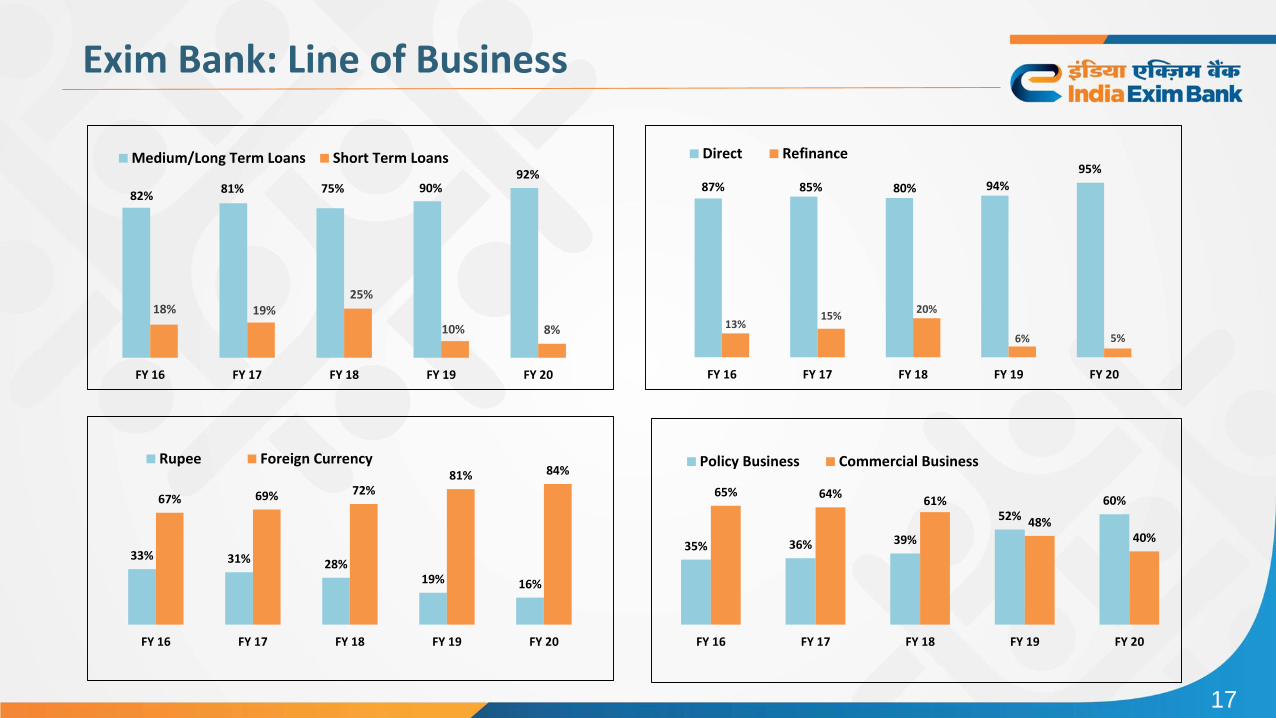
82%81% 75% 90%
92%
18% 19%25%
10% 8%
FY 16 FY 17 FY 18 FY 19 FY 20
Medium/Long Term Loans Short Term Loans
33% 31% 28%19% 16%
67% 69% 72%81% 84%
FY 16 FY 17 FY 18 FY 19 FY 20
Rupee Foreign Currency
35% 36% 39%
52%60%
65% 64%61%
48%40%
FY 16 FY 17 FY 18 FY 19 FY 20
Policy Business Commercial Business
13%15%
20%
6% 5%
87% 85% 80% 94%
95%
FY 16 FY 17 FY 18 FY 19 FY 20
Direct Refinance
17

Asset Quality
9.24%
10.37%
11.34%
8.75%
4.68%
3.75%
2.44%1.77%
55%
71%
85%89%
7.02%4.18% 2.74%
1.94%
2.06%
5.52%1.72% 1.70%
0.00%
2.00%
4.00%
6.00%
8.00%
10.00%
12.00%
FY 17 FY 18 FY 19 FY 20
Gross NPA
Net NPA
PCR
Slippage Ratio
Credit Cost Ratio
Current credit watchlist of INR 20.86bn including IL&FS Group (INR 2.11 bn) [2]
Note: (1) Excludes advances under Lines of Credit, Buyer’s Credit under NEIA and staff loans which cannot be classified under any particular sector; (2) As on March 31, 2020; (3) Others includes industries with exposure less than 1% of the Gross Loan Outstanding.
NPA Ratios
5.71%
4.20%
3.55%
3.53%
3.01%
2.95%
2.17%
2.07%
1.42%
1.12%
1.11%
1.07%
1.05%
11.17%
0.00%
4.22%
24.61%
2.31%
5.74%
5.40%
0.00%
2.90%
1.31%
5.97%
9.78%
0.00%
8.94%
28.82%
Bank & FIs
Ferrous Metal & Processing
Oil and Gas
Chemicals and Dyes
Textile Garment
Petrochemicals
Petroleum Products
Drugs & Pharma
Shipping Services
Agro & Food Processing
Mining & Minerals
Tyres
EPC Services
Others
Standard Gross NPL
% of Total Loan outstanding NPLs as % of Total GNPLs
18
Gross Loans outstanding by Major Industries(1)(2)(3)

Asset Quality
Asset Quality of Commercial Portfolio (1)(2)
(1) As on March 31,2020; (2) Excluding refinance to banks
AA & above50%
A26%
BBB10%
BB & below5%
No Rating9%
AA & above A BBB BB & below No Rating
Out of total PA exposure as of March 31, 2020,
50% are rated AA and above and 85% are BBB and above
19
RBI– Regulatory Package
Under the Regulatory Packages announced by RBI in March & May 2020
moratorium on interest and/ or principal repayments due in the
following periods has been permitted:
1st moratorium Period : March 01, 2020 – May 31, 2020
2nd moratorium Period: June 01, 2020 – August 31, 2020
Impact on Exim Bank
Exim has offered the above Package for its entire Commercial LoanPortfolio, details of which are as under:
RBI 1st Moratorium PackagePrincipal deferred amounted to ₹ 565 crore under Loans aggregating ₹ 9,545 crore (which constituted 29% of aggregate PA Commercial Loans outstanding as on 29.02.2020).
RBI 2nd Moratorium PackagePrincipal deferred amounted to ₹ 970 crore under Loans aggregating ₹ 11,268 crore (which constituted 33% of aggregate PA Commercial Loans outstanding as on 31.05.2020).

Exim Bank-Financial Highlights
[1] Includes loans and advances to industrial concerns, scheduled banks, foreign governments and other financial institutions and bills of exchange and promissory notes discounted / rediscounted. Amounts stated are net of provisions for non-performing assets (NPAs).
Capital Strength
14.29%8.82%
17.71% 18.70%
1.52%
1.53%
1.36% 1.43%15.81%
10.35%
19.07%
FY17 FY18 FY19 FY20Tier I (%) Tier II (%) CAR (%)
20.13%
Profitability Solvency Ratio
Total Assets, Loans and Advances(1)
1,1
72
1,2
35
1,1
46
1,3
08
1,0
26
1,0
75
93
6
99
4
36% 39%
52% 60%
FY17 FY18 FY19 FY 20
(IN
R b
n)
Total Assets Policy Business (Loans and Advances) Commercial Business (Loans and Advances)
64% 61%48% 40%
20
24
.81
19
.31
20
.68
20
.31
19
.39
16
.52
19
.70
19
.94
21
.68
61
.61
18
.81
17
.88
0.4
1
(29
.24
)
0.8
2
1.2
4
1.70
1.31 1.56 1.54
FY17 FY18 FY19 FY20
Operating Profit (INR bn) Net Interest Income (INR bn)Provisions (INR bn) Net Profit (INR bn)NIM (%)
Asset Liability Management
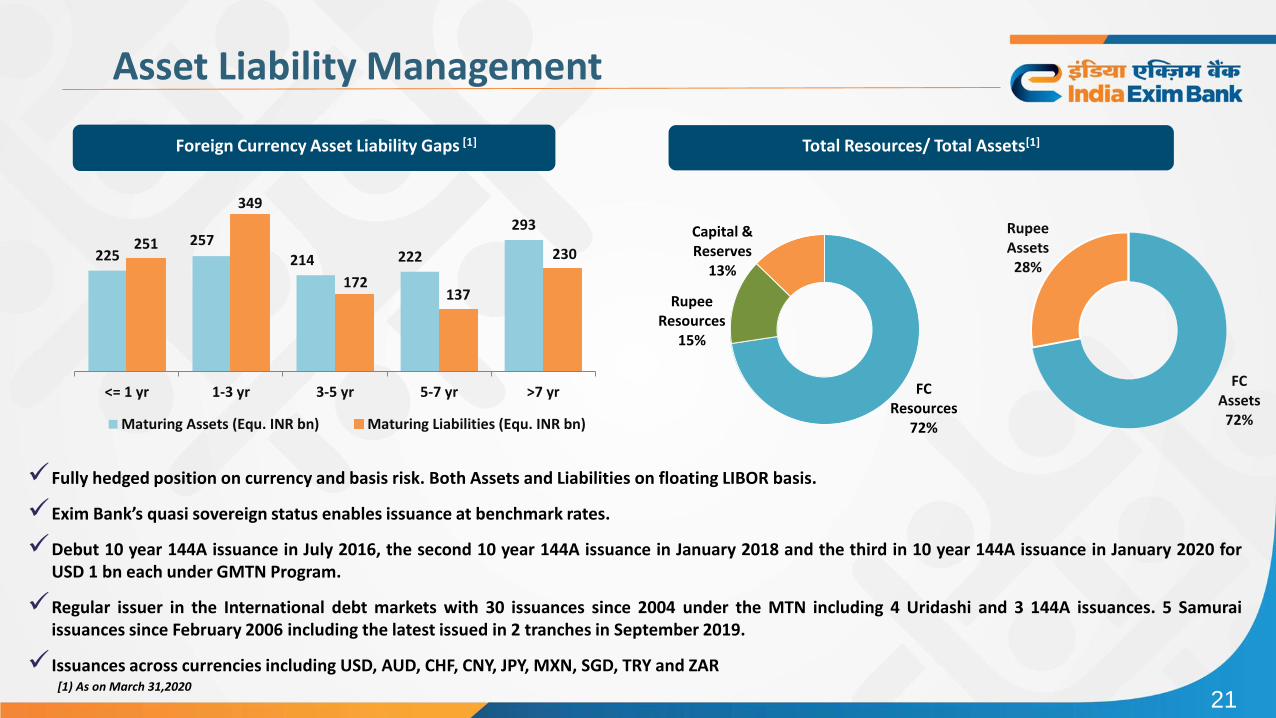
Foreign Currency Asset Liability Gaps [1]
225257
214 222
293251
349
172137
230
<= 1 yr 1-3 yr 3-5 yr 5-7 yr >7 yr
Maturing Assets (Equ. INR bn) Maturing Liabilities (Equ. INR bn)
Fully hedged position on currency and basis risk. Both Assets and Liabilities on floating LIBOR basis.
Exim Bank’s quasi sovereign status enables issuance at benchmark rates.
Debut 10 year 144A issuance in July 2016, the second 10 year 144A issuance in January 2018 and the third in 10 year 144A issuance in January 2020 forUSD 1 bn each under GMTN Program.
Regular issuer in the International debt markets with 30 issuances since 2004 under the MTN including 4 Uridashi and 3 144A issuances. 5 Samuraiissuances since February 2006 including the latest issued in 2 tranches in September 2019.
Issuances across currencies including USD, AUD, CHF, CNY, JPY, MXN, SGD, TRY and ZAR[1) As on March 31,2020
Total Resources/ Total Assets[1]
FC Resources
72%
Rupee Resources
15%
Capital & Reserves
13%
FC Assets72%
Rupee Assets28%
21

Exim Bank - Board of Directors Rahul Chhabra
Secretary (ER), Ministry of External Affairs
Bidyut Behari Swain
Special Secretary, Ministry of Commerce and Industry
Anand Singh Bhal
Senior Economic Adviser, Ministry of Commerce and Industry
Kalyanaraman Rajaraman
Additional Secretary (Investment), Ministry of Finance
Pankaj Jain
Additional Secretary, Ministry of Finance
Indrani Banerjee
Executive Director, Reserve Bank of India
Rajnish Kumar
Chairman, State Bank of IndiaM. Senthilnathan
Chairman-cum- Managing Director, ECGC Ltd.
Rakesh Sharma
Managing Director and CEO, IDBI BankRajkiran Rai Gundyadka
Managing Director and CEO, Union Bank of India
A S Rajeev
Managing Director and CEO, Bank of Maharashtrax`David Rasquinha
Managing Director
Harsha Bangari
Deputy Managing Director
Directors representing Ministries of Finance, Commerce and External Affairs Director representing regulator - RBI
Directors representing major Indian Public Sector Banks Director representing India’s Export Credit Insurance Company Whole Time Directors 22

Appendix

Financial Highlights
Balance Sheet
Figures in INR mn FY17 FY18 FY19 FY20
Cash and Bank Balance 36,909 28,155 42,120 128,791
Investments 51,029 56,969 93,274 108,371
Loans and Advances(1) 1,026,410 1,075,321 936,171 994,465
Fixed Assets 1,298 1,259 2,277 3,729
Other Assets 56,427 73,486 72,412 73,051
Total Assets 1,172,074 1,235,190 1,146,254 1,308,407
Paid up Capital & Reserves(2) 120,239 96,002 146,736 162,851
Deposits 3,726 2,861 2,528 2,314
Notes, Bonds and Debentures 806,930 865,817 779,196 906,281
Borrowings 150,073 172,973 141,318 143,067
Profit and Loss Account 41 - 82 124
Other Liabilities & Provisions 91,065 97,537 76,394 93,770
Total Liabilities 1,172,074 1,235,190 1,146,254 1,308,407
Note: (1) Includes loans and advances to industrial concerns, scheduled banks, foreign governments and other financial institutions and bills of exchange and promissory notes discounted / rediscounted. Amounts stated are net of provisions for non-performing assets (NPAs). ; (2) Includes paid-up capital and reserves. 24

Financial Highlights
Profit and Loss Summary
Figures in INR mn FY17 FY18 FY19 FY20
Interest Earned 84,411 82,384 87,266 82,464
Interest Expended 65,022 65,863 67,567 62,520
Net Interest Income 19,389 16,521 19,699 19,944
Non-Interest Income 7,942 5,399 3,700 4,067
Non-Interest Expense 2,525 2,608 2,718 3,698
Net Non-Interest Income 5,417 2,791 982 369
Operating Profit 24,806 19,312 20,681 20,313
Provisions and Contingencies 21,680 61,610 18,806 17,876
Profit / (Loss) Before Tax (PBT) 3,126 (42,298) 1,875 2,437
Tax (Net of Deferred Tax) 2,714 (13,061) 1,058 1,199
Profit / (Loss) after Tax (PAT) 412 (29,237) 817 1,238
25

Financial Highlights
Key Ratios
FY17 FY18 FY19 FY20
Net Interest Margin 1.70% 1.31% 1.56% 1.54%
Gross NPA 9.24% 10.37% 11.34% 8.75%
Net NPA 4.68% 3.75% 2.44% 1.77%
ROAA 0.04% -ve 0.07% 0.10%
ROAE 0.62% -ve 1.04% 0.94%
CRAR 15.81% 10.35% 19.07% 20.13%
Core CRAR 14.29% 8.82% 17.71% 18.70%
Slippage Ratio 7.02% 4.18% 2.74% 1.94%
Credit Cost 2.06% 5.52% 1.72% 1.70%
26

Insolvency and Bankruptcy Code: Faster NPA resolution
Exim’s Loan Accounts under Exposure to NCLT #(1)
OutstandingAmount
Provision (%)
Net Book Value
Expected Recovery
(A) Exim Loans admitted/ referred
52.64 85% 7.94 10.04
(B) Guarantors for Exim Loans[2] 9.49 87% 1.27 3.29
Total 62.13 85% 9.21 13.33
Non Performing Assets(1)
Lending Programme% of Total
NPAs
% of Gross Loans
Overseas Investment Finance 48.68 4.26
Term Loan to Exporters * 26.83 2.35
Export Finance ** 16.96 1.49
Import Finance 7.49 0.65
Export Facilitation 0.04 0.00
Total100 8.75
Note: # National Company Law Tribunal(1) As on March 31,2020; [2] Corporate under NCLT which are Guarantor to the Loans extended by Exim Bank.* includes Export Oriented Units (EOUs), ** includes Buyers Credit, Deemed exports, EPCDF and PPSC etc.
INR bn
27
A
Issuances in International Debt Markets
28
Upto March 2009
FY 2009-10
FY 2010-11
FY 2011-12 FY 2013-14 FY 2015-16 FY 2017-18
FY 2012-13 FY 2014-15 FY 2016-17 FY 2018-19
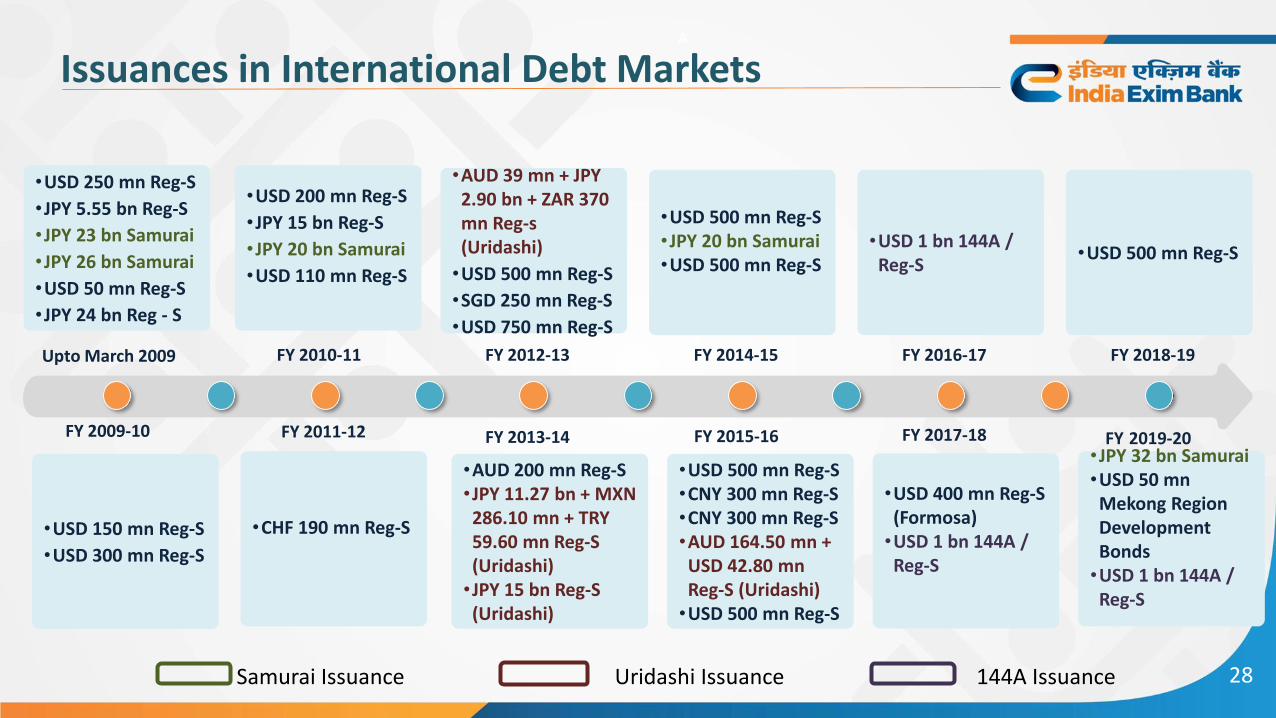
•USD 250 mn Reg-S
•JPY 5.55 bn Reg-S
•JPY 23 bn Samurai
•JPY 26 bn Samurai
•USD 50 mn Reg-S
•JPY 24 bn Reg - S
•USD 200 mn Reg-S
•JPY 15 bn Reg-S
•JPY 20 bn Samurai
•USD 110 mn Reg-S
•AUD 39 mn + JPY 2.90 bn + ZAR 370 mn Reg-s (Uridashi)
•USD 500 mn Reg-S
•SGD 250 mn Reg-S
•USD 750 mn Reg-S
•USD 500 mn Reg-S•JPY 20 bn Samurai•USD 500 mn Reg-S
•USD 1 bn 144A / Reg-S
•USD 500 mn Reg-S
Samurai Issuance Uridashi Issuance 144A Issuance
•USD 150 mn Reg-S
•USD 300 mn Reg-S
•CHF 190 mn Reg-S
•AUD 200 mn Reg-S•JPY 11.27 bn + MXN 286.10 mn + TRY 59.60 mn Reg-S (Uridashi)•JPY 15 bn Reg-S (Uridashi)
•USD 500 mn Reg-S•CNY 300 mn Reg-S•CNY 300 mn Reg-S•AUD 164.50 mn + USD 42.80 mnReg-S (Uridashi)•USD 500 mn Reg-S
•USD 400 mn Reg-S (Formosa)•USD 1 bn 144A / Reg-S
FY 2019-20•JPY 32 bn Samurai•USD 50 mnMekong Region Development Bonds•USD 1 bn 144A / Reg-S

Key Highlights of Recent Policy Announcements
Agriculture • Major policy measures announced include ₹ 1 lakh cr Agri Infrastructure Fund for farm-gate infrastructure, amendment of
the Essential Commodities Act, and announcement of a framework for free sale of agricultural produce, among others. Intra-
state trade, policies related to free sale of agricultural produce, and contract farming are also expected to boost farmer
incomes.
• ₹ 30,000 cr additional refinance support for crop loan requirement of Rural Co-op Banks & RRBs through NABARD.
• ₹ 2 Lakh Crore Concessional Credit boost to 2.5 crore farmers through Kisan Credit Cards.
• ₹ 10,000 cr scheme for Micro Food Enterprises (MFE) for technical upgradation to attain FSSAI food standards, build brands
and marketing.
• National Animal Disease Control Programme (₹13,343 cr) and Animal Husbandry Infrastructure Development Fund (₹15,000
cr) announced.
• From ‘TOP’ to TOTAL (₹ 500 cr) - operation greens that stabilizes supply of Tomato, Onion, Potato (TOP) to all vegetables.
Reforms for
Businesses
• Reforms for businesses broadly envisage increasing threshold to initiate insolvency proceedings to ₹ 1 cr (from ₹ 1 lakh),
decriminalization of Companies Act defaults, suspension of IBC proceedings for 1 year, and a new comprehensive
Public Sector Enterprise Policy.
• All strategic sectors will have atleast one PSE and maximum 4 PSEs, and all ‘other’ sectors will be open to private investments29
‘Atmanirbhar Bharat Abhiyaan’ announced by GoI worth ₹ 20.97 lakh cr (nearly 10% of India’s GDP) to cushion the
economy from the coronavirus blow; these include the monetary policy measures announced by RBI
The package aims at having a self-reliant India, by focusing on the need to manufacture in India at a quality that is good
enough to be exported globally.
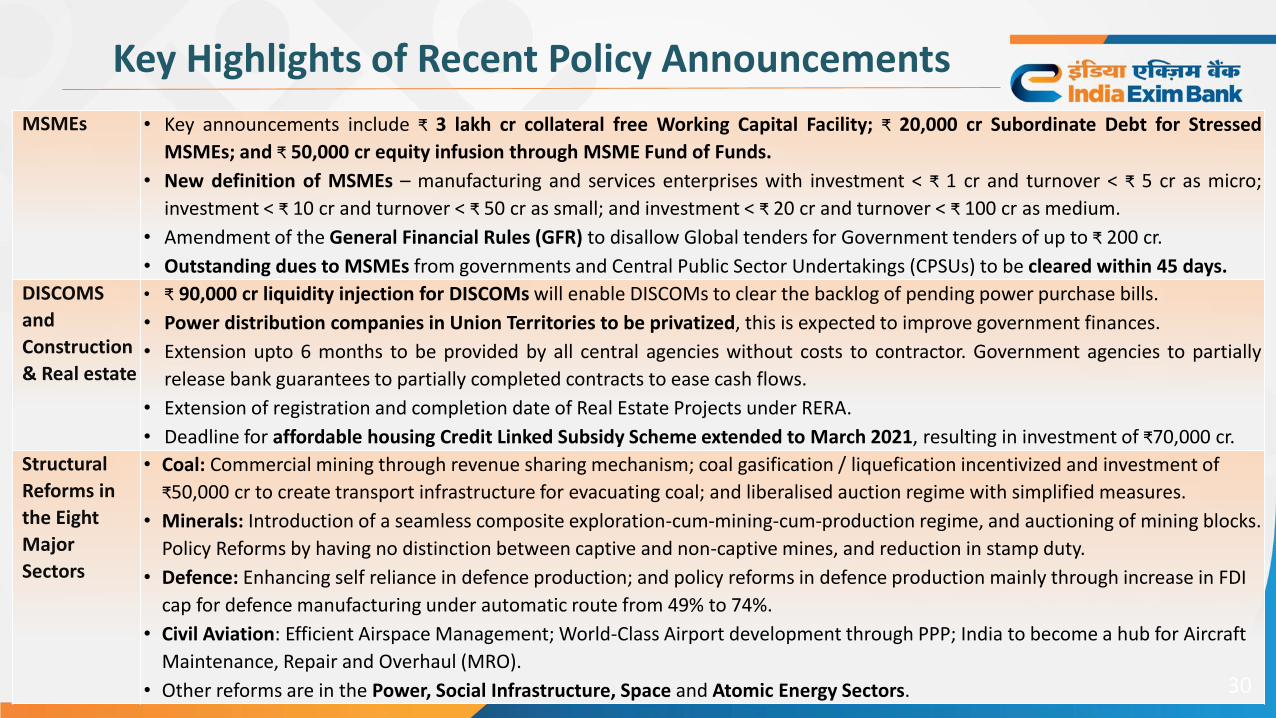
MSMEs • Key announcements include ₹ 3 lakh cr collateral free Working Capital Facility; ₹ 20,000 cr Subordinate Debt for Stressed
MSMEs; and ₹ 50,000 cr equity infusion through MSME Fund of Funds.
• New definition of MSMEs – manufacturing and services enterprises with investment < ₹ 1 cr and turnover < ₹ 5 cr as micro;
investment < ₹ 10 cr and turnover < ₹ 50 cr as small; and investment < ₹ 20 cr and turnover < ₹ 100 cr as medium.
• Amendment of the General Financial Rules (GFR) to disallow Global tenders for Government tenders of up to ₹ 200 cr.
• Outstanding dues to MSMEs from governments and Central Public Sector Undertakings (CPSUs) to be cleared within 45 days.
DISCOMS
and
Construction
& Real estate
• ₹ 90,000 cr liquidity injection for DISCOMs will enable DISCOMs to clear the backlog of pending power purchase bills.
• Power distribution companies in Union Territories to be privatized, this is expected to improve government finances.
• Extension upto 6 months to be provided by all central agencies without costs to contractor. Government agencies to partially
release bank guarantees to partially completed contracts to ease cash flows.
• Extension of registration and completion date of Real Estate Projects under RERA.
• Deadline for affordable housing Credit Linked Subsidy Scheme extended to March 2021, resulting in investment of ₹70,000 cr.
Structural
Reforms in
the Eight
Major
Sectors
• Coal: Commercial mining through revenue sharing mechanism; coal gasification / liquefication incentivized and investment of
₹50,000 cr to create transport infrastructure for evacuating coal; and liberalised auction regime with simplified measures.
• Minerals: Introduction of a seamless composite exploration-cum-mining-cum-production regime, and auctioning of mining blocks.
Policy Reforms by having no distinction between captive and non-captive mines, and reduction in stamp duty.
• Defence: Enhancing self reliance in defence production; and policy reforms in defence production mainly through increase in FDI
cap for defence manufacturing under automatic route from 49% to 74%.
• Civil Aviation: Efficient Airspace Management; World-Class Airport development through PPP; India to become a hub for Aircraft
Maintenance, Repair and Overhaul (MRO).
• Other reforms are in the Power, Social Infrastructure, Space and Atomic Energy Sectors. 30
Key Highlights of Recent Policy Announcements

Liquidity for
Banks
• Reduced policy rate - Repo rate under the liquidity adjustment facility (LAF) to 4.0% from 5.15%; Reverse repo rate under theLAF stands reduced to 3.35%; and Marginal Standing Facility (MSF) rate and the Bank Rate reduced to 4.25% from 5.40%.
• Targeted Long Term Repo Operations (TLTRO) to a total amount of up to ₹ 1,00,000 cr, later followed by TLTRO 2.0 for NBFCs/MFIs of ₹ 50,000 cr.
• Cash Reserve Ratio (CRR) reduced by 100 bps to 3.0% of net demand and time liabilities (NDTL). Minimum daily maintenanceof CRR was reduced from 90% of the prescribed CRR to 80% till September 25, 2020.
• Under the MSF, borrowing limits increased from 2% to 3% of NDTL.
• Banks permitted to deal in Offshore Non-Deliverable Forward Rupee Derivative Markets (Offshore NDF Rupee Market) fromJune 1, 2020 to contain the volatility of the Rupee.
Financial
Institutions
• Special refinance facility of ₹ 50,000 cr through SIDBI, NABARD and NHB for NBFCs, HFCs and MFIs. Special Refinance
Facility of ₹ 15,000 cr to SIDBI for on-lending/refinancing.
• Liquidity Facility for Exim Bank of India through a line of credit of ₹ 15,000 cr for a period of 90 days (with rollover up to
one year) to enable it to avail a US dollar swap facility.
NBFCs • ₹ 30,000 cr Special Liquidity Scheme for NBFC/HFC/MFIs and ₹ 45,000 cr Partial Credit Guarantee Scheme for Liabilities of
NBFCs/MFIs.
• Under the ₹30,000 cr Special Liquidity Scheme, investments in both primary and secondary market transactions in
investment grade debt paper of NBFCs/HFCs/MFIs will be backed by government guarantees.
• ₹45,000 cr Partial Credit Guarantee Scheme invested by banks in NBFC paper below AA ratings will be covered with a first
loss guarantee of 20%.
31
Key Highlights of Recent Policy Announcements
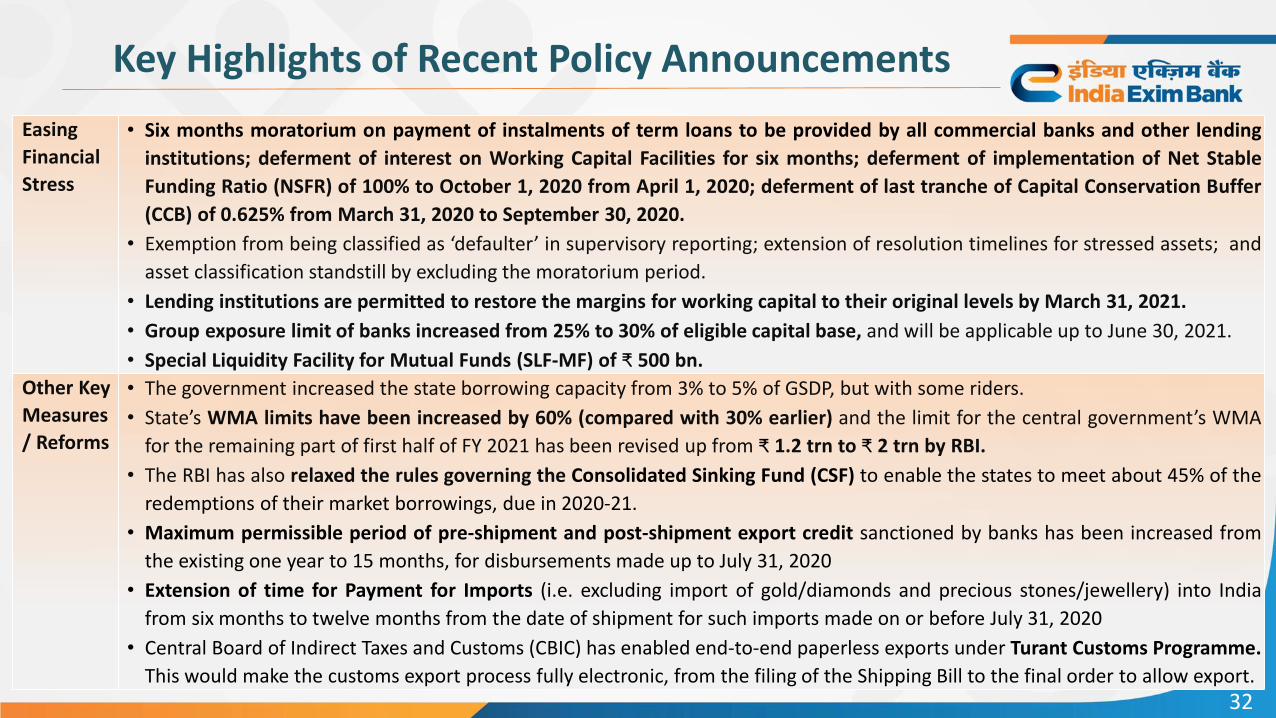
Easing
Financial
Stress
• Six months moratorium on payment of instalments of term loans to be provided by all commercial banks and other lending
institutions; deferment of interest on Working Capital Facilities for six months; deferment of implementation of Net Stable
Funding Ratio (NSFR) of 100% to October 1, 2020 from April 1, 2020; deferment of last tranche of Capital Conservation Buffer
(CCB) of 0.625% from March 31, 2020 to September 30, 2020.
• Exemption from being classified as ‘defaulter’ in supervisory reporting; extension of resolution timelines for stressed assets; and
asset classification standstill by excluding the moratorium period.
• Lending institutions are permitted to restore the margins for working capital to their original levels by March 31, 2021.
• Group exposure limit of banks increased from 25% to 30% of eligible capital base, and will be applicable up to June 30, 2021.
• Special Liquidity Facility for Mutual Funds (SLF-MF) of ₹ 500 bn.
Other Key
Measures
/ Reforms
• The government increased the state borrowing capacity from 3% to 5% of GSDP, but with some riders.
• State’s WMA limits have been increased by 60% (compared with 30% earlier) and the limit for the central government’s WMA
for the remaining part of first half of FY 2021 has been revised up from ₹ 1.2 trn to ₹ 2 trn by RBI.
• The RBI has also relaxed the rules governing the Consolidated Sinking Fund (CSF) to enable the states to meet about 45% of the
redemptions of their market borrowings, due in 2020-21.
• Maximum permissible period of pre-shipment and post-shipment export credit sanctioned by banks has been increased from
the existing one year to 15 months, for disbursements made up to July 31, 2020
• Extension of time for Payment for Imports (i.e. excluding import of gold/diamonds and precious stones/jewellery) into India
from six months to twelve months from the date of shipment for such imports made on or before July 31, 2020
• Central Board of Indirect Taxes and Customs (CBIC) has enabled end-to-end paperless exports under Turant Customs Programme.
This would make the customs export process fully electronic, from the filing of the Shipping Bill to the final order to allow export.32
Key Highlights of Recent Policy Announcements