SRI LANKA: COMPANY PERSPECTIVES - International Trade Centre

WORKING PAPER NO. 82
INDIA’S INFORMAL TRADE WITH SRI LANKA
NISHA TANEJA
APRIL, 2002
INDIAN COUNCIL FOR RESEARCH ON INTERNATIONAL ECONOMIC RELATIONS
Core-6A, 4th Floor, India Habitat Centre, Lodi Road, New Delhi-110 003
Contents
Foreword ..................................................................................................................................i
1 Introduction ...................................................................................................................1 1.1 Background..................................................................................................................... 1 1.2 Framework for Analysis ................................................................................................. 2 1.3 Methodology................................................................................................................... 5 1.4 Design of the Survey(s) .................................................................................................. 8 1.5 Limitations of the Study ................................................................................................. 9
2 Survey-Based Estimation of Indo-Sri Lanka Informal Trade .....................................10 2.1 Sampling Design of the Survey .................................................................................... 10 2.2 Estimates of Air-borne Informal Trade ........................................................................ 11 2.3 Estimates of Sea-borne Informal Trade........................................................................ 13 2.4 Estimates of Trade Balance .......................................................................................... 14 2.5 Composition of Air-borne Informal Trade ................................................................... 14 2.6 Composition of Sea-borne Informal trade .................................................................... 16 2.7 Perceptions on Impact of Trade Liberalization on Informal Trade ............................ 17 2.8 Summary of Survey-Based Estimates .......................................................................... 18
3. Characteristics of Indo-Sri Lanka Informal Trading ...................................................19 3.1 Sampling Design .......................................................................................................... 20 3.2 Characteristics of Traders............................................................................................. 21 3.3 Transacting Environment of Informal Trading............................................................. 22 3.4 Transacting Environment of Formal Trading............................................................... 30 3.5 Factors behind Informal Trading.................................................................................. 32 3.6 Discriminating Characteristics of Formal and Informal Trading ................................. 34
4. Summary and Policy Implications...............................................................................41
References .............................................................................................................................45
Appendix ...............................................................................................................................48
Foreword
The present study is part of a research project at ICRIER on India’s Informal Trade with Sri Lanka and Nepal, which is being carried out in collaboration with the International Center for Ethnic Studies, Colombo and the Nepal Council for Development Research under the aegis of SANEI. This paper prepares quantitative estimates of the informal trade between India and Sri Lanka and spells out the institutional mechanism that governs such trade. The study is based on an extensive survey carried out in the Indian cities of Chennai, Trichy, Thiruvananthapuram, Tuticorin, Mumbai and Rameshwaram.
The study suggests that informal trade between India and Sri Lanka is largely a one way trade from India to Sri Lanka and is almost a third of the total value of trade through formal channels. Informal traders have developed efficient mechanisms for information flows, risk sharing and risk mitigation. The survey data reveals that the transaction costs of trading in the informal channels are significantly lower than in the formal channel. Ethnic trading networks between trading partners continue to facilitate informal trade by reducing transaction costs through minimization of risk costs, market information and search costs. An important policy implication of the study is that improving the transacting environment of formal traders would lead to lower informal trade but such trade would be difficult to eliminate.
I hope that this study will contribute to a larger understanding of the issues involved in informal trade in the South Asian region.
(Isher Judge Ahluwalia) Director & Chief Executive
ICRIER
April, 2002
i
India’s Informal Trade with Sri Lanka
Nisha Taneja
1 Introduction1
1.1 Background
Two earlier studies at ICRIER on informal trade have focussed on the empirical
documentation of the magnitude and composition of informal trade flows in the region
(Taneja 1999) and on an in-depth analysis of the institutional aspects of India’s informal
trade with Bangladesh and Nepal (Pohit and Taneja 2000). It is pointed out in Taneja
(1999) that Chaudhari (1995) provides comprehensive estimates of the magnitude and
composition of India’s informal trade between India and Bangladesh. The second ICRIER
study has examined India's informal trade with Bangladesh and Nepal focussing on
qualitative but equally important institutional aspects underlying informal trade in contrast
to formal trade: the nature of markets in informal trade, the types of mechanisms
supporting information flows as well as the governance of contractual relations in these
markets. A third study is currently being undertaken at ICRIER under the aegis of SANEI.
It aims at preparing estimates of informal trade in the region where such estimates are
lacking or inadequate and examining the institutional aspects of informal trading for
countries where such an analysis has not been undertaken. These gaps are with regard to (i)
estimation of India's informal trade with Sri Lanka and Nepal, and (ii) analysing
institutional mechanisms supporting informal trade between India and Sri Lanka. In this
manner the study hopes to achieve a reasonable understanding of the functioning of
informal trading markets in the South Asian region.
The present paper highlights partial findings of the ongoing study at ICRIER. It
attempts at estimating the magnitude of India's informal trade with Sri Lanka in terms of
volume, value and structure. The paper also makes an attempt to understand the
1 I am extremely grateful to Isher Judge Ahluwalia, K.L. Krishna, T. N. Srinivasan and Mohsin Khan for
useful comments. I am also grateful to Sanjib Pohit, Muttukrishna Sarvananthan and Binod Karmacharya for useful comments at various stages of the project. Sumana Mazumdar has provided able research assistance throughout the study.
1
institutional aspects underlying informal trade between India and Sri Lanka. There is no
land border between India and Sri Lanka and informal trade takes place either by air or by
sea. While informal trade through the air channel is carried out through passenger traffic,
by sea it is carried out by country boats.2 The paper is based on the results of a survey
carried out in the Indian cities of Chennai, Tiruchirapalli, Thiruvananthapuram, Tuticorin,
Rameshwaram and Mumbai.
1.2 Framework for Analysis
What is the rationale for estimating the magnitude of informal trade through
primary survey? Perhaps the prime question is why the study does not use secondary data
for estimating the value of informal trade. As one of the prime objectives of the study is to
prepare estimates of the value of unrecorded trade flows, analysis based on secondary data
may not be very meaningful. Some studies have tried to estimate the value of illegal trade
activities through the method of Partner-Country Data Comparison.3 In practice, this form
of informal trade is carried out by under/over invoicing of exports/imports. Basically, the
method is to compare the export/import data of the trading partners concerned. The
important point is that the method uses recorded trade statistics. A country’s export of a
particular good should equal the import of the same good by its trading partner and vice
versa. If not, then it may be inferred that false invoicing is taking place. The extent of
informal trade is hence measured by the degree of fake invoicing. However there are
several caveats to this method. For instance there could be errors in measuring freight and
insurance costs because of which trade estimates could be inaccurate. Partner-Country
Data Comparisons may not be accurate because one country’s export may be accounted in
one fiscal year and its trading partner’s import of the same good may be accounted in
another fiscal year. Also such comparisons may also be less effectual when faking of
invoices take place at both ends of the international trade. This is more likely the
case when both the trading partners are developing countries. In developing countries
of South Asia, where trade recording systems are poor partner country data comparisons
may not reveal the real extent of fake invoicing. 2 Goods carried by air passengers are not recorded in official trade statistics. 3 For an extremely lucid account see Sarvananthan (2001) 2

What emerges from the above discussion is that international trade data present
considerable difficulties for partner-country data comparison. However, if trade is not
recorded at both ends which is a prominent feature in the South Asian countries, then
partner-country data comparison is not a valid method. As for the present study we have
defined informal trade as unrecorded trade flows, that are not captured by official national
statistics, we need to use primary data generated through a survey for quantification of
such flows.
In order to understand the functioning of informal trading markets the analysis has
been carried out using the framework developed in Pohit and Taneja (2000). In this paper a
more formal presentation of the framework is attempted. To begin with, it is useful to draw
on the notion of institutions. While there is still a lack of agreement on the precise
definition of institutions there is growing consensus on institutions as a set of collectively
defined rules, norms and constraints that govern the behavior of individuals or groups.
These rules and constraints can be formal or informal (Nabli and Nugent 1989a ; 1989b).
The current analysis is carried out using insights from the New Institutional
Economics (NIE). The NIE differs from both neo-classical economics and from the 'old
institutional approach'. While neo-classical economics focuses on perfect markets, it is
devoid of institutions. The 'old institutional approach' on the other hand, recognizes the
importance of institutions but does not provide a theoretical foundation (Langlois 1986).
Four distinguishing features of New Institutional Economics vis-a-vis conventional
economics are that; (a) there is more to the economy than the market, (b) the economy is
dynamic, evolutionary and holistic and hence it has to be analyzed accordingly, (c) whilst
acknowledging the importance of studying individual behavior (methodological
individualism) it is more important to study the intricacies and processes of group
behaviour (methodological collectivism), and (d) studies of empirical phenomena should
not exclusively depend on artificial or contrived a priori deductive exercises but should be
3
based on appropriate data. (Samuels, Vol. I, 1988: 3). All these features particularly the
last one, have a bearing on our study on informal trade in the SAARC region.
Thus a salient feature of the NIE is that acquiring market information and
concluding market transactions have costs and this feature is absent in the theoretical
framework of neo-classical economics. Institutions are intermediaries through which
information and transaction costs are reduced. The NIE incorporates transaction costs in
exchange relationships and takes into account the impediments to economic performance
caused by institutions, which is an improvement over neo-classical economics (Harriss,
Hunter and Lewis, 1995: 3). Accordingly, NIE provides a relatively predictable framework
on the role of institutions in facilitating exchange by reducing transaction costs and
overcoming imperfect information as compared to neo-classical economics.(Assaad 1993;
Bardhan 1989).
Landa (1994) goes beyond the NIE paradigm and brings to focus the role of ethnic
trading networks in developing societies as an alternative to contract law in developed
societies. Thereby she integrates sociological and anthropological concepts with NIE.
Thus, ethnic trading networks functiosn as an institution that facilitates economizing on
transaction costs of traders. Landa draws her arguments from the experience of Chinese
traders in Southeast Asia. Likewise, MacGaffey and Bazenguissa-Ganga (2000) highlight
the ethnic, kinship, religious, and friendship networks of Congolese traders that transcend
international boundaries. Sarvananthan (2001) also highlights the role of ethnic affinities
of Tamils and Muslims of Sri Lanka for understanding the nature, causes, and effects of
Indo-Lanka informal trade.
In the present context it is argued that while both institutional arrangements i.e. the
formal and informal, facilitate trade in goods across countries, they are carried out at a cost
viz., transactions cost. A rational behavior would imply that a more efficient institution (in
terms of lower costs) should be preferred over less efficient one (Coase 1960).
4

As transaction costs arise from the transacting environment of informal and formal
trade, it is important to understand transacting environments in which exchange takes
place. In fact examining the transacting environments would enable discerning factors
influencing informal trade. What demarcates formal traders from informal traders? Under
formal trading arrangements, the recourse to law defines contracts between two contracting
parties. This ensures that goods move across borders and payments are guaranteed. At the
same time contracting parties in informal trade cannot resort to law for the violation of
terms of the contract. Consequently, it is reasonable to assume that individuals trading
through informal channel have developed parallel institutional mechanisms for contract
enforcement and dispute settlement. It therefore becomes imperative to focus on issues of
enforcement mechanisms including aspects of risk and information in informal trading. At
the same time, it is important to understand the institutional structure that supports formal
trade where exchange is affected by factors, such as, administrative processes, government
rules and regulations, infrastructure bottlenecks etc.
1.3 Methodology
Two aspects of informal trade are investigated in the study- (i) estimation of
informal trade and (ii) assessment of the characteristics of informal trading. Both aspects
are examined through a survey. While the former involves two rounds of survey on the
same set of respondents, in the case of the latter only one survey was carried out. An
important aspect of the study was to identify a survey team that would carry out the survey.
The Economic Information Technology (EIT) of Calcutta was selected to canvass the
survey instrument as it has a core team that has carried out several surveys on informal
trade.4 As the survey instruments were prepared by the author, a training program for the
survey team was conducted by the author in Chennai to ensure a complete understanding
of the questionnaires.5 The author was closely involved with the survey team in the field
4 The surveys in the two studies Chaudhary(1995) and Pohit and Taneja (2000) were canvassed by EIT.
The team has carried out surveys for estimating informal trade between India and Bangladesh (Chaudhary (1995) and on qualitative aspects of Indo-Nepal and Indo-Bangladesh informal and formal trade (Pohit and Taneja (2000).
5 The draft questionnaires prepared at ICRIER by the author were discussed with M Savananthan, B.K. Karmacharya and S. Pohit at a workshop and refined thereafter.
5

throughout the survey period. The details of the methodology are spelt out in the following
section.
1.3.1 Quantitative Aspect
The magnitude and pattern of India’s informal trade with Sri Lanka have been
estimated through a primary survey using the Delphi technique which is essentially a set of
procedures for eliciting and refining the opinions of a group over successive rounds of
interviews with it. The responses of the first round of interviews with a group of
respondents are synthesised and the collective information of the group is presented to
each respondent of the group in a second round of interviews to enable them to reconsider
their responses. The responses obtained in successive rounds are thus based on feedback
provided to the group of previous rounds. The number of rounds or iterations is continued
till a consensus emerges. The basic characteristics of this technique are as follows:
Structured questionnaire based interrogation of experts (knowledgeable people) on the issues being probed.
•
•
•
•
Providing summarized responses of the first round to the respondents of the group to enable them to review their response in the second round.
Repeat iterations till broadly converging responses are received or reasons for lack of convergence are documented.
Anonymity of responses.
For the purpose of the study, some modifications of Delphi were carried out. First,
while the initial effort was to attempt successive rounds, the number of rounds was
restricted to two since the respondents were irritated at being visited repeatedly. Moreover,
for the surveying team to probe further meant arousing suspicion in the centers where the
surveys were being carried out. It was thus decided that in the event of no convergence
reasons for divergence would be documented. Second, instead of one group of
respondents, three broad groups/categories were interviewed keeping in mind the fact that
Indo-Sri Lanka informal trade is entirely airborne and sea-borne (Sri Lanka being an island
nation). For estimating air-borne informal trade Category (I) comprises of carriers,
Category (II) comprises of informal traders, Category (III) comprises of ‘knowledgeable
persons’ who were identified by the survey teams. For estimates of sea-borne trade, given 6
the nature of trade, and the associated risk factors, estimates were obtained by identifying
respondents in the ‘knowledgeable persons’ category. To prepare estimates on air-borne
informal trade from the ‘knowledgeable persons’ category information on the proportion of
the air passenger traffic between India and Sri Lanka primarily for the purpose of informal
trade and on the value of contraband trade by each informal trader/carrier was elicited from
airline and customs staff, immigration officials, other knowledgeable persons from
chambers of commerce, formal traders, local people, media and any other persons who
could be identified by the survey team. The summarised responses of the first round in
each category/group were provided to the respondents in the second round where
respondents were given the opportunity to revise their estimate.
A weighted average of estimates of all groups was then used to arrive at a single
estimate for each country.6
1.3.2 Assessment of the Characteristics of Informal Trading
A Qualitative assessment of Indo-Sri Lanka informal trade was undertaken using
modified versions of questionnaires used for formal and informal traders in Pohit and
Taneja(2000). Two separate questionnaires were used for formal and informal traders.7
The qualitative survey questionnaires were based on the discipline of New
Institutional Economics so as to detect and comprehend the economic institutional bases of
informal trade between India and Sri Lanka, and compare the different institutional
mechanisms that govern formal and informal trade. A number of variables were selected
on the basis of which it was possible to differentiate between formal and informal traders.
A univariate test namely the signed rank test is chosen to evaluate the significance in the
differences between the two types of traders. Further, the variables identified by the
univariate test as being important in differentiating the two groups of traders are then
included in a multivariate test to select variables that account most for the differences in 6 Shares of different types of respondents in the sample were used as weights.
7
7 Sarvananthan (2001) revealed that bulk of the informal traders/carriers in Indo-Lanka informal trade are Sri Lankan nationals. However, for statistical purposes roughly equal number of interviews was conducted in both territories.
the two groups of traders. The statistical tests carried out were the same as in Pohit and
Taneja (2000).
1.4 Design of the Survey(s)
The survey was carried out during May 2001 and October 2001 to cover the two
aspects namely (i) estimating informal trade and (ii) characteristics of informal trade.
1.4.1 Quantitative Estimates
For the quantitative estimation of Indo-Sri Lanka informal trade Sarvananthan
(2001) was used as a starting point for identifying centers in the Indian territory. Further
discussions held in Chennai, Thiruvananthapuram, Tiruchirapalli, Mumbai and Delhi led
us to select only three of these centers namely Chennai, Thiruvanthapuram and
Tiruchirapalli. The number of respondents drawn from each center was proportional to the
relative importance of that center in informal trading activity. A total of 220 respondents
were selected in the three cities. A questionnaire for preparing estimates of informal trade
was used to elicit information on value and composition of air-borne and sea-borne
informal trade. Also, information was elicited from air-carriers and informal traders on the
impact of liberalisation carried out in the two countries in the early nineties on air-borne
informal trade.
1.4.2 Characteristics of Informal Trade
For the qualitative analysis, as the objective of the study is to analyse the
characteristics of informal trade juxtaposed against formal trade, an equal number of
formal and informal traders were covered. The sample of informal traders were selected
from the same cities that were identified as being important for the quantitative analysis.
Lists of informal traders were prepared through extensive discussions with knowledgeable
persons in the important centers/cities. Formal traders on the other hand were selected
randomly from lists of registered traders in Chennai, Tuticorin and Mumbai. A total of 110
respondents , i.e., 55 each of formal and informal traders were selected to carry out the
qualitative survey in India. The questionnaires for formal and informal traders elicited
information on several variables. Some variables pertained to the informal traders only,
8

some to the formal traders only and some other variables referred to both formal and
informal traders. Data was collected on trading activity, commodities traded, mode of
entry, age of the firm, contractual arrangements, sources of information, risk attributes,
sources of finance, mode of financing, ethnicity, transaction cost, education levels, time
taken for trade deals, turnover, number of transactions, trading in same commodities,
profits, fluctuation in margins, border price differential, among other things.
It has to be kept in mind that while formal traders were selected randomly from
lists of registered traders, the selection of informal traders was done on the basis of
information obtained from knowledgeable persons. Such a selection procedure may lead to
biased sample. Thus, given the nature of the sample of informal traders, the survey
estimates may only be indicative. Also, it has to be borne in mind that the sample size is
relatively small and the results to that extent are only indicative but not conclusive.
1.5 Limitations of the Study
Researching illegal activities and those who participate in it, places a special
responsibility on the researcher. It is essential on the one hand, to gain the confidence of
the participants so as to elicit accurate responses, and on the other to protect the identity
and confidentiality of the response. A great deal of reliance has to be placed on the
professionalism of the interviewer, and the accuracy of the results depends on this, is no
small measure.
The informal trade in high value goods such as gold and silver are also excluded
from the purview of the present study. The informal trade in these high value goods mostly
takes the form of informal capital transfers rather than commodity trade in the case of
Indo-Sri Lanka trade.8 Informal trade in labor services between India and Sri Lanka is
also excluded from the present analysis.9
8 See Sarvananthan (2001) 9 See Sarvananthan (2001)
9
A major limitation of the present study is the exclusion of unofficial capital
transfers between India and Sri Lanka. As capital transfers are not allowed officially
(unless for investment in joint ventures) between India and Sri Lanka there is a thriving
informal market for capital transfers (undiyal) between the two countries.
2 Survey-Based Estimation of Indo-Sri Lanka Informal Trade
As mentioned earlier, informal trade between India and Sri Lanka takes place
largely through air passengers and by sea through country boats. Informal trade by air
takes place through air passengers who travel solely for the purpose of informal trade
between the two countries. Informal traders/carriers travel between Colombo and the three
major cities namely Chennai, Tiruchirapalli and Thiruvananthapuram. In addition, goods
are also procured from Delhi and Mumbai, but traders usually carry goods from these cities
by train to Chennai from where the goods are carried by air. This is essentially done to cut
down on cost of travel. As mentioned earlier in order to prepare estimates of air-borne
informal trade three sets of estimates were obtained, one each from the three categories
viz., informal traders, carriers and ‘Knowledgeable Persons’. The last category comprised
of airline officials, customs officials, other knowledgeable persons. For obtaining estimates
of sea-borne informal trade information was elicited only from the ‘Knowledgeable
Persons’ category which comprised of officials at the sea-ports and knowledgeable
persons. For each of the categories commodity-wise estimates were obtained from
respondents.
2.1 Sampling Design of the Survey
A total of 195 respondents were selected in Chennai, Tiruchirapalli and
Thiruvananthapuram for preparing estimates of informal trade by air and a total of 25
respondents from Chennai, Tuticorin and Rameshwaram were selected for preparing
estimates of sea-borne informal trade. While the focus in the case of air-borne informal
trade was to obtain estimates from actual participants in trading, for sea-borne informal
trade, information was obtained only from knowledgeable persons. Given the fact that sea-
borne trade is largely war-induced, it was not possible to interview actual participants in
10
trade.10 As a result estimates of sea-borne informal trade are likely to be more unreliable
than the estimates of air-borne informal trade.
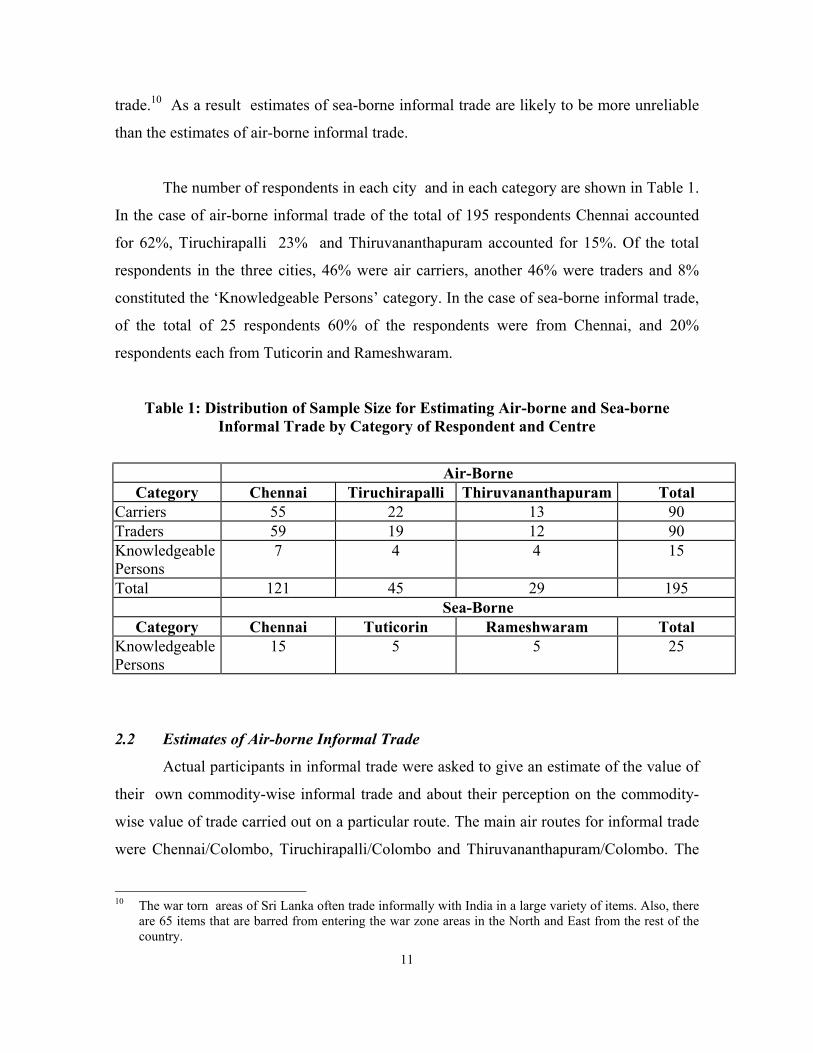
The number of respondents in each city and in each category are shown in Table 1.
In the case of air-borne informal trade of the total of 195 respondents Chennai accounted
for 62%, Tiruchirapalli 23% and Thiruvananthapuram accounted for 15%. Of the total
respondents in the three cities, 46% were air carriers, another 46% were traders and 8%
constituted the ‘Knowledgeable Persons’ category. In the case of sea-borne informal trade,
of the total of 25 respondents 60% of the respondents were from Chennai, and 20%
respondents each from Tuticorin and Rameshwaram.
Table 1: Distribution of Sample Size for Estimating Air-borne and Sea-borne Informal Trade by Category of Respondent and Centre
Air-Borne Category Chennai Tiruchirapalli Thiruvananthapuram Total
Carriers 55 22 13 90 Traders 59 19 12 90 Knowledgeable Persons
7 4 4 15
Total 121 45 29 195 Sea-Borne
Category Chennai Tuticorin Rameshwaram Total Knowledgeable Persons
15 5 5 25
2.2 Estimates of Air-borne Informal Trade
Actual participants in informal trade were asked to give an estimate of the value of
their own commodity-wise informal trade and about their perception on the commodity-
wise value of trade carried out on a particular route. The main air routes for informal trade
were Chennai/Colombo, Tiruchirapalli/Colombo and Thiruvananthapuram/Colombo. The
10 The war torn areas of Sri Lanka often trade informally with India in a large variety of items. Also, there
are 65 items that are barred from entering the war zone areas in the North and East from the rest of the country.
11

respondents in the ‘traders’ category and ‘carriers’ category were more open about their
perceptions on route-level estimates than about their own trade. Hence, the perceptions on
route level estimates of both these categories were used for preparing estimates of informal
trade. The estimates for the ‘Knowledgeable Persons’ category were arrived at by
consolidating information on value of informal trade per trip, number of passengers
travelling and the proportion of informal traders amongst passengers travelling between
India and Sri Lanka. (See Table 1a and Table 1b in Appendix for details)
Table 2 shows the center-wise estimates of air-borne informal exports and imports.
The estimates reported in Table 2 are from the second round. Average commodity-wise
estimates from the first round were tabulated for each of the categories. In the second
round the respondents of each category were provided with the commodity-wise average
estimates within a range of + 20% around the average rather than the average commodity-
wise estimate. As the number of rounds was limited to two, a consensus was sought on a
range (defined as + 20% around the average ) within which the average commodity-wise
estimate is likely to be. The second round commodity-wise average estimates for each
category were summed-up to obtain informal trade estimates of each category.11 The
reference period for the estimate is April 2000 to March 2001. It is important to mention
that the second round could not be carried out for carriers as the survey was carried out at
the airports. As the carriers were mobile between countries they could not be contacted
again during the survey period. The last column gives the weighted average over different
categories of respondents with the number of respondents in each category as weight to
arrive at the weighted average for the center. Some respondents gave perceptions on
exports, some gave their perceptions on imports and some on both. Hence the weighting
pattern used is the same for exports and imports.
Table 2 also reveals that Chennai is the main center for air-borne informal exports
and imports. Chennai accounts for 85% of informal exports and 79% of informal imports.
Total two-way total air-borne trade was to the tune of US $ 180.2 million. 11 The same method was applied for estimating sea-borne informal trade.
12
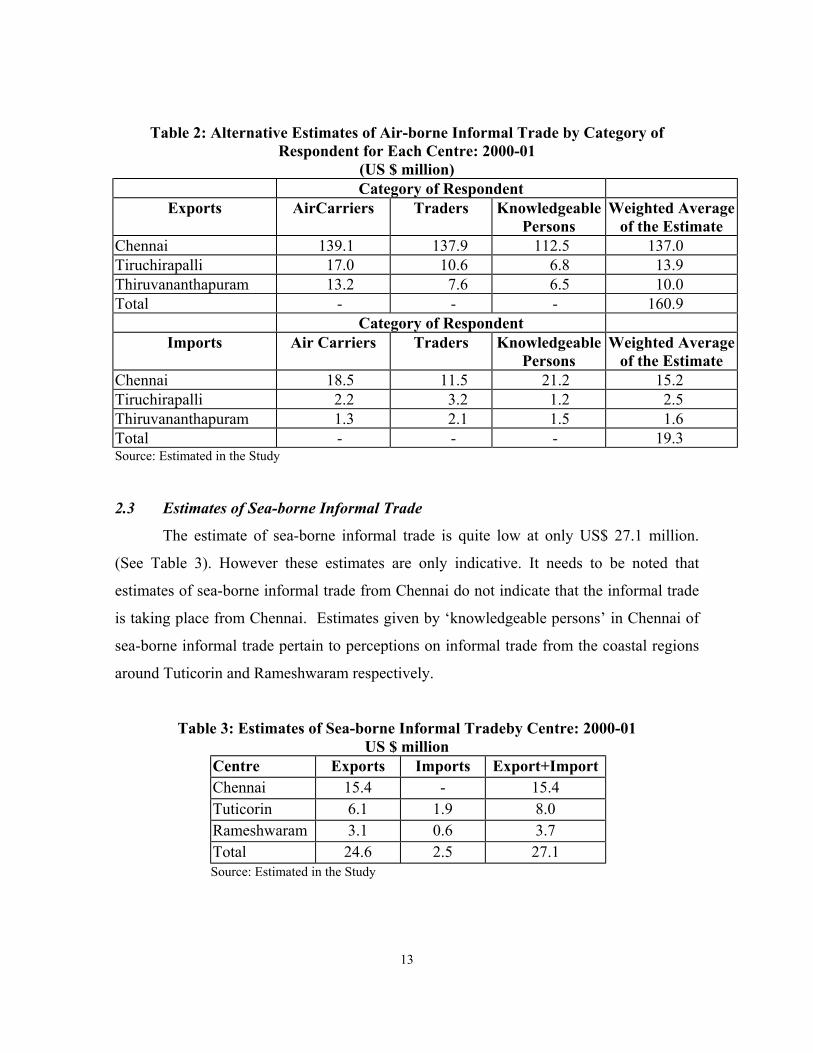
Table 2: Alternative Estimates of Air-borne Informal Trade by Category of Respondent for Each Centre: 2000-01
(US $ million) Category of Respondent
Exports AirCarriers Traders Knowledgeable Persons
Weighted Average of the Estimate
Chennai 139.1 137.9 112.5 137.0 Tiruchirapalli 17.0 10.6 6.8 13.9 Thiruvananthapuram 13.2 7.6 6.5 10.0 Total - - - 160.9
Category of Respondent Imports Air Carriers Traders Knowledgeable
Persons Weighted Average
of the Estimate Chennai 18.5 11.5 21.2 15.2 Tiruchirapalli 2.2 3.2 1.2 2.5 Thiruvananthapuram 1.3 2.1 1.5 1.6 Total - - - 19.3 Source: Estimated in the Study
2.3 Estimates of Sea-borne Informal Trade
The estimate of sea-borne informal trade is quite low at only US$ 27.1 million.
(See Table 3). However these estimates are only indicative. It needs to be noted that
estimates of sea-borne informal trade from Chennai do not indicate that the informal trade
is taking place from Chennai. Estimates given by ‘knowledgeable persons’ in Chennai of
sea-borne informal trade pertain to perceptions on informal trade from the coastal regions
around Tuticorin and Rameshwaram respectively.
Table 3: Estimates of Sea-borne Informal Tradeby Centre: 2000-01 US $ million
Centre Exports Imports Export+Import Chennai 15.4 - 15.4 Tuticorin 6.1 1.9 8.0 Rameshwaram 3.1 0.6 3.7 Total 24.6 2.5 27.1
Source: Estimated in the Study
13

2.4 Estimates of Trade Balance
Table 4 gives a summary of estimates of total informal trade and formal trade. The
estimates show that:
(i) Total two-way informal trade (exports plus imports) is 30% of formal trade.
(ii) Informal exports from India are 48% of formal exports while informal imports are 29% of formal imports.
(iii) There is a large trade surplus in India’s favor in both formal and informal trade.
Table 4: Summary Estimates of Formal and Informal Trade Balance: 2000-01 US $ million
Type of Trade Exports(X) Imports(M) X+M X-M Formal 640.2 45.0 685.2 595.2 Informal 185.5 21.8 207.3 163.7 Ratio of Informal to Formal Trade
28.9 48.4 30.2 27.5
Source: For formal trade -Monthly Statistics of Foreign Trade, DGCI&S, Kolkata For informal trade- Estimated in the Study
2.5 Composition of Air-borne Informal Trade
Estimates on the composition of air-borne informal trade were obtained from two
categories of respondents, namely, air carriers and informal traders. A weighted average of
each commodity group was arrived at by using the number of respondents in each category
as weight.12 Such estimates were prepared for each center. It can be seen from the last
column of Table 5 that sarees with a share of 40% are the single largest item of informal
exports. In fact informal traders were of the opinion that sarees are a high value item and
are more likely to be traded by air than by sea. Electrical and mechanical items were the
second largest item accounting for 20%, followed by garments other than sarees
accounting for 17% of total informal exports. These three items together account for 77%
of total informal exports; utensils has a share of 12%. The combined share of all other
items i.e., food, medicines etc. is only 11%. However, there were some differences in
12 We were unable to get estimates on composition of informal trade from the ‘Knowledgeable Persons’
category of respondents.
14
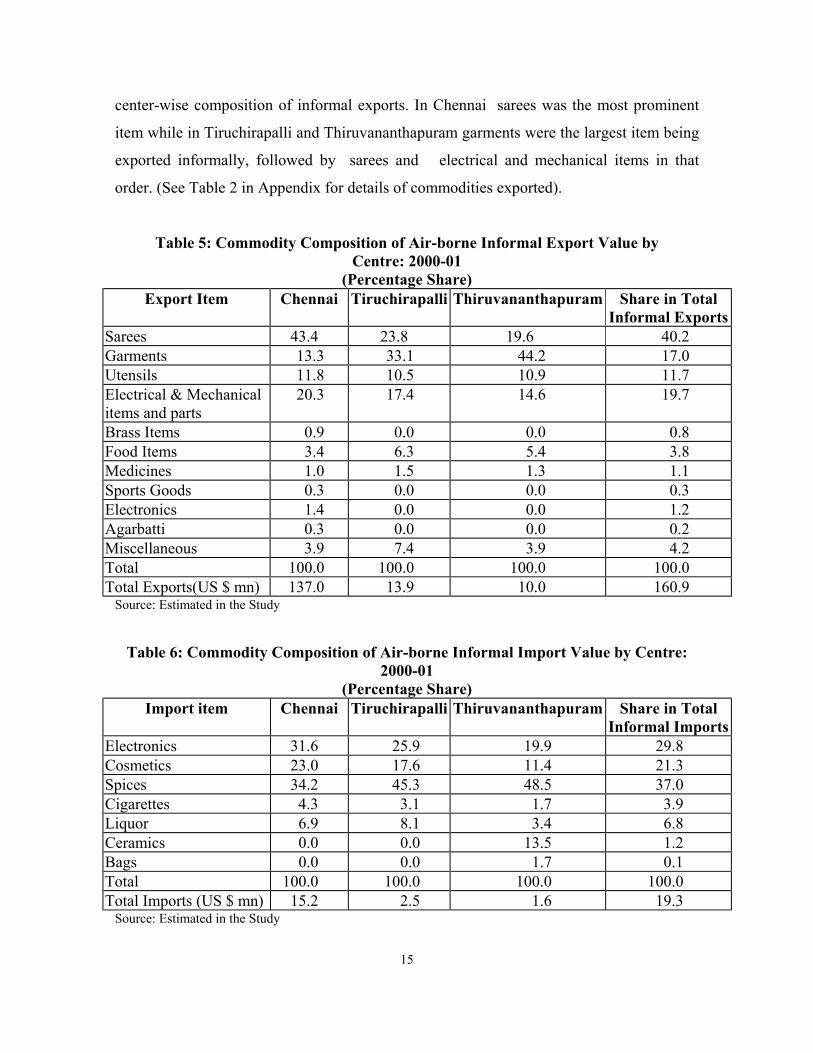
center-wise composition of informal exports. In Chennai sarees was the most prominent
item while in Tiruchirapalli and Thiruvananthapuram garments were the largest item being
exported informally, followed by sarees and electrical and mechanical items in that
order. (See Table 2 in Appendix for details of commodities exported).
Table 5: Commodity Composition of Air-borne Informal Export Value by Centre: 2000-01
(Percentage Share) Export Item Chennai Tiruchirapalli Thiruvananthapuram Share in Total
Informal Exports Sarees 43.4 23.8 19.6 40.2 Garments 13.3 33.1 44.2 17.0 Utensils 11.8 10.5 10.9 11.7 Electrical & Mechanical items and parts
20.3 17.4 14.6 19.7
Brass Items 0.9 0.0 0.0 0.8 Food Items 3.4 6.3 5.4 3.8 Medicines 1.0 1.5 1.3 1.1 Sports Goods 0.3 0.0 0.0 0.3 Electronics 1.4 0.0 0.0 1.2 Agarbatti 0.3 0.0 0.0 0.2 Miscellaneous 3.9 7.4 3.9 4.2 Total 100.0 100.0 100.0 100.0 Total Exports(US $ mn) 137.0 13.9 10.0 160.9
Source: Estimated in the Study
Table 6: Commodity Composition of Air-borne Informal Import Value by Centre: 2000-01
(Percentage Share) Import item Chennai Tiruchirapalli Thiruvananthapuram Share in Total
Informal Imports Electronics 31.6 25.9 19.9 29.8 Cosmetics 23.0 17.6 11.4 21.3 Spices 34.2 45.3 48.5 37.0 Cigarettes 4.3 3.1 1.7 3.9 Liquor 6.9 8.1 3.4 6.8 Ceramics 0.0 0.0 13.5 1.2 Bags 0.0 0.0 1.7 0.1 Total 100.0 100.0 100.0 100.0 Total Imports (US $ mn) 15.2 2.5 1.6 19.3
Source: Estimated in the Study
15
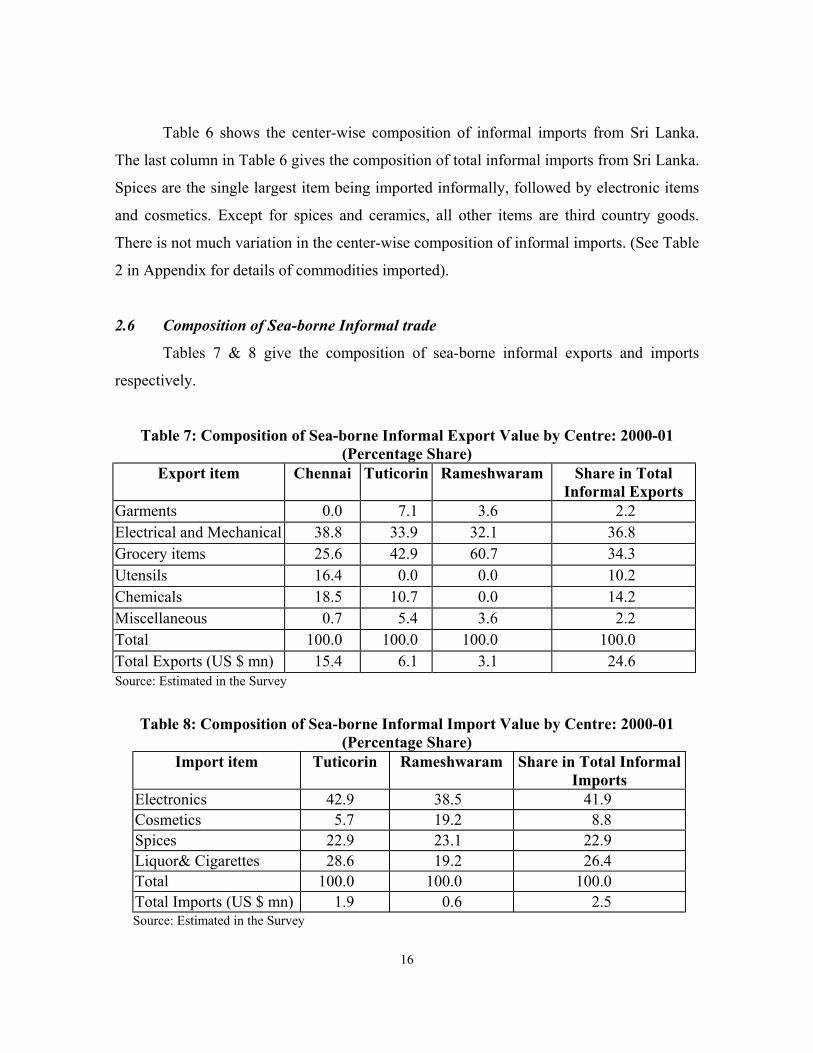
Table 6 shows the center-wise composition of informal imports from Sri Lanka.
The last column in Table 6 gives the composition of total informal imports from Sri Lanka.
Spices are the single largest item being imported informally, followed by electronic items
and cosmetics. Except for spices and ceramics, all other items are third country goods.
There is not much variation in the center-wise composition of informal imports. (See Table
2 in Appendix for details of commodities imported).
2.6 Composition of Sea-borne Informal trade
Tables 7 & 8 give the composition of sea-borne informal exports and imports
respectively.
Table 7: Composition of Sea-borne Informal Export Value by Centre: 2000-01 (Percentage Share)
Export item Chennai Tuticorin Rameshwaram Share in Total Informal Exports
Garments 0.0 7.1 3.6 2.2 Electrical and Mechanical 38.8 33.9 32.1 36.8 Grocery items 25.6 42.9 60.7 34.3 Utensils 16.4 0.0 0.0 10.2 Chemicals 18.5 10.7 0.0 14.2 Miscellaneous 0.7 5.4 3.6 2.2 Total 100.0 100.0 100.0 100.0 Total Exports (US $ mn) 15.4 6.1 3.1 24.6 Source: Estimated in the Survey
Table 8: Composition of Sea-borne Informal Import Value by Centre: 2000-01
(Percentage Share) Import item Tuticorin Rameshwaram Share in Total Informal
Imports Electronics 42.9 38.5 41.9 Cosmetics 5.7 19.2 8.8 Spices 22.9 23.1 22.9 Liquor& Cigarettes 28.6 19.2 26.4 Total 100.0 100.0 100.0 Total Imports (US $ mn) 1.9 0.6 2.5 Source: Estimated in the Survey
16
What is noticeable is that electrical and mechanical items and grocery items are the
largest items being exported informally from India. Informal imports by sea which are of
the order of only US$ 2.5 million comprise largely of electronic items.13
2.7 Perceptions on Impact of Trade Liberalization on Informal Trade
Informal traders and air carriers in all the centers (90 each of informal traders and
air carriers as shown in Table 1) were asked about the impact of trade liberalisation on
informal exports and imports. Traders were asked whether there was an increase, decrease
or no change in the volume of informal trade since 1995.14 Table 9 shows that since 1995
there was an increase in informal exports of textile items and a decrease or no change in
informal exports of all other items. Informal imports of all third country goods
experienced a decline since 1995 while there was no change in the informal imports of
locally produced spices. It is interesting to note that while there was a very perceptible
decline in demand for third country goods from Sri Lanka, a significant amount of third
country goods were being procured from other Indian cities, particularly Delhi. Delhi is a
major center where third country goods (mostly made in China) are procured from the
Indo-Nepal border, Thailand and some countries from the Middle East and South-East
Asia. Agents from Delhi go regularly to Chennai and supply third country goods to traders.
Another point that emerged during our discussions with traders in Chennai was that third
country goods obtained from Sri Lanka were of much better quality (and often branded
items) compared to third country goods procured from other Indian cities.
13 Composition of sea-borne informal imports could not be obtained from Chennai. 14 The year 1995 was selected for two reasons (i) by 1995 both countries were on a progressive path of
liberalisation- policy liberalisation in 1991 in India coincided with a ‘second wave’ of liberalisation in Sri Lanka and (ii) in earlier studies on informal trade (Pohit and Taneja; 2000) perceptions on impact of trade liberalisation on informal trade were sought from informal traders since 1995.
17

Table 9: Perception Regarding Impact of Trade Liberalization on Informal Trade (Percentage of Air- Carriers and Informal Traders)
Since 1995 Export Commodity
Increase Decrease No Change Total
Textiles 58 12 30 100
Machinery & Electrical items 46 4 50 100 Utensils 4 62 34 100 Food items 0 67 33 100 Miscellaneous 20 60 20 100
Since 1995 Import Commodity
Increase Decrease No Change Total
Electronics 0 100 0 100 Cosmetics 0 85 15 100 Spices 0 18 72 100 Cigarettes 0 72 38 100 Liquor 0 68 32 100
2.8 Summary of Survey-Based Estimates
The survey-based quantitative estimates of Indo-Sri Lanka informal trade show that
total informal trade is quite significant and is US $207mn. Informal trade is largely air-
borne constituting 87% of total informal trade, the rest 13% being sea-borne informal
trade. Informal trade is largely in one direction from India to Sri Lanka; informal export
from India accounts for 89% of the total of US $207 mn while informal imports from Sri
Lanka are only 11%.
Comparisons with formal trade reveal that total two-way informal trade (air-borne
plus sea-borne is 30% of formal trade. Also there is a large trade surplus in favour of India
in both formal and informal trade.
The estimates on composition of air-borne informal trade show that textiles are the
largest item constituting 57% of total informal air-borne informal exports, followed by
electrical and mechanical items constituting 20%. Other items exported informally are
utensils, food items, electronic items, sports goods, brass items, medicines and agarbattis.
Air-borne informal imports comprise largely of spices accounting for 37%, followed by
18
electronics accounting for 30%. The other items imported informally are cosmetics,
cigarettes, liquor, ceramic and bags.
The estimates of composition of sea-borne informal trade show that the two largest
items viz., electrical and mechanical items and grocery items accounted for 71% of sea-
borne informal export to Sri Lanka. The other items exported informally by sea are
utensils, chemicals and garments. The largest item imported informally by sea from Sri
Lanka to India is electronics constituting 42% of sea-borne informal import. The other
items imported informally by sea are spices, liquor, cigarettes and cosmetics.
Perceptions on impact of liberalization on air-borne informal trade since 1995
reveal that there was an increase in informal exports of textile items and a decrease or no
change in informal exports of all other items. Informal imports of all third country goods
experienced a decline since 1995 while there was no change in the informal imports of
locally produced spices.
3. Characteristics of Indo-Sri Lanka Informal Trading
This section highlights the qualitative aspect of Indo-Sri Lanka informal trade
based on the framework outlined in section 1. The analysis is based on the results of the
survey carried out in Chennai, Tiruchirapalli, Thiruvananthapuram, Tuticorin, Mumbai and
Rameshwaram during May to October 2001.
This section focuses on the key features of the transacting environment of informal
and formal tradings as revealed by the survey. As mentioned earlier, the fact that informal
trade continues unabated implies that there is an institutional mechanism that enables such
trade to take place. The survey instrument was designed to elicit information on the profile
of informal traders in terms of nature of trading activity and commodities traded. The
transacting environment of informal trading has also been analyzed in terms of entry
characteristics, nature of contracts, information channels, aspects of risk in informal
trading and its financing, role of ethnic networks and aspects of transaction costs. The
transacting environment of formal trading is analyzed in terms of transaction costs
19

incurred both in terms of time and money. In the light of comparisons drawn between
formal and informal traders factors influencing informal trade flows are identified from the
survey. The last sub-section presents a comparative statistical analysis of formal and
informal traders in terms of a set of variables. The format for analysis is the same as that
in Pohit and Taneja(2000) with suitable modifications. The changes that have been
incorporated in the present study are specifically mentioned.
3.1 Sampling Design
While the selection procedure of formal and informal traders has already been
explained earlier it needs to be reiterated that while formal traders were selected randomly
from lists of registered traders in Chennai, Tuticorin and Mumbai, the selection of informal
traders was done on the basis of information obtained from knowledgeable persons.
Estimates based on such a selection procedure may only be indicative. Formal and
informal traders were selected on the basis of information obtained from knowledgeable
persons as published data on center-wise formal trade is not available. Discussions with the
Directorate General of Commercial Intelligence and Statistics (DGCI&S) in Calcutta
helped in arriving at the proportion of formal traders to be selected from each center.15
Further discussions were held with customs officials in Chennai, Tuticorin and Mumbai to
re-confirm the relative importance of each of these centers in formal trade. The center-wise
distribution of respondents is shown in Table 10. Selection of informal traders was made
using the same criteria as for quantitative estimation of air-borne informal trade. The
centre-wise distribution of sample respondents in different centers is given in Table 10.
Table 10 : Number of Respondents in Formal and Informal Trade by Centre Centre Informal
Trade Formal Trade
Chennai 35 29 Tiruchirapalli 12 Thiruvanthapuram 8 Tuticorin 15 Mumbai 11 Total 55 55
15 The DGCI&S headquarters based in Calcutta are the assigned authority that publishes India’s foreign
trade statistics.
20

3.2 Characteristics of Traders
Trading Activity
Informal and formal traders were classified according to three main trading
activities namely exporting, importing and selling in the domestic market. Table 11 shows
that the dominant activity of informal traders is exporting and selling in the domestic
market. (44 traders). Informal traders did not specialize in either exporting or importing,
(one firm was engaged in only exporting and four in importing only) nor were they
engaged in the simultaneous activity of exporting and importing (only two traders). Only
four traders were engaged in importing and selling in the domestic market. Only two firms
were engaged in all three activities. In formal trade, the dominant activity is exporting only
(36 traders). Fifteen formal traders were found to be exporting and selling in the domestic
market. Formal traders do not engage in exporting and importing (one trader) or in
importing only (one trader). Only three firms were importing and selling in the domestic
market and only one was engaged in all three activities.
Table 11: Sample Respondents in Different Trading Activities
Type of Trade Trading Activity Informal Formal
Exporting only 1 36 Importing only 4 1 Exporting and Importing 2 1 Exporting and selling in domestic market
44 15
Importing and selling in domestic market
4 3
All three activities 2 1 Total number of Respondents
55 55
Note: Figures in parentheses are percentage of total respondents while figures not in parentheses give the number of respondents
Commodities Traded
The important commodities traded between India and Sri Lanka both formally and
informally are shown in Table 12. The major categories exported informally are textiles,
utensils, electrical items and machinery and parts while those exported formally are
21
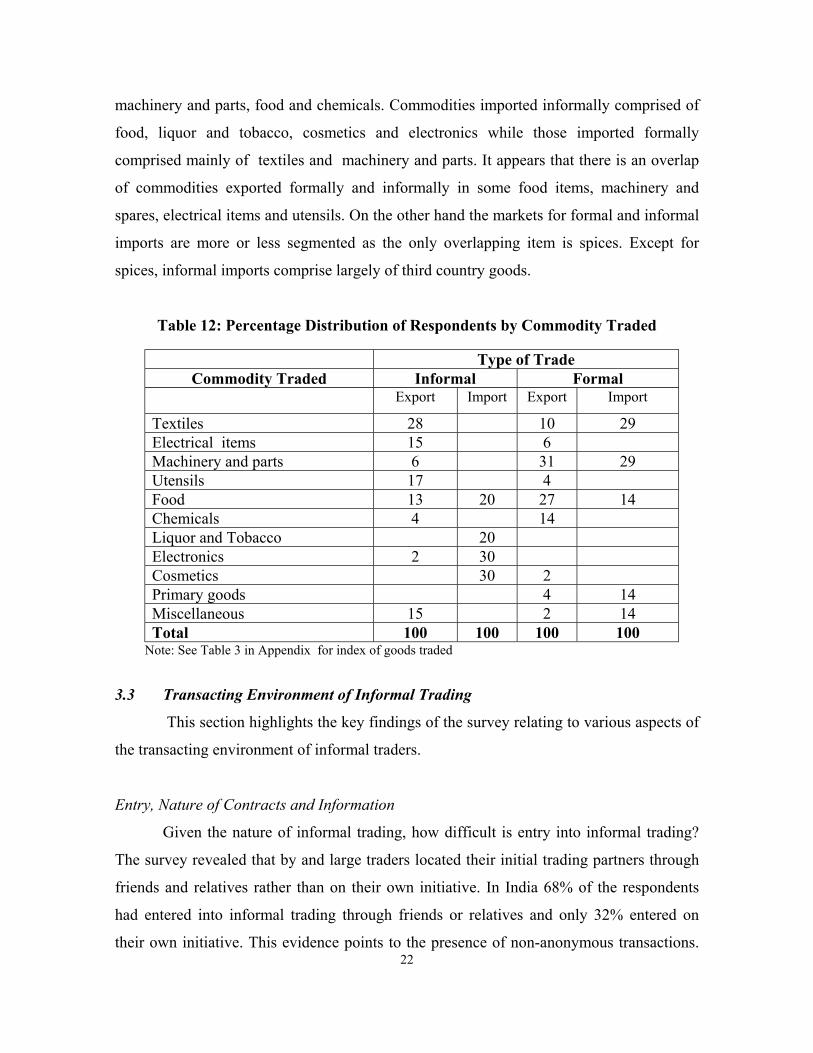
machinery and parts, food and chemicals. Commodities imported informally comprised of
food, liquor and tobacco, cosmetics and electronics while those imported formally
comprised mainly of textiles and machinery and parts. It appears that there is an overlap
of commodities exported formally and informally in some food items, machinery and
spares, electrical items and utensils. On the other hand the markets for formal and informal
imports are more or less segmented as the only overlapping item is spices. Except for
spices, informal imports comprise largely of third country goods.
Table 12: Percentage Distribution of Respondents by Commodity Traded
Type of Trade Commodity Traded Informal Formal
Export Import Export Import
Textiles 28 10 29 Electrical items 15 6 Machinery and parts 6 31 29 Utensils 17 4 Food 13 20 27 14 Chemicals 4 14 Liquor and Tobacco 20 Electronics 2 30 Cosmetics 30 2 Primary goods 4 14 Miscellaneous 15 2 14 Total 100 100 100 100
Note: See Table 3 in Appendix for index of goods traded
3.3 Transacting Environment of Informal Trading
This section highlights the key findings of the survey relating to various aspects of
the transacting environment of informal traders.
Entry, Nature of Contracts and Information
22
Given the nature of informal trading, how difficult is entry into informal trading?
The survey revealed that by and large traders located their initial trading partners through
friends and relatives rather than on their own initiative. In India 68% of the respondents
had entered into informal trading through friends or relatives and only 32% entered on
their own initiative. This evidence points to the presence of non-anonymous transactions.

The mode of entry for informal traders is very similar to the evidence obtained in the Indo-
Bangladesh and Indo-Nepal surveys.
Further information was sought on whether there were any barriers to entry in
informal trading markets. These aspects were not included in our earlier analysis on Indo-
Bangladesh and Indo-Nepal informal trade. Traders were asked whether existing
participants considered new entrants a potential threat and therefore posed resistance to
them. Eighty percent of the informal traders said that the existing firms did not pose any
barriers to their entry.
The survey provided further evidence on non-anonymous transacting environment
for informal traders. Ninety-two percent of the traders mentioned that they had contact
with their trading partners outside their trade deals. In addition, 60% of the respondents
had repeat dealings with more than 50% of their trading partners. Repeat dealings is an
important indicator of trust between trading partners.
The survey instrument also sought information on contractual arrangements
between informal trading partners. The options regarding different modes of contractual
arrangement were a modified version of the earlier survey so that more accurate
information could be obtained from respondents.16 Four options posed to respondents were
advance payment, credit because of prior dealing, credit because of third party reference
and use of collateral. The two predominant modes of finalizing trade deals viz., credit
transactions because of prior dealings was indicated by 80% of informal traders and
advance payment mode was used by 44%. Only 9% of the informal traders entered a credit
arrangement because of third party reference. Traders use more than one mode of payment
depending on the informal trader and goods involved. The mode of payment also depends
on availability of funds with the importers. According to the advance payment mode the
profit margin is high for the importer, but they have to invest capital and take the risk of
potential default in delivery of goods. On credit transactions the profit margin is lower for
16 Pohit and Taneja (2000)
23
the importer, because the informal trader invests the capital and takes the risk.17 The
predominant modes of payment for informal trade transactions reveal a high degree of
honesty and integrity between the transacting parties. The use of collateral was indicated
by only 4% of informal traders. The infrequent use of collateral provides indirect evidence
supporting absence of significant information asymmetries among transacting traders.
The mechanism that supports information flows is also very important since what
transacting parties know and do not know will determine systematically the arrangements
that will characterize exchange between them. Informal trade hinges on how traders can
obtain information on commodities and quantities to be traded. One of the competitive
advantages of informal trade vis-à-vis formal trade is meeting the demand for goods
speedier than through the formal channel. Hence, speedier access to market information is
sine qua non for informal traders. Traders were asked how they obtained such information
with the option of giving multiple choices. The informal distribution channel was the most
important source of information as was indicated by 76% of the informal traders. Seventy-
three percent of informal traders mentioned obtaining information by making personal
trips. It is important to note that the distribution network serves the dual purpose of both
marketing and information channel. Forty-four per cent of the informal traders said that
they obtained information from the formal channel. The dependence on official media was
indicated by 18% of informal traders and trade fairs was indicated by only 5% of the
informal traders. Thus official media and trade fairs as channels of information flows are
less important for traders engaged in informal trade. The evidence on sources of
information corroborates our earlier survey findings in informal trading between India and
Bangladesh and between India and Nepal.
Risk
A crucial aspect in informal trading is the risk associated with informal trading.
Any illegal activity runs a risk, because there are no legal contracts involved. Respondents
were asked about the extent of risk faced by traders in risk attributes arising out of the
transacting environment of informal traders. Risk for exporters could arise due to, default 17 (see also Sarvananthan, 2001) 24

in payment, and due to seizure while that for importers could arise due to goods not
conforming to specifications, default in delivery/ delay of goods, and due to seizure by
enforcement agencies. Exporters and importers were asked to rank their perception on the
extent of risk ranging from never, rarely to frequent. The survey reveals that the modal
range for each of the risk attributes for both exporters and importers was either 'never' or
‘rarely’. (See Table 13). The responses were marked by the absence of frequent occurrence
as the modal range of any risk attribute. These results again indicate a high degree of
honesty and integrity among informal traders. It also reveals the laxity of law enforcement
because the goods lost due to seizure is very low as perceived by both exporters and
importers.(See Table 13). Low risk in informal trading was conspicuous in both Indo-
Bangladesh and Indo-Nepal informal trade.
Table 13: Percentage of Informal Traders Reporting Extent of Risk in Modal Class by Risk Attributes
Type of Informal Traders
Risk Attribute Importer Exporter
Goods not conforming to specifications 91 (Never) N.A Default in delivery of goods 64(Never) N.A Goods lost due to seizure 65(Never) 90(Never) Default in payment N.A 76(Never) Delay in delivery of goods 100(Never) N.A
Note: Percent of respondents in the modal class: labels in parenthesis refer to modal class in options –never, rarely and frequently. NA = Not Applicable
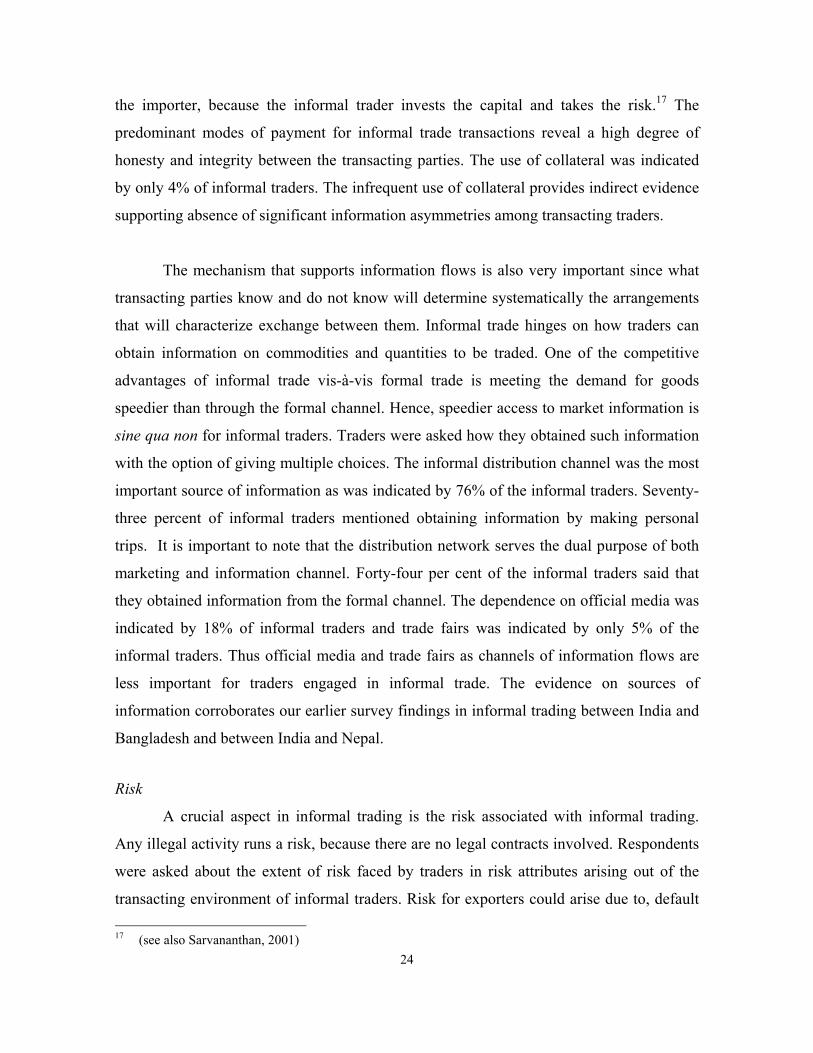
One way of gauging the extent of risk is to look at probability of goods being
seized by enforcement agencies. Respondents were asked to give their perception on the
probability of being caught by enforcement agencies. Fifty five percent of the respondents
claimed that the probability of seizure was nil. (See Table 14). Some of the respondents
seemed to include probability of detection which is often cleared on payments of rents to
the enforcement agencies. In other words, the probability of seizure may be lower than is
revealed in our survey. While these findings are similar to those obtained in Indo-Nepal
and Indo-Bangladesh informal trading, it assumes greater significance in the case of Indo-
25
Sri Lanka as most of the trade takes place visibly through customs, immigration and
baggage checks at airports. This is unlike informal trade across large land borders where
the means of enforcement are limited.
Table 14: Percentage Distribution of Informal Traders by Probability of Seizure
Probability of seizure 0 <0.03 0.3-0.06 .06-.01
Percent of Informal Traders 55 24 18 3 Note: Respondents were asked to tick in the appropriate probability range that was provided in the
questionnaire.
If risk perceived by informal traders regarding various attributes is low, then clearly
traders have developed mechanisms to mitigate risk. As mentioned earlier, non-anonymous
transactions is an important mechanism that minimizes risk in informal trading. Further,
informal traders make payments to enforcement agencies to mitigate risk. Ninety-four
percent of the respondents paid less than 3% of their turnover to enforcement agencies and
only six percent of informal traders paid between 3% to 5%. In fact the average
payments made by the informal traders was 2% of their turnover. Similar risk mitigation
methods were adopted in Indo-Bangladesh and Indo-Nepal informal trade.
Financing Informal trade
Intrinsic to the activity of informal trading is the issue of financing such activities.
If goods are being traded across borders, then the transaction is complete only when
payments are made for the goods received. Respondents were asked about the sources of
finance with the option of ticking more than one option in case they used more than one
source of finance. All informal traders relied to some extent on their own resources for
financing trading activities. Own finances were further supplemented with funds from
friends and relatives (49%). Only 7% of informal traders borrowed from informal money
lenders and 4% borrowed from banks. The important role of own financing and financing
from friends and relatives was seen in the case of Indo-Bangladesh and Indo-Nepal
informal trade as well.
26

Information was also sought on the mode of financing informal trade. In the survey
there was evidence of different mediums of exchange used by traders e.g., barter, gold,
silver Indian currency, Sri Lankan currency and US dollars. However there was a
predominance of certain modes of financing. Ninety-eight percent of the exporters and all
importers made part of their payments in Indian currency. Exchange was also carried out in
US dollars for both exports and imports. Conversions of all currencies into the local
currency of the trading country are carried out through the informal money market. Access
to which is easy for all informal traders. (See Table 15). Evidence on the use of US $ was
not visible in the case of Indo-Bangladesh and Indo-Nepal trade where local partner
country currencies were easily convertible in the informal capital market.
Table 15: Percentage of Informal Traders by Mode of Financing
Type of Trading Mode of Finance Export Import
Barter 2 20 Gold 0 0 Silver 0 10 Indian Currency 98 100 Sri Lankan Currency 4 20 US dollar 30 40
Note: Respondents had the choice of ticking more than one option.
An aspect that has not been dealt with is the issue of balance of payments. In Indo-
Bangladesh where there is one-way informal trade from India to Bangladesh and hence a
balance payments in India’s favor, it was found that there was an accumulation of
Bangladeshi currency in India. Interestingly, illegal and legal migrants working in India
were remitting the Bangladeshi currency in the informal money market back to
Bangladesh. In the case of Indo-Sri Lanka informal trade we did not find any such
evidence. Discussions with traders revealed that the informal money market operates
through a colossal international network, where financing informal trade in goods is only
27

one of the activities. However, what is evident is the domination of the Chettiar caste in the
informal money market between India and Sri Lanka.18
Ethnicity of Informal Traders
Ethnic trading networks are a key to understanding the modalities of informal trade
in various parts of the world. A common language, religion, culture, etc, play a critical role
in facilitating trading across the border. This is particularly so where the same ethnic
community is divided into two national boundaries; for example, the division of the
Bengali nation into Bangladesh and West Bengal state of India.
The distribution of the total sample among different ethnic communities is
reflective of the participation of different ethnic communities (in the order of importance)
in the informal trade between India and Sri Lanka. In India 56% of the informal traders
were Tamils from Tamil Nadu , 23% were nationals from rest of India, 15% were Muslims
and 6% were Sinhalese migrants from Sri Lanka residing in India.19 In the Sri Lankan
territory 60% of the survey respondents were hill-country Tamils, 24% of the respondents
were Muslims, 12% were North-East Tamils, and the rest 4% were Sinhalese (See Table
16).
Table 16: Percentage Distribution of Informal Traders by Ethnic Community
Ethnic Community Percent of Informal traders Sinhalese of Sri Lanka 6 Tamils of Sri Lanka 0 Muslims 15 Tamils in India 56 Nationals of Rest of India 23 Total 100
18 The Chettiar community went to Sri Lanka well before the plantation workers migrated from Tamil
Nadu to Sri Lanka in the late nineteenth century. See Sarvananthan (2001) 19 Through informal discussions it was gathered that the Sinhalese were residing as illegal migrants In
India. 28

Perception of Ethnic Domination of Informal Trade
There is a considerable literature on the ethnic dimension of informal trade in
various parts of the world, for example in Africa and South East Asia.20 Very often
particular ethnic groups are responsible for organizing and controlling informal trading
activities. According to the survey, 58% of the respondents perceived that informal trade
between India and Sri Lanka was controlled by the Tamils of Sri Lanka (hill-country), 27%
of the respondents felt that informal trade was controlled by the Tamils of Tamil Nadu, 8%
felt that informal trade was controlled by nationals of other Indian states and 7% believed
the control was by Muslims. (See Table 17).
Table 17: Percentage Distribution of Informal Traders by Perception on Ethnic Domination
Ethnic Community Percent of Informal traders
Sinhalese of Sri Lanka 0 Tamils of Sri Lanka 58 Muslims 7 Tamils in India 27
Nationals of Rest of India 8 Total 100
Transaction Cost
Informal traders incur transaction costs in the form of payments made to
enforcement agencies as bribes, transportation costs, cost of currency conversion , cost of
credit and imputed risk premium for safe delivery of goods. The categories of components
of transaction cost was widened (from the earlier survey) to include imputed risk premium.
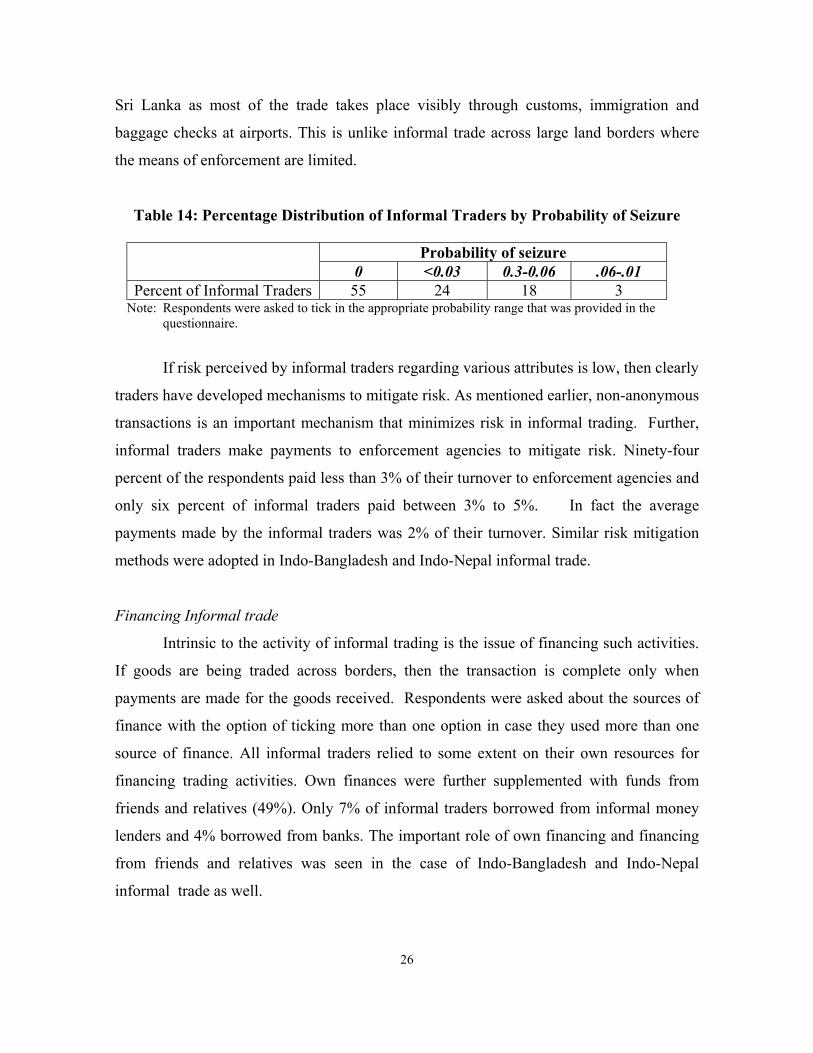
Majority of the informal traders incurred transaction costs between 10% and 20%
of turnover. (See Table 18). The average transaction cost incurred by informal traders was
10% of their turnover.
20 See Sarvananthan (2001), Chapter 2 and references therein.
29
Table 18: Percentage Distribution of Informal Traders by Transaction Cost as Percent of Turnover
Transaction Cost (TC) as Percent of Turnover
<10% 10% to 20% >20% Total
Percent of Informal traders
25
75
0
100
Note: The average transaction cost for the sample of informal traders is 10% of their turnover.
3.4 Transacting Environment of Formal Trading
Research studies have shown that high transaction costs in official trading
exacerbate informal trade. Institutions (the rules and regulations that affect economic
activities and trading) determine transaction costs, the incentives and disincentives of
compliance, and the benefactors and losers of these arrangements. Below, we review the
transacting environment of formal trading in Indo-Sri Lanka trade with a view to
understanding and quantifying the sources of transaction costs in formal trading.
The transaction costs in the formal channel may arise at the following stages of
international trade transactions: (1) securing import/export licenses, (2) procedural delays
at the customs, (3) processing cost at the banks, (4) movement of merchandise. All these
procedural complexities along with institutional bottlenecks and lack of information
transparency give rise to rent-seeking behavior by the officials at various stages of trading.
These may cost traders time and money including demurrage charges, making it more
expensive to trade formally. The additional time taken is estimated as the difference
between the actual time taken and the average of trader’s perception about the time that
should is required at different stages of transactions. The survey reveals that licensing
takes up-to 10 extra days for 54% of formal traders. Further, all formal traders reported
that there was a delay of up-to 10 additional days in getting clearances from customs.
Additional time for clearances from banks took up-to 10 additional days by 88% of the
formal traders. Transportation of merchandise between India and Sri Lanka takes upto 10
extra days than expected by 98% of formal traders. (See Table 19).
30
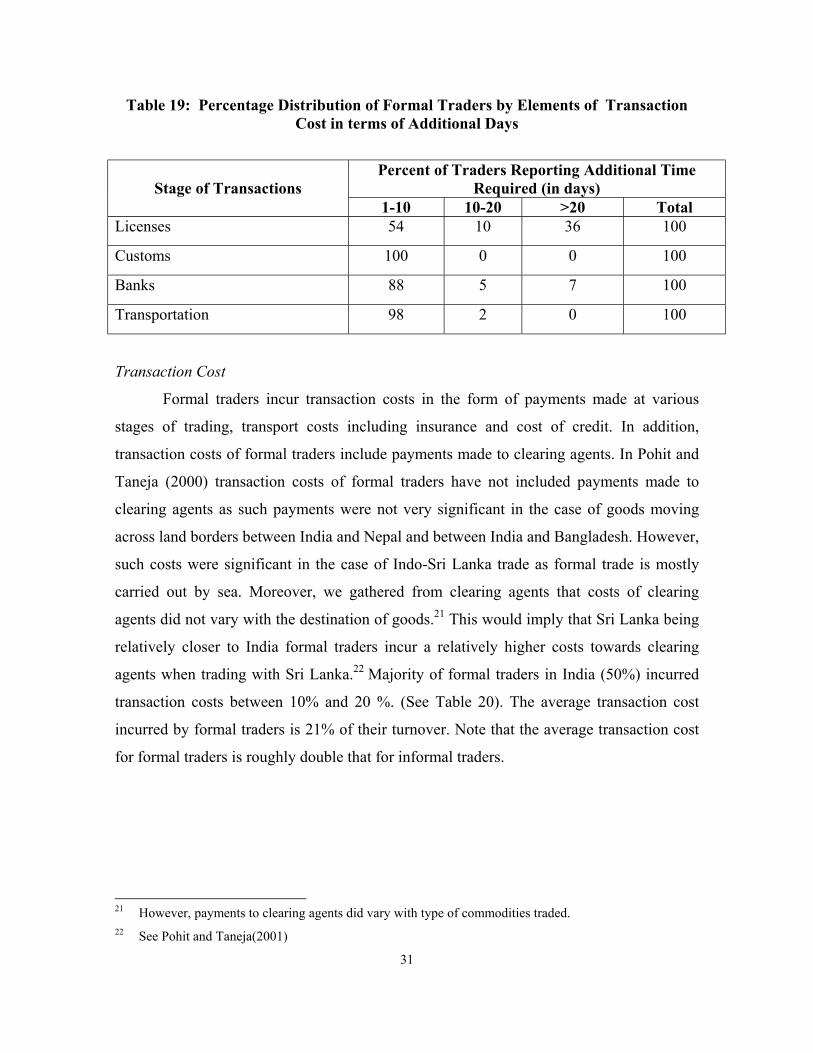
Table 19: Percentage Distribution of Formal Traders by Elements of Transaction Cost in terms of Additional Days
Percent of Traders Reporting Additional Time Required (in days)
Stage of Transactions
1-10 10-20 >20 Total Licenses 54 10 36 100
Customs 100 0 0 100
Banks 88 5 7 100
Transportation 98 2 0 100
Transaction Cost
Formal traders incur transaction costs in the form of payments made at various
stages of trading, transport costs including insurance and cost of credit. In addition,
transaction costs of formal traders include payments made to clearing agents. In Pohit and
Taneja (2000) transaction costs of formal traders have not included payments made to
clearing agents as such payments were not very significant in the case of goods moving
across land borders between India and Nepal and between India and Bangladesh. However,
such costs were significant in the case of Indo-Sri Lanka trade as formal trade is mostly
carried out by sea. Moreover, we gathered from clearing agents that costs of clearing
agents did not vary with the destination of goods.21 This would imply that Sri Lanka being
relatively closer to India formal traders incur a relatively higher costs towards clearing
agents when trading with Sri Lanka.22 Majority of formal traders in India (50%) incurred
transaction costs between 10% and 20 %. (See Table 20). The average transaction cost
incurred by formal traders is 21% of their turnover. Note that the average transaction cost
for formal traders is roughly double that for informal traders.
21 However, payments to clearing agents did vary with type of commodities traded. 22 See Pohit and Taneja(2001)
31
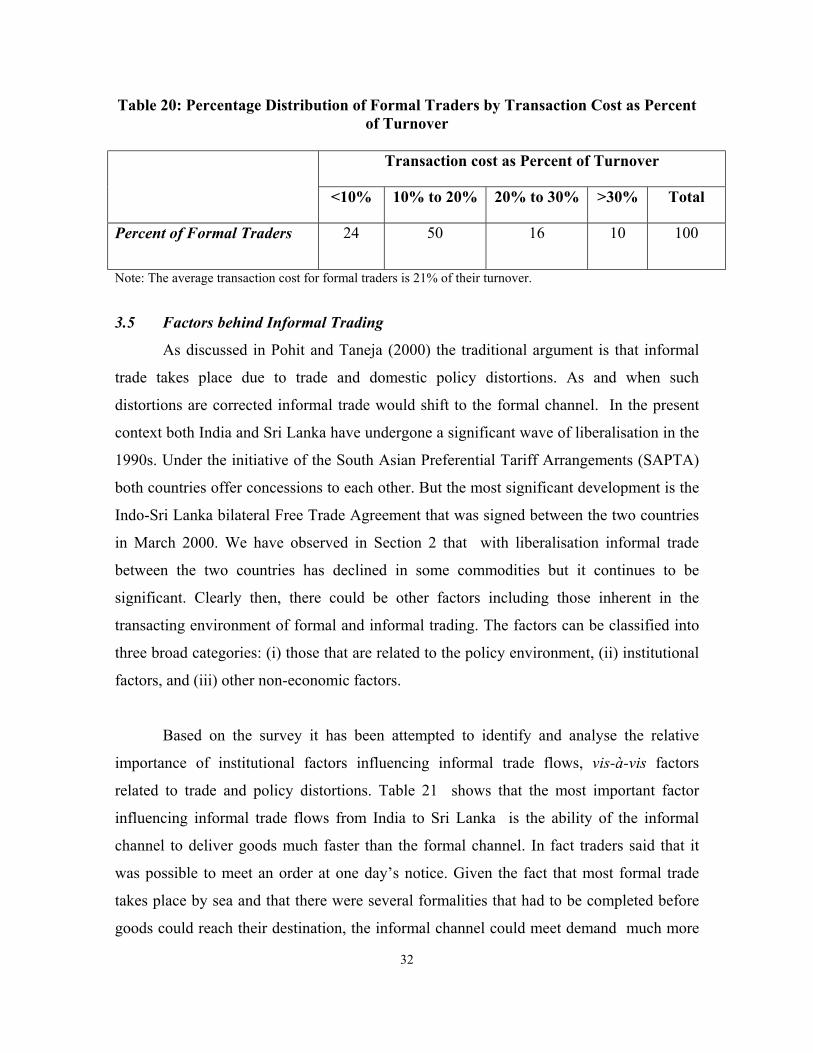
Table 20: Percentage Distribution of Formal Traders by Transaction Cost as Percent of Turnover
Transaction cost as Percent of Turnover
<10% 10% to 20% 20% to 30% >30% Total
Percent of Formal Traders
24
50
16
10
100
Note: The average transaction cost for formal traders is 21% of their turnover.
3.5 Factors behind Informal Trading
As discussed in Pohit and Taneja (2000) the traditional argument is that informal
trade takes place due to trade and domestic policy distortions. As and when such
distortions are corrected informal trade would shift to the formal channel. In the present
context both India and Sri Lanka have undergone a significant wave of liberalisation in the
1990s. Under the initiative of the South Asian Preferential Tariff Arrangements (SAPTA)
both countries offer concessions to each other. But the most significant development is the
Indo-Sri Lanka bilateral Free Trade Agreement that was signed between the two countries
in March 2000. We have observed in Section 2 that with liberalisation informal trade
between the two countries has declined in some commodities but it continues to be
significant. Clearly then, there could be other factors including those inherent in the
transacting environment of formal and informal trading. The factors can be classified into
three broad categories: (i) those that are related to the policy environment, (ii) institutional
factors, and (iii) other non-economic factors.
Based on the survey it has been attempted to identify and analyse the relative
importance of institutional factors influencing informal trade flows, vis-à-vis factors
related to trade and policy distortions. Table 21 shows that the most important factor
influencing informal trade flows from India to Sri Lanka is the ability of the informal
channel to deliver goods much faster than the formal channel. In fact traders said that it
was possible to meet an order at one day’s notice. Given the fact that most formal trade
takes place by sea and that there were several formalities that had to be completed before
goods could reach their destination, the informal channel could meet demand much more
32

quickly. The next important factors were absence of procedural delays and paper work in
the informal channel. The fourth most important factor was ethnic ties between trading
partners. In fact traders mentioned that they had closer cultural ties with Sri Lankans than
with nationals in other Indian states. The fifth most important factor was quick realization
of payments. It needs to be mentioned that ethnic ties play a crucial role in ensuring that
payments are made promptly. Interestingly, as was found in our earlier study, very few
respondents considered tariff and non-tariff barriers to be an important factor in
influencing informal trade flows. (See Table 21). On the import front, demand for third
country goods was considered the most important factor influencing imports. This factor is
clearly related to the difference in tariffs with the rest of the world prevailing in India and
Sri Lanka. In the context of the FTA this implies that third country goods do not meet the
requirements of rules of origin principles and are therefore traded informally from Sri
Lanka to India. However, such trade is significantly lower than was witnessed in the early
nineties when informal exports were roughly equal to informal imports. Lowering of tariffs
has led to a reduction in informal imports of third country goods in recent years.23 Other
factors considered important in influencing informal imports are ethnic ties, quick
realisation of payments, no procedural delays and lower time to reach destination. It is
important to mention that informal imports are carried out in locally produced items as
well. Our estimates of air-borne informal trade reveal that spices and ceramic are two
locally produced items constituting 38% of total informal imports. (see Table 6). Such
inflows would take place due to factors other than those related to trade barriers. While
third country imports are significant in Indo-Sri Lanka informal trade, a distinguishing
feature in Indo-Nepal informal trade is that informal imports are almost as large as
informal exports.24
23 See Sarvananthan (1994) 24 Findings from ongoing study at ICRIER.
33
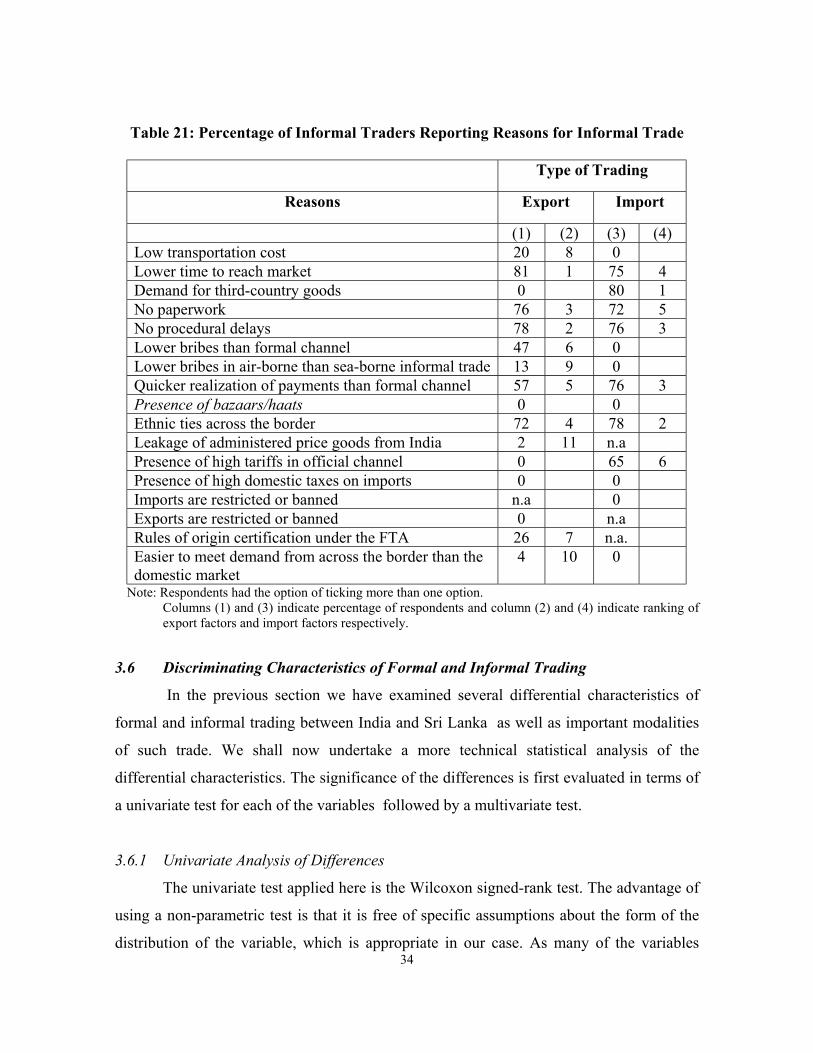
Table 21: Percentage of Informal Traders Reporting Reasons for Informal Trade Type of Trading
Reasons Export Import
(1) (2) (3) (4) Low transportation cost 20 8 0 Lower time to reach market 81 1 75 4 Demand for third-country goods 0 80 1 No paperwork 76 3 72 5 No procedural delays 78 2 76 3 Lower bribes than formal channel 47 6 0 Lower bribes in air-borne than sea-borne informal trade 13 9 0 Quicker realization of payments than formal channel 57 5 76 3 Presence of bazaars/haats 0 0 Ethnic ties across the border 72 4 78 2 Leakage of administered price goods from India 2 11 n.a Presence of high tariffs in official channel 0 65 6 Presence of high domestic taxes on imports 0 0 Imports are restricted or banned n.a 0 Exports are restricted or banned 0 n.a Rules of origin certification under the FTA 26 7 n.a. Easier to meet demand from across the border than the domestic market
4 10 0
Note: Respondents had the option of ticking more than one option. Columns (1) and (3) indicate percentage of respondents and column (2) and (4) indicate ranking of
export factors and import factors respectively.
3.6 Discriminating Characteristics of Formal and Informal Trading
In the previous section we have examined several differential characteristics of
formal and informal trading between India and Sri Lanka as well as important modalities
of such trade. We shall now undertake a more technical statistical analysis of the
differential characteristics. The significance of the differences is first evaluated in terms of
a univariate test for each of the variables followed by a multivariate test.
3.6.1 Univariate Analysis of Differences
34
The univariate test applied here is the Wilcoxon signed-rank test. The advantage of
using a non-parametric test is that it is free of specific assumptions about the form of the
distribution of the variable, which is appropriate in our case. As many of the variables

considered here are qualitative in nature they can be classified or ranked but not measured
accurately, hence non-parametric tests are more appropriate for our analysis.25
The database comprises of fifty-five pairs of traders and sixteen parameters. A
one-tailed test has been conducted (at a 10% level of significance) since we have prior
hypotheses regarding the direction of the difference in many cases. The results for the
selected variables are given in Table 22.
The earlier sections have emphasized the role of transaction cost in informal and
formal trading arrangements. One of the key hypotheses in the paper is to test whether
informal trade flourishes because of lower transaction cost in informal trading than in
formal trading. We have used our survey data to arrive at the transactions costs of trading
in the two channels. The sign-rank test suggests that transaction costs in formal trade are
significantly higher than in informal trade.
Not only are transaction costs important in terms of actual costs incurred, but
traders often incur costs in terms of additional time at various stages of transactions.
Ideally there should be an imputed cost on time taken for transactions as this would be the
correct method of quantifying transaction costs in terms of additional time taken. However,
traders were unable to give an imputed value of time cost hence the second best solution
had to be adopted viz., eliciting information on time taken at various stages to carry out the
trade transactions between the two countries. In the Indo-Bangladesh and Indo-Nepal
survey transaction costs for formal and informal traders were considered only in terms of
costs. In the present study transaction costs have been measured both in terms of money
and time. The survey was used to elicit information on time taken by formal traders to
obtain licenses, to get clearances from banks and customs, realization of payments and
time taken to transport goods to the destination. Informal traders on the other hand were
asked about the time taken for realization of payments and time taken for transportation.
The sign rank test shows that the time taken at various transaction stages significantly
higher for formal traders than for informal traders.
35 25 For details see Taneja and Pohit (2002)
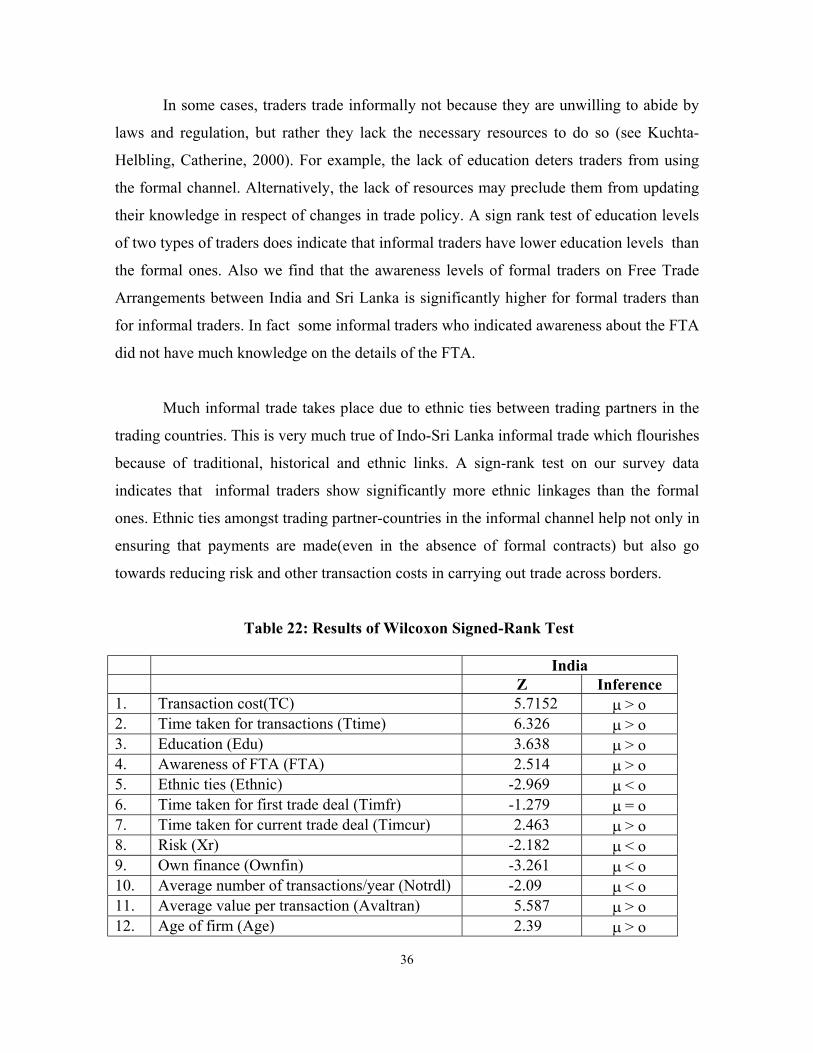
In some cases, traders trade informally not because they are unwilling to abide by
laws and regulation, but rather they lack the necessary resources to do so (see Kuchta-
Helbling, Catherine, 2000). For example, the lack of education deters traders from using
the formal channel. Alternatively, the lack of resources may preclude them from updating
their knowledge in respect of changes in trade policy. A sign rank test of education levels
of two types of traders does indicate that informal traders have lower education levels than
the formal ones. Also we find that the awareness levels of formal traders on Free Trade
Arrangements between India and Sri Lanka is significantly higher for formal traders than
for informal traders. In fact some informal traders who indicated awareness about the FTA
did not have much knowledge on the details of the FTA.
Much informal trade takes place due to ethnic ties between trading partners in the
trading countries. This is very much true of Indo-Sri Lanka informal trade which flourishes
because of traditional, historical and ethnic links. A sign-rank test on our survey data
indicates that informal traders show significantly more ethnic linkages than the formal
ones. Ethnic ties amongst trading partner-countries in the informal channel help not only in
ensuring that payments are made(even in the absence of formal contracts) but also go
towards reducing risk and other transaction costs in carrying out trade across borders.
Table 22: Results of Wilcoxon Signed-Rank Test
India Z Inference
1. Transaction cost(TC) 5.7152 µ > o 2. Time taken for transactions (Ttime) 6.326 µ > o 3. Education (Edu) 3.638 µ > o 4. Awareness of FTA (FTA) 2.514 µ > o 5. Ethnic ties (Ethnic) -2.969 µ < o 6. Time taken for first trade deal (Timfr) -1.279 µ = o 7. Time taken for current trade deal (Timcur) 2.463 µ > o 8. Risk (Xr) -2.182 µ < o 9. Own finance (Ownfin) -3.261 µ < o 10. Average number of transactions/year (Notrdl) -2.09 µ < o 11. Average value per transaction (Avaltran) 5.587 µ > o 12. Age of firm (Age) 2.39 µ > o
36

13. Trading in same commodities (Same) -0.61 µ = o 14. Profit -1.373 µ < o 15. Margin fluctuation (Marfl) 3.939 µ > o 16. Border price differential (Borpr) -2.175 µ < o
Null Hypothesis: µ = o for all variables. Where µ is the population median. Depending on a-priori judgement the alternative hypothesis is µ >0 or µ < 0 for the variable in question. Note: The results have to be treated with caution because the sample of informal traders is not a random one.
The efficiency of the information channel for informal trading arrangements is
judged by the following two attributes: (a) time taken for first trade deal and (b) time taken
for current trade deals. The result shows that there is no significant difference between
formal and informal traders in the time taken to finalize the first trade deal. However for
current trade deals that were taking place between trading partners, time taken to finalize
trade deals was significantly higher for formal traders than for informal traders.
The next attribute relates to the combined risk (viz., goods not conforming to
specification, incidence of default/delay in delivery and seizure) that traders face in
carrying out their transaction. Since informal trade is not legal, do informal traders face
higher risk? The statistical test shows that risk is significantly higher in the informal
channel than in the formal channel.
The next variable looks at the financing part of formal and informal traders. Do
informal traders have access to finance from legal financial institutions? How do they
meet their financing need? Do they use a higher proportion of own finance than formal
traders for carrying out business? Inference from the test shows that own finance plays a
significantly larger role in informal trade than in its formal counterpart.
Do informal traders have a larger number of transactions than formal traders? One
way that informal traders could mitigate risk is by having a larger number of transactions.
Our test shows that the average number of annual transactions is significantly higher in the
informal channel than in the formal channel. This brings us to the next hypothesis, i.e., is
informal trade characterized by large number of transactions, each having low volume of
trade. This variable was not considered in our earlier analysis of Indo-Bangladesh and
37

Indo-Nepal informal trade. We find that value of trade per transaction (Avaltran) is larger
for formal traders than the informal ones.26 This also implies that as formal traders trade in
larger volumes, they require larger amounts of working capital. This explains why own
finance and finance from friends and relatives play a minor role in financing formal trade.
Is the formal trader typically in business over a longer period than the formal one?
The test reveals that the age of firms was higher for formal than for informal traders.
Informal traders could play a role to narrow down the short-term demand/supply
gap. If that is so, the informal trader relative to formal counterpart should not carry out
transaction in the same commodity over time. The test however shows that there is no
significant difference between formal and informal traders on this count.
Maximization of profits is the objective function at individual level in any trading
activity. Naturally, one ponders whether there is significant difference between the profit
margins in the two channels. The test on differences in profit margin shows that profit
margins are significantly higher for informal traders than for formal traders. Also if profits
are higher for informal traders do their profits show higher fluctuations than formal
traders? The test shows that margin fluctuation is higher for formal traders than for
informal traders.
Border price differential is a driving force for sustaining informal/formal trade
activities. Is the border price differential higher for informal traders than for formal
traders? The test shows that border price differential is higher for informal traders than for
formal traders.
3.6.2 Discriminant Analysis
The factors identified by the univariate tests as important in differentiating the two
groups are then simultaneously included in a multivariate test. Our preferred choice of
26 This variable is generated by dividing annual turnover of a trader by the number of transactions carried
out during the year.
38
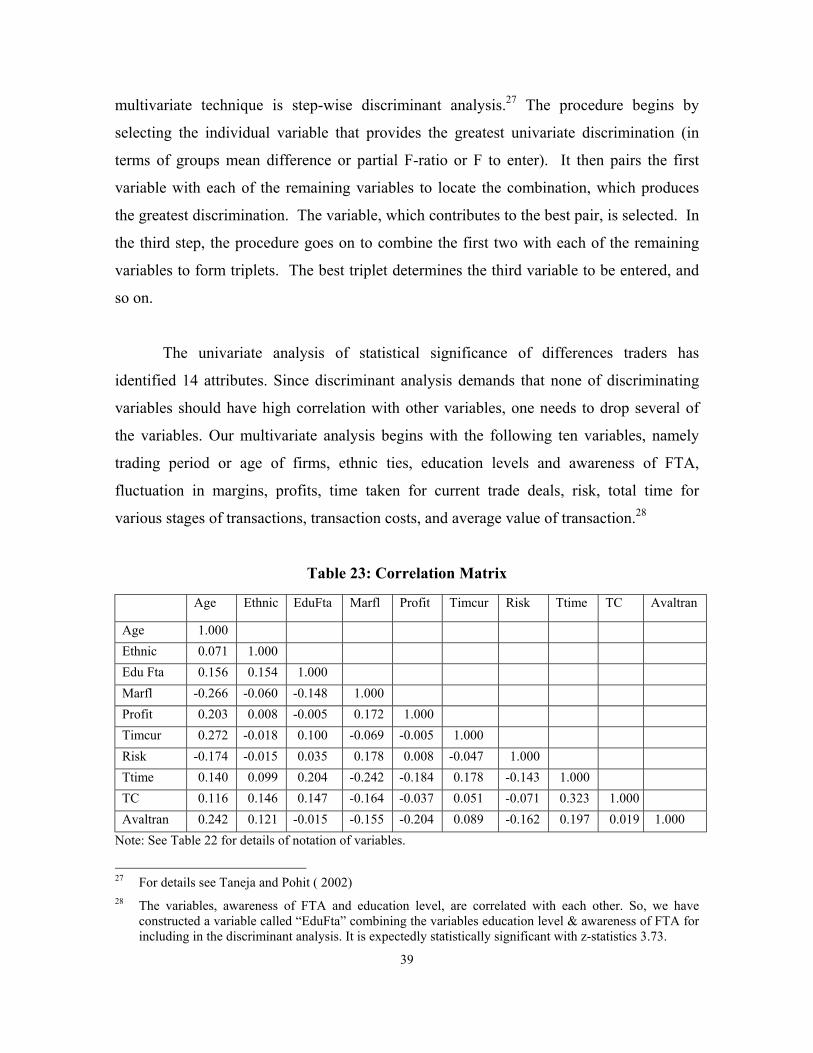
multivariate technique is step-wise discriminant analysis.27 The procedure begins by
selecting the individual variable that provides the greatest univariate discrimination (in
terms of groups mean difference or partial F-ratio or F to enter). It then pairs the first
variable with each of the remaining variables to locate the combination, which produces
the greatest discrimination. The variable, which contributes to the best pair, is selected. In
the third step, the procedure goes on to combine the first two with each of the remaining
variables to form triplets. The best triplet determines the third variable to be entered, and
so on.
The univariate analysis of statistical significance of differences traders has
identified 14 attributes. Since discriminant analysis demands that none of discriminating
variables should have high correlation with other variables, one needs to drop several of
the variables. Our multivariate analysis begins with the following ten variables, namely
trading period or age of firms, ethnic ties, education levels and awareness of FTA,
fluctuation in margins, profits, time taken for current trade deals, risk, total time for
various stages of transactions, transaction costs, and average value of transaction.28
Table 23: Correlation Matrix
Age Ethnic EduFta Marfl Profit Timcur Risk Ttime TC Avaltran
Age 1.000 Ethnic 0.071 1.000 Edu Fta 0.156 0.154 1.000 Marfl -0.266 -0.060 -0.148 1.000 Profit 0.203 0.008 -0.005 0.172 1.000 Timcur 0.272 -0.018 0.100 -0.069 -0.005 1.000 Risk -0.174 -0.015 0.035 0.178 0.008 -0.047 1.000 Ttime 0.140 0.099 0.204 -0.242 -0.184 0.178 -0.143 1.000 TC 0.116 0.146 0.147 -0.164 -0.037 0.051 -0.071 0.323 1.000 Avaltran 0.242 0.121 -0.015 -0.155 -0.204 0.089 -0.162 0.197 0.019 1.000
Note: See Table 22 for details of notation of variables.
27 For details see Taneja and Pohit ( 2002) 28 The variables, awareness of FTA and education level, are correlated with each other. So, we have
constructed a variable called “EduFta” combining the variables education level & awareness of FTA for including in the discriminant analysis. It is expectedly statistically significant with z-statistics 3.73.
39
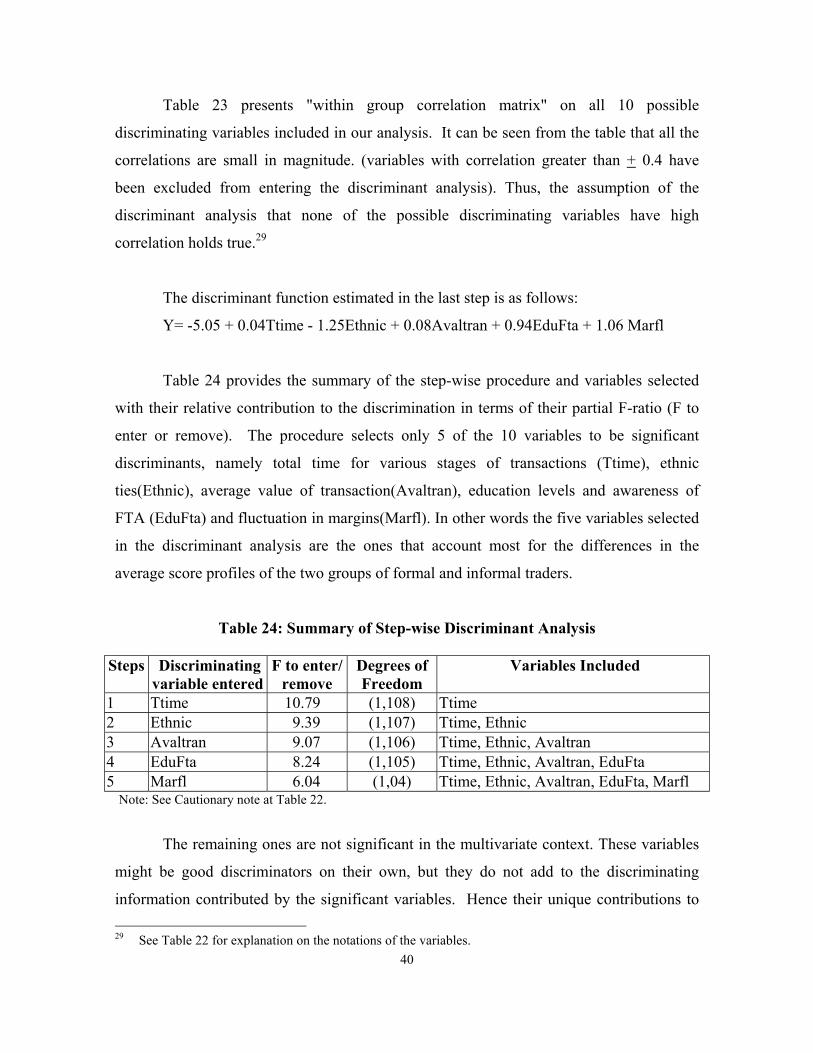
Table 23 presents "within group correlation matrix" on all 10 possible
discriminating variables included in our analysis. It can be seen from the table that all the
correlations are small in magnitude. (variables with correlation greater than + 0.4 have
been excluded from entering the discriminant analysis). Thus, the assumption of the
discriminant analysis that none of the possible discriminating variables have high
correlation holds true.29
The discriminant function estimated in the last step is as follows:
Y= -5.05 + 0.04Ttime - 1.25Ethnic + 0.08Avaltran + 0.94EduFta + 1.06 Marfl
Table 24 provides the summary of the step-wise procedure and variables selected
with their relative contribution to the discrimination in terms of their partial F-ratio (F to
enter or remove). The procedure selects only 5 of the 10 variables to be significant
discriminants, namely total time for various stages of transactions (Ttime), ethnic
ties(Ethnic), average value of transaction(Avaltran), education levels and awareness of
FTA (EduFta) and fluctuation in margins(Marfl). In other words the five variables selected
in the discriminant analysis are the ones that account most for the differences in the
average score profiles of the two groups of formal and informal traders.
Table 24: Summary of Step-wise Discriminant Analysis
Steps Discriminating variable entered
F to enter/ remove
Degrees of Freedom
Variables Included
1 Ttime 10.79 (1,108) Ttime 2 Ethnic 9.39 (1,107) Ttime, Ethnic 3 Avaltran 9.07 (1,106) Ttime, Ethnic, Avaltran 4 EduFta 8.24 (1,105) Ttime, Ethnic, Avaltran, EduFta 5 Marfl 6.04 (1,04) Ttime, Ethnic, Avaltran, EduFta, Marfl
Note: See Cautionary note at Table 22.
The remaining ones are not significant in the multivariate context. These variables
might be good discriminators on their own, but they do not add to the discriminating
information contributed by the significant variables. Hence their unique contributions to 29 See Table 22 for explanation on the notations of the variables. 40
the analysis are inadequate. Our discriminant functions are able to classify correctly nearly
82 per cent of the formal respondents and 91 per cent of the informal respondents. So,
they appear to be a good fit.
While the variables selected in the final stage of the discriminant analysis differ
amongst countries viz., Indo-Bangladesh, Indo-Nepal and Indo-Sri Lanka, the two
common variables selected in all the country studies are education levels and transaction
costs. It needs to be mentioned that in the case of Indo-Sri Lanka transaction cost in terms
of time but not in terms of money gets selected in the discriminant analysis. Also, the three
surveys are not strictly comparable on this count as the latter variable is introduced in the
Indo-Sri Lanka survey as part of the modifications carried out on measuring transaction
costs.
4. Summary and Policy Implications
This study makes an attempt to prepare estimates of informal trade between India
and Sri Lanka and also provides an in-depth analysis of the institutional mechanism that
enables informal trade to take place between the two countries. Using insights from New
Institutional Economics, informal and formal institutions engaged in cross-border trade are
contrasted to examine the transacting environments of formal and informal traders- to
understand whether informal trading arrangements provide good institutional solutions.
The survey data point to the evidence of a one-way informal trade from India to Sri
Lanka. Informal imports, significant until the early nineties have declined rapidly. While
informal trade from India to Sri Lanka takes place in goods produced in India, informal
trade from Sri Lanka to India takes place in both goods domestically produced in Sri
Lanka and goods that originate in third countries. The important commodities exported
informally from India are sarees, garments, electrical and mechanical items/ parts and
utensils. The important commodities imported are spices, electronic items and cosmetics.
The survey also reveals that since 1995 there has been a decline in most of the
commodities exported informally to Sri Lanka and a decline in all commodities imported.
The total two-way informal trade is still quite significant estimated at $207 million and is
41

30% of formal trade. As in the case of formal trade, in informal trade too there is a balance
of trade in India’s favor. The study has not looked into the issue of financing of informal
trade deficit that Sri Lanka has with India. It is a much larger problem and is beyond the
scope of the study. Informal money markets have colossal international networks and
financing cross-border informal trade is only one of their activities.
The study provides evidence on various aspects of the transacting environment for
informal trading. It reveals that in the absence of formal contracts between trading
partners, the informal trading arrangements have developed efficient institutional
mechanisms that ensure trade across national boundaries. Evidence from the survey
supports the view that informal trading arrangements are characterized by non-anonymous
transactions that not only facilitate the entry of firms into informal trading but also serve as
important channels of information flows on quantities and commodities to be traded. The
survey revealed that risk in informal trading activity is very low.
Our analysis of transacting environment of formal traders indicates they have to
incur high costs in terms of time and money at various stages of transactions. The
inefficiencies of the formal channel also give rise to rent-seeking activities of concerned
authorities.
The survey results confirm our hypothesis that the transaction costs in terms of both
money and time in the informal channel are significantly lower than in the formal channel.
This aspect was further highlighted when informal traders were asked about why they
opted for the informal channel. The survey revealed that factors like quick delivery of
goods, absence of procedural delays and paper work, ethnic ties between trading partners,
and quick realization of payments were important in driving traders to trade informally
between India and Sri Lanka. Tariff differentials were an additional factor influencing
informal imports from Sri Lanka. The other reasons for the preference of informal channel
appear to be the lower level of education, and lack of awareness of trade rules among the
informal traders.
42

The multivariate test selects five variables, namely, total time for various stages of
transactions, ethnic ties, average value of transaction, education level and awareness of
FTA and fluctuation in margins that account most for the differences in the two groups
of formal and informal traders.
What are the policy implications of the study? It is evident that the magnitude of
informal trade is quite large and cannot be ignored in any policy dialogue. It is also evident
that the channels through which informal trade takes place are rooted in the strong ethnic
ties among the traders and in the historical linkages in these societies. Ethnic trading
networks that operate on trust and honesty mitigate risks associated with such trading. The
involvement of law enforcement agencies to collect rents (thereby mitigating informal
trading risks) also makes the transacting and transporting processes smooth and acts as an
added incentive to carry on such trade. It is easily perceived that informal trade under
these circumstances would be difficult to eliminate. While it can well be argued that if the
transacting environment for informal trading is more efficient than for formal trading, why
not let it continue - the danger is that such routes are conduits for drugs/narcotics and
arms/ammunition. The aim of policy makers should be to reduce the occurrence of such
transactions so that more revenue accrues to the exchequer through duty-collections and
the danger of entry of illegal substances into the country is reduced. The associated money
laundering to finance such trade deals might prove to be a threat to the smooth functioning
of formal capital markets. However focus on law enforcement agencies to detect and
obstruct informal transit of goods across borders is not a viable solution as increase in
enforcement mechanisms could only lead to increase in rent collections. What would be
more effective would be to reduce the impediments to trade in the formal channels and
allow free capital movement between the two countries. The reduction of impediments to
trade would also have a much larger impact in the form of trade expansion from the South
Asian region. It may be stated here that the study finds that the incidence of informal trade
between India and Sri Lanka has gone down after liberalization and further reduction of
tariffs might reduce the incidence of informal trade.
43
Information is another important aspect which has to be looked into. It is true that a
major proportion of informal traders are locals who do not have high levels of education or
are only conversant with local languages. It cannot be expected of them to understand and
subsequently follow the terms and conditions of the FTA which is a document only
available in English (not in any local language spoken in the two countries) and often
difficult even for conversant persons to follow. Such gaps have to be filled by suitable
dissemination of information and creation of awareness among traders of the various
norms. Time delays due to unnecessarily long and complicated procedures need to be
reduced by simplifying the procedures.
In sum, while informal trade is unlikely to be totally eliminated because ethnic
trading networks between trading partners would continue to facilitate informal trade by
reducing transaction costs through minimization of risk costs, market information and
search costs, further reduction of tariffs, improvements in the transacting environment of
formal trade, improving awareness and education levels and improving information
dissemination would lead to a decline in informal trade flows.
44

References
Assaad, R. (1993), “Formal and Informal Institutions in the Labor Market, with
applications to the Construction Sector in Egypt”, World Development, Vol. 21, No.6, pp
925-939.
Bardhan, P. K. (1989), “The New Institutional Economics and Development Theory: A
Brief Critical Assessment”, World Development, Vol.17, No. 9, pp1389-1395.
Chaudhari, S.K. (1995) 'Cross Border Trade Between India and Bangladesh,' NCAER,
Working Paper 58, New Delhi.
Coase , R. H. (1960), “The Problem of Social Cost,” Journal of Law and Economics.
MacGaffey, Janet, and Remy Bazenguissa-Ganga, (2000), Congo-Paris: Transnational
Traders on the Margins of Law, James Currey, Oxford.
Clague, Christopher (ed), (1997), Institutions and Economic Development: Growth and
Governance in Less-Developed and Post-Socialist Countries, The John Hopkins
University Press, Baltimore and London.
Directorate General of Commercial Intelligence and Statistics, (various issues) “
Monthly Statistics of the Foreign Trade of India, Government of India, India.
Harriss, John, Janet Hunter, and Colin M.Lewis (ed), (1995), The New Institutional
Economics and Third World Development, Routledge, London and New York.
Karmacharya, Binod K, (2001), “Indo-Nepal Free Trade Agreement: Issues and
Opportunities”, a paper presented at the international seminar on South Asian Economic
Co-operation: Problems and Prospects, March 02-03, Kalutara (Sri Lanka).
Kelegama, Saman, (2001), “Indo-Lanka Free Trade Agreement: First Year Review”, a
paper presented at a seminar organised by the National Chamber of Commerce, May 02,
Colombo.
Landa, Janet Tai, (1994), Trust, Ethnicity, and Identity: Beyond the New Institutional
Economics of Ethnic Trading Networks, Contract Law, and Gift-Exchange, The University
of Michigan Press, Ann Arbor.
Langlois, Richard N. (1986) “The New Institutional economics: An Introductory Essay,”
in Richard N. Laglois (Ed.), Economics as a Process: Essays in the New Institutional
Economics (New York: Cambridge University Press).
45
Mehta., R and S. K. Bhattacharya (1997) 'SAPTA I, SAPTA II and SAFTA: Impact on
India’s Imports, South Asian Survey,' Sage Publications , New Delhi.
Lin, J.Y. and Nugent J.B. (1995), “Institutions and Economic Development,” in
Handbook of Development Economics, Volume III, edited by J. Behrman, and T.N.
Srinivasan.
Nabli, M. K., and J. B. Nugent (1989a), “The New Institutional Economics and
Economic Development: An Introduction” in M. K. Nabli and J. B. Nugent (Eds.), The
New Institutional Economics and Development: Theory and Applications to Tunisia
(Amsterdam: North Holland).
Nabli, M. K., and J. B. Nugent (1989b), “The New Institutional Economics and its
Applicability to Development,” World Development , Vol. 17, No. 9 pp 1333-1347.
Pohit, Sanjib and Nisha Taneja, (2000), India’s Informal Trade with Bangladesh and
Nepal: A Qualitative Assessment, Working Paper 58, Indian Council for Research on
International Economic Relations (ICRIER), New Delhi.
Pohit Sanjib and Nisha Taneja (2002) “India’s Informal Trade with Bangladesh and
Nepal: A Comparative Analysis” in Trade, Finance and Investment in South Asia edited by
T.N. Srinivasan, Social Science Press, New Delhi.
Samuels, Warren J (ed), (1988), Institutional Economics, Volumes I, II, & III, Edward
Elgar Publishing Limited, Aldershot.
Taneja, Nisha (2001) “Informal Trade in SAARC Region”, Economic and Political
Weekly, March 17-23.
Taneja, Nisha and Sanjib Pohit (2001) “India’s Informal Trade with Nepal”, Economic
and Political Weekly, June 23-29.
Taneja, Nisha and Sanjib Pohit (2002) “Characteristics of India’s Informal and Formal
Trading with Nepal: A Comparative Analysis” Indian Economic Review, Delhi School of
Economics. (forthcoming)
Sarvananthan, M. (1994) Contraband Trade and Unofficial Capital Transfers between Sri
Lanka and India, Economic and Political Weekly, India, July 23.
Sarvananthan, Muttukrishna, (2001), An Assessment of Contraband Trade and Capital
between India and Sri Lanka, Kumaran Publishing House, Chennai (Madras) and
Colombo.
46

Weerakoon, Dushni, (2001), “Indo-Sri Lanka Free Trade Agreement: How ‘free’ is it?”, a
paper presented at the international seminar on South Asian Economic Co-operation:
Problems and Prospects, March 02-03, Kalutara (Sri Lanka).
47

Appendix
Table 1(a)
Estimates of Air-borne Informal Exports by ‘Knowledgeable Persons’: 2000-01
(1)
Number of Passengers
(2)
Proportion of
passengers doing informal
trade (3)
Value in US $ per trip
(4)
Value of estimated annual exports in
US $ mn (5)
Chennai- Colombo(SL) 104224 50% 1423 74.2
Chennai- Colombo(IA) 48913 55% 1423 38.3 Chennai (SL+IA) 112.5 Tiruchirapalli- Colombo(SL) 22922 30% 985 6.8 Tiruchirapalli (SL+IA) 6.8 Thiruvanthapuram-Colombo(SL) 41879 10% 876 3.7 Thiruvanthapuram-Colombo(IA) 14534 20% 876 2.5 Thiruvananthapuram (SL+IA) 6.5 Total 125.8 Note: SL is Sri Lankan Airlines and IA is Indian Airlines Data Source for Column (2) : From Airline officials of SL and IA. Data Source for Column (3) : Given by sample of ‘Knowledgeable Persons’ Column (5)= [Column (3) of Column (2)] x Column (4)
48

Table 1 (b) Estimates of Air-borne Informal Imports by ‘Knowledgeable Persons’: 2000-01
(1)
Number of Passengers
(2)
Proportion of passengers
doing informal trade
(3)
Value in US $ per trip
(4)
Value of estimated annual exports in US $
mn (5)
Chennai- Colombo(SL) 108033 50% 263 14.2
Chennai- Colombo(IA) 48194 55% 263 7.0 Chennai (SL+IA) 21.2 Tiruchirapalli- Colombo(SL) 23715 30% 175 1.2 Tiruchirapalli (SL+IA) 1.2 Thiruvanthapuram-Colombo(SL) 42570 10% 175 0.7 Thiruvanthapuram-Colombo(IA) 14385 20% 175 0.8 Thiruvananthapuram (SL+IA) 1.5 Total (All centers) 23.9 Note: SL is Sri Lankan Airlines and IA is Indian Airlines Data Source for Column (2) : From Airline officials of SL and IA. Data Source for Column (3) : Given by sample of ‘Knowledgeable Persons’ Column (5)= [Column (3) of Column (2)] x Column (4)
49
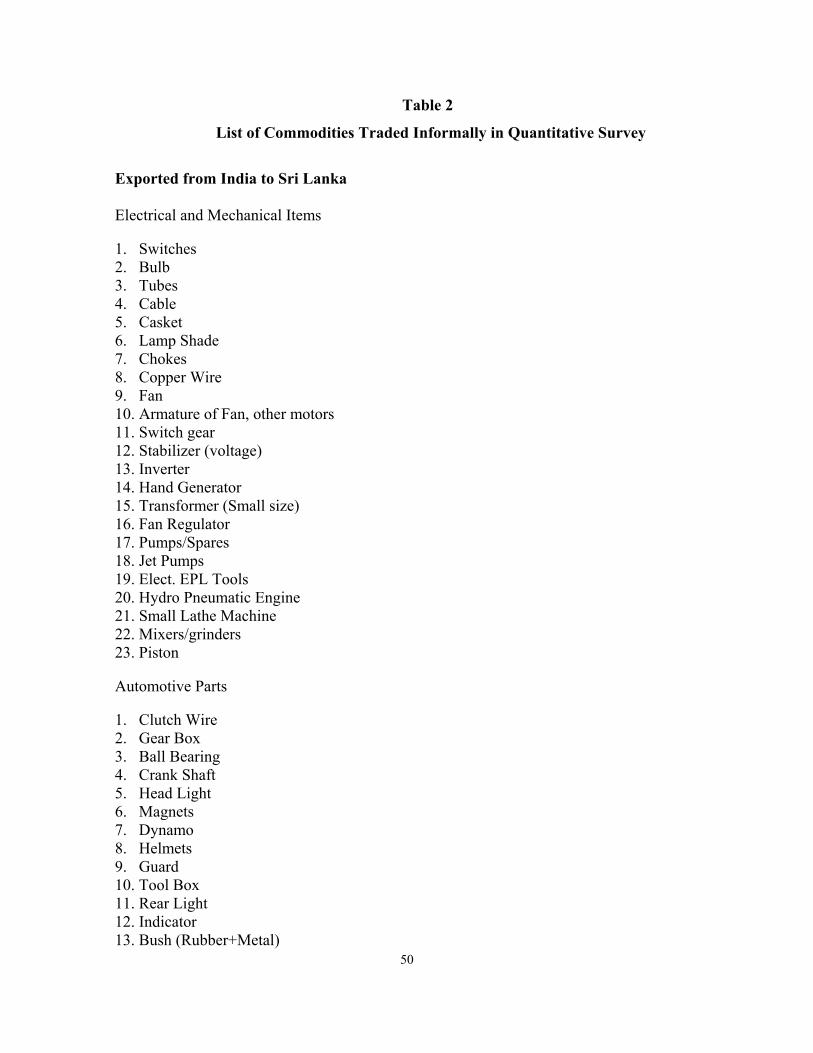
Table 2
List of Commodities Traded Informally in Quantitative Survey
Exported from India to Sri Lanka Electrical and Mechanical Items 1. Switches 2. Bulb 3. Tubes 4. Cable 5. Casket 6. Lamp Shade 7. Chokes 8. Copper Wire 9. Fan 10. Armature of Fan, other motors 11. Switch gear 12. Stabilizer (voltage) 13. Inverter 14. Hand Generator 15. Transformer (Small size) 16. Fan Regulator 17. Pumps/Spares 18. Jet Pumps 19. Elect. EPL Tools 20. Hydro Pneumatic Engine 21. Small Lathe Machine 22. Mixers/grinders 23. Piston Automotive Parts 1. Clutch Wire 2. Gear Box 3. Ball Bearing 4. Crank Shaft 5. Head Light 6. Magnets 7. Dynamo 8. Helmets 9. Guard 10. Tool Box 11. Rear Light 12. Indicator 13. Bush (Rubber+Metal) 50
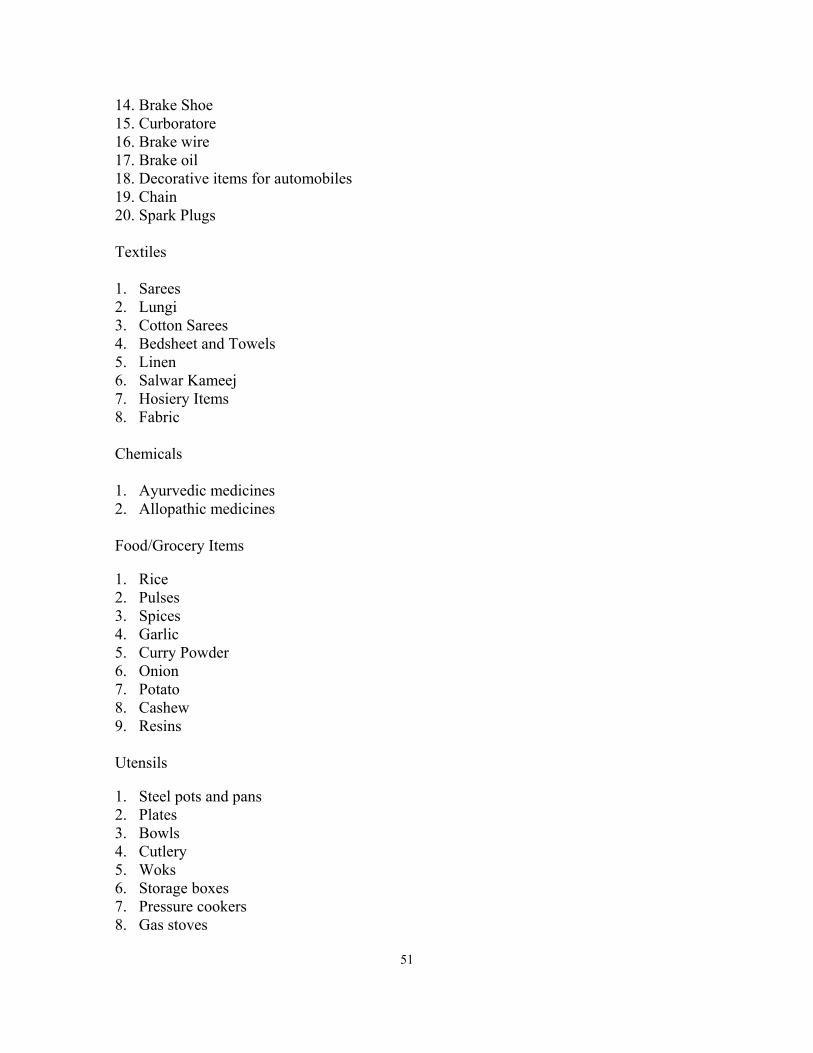
14. Brake Shoe 15. Curboratore 16. Brake wire 17. Brake oil 18. Decorative items for automobiles 19. Chain 20. Spark Plugs Textiles 1. Sarees 2. Lungi 3. Cotton Sarees 4. Bedsheet and Towels 5. Linen 6. Salwar Kameej 7. Hosiery Items 8. Fabric Chemicals 1. Ayurvedic medicines 2. Allopathic medicines Food/Grocery Items 1. Rice 2. Pulses 3. Spices 4. Garlic 5. Curry Powder 6. Onion 7. Potato 8. Cashew 9. Resins Utensils 1. Steel pots and pans 2. Plates 3. Bowls 4. Cutlery 5. Woks 6. Storage boxes 7. Pressure cookers 8. Gas stoves
51
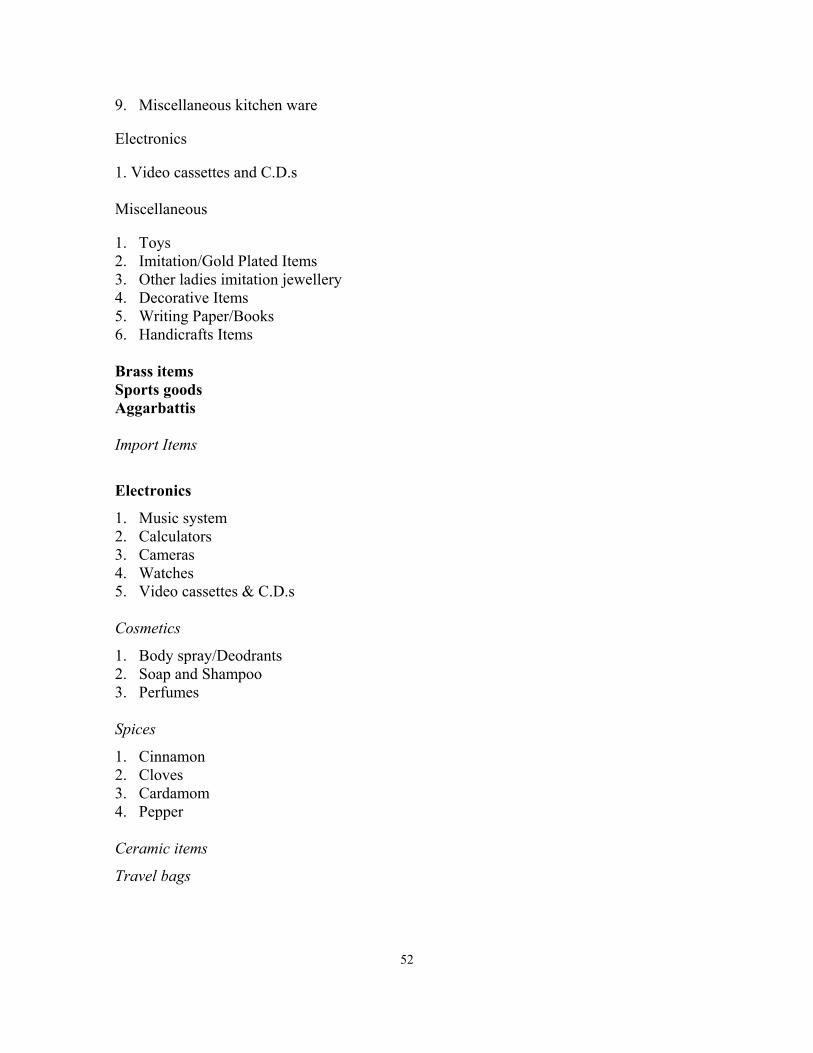
9. Miscellaneous kitchen ware Electronics 1. Video cassettes and C.D.s Miscellaneous 1. Toys 2. Imitation/Gold Plated Items 3. Other ladies imitation jewellery 4. Decorative Items 5. Writing Paper/Books 6. Handicrafts Items Brass items Sports goods Aggarbattis Import Items
Electronics
1. Music system 2. Calculators 3. Cameras 4. Watches 5. Video cassettes & C.D.s Cosmetics
1. Body spray/Deodrants 2. Soap and Shampoo 3. Perfumes Spices
1. Cinnamon 2. Cloves 3. Cardamom 4. Pepper Ceramic items
Travel bags
52

Table 3: Index for Goods Traded in Qualitative Survey (For Table 12) Informal Exports food includes garlic, dry grape, cashew, rice, pulses, onion, potato, curry powders textiles include fabrics, cotton sarees, lungi, salwar kameez, towel, bed sheets, linen, hosiery items chemicals include allopathic and ayurvedic medicines machinery and spares include small lathe machines, automotive parts, fibretube wire electrical items include motor pumps, water and jet pumps ,mixers/grinders, inverter, hand generators, transformers, fan regulators, switches, plugs, bulbs, tubes, cables electronics include CDs, video cassettes utensils include steel utensils, pressure cooker and spare parts, kitchenware miscellaneous includes decorative items, writing paper, metal brass religious articles, sports goods, handicraft toys, paper book gift articles, bags, etc. Informal Imports Food includes spices Liqour & cigarettes, cosmetics include soap, perfumes, body spray electronics include CDs, videos, calculators, cameras
Formal Exports food includes garlic, coriander, gingeroil, onion, sama pods and leaves, curry powder and spices, salt, vegetables, rice, chillies, turmeric, lentils, groundnut. textiles include cotton shirts, fabrics, cotton fabric, spun yarn dyed polyester blended fabric. chemicals include lab chemicals, anti corrosive products, medicines, poly bags cosmetics include hair oil, perfumes machinery and spares include rubber lining of steel articles, lab instruments, break lining, mechanical typewriter, LPG cylinder, medical equipment, plant machinery, tools, industrial scraps, clutch fittings, raw materials for industry, spare parts, engine with chassis, automotive parts, electrical items include electric kitchen machines, electric spike buster, air conditioner, utensils include steel utensils, primary goods including timber, stones, sand. miscellaneous includes nets Formal Imports food includes spices textiles include thread, padding machinery and spares include industrial scraps primary goods include timber miscellaneous include waste papers
53