INDIA SOLAR - Solare · PDF fileINDIA SOLAR MAP 2015 ASSAM ... Gurgaon, Haryana - 122002,...
2
| +91 11 6654 4708 Mr Tumul Dwivedi (Country Representative) [email protected] www.solarcapital.co.za > 250 MW installed LOWEST COST SOLAR POWER PRODUCER GRID SCALE >50MW INDEPENDANT POWER PRODUCER 266 65 153 KERALA 8,707 MW 4,060 MW 4,678 MW GUJARAT MAHARASHTRA KARNATAKA MADHYA PRADESH RAJASTHAN HARYANA PUNJAB JAMMU & KASHMIR UTTARAKHAND DELHI UTTAR PRADESH JHARKHAND BIHAR MEGHALAYA WEST BENGAL CHATTISGARH ODISHA TAMIL NADU 896 34 2,000 40 26 11 188 44 246 971 1,750 41 111 33 40 5 5 33 2 2 7 16 14 395 112 1 130 2 1 2 16 9 197 PUD 910 Tenders 250 40 128 863 Comm. Comm. Comm. 78 Comm. 18 PUD 155 930 250 Comm. Tenders 565 670 250 862 PUD 225 2,040 TELANGANA 5 76 35 Comm. Comm. PUD 1,750 Tenders Comm. PUD 40 35 PUD Comm. PUD 29 PUD Comm. 5 Tenders 127 395 100 10 PUD 10 10 10 35 PUD 811 Comm. 910 50 1,295 5 Comm. 29 5 Solar parks being developed by Solar Energy Corporation of India (Capacity) Risk profile of Distribution Companies (as per CRISIL, 2013) High Medium low All figures in MW www.bridgetoindia.com Tenders Comm. 250 1,031 Central PV allocation Commissioned (Comm.) Projects under development (PUD) Tenders in progress (Tenders) State PV allocation Other PV CSP 15 117 13 10 1,330 280 3,760 300 7,953 474 2,064 1,066 219 Comm. PUD 222 862 Comm. 13 13 50 150 Tenders 130 150 260 PUD 116 2,580 2,500 661 50 8 5 3 3 PUD Tenders Comm. 55 150 19 Comm. 7 INDIA SOLAR MAP 2015 ASSAM Premium sponsor Launch partner ANDHRA PRADESH 35 55 150 224 146 300 195 370 PUD 500 Comm. Tenders 50 403 500 67 136 200 40 10 80 100 Total utility scale solar capacity as of September 2015 (MW) 2,500 MW 1,000 MW 1,600 MW 750 MW 600 MW 2,700 MW 700 MW 150 MW 200 MW 31.2% Self EPC 6.7% STERLING & WILSON BELECTRIC 0.7% IBC SOLAR 0.5% PHOTON 0.6% OTHERS 5.7% 5.9% L&T 5.5% MOSER BAER TATA POWER SOLAR 4.5% LANCO 3.6% MAHINDRA 3.4% WAAREE 3.3% JUWI 3.6% RAYS POWER 3.4% INFRA UJAAS 2.2% RAYS EXPERTS 2.4% REFEX 2.6% MEIL 1.5% VIKRAM SOLAR 1.8% ENRICH 1.9% HARSHA ABAKUS 2.0% EMMVEE 1.5% BHEL 1.4% CHEMTROLS 0.9% JAKSON POWER 0.8% BOSCH 0.7% PREMIER 0.7% CIRUS SOLAR 1.5% EPC contractors 30.3% ABB 22.4% SMA OTHERS 1.1% REFUSOL 0.4% SHARP 0.5% TBEA 0.5% BONFIGLIOLI 15.2% SCHNEIDER 8.1% AEG 4.2% TMEIC 2.5% HITACHI 7.1% HELIOS 2.9% STATCON 1.0% SIEMENS 0.9% SANTERNO 0.9% DELTA 0.8% ELTEK 0.6% SUNGROW 0.5% Inverter suppliers 15.6% FIRST SOLAR 7.6% OTHERS 10.0% TRINA 9.3% CANADIAN 6.4% RENESOLA WAAREE 4.0% CHINT 3.5% EMMVEE 3.4% SHARP 2.7% VIKRAM SOLAR 2.7% HANWHA 2.6% YINGLI 2.3% NEXPOWER 2.1% CNPV 1.3% SOLAR FRONTIER 1.3% DU PONT 1.3% UJAAS 1.2% SUNWELL 1.2% REC 1.0% SUNTECH 1.0% BHEL 0.8% LDK 0.8% SCHUTTEN 0.7% QS SOLAR 0.7% WEBEL 0.6% EINNOVA 0.6% SHAN SOLAR 0.6% SCHEUCO 0.5% HAREON 0.5% BYD 0.5% JINKO 4.6% CSUN 4.5% TATA POWER SOLAR 4.2% Module suppliers Crystalline Thin film Both Cumulative market shares (for projects commissioned until August 2015) 7.6% WELSPUN 5.4% AZURE OTHERS 44.4% 4.6% SUNEDISON 3.8% ACME 3.4% MAHAGENCO 2.7% ESSEL INFRA 2.5% NTPC 2.3% TORRENT 2.0% HPPPL 1.9% MALPANI 1.7% ADITYA BIRLA 1.3% TATA POWER 1.1% RENEW 1.1% WANEEP 1.1% TODAY GROUP 1.1% ROHA 1.1% SOLAIREDIRECT 1.0% RELIANCE 1.0% PUNJ LLYOD 0.9% HERO 0.9% ADANI 0.9% IL&FS 0.9% LANCO 0.9% KIRAN ENERGY 0.8% MAHINDRA 0.8% SEMBCORP 0.8% MADHAV INFRA APEX CLOTHING 0.7% VIKRAM 0.7% SWELECT 0.6% Project developers
Transcript of INDIA SOLAR - Solare · PDF fileINDIA SOLAR MAP 2015 ASSAM ... Gurgaon, Haryana - 122002,...

| +91 11 6654 4708
Mr Tumul Dwivedi (Country Representative)[email protected]
> 250 MW installed
LOWEST COST SOLAR POWER
PRODUCER
GRID SCALE >50MWINDEPENDANT POWER PRODUCER
266
65
153
KERALA
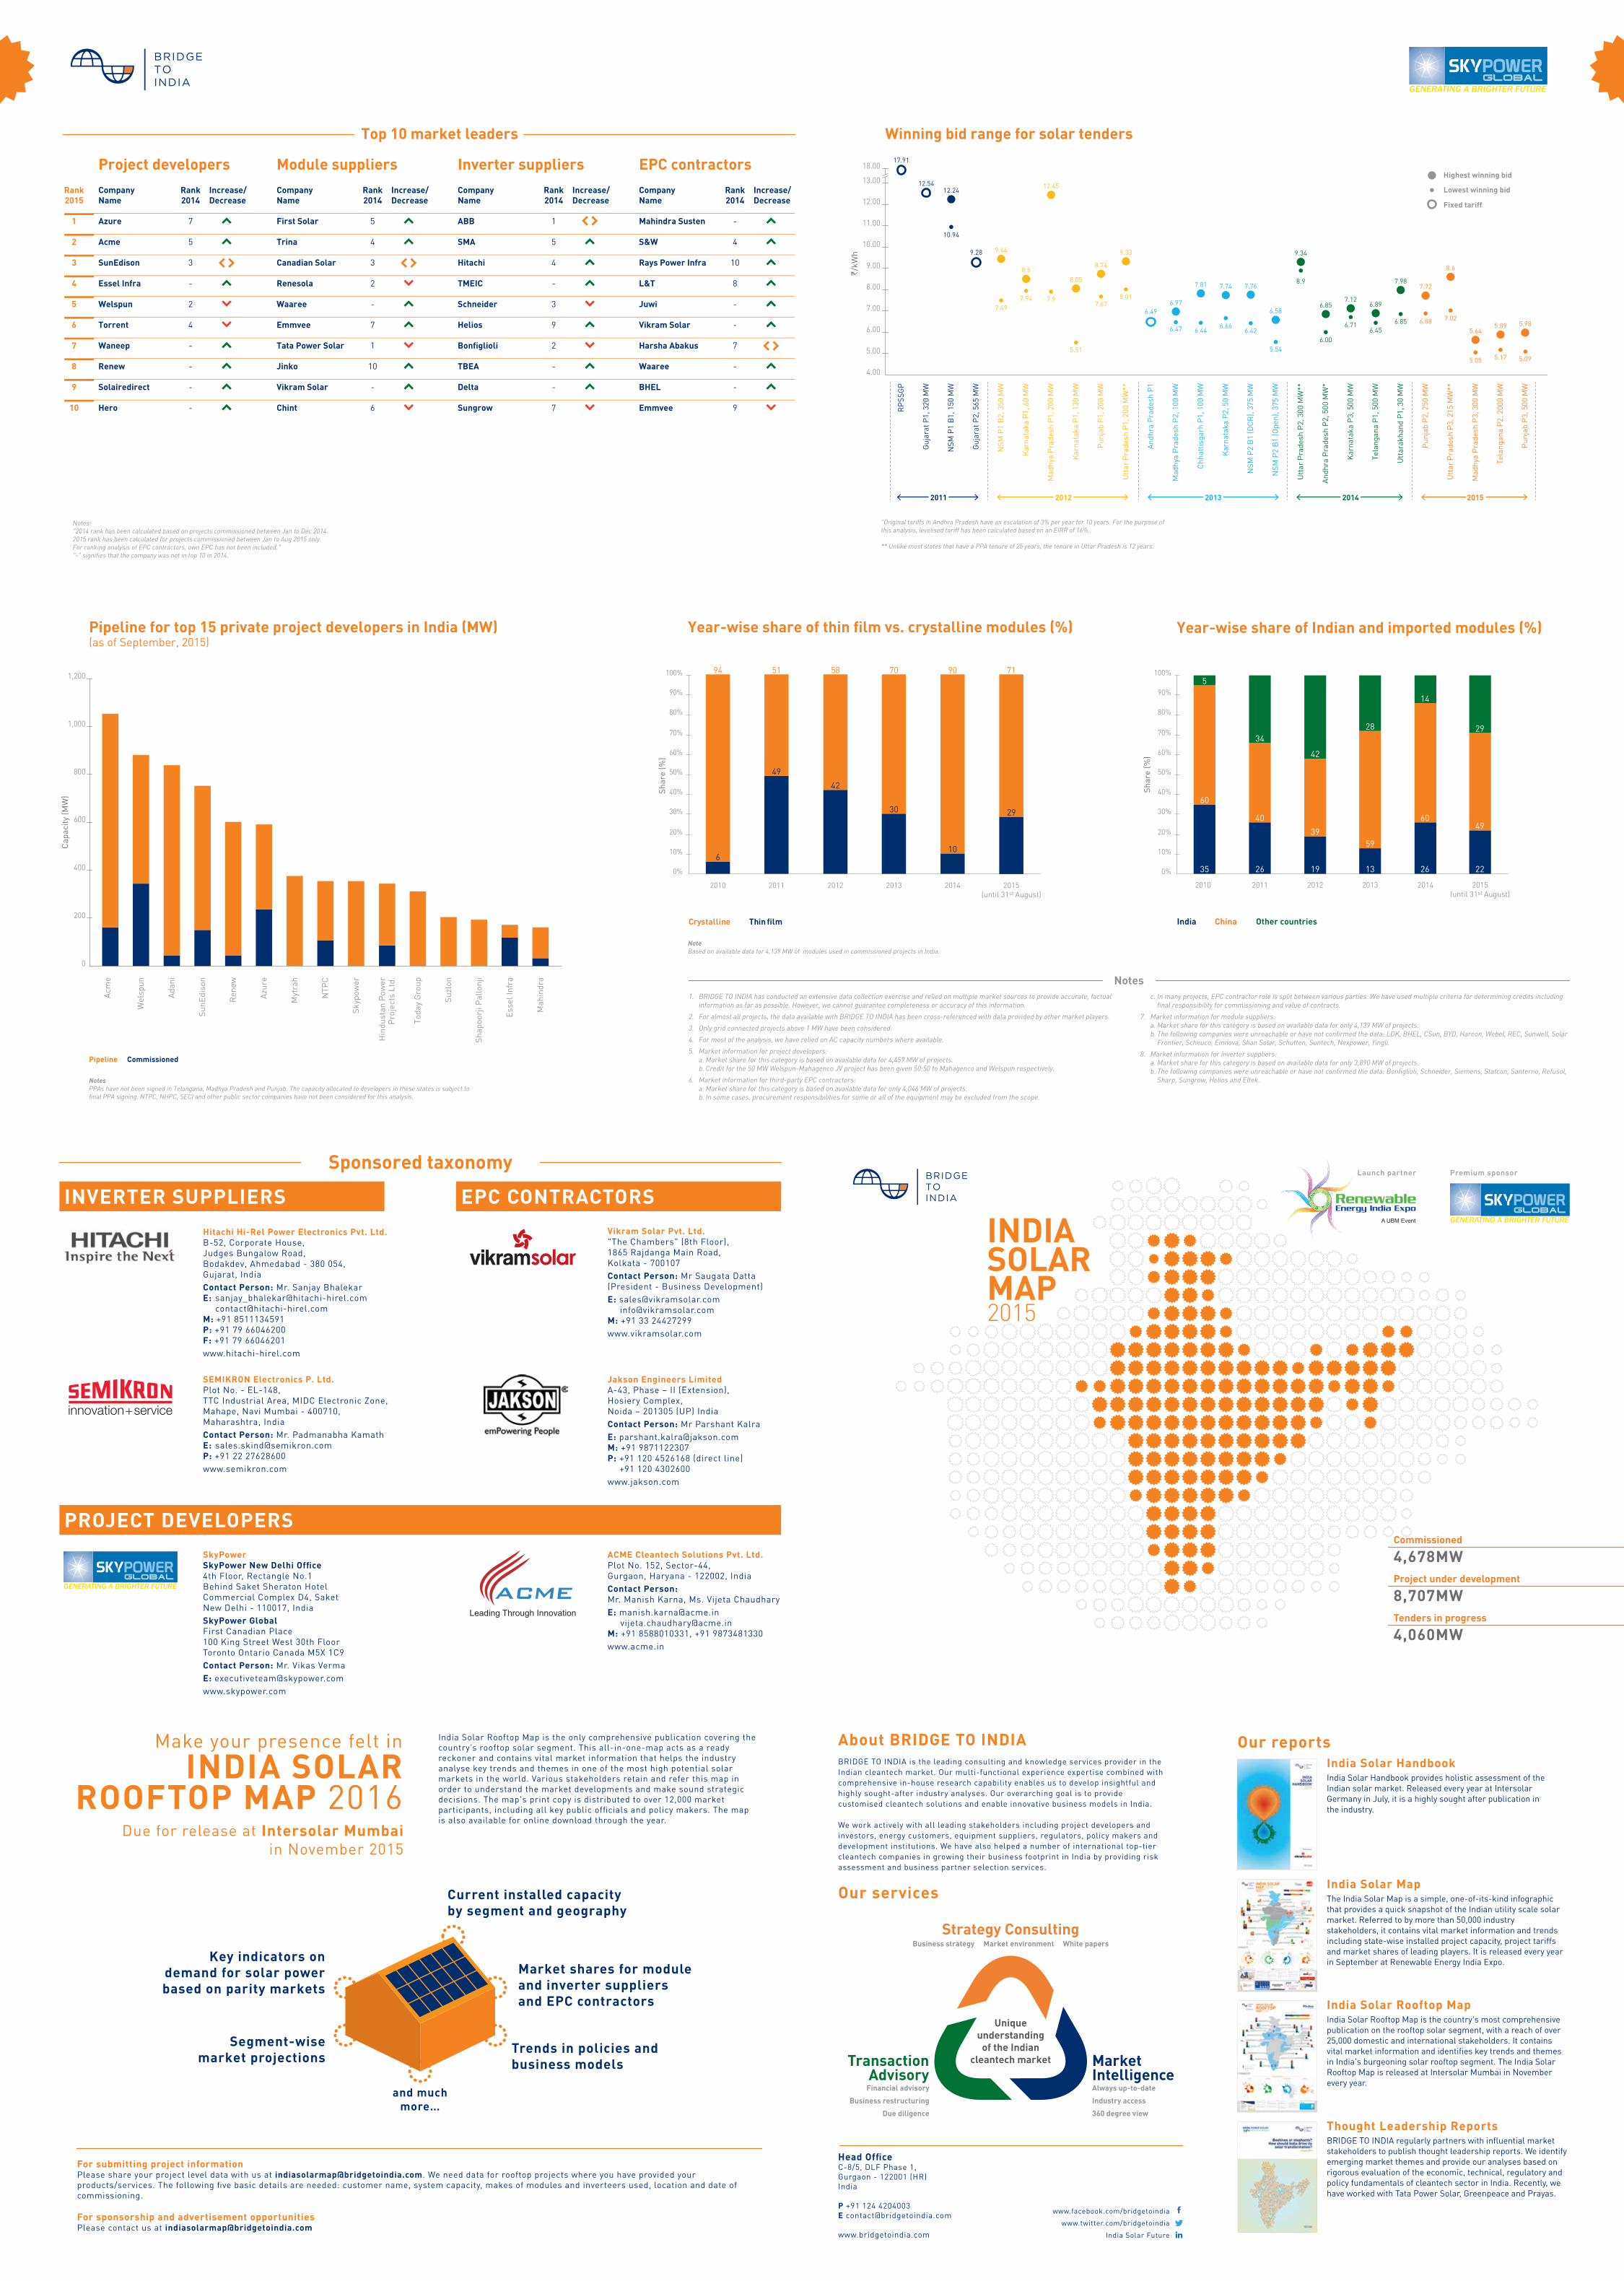
8,707 MW
4,060 MW
4,678 MW
GUJARAT
MAHARASHTRA
KARNATAKA
MADHYA PRADESH
RAJASTHAN
HARYANA
PUNJAB
JAMMU & KASHMIR
UTTARAKHAND
DELHI
UTTAR PRADESH
JHARKHAND
BIHAR
MEGHALAYA
WEST BENGAL
CHATTISGARH
ODISHA
TAMIL NADU
896
34
2,000
40
26
11
188
44
246
971
1,750
41
111
33
40
5
533
2
2
7
16
14 395
112
1130
21 2
16
9
197
PUD
910Tenders
25040
128
863
Comm.
Comm.
Comm.
78
Comm.
18
PUD
155
930
250Comm. Tenders
565
670
250
862
PUD
225
2,040
TELANGANA5
76
35
Comm.
Comm. PUD
1,750
Tenders
Comm. PUD
4035
PUD
Comm. PUD
29PUD
Comm.
5
Tenders
127
395
100
10PUD
10
10
10
35
PUD811
Comm.
910
50
1,295
5Comm.
29
5
Solar parks being developed bySolar Energy Corporation of India (Capacity)
Risk profile of Distribution Companies(as per CRISIL, 2013)High Medium low
All figures in MW
www.bridgetoindia.com
TendersComm.
250
1,031
Central PV allocation
Commissioned (Comm.)
Projects under development (PUD)
Tenders in progress (Tenders)
State PV allocation Other PVCSP
15
117
13
10
1,330
280
3,760
300
7,953 474
2,064 1,066
219
Comm. PUD
222
862
Comm.
13
13
50
150Tenders
130150
260
PUD
116
2,580
2,500 661
50
8
53
3
PUD TendersComm.
55
150
19
Comm.
7
INDIA SOLARMAP 2015
ASSAM
Premium sponsor Launch partner
ANDHRA PRADESH
35
55 150
224
146
300 195
370
PUD500
Comm. Tenders
50
403
500
67
136
200
40
10
80
100
Total utility scale solar capacity as of September 2015 (MW)
2,500MW
1,000MW
1,600MW
750MW
600MW
2,700MW
700MW
150 MW
200 MW
31.2% Self EPC
6.7% STERLING & WILSON
BELECTRIC 0.7%IBC SOLAR 0.5%
PHOTON
0.6%
OTHERS 5.7%
5.9% L&T
5.5% M
OSER BAER
TATA
PO
WER
SO
LAR
4.5
%
LAN
CO 3
.6%
MAHINDRA 3.4%WAAREE 3.3%
JUW
I 3.6
%
RAYS P
OWER 3.4%
INFRA
UJAAS 2.2%
RAYS EXPERTS 2.4%
REFEX 2.6%
MEIL 1.5%
VIKRAM SOLAR 1.8%ENRICH 1.9%HARSHA ABAKUS 2.0%
EMMVEE 1.5%
BHEL 1.4%
CHEMTROLS 0.9%
JAKSON POWER 0.8%
BOSCH 0.7%
PREMIER 0.7%CIRUS SOLAR 1.5%
EPC contractors
30.3% ABB
22.4% SM
A
OTH
ERS 1.1%
REFU
SOL 0.4%
SHAR
P 0.5%TB
EA 0.5%
BONFI
GLIO
LI 15
.2%
SCHNEIDER 8.1%
AEG 4.2%
TMEIC 2.5%
HITACHI 7.1%
HELIOS 2.9%STATCON 1.0%
SIEMEN
S 0.9%SAN
TERNO 0.9%
DELTA 0.8%ELTEK 0.6%
SUN
GROW 0.5%
Inverter suppliers
15.6% FIRST SOLAR
7.6%
OTH
ERS
10.0% TRINA
9.3% CANADIAN6.4% REN
ESOLA
WAAREE 4.0%CHINT 3.5%
EMMVEE 3.4%
SHARP 2.7%
VIKRAM SOLAR 2.7%
HANWHA 2.6%
YINGLI 2.3%
NEXPOWER 2.1%
CNPV 1.3%
SOLAR FRONTIER 1.3%
DU PONT 1.3%
UJAAS 1.2%
SUNWELL 1.2%
REC 1.0%
SUNTECH 1.0%BHEL 0.8%LDK 0.8%
SCHU
TTEN 0.7%
QS SOLAR 0.7%W
EBEL 0.6%
EINN
OVA 0.6%SH
AN SOLAR
0.6%SCH
EUCO
0.5%H
AREO
N 0.5%
BYD
0.5%
JIN
KO
4.6
%
CSU
N 4
.5%
TATA
POW
ER S
OLAR
4.2
%
Module suppliers
Crystalline
Thin film
Both
Cumulative market shares(for projects commissioned until August 2015)
7.6%
WEL
SPU
N
5.4%
AZU
RE
OTHERS 44.4%
4.6% SUNEDIS
ON
3.8% ACME
3.4% MAHAGENCO
2.7% ESSEL INFRA
2.5% NTPC
2.3% TORRENT2.0% HPPPL1.9% MALPANI
1.7% ADITYA BIRLA
1.3% TATA POWER
1.1% RENEW
1.1% WANEEP
1.1% TODAY GROUP
1.1% ROHA
1.1% SOLAIREDIRECT
1.0% RELIANCE
1.0% PUN
J LLYOD
0.9% H
ERO
0.9% ADAN
I
0.9% IL&
FS
0.9% LAN
CO
0.9% KIR
AN EN
ERGY
0.8% M
AHIN
DR
A
0.8% SEM
BCO
RP
0.8% M
ADH
AV INFR
A
APEX
CLO
THIN
G 0
.7%
VIK
RAM
0.7
%SW
ELEC
T 0.
6%
Project developers
INVERTER SUPPLIERSHitachi Hi-Rel Power Electronics Pvt. Ltd.B-52, Corporate House, Judges Bungalow Road, Bodakdev, Ahmedabad - 380 054,Gujarat, IndiaContact Person: Mr. Sanjay Bhalekar E: [email protected] [email protected]: +91 8511134591P: +91 79 66046200F: +91 79 66046201www.hitachi-hirel.com
EPC CONTRACTORSVikram Solar Pvt. Ltd. "The Chambers" (8th Floor), 1865 Rajdanga Main Road,Kolkata - 700107Contact Person: Mr Saugata Datta(President - Business Development)E: [email protected] [email protected]: +91 33 24427299www.vikramsolar.com
Sponsored taxonomy
SEMIKRON Electronics P. Ltd.Plot No. - EL-148,TTC Industrial Area, MIDC Electronic Zone,Mahape, Navi Mumbai - 400710,Maharashtra, IndiaContact Person: Mr. Padmanabha Kamath E: [email protected]: +91 22 27628600www.semikron.com
PROJECT DEVELOPERSACME Cleantech Solutions Pvt. Ltd. Plot No. 152, Sector-44,Gurgaon, Haryana - 122002, IndiaContact Person:Mr. Manish Karna, Ms. Vijeta ChaudharyE: [email protected] [email protected]: +91 8588010331, +91 9873481330www.acme.in
Jakson Engineers Limited A-43, Phase – II (Extension), Hosiery Complex, Noida – 201305 (UP) IndiaContact Person: Mr Parshant KalraE: [email protected]: +91 9871122307P: +91 120 4526168 (direct line) +91 120 4302600www.jakson.com
SkyPower SkyPower New Delhi Office4th Floor, Rectangle No.1Behind Saket Sheraton HotelCommercial Complex D4, SaketNew Delhi - 110017, IndiaSkyPower GlobalFirst Canadian Place100 King Street West 30th FloorToronto Ontario Canada M5X 1C9Contact Person: Mr. Vikas VermaE: [email protected]
Commissioned
4,678MW
Our reports
INDIASOLARMAP2015
India Solar HandbookIndia Solar Handbook provides holistic assessment of the Indian solar market. Released every year at Intersolar Germany in July, it is a highly sought after publication in the industry.
India Solar MapThe India Solar Map is a simple, one-of-its-kind infographic that provides a quick snapshot of the Indian utility scale solar market. Referred to by more than 50,000 industry stakeholders, it contains vital market information and trends including state-wise installed project capacity, project tariffs and market shares of leading players. It is released every year in September at Renewable Energy India Expo.
India Solar Rooftop MapIndia Solar Rooftop Map is the country's most comprehensive publication on the rooftop solar segment, with a reach of over 25,000 domestic and international stakeholders. It contains vital market information and identifies key trends and themes in India's burgeoning solar rooftop segment. The India Solar Rooftop Map is released at Intersolar Mumbai in November every year.
Thought Leadership ReportsBRIDGE TO INDIA regularly partners with influential market stakeholders to publish thought leadership reports. We identify emerging market themes and provide our analyses based on rigorous evaluation of the economic, technical, regulatory and policy fundamentals of cleantech sector in India. Recently, we have worked with Tata Power Solar, Greenpeace and Prayas.
Our services
About BRIDGE TO INDIABRIDGE TO INDIA is the leading consulting and knowledge services provider in the Indian cleantech market. Our multi-functional experience expertise combined with comprehensive in-house research capability enables us to develop insightful and highly sought-after industry analyses. Our overarching goal is to provide customised cleantech solutions and enable innovative business models in India.
We work actively with all leading stakeholders including project developers and investors, energy customers, equipment suppliers, regulators, policy makers and development institutions. We have also helped a number of international top-tier cleantech companies in growing their business footprint in India by providing risk assessment and business partner selection services.
Business strategy Market environment White papers
Uniqueunderstanding
of the Indiancleantech market
Always up-to-date
Industry access
360 degree view
Financial advisory
Business restructuring
Due diligence
MarketIntelligence
Strategy Consulting
TransactionAdvisory
Head OfficeC-8/5, DLF Phase 1,Gurgaon - 122001 (HR)India
P +91 124 4204003E [email protected]
www.bridgetoindia.com
www.facebook.com/bridgetoindia
www.twitter.com/bridgetoindia
India Solar Future
Project under development
8,707MWTenders in progress
4,060MW
Premium sponsor Launch partner
India Solar Rooftop Map is the only comprehensive publication covering the country’s rooftop solar segment. This all-in-one-map acts as a ready reckoner and contains vital market information that helps the industry analyse key trends and themes in one of the most high potential solar markets in the world. Various stakeholders retain and refer this map in order to understand the market developments and make sound strategic decisions. The map's print copy is distributed to over 12,000 market participants, including all key public officials and policy makers. The map is also available for online download through the year.
For submitting project informationPlease share your project level data with us at [email protected]. We need data for rooftop projects where you have provided your products/services. The following five basic details are needed: customer name, system capacity, makes of modules and inverteers used, location and date of commissioning.
For sponsorship and advertisement opportunitiesPlease contact us at [email protected]
Current installed capacityby segment and geography
Market shares for moduleand inverter suppliersand EPC contractors
Trends in policies andbusiness models
and muchmore…
Segment-wisemarket projections
Key indicators ondemand for solar powerbased on parity markets
Make your presence felt in
INDIA SOLARROOFTOP MAP 2016
Due for release at Intersolar Mumbaiin November 2015
CompanyName
Azure
Acme
SunEdison
Essel Infra
Welspun
Torrent
Waneep
Renew
Solairedirect
Hero
Rank2014
7
5
3
-
2
4
-
-
-
-
Rank2015
1
2
3
4
5
6
7
8
9
10
Increase/ Decrease
Project developers
Notes1. BRIDGE TO INDIA has conducted an extensive data collection exercise and relied on multiple market sources to provide accurate, factual information as far as possible. However, we cannot guarantee completeness or accuracy of this information.
2. For almost all projects, the data available with BRIDGE TO INDIA has been cross-referenced with data provided by other market players.
3. Only grid connected projects above 1 MW have been considered.
4. For most of the analysis, we have relied on AC capacity numbers where available.
5. Market information for project developers: a. Market share for this category is based on available data for 4,459 MW of projects. b. Credit for the 50 MW Welspun-Mahagenco JV project has been given 50:50 to Mahagenco and Welspun respectively.
6. Market information for third-party EPC contractors: a. Market share for this category is based on available data for only 4,046 MW of projects. b. In some cases, procurement responsibilities for some or all of the equipment may be excluded from the scope.
c. In many projects, EPC contractor role is split between various parties. We have used multiple criteria for determining credits including final responsibility for commissioning and value of contracts.
7. Market information for module suppliers: a. Market share for this category is based on available data for only 4,139 MW of projects. b. The following companies were unreachable or have not confirmed the data: LDK, BHEL, CSun, BYD, Hareon, Webel, REC, Sunwell, Solar Frontier, Scheuco, Einnova, Shan Solar, Schutten, Suntech, Nexpower, Yingli.
8. Market information for inverter suppliers: a. Market share for this category is based on available data for only 3,890 MW of projects. b. The following companies were unreachable or have not confirmed the data: Bonfiglioli, Schneider, Siemens, Statcon, Santerno, Refusol, Sharp, Sungrow, Helios and Eltek.
Module suppliersCompany Name
First Solar
Trina
Canadian Solar
Renesola
Waaree
Emmvee
Tata Power Solar
Jinko
Vikram Solar
Chint
Rank2014
5
4
3
2
-
7
1
10
-
6
Increase/ Decrease
Inverter suppliersCompany Name
ABB
SMA
Hitachi
TMEIC
Schneider
Helios
Bonfiglioli
TBEA
Delta
Sungrow
Rank2014
1
5
4
-
3
9
2
-
-
7
Increase/ Decrease
EPC contractorsCompany Name
Mahindra Susten
S&W
Rays Power Infra
L&T
Juwi
Vikram Solar
Harsha Abakus
Waaree
BHEL
Emmvee
Rank2014
-
4
10
8
-
-
7
-
-
9
Increase/ Decrease
Top 10 market leaders
Notes:"2014 rank has been calculated based on projects commissioned between Jan to Dec 2014. 2015 rank has been calculated for projects commissioned between Jan to Aug 2015 only. For ranking analysis of EPC contractors, own EPC has not been included.""-" signifies that the company was not in top 10 in 2014.
Year-wise share of Indian and imported modules (%)
India China Other countries
2010 2011 2012 2013 2014 2015(until 31st August)
Shar
e (%
)
0%
10%
20%
30%
40%
50%
60%
70%
80%
90%
100%
35 26 19 13
59
28
26
60
14
22
49
29
39
42
40
34
60
5
Year-wise share of thin film vs. crystalline modules (%)
NoteBased on available data for 4,139 MW of modules used in commissioned projects in India.
Crystalline Thin film
2010 2011 2012 2013 2015(until 31st August)
2014
6
49
42
30
10
94 51 58 70 90
29
71
0%
10%
20%
30%
40%
50%
60%
70%
80%
90%
100%Sh
are
(%)
Pipeline for top 15 private project developers in India (MW)(as of September, 2015)
NotesPPAs have not been signed in Telangana, Madhya Pradesh and Punjab. The capacity allocated to developers in these states is subject to final PPA signing. NTPC, NHPC, SECI and other public sector companies have not been considered for this analysis.
Pipeline Commissioned
0
200
400
600
800
1,000
1,200
Cap
acity
(MW
)
Acm
e
Wel
spun
Adan
i
SunE
diso
n
Ren
ew
Azur
e
Myt
rah
Esse
l Inf
ra
NTP
C
Skyp
ower
Hin
dust
an P
ower
Proj
ects
Ltd
.
Toda
y G
roup
Suzl
on
Shap
oorj
i Pal
lonj
i
Mah
indr
a
Winning bid range for solar tenders
"Original tariffs in Andhra Pradesh have an escalation of 3% per year for 10 years. For the purpose of this analysis, levelised tariff has been calculated based on an EIRR of 16%..
** Unlike most states that have a PPA tenure of 25 years, the tenure in Uttar Pradesh is 12 years.
5.00
4.00
6.00
7.00
8.00
9.00
10.00
11.00
12.00
18.00
RPS
SGP
Guj
arat
P1,
320
MW
NSM
P1
B1,
150
MW
Guj
arat
P2,
565
MW
NSM
P1
B2,
350
MW
Kar
nata
ka P
1, 6
0 M
W
Mad
hya
Prad
esh
P1, 2
00 M
W
Kar
nata
ka P
1, 1
30 M
W
Punj
ab P
1, 2
00 M
W
Utt
ar P
rade
sh P
1, 2
00 M
W**
Andh
ra P
rade
sh P
1
Mad
hya
Prad
esh
P2, 1
00 M
W
Chha
ttis
garh
P1,
100
MW
Kar
nata
ka P
2, 5
0 M
W
NSM
P2
B1
(DCR
), 37
5 M
W
NSM
P2
B1
(Ope
n), 3
75 M
W
M/k
Wh
2012
Highest winning bid
Lowest winning bid
Fixed tariff
17.91
12.5412.24
10.94
9.28 9.44
8.5
12.45
7.9
8.05
5.51
8.74
7.678.01
9.33
6.496.97
7.81 7.74 7.76
6.42
6.586.85
7.12
6.71
6.89
7.987.72
6.88
Punj
ab P
2, 2
50 M
W
Mad
hya
Prad
esh
P3, 3
00 M
W
Tela
ngan
a P2
, 200
0 M
W
Punj
ab P
3, 5
00 M
W
Utt
ar P
rade
sh P
3, 2
15 M
W**
8.6
7.02
5.64
5.05
5.89 5.98
5.095.17
6.856.45
6.005.54
Andh
ra P
rade
sh P
2, 5
00 M
W*
Kar
nata
ka P
3, 5
00 M
W
Tela
ngan
a P1
, 500
MW
Utt
arak
hand
P1,
30
MW
Utt
ar P
rade
sh P
2, 3
00 M
W**
9.34
8.9
6.666.446.47
7.947.49
13.00
2011 201520142013