India Post: Themes and Biases in Commemorative Stamps Issued From 1994 To 2016
40
India Post: Themes and Biases in Commemorative Stamps Issued From 1994 To 2016
-
Upload
raamesh-gowri-raghavan -
Category
News & Politics
-
view
25 -
download
1
Transcript of India Post: Themes and Biases in Commemorative Stamps Issued From 1994 To 2016

India Post: Themes and Biases
in Commemorative Stamps Issued From 1994 To 2016

INTRODUCTION

Introduction
• Next only to currency, stamps have born the unique imprimatur of the state and have rightly been described as ‘little ambassadors’.
• But in a democratic dispensation such as India, do they also serve as vehicles of subtle or overt propaganda for the people in power?

Introduction• This paper examines the distribution of themes reflected in 820
commemorative stamps issued by the Department of Posts, Government of India over a twenty-two year period from 1994 to 2016.
• The analysis has been carried out by looking at– both the complete distribution over 22 years– and also by segregating them into periods corresponding to governing
coalitions– The period from 14/12/1994 to 4/5/1996 has been omitted for periodic
analysis due to insufficient data (38 stamps were issued in this period), but has been included in the overall analysis

Political Background
Governing Coalition Period Prime Minister #Stamps issued
United Front 1996 - 1998 H. D. Deve Gowda, I. K. Gujral
106
National DemocraticAlliance (NDA-1)
1998 - 2004 A. B. Vajpayee 268
United Progressive Alliance (UPA)
2004 - 2014 Manmohan Singh 339
National Democratic Alliance (NDA-2)
2014 - present Narendra Modi 71

MATERIALS AND METHODS

Introduction• 820 commemorative stamps, accompanying
brochures and lists of stamps were examined, tabulated and categorised.
• Additional references and verifications were made from:– Website 1– Website 2– Website 3
Categorisation of Icons - 1• Nature of icons –
– Military (forces, regiments, ships, missiles, war commemorations)– Civil State (courts, legislatures, agencies & their Jubilees, both state & central)– Political persons & events– Social, Cultural and Traditional Icons (festivals, objects, traditional crafts,
dances etc)– Religious Icons (theologians, priests & gurus, Institutions & their anniversaries)– Literary Icons (writers, poets & playwrights)– Financial Icons (banks & NBFCs, MFs & Insurance cos, regulators, and
financiers)– Nature/Environment (national parks, activists, wildlife, fossils)
Categorisation of Icons - 2• Nature of icons –
– Music/Films– Press (newspapers & media houses, journalists)– Art (painters, sculptors; paintings & sculptures)– Sport (sportspersons; sporting events)– Industrial (industrialists, companies, infrastructure)– Historical/Mythical persons and events– Science/Technology/Medicine (persons, organisations, research institutes,
conferences)– Education (libraries, schools, colleges and universities; teachers, professors
and founders of ed. Institutions)– Law (lawyers)

Themes studied - 1• Distribution of Regional, National & International Icons• Distribution of Icons by category –
– State (Civil and military establishments, services, agencies)– Institutional (libraries, schools, colleges & universities;
hospitals and vaidyasalas; trusts and foundations; associations and charities)
– Human (notable people from various walks of life)– Abstract (commemorative days and events)– Other (Wildlife, national parks, cultural practices etc)

Themes studied - 3
• Forces-wise distribution of military icons
• Faith-wise distribution of religious icons
• Statewide distribution and skew of regional icons

RESULTS
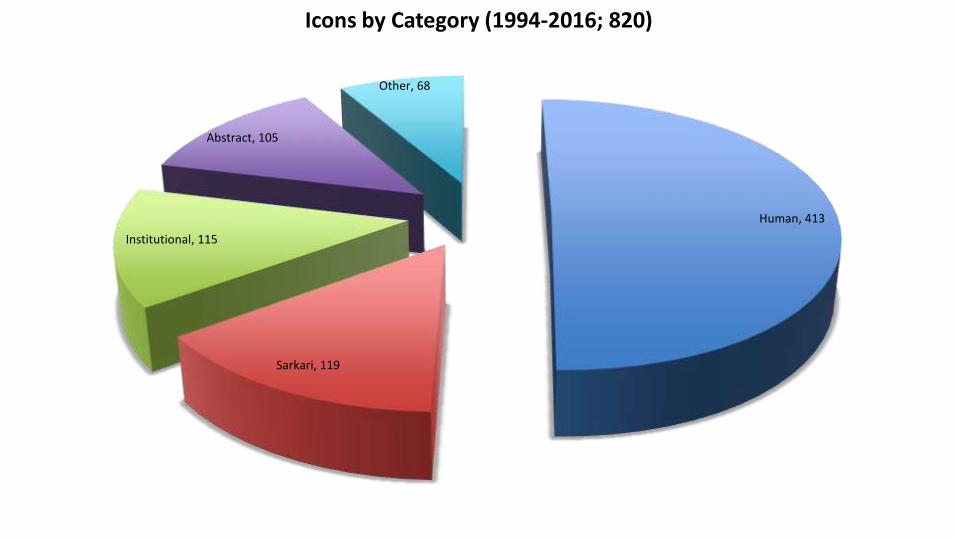
Human, 413
Sarkari, 119
Institutional, 115
Abstract, 105
Other, 68
Icons by Category (1994-2016; 820)
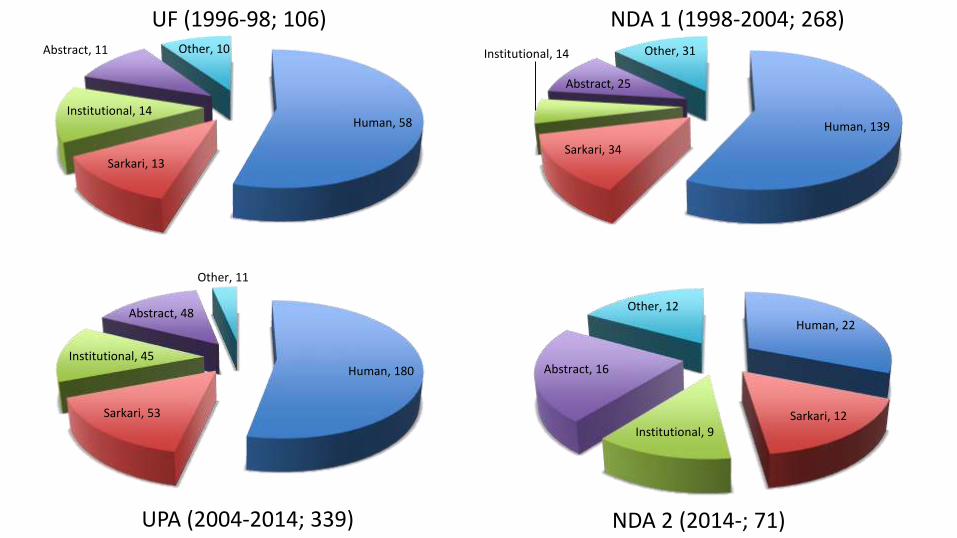
Human, 58
Sarkari, 13
Institutional, 14
Abstract, 11 Other, 10
Human, 139
Sarkari, 34
Institutional, 14
Abstract, 25
Other, 31
NDA 1 (1998-2004; 268)UF (1996-98; 106)
Human, 180
Sarkari, 53
Institutional, 45
Abstract, 48
Other, 11
UPA (2004-2014; 339)
Human, 22
Sarkari, 12Institutional, 9
Abstract, 16
Other, 12
NDA 2 (2014-; 71)

Distribution Across Walks of Life (1994-2016; % of Stamps Issued)
Military, 62
State (Civil), 73
Pol, 75
Soc/Cult/Trad, 72
Religion, 99
Lit, 52
Financial, 7
Nature/Envt, 67
Music/Films, 88
Press, 16
Art, 9Sport, 18
Industrial, 23
Hist/Myth, 82
Sci/Tech/Med, 41
Edn, 33
Law, 3
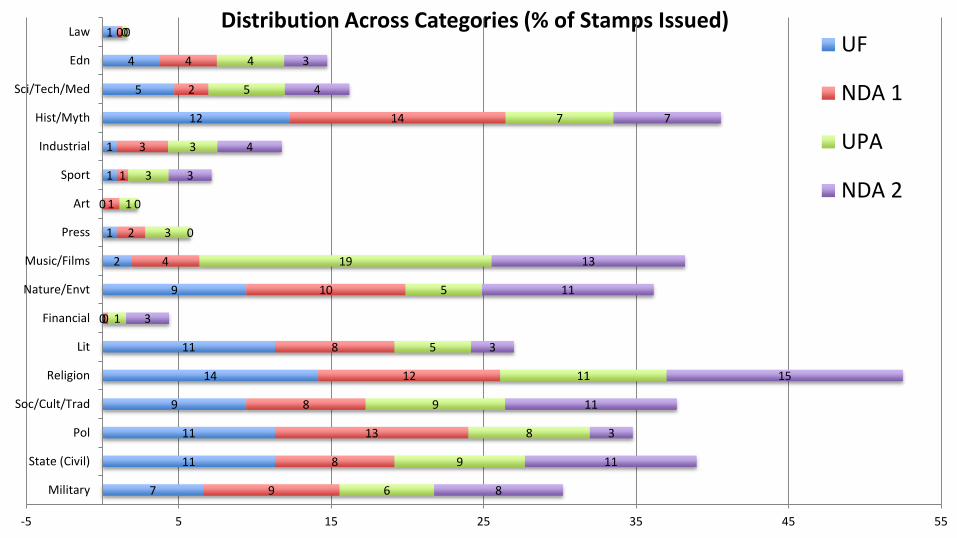
Distribution Across Categories (% of Stamps Issued)
7
11
11
9
14
11
0
9
2
1
0
1
1
12
5
4
1
9
8
13
8
12
8
0
10
4
2
1
1
3
14
2
4
0
6
9
8
9
11
5
1
5
19
3
1
3
3
7
5
4
0
8
11
3
11
15
3
3
11
13
0
0
3
4
7
4
3
0
-5 5 15 25 35 45 55
Military
State (Civil)
Pol
Soc/Cult/Trad
Religion
Lit
Financial
Nature/Envt
Music/Films
Press
Art
Sport
Industrial
Hist/Myth
Sci/Tech/Med
Edn
LawUF
NDA 1
UPA
NDA 2

Army, 37
AF, 3
Navy, 7
Triservices, 10
Paramil, 5
Military Icons (1994-2016; 62)

Army, 5AF, 0
Navy, 0
Triservices, 2
Paramil, 0
Army, 17
AF, 1
Navy, 3
Triservices, 3
Paramil, 0
NDA 1 (1998-2004; 24)UF (1996-98; 7)
Military Icons
Army, 9
AF, 2
Navy, 3
Triservices, 3
Paramil, 4
UPA (2004-2014; 21)
Army, 2
AF, 0Navy, 1
Triservices, 2
Paramil, 1
NDA 2 (2014-; 6)
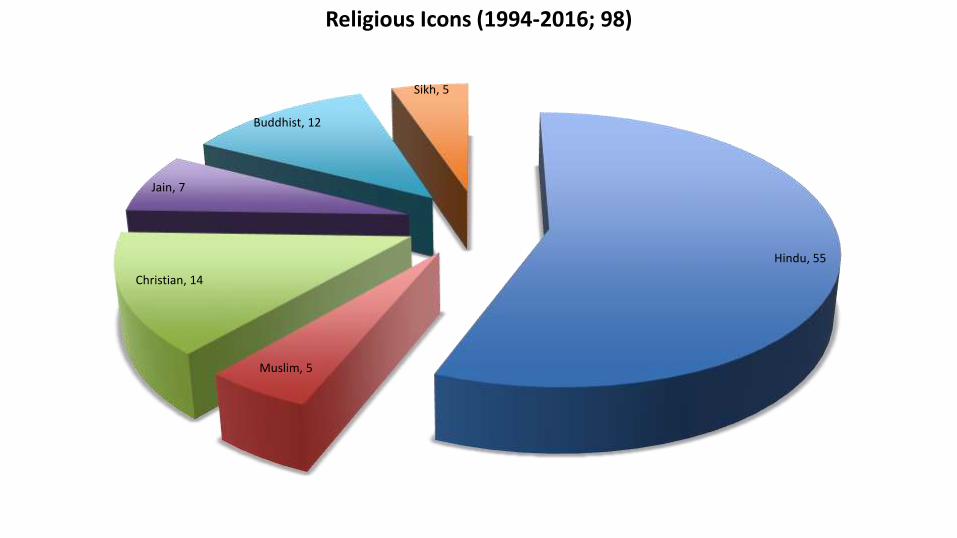
Hindu, 55
Muslim, 5
Christian, 14
Jain, 7
Buddhist, 12
Sikh, 5
Religious Icons (1994-2016; 98)
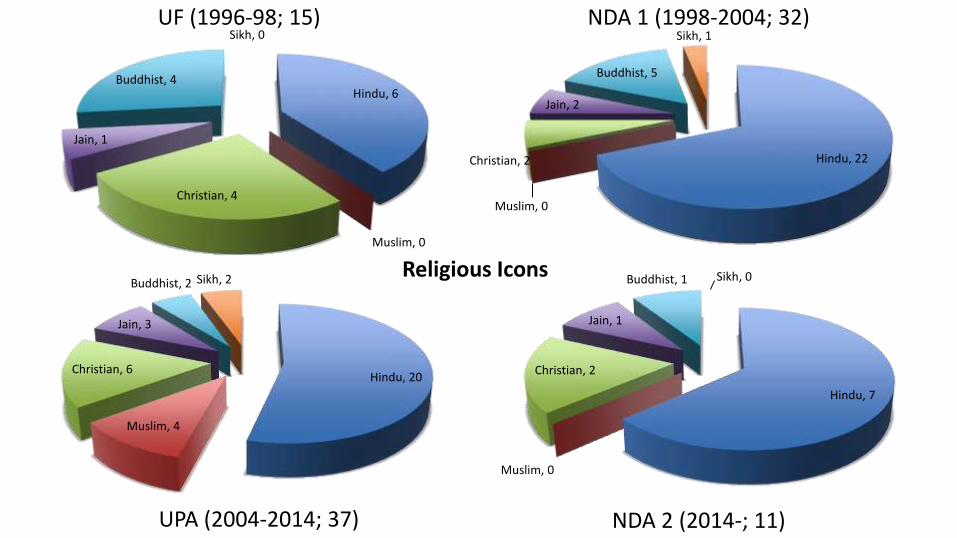
Hindu, 6
Muslim, 0
Christian, 4
Jain, 1
Buddhist, 4
Sikh, 0
Hindu, 22
Muslim, 0
Christian, 2
Jain, 2
Buddhist, 5
Sikh, 1
Hindu, 20
Muslim, 4
Christian, 6
Jain, 3
Buddhist, 2 Sikh, 2
NDA 1 (1998-2004; 32)UF (1996-98; 15)
Religious Icons
UPA (2004-2014; 37)
Hindu, 7
Muslim, 0
Christian, 2
Jain, 1
Buddhist, 1 Sikh, 0
NDA 2 (2014-; 11)
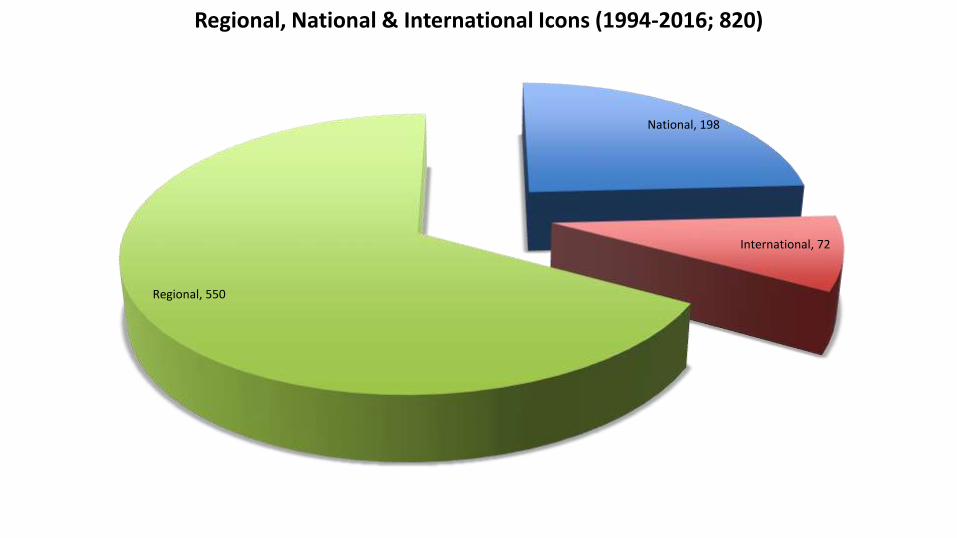
National, 198
International, 72
Regional, 550
Regional, National & International Icons (1994-2016; 820)

National, 79
International, 25
Regional, 235
National, 56International
, 19
Regional, 193
National, 23
International, 13
Regional, 70
NDA 1 (1998-2004; 268)UF (1996-98; 106)
UPA (2004-2014; 339)
National, 30
International, 7
Regional, 34
NDA 2 (2014-; 71)

Andhra Pradesh, 24 Arunachal Pradesh, 2
Assam, 10
Bihar, 27
Chandigarh, 1
Chhattisgarh, 2 Delhi, 12
Goa, 4Gujarat, 23
Haryana, 4
Himachal Pradesh, 10
Jharkhand, 5
Jammu & Kashmir, 7
Karnataka, 26
Kerala, 24
Maharashtra, 78
Manipur, 4
Meghalaya, 1
Mizoram, 1
Madhya Pradesh, 16
Nagaland, 3
Odisha, 9
Pondicherry, 1
Punjab, 42
Rajasthan, 26
Sikkim, 1
Sindhi, 3
Telangana, 4
Tamil Nadu, 70
Tripura, 4
Uttar Pradesh, 58
Uttarakhand, 9West Bengal, 39
Distribution Across States (1994-2016; % of Stamps Issued)

-1.75
1.06
-1.15
-3.08
-0.18
-2.03
0.14
2.49
3.78
-1.50
-0.37
0.53
1.96
-0.18
-1.51
0.78
0.15
0.39
1.78
0.06
-1.30
-5.66
0.24
-1.60
0.84
0.06
-2.66
-4.60
-0.37
-2.58
-1.48
-0.18
-2.03
1.65
-0.37
-4.79
2.84
0.70
0.61
-6.30
0.88
-0.96
0.84
-0.37
-2.66
-10.00 -5.00 0.00 5.00 10.00 15.00 20.00
Andhra Pradesh
Arunachal Pradesh
Assam
Bihar
Chandigarh
Chhattisgarh
Delhi
Goa
Gujarat
UF
NDA1
UPA
NDA2
DMKControl
State wise Skew of Icons

-1.84
0.69
-2.58
0.32
3.41
2.03
2.59
-0.37
-0.37
-0.29
1.85
-0.51
0.45
-2.05
1.50
5.15
1.19
0.15
-1.42
0.11
-2.15
0.17
-1.75
0.57
5.20
0.91
-0.37
-1.84
2.20
-2.58
-1.10
12.49
-3.68
2.92
2.57
-0.37
-0.78
-0.74
-1.51
-0.04
-0.90
0.57
6.05
-0.37
-0.37
-10.00 -5.00 0.00 5.00 10.00 15.00 20.00
Haryana
Himachal Pradesh
Jharkhand
Jammu & Kashmir
Karnataka
Kerala
Maharashtra
Manipur
Meghalaya

-0.18
-1.05
1.24
-2.44
-0.18
4.75
-1.75
-0.18
0.00
0.33
-2.75
0.33
-1.28
-0.18
5.38
-3.05
-0.18
0.00
-0.18
-3.21
0.24
-3.44
0.24
6.54
3.48
0.24
1.28
-0.18
-2.40
-0.18
-0.93
-0.18
-2.39
-1.66
-0.18
0.00
-0.18
-2.15
-0.18
-2.80
-0.18
-2.39
0.72
-0.18
2.13
-10.00 -5.00 0.00 5.00 10.00 15.00 20.00
Mizoram
Madhya Pradesh
Nagaland
Odisha
Pondicherry
Punjab
Rajasthan
Sikkim
Sindhi

-3.13
1.39
-0.37
0.98
0.51
-2.02
-0.18
-0.18
-0.18
-0.18
-2.09
1.11
1.19
-7.48
1.15
0.56
-0.18
-0.18
-0.18
-0.18
-2.71
9.41
0.06
-4.52
0.36
-0.08
-0.18
-0.18
-0.18
-0.18
-0.19
13.41
-0.37
2.91
2.02
-4.79
-0.18
-0.18
-0.18
-0.18
-3.13
20.48
0.70
-8.35
2.27
-3.48
-0.18
-0.18
-0.18
-0.18
-10.00 -5.00 0.00 5.00 10.00 15.00 20.00
Telangana
Tamil Nadu
Tripura
Uttar Pradesh
Uttarakhand
West Bengal
A&N Islands
Dadra & Nagar Haveli
Daman & Diu
Lakshadweep

National, 35
International, 19Regional, 94
Human, 70
Sarkari, 22
Institutional, 19
Abstract, 30
Other, 7
Hindu, 8
Muslim, 2
Christian, 3
Jain, 1Buddhist, 1 Sikh, 0
Military, 10
State (Civil), 13
Pol, 14
Soc/Cult/Trad, 22
Religion, 15Lit, 11
Financial, 1
Nature/Envt, 12
Music/Films, 9
Press, 2
Art, 1
Sport, 6
Industrial, 4
Hist/Myth, 14
Sci/Tech/Med, 4
Edn, 10 Law, 1
Distribution Across Walks of LifeIcons by Category (148)
Religious Icons (15) Regional, National & International Icons (148)
DM
K C
on
tro
l (2
3/5
/04
–1
4/1
1/1
0)

CONCLUSIONS

Categories• Humans are the most popular category,
accounting for over 50% of the stamps in the period
• However, a marked decline is seen in their proportions over the years, as a greater proportion of stamps have been issued favouring government establishments and other institutions.

Walks of Life• The press, the arts, sports and the legal & financial
professions are highly under-represented; literary and film folks are however, well-represented
• Religious and historical/mythical icons occur in high frequency; they occupy the highest percentages in the NDA-1 and NDA-2 periods
• Fully 26% of stamps are dedicated to the state and political icons
• Read with the previous slide, the state seems increasingly happier to celebrate itself on its stamps than its people

Military Icons• The share of military icons has been low throughout,
maxing at 9% under NDA-1.• There appears to be a trend towards more equal
representation of the forces, from a previously marked bias towards the army.
• It is to be noted that the Indian Army represents 86% of all defence personnel (1.18 million), so increasing equality might actually appear unfair to the army
• However, the paramilitary forces, that number 1.08 million, have had scant representation throughout the period.

Religious Icons• The share of Hindu religious figures and institutions appearing on
stamps tends to rise under the NDA-1 (69%) and NDA-2 (64%) governments
• However it is to be noted that Hindus constitute 80% of the Indian population (as per 2001 census)
• Muslims, who form the largest religious minority (14%) remain underrepresented under all regimes; with 3 regimes completwely ignoring them
• The Jains (0.37% as per 2001 census) punch well above their weight with upto 7% representation. Buddhism (0.7%) too is overrepresented in the stamps, peaking at 27% under the UF

Regionalism & Internationalism
• Regional icons occupy the lion’s share of the stamps, though there has been a marked decline under NDA-2, as more stamps are issued featuring pan-Indian icons.
• Internationalism has been poorly represented in Indian stamps, with the share of foreign icons rarely exceeding 12%.

Regional biases• With so large a representation of regional icons, a
detailed break-down was warranted. A state by state categorisation yielded a few surprises.
• Maharashtra (78), Tamil Nadu (70), Uttar Pradesh (58) and Punjab (42) take up a large proportion of the stamps.
• Did this indicate a regional bias, or were the states getting their fare share of representation on India’s ‘little ambassadors’?

Comparison with no. of Lok Sabha MPs
• A reasonable metric was required to compare the stamps on regional themes
• The number of Lok Sabha MPs from each state was found suitable as– They are representative (somewhat) of a state’s population
and political ‘heft’– They have not changed for the duration of the study– At 543, they are comparable to the 550 stamps– MPs can (and do) exert pressure to issue particular stamps

Skews
State % MPs %Stamps Skew
Maharashtra 8.84 14.18 +5.34
Tamil Nadu 7.18 12.73 +5.54
Punjab 2.39 7.64 +5.25
Uttar Pradesh 14.73 10.55 -4.19
Madhya Pradesh 5.34 2.91 -2.43
Telangana 3.13 0.73 -2.40

Skews by government
• For most states, the skews fluctuate.
• However, Maharashtra and Punjab have seen a positive skew throughout the period.
• We might attribute Maharashtra’s outsized presence to the fact that many icons are related to Mumbai. A separate analysis is warranted in the future.
• Tamil Nadu marks a pronounced skew, exploding under the UPA government.

The DMK effect -1• The Ministry of Communications was under the control of
the Tamil regional party Dravida Munnetra Kazhagam (Dayanidhi Maran and then A Raja) from 2004 to 2010 as part of the UPA. The Department of Posts is part of this ministry.
• In this six-year period within the 10-year rule of the UPA, this bias is even more pronounced.
• A number of stamps depicting obscure historic figures and small-time politicians seem the hallmark of this period.

The DMK effect -2• The DMK’s other ideological leanings (atheism, rationalism) or its
deep connection with films are however not reflected.• Other regional parties have also controlled the Ministry of
Communications, viz.
• A study of biases under their control is also planned for the future.
Party Period Government Minister
JD(U) 13/10/99 to 1/9/01
NDA-1 Ram Vilas Paswan
SP 1/6/96 to 19/3/98
UF Beni Prasad Verma