(India). PhD, University of the West of England. Available ...eprints.uwe.ac.uk/25016/1/1-PhD...
309
Joshi, R. (2014) Mobility practices of the urban poor in Ahmedabad (India). PhD, University of the West of England. Available from: http://eprints.uwe.ac.uk/25016 We recommend you cite the published version. The publisher’s URL is: http://eprints.uwe.ac.uk/25016/ Refereed: No (no note) Disclaimer UWE has obtained warranties from all depositors as to their title in the material deposited and as to their right to deposit such material. UWE makes no representation or warranties of commercial utility, title, or fit- ness for a particular purpose or any other warranty, express or implied in respect of any material deposited. UWE makes no representation that the use of the materials will not infringe any patent, copyright, trademark or other property or proprietary rights. UWE accepts no liability for any infringement of intellectual property rights in any material deposited but will remove such material from public view pend- ing investigation in the event of an allegation of any such infringement. PLEASE SCROLL DOWN FOR TEXT.
Transcript of (India). PhD, University of the West of England. Available ...eprints.uwe.ac.uk/25016/1/1-PhD...

Joshi, R. (2014) Mobility practices of the urban poor in Ahmedabad(India). PhD, University of the West of England. Available from:http://eprints.uwe.ac.uk/25016
We recommend you cite the published version.The publisher’s URL is:http://eprints.uwe.ac.uk/25016/
Refereed: No
(no note)
Disclaimer
UWE has obtained warranties from all depositors as to their title in the materialdeposited and as to their right to deposit such material.
UWE makes no representation or warranties of commercial utility, title, or fit-ness for a particular purpose or any other warranty, express or implied in respectof any material deposited.
UWE makes no representation that the use of the materials will not infringeany patent, copyright, trademark or other property or proprietary rights.
UWE accepts no liability for any infringement of intellectual property rightsin any material deposited but will remove such material from public view pend-ing investigation in the event of an allegation of any such infringement.
PLEASE SCROLL DOWN FOR TEXT.

Mobility practices of the urban poor
in Ahmedabad (India)
Rutul B. Joshi
A thesis submitted in partial fulfillment of the requirements of
The University of the West of England, Bristol
for the degree of Doctor of Philosophy
Faculty of Environment and Technology,
University of the West of England, Bristol
October 2014
Word count – 79,031

2
Abstract
Urban poverty, a prominent issue in the rapidly urbanising developing world, consists
of many interrelated aspects in poor people’s lives. One such aspect is accessibility,
which determines the crucial links between housing, labour markets and other
amenities. Relatively little is known about how poor people negotiate the complexities
of their daily lives in relation to their mobility choices with respect to existing transport
systems, especially in Indian cities. This thesis argues that the poor should be viewed
as ‘disadvantaged citizen’ rather than ‘disadvantaged commuters’ or ‘vulnerable road
users’ as often described in the transportation studies in India and elsewhere. It is
important to ask why the poor make certain mobility-related choices and how these
choices shape their own efforts to deal with poverty. This thesis develops a conceptual
model linking poverty and mobility debates by employing social practice theory for
understanding and structuring mobility related practices of the poor. Further, the
conceptual model is pitched in the larger international debates of informality, poverty
alleviation and sustainable mobility.
To situate the mobility practices of the poor, Ahmedabad is selected as a case-study
which represents the dynamics of poverty, informality and intraurban relocation and
displacement coupled with some innovative urban projects which, at least in terms of
rhetoric, are engaged in developing more sustainable mobility and with poverty
alleviation. This study adopts an inductive research strategy based around ‘building
theory’ where the focus is on understanding the poor’s own efforts to deal with their
mobility and poverty. A mixed methods approach is followed involving qualitative
narratives of individuals and a quantitative household survey, supported by secondary
documentary analysis. This thesis extensively uses the qualitative narratives of the
poor to build empirical knowledge about the differential sub-groups within the poor and
to understand the dynamics of poverty in their mobility related decision-making.

3
A range of social practices was identified by the research, which have developed
around the low affordability of transport. The poor people are largely dependent on the
human-powered transport modes like cycling and walking. The poor are found to seek
shelter-livelihood-mobility balance variably across their locations, and differing based
on their livelihoods and other social categories like gender. The prevailing informality in
housing or job markets is often helpful for poor households to not only minimise
transport but to also move out of poverty over a period of time, at least, in some cases.
However, the current mobility practices of the poor based on walking, cycling and use
of shared or public transport, in spite of their low energy consumption, are being
marginalised in the official urban and transport planning in Ahmedabad. The poor face
an intrinsic paradox in their mobility to access the various facets of the city; on one
side, they resist motorised trips due to low-affordability and on the other side, even if
some of them want to travel longer distances to access better opportunities, they are
constrained in the absence of an affordable and reliable transport service in the city.
Finally, this thesis makes a case for more inclusive and integrated policies around
shelter-security, livelihood protections and sustainable transport linked infrastructure
provision for the poor people in the cities of India. It is crucial that improved articulation
and understanding of the social dimensions of transport should attract greater research
and policy attention in India in future years.
COPYRIGHT This copy has been supplied on the understanding that it is copyright material and that no quotation from this thesis may be published without proper acknowledgement.

4
Acknowledgements
I would like to take this opportunity to thank all the organizations and people that have
supported me as part of these learning sojourns. I sincerely thank UWE for funding my
studies and Centre for Transport and Society for developing this unique academic
niche – it indeed helped me anchor. I would like to sincerely thank my supervisory team
- especially Graham Parkhurst for keeping me grounded yet always asking critical
questions and encouraging me to go forward. I am trully indebted. To Charles
Musselwhite and Yusak Susilo for giving valuable feedbacks with great interest in my
work. I am also thankful to Juliet Jain for her critical comments and for her help
throughout. To Erel Avineri for all the critical feedbacks in the initial stages.
I am highly indebted to CEPT University for supporting me over the years. I am thankful
to Centre for Urban Equity to help me with one part of the data collection and United
Nations Environment Program Riso Center for funding it. I particularly acknowledge
Darshini Mahadevia for keeping me focused and for sharing the resources. Biswaroop
Das has helped me immensely to structure my thoughts and encouraged me to keep
going.
I am thankful to number of friends from Bristol; My collegues at 4Q57 and beyond –
Carmel, Ben, Mike, Heather, Billy, Geoff, Caroline, Ben Spencer, Ian, Anja, Miriam;
Monica Albertnazzi Parkhurst for being one of the most positive person around, it
helped; Jessa and Chris Kerr, thank you for your generosity and for opening your
hearts and home for me. My CEPT friends Gauri, Talat, Bhargav, Sankalpa, Mahroof,
Yogi and Mansi for being there and for helping me when required.
Most of all, I want to thank my family especially my parents, Mira and Advaya for
putting up with all my highs and lows in the past four years and who still continue being
the strength behind me.

5
Contents
Abstract .................................................................................................................. 2 Acknowledgements ................................................................................................ 4 Contents ................................................................................................................. 5 List of Acronyms ..................................................................................................... 9
1. The research problem and conceptual premises .................................. 10
1.1 Urban contestations and the Indian city .................................................. 11
1.2 Mobility, planning and Indian cities ......................................................... 14
1.3 Poverty, Informality and Mobility .............................................................. 21
2. Towards a theoretical model of poverty-mobility inter-linkages .......... 29
2.1 The (urban) poverty debate ....................................................................... 29
2.1.1 Social and political organization of the poor .............................................. 33 2.1.2 Postulates related to understanding poverty ............................................. 37
2.2 Poverty and transport linkages in international literature ...................... 38
2.2.1 Disadvantaged commuters in the US ........................................................ 39 2.2.2 ‘Social exclusion and transport’ debate in Europe ..................................... 42 2.2.3 Poverty and transport through multi-lateral lenses .................................... 47 2.2.4 Poverty and transport in African cities ....................................................... 51
2.3 Poverty and transport in Indian cities ...................................................... 55
2.3.1 Differentials within the Poor – the gender issues ...................................... 62 2.3.2 Transport supply and the governance issues ............................................ 63 2.3.3 Dynamics of poverty ................................................................................. 64
2.4 Theoretical model of mobility-poverty linkages ...................................... 66
2.5 Towards the research questions .............................................................. 73
2.5.1 Research Questions ................................................................................. 76
3. Research Strategy and Methodology ........................................................ 77
3.1 Research design and key strategic decisions ......................................... 77
3.1.1 Mixed-methods ......................................................................................... 81 3.1.2 Case-study approach ................................................................................ 83 3.1.3 Selection of Case study ............................................................................ 84
3.2 Detailed Methodology ............................................................................... 86
3.2.1 Desk Research and data sets ................................................................... 86 3.2.2 Quantitative survey and sampling ............................................................. 86 3.2.3 Qualitative Interviews ................................................................................ 93
3.3 Conclusion ................................................................................................. 95
4. The case of Ahmedabad: poverty and the urban planning context ..... 98
4.1 Introduction ............................................................................................... 98
4.2 Demography and employment................................................................ 100
4.2.1 Employment and informal work ............................................................... 101

6
4.2.2 Slum population ...................................................................................... 105
4.3 Evolution of informal housing and the state response ......................... 108
4.3.1 ‘Command and control’ planning and public housing .............................. 110 4.3.2 Bottom-up approach of Slum networking projects ................................... 113 4.3.4 Emergence of ‘development-rhetoric’ and displacements ....................... 116
4.4 The land use planning and transport characteristics ........................... 119
4.4.1 Public transport ....................................................................................... 124 4.4.2 The BRT and its promises ...................................................................... 125
4.5 Mobility of the poor in Ahmedabad in recent literature ........................ 130
4.6 Conclusion ............................................................................................... 134
5. Mobility practices and urban poor in Ahmedabad ................................. 137
5.1 Mobility pattern of the urban poor in Ahmedabad ................................ 138
5.1.1 Transport mode use amongst the poor ................................................... 142 5.1.2 Mode use, trip lengths and trip purpose - interrelations ........................... 145 5.1.3 Household Income and mobility .............................................................. 151
5.2 Mobility of the poor through the qualitative narratives ........................ 154
5.2.1 Mode choice dynamics ........................................................................... 155 5.2.2 Affordability and mobility ......................................................................... 164
5.3 Negotiated mobility amongst the sub-groups of the poor .................... 168
5.3.1 Location variations and mobility practices ............................................... 168 5.3.2 Livelihood variations and mobility practices ............................................ 181 5.3.3 Gender and mobility practices................................................................. 199
5.4 Conclusion – negotiated mobility practices .......................................... 204
6. Moving out of poverty and the role of sustainable mobility ............... 209
6.1 The role of transport provision and urban governance ........................ 209
6.1.1 Bus rapid transit and public transport in Ahmedabad .............................. 210 6.1.2 Infrastructure for non-motorised transport ............................................... 217 6.1.3 The transport system and the poor in Ahmedabad.................................. 221
6.2 Mobility practices and moving out of poverty ....................................... 223
6.2.1 Mobility related vulnerabilities ................................................................. 223 6.2.2 Shelter-livelihood-mobility balance to move out of poverty ...................... 226 6.2.3 Mobility paradox of moving out of poverty ............................................... 233
6.3 Discussion – achieving poverty alleviation and sustainable mobility together ............................................................................................................. 235
7. Conclusion – Mobility, poverty and the Indian city ................................ 241
7.1 Main arguments based on the primary data collected .......................... 241
7.2 Conceptual arguments linking mobility and poverty ............................ 245
7.3 Implications on the transport planning and policies ............................ 248
7.4. Policies for poverty alleviation and sustainable mobility .................... 251
7.5 Reflections on the research process ..................................................... 253
7.6 Future research directions ...................................................................... 254
References..................................................................................................... 256

7
Appendices.................................................................................................... 273
A1. Qualitative data – semi-structured interviewing guide ......................... 274
A2. Socio-demographic profile of the interviewees .................................... 276
A3. Detailed profile of the first interviewee .................................................. 278
A4. Specimen Transcripts of two interviews ............................................... 282
A5. Quantitative data – Household survey form .......................................... 291
A6. Statistical tests – detailed results .......................................................... 295
A7. Ethical review application and approval ............................................... 298
List of Figures and pictures
Figure 1-1 Global car fleet estimates 2050 (from Chamon, Mauro & Okawa, 2008) ........... 17 Figure 2-1 Pathways to move out of poverty by Narayan et al, 2007 .................................. 65 Figure 2-2 Constituents of mobility related (social) practices ............................................. 69 Figure 2-3 Conceptual model of mobility-poverty nexus ...................................................... 72 Figure 3-1 Slum settlements in Ahmedabad as per the AMC ............................................... 89 Figure 3-2 Core city informal settlement and the peripheral re-settlement colony ........... 91 Figure 3-3 Household surveys in progress with the help of the field workers ................... 91 Figure 3-4 Locations of the settlement studies in Ahmedabad city .................................... 96 Figure 4-1 The 1965 development plan of Ahmedabad ....................................................... 111 Figure 4-2 Impacts of slum networking project in Ahmedabad ......................................... 115 Figure 4-3 Forced evictions from the newly built riverfront in Ahmedabad ..................... 117 Figure 4-4 Proposed affordable housing zone in the draft development plan 2013 ........ 121 Figure 4-5 AMTS performance over the years as presented by Parikh (2011) ................. 125 Figure 4-7 Ahmedabad BRT corridor .................................................................................... 128 Figure 4-6 Ahmedabad BRT network and phases ............................................................... 128 Figure 5-1 Outline of the current chapter ............................................................................. 138 Figure 5-2 Mean Monthly Household income and household size .................................... 139 Figure 5-3 Mode share amongst the poor and in the overall city (percentage of trips to
total trips) ......................................................................................................................... 143 Figure 5-4 Trip distribution by distance amongst the poor ................................................ 148 Figure 5-5 Cyclists navigating through traffic in Ahmedabad ........................................... 156 Figure 5-6 Shared cycle ride amidst motorised traffic ........................................................ 157 Figure 5-7 Auto rickshaws and municipal bus stand in Ahmedabad ................................ 166 Figure 5-8 Cycle renting and repair shop in Baherampura area of Ahmedabad .............. 185 Figure 5-9 Pedal rickshaw and handcarts in Ahmedabad .................................................. 192 Figure 5-10 Mapping social practices around mobility of the poor ................................... 206 Figure 6-1 Forced evictions for the road widening on the BRT corridor - Wadaj ............ 217 Figure 6-2 Roads without good quality footpaths in western Ahmedabad ...................... 218 Figure 6-3 Non-use of cycle tracks on the BRT corridor in the West Ahmedabad .......... 220 Figure 6-4 Conceptual diagram of access, mobility and location in Ahmedabad............ 232 Figure 6-4 Mobility pathways to move out of poverty for non-motorised poor ................ 238 Figure 6-5 Mobility pathways to move out of poverty for motorised poor ....................... 239
List of Tables
Table 2-1 Mode use in Mumbai (Baker et al., 2005) by income-groups ............................... 55 Table 2-2 Mode use and travel distance in Pune (Astrop et al., 1996) by income-groups 56 Table 2-3 Vehicles per thousand population in Indian cities ............................................... 58 Table 3-1 Criteria for case study selection ............................................................................. 85 Table 3-2 Selected settlements for household surveys ........................................................ 92 Table 3-3 Interviewee characteristics – Gender and Age groups ........................................ 95 Table 4-1 Decadal population growth rates in Ahmedabad city (Census 2011) ............... 100 Table 4-2 Employment categories in Ahmedabad over time (based on NSSO data) ....... 104 Table 4-3 Slum population in Ahmedabad over the years by different agencies............. 105

8
Table 4-4 Total population and Slum population in Ahmedabad as per the AMC ........... 107 Table 4-5 Registered vehicle population in Ahmedabad District ....................................... 121 Table 4-6 City level modal share, Ahmedabad ..................................................................... 122 Table 5-1 Sample Description by Age, Gender and Education Level ................................ 140 Table 5-2 Sample Description by Age, Gender and Livelihood categories ...................... 141 Table 5-3 Mode use by urban poor and other income groups ........................................... 142 Table 5-4 Mode share by gender amongst the poor (percentage of trips to total trips) .. 144 Table 5-5 Waiting time and time taken for public transport trips....................................... 144 Table 5-6 Mode-wise Mean Trip Lengths (km) ..................................................................... 145 Table 5-7 Mode and Distance – Equality of means tests .................................................... 146 Table 5-8 Mode and Distance – One-way ANOVA ............................................................... 146 Table 5-9 Mode and Distance across gender (independent T-test results) ...................... 147 Table 5-10 Mean Trip Lengths for motorised and non-motorised modes ......................... 147 Table 5-11 Trip Purpose by Modal Share (percentage trips) .............................................. 149 Table 5-12 Trip Purpose by Modal Share disaggregated by gender (percentage trips) .. 150 Table 5-13 Distribution of Per Trip Expenses, by Gender (percentage trips) ................... 151 Table 5-14 Mode wise mean household income (monthly in INR) ..................................... 152 Table 5-15 Correlations results – trip length, trip cost and hh income ............................. 153 Table 5-16 Mode use by different residential locations (percentage trips) ....................... 170 Table 5-17 Mean trip lengths (km) by modes, gender and geographic locations ............ 171 Table 5-18 Distribution of Trips by Distances, Gender and Geographic Location .......... 172 Table 5-19 Mean trip lengths by trip purpose across residential locations ...................... 173 Table 5-20 Distribution of per trip expenditure by gender and locations ......................... 174 Table 5-21: Mean per capita monthly income, mode use and residential location .......... 174 Table 5-22 Mean household incomes for NMT-MT and livelihood ..................................... 182 Table 5-23 Mean per capita income for NMT-MT and education ........................................ 183 Table 5-24 Distances covered and per capita income for the transport providers .......... 192 Table 5-25 Mode use distribution in the regular employment trips (percentage trips) ... 197 Table 6-1 Mode share in settlements located along BRT corridors (percentage trips) ... 211 Table 6-2 Income and gender profile of BRT users ............................................................. 212 Table 7-1 Mobility related social practices ........................................................................... 243
Note: All images, diagrams and charts used in this document are prepared or taken by the author unless otherwise mentioned. For material from other sources, appropriate permissions have been procured.

9
List of Acronyms
AMC Ahmedabad Municipal Corporation
AMTS Ahmedabad Municipal Transport Services
AUDA Ahmedabad Urban Development Authority
BPL Below Poverty Line
BRT Bus Rapid Transit
CEPT Centre for Environmental Planning and Technology
CNG Compressed Natural Gas
DFID Department for International Development, UK
DPR Detailed Project Report
EWS Economically Weaker Section
FSI Floor Space Index
GoG Government of Gujarat
GoI Government of India
INR Indian National Rupee
JnNURM Jawaharlal Nehru National Urban Renewal Mission
LIG Low-Income Group
MoUD Ministry of Urban Development
NGO Non-Governmental Organization
NUTP National Urban Transport Policy
PIL Public Interest Litigation
SEWA Self-Employed Women’s Association, Ahmedabad
SNP Slum Networking Program/Project
TOD Transit Oriented Development

10
1. The research problem and conceptual premises
This thesis is developed from the confluence of discourses related to three idioms: the
city, mobility and poverty. The present chapter lays down the conceptual settings of the
city or the urban in India where mobility and poverty interactions take place and the
following chapter further deepens the theoretical premises with the help of more
specific literature on poverty and mobility. It will be argued that if the urban settings
change then the nature of interactions between mobility and poverty change. The
urban settings are constantly under transformation, which means that the interactions
between mobility and poor people are also constantly evolving in the context of the city
and they will further change from one city to another. The ‘city’ here is incidental yet
crucial to establish the nature of interactions.
Hence, the thesis aims to explore through a specific city case study how poor people
living in a marginalized socio-economic context and informal employment-housing
scenario negotiate their mobility practices. Mobility is often understood as short-term
decisions of travel choices (Papacostas & Prevedouros, 2000) such as frequency of
travel for various purposes, mode, destination, routes, cost and time of trips. Mobility
should also be viewed as being related to long-term decisions such as shelter and job
types of locations, vehicle ownership and its usage for accessing the city. Mobility or
accessing the city is crucial for everyone in the city. It is more crucial for poor people as
it is linked with the possibilities of escaping poverty and deprivation. The current thesis
seeks to explain the interaction between mobility and poverty informing theoretical
debates and recommending ways of making transport systems more inclusive.
Before embarking on this thesis and narrowing it down to mobility of poor people in an
Indian city, it is important to understand the nature of urbanism and the urban context
where the poor are located. The very idea of this thesis was generated by observing

11
the struggles of poor people in a city where larger, structural forces were affecting the
mobility patterns and policies. Urbanisation has brought a number of changes and
challenges for the developing world. The population and productive activities are
increasingly concentrated in cities. At the same time, disparities in income continue to
rise around the world, especially in emerging economies where wealth is concentrated
in ever-smaller groups (Ghosh, 2010). The following discussion begins with the
dynamics of the Indian cities and then continues by elaborating the issues of mobility
and poverty.
1.1 Urban contestations and the Indian city
“Surely go ahead with development... ask for more and more of it. But in the name of
IBP [International Business Park]...in name of development you will throw these
residents of Bharatnagar some fifty miles away. Then you will put the same people
from Bharatnagar in front of the gates of IBP as guards. What kind of development is
this? (Why) can’t they stay with you here? [Is it because] they are dark, wear dirty
cloths, can’t speak English? What kind of development is this where only Mercedes will
go but a cycle can’t go...”
- A dialogue from a Hindi film Shanghai (Banerjee, 2012)
The above quote encapsulates the contestations that define the kind of urban
development challenges Indian cities are facing today: what is development, who
defines it and promotes it, who are the beneficiaries and who are the victims of this
development? The name of the film Shanghai (Banerjee, 2012) is inspired from the
Prime Minister of India’s 2006 speech where he asserted that Mumbai should aspire to
develop on the lines of the Chinese city of Shanghai. The newly formed national
government in 2014 has promised to build 100 new ‘smart’ cities. Will these new cities
resemble the ‘international business park’ being talked about in the above quote?
Shanghai is just a metaphor here for a peculiar kind of urban vision. Time and again,
such ‘urban visions’ are expressed to plan cities, which are ‘smart’ or high-tech, or

12
marking them on the world map, which means in other words - attracting global capital.
These urban visions focus on building high-tech infrastructure and urban skyline that
resembles some global cities. The term ‘development’ which was used mainly by the
academicians and policy-makers so far has become part of the electoral politics,
everyday TV debates and popular imagination, riding the waves of a peculiar kind of
urban vision.
While 52.8 per cent of the world population lived in cities in 2010, only 31.16 per cent
of population in India lived in urban areas (Census of India, 2011). India’s cities are
placed between its vast population spread across the countryside and the urban-
centric global economy. The largest concentrations of poor people live in Indian and
South Asian cities. Every third poor person of the world lives in India and every fourth
urban poor person lives in Indian cities (Mathur, 2010). Poor people try to make space
for themselves in cities by slumming, labouring, vending, transporting goods and
sometimes scavenging. In the process of making space for themselves, the poor are
often in conflicts with the official developmental plans, policies and government
regulations (Benjamin, 2008; Ghertner, 2008; Bhan, 2013). The quote above hints at
this contest between competing urban visions and perceptions about an Indian city
where the poor do not appear only as people who are marginalised in the process but
are also re-instated only to become the low-end workers in the capitalist machinery.
But is this the correct way to look at the city and its poor? This contestation for space in
a city not only defines the urban political discourse but also the dilemmas in policy-
making and academic debates. How to balance the capital investments in real estate
and infrastructure sectors with the investments that facilitate the socio-economic
activities of people living on low-incomes? How to balance the global aspirations of
elites and the structural conditions of disparities and fractured governance of the cities
in India and elsewhere?

13
It is important to understand how Indian cities are viewed around the world as these
views impacts the way in which the cities are imagined by local elites. In the past few
years, Indian cities have captured much of the popular imagination of the international
audience. There are globally circulating images of the Indian and South Asian cities –
call centres, shopping malls, terror attacks, slum squatters and, of course, the scenes
from Slum Dog Millionaire1. How these cities are viewed popularly around the world is
radically different compared to a generation ago. Global business culture, consumerism
and violence have merged into and expanded the traditional, organically evolved urban
form, which is survived either by accommodation or segregation of competing interests.
Anjaria & McFarlane (2011) term the South Asian city as the ‘city of action’ that is no
longer associated with tropes of poverty, despair or traffic chaos. Poverty persists in
the ‘city of action’ but potential for growth and promises of transformation are part of
the poverty discourse. The journalistic stories of hope in despair, promises of
transformation get translated as the ‘development’ rhetoric or to put it crudely, as
Shanghai dreams. The million plus Indian cities are imagined and consume to be like
Shanghai – urban landscape of tall towers, glossy facades, flyovers, elevated roads
and beautiful waterfronts. Besides, there is a growing interest in this Indian ‘city of
action’ because it is one of the world’s largest markets for consumer goods, gadgets,
automobiles and even financial products(Anjaria & McFarlane, 2011). Being like
Shanghai and commercial market based interest complement each other to form the
new variety of the Indian city of the neo-liberal kind.
The projections of growth and promises of capital investments often override the
complex, contradictory and multi-layered qualities of the urban landscape. Thus, the
processes of urbanization in contemporary Indian cities need to be looked at through
multiple lenses. One of the lenses used in this thesis is the contestation related to
1 Slum Dog Millionaire is a 2008 British drama film directed by Danny Boyle. It is an adaptation of the novel Q &
A (2005) by Indian author and diplomat Vikas Swarup. Set and filmed in India, the film tells the story of Jamal Malik, a young man from the Juhu slums of Mumbai who appears on the Indian version of ‘Who Wants to Be a Millionaire?’ Slum Dog Millionaire was globally acclaimed and it was nominated for 10 Academy Awards in 2009, winning eight, the most for any film of 2008.

14
urban mobility and how the poor appear in that discourse. The mobility issues in India
further confirms the premises on which this thesis was initiated - the contestation over
spaces and resources, competing urban visions, neo-liberal promise of development
juxtaposed with the structural conditions of poverty and vulnerability. There are only a
few works in the urban studies or human geography (like Anand, 2006) which have
attempted to view an Indian city through the lenses of mobility. The following section
discusses the challenges of urban mobility, transportation related policy-making in
Indian cities to place the mobility-poverty linkages in these contexts.
1.2 Mobility, planning and Indian cities
Mobility is an excellent locus for examining modernity claims, because it has been
repeatedly identified as a major driver of modernization (Sheller & Urry, 2000) and
urbanization. The absence of mobility by implication becomes a key characteristic of
‘backwardness’ or not being modern enough. An essential part of the condition of
modernity (and post-modernity) is the fast, smooth flowing traffic that poses a
compression of both spatial and temporal worlds (Harvey, 1989). The imagination of
automobile-dependent cities dominated the modernist architectural and planning
projects of Le Corbusier, Frank Lloyd Wright, and many others who influenced the
generations of planners and architects in both the developed and developing countries.
This modern notion of mobility still dominates the discourse of transportation planning
in India and elsewhere.
The conventional planning of ‘road space’ only for the motorised traffic completely
marginalizes other existing uses of the street space. Chakrabarty (2007) points out how
the imagery of the modern Indian city was not only a product of nineteenth-century
European thought; the colonial as well as the post-colonial elites also shared it.
Chakrabarty (2002) highlights the distinctions between the road and the bazaar
(market place) where the road, as a modernist planning project, requires not only the

15
making of a corridor for ‘free-flowing traffic’, but also an erasure of existing uses of
urban street space. Edensor (2002) sees the Indian road sides bounded by
‘heterotopic space’ with sites of numerous activities as against the controlled flow and
pace of traffic on Western thoroughfares. Indian traffic is heterogeneous and diverse,
moving at different speeds, maneuvering for space, which requires tactile sense of
motoring. Sometimes, the street is best described as ‘bazaar’ (market), which is
inherently accommodative. It leaves the possibilities of negotiation and contest for
various purposes as well as for various kinds of motorised and non-motorised modes.
The ‘rational’ model of modernist planning assumes that road infrastructure is
exclusively for movement rather than activity and specifically for motorized vehicles.
The use of the street by squatters, vendors or slow traffic was not viewed as something
modern and assumed that it would be changed with prevailing modernization. The
pedestrians, cyclists, cart-pullers or street vendors are not even considered as ‘traffic’
and thus, there is no question of planning something for them or giving them space.
The language of ‘eliminating bottlenecks’ and ‘easing congestion’ for motorised traffic
is often used in the local transportation plans and media reports: cities are viewed and
built around such assumptions. Vendors have had to face repeated raids on their
businesses and they are often removed from the roadside for road-widening purposes
(Bhowmik, 2005; Brown, 2006). Denied employment guarantees or any form of social
security, these evictions also deny them their rights to livelihoods in the city (Brown &
Kristiansen, 2009). It was the fundamental inability of modern urban planning to
recognise wider uses of streets as a legitimate and intrinsic part of the urban way of life
which resulted in converting ‘street space’ into ‘road space’ built only for motorized
vehicles pushing all the alternative modes and activities into the margins.
Due to the colonial policies of prolonged de-industrialisation in India, the post-
independent India witnessed the surge of industrial-commercial activities, which were
further aggravated with the economic reforms and structural adjustment program of the

16
early 1990s. The claims of modernity are re-shaped and re-organised around neo-
liberalism, which has dominated in the developing world including India since the early
1990s (Chopra, 2003). Since then, the urban policies are influenced by neo-liberalism,
where the primary role of transportation planning is perceived to support economic
growth by facilitating automobile use and by the ‘myth’ of saving travel time (as per
Metz, 2008). In fact, transport does induce economic growth through investments in
infrastructure, the purchase of motorised vehicles and the generation of employment
by both of these. Such policies hold the ‘growth of mobility’ and the ‘freedom of modal
choice’ to be inseparable parts of economic growth and infrastructure building. Being
situated in this neo-liberal approach, conventional transport planning assumes that
motor-vehicle centric infrastructure building benefits everyone equally in the given
transport system. But this growth-centered paradigm of transport does not necessarily
address the concerns like equitable human development concerns and environmental
sustainability. Vasconcellos (2005) gives further explanation of how the social and
political approaches of viewing transportation as economy-generating activity overrides
other human development concerns (like poverty) in the Latin American cities.
In countries such as India, which are experiencing high economic growth, there is
latent demand for private motorised transport because of newly achieved prosperity. In
last two decades, about 100 million vehicles have been added to the roads in India with
the share of cars and other four-wheel vehicles nearing 20 million. Many of these
vehicles are operated in urban areas including the small and medium towns. However,
when compared with the population of the country, this level of motorization is still
much lower than the developed world (Gakenheimer, 1999; Chamon, Mauro & Okawa,
2008). The increase, along with rising income levels, of private vehicle use has already
resulted in deteriorating air quality and the degrading of the quality of urban living.
Ministry of Road Transport and Highways (MoRTH) reports of various years suggest
that 8.5 million cars were added between 2001 and 2011 as compared to 7 million cars
from1951 to 2000. The estimate for the year 2025 suggest that the car ownership level

17
is going to around 35 cars per thousand population adding about 30 millions new cars
on the Indian roads (Ghate & Sundar, 2013). In one estimate, the motor vehicles in
India will grow to about 200 per thousand persons by the year 2050 (Chamon, Mauro &
Okawa, 2008).
Figure 1-1 Global car fleet estimates 2050 (from Chamon, Mauro & Okawa, 2008)
The process of motorisation needs to be considered beyond an increase in private
motor vehicle use. Motorisation facilitates the emergence of socio-political
constituencies that demand wider roads, cheaper fuels and free parking lots. Further,
there is also an economic regime of neo-liberal policies, which provides incentives for
the automobile industries and cheap loans for the buyers. In these circumstances, the
urban populations of metropolitan cities or small-to-medium-sized towns increasingly
assume that private vehicles are inevitable for both practical purposes, such as
commuting, as well as for social status. The state, on the other hand, faces a ‘viability-
affordability dilemma’ in running the public buses and is tempted to pull out of the
provision of urban services like public transport. For the state, facilitating the
proliferation of private vehicles with infrastructure building might be a more rewarding
proposition politically compared with running financially complicated and socially
challenging public transport services.

18
Road infrastructure are socially-constructed technical assemblies (Wahdan, 2010)
where the power play occurs between competing vehicles. There has been a debate in
the popular media in Delhi whether it is a good idea to dedicate the median lanes of
multi-lane roads for the exclusive use of the bus rapid transit (BRT) project. The lobbies
representing the private car owners petitioned to the high court claiming that as the ‘job
creators’ in the economy, they are more legitimate users of the road space compared
to the ‘wastage’ of space for the bus rapid transit corridors (High court of Delhi, 2012).
The high court rejected the petition and supported the government decision of building
the BRT project. However, since then the BRT project has not really expanded beyond
the pilot corridor of six kilometres, even after claiming ‘victory’ in the court. Chaplin
(2011) points out, through the examples of other basic urban services, the very nature
of the post-colonial state which, instead of being an instrument for socio-economic
change, have been dominated by coalitions of interests championed in using public
funds to provide private goods.
There are pressures on the city administrations to invest in infrastructure to facilitate
the movement of private vehicles, which the city governments are complying with after
a long lag. Cox (2010) demonstrates how there remains a bias towards prestigious
mega-projects and market-based top-down approaches of transport provision in many
Asian cities. Badami (2009) shows how this approach further facilitates motorisation
rather than promoting the goals of sustainable mobility through the cases of a few
Indian cities. Sustainable mobility means to describe all forms of transport which
minimize fuel consumption and carbon emissions by minimising the need to travel itself
(Knoflacher, 2007; Banister, 2008) that includes modes such as shared or public
transport, walking and cycling (Agarwal & Zimmerman, 2008). Knoflacher (2007)
argues that the hypothesis of traditional urban transport planning ‘growth of mobility’
and ‘travel time saving by increasing speed’ end up creating more transport,
environmental, socio- economic problems all over the world. Vasconcellos was one of
the early commenters to observe that transportation planners in developing countries

19
are using transport modelling techniques designed by and developed in foreign
contexts which are unsuitable for the everyday needs of people in developing countries
(Vasconcellos, 1997b). He urged the planners to reassess their approach, rid
themselves of their assumptions, re-think their methods and models and adopt more
evidence-based approach to planning by asking a new set of context-sensitive
questions.
It was not only about finding appropriate methodology and tools for planning in
developing countries. The conventional transportation planning paradigm of facilitating
traffic movements in the city was a product of social aspirations and political outlook of
the mobility in the cities. It took a long time for many developing countries to adopt
sustainable mobility paradigm. The idea of sustainable transport had a belated
entrance into Indian urban policies too. It was only in 2006 that the first and current
‘national urban transport policy’ was formulated. This policy brought a dramatically
pronounced shift from ‘roads for vehicles’ to ‘streets for people’. However, the rhetoric
of ‘sustainable transport’ does not find much resonance in transport sector investment
priorities, which are highlighted here with three examples of investment at the national
and the city level:
The draft of the national five-year plan (2013-2018) identifies that about 44% of 871
billion US$ of funds are to be spent on ‘urban roads’ with only 11% on ‘urban
(mass) transport’ over the next 20 years.
In 2005, the Government of India created the Jawaharlal Nehru National Urban
Renewal Mission (JnNURM) to invest over US$ 20 billion in urban infrastructure
improvements and basic services to the urban poor in 65 mission cities over the
course of seven years. After seven years of disbursements, the assigned funds are
concentrated in road infrastructure sector, favouring general traffic and not
necessarily sustainable transport investments. IIHS reports that 57% of transport-
related funding was allocated to roads and flyovers and 33% to mass rapid transit

20
and other public transport (IIHS, 2011). All sizes of cities have more JnNURM-
funded road and flyover projects than any other types of projects (CSE, 2011).
Further, an analysis of municipal budgets reveals which modes are given priority,
beyond JnNURM-funded projects. In Pune, for example, although the city’s mobility
plan sets out goals of achieving 50% mode share from non-motorized transport
and 40% from public transport, they allocated 61% of their 2011-2012 budget to
motor vehicle-related projects. Similarly, in the 2013-14 budget of Ahmedabad with
the size of US$ 460 million, about US$ 152 million will be spent on ‘roads and
bridges’ and the expenditure on public transport is less than half of that amount.
Mobility is a relational concept and that 'one's mobility may well be another's
immobility'. The hegemony of private motor vehicles prevails not only in national level
programs and city budgets but also in the popular urban culture, media and political
demands. This leads to more and more road infrastructure building activities on one
hand and marginalization of other modes such public transport, para-transit, cycling
and walking. Motorisation is a phenomenon encompassing the consumerist culture,
popular imagination and social mobility. It thrives on predominant politics of mobility
practiced by the governing class and the motoring class that systematically marginalize
the other modes. This process is not unique to the Indian situation but similar trends
were seen in the other cities/countries when they were at the peak of the motorization
process. However, the unique facet of the motorization process in India is the sizeable
portion of its population living in poverty and in informal job-work scenarios. This is an
unexplored territory in urban research in India and elsewhere: namely how the process
of motorisation affects the poor and how the poor negotiate their travel needs in a city
in the context of on-going rapid motorisation.

21
1.3 Poverty, Informality and Mobility
Urban poverty is a prominent issue in the rapidly urbanising developing world. Poverty
consists of many interrelated aspects 2 and one such aspect is transport, which
determines the crucial links between housing and labour markets (Narayan et al.,
1999). Evictions in the cities and how the poor are re-located or dislocated resulting in
higher transport costs to those households is a familiar narrative in urban planning.
Beyond this familiar narrative, the process of motorisation being facilitated by
conventional transport planning and the neo-liberal paradigm completely bypasses the
poor, given the economic barriers to them purchasing or using motorized vehicles. How
do they survive in cities without being motorised like the other economic classes or
without being facilitated by the state-sponsored services of the public transport?
Relatively little is known about how the urban poor negotiate the complexities of their
daily lives in relation to their mobility opportunities with respect to existing transport
systems, land use structure and the planning policies (Booth, Hanmer & Lovell, 2000;
Barter, 2004; Cox, 2009). The literature – whether in transportation studies or
development (or poverty) studies – is inadequate to explain how poor people negotiate
transport (along with other urban services) for the betterment of their lives in
developing countries in general and in India in particular.
This thesis intends to see people living in poverty with their own agency, their own
interest groups and their own ability to change situations and contest for space and
resources in cities (as discussed by Gotham, 2003). There is an extensive literature on
how the poor struggle and survive in the cities of the developing countries (Davis,
2007; Narayan et al., 1999; Narayan, Pritchett & Kapoor, 2009; Webster & Engberg-
Pedersen, 2002): by negotiating housing tenure security through patron-client
2 In addition to relative income poverty, interrelated aspects such as food security, shelter security
(including access to water and sanitation), access to livelihood, access to health and education services, social networks and participation in local governance etc. play a crucial role in escaping poverty or being in poverty (Narayan et al 1999, 2000 and UNRISD 2010). Some World Bank studies (Narayan et al 1999, 2000) based on the narratives of the poor people highlight dynamic changes in the status of a household in the given time or over a period of time.

22
relationship (Benjamin, 2008) or by community mobilization for shelter rights, for
example, the Slum Networking Programme (SNP) in Ahmedabad (Dutta, Batley &
Sidhartha, 2000) and the Slum Redevelopment Scheme in Mumbai (Patel & Arputham,
2008). These are examples of how the poor have survived the hostility of the official
master plans, through political support, community mobilization or devising their own
strategies. Poor groups build complex alliances to claim public services and to
safeguard territorial claims. Solomon Benjamin terms this as ‘occupancy urbanism’
where poor groups appropriate real estate surpluses via reconstituted land tenure to
fuel small businesses whose commodities jeopardize branded chains (Benjamin,
2008). Similar to Gramsci’s famous dictum that the ‘lower classes achieve self-
awareness via a series of negations’3, poor households subvert rules, regulations and
legalities in order to survive in the city.
Ananya Roy critiques the perceptions developed based on Slum dog Millionaire and
other media stories about Indian slums as ‘poverty pornography’ (Roy, 2011; p.225)
and she asserts that it is only one of those fictional imageries that constitutes cities like
Mumbai. Mumbai and its squatter settlements are more complex than the extremist
clichés like the ‘spirit and enterprise’ of the poor verses ‘the harsh reality of Mumbai
slums’ games. Such examples show that poverty, poor people or slums have been
reduced to a stereotype by the popular media, which either glamorises them or
condemns them. These two extremes are also critiqued by Gilbert (2009) that there is
trivialisation and exaggeration, both in the right-wing romanticism of Hernando de Soto
(Soto, 2003) and in the left-leaning radicalism of Mike Davis (Davis, 2007). Gilbert is
critical not just of de Soto’s positive stereotyping of urban poverty, but also the
simplistic solution of providing the poor with legal titles which according to Gilbert is an
idea with some developmental potential has turned into a panacea for reducing urban
poverty (Gilbert, 2002, 2009, 2012). Davis generates an apocalyptic, negative
stereotype about proliferation of slums in the cities of the developing world (Gilbert,
3 Based on Ranjit Guha’s seminal essay ‘the prose of counter insurgency’ in (Guha, 1983)

23
2009; Angotti, 2006). Further, Gilbert (2007) observes the explicit ‘return of slums’ in
the UN-World Bank literature (specifically the 2003 Global human settlement report
titled ‘the challenges of slums’) with all its inglorious associations and a long history of
the varying use of the term. Gilbert asserts that the newly found use of the term slums
have become epistemological shorthand for portraying the problems of urban poverty
and creating dangerous stereotypes about the poor and the marginalised, but also
glossing over a highly differentiated landscape of urban poverty. Similarly, in the quote
at the beginning of the section 1.1, the melodramatic ‘only Mercedes will go but a cycle
can’t go’ is also a clichéd representation of the divide between the rich and poor and is
inadequate to explain the conditions by which such binaries are produced or operated.
Developing Gilbert’s approach, Arabindoo (2011) insists that researchers should stop
treating ‘slums’ as a ‘short-cut icon to desktop-based research’ on urban poverty and
instead set out in the field to build ‘an ontology of slum practices’ (Arabindoo,
2011;p.644). Arabindoo argues that rather than a grand narrative about slum as a
meta-theory, it is such investigations on the city as a site of everyday practices that
provide valuable insights into linkages between the coarser grain of macro-structural
processes and the finer texture of human experiences. It is important to trace the new
trajectory of their everyday networks and how this reshapes either their resilience or
marginality. The urban scholarship on poverty and slums in Indian cities and elsewhere
require careful outlining of these concepts charting away from any possible
stereotypes, binary opposites or emotive impulses to build narratives that are based on
everyday life practices and human experiences.
Here ‘urban informality’ emerges as a useful concept. It is not merely a labour
categorisation or economic category. Informality is defined here as goods, services and
practices, which are not entirely formalized, regularized or even legitimized by
government. Urban informality has an organising logic (Roy & Alsayyad, 2004) and it
can be seen as a system of ‘spatialised practices’ (Roy, 2009;p.84). Informality exists

24
and prospers in the gaps created by formal institutions such as markets, governments
and societies. This does not necessarily mean that policy interventions that would
integrate the informal into legal, formal and planned sectors would ‘solve the problem’.
Indian urban planning operates through systems of deregulation, un-mapping and
exceptionalism, which defy all norms of rational planning and ‘future-proofing’ (Roy,
2009;p.85). And sometimes, the selective flexibility of the state gives way to the various
impasses that indulge in such acts as presented by number of studies (Chatterjee,
2008; Ghertner, 2011; Roy, 2008; Bhan, 2013). These systems are neither anomalous
nor irrational; rather they embody a distinctive form of rationality that underwrites a
frontier of metropolitan expansion. Importantly, making use of these informalities; the
urban poor have created their own lives, their own ways of dealing with their transport
means in order to create access.
A study of low-income cyclists in Ahmedabad (Sheikh, 2009) described the existing
informal systems of bike renting, selling and re-selling, and financing in the squatter
settlements. Another example of ‘informal’ means of transport is the cycle rickshaws in
many Indian cities. While they secure the livelihoods for thousands of poor migrants
and personalized mobility for those who cannot afford the automobile, there have been
(and continue to be) pressures for their ‘regulation’ out of congested streets as urban
planners and policymakers view them as ‘bottlenecks’ in smooth flows of traffic (Sood,
2012;p.101). Similarly, there are often efforts by the city governments to regulate
various forms of auto-rickshaw services. Licenses, permits and caps on the numbers of
auto-rickshaws exist in all cities and yet the number of auto-rickshaws is increasing4.
These transport markets are highly dynamic: they changes and adapt the routes and
operations quickly depending upon where the regulatory authority is more likely strike
them. However, in some countries, these unofficial, unregulated and unregistered
services are becoming more acceptable to governments and there are attempts to
4In absence of municipal bus transport, the city of Surat had more than 55,000 auto rickshaws for a city of
two million people.

25
regularize them. However, bans, bribes, fines and regulations tend to dominate these
‘informal’ transport services in Indian cities. One recent example is the complete
banning of cycles from all major roads (176 of them) in Kolkata (Tandon, 2013). The
undemocratic and environmentally unsustainable nature of these regulatory measures
has not gone uncontested, yet the technocratic urge for a fast urban modernity remains
dominant. In the transport realm, the urban informality discourse has been dominated
by informal transport provision (as described by Cervero, 2000) which needs to be
expanded to include mobility practices related to walking, cycling and other modes.
However, the concept of ‘urban informality’ in transport realm needs to be employed to
understand one, how the systems of deregulation, un-mapping and exceptionalism
create hegemony of automobile-centric systems and two, how people deal with mobility
related choices given the context of informalised housing and livelihood scenarios.
In the negotiated urban territories, mobility related choices are carried out by ‘mobility
practices’. ‘Mobility practices’ is a term used in this thesis for the transport related
activities of the poor people. As mobility practices are indicative of specific socio-
economic situations, this thesis intends to place transport-based mobility in the wider
context of the lives of the urban poor. The practice oriented approach challenges much
transport research in supposing that mobility is not merely about getting from A to B,
suggesting that it is instead about integrating everyday life and the activities required of
‘normal’ social practice (Shove, Pantzar & Watson, 2012). Elisabeth Shove expands
the idea of ‘social practice’ as the action of achieving what people count as normal
social practice: signalling membership of society, conforming to convention and
reproducing social order. Changes in consumption, including changes in mobility,
consequently suggest a rearranging of routine, convention and order. Shove & Walker
(2010) suggest that instead of viewing the ‘demand’ (of mobility or any other forms of
‘consumption’) narrowly, based on ‘human needs’ or ‘societal function’, the
understanding needs to be developed about how sustainable practices come into
existence and how interventions of different forms can be implicated in these dynamics.

26
A social practice-based approach may lead to explaining not only the sustainability
aspects of mobility but also the socially rooted choices for mobility more
comprehensively.
Much of this work on (mobility based) ‘social practice theories’ is situated in the
developed world where the sustainability discourse has different challenges than the
developing world ( like Lyons, 2013; Williams, Chatterton & Parkhurst, 2013). However,
this thesis employs the ‘social practice approach’ for the developing countries case. In
the developing world there are two-fold challenges; one, retaining the existing
sustainable, less-resource consuming practices which may not be predominantly
perceived as ‘modern’ or ‘formal’ and two, dealing with the excessive resource
consumption which creates inequitable costs and benefits. For this thesis, the concept
of mobility as a social practice will have to be situated within these two-fold challenges
while debating the sustainability aspects.
Mobility practices mean ‘mobility related social practices’. One of the reasons of the
usage of the term ‘mobility practices’ is also because ‘practices’ may often be
expressions of ‘subversive use’. The concept ‘subversive user practices’ is intended to
capture the tactics deployed by mobility communities to redefine dominant meanings
attached to their mobility and resist governmental attempts to regulate their social lives,
to develop sub-cultures which not only nurture counter-hegemonic representations of
mobility but also promote the creative use of technologies (Certeau, 1984). This is not
to say that such subversive practices are equitable or sustainable but they do help in
asserting the right to be in the city and this thesis is testing to what extend these rights
are being asserted. Finally, should the mobility of the poor be viewed as ‘subversive
mobility’ where the poor subvert the dominant efforts of transport planning by their
mobility practices or their mobility practices are subordinated and marginalized by the
hegemony of private vehicle centric motorisation? These categories of subversion or
marginalization are not mutually exclusive and they possibly infringe on each other. But

27
it will be crucial to know to what extent the mobility practices of the poor are a resilient
response; both in terms of dealing with their poverty and also in terms of sustainable
mobility paradigm? These are larger questions, which create the settings for this thesis
and the concepts such as ‘informality’ and theirs of ‘social practice’ provide recurrent
themes for analysing the interactions between mobility and poverty in Indian cities. The
nuances of social practices are further debated in Chapter 2, while discussing
theoretical mode of mobility-transport interlink ages.
In summary, this chapter presents the larger debates about urban development in
Indian cities within which the issues mobility of the poor will be situated. In the wake of
21st century, Indian cities are being characterised by competing urban visions,
contestation for space and resources, new-found prosperity and growing disparity. The
term Shanghai dreams is used here as a metaphor to caricaturise how the future
Indian cities are being imagined by the elite political and governing class. Mobility
emerges here as an important yet under-studied lens to view claims of modernity and
contested territories of Indian urbanism. In spite the rhetoric of sustainable mobility in
the national policy agenda, automobile-centric infrastructure projects dominates the
urban transportation planning which marginalise the ‘other’ uses such as public
transport, walking, cycling or street-vending. Urban poor are carriers of these
marginalised uses on the road space. Being conscious of possible stereotypes,
binaries or emotive impulses, this study departs to see the city as a site of everyday
practices which are producing, both marginality and resilience of the poor. In the end, it
is signposted that this thesis will employ ‘social practice approach’ to mobility (termed
as mobility practices) which will be elaborated further in the chapter-2 after building the
theoretical grounds based on the literature review.
The remainder of the study is organized in the following way: Chapter 2 further reviews
specific literature related to the mobility of the urban poor in the inter-national contexts,
deliberates further on the theoretical model linking mobility-poverty and develops

28
research questions for this study. Chapter 3 presents the detailed methodology for the
current thesis including the selection of the case study. Chapter 4 outlines the case
study of Ahmedabad; discussing the specific context to analyse the mobility of the
urban poor in the city. Chapter 5 outlines the answers of the research question(s)
based on empirical findings and analysis. Chapter 6 further concludes the debates
around mobility of the urban poor informing the international fields of urban poverty
alleviation and sustainable mobility. Chapter 7 presents overall conclusion,
recommendations and pathways for further research.

29
2. Towards a theoretical model of poverty-mobility
inter-linkages
This chapter reviews more specific literature related to the mobility of the urban poor
based on the fields of transport studies and poverty studies and aims to develop a
theoretical model linking poverty and mobility. The chapter starts with an account of the
urban poverty debate leading to the international literature on mobility of the
disadvantaged population (as a broader category) in different national and
geographical locations and theoretical approaches. From the broad-base review of
international literature, the chapter then focuses on the urban transport studies related
to poor people in India. Towards the end of the chapter, the proposed theoretical model
is discussed and the research questions for the thesis are developed.
2.1 The (urban) poverty debate
Poverty is one of the most debated concepts in the social sciences, development
studies and urban studies. An extensive body of research has emerged over the years
about various aspects of poverty and poor people such as definition, measurement and
analysis of living with poverty. The phenomenon of poverty has to be understood both
as a painful reality experienced by millions of human beings and as a construction of
competing conceptualizations, definitions and measures. The following parts primarily
argue how poverty will be conceptualised and defined as part of this thesis.
The understanding about poverty begins with lacking material resources and extends
to many factors to make it a complex, multidimensional phenomenon (Toit, 2004).
Poverty is routinely defined as the lack of what is necessary for material well-being –
especially food but also shelter, clothing, clean water, and other assets. It was argued
by Peter Townsend in his seminal work on poverty that lack of these needs is defined
as ‘absolute poverty’, as distinct from ‘relative poverty’, or the condition of having fewer

30
resources or less income than others within a society or country, or when compared to
worldwide averages (Townsend, 1979). However there is no universal consensus over
what is necessary for material well-being (Wratten, 1995). Beyond income-based or
consumption-based definitions of poverty, the absence of basic infrastructure –
particularly roads, transport, water and health facilities – emerge as critical factors
affecting the wellbeing of poor people (Amis, 1995; Wratten, 1995). Poor people’s own
definitions also reveal important psychological aspects of poverty: that they are acutely
aware of their lack of voice, power, and independence, which subject them to
exploitation (Narayan et al., 1999).
The dominant conventional approach of poverty uses consumption levels to measure
poverty, defining a poverty line to classify people as poor or non-poor (head count
measure). For example, in India, official poverty lines are based on expenditures for a
minimum food basket, differentiated by rural and urban areas. Satterthwaite (2003)
argues that the scale and depth of absolute poverty in urban areas of Africa, Asia and
Latin America have long been underestimated. Saith (2001) also critiques the poverty
line approach for the reason that a poverty line measure may not capture all the assets
of households that may increase or decrease their long-term vulnerability. Secondly,
the health of family members can be an asset or liability. Third, spatial segregation and
exclusion among poor households is not covered. Further, the poverty line estimate
typically takes no account of other deprivations such as very poor housing conditions
and lack of basic services. The poverty line debate in India is a highly contentious
issue and many scholars have criticised the methodology of the official Planning
Commission of India approach to estimating the poverty line (Manna, 2012;
Subramanian, 2011; Chandrasekhar & Mukhopadhyay, 2007). Alkire & Seth (2009)
propose an alternative methodology for the estimation of poverty line and Baud et al.(
2009) shows how to map poverty in urban areas based on multi-dimensional aspects,
whereas (Krishnaji, 2012) calls for abolishing the poverty line as an approach
altogether.

31
The ‘poverty line view’ of poverty and its prevalence is problematic when placed within
the socio-economic situation or more specifically the income pyramid of a country.
Arjun Sengupta works within the framework of calculating consumer expenditure and
links this with social, educational and work status dimensions to prove that there is a
strong case for building up a multidimensional profile of poverty (Sengupta, Kannan &
Raveendran, 2008). This approach demonstrates that more than three-quarters of
Indians are poor and vulnerable, with a level of consumption not more than twice the
official poverty line despite the high economic growth in last two decades or more.
They categorise these people as ‘common people’ instead of calling them poor. In
other words, people who are above the poverty line are not necessarily ‘better off’ and
a sizable population struggles for resources in their daily lives. Based on consumption
expenditure, they also show evidence to suggest that inequality is widening between
the common people and the better-off sections of society in India. They claim that their
numbers point to the often talked about “two Indias”, a shining and resurgent one and a
suffering yet labouring one. This increasing inequality and income-based segregation
being played out in cities is not a unique problem in Indian cities but these issues
encompasses the cities in the global south – Latin America, Africa, South Asia and
South-East Asia (Satterthwaite, 2003; Alkire & Santos, 2010).
This understanding about poverty raises methodological issues that not all dimensions
of poverty and their relationships or processes are quantifiable; people poor by one set
of indicators (e.g. income) are not necessarily poor by another (e.g. welfare indicators
such as mortality or social capital); while vulnerability and lack of power and autonomy
are hard to measure. The conventional poverty line approach is also questioned by the
conceptual developments around the world in the last two decades. Over the years,
new concepts such as ‘vulnerability’, ‘deprivation’ and ‘social exclusion’ have emerged
in various international contexts to cover a wider range of meanings and to expand the
factors affecting the lives of the disadvantaged population. Misturelli & Heffernan
(2010) trace how the concept of poverty has evolved from the tangible ‘basic needs’

32
approach in the 1970s to the ‘softer’ human rights-based approaches in the last
decade. New participatory approaches of poverty measurements have also, for some
time, been developing to include local variations in the meaning of poverty (Spicker,
2007). Even the World Bank Group, which propagated the conventional poverty line
approach (like living below one dollar a day with varying purchasing power parity), has
initiated trans-national studies with participatory approaches in the last decade
(Narayan et al., 1999, 2007; Narayan, Pritchett & Kapoor, 2009).
Amartya Sen moves away from the conventional economic approach to poverty and
brings an alternative perspective by asking to focus on the ends not the means (like
income or consumption). The end result for any human development paradigm is
freedom – freedom to develop the way people like and freedom to choose ways of
living. Sen (1999) sees poverty as ‘capability deprivation’ whereby being poor means
not having the capability to realize one’s full potential as a human being. Capability
inadequacy or deprivation leads to ‘an intolerable waste of talent’ (Banerjee & Duflo,
2011). Poverty is thus characterised not only by a lack of assets or inability to
accumulate a set of assets, but also by lack of choice with respect to alternative coping
strategies. This approach constructs human beings as people with agency for whom
the freedom to be able to make choices about what they want to be and about how
they deploy the resources available to them (Lister, 2004). In other words, poverty is
not only about ‘not having resources’ but it is more about ‘not having choices’ to access
more resources or to deploy them as they like.
The definition of poverty lines and quantification of the proportion of people below them
have limited contribution to explaining poverty’s continuation, reduction or deepening.
Poverty is multidimensional because the notions of human development are multi-
dimensional even in its basic sense of the term of life with dignity (Sengupta, Kannan &
Raveendran, 2008). This multi-dimensional nature of poverty is experienced through a
combination of deprivations that poor households encounter while coping with

33
changing socio-economic situations. Poor households get out of poverty and prosper
or fall back into the traps of poverty. This more sophisticated understanding of poverty
and deprivation, as a set of relationships and a process rather than a ‘state’, implies
that the poor are not passive.
2.1.1 Social and political organization of the poor
The poverty situation is shared at the household level which as a basic unit of social
organization and economic production. Rakodi (1995) articulates the concept of
‘household strategies’ to explain poor people’s responses to the matters of everyday
situation; the family based household has remained for its members the basic resource
for coping with the environment. Family-based households are likely to have some
common strategies and co-operation within the family networks is the basic pattern of
social interaction (Lomnitz, 1977). Individual family members may have conflicting
interests, but each is likely to derive some advantage from the enhancement of their
collective welfare (Roberts, 2010). Whether a household is temporarily or permanently
poor may be related to its resource endowments, its organisational capacity to manage
and deploy its resources, its labour force position, the coping mechanisms available to
it and external or family contingencies, which affect it.
Analysis of poverty based on household income or consumption expenditure treats the
household as a black box and it ignores distribution of food, status, influence in
decision-making and access to services within the household. The strategies that
households employ to get by in the cities of the developing world are based mainly on
the intensive use of household and community relationships. Different members of the
household may have a different role to play in each of these, and their influence over
household decision-making may vary from household to household, over time and
between activities. Households and individuals adjust this mix of resources according
to their own circumstances (age, life-cycle stage, educational level, tasks) and the
changing contexts in which they live. Coalitions may emerge between members of a

34
household to secure a greater share of resources for themselves. The poorest
households are likely to aim at survival while those who have been able to achieve a
basic level of security may be able to engage in more risky, but also potentially more
profitable, economic enterprises which, if successful, lead to income growth.
Not only as household strategies, the urban poor are socially organized as a collection
of family networks, which assemble and disband through a dynamic process. In the
absence of state-provided welfare, individual survival depends upon family provision of
care for elderly, the pooling of inadequate incomes and sharing of shelter (Roberts
1995). The family, together with wider kinship and friendship networks, helps
individuals to find jobs in the informal sector of the urban economy and provides aid in
emergencies (Narayan et al., 2007). Rural migrants mostly make the first move to a city
where they can expect to be received by relatives and friends. They will be offered
shelter and food for a while, they will be introduced to the urban environment, and
efforts will be made to find them an opportunity to earn their living and consuming the
informal housing and urban services market. This pattern of initial urban association
encourages persons of the same origin to form residential clusters or even ghettos.
Luke, Munshi & Rosenzweig (2004) emphasize the importance of networks, formed
along caste and community lines, in determining the jobs available to workers in case
of Mumbai. These networks are especially important for labourers and unskilled
workers to find their entry into cities.
The responses and collective action of the urban poor is important to understanding
political dimensions of urban poverty. Although the urban poor often participate into
political activities in the developing cities, they are generally marginalised in terms of
their integration into urban planning and policies. Beall, Crankshaw & Parnell (2000)
argues that the responses of the urban poor themselves and the conditions under
which collective action shifts from isolated or self-contained self-help activities to wider
engagement in urban politics need to be explored for the pro-poor urban development

35
policies in developing countries. The urban poor are not politically marginal in the
sense of not participating in or affecting urban politics in developing countries, as they
are often seen as potential ‘vote banks’ by the politicians. Although they are skilful
participants in local politics, the poor have been unable to sustain protests or political
organisations enough to constitute a serious threat to any political establishments.
It would only be appropriate to view the debates around poverty definition or poverty
line with the political use of these conceptions in the policy realm. There are many
competing theories about why poor people stay poor. Globally, there is one school of
thoughts, which would argue that the persistence of poverty is an inherent element of
capitalist development. And on the other extreme, the opposing views would argue that
that poverty persists because of obstacles to capitalism and distortions in local and
global markets. Two other types of discourses are politically subtler in examining the
relationship between poverty and its distribution, reflecting individualistic or structural
perspectives. The first attributes the main responsibility for poverty or a move out of it
to the poor themselves and applaud individual efforts and the second points at how
economic, social, political structures or processes create and perpetuate poverty
(Lister, 2004). This kind of discourse on poverty reduction – whether coming from the
left or the right - mainly emphasizes the respective roles of the state and the market.
(Webster & Engberg-Pedersen, 2002) argues for the importance of exploring and
understanding the poor's own actions as there is a great diversity in the contested
nature of poverty reduction and the significance of political space for challenging
conditions of marginalization.
This thesis argues that the relationships between the actions of the poor and the
organizations and institutions of the political arena are neither simple nor predictable
nor static. The state sees the poor by selectively invoking legality or illegality (Scott,
1998; Ghertner, 2011; Bhan, 2013) and the poor see the state through their
decentralized local government where they are queuing up for ‘goodies’ (Corbridge et

36
al., 2005). In governmental or developmental agencies, poverty is defined and
measured to ‘do something’ about it whether it is in terms of distributing welfare
benefits, promoting property rights for the poor, or finding reasons to speed up
economic growth. In whichever case, people are often reduced to a ‘target population’
and top-down approaches of development pre-suppose the ‘need’ of people and try to
meet these needs by the dysfunctional decentralized entity of the state. Thus, the focus
is not on systematically facilitating the survival of the poor based on their own practices
but there are policy designs based on the economic and social theories that assesses
the ‘demands’ or ‘needs’. The economic debate on poverty often loses sight of people
living in poverty; especially, how they are strategising to cope up with the situation,
falling back or moving out of poverty and how they negotiate their constraints by
reusing or reallocating their resources.
Conceptually, this study views poor people are not as victims but as active agents of
change in their own situation through the exploitation of economic opportunities. The
spirit of this proposition is largely based on Janice Perlman’s seminal work ‘myth of
marginality’ (Perlman, 1976, 2007) which contests the ideas of viewing poor people as
passive victims or blaming them for their own poverty. Partha Chatterjee’s idea of
‘political society’ takes the argument further and elaborates the politics of the poor
based on building alliances and employing tactics for survival (Chatterjee, 2006, 2011).
The poor are constantly seeking to maneuver in the given conditions and political
spheres to improve their living conditions (Benjamin, 2008). Poverty situations should
be understood based on the existing practices of the poor. These actions or practices
may seek to change their poverty directly, or the poor may seek to effect change with
respect to the implementation of public policy or government programs. But in some
cases, the agency of the poor remains only notional given the arising conditions:
hence, a ‘poverty trap’ may lead to the deprivation of the whole household. Yet, the
‘trap’ itself is not important but the efforts and practices to move out of the ‘trap’ are
more useful for possible theorizing, policy-making or actions.

37
2.1.2 Postulates related to understanding poverty
It was a fundamental need for this thesis to define poverty for this work. It is clear from
the literature that there is no singular, linear definition possible of complex phenomena
like poverty. Having reviewed various approaches and standpoints related to urban
poverty, the following postulates are developed to conclude the understanding about
poverty and people living in poverty for the purpose of this study:
1. Poverty is more than a lack of adequate income but a combination of many
forms of deprivation that together allow human capabilities to go unrealised.
Income is not ultimately defining factor in poverty but it is a useful indicator.
2. The ‘poverty line’ approach has its own conceptual, methodological and
operational limitations. Such approaches are generated to identify beneficiaries
for government-sponsored schemes or programs, which often fail due to the
limitations of the poverty line approach. Bottom-up, participatory approaches to
poverty measurements are more useful in understanding relative poverty and its
relation to the contexts. Poverty is a contextually defined phenomenon.
3. Poverty is dynamic as people can fall back into as well as move out of poverty.
Poverty has time and space dimensions.
4. Living in poverty and efforts to move out of it needs to be understood in terms of
‘household strategies’ which may or may not be compatible with people’s own
individual practices.
5. Poor people are not passive victims but active agents of change. Poor people
attempts to form alliances or seek participation to have voice in the political
system. Political empowerment or engagement is an important tool for poor
people. Poverty is an institutionally imbedded phenomenon.

38
6. Poverty reduction strategies should facilitate and compliment people’s practices
and efforts to move out of poverty instead of pre-supposing or estimating what
is required.
2.2 Poverty and transport linkages in international literature
The following section reviews the literature exploring the inter-relationship between
poverty and transport. Transport and mobility-related research involving the urban
populations in India is limited compared to most of the western countries, particularly
considering the population size, the number of towns and cities and their diversities.
Traditionally, the infrastructure engineering field dominates transport research in India
and the research subjects emphasize the needs for the motorised modes barring one
or two researchers who consistently produce research on non-motorised mobility (like
Geetam Tiwari and Dinesh Mohan). Multi-disciplinary approaches to transport research
have been emerging only in the last decade and sustainable mobility concerns are late
entrants to the national urban transport policy and programs. As will be evidenced later
in the section, transport studies of the urban poor in India are even more limited and
there are only a handful reports and research papers. However, this is not the case
with Indian urban studies or poverty research in general. It is curious as to why there is
so little on the transport issues of poor people in urban studies, development studies or
poverty research in the South Asian context in particular. Similarly, there is little ground
covered in the conventional transport research about poverty or poor people.
Since there are limited studies on the mobility of the poor, the literature review is
expanded to include other approaches and concepts from across the globe, which
deals with issues of transport for disadvantaged populations (if not specifically the
poor). The approach here is to categorise and discuss the literature based on the
national or geographical distribution around thematic areas. This approach is
consistent with the earlier discussion that poverty or any such disadvantage is context-
specific and it cannot be generalised beyond certain points. The following section

39
presents the international literature on transport and disadvantageous population
briefly before going into the Indian literature on transport and poverty linkages.
2.2.1 Disadvantaged commuters in the US
The relationship between poverty and transportation being researched in US cities
starting from the late 1960s and the early 1970s, prior to many other countries where
this discourse is still emerging. Transport was identified as a major contributor to socio-
economic inequality in the US (Wachs & Kumagai, 1973). Many studies focused on
whether better public transit accessibility results in more workers finding jobs instead of
relying on the state sponsored employment benefits. The major contribution of this
body of work was to document the degree to which urban spatial structure creates a
disadvantage for poor workers and emphasizes how their personal mobility needs are
amplified by the locational characteristics of place. It is difficult for the poor to travel to
work locations because of the ‘spatial mismatch’ between residential locations and
employment or the ‘mode mismatch’ due to their over-dependence on public transit or
slower modes of commute (Ihlanfeldt & Sjoquist, 1998). The spatial mismatch is often
created by the automobile friendly infrastructure, which connects low-density and
sprawling suburbs to the mono-centric central business districts. The cities’ centres are
difficult to access by the non-car owning households given the longer travel distances
and deficient public transport provision further exaggerates their exclusion. Thomas
Sanchez has repeatedly argued that disintegrated residential and employment location
patterns and deficient public transportation service are critical obstacles to improving
the economic and social conditions of low-income persons (Sanchez, 1998; Shen,
Qing and Sanchez, 2003; Sanchez, 2008).
Over the years research in this area has moved beyond the spatial issue to include
characteristics of low-income workers such as their race and ethnicity, sex, education,
and income histories. Giuliano (2003) claims that the dominant understanding of travel
behaviour in US cities is largely based on the understanding of the white majority

40
population, which dominates the analysis when race/ethnicity is not explicitly
considered. Based on US national travel data, Pucher & Renne (2003) demonstrate
that the poor and racial and ethnic minorities have much lower mobility rates than the
general population. The poor, blacks, and Hispanics are far more likely to use public
transit than other groups and low-income households and minorities account for 63%
of the nation’s transit riders. Nonetheless, the private car continues to dominate urban
travel among every segment of the American population, including the poor, minorities,
and the elderly. By comparison, public transport accounts for less than 2% of all urban
travel at the national level. The car-owning households even amongst the poor are in
an advantageous position. Shen, Qing and Sanchez (2003) and Cervero (2000)
observe that only transportation adjustment in the form of increased car ownership
substantially improved job accessibility whereas residential adjustment made by
welfare recipients on average did not improve job accessibility. Instead, residential
relocation appeared to give welfare recipients a living environment with more desirable
socio-economic characteristics. Similarly, Rogalsky (2010) claims that access to cars
will not only increase working poor women’s daily mobilities, but also their job
opportunities, overall earnings, and their successful and permanent transitions from
welfare to sufficient and satisfying work. Some studies frame transportation as the
remedial measure for the right to travel and freedom of movement and argue for
greater funding of urban mass transportation systems (Dombroski, 2005). But it is
difficult to run efficient public transport facilities in the automobile-friendly spatial
structure of the sprawling US cities that favours car-based mobility. The car is an
important personalised cultural object in the US cities and car-based mobility is
dominantly believed to be the ‘American way’ of dealing with transport, which is
supported by a popular rhetoric of socio-political constituencies around freedom of
movement.
The Indian urban context is very different from the US but for the sake of argument -
Would giving a car to every poor household and building a city that favours car-traffic

41
‘solve the problem’? Does more mobility mean less of social disadvantage as an
income class or ethnic minority? Does more mobility mean more accessibility in the US
cities? There are limits to taking a strict mobility-based approach to solving these
problems of the disadvantageous population as the findings reveal how institutional
barriers and practices can interact with mobility problems and confound the issues
(Clifton, 2003). Recent research in Melbourne, for example, suggests that the
proportion of low-income households on the urban fringe who have experienced
‘enforced’ car ownership where they end up buying cars to be ‘part of the city’ (Currie
et al., 2009). Transportation policies not only have inequitable effects on the ability of
low-income individuals and minorities to access places, but also have serious indirect
effects such as encouraging and reinforcing residential segregation (on race or class
lines); restricting access to employment and other economic opportunities, housing,
and education; and causing health disparities (Sanchez, Stolz & Ma, 2003).
Besides, there are also other structural issues with the way in which the transit
investments are made and the transport planning is practiced in the US. Sanchez
(2008) observes that a relatively miniscule fraction of funds is spent on research
examining transportation’s effect on poverty and social outcomes compared to the
research on physical infrastructure building and its engineering aspects. Martens,
Golub & Robinson (2012) review transportation planning practice in the US for
distributional goals and find little guidance in conventional transportation planning for
justice-oriented measures. Martens (2011) observe that cost-benefit analysis has a
built-in distributive mechanism that structurally favours transport improvements for
highly mobile groups. He demonstrates how accessibility increments for low-accessible
communities could be more explicitly accounted for and more highly valued within both
traditional cost-benefit analysis and the four-step travel demand models, as a way of
moving forward to closing accessibility gaps (Martens, 2006).

42
The US examples pose an interesting puzzle as to how to mitigate the transport
disadvantage of a population group when the built infrastructure, urban spatial
structure, public investments, transport planning practice and socio-political
constituencies tend to favour car-based personal mobility over shared public transit
modes. This is important because lot of the Western and specifically American
solutions are often ‘imported’ in developing countries where transport infrastructure,
urban spatial structure, public investments and socio-political constituencies are
different then the US cities.
2.2.2 ‘Social exclusion and transport’ debate in Europe
Another extensive body of work related to the transport issues of the disadvantaged
population is the growing interest in the ‘transport and social exclusion’ debate in the
late 1990s and early 2000s in Europe, notably in the UK. The key question here was
how transport disadvantage is related to emerging concerns about social exclusion of
low-income communities. These studies make explicit links between the policies
related to social exclusion (and poverty), transport disadvantage and access to key
services in all aspects of life. Preston (2009) finds the genealogy of the term ‘social
exclusion’ emerging from the Marxist notions of social and spatial exclusion as inherent
conditions of capitalism based on the works of Lefebvre and Lenoir. And later, he
asserts that ‘social exclusion’ was de-radicalised, mainstreamed and appropriated by
the New Labour government and others in the 1990s. In 2003, the UK Social Exclusion
Unit in the New Labour government had published a report which subsequently
resulted in a set of transport policy guidance for local authorities intended to ensure
their Local Transport Plans included a focus on accessibility planning (Social Exclusion
Unit, 2003). Since this time, researchers, policy makers and practitioners in several
other countries became interested in adopting a social exclusion approach to transport
planning, largely because of its utility in identifying the role of transport, land use

43
planning and service delivery decisions in creating and reinforcing poverty and social
disadvantage.
The social exclusion approach (mostly focused on European context) explains
transport disadvantage by directly identifying the social consequences of a lack of
transport provision. Transport related social exclusion affects individuals and
communities to participate in key life-enhancing opportunities, resulting in reduced job
search activities, job losses, missed health appointments, school truancies and
increased physical isolation in later life. In this way, the social exclusion concept makes
a more direct link between transportation planning and social policy. It is concerned
with how mobility enables access and thus inclusion in society’s institutions, activities,
opportunities (Church, Frost & Sullivan, 2000; Lucas, 2006). Kenyon, Rafferty & Lyons
(2003) offers this widely cited definition of transport-related social exclusion –
“The process by which people are prevented from participating in the economic,
political and social life of the community because of reduced accessibility to
opportunities, services and social networks, due in whole or part to insufficient mobility
in a society and environment built around the assumption of high mobility”.
This definition clearly mentions how ‘reduced accessibility’ and ‘insufficient mobility’
placed within a context may lead to exclusion and identifies the relational nature of the
problem. Concerns with social exclusion go beyond transportation and extend to labour
markets, housing opportunities, income inequality, education, and health care. Church
et al (2000) has proposed a more clearly defined framework of exclusion across the
following categories: physical exclusion, geographical exclusion, exclusion from
facilities, economic exclusion, time-based exclusion, fear-based exclusion and space
exclusion.
(Lucas, 2012) and (Preston, 2009) are two works that retrospectively examine the
theoretical and policy progress on the issue of ‘transport and social exclusion’ mainly in
the UK context. Lucas considers that the transport research community has been

44
successful in developing methodologies to identify and measure transport-related
exclusion as social phenomenon with all its diversities. Both Lucas and Preston
recognise that the concept of social exclusion in the transport realm has been difficult
to operationalise from theory to practice in terms of policy prescriptions and practical
delivery. However, both have different views about applicability of the concept of
‘transport led social exclusion’ for developing countries or less-economically developed
countries. Lucas is very optimistic about identifying transport-related exclusion as a
‘universal and operational’ concept with recognition that exclusion is differentially
experienced within and between different nations by different social groups. Whereas
Preston argues that social exclusion may not have the same relevance in many
developing economies as poverty alleviation is the primary policy goal in these
countries, which is linked with the primacy of economic development objectives often
associated with road-building and pro-motorisation policies.
There are limitations in both arguments. Preston’s argues that road-building and pro-
motorisation policies are inevitable because they are linked with economic growth,
which is important for poverty alleviation. So it is inevitable that there could be some
social price (probably in the form of social exclusion or poverty), which needs to be
paid for road-building and pro-motorisation policies because they are important. This
implies that concepts like ‘social exclusion’, which look at social-spatial-temporal
dimensions simultaneously and measure multiple deprivations are a ‘luxury’ which less-
developed economies cannot afford, due to being under pressure to achieve economic
growth. This further implies that achieving social equity and better human development
should only be achieved after reaching a certain level of economic development. Then
what is the point of carrying on the path of economic growth if human development is
not in-built in the whole process?
Ivan Illich argues in his seminal essay ‘Energy and Equity’ that social equity and
energy use can grow concurrently only till a point. Below a threshold of per capita

45
energy use, transportation improves the condition for social progress and above this
threshold, energy use grows at the expense of social equity (Illich, 1974). This
hypothesis sounds logical but it is very difficult to determine this threshold point and
there are other unknowns like how to measure social equity and progress. However, it
is discussed previously through examples of various countries how excessive energy
use with limited distributional goals grow at the expense of social equity. This debate in
transport policy making and planning is represented as ‘mobility vs. accessibility’.
Would more and more mobility ensure accessibility or can high accessibility be
achieved despite limited mobility? The UK’s experience with the ‘transport-related
social exclusion’ concept and its operationalization suggest that there have been clear
attempts at mainstreaming accessibility perspectives while making plans at the local
area levels. However, some researchers observe that these have had limited success
(Preston, 2009; Halden, 2011; Lucas, 2012). This thesis recognises that this dilemma
needs to be debated as part of this work while discussing transport issues of the poor
in developing countries.
Lucas’s argument on the other hand of claiming ‘transport-related social exclusion’ as a
universal concept has its own limitations. Lucas is particularly optimistic about using
the ‘social exclusion’ framework for developing countries while demonstrating it in the
South African case of Tshwane region (Lucas, 2011). Given the African urban context
of a legacy of apartheid planning and post-apartheid housing developments, social
exclusion might be an appropriate framework to analyse the segregation between
ethnicities and income classes. The primary use of the idea of social exclusion relates
to poverty, because much of the concern with ‘inclusion’ relates to the availability of
systems or support to meet the needs. Poverty also implies that the poor are not fully
integrated with the social or governing system and thus are not fully part of the society.
However, it is possible to be excluded but not be poor, but it is less likely to be poor
and not excluded from various urban services.

46
The concept of social exclusion is useful for demonstrating that poverty is multifaceted.
Most features of the ‘social exclusion’ concept (attention to multiple dimensions, social
relationships, assessing the poverty of individuals relative to others in society and
concern with dynamics of poverty) are shared by concepts implemented in developing
countries (Saith, 2001a). (Saith, 2001) argues that attempts to replicate the concept of
‘social exclusion’ as developed in industrialized countries would not serve the purpose
in developing countries because of differences in the arrangement of social security
policies. It would result in a repetition of research that has already been conducted
within frameworks developed in developing countries (basic needs, capabilities, human
development index, sustainable livelihoods, risk and vulnerability, participatory
approaches). These frameworks, however, could benefit by taking from social
exclusion its emphasis on investigating the processes that lead to poverty. Besides, the
poverty-led exclusion in developing countries is different from ‘social exclusion’ in the
developed countries. The people living in poverty in the developing world might have
stronger social networks, community mobilization, political patronage and cultural
vibrancy. In the case of the poor households in developing countries, it is possible that
they are integrated with society with the help of their own networks yet deprived in
multiple ways. The concept of exclusion may present stark differentiation between the
‘excluded’ and ‘included’ whereas in the case of the poor in the developing countries,
there are ‘grey areas’, which help them survive and be sustained. And thus, it will not
be relevant to replicate the ‘social exclusion’ concept in the developing country context.
However, the ‘transport related social exclusion’ body of work in the UK and elsewhere
in the Global North provides useful insights into the diversity and complexities of the
transport issues of the disadvantaged population. This is the largest and most diverse
set of works that covers various theoretical trajectories such as the accessibility
perspective, social capital and capability perspectives, time geography perspectives –
as categorised by (Lucas, 2012). The methodological trajectories run from accessibility
analysis, spatial and social network analysis and spatial modelling. And there are

47
practical ways of dealing with the transport research outputs in the forms of local
transport plans, accessibility planning and national policies in the UK showing some
interactions between theory and practice. This should inspire and aspire the poverty-
transport studies in the developing countries to develop diverse perspectives, methods
and policy outcomes, but to replicate the exact concept is not appropriate for the
research in developing countries.
2.2.3 Poverty and transport through multi-lateral lenses
In the Indian sub-continent and elsewhere in the Global South, multi-lateral financial
institutions like the World Bank, Asian Development Bank and bi-lateral development
agencies like DFID (Department for International Development, UK) emerge as the
‘knowledge producers’ in the absence of country-based research institutions or in spite
of the presence of country-based institutions. The World Bank and DFID (or the
researchers associated with these agencies) have produced most of the research to
date on poverty and transport linkages in the developing countries of Asia and Africa
(notwithstanding the fact that the available works on this subject are limited).
Throughout the World Bank studies, transport has been identified as a key factor for
the economic growth and social development process because it facilitates the
movement of people and goods, and thereby (theoretically at least), promotes trade
and better standards of living through improved access to markets, employment,
health, education and social services. Gannon & Liu (1997) claims explicitly that
improved productivity and output due to better transport help to lower transaction costs,
allow economies of scale, widen opportunities, expand trade, integrate markets,
strengthen effective competition, and eventually increase real income and welfare of
society. They further claim that without efficient transport, economic growth is not
possible, and without growth, poverty reduction cannot be sustained. Largely stemming
from the belief in this relationship, the World Bank’s lending tends to be biased towards
investment in transport infrastructure, and in particular road-building, both in urban and

48
rural areas. With very little research available on this subject, it is difficult to verify the
claims as to what extent the road-building activities help the poor or to what extent
local, less-expensive solutions would have worked for the poor. Interestingly, most of
the World Bank studies have time and again recognised that the literature is far less
developed on the nature, extent and most importantly distribution (i.e. how different
groups gain and lose) from the impacts of transportation interventions in the developing
world (Gannon & Liu, 1997; Booth, Hanmer & Lovell, 2000; Baker et al., 2005).
Another recurring theme in the World Bank reports is that the provision of transport
infrastructure and services can facilitate (or constrain) poor people’s access to
locations where there is greater demand for their services. The urban poor, living in
geographically marginalised areas with poorer quality services and infrastructure, pay
higher transport cost as a proportion of their income share and commute the longer
journeys. They are (often) unable to travel to relatively inaccessible jobs that might pay
higher wages and must instead accept those which are easily reached (Booth, Hanmer
& Lovell, 2000). Most of the World Bank studies often rely on existing published
literature and very few studies – at least on this subject - have developed knowledge
about the transport disadvantage of the poor by studying their mobility or by measuring
their accessibility. One of the exceptions is the World Bank study by Baker (Baker et
al., 2005), who on the basis of primary investigations in case of Mumbai, found more
diverse patterns in the residential location, job opportunities and travel behaviour of
poor people than the non-poor. And this means that it is difficult to generalise that poor
people in developing countries are either geographically isolated or that they are
working in easily accessible jobs as a result of transport disadvantage.
In 2002, the World Bank published its urban transport strategy review ‘Cities on the
Move’ (World Bank, 2002). This document intended to develop ‘better understanding’
of urban transport problems in developing and transitional economies while articulating
the World Bank’s role in supporting national and city governments. This document is

49
much more prescriptive yet comprehensive in its outlook on urban transport compared
to other World Bank studies and this is probably the first important document to
explicitly focus on sustainable mobility, for example, identifying the futility of a
‘simplistic solution of increasing road capacity’ and how non-motorised transport is
systematically under-recognised. This document had a chapter dedicated to ‘urban
transport and poverty reduction’, which outlines ‘the rich agenda of urban transport
policies that are both pro-growth and pro-poor’. ‘Cities on the Move’ recognised that
whatever is pro-growth may not be pro-poor and there is a need to develop ‘poverty-
focused (transport) policies’. The transport disadvantages of the poor can be
addressed by a two-fold approach: one, by servicing the areas where poor people live
and work with public transport, and two, by specifically targeting the disadvantaged
sections of the poor and supporting their work journeys through transport subsidy
arrangements as a ‘safety net approach’.
Ken Gwilliam who was the lead author of ‘Cities on the Move’ takes stock, after a
decade, in a recent article (Gwilliam, 2013) and lists the number of positives and
negatives in the urban transport sector in the developing countries. In the areas that
concern poor people, there have been positive developments such as renewed interest
in bus-based public transport, investments in mass transit systems and policy changes
for fuel taxation and cleaner technologies. However, the accentuated motorization with
more road traffic accidents and worsened air pollution adversely affects the urban poor
disproportionately. Besides, the use of non-motorised transport is decreasing in spite of
some sporadic efforts at building better infrastructure. Mitric (2013) argues that the
future projects should specifically give more attention to fare policy – poverty – service
quality inter-linkages. Although Gwilliam doesn’t say this explicitly in his 2013 paper, it
appears that the progress in the ‘poverty focused transport policies’ is still insufficient
both in terms of its political acceptance and practical delivery.

50
Unlike the literature of the US and European contexts, where a number of diverse
research works have been conducted to develop more nuanced, context-specific,
institutionally-embedded understandings of transport disadvantage, the World Bank
studies on ‘poverty and transport’ are limited and of a prescriptive nature in spite of the
fact that most of the World Bank researchers are not from the developing world, and
have a high chance of having been exposed to the US or the European discourses.
The preoccupation of the World Bank transport research with higher technology fixes
and efficiency savings often ignores the travel needs of local ‘beneficiary’ communities.
The less expensive and more context-specific and socially sensitive solutions are often
not the focus of the World Bank or the national governments in terms of funding or
project development. It is only in the last few years that the World Bank group is
promoting ideas such as bus rapid transit (BRT) or land-use and transit integration (as
in Suzuki, Cervero & Luchi, 2013) and trying to enter the lending market for such
projects in the Indian and African cities.
DFID has commissioned studies on ‘poverty and transport’ from the early 1980s. In
1981, (Jacobs, Maunder & Fouracre, 1981) the low mobility of the poor in developing
countries (based on per capita trip rates compared to the developed countries) is
identified as a function of their ‘lifestyle’ or an indicator of being unable to make
important journeys given their low affordability. The authors do not develop this point
further but it is possible that that the poor have developed their life style or social
practices around low affordability. And over the years, the life style becomes so
ingrained that low mobility becomes a way of life and obvious social practice. This
aspect needs more deliberation based on a field-based primary study.
Many other (non-World Bank) recent studies have echoed concerns regarding the lack
of attention to the poor in transportation policy, practice and research, calling for
improved basic data on issues of transportation access for the poor, greater
consideration of equity in policy and project design, and further research on the

51
transport-poverty linkages (Barter, 2004; Badami, 2009; Cox, 2010). At this juncture,
there are two important research gaps that emerge out of the international literature:
one, understanding about the shelter-livelihood-mobility nexus in the life of the poor
and two, the role and impacts of pro-motorisation policies and transport infrastructure
development for the poor.
2.2.4 Poverty and transport in African cities
Two world bank studies (World Bank, 2004b, 2004a; Markovich & Lucas, 2011) identify
that there are four broad issues related to poor people’s transport disadvantages in
different African cities: (i) low access to public transport services and inadequate
transport supply, (ii) affordability issues linked with high levels of reliance on the use of
informal transport operating to meet the transport supply deficit; (iii) long distances
between peripheral residential areas and central job centres (sometimes aggravated by
the legacy of apartheid planning or new post-apartheid housing development patterns
in South Africa), and (iv) walking long distances to mitigate transport disadvantage and
exposure to risk whilst the urban poor as pedestrians account for two-thirds of road-
crash fatalities.
(Mitric, 2013) finds that the African urban transport context has many features in
common to those found in Latin American cities. However, poverty is more widespread,
car ownership is lower, and the provision of public transport services is even more
informal, and of lower quality. The share of long-distance walking in home-to-work
travel is higher in urban Africa than anywhere else in the world and sidewalks are
missing on two-thirds of the roads (Kumar & Barrett, 2008). Salon & Gulyani (2010)
demonstrate through a large sample in Nairobi that poverty is strongly negatively
correlated with the use of motorised transport and identify that affordability is a key
issue for not being able to use public transport for the urban slum dwellers, with the
situation being particularly worst for slum women and their children. They find that most
slum dwellers need to use motorised transport to access education and employment

52
opportunities that could lift them out of poverty, both because of the distance of their
housing locations from these key destinations and because of their inability to move
physically closer to them due to the absence of affordable housing within the city. (Diaz
Olvera, Plat & Pochet, 2008) show with the three case studies of Dar-es-Salaam,
Niamey, and Ouagadougou that transport is a major component of poor household
expenditure and daily use of public transport is unaffordable for the poor populations.
In these ever-expanding areas, even though low-resource households limit motorized
travel to the most essential trips, travelling by public transport imposes additional
pressure on their budgets. (Olvera, 2003) depicts in the case of Dar-es-Salam that the
‘unplanned settlements’ in the periphery are themselves ‘poverty traps’. In such
situations, it is obvious that the poor feel excluded and isolated as (Lucas, 2011) finds
that there has been a very poor post-apartheid government response to the escalating
mobility needs of low income travellers, who constitute the vast majority of South
Africa’s urban population.
Porter (2002) identifies that transport disadvantage is not only associated with a lack of
provision of transport infrastructure and motorised services and the monetary cost of
travel but can also include the amount of time people spend accessing and waiting for
transportation, the time they spend actually travelling and the overall time spent away
from the home – all of which significantly reduce the potential for undertaking other life-
supporting activities, especially for women. It can also embrace the discomforts and
risks experienced whilst travelling, such as exposure to accidents, crime, noise and
pollutants. Through a series of studies, both in urban and rural areas (Porter, 2007,
2008, 2011), Porter shows the inter-linkages between prevailing gender constructs,
women’s mobility and transport development in Africa. Male identity and its connection
to ‘motor mobility’ is a major factor in the current gendered patterns of transport use,
where driving is still a mark of masculine power. Porter further states that transport
remains a surprisingly neglected area amongst gender specialists, while transport
specialists are still reluctant to take on gender issues.

53
Following the pioneering Latin American examples, BRT systems have emerged as a
new type of public transport system in developing countries which promises multiple
benefits, ranging from sustainable mobility to poverty reduction and at much lower cost
than the rail-based mass transit system. In the African context, the BRT systems are
also viewed as correcting the public transit deficit and reducing the reliance on the
informal minibus or taxi services in the city. Vaz and Venter (2012) provide an early
assessment of the actual poverty impacts of the ‘Rea Vaya’ bus rapid transit
system in Johannesburg. Their data suggest that the main benefits of the first
phase BRT lie in its enhancement of access to a variety of activities, rather than its
direct expansion of accessibility to work opportunities. Both time and cost savings
are substantive, in the region of 10 to 20% compared to previous levels, but these
benefits accrue largely to medium-income households rather than to the poorest
commuters in the area. While BRT in general offers significant promise for
underpinning the formalisation and transformation of informal public transport
operators, the jury is still out on the question of whether BRT in South Africa will
continue to do so in a sustainable and comprehensive manner (Venter, 2013). Besides
the physical access issues, one reason that prevents the poor from using public
transport such as a BRT is the affordability issue.
The researchers associated with the World Bank (Mitric, 2013; Serebrisky et al., 2009)
insist that current public urban transport subsidy policies do not make the poorest
better off. Supply side subsidies - provided to the operator - are, for the most part,
neutral or regressive; while demand side subsidies - provided to the user - perform
better, although many of them do not improve income distribution. Rather they ask to
transfer the subsidies through other welfare instruments (food, education and health)
leaving public transport alone. This is mainly because there are no clear links between
public transport affordability and the welfare of the poor. As (Venter, 2011) mentions,
both expenditure levels and affordability perceptions vary significantly and

54
systematically across geographic settlement types, and depend to a large extent on the
modal and travel characteristics of commuter trips. Residential location has an
important role to play in public transport expenditure and getting the shelter-livelihood-
transport equilibrium right. It depends on the city governance and formal planning
mechanism to provide opportunities for the poor to stay close to the workplace or the
poor should have ‘informal opportunities’ to squat on public or private land near their
workplaces to minimize their transport disadvantages. In the case of most African
cities, none of the above options work out for the poor. This results in economic
vulnerability at the time of crisis in the households, leading to other deprivations, which
may not be directly linked with the transport needs.
(Salon & Gulyani, 2010) identify four key themes as the existing research on transport
for the urban poor in the African cities (which are again very similar to the issues
identified by the World Bank studies and Markovich & Lucas in the beginning of this
section): (i) income poverty as the main cause of transport disadvantage; (ii) the spatial
mismatches between housing location and labour market opportunities; (iii) road safety
for pedestrians and other non-motorised road users; and (iv) gender differences in
transport provision and the related disproportionate negative social consequences of
this for women and children. Unlike research in the US or Europe, the African literature
on transport research time and again mentions the quality of the public sector data,
methodological data-processing issues, and many times the research is funded by the
external development agencies which have their own research objectives. Most of the
research on the African cities is overwhelmed with the transport deficit (private or
public) and the over-reliance on long-distance walking. There is little debate about
diversities in the way in which poor people balance their shelter-livelihood-transport
equilibrium because such strategies and practices seem to be rare: in most cases the
poor seem to be stuck with a lack of transport and long distances to commute. A
number of research studies do talk about weak institutional capacities, lax enforcement
or regulations and fragmented planning efforts and suggest prescriptive measures for

55
fixing them, but there is limited coverage of the role and impacts of pro-motorisation
policies or road-building on the lives of the poor.
2.3 Poverty and transport in Indian cities
Transport research concerning the urban population in India is limited and transport
studies of the urban poor are further more limited as there are only a handful of reports
and research papers for the Indian cities. Notably, this is not the case with urban
studies or urban poverty research in general. Most of this handful of transport-poverty
studies represent different Indian cities like Delhi (Anand & Tiwari, 2006), Chennai
(Srinivasan & Rogers, 2005), Mumbai (Baker et al., 2005) and Pune (Astrop et al.,
1996) and some others talk about urban transport and poverty in general for Indian
cities (Badami, Tiwari & Mohan, 2004; Pucher et al., 2005; Badami, 2009). All of these
studies support the above observation that the data on travel behaviour in developing
countries like India is limited and this is especially true for the relatively poor residents
of urban India. Obviously, most of studies leave a rich agenda for future research.
Table 2-1 Mode use in Mumbai (Baker et al., 2005) by income-groups
Category Walking Cycle Local trains
Public bus
Rickshaw+ Taxi
M2W Own Cars
Other’s car
Others Total
Total trips (Sample size 5594)
43.8 3.1 22.7 16.1 1.9 8.5 2.7 0.1 1 100
Trips amongst income group (hh income less than 5000 INR) – Sample size 1195
60.8 6.1 16.1 14.5 1.3 0.7 0 0.2 0.4 100
One of the largest transport studies in the Indian urban context is the World Bank study
of Mumbai (presented as Baker et al., 2005) where they surveyed more than 5000
randomly selected households in different urban zones. Unlike the African or the
American cities, they find heterogeneity in the spatial distribution of households by
income groups and also in the spatial distribution of land use activities. There are no
predominantly rich or poor areas and there are no predominantly residential or
commercial areas in terms of land use. One of the major findings of their survey is the

56
extent to which all income group households (and especially poor households) rely on
walking. In Mumbai, 43.8% of all commuters walk to work and amongst the low-income
group the share is 60.8%. Similarly, 22.7% of all commuters use suburban rail and
16.1% use the buses for all trips, whereas amongst the poor, 16.1% commuters use
suburban rail and 14.5% use the buses.
Table 2-2 Mode use and travel distance in Pune (Astrop et al., 1996) by income-groups
Category Walking Public bus Auto Rickshaw M2W Car Others Total
Low income group (Less than 1250 INR per capita per month)
34 24 10 20 1 11 100
Travel distance – low income group 2 7.9 4 6.9 3.5 - -
Mid income (1251-2500 INR per capita per month)
21 28 9 32 4 6 100
Travel distance – mid income group 1.3 9.5 5.1 8 8 - -
High income (Above 2501 INR per capita per month)
20 8 15 31 22 4 100
Travel distance – high income group 0.9 10.5 3.3 8.1 11.5 - -
Note: The mode share data is reproduced from a bar chart so the numbers are approximated based on a graphical scale.
Even the Pune study (Astrop et al., 1996) finds that distances travelled across the city
are short (4-6 km across all modes) and one-third of the trips were by walking amongst
the low-income groups who were walking for about 2 km on average. Both Mumbai and
Pune case studies show that travel characteristics changes across the income groups.
The higher income groups were relying much more on the private motorised vehicles,
spending more on transport and travelling longer distances. In fact, the Pune study
shows the middle-income group, which depicts the transition between the low and
high-income groups. Both middle income group and high income group rely on private
modes for their commute but in case of middle income group, there is much more use
of the motorised two wheelers whereas the high income groups make more trips by
cars. High and middle-income groups ‘consume’ longer distances in private modes.
Whereas the low-income group end up travelling shorter distance by walking and for
the longer distance they use public bus or motorised two wheelers in Pune.
The Pune study conducted in 1996 was optimistic about improving public transport and
walking-cycling facilities and it only hints towards the rising popularity of motorised two-

57
wheelers, which in particular facilitates the middle class women’s mobility. They also
predicted that the bicycle would continue be an important means of personal transport
for low-income households for a number of years to come. In another decade from
1996, the cities in India started motorizing with the increasing per capita income and
high economic growth after the structural adjustment program in early 1990s. This led
to booming of the automobile sector and proliferation of motorised vehicles in the cities.
The impacts of the proliferation of traffic in the Indian cities are well captured in the
government reports and academic studies.
Pucher et al. (2005) is particularly apocalyptic about the urban transport ‘crisis’ in
Indian cities and this paper lists every possible transport problem in Indian cities like-
‘levels of congestion, noise, pollution, traffic fatalities and injuries, and inequity far
exceeding those in most European and North American cities’ and further ‘low
incomes, limited and out-dated transport infrastructure, rampant suburban sprawl,
sharply rising motor vehicle ownership and use, deteriorating bus services, a wide
range transport modes sharing roadways, and inadequate as well as uncoordinated
land use and transport planning’.(Pucher et al., 2005;p.185)
Such list of ‘problems’ with the Indian transport sector often follow policy prescriptions
to fix them. Whilst not true of Pucher, many transport experts however pre-suppose
both transport problems and solutions without the support of evidence-based research,
and seek to convince policy-makers about the ‘crisis’ leading to solutions, which are
often automobile-centric. For example, if a wide range of modes is sharing the
roadways then to what extent is it a problem and to what extend is it a ‘shared space’
solution. Is the slow-moving traffic always a problem when traveling distances are quite
low in the Indian cities? As another example, more coordinated land use and transport
planning may lead to making the transit corridor more expensive for the poor to occupy
and open these corridors for the high-income groups which are not the captive public
transit riders. Many of these issues require careful research and clear policy objectives
so that they do not end up pre-empting certain kinds of solutions, which are popular

58
amongst technocrats or bureaucrats. The over-whelming transport chaos in Indian
cities often overshadows what needs to be retained and maintained as sustainable
practices, many of which may not have emerged out of the formal, coordinated,
organized efforts of urban or transportation planning.
In 2008, the Ministry of Urban Development published a report based on data from 87
major Indian cities, which presents the macro picture of urban transport trends.
Amongst many other findings, the report shows that 30% of cycling trips in 1994 have
been reduced to 11% by the year 2008. Similarly, the share of walk trips in the city
level modal split is also reducing across cities and the proportion of roads with
footpaths in most cities were reported as less than 30%. The municipal or urban bus
fleets are reducing in most cities and there are instances of inadequate public transport
in most Indian cities (Badami & Haider, 2007). The private motor-vehicle ownership
and use are increasing exponentially (12% per annum) but absolute car ownership is
still significantly low for any of the Indian cities (as per table 2-3 below) compared to
developed-country cities (approximately 500+ in Europe and 700+ in the North
America). However, this situation is going to change (as discussed in section 1.2) and
the proliferation of the private motor vehicles is projected to increase exponentially in
next few decades.
Table 2-3 Vehicles per thousand population in Indian cities
It has been established by the city level studies of Pune, Mumbai, Chennai and Delhi
that the trips by the urban poor are mainly by walking, cycling or by using public
Unit Ahmedabad Bangalore Chennai Delhi Jaipur Mumbai Pune Surat
Area in Sq. Km. 466 1,279 1,189 1,483 288 4,355 700 312
Population in millions 2011 5.5 8.4 6.8 11.0 3.1 12.5 3.1 4.4
Vehicles/1000 pop
2w/1000 pop 316 233 181 238 304 30 288 437
4w/1000 pop 55 50 45 117 55 24 48 55
Note: The area and population are from 2011 census. The vehicle ownership is based on Embarq (2008)

59
transport. And all of these modes are facing problems resulting from the growing
private motor-vehicle activities. Badami, Tiwari & Mohan (2004) observe how low
income groups and the urban poor are affected by various transport impacts
disproportionately. They are ‘vulnerable road users’ as the majority of the victims of the
road fatalities being the pedestrians or the cyclists. There are many Delhi based
studies by Geetam Tiwari, Dinesh Mohan and others who have provided empirical
evidences capturing the vulnerability of the poor as marginalised road users (Tiwari,
2001; Tiwari, Arora & Jain, 2008; Tiwari, 2011; Mohan, 2002, 2003, 2004). In the case
of air pollution, the poor often suffer the highest exposure, since many of them
(including infants, the old and the infirm) live and work on the road-sides, where air
pollution levels are typically higher than farther away. And because the poor are in
marginal health, and lack adequate nutrition and medical care, and so are least
capable of coping with the impacts of air pollution.
Residential location of the poor emerges as a major factor influencing their mobility.
The Chennai study (Srinivasan & Rogers, 2005) also finds that centrally-located
settlements were more likely to use non-motorized modes for travel (walk or bicycle)
than were the peripherally-located residents for whom long-distance commuting is a
burden on household budgets. Baker et al., (2005) grapples with the question of
whether the lack of accessibility to public transit is a barrier to the mobility of the poor
and whether limited mobility keeps them from obtaining better housing or better jobs.
They termed it a ‘difficult question to answer’ but went on to argue that transport is less
of a barrier for the poor living in central Mumbai than for the poor living in the suburbs.
Most of the poor living in central Mumbai travel less than three kilometres on an
average per trip. ‘Short travel distance is less of a barrier for the poor’ is an incomplete
argument based solely on the quantitative data. This study doesn’t capture any of the
lived experiences of commuting or how do the poor negotiate their short distances viz
their other daily needs. Further, what do they end up giving up to manage shorter
distance in a city like Mumbai. Barter (2004) argues that one reason why the poor

60
locate themselves at sites with insecure tenure is the higher accessibility of slum
quarters near the centres of employment in the city. Affordable sites with more secured
tenure may not be accessible or involve high costs of commuting. Or because these
sites are not easily accessible, they remain more affordable. Limited mobility resulting
from limited affordability becomes one of the reasons that would force them to squat in
slum quarters near the job centres in the city to minimise their exclusion by trading off
between quality of life and security of tenure while retaining high access to the city
(World Bank, 2002).
Barter warns against the tendencies in some of the research in the developed world to
argue for greater car access for the poor, because it is possible that simply trying to
increase mobility in general would result in no net benefits for the poor and could even
harm their access levels in the longer run. Increasing mobility may also mean allowing
more and more traffic on the road, building more roads, providing more parking and
letting cities to spread out more. In fact, the developing world has a history of the
higher income groups enjoying policy perks (such as automobile-friendly infrastructure)
given out ‘in the name of the poor’ (Vasconcellos, 2005; Badami, 2009). Markovich &
Lucas (2011) present this in other words as a ‘paradox of transport’ for marginalized
groups within society; they are more likely to experience disadvantage as a result of
lack of access to transport (both public and private); yet when access increases at an
individual level (such as in the case of higher vehicle ownership), or at an aggregate
level (such as when low income communities are in close proximity to transport
facilities), they still end up experiencing disadvantage due to multiple reasons including
affordability. More mobility for general population by investing in vehicle-friend
infrastructure may not always result in accessibility for the urban poor or the
marginalized groups in the society. Recognition of and engagement with this paradox
can help policy makers move towards more equitable transport networks and plans.
Yet, it is only through better understanding of the complex and nuanced nature of the
social and distributional impacts of transport that these wider equity objectives will be
61
achieved. But unfortunately, we do not have a basic understanding (at least in India) of
how transport problems contribute to their possible deprivation or how deprived people
deal with their limited mobility or limited transport options.
In the study of low-income populations, it is often assumed that urban travel is an
indicator of well-being. The main question here is how do the urban poor negotiate
their ‘constrained’ or ‘limited mobility’? Do they manage to achieve high accessibility in
spite of affordability barriers? Or does their constrained mobility mean their deprivation,
as has been observed in many other countries. Limited or constrained mobility means
fewer out-of-home activities, less ability to search for and maintain employment, and
lower capacity to seek higher quality goods at a lower price. But if the urban poor with
limited mobility are retaining higher accessibility then does it mean that the poor are
more efficient urban commuters? It is possible that they are accomplishing more with
less travel. If the poor tend to make fewer kilometers of travel than the non-poor, would
this enhance their ability to meet their daily needs? This is the same question, which
puzzled the DFID researchers while studying the urban mobility of the poor in Kolkata
(Jacobs, Maunder & Fouracre, 1981).
"… low-income groups in Third World cities make little use of motorised private transport with few trips made for purposes other than to and from work and, to a lesser extent, education… more work needs to be done to determine whether or not this is a function of their 'lifestyle' or whether they are unable, for financial reasons, to make important journeys."
The current section demonstrated that this question is largely un-answered after 33
years of all the urban/transport research in India. This is one of the main debates that
this thesis wants to engage in regarding the accessibility issues or constrained mobility
issues of the poor. Besides this, there are three other important issues which have
emerged about the mobility of the urban poor - namely the issue of differential
mobilities within the poor, the role of transport supply or governance and mobility
aspects linked with moving out of poverty. These are briefly described below:

62
2.3.1 Differentials within the Poor – the gender issues
Based on the literature on the mobility of the poor in the developing countries, ‘gender
emerges as an apt social category to understand the differentials within the poor. A
number of studies in the African context (Porter, 2008b; Salon & Gulyani, 2010; Venter
& Vokolkova, 2007) and in the Indian context (Astrop, 1996; Srinivasan & Rogers,
2005; Anand & Tiwari, 2006) have argued that the burden of limited mobility is borne
disproportionately by women and children. The studies conducted amongst low-income
residents of Pune, Delhi and Chennai illustrate that considerable differences exist
between males and females in terms of access to and the use of the various travel
modes on offer. In household budgets, the cost of the main breadwinner’s trip to work
is prioritised which sometimes means that trips made by women, the elderly or the
young, (for schooling or health services) may be sacrificed or rationed. The working
poor women have to work within specific work times, as their priorities are safety and
security. The Pune and Delhi studies also illustrate that women spend more time
travelling on slower modes of transport to access work; the faster modes are more
expensive or prioritised for the male members of the family. Their time poverty
demands they look for work at shorter distances from home. Does it mean that
women’s ability to contribute to the alleviation of their standard of living and their status
in society is severely curtailed by their limited mobility and the constrained accessibility
to the transport system of the city?
The social identities of transport users are deeply embedded in social relations and
practices, which are played out in public spaces (Levy, 2013). Geographer Robin Law
through her works (Law, 1999, 2002) has argued over the years that the concept of
gender used in transport research is often one-dimensional, with the focus on
gendered variations in behaviour rather than on gendered meaning and identities. The
gender and age aspect of ‘limited mobility’ of the poor requires further exploration given
the thin spread of research in this area.

63
2.3.2 Transport supply and the governance issues
One of the crucial aspects of urban poverty in India and elsewhere in the developing
world is the role that the transport system plays in preventing or enabling the poor to
access resources for everyday life. Efficient mobility, or the lack of it, profoundly affects
individuals and access to minimum infrastructure services is one of the essential
components of personal welfare. The urban mobility opportunities of individuals
depend on increasingly complex and dynamic sets of economic (i.e. financial
accessibility to urban transport services), cultural (with ethnic, gender and ‘motility’
components) and political (i.e. political regimes underpinned by different policy
discourses) factors. Multiple potentials are embedded in urban mobility, which is not
only a key to access to work, education and health, and the social mobility of
individuals, but also provides ‘a channel’ to social interaction, the integration of urban
society and the political activisation of citizens across urban space (Miciukiewicz &
Vigar, 2012).
Improvements in transport, which are mainly the responsibility of city governments, not
only provide people with more convenient access to a broad range of socio-economic
opportunities, but also have strong income effects by lowering transport costs and
hence the prices of consumer goods and services. Providing or not providing transport
is a political choice, which gets filtered through institutional capacities, financial
situations and public perceptions and demands. The emergence of new streams of
inquiry in transport studies in the last decade that innovatively link urban mobility to
broader social issues have not been yet translated into practice and public policies
(Miciukiewicz & Vigar, 2012). The transport policy-making and its implementation still
rely mostly on single-modal, technology-led quick fixes and it is more so in developing
countries.
There is a need to expand the debate about the mobility of the urban poor in
developing countries from being ‘the vulnerable road user’ or ‘the disadvantaged

64
commuter’ to ‘the disadvantaged citizen’. The idea of citizenship brings in the political
and governance context including issues like provision of housing and basic services,
employment, participation in urban processes and the stakes of the poor in
infrastructure investments. Public policies and governing institutions have an important
role to play in the alleviation of poverty. Mobility of the poor and their choices operate
within a context of the city and its governing institutions as the context constrains
mobility choices (Uteng 2009). And thus, it would be useful to see whether the
transport policies and projects in an urban context facilitate the urban poor’s mobility
needs and how the poor cope up with transport constraints. There have been massive
investments in the urban infrastructure in Indian cities and it is a timely debate in policy-
making whether these investments are used for the betterment of everyone in society.
Specifically, this thesis intends to contribute to the discourse of inclusive urban
transport in Indian cities where increasing transport-related investments and policy
regimes are promising many changes in the existing urban transport systems.
2.3.3 Dynamics of poverty
Unable to access economic activities, poor people remain on the fringes, work for low
wages, sell in small quantities at low prices, unable to compete or to accumulate
assets. Because they remain so close to the poverty line, a sudden shock — typically a
death or illness — can wipe out years of modest progress. ‘Moving out of poverty’ – a
study carried out by the World Bank Group (Narayan et al, 2007) - focuses on the
dynamics of poverty reduction, as opposed to trying to measure poverty incidence
alone. The study argues that net poverty rates are the product of two contrasting
phenomena: movement out of poverty and falling into poverty (see figure 2-1). The
reasons for ‘moving up’ and for ‘falling down’ are different. For moving up, initiatives
and opportunities are important, whereas, to prevent falling back, the ‘social safety-net
approach’ is required based on welfare or policy interventions. The World Bank study
does not talk about the welfare approach, as it is a mis-fit into the neo-liberal

65
framework of the bank. As far as the mobility of the poor is concerned, there are two
challenges: one, their mobility (or capacity to move) should facilitate their initiatives and
opportunities and two, they should be part of (or a beneficiary of) policy interventions,
specifically in the transport sector. Mobility (more specifically motility) is important for
the poor households to ‘move out’ of the poverty.
Figure 2-1 Pathways to move out of poverty by Narayan et al, 2007
The constraints of mobility in everyday life limit participation in the way that the low-
income population has traditionally participated in an Indian urban society: their current
levels of mobility might be seen as sufficient for fulfilling their expected roles as low-
skilled workers, students in poor-quality schools or full-time house-managers. But when
a change in these roles is demanded, when workers ask for quality free time or skill
building opportunities, or house-managers start looking for a job, these demands are
necessarily limited by their incapacity to reach the locations these new activities would
Moving Out of Poverty
Material well-being Power and rights
Individual agency, aspirations, and initiatives
Economic opportunity
National policies
Local economy
Economic fairness
Democracy
National elections
Local politics
Political fairness
Collective action
Collective and cooperative endeavors
Collective action
Social capital and civic engagement
Social stratification Social stratification

66
demand. Their very limited motility determines their mobility and thus, new
opportunities to move out of poverty would be limited. Unable to access economic
activities, poor people lurk on the fringes, work for low wages, sell in small quantities at
low prices, and are unable to compete or to accumulate assets. Because they hover so
closely above the poverty line, a sudden shock — typically a death or illness — can
wipe out years of modest progress. Mobility - more specifically ‘motility’- the ‘capital’
available to move or travel (Kaufmann, Bergman & Joye, 2004) is important for those
poor households seeking to ‘move out’ of poverty. There is a need to conceptualise
and explore both parts of moving out and falling back into poverty from the transport
perspective – how to view the mobility constraints of the poor and how the governance
or more specifically the transport supply of a city deal with it.
2.4 Theoretical model of mobility-poverty linkages
There are significant gaps in our knowledge of the travel behaviour of the poor
population that take us beyond their mobility disadvantage in Indian cities. There are
also conceptual limitations in thinking about poverty and mobility together at large in
developing countries. At a very fundamental level, this thesis intends to go beyond the
urban travel patterns of the poor, discussing how poverty plays out while negotiating
mobility options and how mobility options determine the wellbeing of people – moving
out or falling back into poverty. Most of the academic literature related to the mobility of
the poor in India details what their mobility patterns are, as these studies are
concerned with how to improve the access levels for the poor. And rightly so, these
studies are studies of ‘travel behaviour of the poor’. Behaviour change and demand
management strategies typically overlook the reasons why people use resources, how
these ‘needs’ and ‘wants’ are constituted, and how they are changing within the
broader context of everyday life (Strengers & Communities, 2010). So the travel
behaviour studies of the urban poor do not necessarily link living in poverty, and being
in an informal job and/or housing market with their mobility pattern or practices. There

67
is a growing literature in transport studies that is critical of the proposed transport
solutions of hypothetical future conditions, based on forecasting social and economic
variables, adopting market and efficiency paradigms and targeting mobility as a prime
objective (Vasconcellos, 1997b; Dimitriou, 2006; Cox, 2009; Avineri, 2012; Levy, 2013;
Mohan, 2013).
Accessibility studies have emerged in transportation planning as useful alternative to
mobility-centric paradigm which has adverse impacts on sustainability and social
equity. Access is the goal of transportation planning and not mobility per say (Litman,
2014). Envall ( 2007) suggests that ‘planning for accessibility’ is a process that allows
for mobility as well as non-mobility improvements to be implemented as a solution to
insufficient accessibility. Accessibility is a useful concept that is sympathetic to the
transport issues of the disadvantaged population and provides tools for planning for
them. However, measuring accessibility may not allow scope for thinking about poverty
and mobility together. Achieving a certain level of access may be justified from the
transport lenses as it eliminates transport as an immidiate ‘problem’ from the lives of
the poor but it may not eliminate poverty as their living condition. Especially when living
in poverty may mean that the ‘transport problem’ doesn’t go away and it reappears in a
new way with changing circumstances. So measuring the access levels may not
answer the poverty-related question of building long-term resilience.
This thesis wants to carefully chart away from either being solely a travel behaviour
study linked with possible remedies or accessibility-measurement study again linked
with accessibility plans. It is important to ask ‘why’ the poor practice their mobility in a
certain way and how these practices are influenced by their own efforts to deal with
poverty. Their own efforts of dealing with poverty would also mean that they are
accessing what they want to access. Besides, there is also a rich agenda in unpacking
and deconstructing the ‘high level of access’ and exploring the dynamic relationship
between mobility and poverty. There is a value in asking why and how the poor

68
practice a certain kind of mobility, as it will give a voice to the efforts of the poor
themselves.
The idea of ‘mobility practices’ is to expand the context and link it with the notions of
poverty, which is the main theoretical departure of this thesis. The conceptual
framework of social practices is employed here for building theory and for debating how
people deal with poverty. Mainly based on the structuration theory by Anthony
Giddens(Giddens, 1986), the concept of ‘practice’ is being articulated in emerging
literature in diverse fields. Giddens makes the point that the day to day activity of social
actors draws upon and reproduces structural features of wider social systems. Human
activities are shaped and enabled by structures of rules and meanings, and these
structures are, at the same time, reproduced in the flow of human action. This flow is
neither the conscious, voluntary purpose of human actors, nor the determining force of
given social structures. The flow of largely routinized social life depends on forms of
practical knowledge, guided by structural features – rules and resources – of the social
systems which shape daily conduct.
Based on Giddens, ‘social practice theory’ is being put to new use by (Shove, Pantzar
& Watson, 2012) and others (Strengers & Communities, 2010) in the areas of
transport, consumption, energy use and other built environment practices. This thesis
focused on ‘mobility related social practices’ (termed as ‘mobility practices’) instead of
all practices in the everyday life of the poor. For practice theory, the nature of social
structure consists in routinization. Social practices are routines: routines of moving the
body, of understanding and wanting, of using things, adapting to the built environment -
all interconnected in a practice. Practices are established ways of doing things, which
change or get replaced over a period of time. They are being produced out of the
interactions between the given materials, individual know-how (competence) and
(social) meaning (Shove, Pantzar & Watson, 2012). Any form of change or continuity of

69
practices needs to be understood and placed within these connections. Connections
between these three elements shift and vary over time.
Figure 2-2 Constituents of mobility related (social) practices
To give a practical illustration, the practice of hand-cart pulling consists of complex
amalgam of carts, its making, street spaces where they move and bodily competencies
required to pull the cart; norms of where and how it negotiates space on roads with
other vehicles; embedded meaning to practitioners based on their social identities –
who pulls the cart and who doesn’t and what does it mean to them. For a family, a
hand cart is a resource, it requires bodily competencies to pull it across the city and
there may be masculine or feminine identities formed around the practices. The
practice of hand-cart pulling endures through countless recurrent enactments. The
resource (cart), competencies (pulling it), social meanings together shape the practice
of hand-cart pulling and its continuity. These three constituents are often overlapping

70
and mutually reflective categories. This example is only to demonstrate the possibilities
of open-ended and all-round analysis based on this conceptual approach.
Vincent Kaufmann and others gave an important concept of ‘motility’ as a capacity for
movement or movement-potential (Kaufmann, Bergman & Joye, 2004; Flamm &
Kaufmann, 2006). The motility concept relates to notions regarding accessibility.
Accessibility is the measure of a place’s attractiveness in relation to its potential
opportunities. Motility differs from accessibility by focusing on the logic of an actor’s
actions, in particular the reasons behind the choice of tools and localisations, without
being concerned with an action’s maximum utility. In this sense, motility concentrates
more than accessibility on how an actor builds his/her relationship with space and less
on the possibilities offered by a given territory. While operationalising the concept of
motility, three groups of factors are given namely access, skills and cognitive
appropriation. These factors are not too different from the constituents of social
practices in the same order (access to) resources, (skills or) competencies and
meaning (or cognitive appropriation). In the same way as ‘motility’, mobility related
social practices promise to explore individual strategies to maximize the utility of
transport gains. Given the similarities between the two concepts of motility and social
practices, the learnings from the both are combined in this thesis.
The practice-based approach allows a broad base compared to the conventional
‘behaviour change’ kind of frameworks based on individualistic psychology as it allows
the wider framing of activities at a societal level. By focusing on the practice of travel, it
may be possible to identify measures that shape current practices and reconfigure
them through to adapt to the built environment. The social life of poor people is a
constant struggle to construct life out of available resources in the face of economic
constraints and this is also reflected in the way they move around in the city. By living
in a society or a community structured by such constraints and organised by
‘successful’ practices, one develops predispositions to act in certain ways. It gets

71
locked in through social sanctions or aspirations or it helps to develop new capabilities
or competencies.
The practice-based approach allows flexibility in understanding changes in time and
space and there is also a scope of articulating strategies of survival or prosperity based
on their practices. The practice-based approach can be posed in contrast with the
system-based approach, where a system is pre-supposed (such as a transport system)
and the individual practices are viewed as ‘fitting in’ to the corresponding parts of the
system. Sometimes, if certain practices don’t fit into the system at all, then they are
excluded from the analysis and developing knowledge about the system5. Ideally, ideas
around system design or systemic policy matters should be informed based on the
existing practices instead of pre-supposing a system by aggregating and molding
practices to suit the system based thinking. There is a prospect of developing an
explicitly practice-oriented approach to public policy, for which there is firstly, a need to
recognise practices even if it is difficult fitting them into any dominant paradigms,
values or ideologies.
The researchers employing ‘social practices theory’ like Elizabeth Shove (Shove, 2005;
Shove & Walker, 2010; Shove, Pantzar & Watson, 2012) and others (Warde, 2005;
Strengers & Communities, 2010) are mainly concerned about social production of
climate change issues and aspire to transit to low-carbon or carbon-neutral
communities. The social practices theory helps in conceptualizing either retaining or
governing transitions to more sustainable practices. This thesis is using the social
practices theory to understand interactions between poverty and mobility where
mobility of poor is seen as practices around low-affordability. Here, the possible change
in practices means moving out of poverty or falling back into it. It is a useful approach
for this study because it is open-ended and flexible to include various practices and its
5 An example here is the exclusion of walk trips during the transportation modelling exercise to focus on
the analysis of all motorised trips: not being part of analysis would tend to support the idea that there may not be any need to ‘do something about them’, such as developing pedestrian networks.

72
mobility implications. This approach also allows various differential mobilities to be part
of this discourse. Importantly, this approach is a reliable structuring device to analysis
of the empirical data in this thesis.
Figure 2-3 Conceptual model of mobility-poverty nexus
For this thesis, transport-based mobility is seen as negotiating practices and weighing
consequences within the marginalized socio-economic context and informal housing
and job markets. The figure 2-3 assimilates and presents all the conceptual model of
Mobility related social practices
Resources
Competencies
Meaning Balancing between long-term and
short-term equilibriums
Mobility
Conceptual model of mobility related social practices to
understand mobility – poverty nexus
Enables / prevents / influences
Poverty/
Poor people
Distance
Mode
Time/Cost
Work – employment location/
opportunities
Planning /governance/
participation
Shelter, services,
location
Key debates
Affordability (time-cost), transport efficiency, social exclusion, spatial mis-match, peripheral poverty
Mobility viz. Accessibility (low mobility and high-accessibility or vice versa), constrained mobility, motility
Motorisation (in developing countries) and sustainable mobility agenda
Politics of mobility /of
transport supply,
housing relocation
policies, planned
illegalities
Gender or other
differences in terms of
accessing the city, right
to the city, right to the
mobiity
Disadvantaged citizen
not disadvantaged road
user, political society –
Informality, survival
through subversions,
occupancy urbanism

73
mobility and poverty interactions, which speculative and hypothetical as it needs to be
tested with empirical data. The mobility issues in transport studies are defined by key
characteristics like travel cost, time and distance and the mode usage. Given the
circumstance of Individuals, they try to find a balance between available mode, costs
involved, travel distance based on these short term decisions. These characteristics
are seen in the wider debates in transportation studies such as affordability of the
disadvantages population, constrained mobilities and level of accessibility. Finally, the
structural issue of societies transiting through the phases of motorization. Regarding
urban poverty in India, there are larger debates of informality, right to the city,
competing visions of urban development and contestations over space and resources.
The issues related to poverty are characterized by housing and its location, livelihood
options, available infrastructure, participation and political governance issues.
Interactions between these factors govern the poverty situations.
An Individual’s mobility practices are reflections of short-term and long-term decisions.
Short-term decisions of individual trip details are linked with long-term decisions of
location of livelihood and housing viz. available transport infrastructure and its supply.
Individuals try to achieve some balance in their long-term and short-term decisions for
their own well-being. Mobility related social practices reflect these interactions and
negotiations between the long-term and short-term decisions. This thesis maps and
documents mobility-related social practices termed as mobility practices. The following
conceptual diagram presents the grounds of this thesis and here, mobility based social
practices emerge as conceptual tools by which empirical data would be analyses in the
contexts of the listed debates.
2.5 Towards the research questions
The main research questions are linked with the conceptual diagram presented in
Figure 2-3. This thesis intends to ask ‘how do the urban poor negotiate their mobility
practices?’ This question creates a scope of going in-depth into the issues of ‘limited

74
mobility’, ‘high accessibility’ and strategies to deal with transport related mobility. To
answer this question, there will be a need to first establish the mobility pattern of the
poor in the city. In the absence of any national level travel datasets or any other
transport statistics, the mobility pattern of the poor needs to be studied as part of the
larger question of ‘negotiating their mobility practices’. Secondly, as discussed earlier
the urban poor are not a homogeneous group and there are differentials levels of
transport disadvantages may be experienced on the basis of gender, age or any other
social categories. The mobility pattern of the poor should specifically represent the
differentials within the larger group.
The issues of urban poverty alleviation are discussed earlier in this chapter but
‘sustainable mobility’ issues require some careful consideration here. There is a strong
relationship between the income of a household and their travel behaviour, especially
mode choice (Dargay, 2001). Since income is the dominant determinant of individual
travel behaviour, more trips per person, longer average trip distance, and faster and
more comfortable modes of transport are all associated with rising incomes. The
continuing hegemony of private motorisation over the rest of the public or non-
motorised modes in the city makes the poor stretch their budgets to own a motorized
vehicles (Gakenheimer, 1999; Pucher et al., 2005; Vasconcellos, 1997a). In other
words, the low-income households in developing world are giving up their low-cost,
zero-carbon modes and choices to more expensive, more-carbon emitting modes and
choices. Should motorisation amongst the low-income groups be credited as crucial
asset building or a failure on the part of the state to provide for efficient and sustainable
public transport? This represents a critical yet largely unaddressed tension in the
sustainable mobility paradigm – how to deal with continuing motorisation of the low-
income groups who with rising income are aspiring to own vehicles replacing their more
sustainable but currently disadvantageous practices. The present thesis intends to
engage in the debate related to urban poverty alleviation without losing the focus on
sustainable mobility and the climate change challenges.

75
Finally, the questions discussed have potentials to discuss the question of ‘poverty and
transport’ beyond the Indian urban context and this discussion can contribute
international discourses on urban poverty alleviation and sustainable mobility. This
thesis will also attempt to theorise and summarise the learning from a specific context
to be applied to the larger international discourses. There are two important aspects of
looking at mobility and poverty in the international literature context.
One, the mobility practices of the urban poor have to be placed in the larger context of
urban citizenship by finding out to what extend the urban governance and specifically,
transport supply facilitates the practices of the poor. There is a need to expand the
debate about the mobility of the urban poor from being ‘the vulnerable road user’ or
‘the disadvantaged commuter’ to ‘the disadvantaged citizen’. The idea of citizenship
brings in the political and governance context including issues like provision of housing
and basic services, employment, participation in urban processes and stakes of the
poor in the infrastructure investments.
And two, the ‘negotiating mobility practices’ are being discussed here essentially to see
how shelter-livelihood-mobility linkages are being worked out by the households and
how these linkages help or do not help in moving out of poverty. All these different
trajectories will be useful in unpacking and discussing various parts of the main
question of negotiating the mobility practices for the urban poor.
Based on the literature review and the discussion above the research questions are
developed and listed in Section 2.5.1.

76
2.5.1 Research Questions
1. How do poor people in a large developing-country city negotiate their mobility
practices and transport opportunities?
a. What are the mobility patterns of the urban poor?
b. How are those patterns negotiated by different sub-groups within the poor
based on e.g. gender, livelihood or varying locations in a city?
2. How do findings about the mobility and accessibility of this group of urban poor
inform policies for poverty alleviation and sustainable mobility?
a. To what extent does the city’s transport system facilitate or constrain the
mobility and accessibility of the poor?
b. How do mobility-related negotiations influence aspects of moving in and out
of poverty and how can they be supported by policy?

77
3. Research Strategy and Methodology
This chapter presents the rationale for the methodology design for the collection of
empirical data in this thesis. This chapter provides a critique of the methods available
to the researcher, identifying the most appropriate to the delivery of the research
questions. The research questions addressed in this thesis have been presented at the
close of the previous chapter 2. The present chapter explains how the research
questions have dictated the form of the research methodology. First, this chapter
presents the overarching research strategy, including a discussion of epistemological
issues, an explanation of the mixed-methods approach adopted in this thesis, and a
strategic summary of the sequence of empirical data collection.
3.1 Research design and key strategic decisions
As discussed in the previous chapter, this research is concerned with exploring the
mobility practices of the urban poor in a specific Indian city. Currently, the analysis of
mobility pattern and practices of the poor with its subjective values is not well captured
for Indian cities as discussed in Chapter-2. There is a strong argument that the
interlinked aspects of mobility and poverty are currently under-researched, and further
that there is little discussion about these aspects in the realm of public policies. The
following sections discuss the theoretical approach adopted in this thesis, and present
the research strategy, which has been designed to collect the empirical data necessary
to address the research questions.
Transport studies have traditionally been allied to the positivist approaches developed
in the physical sciences, conceptualising structures of mobility as systems, which can
be measured objectively. However, one important theoretical pathway in this thesis is
about understanding the ‘systems’ on the basis of practices and not the other way
around. This is essentially a bottom-up approach. Especially, how do individuals
experience their mobility and negotiate its practices and these are inherently subjective

78
discussion. Besides, as per the discussion in the previous two chapters, the
conventional transport studies have been critiqued for ignoring the human aspects
while being obsessed with the narrowly economic efficiencies.
Flyvbjerg (2001) has questioned whether the pursuit of objectivity is even desirable in
the context of social research – which by its nature explores societies, people, and
their differing values and norms. But this is not to say that that the functionality of the
measured objectivity is reduced in any way. Without going into the discussion of how
‘objective’ is the objectivity, the measured objectivity could be a good starting point to
place the subjective narratives and to discuss the human negotiation, subjective
adaptions and subversions of the (transport) systems. Measured objectivity could lay
down the frames, which could be modified and twisted with the subjective
interpretations. This thesis argues that the frames are required as much as the twisting
of them.
The first research question is about ‘negotiations of mobility practices’ being
understood and reinforced by two important aspects; first, the mobility patterns of the
population sub-group (based on their income and assets) and two, the mobility patterns
of the sub-groups within based on social or geographical categories. The data require
to answer this questions would span out into the quantitative and the qualitative
methods. Because the terms such as ‘negotiations’ are set out to be explored by
subjective narratives and interpretations whereas the terms such as ‘pattern’ are
analysed through quantitative data. The motivations to research about ‘negotiations’
come from the post-colonial urban studies, which is an inter-disciplinary and post-
positivist discourse. Whereas ‘patterns’ are very much part of the mainstream transport
research. Including the mobility patterns in a quantitative way as part of the primary
data in the context of the Indian cities is also crucial given the absence any public data
sets such census or any other academic studies available on the same.

79
As this thesis spans a number of academic disciplines, it is believed that there are
advantages to drawing on a variety of overlapping traditions and thus, a pragmatic and
mixed approach should be adopted. This thesis represents a philosophical position
between the extremes of a pure positivist approach and a pure constructivist (or
interpretivist) position, and in some ways bridges the divide between the two. A critical
realist position as articulated by Roy Bhaskar in (Bhaskar & Lawson, 2013) accepts
that there is an independent reality that exists outside of subjective interpretation, but
also that there is a distinction between objective reality and our knowledge and
interpretation of it. This research recognises that there is a need to balance the two
and find a pathway, which chart away from the fallacy of either being overtly positivist
or being overtly interpretivist. This partly reflects the tradition of transport and urban
planning research: this is an applied field, benefitting from public funding, and
orientated towards informing policy and practice. And on the other hand, this research
wishes to employ the knowledge generated by the post-colonial urban studies and
thus, it is viewed to be the part of the these debates which are relevant for the Indian
and other developing contexts. Besides, a pragmatic and mixed approach is also
crucial for the wider public dissemination and acceptability of the findings of a research
initiative such as this.
Both ontologically and epistemologically this research displays multi-faceted realities,
resulting from concepts of ‘mobility’ and ‘poverty’. Poverty is historically imagined to be
from being a culture, a state of mind to a trap or imposed structural condition. As
discussed in Chapter 2, these conceptions would also sway between the right and the
left sides of the political ideologies. And the notion of mobility is also expanded from
being physical movement to the movements of communication and technology
including the text messages. Poverty may be experienced differently to different people
and so are the characteristics of one’s mobility. And it is the same case with the
mobility. However, for this study the definition of mobility is restricted to the physical
movement of people through various modes.

80
In adopting a critical realist position this thesis recognises that the transport
infrastructure in a city operate and exist independently of a particular individual’s
interpretation or experiences of it and it can be studied in an abstract manner divorced
from any physical realities. However, there is a lot of value in focusing on the ways in
which the users apply subjective meaning to their experiences of this system and the
manner in which they turn, twist the system for their own use. In their usage and
negotiations with the system, they might bring in attitudes, which may expand the very
definition or the outreach of the system. This may help to view the system itself
differently.
In order to operationalise the critical realist position, this study has adopted ‘inductive
research strategy’ as described by Blaiki (2000). Inductive research strategies promise
to ‘build theory’ following the data analysis. Since there is a clear academic gap in
theorising the mobility of low-income groups and given the data gaps in the Indian
context, an inductive strategy is the most appropriate for this study. Obviously, there
are no hypotheses to be deduced about the mobility of the urban poor. There are
several theories conceptualising poverty but, again, the links with transport or mobility
are not clearly established. In the absence of such theories or clear conceptual
frameworks, the deductive approach is not possible. This makes the inductive
approach more relevant here. This requires stages such as accumulation of data,
inductive logic formation and instance confirmation leading towards inductive research
strategy (Blaiki 2000). The inductive research strategy is a ‘default’ research strategy
for the research process of the present research, which has been full of exploration
and deviations from the pre-assumed paths, both, in terms of the methods and the
analysis.
The nature of the knowledge that is generated by the research process have explained
that the values held by the researcher (and the value judgments that researchers
make) are deeply embedded in the methods chosen, the questions that are asked, and

81
thus also in the knowledge that is generated (Flyvbjerg, 2002, 2004; May, Burke &
Centre, 2010). This thesis recognises the role of the researcher in generating findings
through their intellectual engagement with the data, and hence their influence upon the
knowledge that is produced. Hence, the knowledge that has been generated
represents the researcher’s interpretation of the subjective meaning that poor people
ascribe to their mobility in a city. The researcher is not simply “gathering”
interpretations and understandings which already existed in the participants‟ minds,
ready to be retrieved in response to neutral questioning, but also encouraging them to
think about their own and other people’s mobility in ways which they had not
necessarily done before. The researcher uses this knowledge to gather more
interpretation and more insights from the next person. The methods and knowledge
base are constantly evolving, as it is getting more and more informed in the process.
The later interactions with the respondents become more nuanced with the wider base
of knowledge. Given the nature of such study, the inductive research strategy is the
most appropriate one.
3.1.1 Mixed-methods
Reflecting on insides discussed previously, it is therefore necessary to consider what
types of data are appropriate to exploring the mobility practices of the poor. This thesis
incorporates qualitative and quantitative data through the mixed-methods. This
purposive contrasting of data through the mixed-methods shows two perspectives on
the same subject, almost like parallel dimensions; in some respects the datasets
support one another, and yet in others they assert contrasting explanations. The first is
that social experience and lived realities are multi-dimensional and that our
understandings are impoverished and may be inadequate if they are viewed only along
a single dimension. There is a need for methodology and methods that open
perspective to the multi-dimensionality of lived experiences. And that’s why mix-
methods approach is more beneficial for the current research.

82
The advantages of the mixed-methods approach are that the weaknesses of one
method may be compensated for by another, creating complementary strengths and
non-overlapping weaknesses (Brewer et al 2006, Blaiki 2000). Quantitative analysis
would also be useful in determining some of the basic characteristics of mobility pattern
such as trip length, mode usage, time and cost implications etc. Given the complete
lack of data on the mobility of the poor at the city level, the primary function of the
quantitative analysis is to establish the mobility pattern of the poor. In addition,
quantitative surveys will be used to validate and synthesise the claims of qualitative
analysis.
The focus of this study is to understand how poor people negotiate with the situations
related to their mobility and such negotiations can only be captured through detailed
qualitative component. The qualitative data collection based on individual interviews is
employed here to understand the nuances of short-term decision regarding mode or
route and long-term decisions such as residential location and job changes etc. An
important feature of qualitative interviews is their ability to explore information in depth
cumulatively building on previous knowledge rather than adhere to a fixed set of
questions and answers (Mason 2006). Qualitative interviewing is more relevant to
answer question such as ‘why do people conduct certain practices or make certain
choices’ highlighting the strategies to cope up with constraints of mobility. Unlike, one-
to-one interviews, focus group discussions or any other qualitative methods are less
likely to answer questions related to individual’s choices or strategies (Kvale 1996).
This also means exploring their efforts to move out of poverty with the help of changing
situations in the labour market, housing and transport needs. To understand these
efforts and situations, qualitative techniques are more relevant, especially, interviews
where these aspects could be talked about in detail. The format of focus group
discussion (FGD) does not allow documenting individual choices and practices in
detail. Thus, individual interviewing is used as the key method for qualitative data
collection.

83
3.1.2 Case-study approach
Persistence of poverty is dynamic, institutionally imbedded, contextualised phenomena
(Narayan et al 1999, UNSIRD 2010) and thus requires specific geographical settings
for the analysis of the same. Similarly, the findings related to the mobility practices of
the poor will be time-space specific, situation specific. They need to be further
contextualised in the setting of a city. These research intentions outline the need of a
case study based approach (Yin, 1994; Flyvbjerg, 2006). The case study approach
enables a greater tendency to emphasize the detailed workings of the relationships
and social processes, rather than to restrict attention to the outcomes from these
(Denscombe, 1998). At the same time, it is possible to have thematic discussion based
on mobility and poverty related findings placed in a specific case.
Here, as part of the research strategy, a city is seen as an arena where mobility of the
poor is observed and analysed within the urban dynamics of infrastructure and policy
regime. As it is an inductive research approach, there is a possibility of aggregating all
the contextualised understanding and specific observations into the thematic nuances.
Studying more than one city has a danger of diluting the context-specific discourse on
poverty-transport links. The intention here was not to compare poverty instances in
different urban contexts but to explore the poverty-mobility links in the life of the urban
poor. Denscombe (1998) argues that the rationale 'behind concentrating efforts on one
case rather than many is that there may be insights to be gained from looking at the
individual case that can have wider implications and, importantly, that would not have
come to light through the use of a research strategy that tried to cover a large number
of instances. And thus, it was more appropriate to select a city and detail it out. A case
study is appropriate as ‘a locus for study’ but it must also be recognised that many of
the identifiable characteristics of a case study are dependent upon and a reflex of the
larger society and can only be explained with reference to their specific connections
with it. Although, there are question marks around the generalizability of findings from a
84
case study, it is possible to generate thematic debates (such as of poverty and
mobility) from the findings based in a specific case. So the given the nature of this
research, the case-study approach is the most appropriate one.
3.1.3 Selection of Case study
This research is situation in a city in India. At one level, the selected case study should
be a representative case of urban development and its constraints amongst the Indian
cities. At another level, the case study should also have some interesting requisites
that may challenge the stereotypes of a city from India. The selection of the case study
was based on straightforward criteria that the case study should be ‘interesting and
sizable’ enough to discuss the dynamics raised in the research questions such as
poverty, mobility and policies. It could be any city in any given context in India where
the issues of poverty are most relevant. As mentioned earlier, for this study the city is
incidental. It could be any city from India where dynamics of mobility and poverty could
be studied and the contributions to theoretical debates could be made.
The city of Ahmedabad was an obvious choice of being a case-study, as lots of the
preliminary ideas about this research were originated based on this city. Besides, the
city of Ahmedabad is also relevant to the discussion previous discussion carried out in
Chapter-1 about poverty and informality in an Indian city. As economies in regions like
India show rapid growth, there is a good chance that these cities could be a problem of
tomorrow. It is believed that middle-sized cities in Asia with population range around 4
million because of their present infrastructure levels and growth potential will be
confronted with coping with rapid urban growth and related urban problems like rapid
motorization.
An exercise was carried out to rationalize and re-affirm the choice of Ahmedabad
based on indicators related to poverty, transport and policy changes at the national
level. Ahmedabad urban agglomeration has an estimated urban population of around
4.5 million, and has observed compound annual growth rate of around 2 per cent for

85
the past two decades. The city agglomeration area has more than doubled during this
period but the observed average trip lengths in the city have increased only marginally.
The average trip length in Ahmedabad is lower in comparison to other cities with similar
population in India like Hyderabad, Bangalore or Kanpur. The following table presents
poverty and transport related characteristics in Indian cities. Here the city of
Ahmedabad is compared with other cities based on these characteristics:
Table 3-1 Criteria for case study selection
No. Urban characteristics Cities (India)
Urban poverty
1
Rapidly growing cities (above 1.5% compound annual population growth rate projected by ADB (2008) between 2006-20)
Surat (5%), Jaipur (3.6%), Delhi (3.5%), Pune (3.5%), Bangalore (2.8%), Ahmedabad (2.7%), Kanpur (2.5%), Mumbai (2.3%), Hyderabad (2.2), Kolkata & Chennai (1.7%)
2 Above 20% population living in slums in urban areas based on 2001 census National average ~20%
Patna, Mumbai, Delhi, Kanpur, Lucknow, Kolkata, Chennai, Surat, Pune, Ahmedabad, Hyderabad, Bangalore, Jaipur,
3
Above 30% decadal growth rates in slum population in urban agglomerations (between 1991-2001) National average 35%
Surat, Jaipur, Delhi, Hyderabad, Pune, Lucknow, Kanpur, Bhopal, Nagpur, Indore, Bangalore, Cochin, Vizag, Mumbai, Ahmedabad,
4
Innovative housing and poverty alleviation projects (based on ministry of housing & urban poverty alleviation, Govt. of India)
Slum networking program (Ahmedabad), Slum networking (Indore), Slum Resettlement schemes (Mumbai), Public housing (Hyderabad), Patta (land tenure) act, (Jaipur and Bhopal), Citizen report cards (Bangalore)
Transport and urban governance
5 Rapidly growing automobile population in cities – based on growth rate between 2001-06 National average (~10%)
Jaipur(30%) Ahmedabad (18%), Nagpur, Vishakhapatnam, Chennai, Coimbatore, Madurai,
6 Investments in public transit initiatives– cities which are building the new systems
BRT (bus based) - Delhi, Pune, Jaipur, Indore, Ahmedabad, Vizag, Hyderabad, Vijayawada, Rajkot, Surat Metro (rail based) - Mumbai, Delhi, Bangalore, Chennai, Pune, Hyderabad
7
Front runner cities in utilizing the national urban mission (JnNURM) funds for projects related to transport, basic services and housing
Surat, Rajkot, Ahmedabad, Coimbatore, Madurai, Hyderabad, Jaipur, Bhopal, Vishakhapatnam, Pune
Besides, Ahmedabad appearing in the various listed indicators above, there was
another important criteria in the favour of the city. Ahmedabad was one of the few cities
in India where at least some official studies related to transportation were available to
understand the city level characteristics. Many academic institutions have contributed

86
to the urban research about the city. Ahmedabad has some typical characteristics of
urbanization in south Asia such as rapid population growth followed by industrialization
and mercantilism, depleting urban infrastructure and swelling slum squatters. This is
coupled with high growth rate of private motor-vehicle activities and building of big
transport infrastructure projects to ‘ease congestion’ along with the national ‘best
practice’ project of Bus Rapid Transit (BRT).
3.2 Detailed Methodology
3.2.1 Desk Research and data sets
Being a case study research, the first step was to understand the city’s historical
planning trajectories, economic development and poverty issues. It also included
reviewing transport studies and town planning documents and analysis of the city’s
statistical data obtained from the local/state government, relevant census data and
national sample surveys, analysis of city’s development policies and plans designed
over time and compiling their impact studies. Newspaper reports, academic studies,
international journals, governments’ reports and monographs gave the broad idea
about city’s development paradigm, issues and urban initiatives. Although qualitative
analysis of newspapers, for example, might enable substantial conclusions to be drawn,
such research could not be regarded as reliable on its own. As such, this could be
supported by other research methods.
3.2.2 Quantitative survey and sampling
Available secondary datasets of city level transport studies were obtained. In
Ahmedabad, two major transport surveys have been carried out in last two decades;
the feasibility study for IPTS (Integrated Public Transport System) alternatives for
Ahmedabad by Louis Berger Group Consortium for Gujarat Infrastructure Development
Board in 2001-02 and recently (2005-2006) surveys for Bus Rapid Transport System in
Ahmedabad for Ahmedabad Municipal Corporation. Reports containing both the

87
surveys were obtained and they are drawn upon in the quantitative analysis. However,
in both the reports, there was a limited coverage of any of the socio-economic
characteristics including the income groups. Further, there was also limited coverage of
the non-motorised transport. The focus of these reports was more in the realm of
‘predict and provide’, where based on the transport demand, the feasibility of mass
transit systems were worked out. On the prima facie, it appears to be the case of over-
estimating the ridership and under-estimating the costs as described by (Flyvbjerg,
2007).
Given the limited data on the socio-economic characteristics and transport, the
quantitative household surveys became important primary data collection activities.
Questionnaires can provide a broad range of information from a diverse group of
people. And this is especially useful alongside more in-depth, detailed, but narrower
research methods. The main quantitative component based on the household-level
travel survey in selected slum settlements. Other options of conducting travellers
survey such as mid-block (corridor intercept) survey or surveys around transport
facilities (typically fuel stations) were considered and discarded. The household based
travel survey can cover the cross section of population across the age and gender. In
other surveys, there was a danger of getting a male bias or a bias toward motorised
vehicles (in case of fuel station). Besides, the objective here was to capture the poor
for which the surveys have to be conducted in their own locality and at the time when
they are available to answer the questions for the household level survey.
The definition of poverty for this thesis is based on multi-dimensional criteria specific to
income, living conditions (housing and basic services), access to livelihood and social
inclusion (caste, age, gender). The city of Ahmedabad has about 750 slum settlements
with varying population size, land ownership (public or private) and years of existence
within the municipal limits (466 sq. km.) as per the municipal data. The poor are located
based on two broad conditions: One, official poverty line (known as below poverty line

88
– BPL population) and second, deprived living conditions defined by the local municipal
government as ‘slum settlement’. On prima-facie these categories are accepted but
there were further attempts made to ensure that the poorer group is captured amongst
the people living in the slum settlements. There were three levels of filtering done for
the sampling of the household surveys. One, locating concentration of poverty in each
municipal zone in Ahmedabad; two, selecting the slum settlements within each zone
and three, selecting the households within the selected settlements.
The Ahmedabad Municipal Corporation (AMC) has carried out the surveys of the
‘Below Poverty Line6’ (BPL) households in all the slums distributed in different zones
and wards (sub-set of zones) in the year 2009-10. This database includes listing of
households (as BPL or otherwise) in different slums for each ward of the city. This was
the latest database available (year 2010) and it was used for sampling. The list of such
slums settlement in Ahmedabad with the BPL population was obtained for the year
2010. Based on these two conditions of concentration of BPL population living in the
designated slum settlements and the distribution of such pockets of concentrated
poverty in different municipal zones, the slum settlements were identified.
Concentrated pockets of poverty were identified based on number of BPL households
in each municipal zone and there were six such pockets were there in North, South,
West, South East and Central zones. For the quantitative or qualitative sampling, the
target population in the selected settlements is stratified and randomized based on
employment, age and gender.
6There are many debates about identification and estimation of poor people in the Indian public policy and
social sciences. A recent one being, the BPL (below poverty line) surveys are based on poverty line as per the year 2009 as 20 rupees/person/day.

89
Figure 3-1 Slum settlements in Ahmedabad as per the AMC
Source: Center for Urban Equity, CEPT University
Based on a hypothesis that ‘slums located in differing distance from the city centre
would have different characteristics’, the slum settlements were categorised as either
being in the core city7 or being peripheral settlements. It was also decided to select the
settlements based on varying distance from the city centre in different directions to
ensure the spatial representation. The core city settlements were in and around the
historic walled city of Ahmedabad, which incidentally fall within the 3.5 km radius of the
city centre (Bhadra square). The peripheral settlements fall within 3.5 to 7 km radius of
the city centre. Two of the resettlement sites were beyond the 7 km radius of the city
centre and two of them fall within 7 km radius.
7Here the ‘core city slums’ category would include the central city slums and the intermediate slums. In
case of Ahmedabad, the central city means the historical walled city and the intermediate slums would mean the slums developed in the periphery of historical walled city.

90
Besides, taking settlements from different local administrative boundaries like municipal
zones ensures not only spatial distribution of the settlements in different directions (in
addition to the core, intermediate, peripheral categories) but also the practicalities of
using secondary data. In different municipal zones, slums with higher share of BPL
population than the rest were selected. Beyond the spatial distribution and distance
from the city centres, slum settlements in Ahmedabad can also be categories as core
city slums, peripheral or industrial suburban slums and resettlements sites8. While
selecting the settlements, it was ensured that these categories are covered. Inclusion
of the resettlement sites was important as many poor people were displaced by various
development projects; some of which are not rehabilitated fully but many of them were
given public housing in last few years. To summarise, the slum settlements in
Ahmedabad were selected representing three criteria:
Distance from the city centre (core or peripheral)
Spatial distribution of concentrated poverty pockets determined by municipal
zones (north, south, east, west etc.)
Slum typologies (established slums, industrial suburban slums, walled city
slums, Resettlement sites)
The purpose of the household surveys was to quantify and analyse urban travel
characteristics of the poor people in the city of Ahmedabad. The travel characteristics
included are frequency of travel for various purposes, mode use, destination, routes
and cost - time taken. The trips captured in the survey are analysed by gender, income,
employment and locations of various settlements. A detailed household survey was
conducted in Ahmedabad in October 2011 and a sample household survey form is
attached in the Appendix A5. From each household, trip details were asked for at least
8As part of the national urban renewal mission, Ahmedabad acquired funds to build housing for the poor
people in the city; especially the families displaced from various developmental projects in the city were housed here.

91
4 adult members and 2 children9. The questionnaire was designed in such a way that
trips per week, multiple-mode trips, trip chaining are captured and quantified.
Figure 3-2 Core city informal settlement and the peripheral re-settlement colony
Photos in figure 3-2 and 3-3: author and Center for Urban Equity, CEPT University
Figure 3-3 Household surveys in progress with the help of the field workers
The data-collection was
undertaken using survey forms
completed by trained
fieldworkers. The field workers
represented gender balance
and they administered
questionnaires in the language
of the interviewee in order to
promote clear comprehension.
The help from local civil society
organisations working with the
slum community (SAATH and
SEWA) and the local research
center at a university (Centre for Urban Equity, CEPT University) was taken in
employing the field workers.
9If there were more than four adults or 2 children, the field workers were encouraged to fill up their details
in an extra form. Any household members who go out of the slum settlement were asked to give their details. Any trips within the slum settlement were not considered in this survey.

92
Table 3-2 Selected settlements for household surveys
Name of Major Settlements surveyed
Slum settlement type/ location
Ward Zone No of Hh in settlement
Total number of
households surveyed
Core City Slums (Within 3.5 km radius of the city centre)
1 Municipal quarters Central core Shahpur Central 310 29
2 Khanpur darwaja Central core Khanpur Central 500 47
3 Baba Lavlavi Nagar, Ramjimandirnichali
Southern Core city Baherampura South 750 64
4 Lalluram na chhapara, Damodar ni chali, Rami ni Chali
Eastern Core city Rakhial East 1097 98
Total 238
Periphery/intermediate slums (within 3.5 to 7 km radius of the city centre)
5 Hanuman Nagar, CTM Industrial suburban South-Eastern Periphery
Bagefirdos South 320 29
6 Santoshinagar na chhapara
Industrial suburban Northern Periphery
Naroda-muthiya North 1040 52
7 Yogeshwar nagar-1 Western periphery Vasana West 450 29
8 Sanjay Nagar Na Chhapara
Western intermediate
Naranpura West 975 59
Total 169
Relocation-Resettlement sites (9,10 within 3.5-7 km radius of the city centre and 11,12 beyond that)
9 Ajit Mill Ni Chali , Rakhial
Core city Resettlement
Rakhial East 704 30
10 Balol Nagar BSUP Western Resettlement
Near Akhbar Nagar
West 640 35
11 BSUP Housing, Trikampura
Eastern Resettlement
Jasodanagar South east
672 54
12 Ganesh Nagar, Piplaj Temporary Resettlement site (south)
Piplaj South 600 55
Total 174
Grand Total 581
Note: The map at the end of the chapter shows all settlements represented by the same number given here. The map also represents the concentration of slum settlements and Chawls in Ahmedabad.
The following variables were recorded in the surveys:
Basic demography and employment – age, gender, level of education, income,
days of work in a year, type of work, work profile in the previous year
Housing and basic urban services: House type, house condition, level of basic
services (water supply, sanitation, solid waste etc.) and history of residential
mobility, perception of eviction threats

93
Transport: primary mode, input costs, frequency of use, level of access, history of
mode-choice and aspirations, trips details for the last week (mode use, time taken,
cost) for all the members in the family, proximity and affordability of BRT/municipal
bus services.
The following table gives details about the number of household surveys conducted in
different informal settlements with varying locations.
3.2.3 Qualitative Interviews
There were mainly two qualitative methods were deliberated; one, qualitative interviews
and the focus group discussion. Given the familiarity and field experience of the
researcher, the focus group discussions were not the right approach for the present
thesis because the research question focused on the individual negotiations of poverty
situations and mobility options in the wider social context of household strategies. The
qualitative interviewing gives an in-depth understanding about the travel and mobility
context of the poor. When it comes to deliberating options or explaining situations, the
focus group discussions are not adequate methods. The main danger of focus group
discussion at the household or at the neighbourhood level were the complete
marginalisation of the less powerful social group based on their age, gender or their
caste. In this context, individual qualitative interviews seemed appropriate to give
‘voices’ to the individual views about mobility and poverty. So qualitative interviews are
selected as the main qualitative method based on Clifton & Handy (2001) and Kvale
(1996).
Semi-structured interviews used in conjunction with other research methods, can help
establish the subjective narratives of the poverty situations and the mobility practices.
To this end, the interviewer is able to seize upon any opportunity where the interviewee
could elaborate on points of interest without being restricted to the rigidity of a more
structured interview. Semi-structured detailed interviews were employed where the
questions were more open-ended and answers were audio-recorded from individuals in

94
the setting of a household or any other comfortable space to the interviewees. The
interview guide covered the following issues:
1. Housing and living conditions: Migration to the city, subsequent residential mobility
and available options, employment linkages, community support and social
networks, health and education priorities and recreation
2. Transport mobility and attitudes: changes in urban travel over time, attitudes to
route and mode selection, managing financial burden of urban travel, stated
preferences, perception of public transport and other modes like M2W and NMT
3. Economic mobility and social attitudes: Nature of employment, other members in
the household, their jobs, their daily travel, attempts to move out of poverty and
changes over time, aspirations and future plans
The samples were selected on the basis of variations in gender, age, occupation,
mode usage and the location of the settlement. The motivation of such distribution is to
ensure the representation from the various sub categories of the poor. Number of pilots
were conducted in each settlement and depending upon the comfort level of the
interviwees and their articulation, they were encouraged to give the full interviews. It
was important to balance the inteviwees based on gender, age, occupation and
locations. To keep A sampling ‘grid’ was created (portrayed as Table 3-2 below) to
reflect groups, which have combination of variables. The interviewees were selected
ensuring representations of different combination of cells. Total 34 interviews were
carried out.
The decision on number of interviews conducted was based on the first-hand
experience of recording differentials within the selected community. There are relatively
few guidelines about how many interviews are needed for a valid and reliable result
except a constant reference to the theoretical saturation point (Fossey et al 2002). The
practicality of time constraints in an academic project would also decide ‘when to stop’.

95
On prima facie, if three types of slum settlements (core city, peripheral and
Resettlement sites) are selected then 10-12 interviews in each were considered.
Table 3-3 Interviewee characteristics – Gender and Age groups
No.
Settlement typologies
Male Female
18-30 30-40 40-50 50-60 60+ 18-30 30-40 40-50
50-60 60+ Total
1 Core city slums 2 2 1 2 1
4 2 1 1 16
3 Periphery - suburban slums 1 1
1 1 2 1 2 1
10
4
Resettlement sites (public housing) 1 1 1 1 1 1 1
1 8
Total Male 16 Total Female 18 34
Qualitative component was originally conceived to set grounds for the specific
quantitative inquiry. However, practically this was not possible as the qualitative
analysis would take longer time and given the constraints of mobilising the teams and
rapport with the community etc, both components were carried out almost parallel to
each other. To take advantages of the mobilized team and newly built rapport with the
community, all the field work was intensively finished together in 2-3 months followed
by data feeding and transcriptions. Another deviation from the original plan was to
employ a female interviewer to interview the women. It was observed in the pilots that
the women were reserved when talking to a male researcher and with female
interviewer; they were more comfortable in sharing their views. So finally a female
interviewer was employed who would audio record the conversation and the
researcher would work in close collaboration with her to guide her to the right kind of
conversation after listening to the recording each day.
3.3 Conclusion
After deliberating various methods and approaches, this thesis developed its own path
of inductive research strategy. As part of this research strategy, a mixed method
appraoch of combining quantitative and qualitative methods; first to specify what are
the mobility practices and secondly exploring ‘why these practices’ in the given context.

96
It was decided to conduct household surveys as part of the quantitative component
where detailed trip details of all family members were captured. Disaggregated data on
education level, livelihood categories, housing conditions and assets was also
recorded for each selected household. As part of the study, about 581 households
were surveyed in 12 settlements distributed in different locations of the city.
Furthermore, it was decided to conduct semi-structure qualitative interviews of poor
peple over the focus group discussions. Finally, about 34 individual interviews were
conducted in the differently located settlements mainly constituting the interviewees
with varying employment and housing scenario. The qualitative and quantitative data is
further analysed in Chapters 5 and 6 answering the research questions. The following
map of Ahmedabad represents all different informal settlements where both qualitative
and quantitative components were studied.

Figure 3-4
Locations of the
settlement
studies in
Ahmedabad city
Informal settlements studied
Resettlement colonies
studied
Source: EPC-SEWA study
12
3
5
4
8
7
9
6
10
11
2
1

4. The case of Ahmedabad: poverty and the urban planning context
The present chapter introduces the case-study city of Ahmedabad and its urban
planning and transport context. This chapter begins by giving a demographic profile of
the city and moves on to discuss the prevalence of slums and informality in the city
over the years. Towards the end, it gives highlights of the transport system in the city
and discusses mobility issues of the poor based on the city-specific secondary
literature.
4.1 Introduction
Ahmedabad is a metropolitan city and commercial capital of the highly industrialised
and urbanised state10 of Gujarat located in Western India. Ahmedabad is the seventh-
largest urban agglomeration in India with a population of 6.35 million in the year 2011.
Ahmedabad accounts for 7% of the state’s total population and around 20% of its
urban population. Ahmedabad has been central to political, economic and cultural
activities in Gujarat over centuries. The political capital of the Gujarat state called
Gandhinagar – a town planned and developed from the 1960s – is located in the close
vicinity of Ahmedabad. Ahmedabad houses the only international airport of the state
and is a major hub of regional transport network through rail and national highways.
The city of Ahmedabad was founded in the year 1411 as a new capital by Sultan
Ahmedshah. By the year 1818, the British East India Company took over Ahmedabad
from the Maratha rulers who had by then been ruling the city for more than a hundred
years. The British regime established Ahmedabad Municipality in year 1873, which was
upgraded as Ahmedabad Municipal Corporation in the post-independence era, in 1950.
10
The state of Gujarat, with 42.6 per cent of its population being urban, is well over the all-India urbanization average of 31.2 per cent as per the 2011 Census. The average annual growth rate of urban population in Gujarat for the next fifteen years has been forecast at 2.9 per cent (Census of India, 2006), indicating continued high urban population growth in the state for an extended period. It is also important to note that the urban growth rates in Gujarat are slowly stabilising compared to the 1970-80s during the early phase of industrialisation and urbanisation.

99
Today, Ahmedabad Municipal Corporation (AMC) is responsible for all the municipal
services and civic amenities including urban planning, provision of basic services, local
transportation, public health and education. In the three-fold structure of governance in
India, the city government or the municipal corporation plays a crucial role of being the
local, third tier of government. Since ‘urban development’ is a state government
domain, the local government works with the state government in pursuit of day-to-day
urban governance. However, the national government also frames broad urban
policies, funds urban development programs and provides model urban legislation.
AMC has an area of 466 km2 divided by 64 municipal wards. 192 municipal councillors
represent these wards and they form the legislature, headed by an elected Mayor. The
Municipal Commissioner heads the executive in the Municipal Corporation, which also
includes technical staff like the planning officials. The Ahmedabad Urban Development
Authority (AUDA) is a state government agency that regulates the metropolitan region
of Ahmedabad city and works closely with AMC in preparing the development plan for
the city. The latest draft development plan (2021) was released for public consultation
in June 2013 and the final plan with the state government sanction is awaited.
Ahmedabad is divided into two geographically distinct parts, East and West
Ahmedabad, by the river Sabarmati. The eastern part consists of the medieval walled
(fortified) city and its northern, eastern and southern extensions. The walled city today
houses people mainly involved in trade and commerce. Most of the wholesale goods
markets are located in the old city, such as the grain, vegetable, fruit and cloth markets.
The traditional textile industries, which now lie abandoned, and most of the recent
industrial estates, warehouses and wholesale markets are located in the East. The
eastern part is also dominated by traditional kinds of trade such as hawking, bazaars,
workshops and home-based manufacturing activities. In contrast, the western part is
relatively newly built with modern architecture, providing attractive locations for service
industries and contemporary shopping arcades. The western part also includes most of

100
the higher education institutes and universities, besides the ‘aspirational’ housing
developments for the middle and higher-income groups. The contrast between the
eastern and western sides also gets reflected in the infrastructure provision and
development projects, and it will be discussed later in this chapter.
4.2 Demography and employment
The population of Ahmedabad grew at a rapid pace in last few decades, but there are
indications of the population growth stabilising. Ahmedabad has grown annually by 3.5
per cent on average during the past decade. Ahmedabad registered the third-highest
population growth amongst the Indian cities in the last decade after Surat and
Bengaluru urban agglomerations. In the last decade, the population growth rates in all
other metropolitan Indian cities like Kolkata, Mumbai, Delhi and Chennai have slowed
down. In terms of increase in population growth rates, Ahmedabad along with
Bengaluru lead the second-tier group of large cities (with 5 million plus population) in
India, followed by Hyderabad and Pune. In the table below, the decadal population
growth rate of Ahmedabad between 2001-2011 is reported as 36.9 per cent, which is
mainly attributed to the city limits expansion from 192 km2 to 450 km2 in the year 2006
along with the natural increase of population. Ahmedabad has grown in the official
figures, but exact picture complicated by unrecorded growth outside city limits, which
were then extended in 2006.
Table 4-1 Decadal population growth rates in Ahmedabad city (Census 2011)
Census+ years Population Decadal growth rates %
1951 837,163 41.6
1961 1,149,918 37.4
1971 1,586,544 37.9
1981 2,059,725 29.9
1991 2,876,710 20.8
2001 3,515,361 22.2
2011 5,570,585 36.9
Ahmedabad has seen major improvements in the human development indicators over
the last few decades. The literacy rates of Ahmedabad city are improving over the

101
years: from 84 per cent in 2001 to nearly 90 per cent in 2011. The male literacy rate
reached 94 per cent in 2011, while the female literacy rate was about 10 percentage
points behind. The overall sex ratio has also improved, from 885 in 2001 to 897 in
2011. The earliest available data on the social composition of Ahmedabad’s population
dates to 2001, where 9.5 per cent were categorized as Scheduled Castes11 while only
0.8 per cent as Scheduled Tribe and 12.4 per cent were Muslims. The majority of the
population in Ahmedabad (about 80 per cent) is the non-scheduled castes and the
non-Muslims, which means they are mainly the dominant Hindu castes.
The poverty rate12 in Ahmedabad also declined from about 32 per cent in 1993-94 to
13 per cent in 2004-05; a 19 per cent decline in about a decade. This has been among
the fastest declines shown by the large cities of India (Srivastava et al., 2010). At the
state level also, the incidence of poverty has declined, from 27.9 per cent in 1993–94
to 20.1 per cent in 2004–05. Given the issues with the poverty line approach (as
discussed in Section 2.1), the poverty data need to be looked at critically. The optimism
of a declining instance is diminished when the population living in slums is considered.
It is proved time and again that the declining poverty line numbers may not directly
translate into decline in the population living in the slum quarters in cities. The national
Ministry of Housing and urban poverty alleviation report projects that the slum
population of Gujarat state will increase from 4.66 million in 2011 to 5.24 million in the
year 2017 (NBO-MoHUPA, 2010, p. 22).
4.2.1 Employment and informal work
The tertiary sector informal trade and commercial activities dominate the urban
economic activities of Ahmedabad. The urban economy’s reliance on the tertiary sector
is evident in the distribution of economic enterprises in the urban areas of the
11
The Scheduled Castes (SCs) and Scheduled Tribes (STs) are two population groups of historically disadvantaged people recognised in the constitution of India. The other - more political name for the scheduled castes is the ‘Dalits’ and to the scheduled tribes is the ‘Adivasis’. 12
The ratio of poor people in total population; the ‘poor’ are defined by the national poverty line based on head count.

102
Ahmedabad district13. Of the total economic enterprises in 2005 (DES-GoG, 2005),
nearly 80 per cent were in the tertiary sector; of them, nearly 46 per cent were in retail
trade. Secondary (manufacturing) sector enterprises represented only 20 per cent of
employment in the Ahmedabad district. 85 per cent of the employment of the tertiary
sector enterprises was in small-sized enterprises14. And there is a high probability that
the dominance of smaller enterprises means a higher share of informal work15 or being
self-employed. The enterprise data therefore indicate that there is a large informal
economy in Ahmedabad, as of 2005. The downtrend in the textile industry has led to
the weakening of the industrial base. The industries like chemical, petrochemical,
engineering that exist in the government-supported industrial estates and private
industrial parks are less labour intensive and hence have lower employment rates. This
has led to the redundancy of a major section of the labour force. The surplus labour,
which was unable to enter the formal market/ organised sector, was mainly absorbed in
the informal sector. A study (Unni & Rani, 2002) on income and employment in the city
indicates faster growth of employment in the informal sector than the formal sector. By
2001, the share of employment in the informal sector was 77%, and it generated 47%
of the total city income.
The workforce participation rates show some decrease across both genders. The
compounded annual growth rate of male workers in 2004–05 to 2009–10 is 6.4 per
cent, even though the work participation rate16 had declined marginally from 56.9 per
cent to 54.4. There was a simultaneous reduction in unemployment rates of male
13
The latest economic census available is for 2005 (DES-GoG, 2005), although it is available only for Ahmedabad district and not the whole city. However, Ahmedabad city’s economic structure is presumed to largely influence the district’s urban situation. The population of the Ahmedabad urban agglomeration would be 85% of the population of the district. 14
According to the Micro, Small and Medium Enterprises (MSME) Development Act of 2006 of India, a small enterprise in the manufacturing sector is where the investment in plant and machinery is more than 2.5 million Indian rupees but does not exceed 50 million. Small enterprise in the service sector is where the investment in equipment is more than one million Indian rupees but does not exceed 20 million. 15
Here ‘informal work’ means being employed in the informal sector (unlike other parts of this thesis where ‘informality’ is used as an urban theory concept). Amongst many definitions by different agencies in India, the National Commission for Enterprises in the Unorganised Sector (India) defines informal workers as – “Informal workers consists of those working in the informal sector or households without any employment and social security benefits provided by the employers” (Naik, 2009). 16 As per the Indian census, the work force participation rate is the percentage of working-age persons in
an economy, who are employed or who are unemployed but looking for a job, to the total population.

103
workers as well from 2.62 in 2004-05 to 1.30 in 2009-10 and female workers from 2.78
in 2004-05 to 1.24 in 2009-10. However, the female workforce participation rate has
declined from 15.6 in 2004-05 to 11.1 in 2009-10. It is possible that some women have
dropped out of the labour force as a result of rising household incomes, which is seen
everywhere in Indian cities (Chowdhury, 2011). Mahadevia (2012) argues that a large
proportion of the available manufacturing employment has shifted to self-employment,
most likely subcontracted work involving nearly half of male workers and 90 per cent of
female workers (Mahadevia, 2012). Many workers operate out of their homes. The
increase in home-based work often goes unreported. In some slum quarters, for
example, small workshops and enterprises operate to produce food items and
equipment for engineering production.
In Ahmedabad city, about one-third of the work force is in regular employment, where
nearly half of the work force is self-employed (Table 4-2). There was a consistent
increase in self-employment among men in Ahmedabad city, from 34.7 per cent in
1987–88 to 53.6 per cent in 2009–10. The regular employment among the men
declined by 15.3 per cent between 2004-05 and 2009-10. In 2009–10, once again, self-
employment among women increased, by 9.7 percentage points, in relation to 2004–
05, by nearly 50 per cent. At the same time, the proportion of regular employment
amongst women also marginally increased, to 30.9 per cent in 2009–10 from 30 per
cent in 2004–05. Casual labour among women drastically decreased in the same
period indicating that self-employment might have increased.

104
Table 4-2 Employment categories in Ahmedabad over time (based on NSSO data)
Self-employed Regular employed Casual labour Total
Male
1993–94 35.2 51.2 13.5 100
2004–05 36.4 53.1 10.5 100
2009–10 53.6 37.8 8.6 100
Female
1993–94 43.6 27.3 29.1 100
2004–05 38.9 30.1 31.1 100
2009–10 49.2 30.9 19.8 100
Persons
1993–94 36.8 46.7 16.5 100
2004–05 36.9 48.5 14.6 100
2009–10 52.9 36.6 10.5 100
The increase of self-employment amongst the males and female workers in
Ahmedabad shows the distinct character of its urban growth. Generally, with high-
economic growth and expansion of the service sector, it would be assumed that regular
employment would increase and formalisation of the labour force would take place.
Whereas in Ahmedabad, like many other Indian cities, self-employment has increased,
indicating that the high economic growth of the state is ‘jobless growth’. The workers
are either not obtaining regular employment or they find more reliability in self-
employment. In either situation, there are higher chances of income irregularities
leading to economic vulnerabilities and deprivation. Mahadevia (2012) argues that the
Gujarat state government has not been working on labour welfare effectively, which is
resulting in the increase in self-employment. For example, the minimum wage rates set
by the state government are the lowest amongst the relatively industrialised states in
India like Maharashtra or Tamil Nadu. Social security measures, which are essential in
a situation of informal economy and unorganized labour, have been minimal. There
has not been any counter political force from the labour unions to demand labour
welfare. Finally, the dominance of the service and retail sector in the urban economy of
Ahmedabad and the increase in self-employment instead of regular employment
creates situations which require the poor and low-income workers to be more flexible

105
about the timings, payments and locations of work, leading to possible livelihood
vulnerabilities. This prevalence of informal work in the urban economy is closely linked
with the other ‘informalities’ in the lives of the poor workers such as residential choices
and mobility options. Hence, the current thesis examines the linkages of these
livelihood vulnerabilities with mobility represented by a research question (1-b) focusing
on the mobility practices of the livelihood based sub-groups within the poor.
4.2.2 Slum population
Over the years, various attempts have been made by government agencies to
enumerate the slum households and settlements, with varying degrees of difference in
the definitions used for the surveys. As per the census data of the housing stock over
the years, the percentage of Ahmedabad housing categorized as slums increased from
17.2 per cent in 1961 to 22.8 per cent in 1971 and 25.6 per cent in 1991. As per the
2001 census, there were 92,307 slum households (13.5% of the total households) in
Ahmedabad, with a population of 430,000. The city-wide slum census of 2011 is still
not published. The census procedures typically rely on the municipal authorities to
notify which were the slum settlements and, in Ahmedabad, chawls (declining-quality
row housing considered further in Section 4.3) are never included in the census data
on slums.
Table 4-3 Slum population in Ahmedabad over the years by different agencies
Year No. of units No. of slum settlements No. of Chawls Survey done by
1976 82,177 1200 -- Ahmedabad Municipal Corporation
(AMC)
1990 92,121 in Slums,
136,773 in Chawls
1023 1409 Ahmedabad Study Action Group
(ASAG)
2001 92,307 -- -- Census (Government of India)
2001 350,000 (approx.)
710 958 AMC-SEWA (Self-Employed
Women’s’ Association)
2009 262,551 in
slums, 149,022 in Chawls
834 958 Ahmedabad Municipal Corporation
(AMC) 2009 as published in (AUDA, 2013)
Table 4-3 shows the number of attempts by various agencies to capture slum
demographics. The slum demography in Ahmedabad (like many other Indian cities) is

106
bureaucratically-contested territory. Over the years, claims and counter claims have
been made about the slum demography in the city. The governing agencies like AMC
don’t accept the surveys done by non-governmental organisations (NGOs) and the
NGOs contest the surveys done by the AMC. Amongst the governing agencies, there
are no consistent methods to categorise and enumerate slum settlements. Settlements
are often categorised as ‘slums’ on the basis of their legal or bureaucratic conditions
and not their living conditions.
The 2001 survey jointly conducted by AMC-SEWA offers the most recent and the most
comprehensive publicly available data on slums in Ahmedabad. As per this survey,
Eastern Ahmedabad accounted for 75 per cent of the chawls units and 47 per cent of
the slum units in the city. Eastern Ahmedabad housed 54.8 per cent of the total
slum/chawls dwelling units in the municipal area (before the expansion in the year
2006). This shows the difference between the Eastern and the Western parts of
Ahmedabad in terms of the concentration of slum dwellings. The draft development
plan (AUDA, 2013) gives details of the number of households living in slums as
262,551 and in chawls as 149,022. There are 411,573 households in Ahmedabad
living in sub-standard housing and struggling with basic services like water and
sanitation.
A World Bank working paper examining Ahmedabad’s housing scenario (Annez et al.,
2012) estimates that the population living in slums has increased by 18 per cent
between 2001 to 2011, with the slum population estimated to be about 2 million people.
The same paper also reports the very striking upward trend in household incomes in
the last decade as per their own calculations. According to the paper, the median
income has increased 2.7 times from 7,250 INR in 2001 to 19,500 INR17 in 2011. Even
the national sample survey (NSS) data show that median household expenditure in
Ahmedabad has grown at over 5 per cent a year in real terms in the 5 years between
17
The average exchange rate in the year 2011 was 1 US dollar = 48 Indian Rupees (INR).

107
2004-05 and 2009-10. The increase in the slum population indicates that the rising
incomes in Ahmedabad are extremely skewed, and related to the increasing inequality
in the city. However, Annez et al., (2012) see the increase in the slum population as
more of a problem of supply of formal sector housing and affordability instead of
growing poverty amongst low-income groups in Ahmedabad city.
Table 4-4 Total population and Slum population in Ahmedabad as per the AMC
Year AMC population in million Slum population in million Percentage share of slum population
2001 3.5 0.88 28
2010 5.5 0.73 13
Source: (AMC-CEPT, 2010) shows the source of 2001 data as their own survey and the 2010 data as the 2010 biometric socio-economic survey.
Hence, the AMC contradicts the World Bank view (Annez et al., 2012). The AMC
conducted a biometric socio-economic household survey in the year 2010 to make a
‘slum-free city’ plan under the national housing scheme ‘Rajiv Awas Yojana’. These
survey data have not been shared publicly by the AMC. However, the information
shown in the online presentation by AMC (AMC-CEPT, 2010, slide 9) for a national
level workshop revealed the slum population to be only 0.73 million: thereby claiming a
reduction in slum population of the city. The reported reduction is not observed by any
other city-level study in the last decade. As per the data published in the draft
development plan document (as shown in Table 4-3), the most conservative estimate18
of the slum population in Ahmedabad would be at least 1.05 million people without
adding population living in chawls. This suggests two possible conclusions: one, the
city government has failed to create a systematic database for the slum settlements in
the city, leading to confusion in the basic numbers related to the slum population, and
two, the state and the city governments are perhaps failing to confront the reality of the
increase in the slum population, which is a source of embarrassment given the high
economic growth and increase in income levels. The following section puts this context
18
As per the draft development plan document (AUDA, 2013), there are 262,551 families living in slums in Ahmedabad as per the date of AMC in 2009. Even if the household size were 4, the population living in slums in Ahmedabad would be at least 1,050,204. Importantly, the household size in the primary household surveys of this thesis is 5.2.

108
of demography and politics of enumeration in the historic perspective of political
economy and the urban housing policies.
4.3 Evolution of informal housing and the state response
Slum settlements first appeared in Ahmedabad from the end of the 19th Century, with
the establishment of the textile industry and the cotton mills. The dominant mercantile
class as the ‘indigenous elites’ (term used by Raychaudhuri, 2001) transformed into the
industrial capitalists in the 19th century, establishing patron-client relationship with the
labouring poor. This patron-client relationship was visualised and legitimized as ‘the
principle of trusteeship’ by Mahatma Gandhi who established an ashram (commune)
on the banks of the Sabarmati in the 1910s. Gandhi’s influence on the city (and vice
versa) depicts the ingrained local culture of negotiations and conflict resolution through
mediation. Many urban history researchers (Spodek, 1969; Raychaudhuri, 2001) see
the negotiations, mutual adjustments and entrepreneurial traits through the history of
Ahmedabad as an important characteristic of the city. Relatively early industrialisation
compared with the rest of India and global trade and cultural linkages allowed the city
to have its own process of modernisation through institution-building, grand
architectural projects and industrial-economic growth in the 20th century (Gillion, 1968;
Khilnani, 1999).
The early industrial activities produced two predominant kinds of low-quality housing in
Ahmedabad – typologies as Slums and Chawls. Most of the organised textile mills
were typical welfare units with the labour force housed in the employee housing
provided by the mill owners. This housing for industrial workers was called Chawls or
Chali19, which is typically a settlement with one-two room row houses and non-concrete
roofs near the industrial sites. Sometimes these chawls got municipal services and
19
There are two other references to the term Chawls or Chali in Ahmedabad. Chali is also more dignified name used for a slum settlement in the local language in Ahmedabad. The slum dwellers widely referred to their settlement as ‘Chali’. Second use of the term is more popular because of the chawls in Mumbai. Here (and in a few places in Ahmedabad), chawls/ Chali means a walk-up apartment building of independent rooms in a row on each floor with common toilets and other shared facilities, which were initially constructed to house the industrial workers.

109
sometimes they didn’t - depending up on whether or not they were legally sanctioned
by the municipal corporation. Chawls started degrading when the ‘parent’ textile mills
closed down and the residents of these chawls no longer remained the employees of
the mills and the management was no longer interested in providing these housing
benefits. However, the national level rent control laws prevented the mill owners from
either increasing the rent or evicting the renters. Over time, these housing units
suffered from depleting infrastructure and services (Bhatt, 2001). In some cases, the
owners stopped collecting the rents as they were too low and the occupiers became de
facto owners. The occupants of the chawls, now without jobs, were not in an economic
condition to improve the building conditions on their own; neither could they sell the
properties nor move on. Some chawls owners offered the occupants the opportunity of
purchasing their dwelling units so that they could offload the liabilities and such
transactions indeed took place in some chawls. During the fieldwork for this thesis, the
researcher came across several instances where the occupants had not purchased the
units and there were complex housing tenure arrangements.
The second kind of low-quality housing was slum settlements. The labour force in the
small-scale and ancillary industrial units were, unlike the major mill workers, not getting
any housing benefits provided by the owners. These workers started to live in informal
slum settlements. In Ahmedabad slums or informal settlements are organically evolved,
over-crowded areas with insecurity of tenure and lack of basic services. Many of these
settlements lack access to basic amenities such as water, sewerage, waste collection
or paved roads. These informal settlements were developed either on public land
belonging to the various government agencies or on private land. Sometimes, the open
land in the former chawls has been encroached upon and the entire settlement has
become an informal slum settlement. Along with the informal settlements, the depletion
of the chawls led to the present day situation of distressed housing stock for poor
people in the city. The following sections explain the process of slumming in
Ahmedabad and the issues with planning and governance of the city.

110
4.3.1 ‘Command and control’ planning and public housing
The post-independence era (post-1947) witnessed the peak of industrialisation and
informalisation of the economy and the labour market in urban India in general and in
Ahmedabad in particular. The following examples illustrates how the informal
settlements were ‘created’ as a result of ill-informed urban land policies and urban
land-use planning failing to provide decent housing for migrants coming to the city in
search of jobs.
The first development plan of the city in 1965 proposed a green belt with a width of 150
to 250 metres around the boundary of the municipal limits. The plan sought to limit
growth of the city with this green belt surrounding the city, thus placing reservations on
large tracts of private land at the periphery of the city. This was the peak of ‘command
and control’ land use planning, which did not respect the property rights of landowners.
The government machineries were to acquire these land pockets based on the archaic,
colonial law named ‘the Land Acquisition Act 1896’20. However, these plans were never
fully realized, due to lack of funds, among other reasons. The political and social
disruption (some of which leading to litigation) made the ambitious plans of acquiring
such large tracts of land impracticable (Annez et al., 2012).
In these circumstances, the landowners resorted to ‘grey market’ transactions often
with poor and ill-informed households. This created even more competing and
unresolved ownership claims to many plots of land in the city. As seen in the figure 4-1,
Eastern Ahmedabad had a number of Industrial areas (represented by shades of
purple colour) and there was a high demand for low-income housing for industrial
workers in their close vicinities. Most of the stretch of land under green belt ‘protection’
in Eastern Ahmedabad is today occupied by informal settlements. In Western
Ahmedabad, where large tracts of ‘green belt’ land are still vacant, was under litigation
in the Supreme Court of India for a long time.
20
To replace the 1896 Land Acquisition Act, the Government of India has recently passed a new land-acquisition law in the year 2013 in the parliament.

111
Figure 4-1 The 1965 development plan of Ahmedabad
The Urban Land Ceiling
and Regulation Act
(ULCRA) passed in the
year 1976 further
aggravated this
situation. According to
this act, a certain ceiling
was applied to all land
parcels bigger than
certain limits and they
were to be acquired by
the urban authorities to
build housing for the
poor. The idea was to
‘redistribute’ the urban
resources like land equitably in the urban areas. But again, such land parcels was
often sold to low-income households who in some cases purchased the land using
legal procedures such as power of attorney, but which conferred no formal property
rights or change of title. Some owners, who could not manage the sale, gave Power of
Attorney (POA) to an intermediary or an informal market developer – to illegally
subdivide the land and sell it in small plots to the buyers. This created multiple
stakeholders claiming the rightful title of the land of the informal settlements including
the people who were living on the land. Due to their extra-legal status, these
settlements were not provided with the basic infrastructure services — roads, water,
sanitation, drainage and waste collection. In Eastern Ahmedabad, the state
government established five new industrial estates along with a number of textile mills
from the pre-independence era. New warehousing and wholesale trading facilities were
Source: Sacntioned Development Plan 1965, Ahmedabad Municipal Corporation

112
expanding. The informal and squatter settlements emerged on a large scale in the
1970s and 1980s in Eastern Ahmedabad (Kundu & Mahadevia, 2002) with the formal
planning tools like the ‘green belt’ and the planning mechanisms like the land ceiling
providing opportunities for the poor workers to occupy various land parcels.
Breman (2004) estimates that more than fifty corporate textile mills closed their gates
during the last quarter of the 20th century, pushing nearly one hundred thousand
workers into the informal sector of the economy. Most of these workers were living in
chawls or informal settlements. The chawls were degrading and the populations in the
informal settlements were increasing. Another highlight of centralised planning in this
era was the promise to build grand projects of public housing, often in the name of the
poor. The AMC and other state agencies constructed a number of low-income housing
developments but, given the politics involved in identifying the right ‘beneficiaries’, the
public housing built in the name of the poor was subsequently occupied by the middle
or lower-middle classes. The various schemes and programs of the government
have proved largely ineffective in addressing the systemic causes of slum
formation and in meeting the basic services needs of the urban poor. The failures
of urban governance in dealing with housing issues of the poor are well
documented by a number of researchers for the case of Ahmedabad (Kundu &
Mahadevia, 2002; Anand, 2008; Annez et al., 2010, 2012).
The informal housing market operates exactly like a formal housing market: with actors
like proprietors, renters, agents and financial mechanisms like deposits, loans and
rents outside the purview of legal-regulatory mechanisms. The key aspect of
affordability is generated out of the fact that the land is disputed and the risk of
investing here is higher, compared to the formal housing market, so the land value is
reduced. The availability of informal settlements provided much needed shelter security
for poor people in Ahmedabad through the decades of industrialisation. Due to the
systemic failure of the city-state and its planning regime of land reservations and

113
ceilings, the disputes over land were systematically created. In some cases, the poor
people informally transacted and occupied the disputed land, and in other cases, the
local politicians supported and later protected them to occupy the government land.
The evolution of informal settlements in Ahmedabad illustrates how the planning
regime has nurtured the informal devleopment, albeit, unintentionally. It failed at
multiple level; the planning ideas overlooked the property rights, the plans were never
implemented and the land was mis-mananaged. In many ways, these case illustrates
what Annaya Roy calls the ‘informality from above’ (Roy, 2009, pg.84).
The insecure tenure of the land for the poor cannot be reduced to the sweeping
generalization of the ‘illegal encroachment of land’ by the slum dwellers. The process
of slumming occurred due to mismanagement of land, weak enforcement and lack of
affordable housing for the poor. The low-income housing needs were expanding and
there was a short supply in this segement, both from the public and private sector. This
gave rise to the slumming, enchroaching and occupying of public and private land and
in the words of Solomon Bejamin ‘occupancy urbanism’ in Ahmedabad (Benjamin,
2008).Similarly, in Western Ahmedabad and elsewhere in Eastern Ahmedabad, poor
people occupied the low-lying areas of the riverfront and around a number of lakes.
They occupied national government land, which was not effectively guarded against
illegal occupation locally. Informal housing became a way of affording housing in an
industrializing city.
4.3.2 Bottom-up approach of Slum networking projects
With the national economic liberalisation policies of the 1990s, the already
industrialised centres like Ahmedabad got further impetus in industrial growth. Since
the 1990s, the state has moved on to a higher-growth trajectory, inviting investments
into mega industries and a burgeoning middle-class raising the demands for real estate
development and service-sector expansion. In the last two decades, Ahmedabad has
shifted towards an industrial base of pharmaceutical, automobile and engineering, agro

114
and food processing, textile and apparel, chemicals and dyes and information
technology industries, and in the past decade, as a centre for education and health
tourism. Along with the industrial growth and the service sector expansion, there were
needs for the low-income workers to house themselves in the city.
The Ahmedabad municipal corporation collaborated with some prominent NGOs to
conceive ‘slum networking program’ in Ahmedabad in the late 1990s. Starting from
1999, ‘slum networking’ was the only multi-faceted, comprehensive program (a set of
projects relating to housing, services and micro finance) in the slums. The program was
based on the idea of integrating the slums with the city level infrastructure in terms of
service networks and allowing poor people to build their own housing in an incremental
way. This was a major shift from the conventional ‘slum clearance’ approach in earlier
decades by the state and the city government to one of environmental upgrading of
slums based on community participation and by developing the network between the
municipal corporation, NGOs and possibly private sector funders. As per this program,
the community would be mobilised to pay the one-third cost of the capital investments
in the water, sanitation, streetlights and paving and they will continue to pay the regular
service charges. The Municipal Corporation pays two-thirds if there are no private
sector funders to pay for the remaining one-third share. In some cases, the municipal
corporation paid up to 90 per cent of the cost, taking only a token contribution from the
slum communities. The municipal corporation also gives a ten-year no-eviction
guarantee to the slum dwellers to encourage them to pay the infrastructure costs.
This program was carried out in 98 slum settlements involving more than 14,000
families. Figure 4-2, based on an unpublished study (Panchal, 2005), shows the
conditions of living, i.e. housing type, access to water and toilets, have improved for the
slum dwellers taking part in the program. The slum networking projects had presented
an effective mechanism for integrating the informal settlements with the rest of the city.
Many researchers have argued for its scalability and possible improvements in the

115
operationalization showing multiple benefits to the slum communities (Tripathi, 1999;
Dutta, Batley & Sidhartha, 2000; Bhatt, 2001; Samad, 2006; Das & Takahashi, 2009;
Joshi & Khan, 2010; Mahadevia, 2011; Russ & Takahashi, 2012).
Figure 4-2 Impacts of slum networking project in Ahmedabad
The municipal
corporation
received the
‘international best
practice award’ for
these innovative
practices in 2006
after which AMC
shelved the whole
program. The
communal violence
in 2002 had already reduced the momentum of the program. But the introduction of the
highly subsidized public (social) housing programs under the ‘basic services for the
urban poor’ component of the Jawaharlal Nehru National Urban Renewal Mission
(JNNURM) in 2005-06 took away the attention of the government from the slum-
networking program. It was convenient for the city government to simply build
thousands of housing units instead of being involved in the slow and complicated
community-centric incremental housing activities where the slum dwellers were being
given rights to live where they were, controversially, living. Ironically, the JNNRUM
component was named ‘basic services for the urban poor’ under which the slum
networking projects could have been scaled up and expanded in the remaining 600 or
more slum pockets (as per the 2001 survey). Instead, the state and the city
government chose to build about 19,000 public housing units on the peripheries of the
city. Behind this shift in the informal housing policy – from the bottom-up approach to
Source: Based on Panchal (2005)

116
the conventional top-down approach – was the new, emerging urban politics, which is
discussed in the following section in detail.
4.3.4 Emergence of ‘development-rhetoric’ and displacements
The last decade has seen another shift in the political economy of the state and its
manifestations in urban development, especially in Ahmedabad. The political base
created by the Hindu nationalist political organisation called Bharatiya Janata Party
(BJP) over the last two decades has turned to development-centric rhetoric. BJP has
won all three state assembly elections since 2001 on growth-based promises. This
development-centric rhetoric is constituted by a combination of the neo-liberal
tendency of the state, for example, showcasing investments in various sectors through
‘Vibrant Gujarat Global Summits’, and by arousing the aspirations of the middle-class
within the subtler context of Hindu nationalism. The development-centric rhetoric is
translated into actions like the city beautification projects e.g. Sabarmati Riverfront
Development Project, Kankaria Lakefront Development Project and transportation
projects e.g. Bus Rapid Transit (BRT). This development-centric rhetoric prevalent in
the Gujarat politics is another manifestation of Shanghai dreams (as discussed in
Chapter-1), where cities such as Ahmedabad are imagined as Shanghai – urban
landscape of tall towers, glossy facades, flyovers, elevated roads and beautiful
waterfronts - the cities which are clinically sanitised of poverty and disparity.
To point out one of the adverse consequences of these projects on the lives of the poor
people; the projects have resulted in the forced evictions of an estimated 15,000
families21 living in the slums in last seven years without effective resettlement plans.
Any dissent or resistance to these projects has been subdued politically and a phrase -
‘vikas ma vivad nahi’ (no disputes in developmental works)22 - depicts the populist
sentiment by which the dissent is diluted. Having lost any political or civil society
21
Author’s own estimate based on Desai (2012) and SEWA Union (2010) 22
Quoting the resolution number 1677 of the AMC standing committee published as a forward in the municipal budget of the year 2013-14 (AMC, 2013; pg.2).

117
opposition, a number of public interest litigations have been pursued by NGOs in the
Gujarat high court against these major urban development projects in Ahmedabad.
With the shrinking space between civil society and the city government to interact on
any contested developmental ideas, the traditional ways of dealing with urban issues
by negotiation and consensus-building are being subverted. Consensus building over
critical urban issues is being replaced by new form of top-down governance, in which
urban planning is an inseparable component. Navdeep Mathur (2012) demonstrates
the limitations of this emerging form of governance by citing the case of the Sabarmati
Riverfront Development Project.
Figure 4-3 Forced evictions from the newly built riverfront in Ahmedabad
Low-income and poor
people’s housing is
not merely an issue
of capacities to
produce bulk public
housing, but of
ensuring shelter
security for everyone
in the city, in the most
inclusive way.
Given the lack of cheap land pockets in the central parts of the city, all the public
housing projects are located in the far off peripheries of Ahmedabad. Researchers
Navdeep Mathur and Renu Desai in separate studies (Mathur, 2012; Desai, 2012)
have documented the experience with this new public housing built since 2005 and the
underlying politics that guided such decisions. The 19,000 dwelling units built with the
national grants were being used not to increase the housing stock for the poor in the
city but to house the forcefully evicted families from informal settlements to get the land
Credits: Dr. Renu Desai, Center for Urban Equity, CEPT University

118
for the various projects like the Sabarmati Riverfront Development Project, Bus Rapid
Transit (BRT) project and the Kankaria Lakefront Development Project.
In a response to public interest litigation (PIL) filed in the year 2004, The High Court
directed the city government in the year 2006, not to evict any families unless they are
given alternative housing. The city government obliged by using the funds of ‘basic
services of the urban poor’ to build public housing to resettle the evicted population.
The city level informal housing policies in the last decade affected poor people
adversely in multiple ways; one, by abruptly ending the progressive and community-
centric slum networking projects, two, by forcefully evicting thousands of families and
pushing them into the peripheries and three, by using the funds meant to increase the
standard of the low-income housing stock in the city for the resettlement. And
meanwhile, the population in the informal settlements continues to grow, the slum
density continues to increase and the newer areas continue to be occupied. This thesis
examines whether the evicted poor families have been socio-economically
marginalised as well as spatially peripheralised. A detailed discussion is carried out in
Section 5.3.1.
Political theorist Partha Chatterjee (Chatterjee, 2004) argues that these visible contests
over urban resources (like land) are the terrain of the ‘political society’ as against the
classical notions of civil society. The demands of electoral mobilisation overlapped with
the logic of welfare distribution and political constituencies emerged and prospered
from the informal settlements of the city. Given the unavailability of resources and weak
enforcement capacities, it was not practical for the city government to insist that the
poor first mend their ways and turn into ‘proper citizens’ before they become eligible for
government benefits. Urban researcher Mihir Bhatt (Bhatt, 2001) notes that, with
almost one-third of its population living in slums, the AMC functioned, until the early
1990s, as a small welfare state. It deliberately made life easier for the poor by applying
a regime that did not enforce anti-poor regulations, while tolerating squatter

119
settlements on public and private land and allowing public space to be used for
income-generating activities, with forced evictions being rare. The urban poor in turn
provided labour and services to middle and upper class urban dwellers. Over time, the
AMC began to send property tax bills to the informally living slum dwellers, and the
poor complied by paying them, which was also a way of imagining their rights and
raising claims over the land. Thus, the informal and the formal had active interactions
with each other and their interests often intertwined to maintain the mostly peaceful co-
existence. This relationship gave the poor the space they were looking for in a city, if
not their rights or citizenship. The slum-networking program in Ahmedabad was
situated in this context of complex relationship between the poor and the city
government. Unfortunately, this relationship and space for negotiations between the
poor and the city has been completely subverted in the last decade.
4.4 The land use planning and transport characteristics
Apart from the ‘green belt’ and the land ceilings imbroglio, land use planning efforts in
Ahmedabad have been fairly successful in developing the ring-radial spatial structure
and planned mixed land use areas in the city. Last two development plans starting from
the 1990s have seen better compliance and implementation compared to the earlier
ones. The population density of the pre-2006 AMC area was about 190 persons per
hectare (pph) and the density new extended AMC area (post-2006) is about 120 pph.
In an international comparison of urban densities, Alan Bertaud (2004) demonstrates
that Asian cities and especially Indian cities are much denser than to North American
or European cities. Desai (2005) demonstrates, based on land use – transport
indicators and satellite images, how Ahmedabad continues to be relatively compact
compared to other Indian cities of a similar population size like Pune, Hyderabad or
Bangalore. However in recent times, commercial-industrial activities have increased on
the periphery after the building of subsequent ring roads.

120
The city’s planning authority, the AUDA (Ahmedabad Urban Development Authority),
has laid out road infrastructure over a 10 km radius outside the municipal limits. There
are also low-density residential zones called R3 and R4 zones with a width of 2.5 to 3
km on the Western periphery proposed by the development plan of 2001, that survived
intact in the revised draft development plan released in 2013. There has been
significant urban sprawl with the development of low-density, high-income housing in
gated communities in the R3 and R4 zones. The new middle class housing (in Bopal-
Ambali area) has developed beyond the low-density R3 and R4 zones increasing the
travel distances on the western periphery. In a systematic study of change in spatial
structure of Ahmedabad, Adhvaryu (2011) finds decline in density gradients and
suggests that Ahmedabad's population is gradually dispersing. As a result, housing for
the low-income groups are available only at a distance of about 15 km from the centre
on the Western periphery. Traffic congestion and unaffordable housing have forced the
low-income groups to either move further or to further crowd the existing informal
settlements in the core areas. Besides, there is also an official attempt to push the poor
and low-income groups to the periphery. Under the draft development plan of 2013, a
new affordable housing zone is being proposed adjoining the outer most ring of the
city. The outer most ring (Sardar Patel ring road) is located on an average radial
distance of about ten km from the city center and it is poorly served by public transport.
Regardless of the attempts to push the poor and the low-income groups to the
periphery, there is a high demand amongst the middle and high income groups to
prefer to stay on the periphery of the city. Urban researcher Bhargav Adhvaryu finds a
strong correlation between density gradient and increasing vehicle ownership in
Ahmedabad (Adhvaryu, 2010). The middle and high income groups are moving out
from the centre to the periphery with the increasing motorisation in Ahmedabad.

121
Figure 4-4 Proposed affordable housing zone in the draft development plan 2013
The total number of
vehicles in Ahmedabad
has increased by a
factor of 170 in 40
years (AMC-CEPT,
2008, p. 32).
Ahmedabad has also
experienced a great
increase in the number
of two and four-
wheelers. The privately
owned motorised two
and four wheelers are increasing with sustained annual growth rates of 12-13 per cent
and 7-8 per cent respectively. There are more than 100,000 vehicles being added in
the city every year. By 2012, a total of 2.85 million vehicles were registered in
Ahmedabad district 23 , including 0.42 million four-wheelers and 2.02 million two-
wheelers as per the Table 4-5. Increasing vehicle numbers in the city and growing
reliance on them for daily commuting has led to traffic congestion, specifically in the old
(walled) city areas where road widths are already narrow, causing high carbon
emissions as well as pollution.
Table 4-5 Registered vehicle population in Ahmedabad District24
Type of motorised vehicles / years
2009-2010
Annual growth rate 09-11 (%)
2010-2011
Annual growth rate 11-12 (%)
2011-2012
Private 4Ws 339055 13.13 383588 12.02 429688
Private 2Ws 1728522 8.51 1875658 7.82 2022424
Auto Rickshaw 115699 10.84 128240 8.85 139587
23
The vehicle registration data is not available at the city level. However, Ahmedabad city and its outgrowths are consisting of 90 per cent of the population in the district, as per the census 2011. 24
Since there is no system of de-registration of old, defunct vehicles, there is a systematic over-estimate of registered vehicle on Indian roads (Mohan, 2013). That is why it is better to observe additional number of vehicles and not the absolute number of registered vehicles.
Source: Volume 1, Draft Development Plan, AUDA.

122
Buses/school buses 24144 1.81 24582 2.88 25289
Goods vehicles 183212 7.42 196815 8.76 214058
Commercial 4Ws 12169 9.17 13285 11.10 14760
Other govt. vehicles 10089 9.19 11016 7.14 11802
Total vehicles 2412890 9.13 2633184 8.52 2857608
Source: Based on the data from Regional Transport Office (RTO) of Ahmedabad
Munshi, Brussel & Zuidgeest (2008) observe that the total per day trips in Ahmedabad
increased from 5.55 million in 1988 to 6.54 million in 2006, but the average trip
rate/person decreased from 1.57 in 1988 to 1.1 in the 2000 and 2006 surveys. The
decrease in the trip rate is possibly indicative of fewer discretionary trips like shopping
and recreation being made in the city or greater trip-chaining practices. Besides, some
transport studies in the past have not taken in account the walking trips. It is observed
that the average trip lengths have increased from 4.6 to 5.6 km in 2001 and to 6.2 km
in 2006. But most of the trips are short distance trips: for work very few trips are longer
than 10 km and for shopping very few trips are longer than 2.5 km.
Table 4-6 City level modal share, Ahmedabad
Over the last few decades, Ahmedabad has transformed into a polycentric city from a
traditional mono-centric city. Munshi, Zuidgeest & Brussel (2011) observed that
development of employment sub-centres and poly-centrality has played a major role in
reducing the average trip lengths in the city. There are as many as 34 employment
sub-centres, 12 of which have substantial employment. These sub-centres are a
combination of traditional bazaars, modern markets, warehousing facilities and
industrial estates and service industries, which are not exactly planned but developed
through market pressures, which reflect the benefits of agglomeration. In his PhD
Mode share in different studies
Walking Cycle Public bus
Shared auto rickshaw
M2W Auto rickshaw
Cars Others Total
LB-GIDB study 2000 1
37.6 17.6 8.4 5.7 25.3 2.5 2.5 0.3 100
AMC-CEPT 2006 2
13.2 18.8 15.0 - 35.0 8.8* 3.1 5.8 100
22 14 16 - 25 6* 17 - 100
Notes: * Shared auto-rickshaws trips are assumed to be part of this as it is not mentioned separately. 1 As quoted by (AMC, AUDA & CEPT University, 2007)(Detailed Project report for BRTS Phase -1) 2 As quoted by (AMC-CEPT, 2008)(Detailed Project report for BRTS Phase -2)

123
thesis, Talat Munshi (2013) asserts that the formal public transport has had no role in
the development of the sub-centres. Conversely, the development of employment sub-
centres has also not led to the rationalizing of public transit routes either. The provision
of public transit is concentrated towards the central core and does not coincide well
with the locations of sub-centre formation.
Three different reports 25 published in the last fifteen years have produced very
different, unmatching mode share values for the city of Ahmedabad. All three reports
are not comparable and since their methodologies are not described in detail, it will be
wrong to assume any trends over the years. However, it is possible that there has been
some reduction in walking because of the perceived danger, sprawl of the city and
other modes being affordable with rising incomes but it cannot be clearly concluded on
the basis of these reports. Focusing on the broad similarities of these values, the share
of motorised two-wheelers has clearly grown to dominate the city traffic, and now
comprise about 70 per cent of the total motor vehicles in Ahmedabad.
Munshi, Brussel & Zuidgeest (2008) observe that the share of two wheelers for work
trips has almost doubled in two decades; the shift has been from public transport and
non-motorized modes. As per their study, the shift from public transport can be
attributed to the poor access these modes provide to employment locations, and the
overall central orientation of the public bus routes. The bus-based public transport has
not had significant increase over the years. The shared auto-rickshaws have been a
popular option in place of public buses amongst the low-income and middle-income
groups in the city.
Ahmedabad roads are unsafe and there is an increasing instance of road crashes. In
2007, 2,605 collisions occurred on Ahmedabad’s roads, of which 248 (9.5 per cent)
25
There have been three major transport studies in the city in the last decade or so. The first was the ‘Integrated Public Transport System’ by Louis Berger Group and GIDB (Gujarat Infrastructure Development Board) in 2000 (Louis Berger-GIDB, 2000), and the second and third were the detailed project reports for the metro rail and BRT in 2005 (DMRC-AMC, 2005) and 2006-08 (AMC-CEPT, 2007) respectively.

124
were fatal. A further enquiry into these crashes also indicated that in 42 per cent of
cases victims were bicyclists and 19 per cent pedestrians (AMC-CEPT, 2008, p. 33).
This means that 61 per cent of those affected by accidents were NMT mode users. The
city roads have only few, dis-continued stretches of dedicated space to walk or to
bicycle. The GVK-Emergency Medical Research Institute, which runs the main
ambulance services, indicated that of the 96,669 vehicle accident emergencies
reported in the state between January-November 2010, Ahmedabad topped with 16
per cent (15,776), making it the city with the most unsafe roads in Gujarat (Shastri,
2010).
4.4.1 Public transport
The bus-based public transport (known as Ahmedabad Municipal Bus Service – AMTS)
has seen many ups and down since 1947. It is one of the oldest urban transport
organizations in the country. In the last decade AMTS has seen a sharp decline and
then a recovery in its performance. Between the years 2000 to 2005, the AMTS-owned
bus fleet changed from 752 to 371 buses and an average of 0.35 million passengers
were carried per day. The modal share of AMTS was just 7 per cent in 2005. After a
continuous decline in commuters and the bus fleet to 2005-06, the AMTS decided to
hire private CNG buses and use them as public transport. At the end of 2009, there
were a total of 728 buses run by AMTS on 157 routes (AMC, 2010, p.2), which
consisted of its own fleet and a fleet of other private operators. The bus fleet in 2011
was 600-650 (Parikh, 2011). Minimum and maximum fares in AMTS used to be INR1
and 14, which were also increased to INR 2 and 21 in January 2012 resulting in a
further dent in ridership.
The other important (intermediate) public modes of transport are auto-rickshaws. For
many years now shared auto-rickshaws have become substitutes for the public bus on
account of lower fares and more demand-oriented routing. In 2005, 43,865 auto-
rickshaws were registered with the Road Transport Office of Ahmedabad (WSAPL-

125
MoUD & WSA-MoUD, 2008) which have become 139,587 in the Ahmedabad district
over the years. Discounting the peri-urban rickshaw services operating in the absence
of public transport, the number of auto-rickshaws has increased two-fold in the city
itself. This indicates a strong and rising demand for mobility that the official public
transport service is not able to fulfil. From July of 2004, all the auto rickshaws in the city
were converted to Compressed Natural Gas (CNG) based engines. Ahmedabad was
one of the pioneering cities in implementing transport initiatives like CNG conversion of
both bus-based public transport and of the auto-rickshaws. The auto-rickshaw drivers
were helped to procure loans to buy CNG engines (Rana, 2011). The change in fuel
did reduce the air pollution levels in the city temporarily between 2008-2011, before it
began to rise again with the growing number of motor vehicles.
Figure 4-5 AMTS performance over the years as presented by Parikh (2011)
Source: Page 6, Parikh (2011)
4.4.2 The BRT and its promises
As a landmark decision for public transport in the city, the Ahmedabad Municipal
Corporation (AMC) decided to construct a BRT (Bus Rapid Transit) system in 2006.
This coincided with the launching of the Jawaharlal Nehru National Urban Renewal
Mission (JNNURM) and the National Urban Transport Policy (NUTP) in 2005 and 2006
respectively. The willingness of the central government to fund a large portion of the

126
project cost of BRTs in all million-plus cities encouraged the Ahmedabad municipal
corporation to go ahead with its planning. Ahmedabad was among the first to seize this
opportunity and submitted a DPR (detailed project report) to the JNNURM. The project
was approved in the year 2006 and the work started in 2007. The sanctioned length of
the project is 88.8 km and it is divided into two phases. The first phase is of 58.3 km
and the second phase is of 30.5 km. There were expectations, and optimism, of getting
well-laid roads, creation of road space for pedestrians, bicyclists and vendors,
management of on-street parking and mainly, the provision of an efficient and reliable
bus system promised in the DPRs of 2006 and 2008. This project was ambitiously
named ‘Janmarg’ (people’s way) and the first phase was opened in October 2009.
The Ahmedabad BRT system stands out amongst the Indian cities in having about 82
km of rapid transit network, which continues to expand. Janmarg was the first BRT
Project in India, which aimed at creating a city-wide network in the first proposal itself,
rather than delineating a few isolated corridors like in cities such as Delhi, Pune and
Jaipur26 (Mahadevia, Joshi & Datey, 2012). It was decided to create a project on the
lines of Bogotá’s famous BRT Transmilenio, with bus stops in the middle of the median
bus lanes and using physically-segregated bus ways with BRT buses running
exclusively on them (Suzuki, Cervero & Luchi, 2013). The first BRT corridor was
designed by following the idea of connecting ‘busy places but avoiding busy roads’ so
as to minimize resistance from private vehicle users, as had occurred in Delhi and
Pune. The first corridor in Ahmedabad did not create any visible problems of
congestion for private vehicle users when it started operations because it returned
back a similar amount of road-space. This gave a wide recognistion to the BRT system
in the city. Most of the operational BRT corridors have been placed on roads of 30 m or
more in width, and maximum road space has been left for the mixed traffic, sometimes
26
This researcher along with others has studied this system in detail and evaluated it as part of a larger study supported under the project called ‘Low Carbon Mobility in India’ by United National Environment Program (UNEP).

127
at the cost of cycle tracks and footpaths. On the road widths of less than 30 meter, the
BRT runs on single, mono-directional, one-way segregated bus lanes.
The Janmarg team has remained conscious of the importance of branding and social
marketing of the project, especially amongst the vocal middle-classes. This also fits
into the larger politics of the state government of showcasing ‘development’ in the city
and giving credit to the political leadership. Janmarg could be said to be one of the
highly publicised government projects in Gujarat, through advertisements in the
newspaper, special articles extolling its successful use during cultural festivals and
above all, free use of the system for the first 3 months following its launch, between
October to December 2009. Local media frequently reported about the system, for
example on future plans, facilities introduced on the corridors, opinions of well-known
people, etc. All these have added favourably to the system’s image locally, nationally
and internationally. The public bus systems in India are generally associated with poor
services and Janmarg worked hard to remove this image. Most stations are kept clean,
the frequency of buses is well maintained, and customer support staff is available.
Meanwhile, the BRT of Ahmedabad has attracted global as well as national awards as
a prime example of best practice in the field of public transport (Suzuki, Cervero &
Luchi, 2013). By December 2011, The Janmarg was carrying about 0.15 million
commuters per day with daily revenues of about INR 0.9 million and the network length
was about 45 km (NIUA, 2011). But since then there has not been any increase in the
number of commuters although the network has expanded to about 82 km (Times of
India, 2014; Tewari, 2014).

128
Figure 4-7 Ahmedabad BRT corridor
Figure 4-6 Ahmedabad BRT network and phases
Source: From Suzuki, Cervero & Luchi (2013) pg. 98 attributed to COE-UT-CEPT (2012)
The main reason being given for the Ahmedabad BRT’s stag nating ridership is the
lack of feeder system (Cervero & Dai, 2014). In fact, the exclusive branding of the
Source: http://en.wikipedia.org/wiki/Ahmedabad_BRTS , Creative Commons Attribution 3.0 Unported

129
‘Janmarg’ also created a schism between the two bus services, the AMTS and the new
BRT, owned and operated by the same entity, the AMC. The BRT was getting
associated with the new, swanky services whereas the AMTS services began to be
more irregular, financially depleted and facing slowed speeds due to increasing mixed
traffic. In a detailed study of organisational behaviour, Parikh (2011) depicts how the
BRT is operated by a public sector ‘special purpose vehicle’ (SPV) with corporatised
bureaucrats as its office bearers whereas the AMTS is still operated as a conventional
government agency with political representatives and employee trade unions. On the
corridors where the BRT is operated, the AMTS services have been stopped and on
some of the new corridors, both AMTS and BRT compete with each other. The growth
of BRT did not improve the condition of public transport in general given the weak
institutional and physical integration with the AMTS bus service. There are no plans, at
least in the public domain so far, to integrate the two in terms of road-space sharing,
bus stops or other resource sharing, fares and ticketing or even creating a common
marketing strategy for public transport in the city. The BRT of Ahmedabad has
remained an exclusivist public transport project which successfully expaneded its
network over a period of time but the larger goal of public transport improvements were
not achieved in the city.
Further to this, there are also plans of implementing a metro rail based mass transit in
Ahmedabad. The proposed route of the metro rail project has changed three times in
past eight years and they have been lot of speculations about the feasibility of the
project (John, 2014; DNA, 2014). But in February 2014, the detailed project reported
was sanctioned by the Government of India and INR 1 billion are allocated for the
project in the annual budget of the current year (Business Standard, 2014). The first
phase of the project costing INR 106,750 millions is expected to be completed in the
year 2018 and it aims to carry about half a million commuters daily (Indian Express,
2014). The total length of the proposed metro project is 36 km. As per the draft
development plan of 2013, there are proposals of giving upto 4 FSI (floor space index)

130
instead of the current 1.8 on all the mass transit corridors with the metro rail or the BRT
to facilitate ‘transit oriented development’ (TOD) in Ahmedabad (AUDA, 2013). This
proposals of TOD are expected to significantly change the cityscapes and the mobility
pattern of the city. Given the experiences of the lack of integration between the BRT
and the municipal buses and the affordability issues in Ahmedabad, similar issues
could be enticipated after the implementation of the metro rail project in next few years.
The question, however, remains whether the future public transit in Ahmedabad would
facilitated the mobility of the poor or not.
4.5 Mobility of the poor in Ahmedabad in recent literature
In last five years, a Dutch academic institute27 has produced number of academic and
professional research projects related to travel behaviour and built form characteristics
in Ahmedabad along with the accessibility issues of the poor. Two of these research
reports (Wati, 2009; Zuidgeest et al., 2012) employ the prism of ‘social exclusion’ to
measure and understand the mobility of the poor in Ahmedabad and these two reports
are discussed and critiqued in detail in the following section. Whereas Zhen (2013)
measures the job accessibility for the urban poor in Ahmedabad through geo-spatial
modelling by building footprints on the base created by Zuidgeest et al. (2012), the
latter being a technical report funded by the World Bank. In terms of contents or
arguments, Zhen (2013) does not offer any additional insights over Zuidgeest et al.,
only methodological innovation.
Kala Wati (2009) in her masters’ thesis presents a case of transport-related social
exclusion for the urban poor in Ahmedabad and claims that it is ‘highly prevalent’ in the
city (Wati, 2009: 102). The thesis measures social, physical, financial, human, political
and transport capital based on various indicators in different wards in Ahmedabad. The
transport capital is represented by transport infrastructure indicators such as amount of
unpaved roads, road lengths in the ward (based on the 2001 SEWA-AMC data) and by
27
ITC, the Netherlands: www.itc.nl

131
transport usage indicators such as non-motorised vehicle ownerships and number of
walking and cycling trips reported in the primary household surveys. The thesis goes
on to describe how social exclusion increases while moving away from the city centre
and the Eastern parts being more excluded then the Western parts. This study
concludes that overall exclusion per ward is strongly correlated with the transport,
human and financial capitals. The ‘socially excluded’ households had a substantially
smaller activity space than the ‘well-off’ clusters. The activity spaces gradually increase
away from the city centre but they don’t increase consistently while the other transport
deprivations increase.
One major limitation of this study, which is also highlighted by the author, is that it does
not capture the actual experiences of exclusion of poor households. Otherwise, this
important study definitely lays the groundwork for further debate on the issues of the
mobility of the urban poor in Ahmedabad. Secondly, this study defines the ‘transport
capital’ based on the amount of walking and cycling trips, along with non-motorised
vehicle ownership. In other words, the extensive amount of walking and cycling trips
amongst the surveyed population leads to possible transport-related social exclusion,
especially in situations where public or private motorised transport is not affordable.
Here, poor cyclists and pedestrians are viewed typically as ‘captive users’. This is a
problematic position. Higher reliance on walking and cycling cannot be reduced to the
possible exclusion of the trip-makers unless the trip distance, time taken and quality of
experiences are taken into account, which is not done by Kala Wati’s study. It is
possible that the walking and cycling trips indicate the issue of affordability for the
urban poor but again, lack of affordability doesn’t necessarily mean any form of
exclusion unless it is proven through different types of indicators encompassing the
experience of the usage. Not being able to access motorised transport due to
affordability, location or any other constraints does not necessarily lead to exclusion.
As discussed earlier (Section 2.4), it is possible that the poor retain a sufficient or even
high level of accessibility in spite of exhibiting lower levels of mobility.

132
Similarly, the stronger correlation of transport capital with physical, social or financial
capital indicates that this correlation needs to be probed further. It is possible that the
poor people who rely more on walking and cycling have a lack of physical and financial
resources and other deprivations in their daily life. But it would be inappropriate to
assume that walking and cycling every day for a short distance amounts to any form of
deprivation. On the contrary, it would be a preferable form of transport from the low-
carbon development perspective. Besides, the concept of poverty also encompasses
the issues of physical, social and financial capital like the ‘social exclusion’ framework,
which may not be the appropriate framework to be used in the Indian urban situations.
This is discussed in detailed in Chapter - 2.
Zuidgeest et al. (2012) is another important study where an accessibility analysis of the
poor is carried out based on geo-spatial modelling. This report takes accessibility as a
measure of social exclusion and they develop metrics based on GIS tools to map the
accessibility of the urban poor to the employment locations by using public transport
(AMTS, BRT and proposed metro rail) in combination with non-motorised modes (as
access-egress modes) from their residential locations. This study uses the 2001 slum
locations data for the residential locations and the 2011 property tax data to determine
employment locations. The study further models the AMTS, BRT and the proposed
metro networks as one multi-modal public transport system of the city. Zuidgeest et al.,
(2012) in their summary conclude that the low-income dwellers in cities such as
Ahmedabad experience ‘the highest levels of social exclusion’ as they spend ‘long
daily commutes to and from low-paying jobs’, on ‘overcrowded public transport
vehicles’ for which fares continue to rise.
In terms of action points, Zuidgeest et al. suggest more investment in AMTS bus
services as that network clearly ‘provides a high level of job accessibility to the urban
poor’. This is a particularly important conclusion as it was discussed earlier (in Section
4.4.1) that AMTS is already a subsidiary mode in the city, which is struggling to

133
maintain a good level of service. The report concludes that compared to walking, public
transport does improve job accessibility, particularly through the extensive AMTS
network that can be accessed relatively easily from all locations in the city. The current
and planned investments in BRTS and MRT improve this accessibility to jobs
considerably further, but mostly in the catchment areas of these systems. And the
report subtly suggests providing more careful attention to the routing of the BRT: that it
should ideally connect the residential and job locations of the poor and other income
groups.
However, there are some limitations in the work of Zuidgeest et al (2012). This report
models the public transit networks in the city based on the spread of formal jobs and
residential locations of the poor and presents a hypothetical possibility of whether the
poor can access the job locations or not. But it is not known whether the poor actually
use these networks to access those jobs or whether the poor do these jobs. The
assumptions that the poor access jobs in that way are not backed by any primary
survey of the poor. The approach to modelling is top-down and imagined on the basis
of transport supply. For example, other studies (Mahadevia, Joshi & Datey, 2012;
Khanna, 2009) have shown that the poor are not active users of the BRT given the cost
and the other access barriers, in spite of close proximity. So it is possible that in spite
of being close to the formal transit networks, the access issues still persist due to
affordability or other issues. Secondly, this report takes travel time and distance as
important parameters and measures the accessibility to jobs through the exponential
decay function. But it doesn’t take into account the fare costs of travel, which is an
important factor for the poor in choosing their modes of travel.
In spite of being an important accessibility modelling exercise involving the poor in the
urban Indian context, Zuidgeest et al.’s study raises some pertinent questions about
the way in which the transportation planning discourse based on quantitative analysis
is being carried out. The discourse in that report and the other BRT project reports

134
presents a great confidence in technical tools, models and graphical exercises to
prepare the proposals about how transport should be planned in the city. In spite of the
rhetoric about the accessibility of the poor and their inclusion in planning efforts, this
discourse still remains top-down, of imagined systems and their possible benefits for
the poor. These imagined systems work differently in reality given their socio-political
usages and motivations. The discourse is not built on bottom-up perspectives of how
people negotiate their travel in the city and, given better transport facilities, how likely
they are to improve their lives.
4.6 Conclusion
This chapter presents the case of Ahmedabad and reminds the larger debates of urban
planning, informality and poverty discussed in Chapter-1. In Ahmedabad, the contests
for space and resources are intensified in the transport realm by on-going motorisation.
Over the years, Ahmedabad has seen a shift from a manufacturing industrial base to a
service sector focus. There is a rise of retail (often informal) trade in the city along with
self-employment. However, with increasing propulation growth and rising income, the
slum population continue to grow in the city and the transition into formal housing is not
widely seen.
Ahmedabad has developed a polycentric, ring-radial urban form based on mixed use
and dense urban districts. Much of the present urban form is oblivious to, or in spite of,
the directions in the official development plans and planning activities. Having failed to
provide adequate housing through any governmental mechanism, the official urban
planning policies on the contrary unintentionally created ‘illegalities’ and opportunities
for slum formations. Some of the grand plans were never implemented or were
systematically subverted. The poor in turn found their way of survival in the city by
squatting for shelter through informal transactions. They often had the necessary
political patronage for survival in the city; this patronage based on the democratic

135
rhetoric of citizenship and rights, different then from the traditional patronage of the
industrial capitalists.
There is again a shift in this relationship with the rise of the Hindu-nationalistic politics
combined with the neo-liberal policies from the 1990s. The new rising political class
rooted and supported by the burgeoning middle class lost their empathy towards the
poor, who were increasingly seen as hindrances to the grand infrastructure and the
‘city beautiful’ projects. The recent evictions of thousands of families, building of public
housing for resettlement on the urban peripheries and the complete closure of the
innovative slum networking projects prove that the state and the city government have
actively sustained the conditions marginalising poor people.
The transportation situation in Ahmedabad favours private motor vehicles as the public
modes like the municipal bus services are depleting. The city roads are congested with
traffic and the air quality is depleting. BRT was one potential positive intervention with a
promise of a comprehensive system seen in the last decade. It continues to expand
beyond the present network length of 82 km of corridors but the future plans are devoid
of any improvements in walking, cycling infrastructure, integration with the other bus
service, effective parking regulations or stringent traffic enforcement. In last three
years, the BRT has not seen any increase in its commuter base in spite of the doubling
of the network. With the prime focus on the BRT, the parallel running municipal bus
service is faltering and shrinking over the years. In the absence of the formal transport
services, the shared auto-rickshaws are the other, more widely networked options for
the commute.
These are the historical and socio-economic trajectories within which the mobility
practices of the urban poor in Ahmedabad operate. With the shrinking patronage from
the political class and lack of support from the state, the urban poor are left to their own
devices to deal with the difficulties in their lives. These contextual inferences are vital to
place and understand the mobility practices of the poor. In the following chapter, the

136
research will both quantify the mobility characteristics of the poor and unpack the
narratives behind their practices based on the qualitative data and attempt to answer
the research questions posed earlier, such as ‘how do the poor people negotiate their
mobility practices’.

137
5. Mobility practices and urban poor in Ahmedabad
This chapter discusses the first research question, ‘how do the urban poor negotiate
their mobility practices and transport opportunities in Ahmedabad’. The agendas raised
in the research question are explored by raising the following two sub-questions:
a. What are the mobility patterns of the urban poor?
b. How are those patterns negotiated by different sub-groups within the poor
based on e.g. gender, livelihood or varying locations in a city?
The main research question and its sub-questions are answered based on the primary
qualitative and quantitative data for Ahmedabad. For the quantitative component, the
household surveys were conducted and the previous day’s trips of all working adults
and upto two children were recorded. The trip details were recorded based on the
name of the localities. The survey team also carried the maps and quickly calculated
the distance between origin and destination of each trip recorded and verified them
with the respondents. For the qualitative component, personal interviews were carried
out. The respondents for this component were selected based on their age, gender,
location and means of livelihood.
Section 5.1 analyses the mobility characteristics such as mode use, trip length,
purpose, cost and time of the trip of the urban poor households in the city of
Ahmedabad collected during the primary survey. Along with this quantitative data, the
qualitative narrative, in section 5.2, unpacks how the urban poor negotiate their mobility
constraints. In section 5.3 the quantitative data outputs are further disaggregated
according to key social-demographic variables such as gender, age, income distributed
across various slum locations in the city. Both the quantitative data and the qualitative
narratives are presented together in this section. The chapter is concluded in section
5.4 by outlining the social practices related to mobility of the poor.

138
Figure 5-1 Outline of the current chapter
5.1 Mobility pattern of the urban poor in Ahmedabad
Section 5.1 outlines the mobility pattern of the poor (also known as travel behaviour)
based on the primary household survey. A detailed household survey was conducted
in Ahmedabad in October 2011 and the methods and sampling process for the same
have been presented in Chapter 3. A sample household survey form is attached in the
Annexure A-1. From each household at least 4 adult members and 2 children28 were
interviewed to note their trip details. The questionnaire was designed in such a way
that information regarding trips per week, multiple modes trips, trip chaining etc. is
28
If there were more than four adults or 2 children, the field workers were encouraged to fill up their details in an extra form but such instances were very rare that more than 6 members of the family have to ‘go out’ in the city. In essence, any household members who go out of the slum settlement were asked to give their details. Any trips within the slum settlement were not considered in this survey.
5.1.1 & 5.1.2
Mode use, trip length, trip purpose
5.1 Quantitative analysis – Mobility
pattern
5.2 Qualitative analysis – Mobility
practices
Residential location
Livelihood
Gender
5.3 Mixed methods – Variations in mobility and
negotiated practices
5.4 Conclusions
5.1.3
Hh income, trip cost and mobility
5.2.1
Mode choice dynamics
5.2.2
Affordability and mobility

139
recorded and quantified. The purpose of the household surveys was to quantify and
analyse urban travel characteristics of the poor people in the city of Ahmedabad. The
travel characteristics included are frequency of travel for various purposes, mode use,
destination, routes, cost/time taken for each trip. The trips recorded in the survey are
analysed by gender, income, employment and locations of various settlements. The
survey covered 12 slum settlements, located in the central city, at the periphery, and at
resettlement sites of east and west Ahmedabad. The following is a sample description
and basic demographic characteristics:
The survey covered 581 households, 3002 people, with an average household size
of 5.2 and sex ratio29 of 859.
The survey covered 3,428 trips; 1253 trips by women and 2166 trips by men. The
trip rate30/day for women is 0.9 and for men is 1.34. The sex ratio of trip makers is
578 women per thousand men.
The surveyed population’s literacy rate is 73.2 per cent, 65.6 per cent among
females and 79.6 per cent among males. Only 18.9 per cent people had education
beyond primary level31.
The workforce participation rate (WPR) of the population is 41.7 per cent, 23.1 per
cent among females and 57.6 per cent among the males.
Figure 5-2 Mean Monthly Household income - household size (Primary survey)
29
Sex ratio is females per thousand males. National average of sex ratio is 932 for 2011 30
Trip Rate – Ratio of total number of people and total number of trips per day 31
It was observed that those with education beyond primary level might only be able to perform some minimum functions such do their own signature and read minimum such as signs, instructions, etc.

140
Figure 5-1 shows monthly household income plotted across the size of the household.
The mean monthly household income is INR 6,049 for the sample population32. If top 3
per cent of the sample is removed than 97 per cent sample had income of less than
INR 5,684 per month. It is estimated that about 85 per cent of sample would fall under
the 2012 official urban poverty line as per the Government of India (INR 32/capita/day).
Table 5-1 Sample Description by Age, Gender and Education Level
Education level Female Male Total % of total population
Illiterate 475 331 806 26.8
Literate (read and write) 272 339 611 20.4
Primary education or up to 4th grade 516 676 1192 39.7
Old Matriculation or up to 12th grade 107 247 354 11.8
Graduation and above 14 25 39 1.3
Total 1384 1618 3002 100
Table 5-1 shows the distribution of the sample population by age, gender and
education level. Only 13.1 per cent population has education beyond primary level,
whereas majority of the population has either only basic literacy or no literay at all.
These numbers are more drastic amongst women, with only less than 10 per cent of
women having studied beyond primary level. This means that most respondents have
low education level and hence, possibly low-wage, low-skill based employment which
involves hard labour or manual work. In terms of literacy, women are proportionately
lagging behind as compared to men. For every two illiterate men, there are three
illiterate women.
Looking at the education and employment level of the sample population in table 5-2,
49.3 per cent of population is dependent, non-working population. The workers are
almost equally divided between the regular salaried, self-employed and the casual or
daily wage earners. The working women are only 23.1 per cent of the total women’s
population. There are 972 children in the sample population below 14 years of age, out
32
The monthly average income of Ahmedabad city was INR 8,928 in the year 2010.

141
of which 15 children have reported to be working indicating the cases of child labour. At
the same time, 23.3 per cent of children (below 14 years) are not attending any
educational activities and can be considered as possible child-labour cases. About
20.6 per cent of the sample population consists of women engaged as house
managers (housewives or in gender-sensitive terms - ‘domestic unpaid workers’) in
their own households.
Table 5-2 Sample Description by Age, Gender and Livelihood categories
Livelihood categories (aggregated)
Livelihood categories (disaggregated)
Female Male Total - people
% of total
working people
% of total population
Regular salaried
Salaried employment (regular waged)
76 302 378 12.6
13.8 Domestic Worker- fixed rate (domestic help)
26 10 36 1.2
Casual - daily wage daily wages employment (casual labour)
53 326 379 12.6 12.6
Self-employed
Self-employed work (work in h/h enterprise)
83 187 270 9.0
15.3
Transport Service Provider 4 69 73 2.4
Mobile Vendor (street vending)
3 28 31 1.0
Home-based paid worker (manufacturing etc.)
76 8 84 2.8
Total Working population
321 (23.1%)
930 (57.6%)
1251 41.7%
Non-working population (no wage earners)
Home based unpaid work (house manager)
603 21 624 20.8
49.3
Attending education 319 424 743 24.8
Pensioners/ remittance recipient
1 18 19 0.6
Unemployed: due to disability 8 32 40 1.3
Unemployed: still seeking work
6 49 55 1.8
other non-working population 114 136 270 9.0
Total 1384 1618 3002 100.0 100
The following section details out variables like mode usage, travel distance, trip
purpose, cost and time of one trip, for each gender and household income group.

142
5.1.1 Transport mode use amongst the poor
One important indicator of defining the mobility practices of the poor is the transport
mode choice and use. Clearly, with 55.4 per cent of the poor population being
dependent upon walking and cycling, majority of their trips are using non-motorised
modes. Shared auto-rickshaw usage amongst the poor far outnumbers the municipal
bus service and forms the second most important mode of travel after the non-
motorised mode.33 The municipal bus service has mode share of 10.7 per cent while
the newly built Bus Rapid Transit (BRT) is only marginally used. Similarly, only 3.5 per
cent use private modes such as motorized two wheelers. This means that the poor are
not ‘motorised’ yet and they rely much more on non-motorised or the public or shared
modes for their daily commutes.
Table 5-3 Mode use by urban poor and other income groups
Model split of the poor-income groups based on primary survey 2011-12
Category Walking Cycle Hand cart/ pedal rickshaw
Public bus
Shared auto rickshaw
Auto rickshaw
Others (multiple modes)
M2W Cars Grand total
Poor people
40.4 13.0 2.0 11.1 15.8 3.2 11.0 3.5 0 100
Non-motorised modes = 55.4
Public/ shared modes = 41.1
Private modes = 3.5
100
City level model spilt based on AMC-CEPT 2006
Walking Cycle
Public bus
Auto rickshaw Others M2W Cars Grand total
Overall city
13.2 18.8 15 8.8 5.8 35 3.1 100
Non-motorised modes = 32 Public mode = 23.8 -
Private modes = 38.1
100
Indian cities have a high number of non-motorised trips (WSAPL-MoUD, 2008) and this
may be attributed to the large number of the poor population relying on non-motorised
transport. The last available data of Ahmedabad City (2006) indicates that the share of
33
The auto-rickshaw trips may not always be comparable to the private or individual modes amongst the poor groups. Most of the time the auto-rickshaw rides is shared in a group of two-three people (or sometimes more). So these are ‘shared trips’ (like car-sharing) but not again same as the ‘shared auto rickshaw’ trips where the rickshaws are plying on shared basis on fixed (demand driven) routes across the city.

143
non-motorised trips is 32 per cent of total trips amongst all the income groups. At the
city level, private motor vehicle trips dominate. 38.1 per cent of trips were made by the
private motor vehicles and only 15 per cent by public modes. Since 2006, the city
boundaries have expanded and numbers of vehicles have increased manifold (about
100,000 vehicles are added every year in the city). The public transport supply has not
changed as dramatically in the city despite the recent introduction of BRT corridors. So
it can be deduced that the share of motorised trips have increased and the share of
non-motorised trips have decreased further since 2006.
Figure 5-3 Mode share amongst the poor and in the overall city (percentage of
trips to total trips)
It becomes much clearer in Table 5-4 which shows the distribution of multiple modes
with the dominant mode defined by the longest leg of the journey. 62 per cent of the
trips of the poor people are made by non-motorised transport (NMT) mode and the
remaining ones by shared auto rickshaws (18 per cent) and municipal buses (12 per
cent). The private mode share is merely four per cent and the BRT trips are negligible.
Table 5-4 also shows that there are significant differences in the mobility of men and
women. Women (65 per cent trips) tend to walk much more than the men (34 per cent
trips). In case of men, cycling has the next highest mode share (22 per cent trips).
However, the total NMT mode share including walking, cycling and hand-cart/pedal
rickshaw pulling amongst women is 68 per cent and amongst men is 59 per cent, which

144
is comparable. Cycling is not seen much in case of the women, but this aside the
shared and public transport usage is comparable between both genders. However,
higher use of motorised two wheelers and cycles amongst men is observed whenever
a household owns a private vehicle (cycle or motorised two-wheeler); men tend to use
them more, whereas women either walk or use shared or public modes. This aspect of
gender differences in mobility practices is further analysed in section 5.3.3.
Table 5-4 Mode share by gender amongst the poor (percentage of trips to total trips)
Gender
Mode Share (after distributing multi-modal trips) (%)
Walking Cycle
Hand cart/ pedal rickshaw
Public bus
BRT Shared auto rickshaw
Auto Rickshaw
M2W Grand Total
Female 65 2 1 10 0 18 3 1 100
Male 34 22 3 13 1 18 4 6 100
Over all
45 15 2 12 0 18 4 4 100
Non-motorized modes = 62
Public or shared modes = 34 Private modes = 4
100
Table 5-4 shows the distribution of public transport trips. The share of trips by public
bus is 12 per cent whereas the trips by shared auto rickshaw are 18 per cent. The trips
by BRT are negligible (0.4 per cent) amongst the poor. Instances of someone from the
surveyed slum settlements having used BRT34 were rare. The BRT and the municipal
bus services are not well-integrated with each other in terms of ticketing, fares, station-
sharing or even marketing.
Table 5-5 Waiting time and time taken for public transport trips
34
Three settlements part of the primary surveys are situated on the BRT network and three more settlements fall within the 500 meters radius of the network out of the total twelve settlements. The length of the BRT network was about 47 km by the time this study was conducted in October 2011, which is quite substantial and it is being expanded further to about 60 km now.
Public Transport Modes
Trip counts
Mean - Trip time taken
Std. Deviation
Mean - Waiting time
Std. Deviation
Public bus 411 33.8 21.6 25.2 14.6
Shared Rickshaw 617 24.9 16.7 7.0 6.7
BRTS 14 21.1 11.8 1.6 2.0

145
Table 5-5 shows that the mean waiting time for shared auto rickshaws is 7 minutes
(Standard Deviation - 6.7 minutes) compared to 25.2 minutes (SD=14.6 minutes) for
the public (municipal) bus. This is an important reason why shared auto rickshaw is
more popular compared to the public bus amongst the poor. Long commute and
waiting time for public buses would affect the captive riders adversely. It is evident that
an average public bus commuter would end up spending about two hours every day in
waiting and travelling. It is further observed that the higher frequency, reliability,
demand-driven or flexible routes and competitive fares are giving shared auto rickshaw
service an edge over the municipal bus service.
5.1.2 Mode use, trip lengths and trip purpose - interrelations
Table 5-6 Mode-wise Mean Trip Lengths35
(km)
All trips Walking Cycle Hand cart/
pedal rickshaw
Public bus
Shared auto
rickshaw BRT
Multiple modes
M2W Auto
rickshaw Mean trip
length
Trips occurring more than 4 days/week
Female 1.36 2.90 3.33 5.24 4.77 1.50 7.98 6.88 3.39 2.88
Male 1.35 4.86 5.08 9.34 6.12 4.75 9.39 7.07 5.96 5.19
All trips 1.36 4.77 4.84 8.14 5.70 4.39 8.99 7.06 5.24 4.35
Lower band* 1.297 4.266 3.948 7.221 4.911 4.306 8.825 6.025 5.136 4.311
Upper band* 1.504 5.056 5.742 8.426 5.556 9.337 10.390 8.109 6.671 4.659
Std. Deviation
1.957 4.241 3.677 5.531 3.749 4.357 7.909 5.739 4.044 5.194
Std. error 0.052 0.201 0.449 0.306 0.164 1.164 0.397 0.526 0.387 0.088
Mode wise trip lengths in city level studies
LB-IPTS study 2000
0.9 3.6 - 12 5.3 - - 6.8 5.1 4.6
AMC-CEPT ‘061
2.2 3.3 - 6.2 - - - 5.4 4 5.4
1 – Only trips exceeding 1 Km are considered as a ‘trip’ for this report. * - 95% confidence interval for mean
Table 5-6 shows how the mean trip lengths vary with the use of different modes. The
pedestrians travel about 1.4 km on average without much difference between men and
women. Men travel about 4.8 km on average on cycle per trip, which is a three-fold
increase in distance compared to the pedestrians. Another significant rise is observed
amongst the male public bus users’ travel on an average of 9.3 km each. Beyond the
35
Trips length is calculated as distance between origin and destination on a particular mode.

146
walking trips, the difference between men and women’s trips becomes more visible
with the men using cycles, public buses, shared auto rickshaws and other modes for
significantly higher distances. The city level average trip lengths (in LB-IPTS 2000) for
shared auto rickshaw, auto rickshaw and motorized two wheelers are comparable with
the sample of the urban poor. The city level public bus trip length is 12 km whereas the
city level non-motorised trip lengths are lower compared to the poor population.
In the descriptive analysis, the mean trip lengths appear to have differences based on
the mode usage. A one-way Analysis of Variance ( ANOVA) test was conducted to
compare mean trip lengths for different modes with the null hypothesis that all the
mean trip lengths for different modes are equal and comparable. The test result
suggests that the null hypothesis cannot be accepted. There was a statistically
significant difference in the mean trip lengths at the p<.05 level for conditions [F(10,
3406) = 159.995, p = 0.000]. In other words, there are statistically significant
differences in the mean trips lengths across modes.
Table 5-7 Mode and Distance – Equality of means tests
Test of Homogeneity of Variances
Statistica df1 df2 Sig.
Levene Statistic 75.937 10 3406 0.000
Robust Tests of Equality of Means
Welch 164.914 10 163.001 0.000
Brown-Forsythe 125.832 10 472.12 0.000
a. Asymptotically F distributed.
Table 5-8 Mode and Distance – One-way ANOVA
Sum of Squares df Mean Square F Sig.
Between Groups 29454.846 10 2945.485 159.995 0.000
Within Groups 62704.099 3406 18.41
Total 92158.946 3416
The mode-trip lengths descriptive analysis also suggests that there are significant
differences in the trips made by men and women. An independent t-test was carried
out to determine whether there is a statistical significance in the compared mean trip
lengths of both the groups. The test results show that there is a significant difference in
the mean trip length for men (M=5.1, SD=5.6) and women (M=2.8, SD=3.8) based on [t

147
(3415)=11.37, p = 0.000]. The men travel longer distances than the women across all
modes except walking and across any other variables like residential location,
livelihood or education background
Table 5-9 Mode and Distance across gender (independent T-test results)
Table 5-10 shows the mean trip lengths across the motorised and non-motorised trips
for both genders. Amongst the poor, the NMT mode users (the majority of the
population) show a different pattern to the motorised mode users. Mean trip length for
male non-motorised trip makers is 2.6 km only compared to 7.48 of motorised trips.
Similarly, the mean trip lengths for women non-motorised trip makers is 1.38 km
compared to 5.77 for the motorised trips. Women travel much shorter distances than
men on both non-motorised and motorised modes.
Table 5-10 Mean Trip Lengths for motorised and non-motorised modes
Mean trip length All trips Motorised trips Non-motorised trips
Female 2.8 5.77 1.38
Male 5.1 7.48 2.60
Total trips 4.4 6.93 2.13
Further, the trip lengths are distributed in distance ranges to understand the
concentration of trips (figure 5-4). About 31 per cent of the poor travel less than one km
and about 59 per cent of them travel less than three km for their daily activities and the
Group statistics for t-test – Mean trip lengths in male and female trip makers
Gender N Mean Std. Deviation Std. Error Mean
Trip
length
Male 2165 5.139 5.6899 0.122
Female 1252 2.811 3.8702 0.109
Levene's Test for
Equality of Variances
T-test for Equality of Means
F Sig. t df Sig. (2-tailed)
Mean Difference
Std. Error Difference
95% Confidence Interval of the
Difference
Lower Upper
Equal variances assumed
105.712 0.000 11.37 3415 0.000 2.058 0.181 1.7036 2.4136
Equal variances not assumed
12.548 3327.491 0.000 2.058 0.1641 1.7369 2.3803

148
share of trips reduces further as the distance increases. Poor women have 72 per cent
of trips with travel distance of less than three km and poor men have 51 per cent of
trips below three km.
Figure 5-4 Trip distribution by distance amongst the poor
In case of the urban poor, the average trip length is 4.5 km with 59 per cent of trips
being less than three km. A study conducted in 2000, showed that about 56 per cent of
trips at the city level are below three km (Louis Berger-GIDB, 2000). But in the last
decade, not only the municipal limits have increased manifold from 192 sq. km to 466
sq. km but the urbanised built area has also expanded and the trip distances have
increased in Ahmedabad (Adhvaryu, 2011). Besides, it is possible that removing the
urban poor’s trips from the total trips in the LB-IPTS study would further increase the
mean trip lengths of the other income classes. In any case, the average trip length in
Ahmedabad was about 4.6 km (as per LB-IPTS study 2000), which has increased 5.5

149
km (as per AMC-CEPT 2006). But the urban poor continue to travel short distances
compared to the city level averages.
Table 5-11 Trip Purpose by Modal Share (percentage trips)
Trip purpose/ Mode use
Walking Cycle Hand Cart/ Pedal Rickshaw
AMTS BRTS Multiple Modes
Shared Auto Rickshaw
Auto Rickshaw
M2W Grand Total
Work 12.3 10.6 2.0 6.4 0.2 9.1 9.5 1.9 3.3 55.2
Education 19.8 1.7 0.0 2.6 0.1 0.9 3.6 0.7 0.1 29.4
Shopping 7.3 0.8 0.0 0.8 0.0 0.2 1.5 0.2 0.2 11.0
Social-recreational
0.3 0.0 0.0 0.5 0.1 0.5 0.6 0.1 0.1 2.1
Health 0.2 0.0 0.0 0.1 0.0 0.3 0.2 0.1 0.0 0.9
Other household work
0.5 0.1 0.0 0.2 0.1 0.1 0.3 0.1 0.0 1.4
Grand Total 40.5 13.2 2.0 10.5 0.3 11.1 15.8 3.0 3.6 100
Table 5-11 shows that the majority of the trips by the poor are either for work (55.2 per
cent) or education purpose (29.4 per cent). The shopping trips are 11 per cent but any
other social or recreational trips are negligible. This table shows that the poor are
making only the most essential trips. Interestingly, they rely much more on motorised
modes for the social and recreational trips, whereas two-thirds of education trips are
carried out by walking, supported by intermediate or public transport. Similarly, most
shopping trips are made by walking. So there is a selective use of motorised mode,
which is for work or social-recreational trips. For all other trip purposes such as
education, shopping, health, and household work, walking emerges as the most
popular mode. This analysis is further disaggregated by gender in Table 5-12.
The data of modal split by trip purpose gives important findings. According to Table 5-
12, only 20 per cent of trips made by men are walk trips to work (mean trip length 1.4
km) whereas 55 per cent trips made by women are walk to trips to work (mean trip
length 1.4 km). 30 per cent of work trips (mean trip length 4.9 km) made by men are on
cycles, 13 per cent of work trips are by public bus (mean trip length 9.3 km), and 19 per
cent by shared auto rickshaw (mean trip length 6.1 km). Women travel less by other
modes for all purposes compared to men and mostly by cheaper modes. 15 per cent of

150
women’s work trips are made by public bus (mean trip length 5.5 km) and 20 per cent
of women’s work trips are made by shared auto rickshaw (mean trip length 4.8 km).
Education and shopping trips amongst women (mean trip length two and one
respectively) are dominated by walking. Social and recreational trips amongst women
are made by public and shared transport (mean trip length five and six km).
Table 5-12 Trip Purpose by Modal Share disaggregated by gender (percentage trips)
Trips (more than 4days/ week)
Walking Cycle Hand Cart/
Pedal Rickshaw
Public bus
Shared Auto Rickshaw
BRT M2W Auto
Rickshaw Grand Total
Female 70 2 1 9 15 0 1 2 100
Work 55 4 3 15 20 0 2 1 100
Education 76 2 0 7 12 0 0 3 100
Health 33 0 0 0 33 0 0 33 100
Shopping 89 1 0 1 9 0 0 0 100
Social-recreational
0 0 0 0 100 0 0 0 100
Male 35 23 3 12 17 0 6 3 100
Work 20 30 5 13 19 1 8 4 100
Education 65 9 0 10 13 0 1 2 100
Shopping 46 21 0 7 11 0 11 4 100
Social-recreational
0 0 0 100 0 0 0 0 100
Health 0 0 0 0 0 0 0 0 0
Overall 47 16 3 11 16 0 4 3 100
The trip purpose, mode use and trip distance table shows that the mobility of the poor
is mostly dominated by work and education related trips. Although there was a
determined attempt made during data collection to identify all kinds of trips, it emerges
that all other purpose trips have a small share in overall trips of the poor. It can be
deduced that for work trips, the mode use changes as the distance increases. In
absence of any private motorised modes, there is a strong dependence on public
transport or intermediate public transport. For longer trips (more than six km) the
municipal bus becomes the suitable option, even if there are issues related to high
waiting time and erratic services. If motorised two wheelers are available then they are
used to commute longer distances for work trips.

151
5.1.3 Household Income and mobility
Table 5-14 shows that 58 per cent of trips incurred zero cost for the trip-makers. 16 per
cent of trips were managed with equal to or less than 5 INR. 80 per cent of women and
69 per cent of men spends less than INR five per trip. Further, 93 per cent of women
and 86 per cent of men spends less than INR 10 per trip. The minimum BRT fare is
INR five, minimum AMTS (public bus) 36 fare is two rupees for the same distance
between two bus stops. By spending INR five about two to three km can be travelled
by AMTS and shared auto rickshaws, and lesser distance by the BRT. Spending about
INR 10 travel distance can be expanded to four to five km by AMTS.
Table 5-13 Distribution of Per Trip Expenses, by Gender (percentage trips)
Gender Expense per trip (in INR)
Nil 01-05 06-10 11-15 16-20 20+ Grand Total
Female 63 17 13 3 1 2 100
Male 54 15 17 5 2 6 100
Over all 58 16 15 5 2 4 100
For majority of the urban poor, BRT is an expensive option and AMTS becomes
attractive for long distance commutes within the city. However, for distances in the
range of three to five km the shared auto rickshaws becomes more feasible as they
offer competitive fares compared to the AMTS. The shared auto rickshaw operators
always keep their fares less than the AMTS fares. AMC-CEPT (2008) mentions, “in
Ahmedabad on an average households spend about INR 200 to 500 per month on
transport” across all income groups. As per the present study, about 30-35 per cent
poor households end up spending monthy more than INR 500 for their transport needs.
It is evident that most of the poor households try to minimise the cost of the transport
by using NMT modes or using motorised modes selectively.
The table 5-14 shows transport mode-wise mean household incomes in INR. It is
evident that the mean household income of the motorised two wheeler trip makers is
36
Both AMTS and BRT use telescopic fare calculations. There is also a minimum starting fare based on a distance cap. Beyond that, fares would increase incrementally in increasing proportions as travelling distance increase.

152
the highest within this group of poor people followed by the autorickhaw users. The
pedestrians and the hand cart/pedal rickshaw pullers are the poorest amongst the
group. A one-way ANOVA test was conducted to compare mean household incomes
for different modes. There is a statistically significant difference in the household
incomes at the p<.05 level for the three conditions [F (10, 3414) = 11.497, p = 0.000].
However, the income levels of the cyclists and the shared auto rickshaw users are
comparable. But the income levels of the motorised two-wheeler users are significantly
higher than the income of the non-motorised mode users.
Table 5-14 Mode wise mean household income (monthly in INR)
When the modes were aggregated as non-motorised modes and motorised modes, the
monthly household income respectively were INR 6,035 and INR 6,818 suggesting that
the non-motorised mode users are poorer in this group of poor people. However, the
poor public transport users are incurring more cost per month on transport. That leaves
them poorer as compared to the non-motorised transport users in terms of absolute
Mode Mean Monthly Household
Income in INR
Std. Deviation
Mean Trip length (km)
Estimated monthly transport per trip maker (in INR)*
% of income
walking 5789 3659 1.36 0 0
Cycle 6586 3882 4.77 0 0
Hand Cart/ Pedal Rickshaw 5462 4427 4.84 0 0
AMTS (Public Bus) 6175 2970 8.14 1172 19.0
BRTS 5814 3307 4.39 1054 18.1
Shared Rickshaw 6479 3675 5.70 684 10.6
Auto Rickshaw 6918 3909 5.24 1887 27.3
M2W 8593 3846 7.06 720 8.4
Overall – Monthly household income (counts – 561)
6045 3632 -- -- --
Mean Trip length (counts 3428) 4.48 5.2 -- --
Mean Trip cost 4.87 10.98 -- -- --
*Assuming that two such trips are made per day for 24 working days per month. The public transport trips per Km. are estimated based on the current fares as the following – INR 3 /Km.km for AMTS, INR 5/Km for BRT and INR 2.5/Km. for the shared auto rickshaw. For the direct fare, auto rickshaw INR 7.5/Km. charges is assumed based on the current fares. For motorised two wheelers, the petrol cost is assumed as INR 75/litre and the mileage of an average motorbike is assumed as 36 km/litre. For M2W, this is only the running cost and it does not include any owning cost/ debt servicing cost or maintenance cost.

153
income. There is an estimate given in table 5-13 which shows that, depending upon the
mode of public transport service, the household would incur transport cost in the range
of INR 684 to 1,172. The motorised two-wheeler works out to be one of the cheapest
motorised modes in terms of operating cost. However, with the capital cost of purchase
(as debt servicing), maintenance and insurance cost would make the aggregate cost of
owning and operating a motorised two wheeler as expensive as the expenditure on
other public transport modes. With the difficulties in accessing the formal credit for
purchasing vehicles, the motorised two-wheelers do not have a widespread use
amongst the poor.
Table 5-15 Correlations results – trip length, trip cost and hh income
Trip length Trip cost Household income, Monthly
Trip length Pearson Correlation 1 0.436** 0.053
Sig. (2-tailed) - 0.000 0.082
N 3417 3408 3416
Trip cost Pearson Correlation 0.436** 1 0.019
Sig. (2-tailed) 0.000 - 0.269
N 3408 3417 3416
Household
income, Monthly
Pearson Correlation 0.053 0.019 1
Sig. (2-tailed) 0.082 0.269 -
N 3416 3416 3427
** Correlation is significant at the 0.01 level (2-tailed).
Statistical correlations were carried out between household income and trip
expenditure and household income and trip length. It was found that there are no
significant correlations between them (r=0.037, p=0.44>0.01 and r=0.009,
p=0.85>0.01). In other words, it is not necessary that people who are earning more are
spending more on their trips or they are travelling longer distances. At least within the
group of the urban poor, the household income did not have much impact on the trip
cost or length. However, there was a significant correlation between trip length and trip
cost (r=0.436, p=0.000<0.01). This also means that there is a complex relationship
between household income and trip cost which cannot be explained through linear

154
bivariate correlations. Depending upon its specific situation, a household earning more
amongst the urban poor might end up spending more on its daily trips.
Since the majority of trips are limited to non-motorised modes, further investigation is
needed to assess whether the choice of these modes impose any distance related
constraints. Further investigation is also needed to establish those situations, and in
which long-distance motorised trips become feasible and desirable. It is expected that
the experience of traveling less using non-motorised modes or travelling more using
motorised modes would vary with gender, education level, livelihood and residential
location in the city.
5.2 Mobility of the poor through the qualitative narratives
The primary quantitative data discussed in the previous section demonstrates that the
mobility of the poor relies much more on non-motorised transport or intermediate or
public transport. The poor travel shorter distances compared to the others in the city
and they spend very little on transport. The trip purpose analysis further shows that the
essential trips like work and education dominate their urban travel, while other purpose
trips have a small share. The quantitative data indicates that mobility of the poor are
limited by various constraints such as their affordability and the choice of modes
available to them. However, mobility of the poor has complexities, which are best
understood through their own perceptions. The activities in which they engage for their
livelihood necessitate them to engage in complex patterns of social interaction within
the new urban environment. These emerging mobility characteristics need to be
understood through qualitative narratives of the poor to further unpack and verify the
reasons behind their mobility choices and practices.
At the outset, two observations are important to note. Many people conversed in
Gujarati or Hindi and they did not use words similar to the English words ‘transport’ or
‘mobility’. Their daily mobility was referred as ‘coming and going’ in everyday

155
conversations. Any transport mode (except for walking) was referred to as
‘conveyance’ and in Gujarati/ Hindi the original words used literally mean ‘instrument’
or ‘tools’ depicting more utilitarian associations with different modes of transport. The
transport mode being talked about was never a ‘ride’, thus not associating pleasure or
recreational aspects with their mobility. In addition, there were probably not enough
words, expressions or idioms developed to describe their mobility, journey experiences
or trade off related to transport.
Secondly, while conducting the initial interviews in the core city settlements, it emerged
that sometimes the interviewees were not at all concerned about transport. They had
nothing to say about their transport. For some respondents, their mobility choice was
inevitable given their circumstances, saying – “What else would you do?” Their
priorities were their job responsibilities, housing needs, basic services like water and
sanitation, or daily earnings. Transport issues were not even mentioned while talking
about their main concerns of their everyday lives. Those who talked about transport,
they considered transport something they ‘managed’ either by walking or through other
modes. That is the reason why the interviewees who were walking shorter distances for
work and other household activities had nothing much to say about the transport
issues. As the participants increased, more complexities of their mobility patterns
emerged making it clear that their mobility choices were dependant on their
affordability, work-home distance, and the available modes.
5.2.1 Mode choice dynamics
Analysis of the interviews with the poor commuters, especially women, revealed
walking as their most popular choice of mobility. Respondents who mostly travel
shorter distances (less than two km) never considered giving their mobility issues any
special attention. Some of them did not consider their transportation needs to be
serious enough to even attempt verbalising their thoughts or reasoning behind their
choice of walking. It seems that walking occurred to them as the obvious or natural

156
choice. Participants mentioned walking with a distinct casualness as if implying that
they never considered any other options.
“When I come walking (to work), there is no problem. I come walking and go back
walking, no problem at all… I don’t have to go a long distance for which I have to worry
about…” (Female, 55)
“We go walking all the time, we are used to it. Everything is nearby, so why should we
think of something else…” (Male, 19)
Similar to the pedestrian respondents the cyclists displayed an equivalent sense of
advantage in cycling practices. Mostly, they travelled less than four to five km per trip.
They considered cycle as the obvious choice and an advantage. But the advantage is
restricted to the male members and it rare to find a female cyclist. Attitudes to cycling
were gendered. For example, one of the male participants described the cycle as a
‘family vehicle,’ which he used to drops his wife to her work wherever he can and to
carry grocery shopping bags.
Figure 5-5 Cyclists navigating through traffic in Ahmedabad
“We cannot do without cycle, the shops are so far. We cannot go anywhere otherwise.
The fares are so high. When you want to go somewhere, cycle is good”. (Male, 45)
“Sometimes in the morning when I go for work, I drop my wife to her work place. So
cycle is like a family conveyance… in the evening (while returning) sometime I get
ration and put on the back of the cycle. It works well…” (Male, 35)
Photos: Center for Urban Equity, CEPT University

157
“Earlier when I came here (to the city), there were lot of problems. It was so expensive
to go in the bus. The red bus37 would not come in time. You can’t rely on that. We have
to reach in time, you know? Or the day’s salary is cut… so I started renting a cycle
whenever I could. It (renting) was not that expensive those days. We all had cycles.
You just pedal and you reach. There was not so much traffic… then later, I bought my
own cycle. It was a second-hand one. It was not so expensive those days. So I have a
cycle since then…” (Male, 60)
In the above cited response, there are undertones of nostalgic of the 70s when
everyone had a cycle and that cycling was convenient. Despite ‘so much traffic’ and
constant objections from his family members, the respondent has continued cycling till
today. Interestingly, the English word ‘traffic’ was widely used to describe events,
people, actions, and everything that is taking place on the road. Mostly, the word
‘traffic’ mentioned in the interviews implies ‘motorised traffic’ only and the pedestrians
or the cyclists didn’t consider themselves being part of that ‘traffic’. Amongst the
cyclists, there was a careful vocalisation of their separation from the ‘other’ that is the
motorised traffic. This ‘traffic’ was often blamed for making the roads congested and
riskier. The respondent is an ex-textile mill worker and he recounts that when the mills
were running, cycling was a way of life. Cycling was convenient as ‘you just pedal and
you reach’. Another ex-textile mill worker who is now working in a small factory
recounts his cycling days from 70s and 80s.
Figure 5-6 Shared cycle ride amidst motorised traffic
“In those days, there were only two
important sounds in the city. One, the
cycle bells ringing and the other were
the sirens of the mill. Our days were
spent between these two sounds… but
it is all gone now…” (Male, 52)
37
Colloquial use for the municipal bus service because the buses are red in colour.

158
Cycling in everyday life evokes nostalgia amongst the poor men. Cycling is strongly
associated with the past and sometimes referred to as a ‘pre-modern’ mode of
transport. This is however not consonant with the revival of the urban cycling in the
developed parts of the world such as Europe and America. The revival may however
be attributed to the fact that those countries have gone through the full phase of
embracing various modes of transport and then discarding many. That opportunity has
yet not come to this section of the community. There were many cyclist participants
who continue to cycle today because of the convenience and low-cost but they are
willing to change their mode at the first available opportunity. This is especially true for
the younger generation which neither considers cycling as a way of life nor the most
convenient travel option. They aspire to a travel experience using motorised two
wheelers. There were often complaints about how cycling becoming increasingly
difficult with time and with increasing traffic. One of the respondents - a male, 32 year
old is a supplier of sweets and food items to shopkeepers and vendors around schools.
For quite a long time, he kept transporting the sweets in wholesale amounts on cycle. It
took him a substantial amount of time to build money, by investing in informal ‘chit
funds’, to buy an 80cc motorised scooter. He describes that,
‘’I used to take lesser goods earlier on cycle but after I got the scooter, I take more
goods with me… Yes, it (getting a scooter) has helped adjust things a bit. Actually,
when I used cycle, I used to have swelling in my abdomen and it pained. I got it
checked in the hospital and the doctor advised me not to cycle anymore. Still I
continued 2-4 months until I got my chance (in the chit fund).’’ (Male, 32)
At the beginning of this research, it was assumed that many poor households would
widely own motorised two-wheelers given the trends of vehicle ownership in the rest of
the city. However, it emerged that motorisation has not yet reached the poor
households. The response cited above is a one-off instance of a poor household
having made the transition from a cycle to a motorised two-wheeler. The major barrier
against buying a motorised two wheeler is not the running cost but the owning cost.

159
Poor people don’t get any formal vehicle loans so they do not have the capital cost to
invest in a motorised two wheeler. It is important to note that this respondent could only
create finance to invest in a motorised two-wheeler through the informal mechanism of
credit access. Generally, the cyclists continue to cycle and pedestrians continue to
walk for many years with only the hope of changing their mode. Along with the limited
transport mobility transition, there was also slower or no transition in their residential
mobility or job mobility. The poor households seem to be stuck in a similar kind of
situation for a long time and also with their transport mode choice.
This is not to say that there were no aspirations to buy motorised two-wheelers. Buying
a motorised two-wheeler was the ultimate dream for a cyclist or a pedestrian, given the
fact that there is a privileged social status attached to a motorised vehicle. The
attitudes towards owning individual vehicles, whether cycles or motorised two
wheelers, were often gendered and affirmed to the patriarchal social structure.
Typically, the older men expected their sons to buy a motorised two-wheeler and the
older women expected her husband or son to buy a motorised two-wheeler. To cite an
instance, an elderly man described that he would be happy to be driven around by his
son when required. Similarly, an older women expressed her dream that someday
when her son would have a ‘motor-bike’ she would be happy to sit behind him and visit
her friends’ place. The respondents are aware of the difficulty of owning a motorised
vehicle given their financial situations but they are also unanimous in their hope of
acquiring it someday.
Another notable issue relevant for transport energy consumption and emissions was
walking to work on a regular basis not being an enjoyable or healthy option for
everyone. Their complaints ranged from there being ‘no space to walk’ to it being
‘scary’ as they described their everyday travel experiences. There were also accounts

160
of being tired and fatigued, especially amongst the working women38. The women said
that they were always in a hurry to reach home, as they have to take care of the
household. They manage the household work, grocery shopping and child care along
with their job so they end up making many short trips across their job location, shops,
children’s school and home. Some of them end up walking about eight to ten km
making multiple trips between these locations. In order to manage their everyday life,
they need flexible work-time and short distance between locations for all the activities.
‘I get very tired, I have to walk fast…my legs pain but how do one do this otherwise? If
one waits for the vehicles or (even if) thinks to spend some money on it (public
transport)… it wastes lot of time waiting (for the vehicles). And I need to reach home in
time…’ (Female, 32)
The pedestrian participants often claimed that they were walking by choice even when
they had other public transport options available. Some of them would prefer some
shared or public transport at some parts of their daily trips. Some pedestrians were
potential public (or shared) transport users had there been any affordable and reliable
options available. Some of the regular users of public transport or the shared transport
mentioned that there are no fixed ways of travelling. Most of them said that whenever
they get ready to go to work, they come to the main road and wait for the ‘conveyance’.
The first preference is always the public bus (AMTS) because of the cheapest fares
amongst all modes. The second preference is shared auto rickshaw, which is faster
and more efficient but it makes passengers wait until it is fully occupied and so can
become time-intensive occasionally. The following account describes the complex
travel pattern: the participant travels for about four km. She prefers to go by bus and
her preference was because of her age.
38
The National Family Health Survey (NFHS) of 2005-06 round-3 points out that more than 36% of women in Gujarat have a body mass index below 18.5 – the official cut-off point for acute undernutrition and thinness. Most of these 36% of women are likely to be poor women. Possible under-nutrition could be an explaination for these repeated complaints about not been able to walk long distances.

161
‘It is far off…coming here. I have to change two buses. See, from Jamalpur I take 36
(number bus) and get down at Raipur. Then from Raipur I take 145 (number bus) and
get down at Patel Mill. If I don’t get a bus to Patel Mill then in 42 (number bus), I get
down at Kamdar and from there I walk here. Sometimes, there is no bus. I have to
either wait or sometime I dare myself to walk. Sometimes, the bus comes early and
goes away. (So) I have to come in ‘Shuttle’39. It is expensive, you know?’ (Female, 54)
Mobility is linked with making everyday decisions based on what is conveniently
available. The affordability aspects of everyday decision making will be discussed in
the following section. But it is important to note that it is difficult to categorise someone
based on their mode choices for a long term. In a situation where there is no access to
the individualised mode of transport, mobility of the poor becomes complex and often
fluid across various choices. A pedestrian is a potential public transport user and a
public transport user is a potential pedestrian. Any person becomes a particular mode
user depending upon availability situation that day or ‘what they feel like that day’. If
they don’t feel like walking, they spend money and travel by the shared auto rickshaws
(if not bus). The municipal buses were perceived as unreliable but the shared auto
rickshaws were ‘always there’. Sometimes, choice of travel mode is merely a matter of
deciding whether or not they want to spend money on it. The wage earners in a family
(both women and men) either decide to spend a small amount on transport or save that
money by walking to convince themselves that they ‘have saved some money today’.
Analysing mode of travel choices with respect to the trip purpose indicated that people
travelled only when it was essential, for example for work or for education or shopping.
Children always walked to school, sometimes in a group with older kids taking care of
younger ones. There were other social practices related to everyday child care
activities. Sometimes parents took turns to pick up their children from school. Not only
that, children of working parents often stayed at the neighbour’s house until their
39
Shuttle is a word used for the shared auto rickshaw (with 3 or 6 seats) service in Ahmedabad. The word ‘Shuttle’ represents that there is an ‘up’ and ‘down’ services on certain routes known to the participants. Whereas the term used for hiring an exclusive auto rickshaw service are the English terms - ‘direct’ or ‘special’ service, which sounds like ‘dyrekt’ or ‘pesiyal’.

162
parents returned from work. The practices of give and take or doing things for each
other were widely seen amongst the poor. Taking care of each other’s children when
needed was one of the most common practices.
In terms of the leisure and recreational trips, there was a clear deficit. This was
because many people were quite concerned about their finances. However, there were
many festivities (religious or otherwise) organized within the settlement on a regular or
seasonal basis. Otherwise, their participation in any recreational or community activity
outside their neighbourhood was either not present or a rare occurrence. Leisure
outings were restricted, although they participated in a number of religious and/or
cultural activities taking place within their settlements. When asked about their
recreational activities or family outings, the following were the responses:
‘’We are left within our own limits. We do not think beyond it. If a person has that kind
of money (income), only then can he think about those things (recreation). We think
within the limits of our condition (stature). Just nearby India-colony, that mall and other
things (multiplex, shopping etc.) are developed. But it’s beyond our capacity so we
don’t think about going there, asking around or living there, and so we don’t think about
it.’’ (Male, 32)
“No, it’s not about (getting) the rickshaw; we don’t require going out much. We keep to
our work only. What is the point of ‘going out’ for no reason? If we go out, it’d be once
in a month. What can we do when we don’t have that capacity (to spend money for
leisure)?” (Female, 44)
“There is really no need to go out like that. We have everything here in our Chali. We
celebrate all festivals here… something or the other keeps happening in our Chali.
Then what is the need to go out?” (Male, 38)
The individuals and families studied; given the characteristics of their everyday mobility
(costs, time, etc) limit their travels beyond the walking sphere as much as possible.
When walking is the only mode possible for the family of the bread-winner, the
perception about distance and ‘what can be reached or not’ becomes important. In

163
practical terms, they heavily concentrate on travels related to work, education and the
maintenance of the house (shopping, doing errands, etc). Any movement not directly
related to some obligation or urgent need is commonly postponed or simply discarded.
These families rarely move beyond the settlement purely for pleasure, either on
working days or during weekends. Even trips to go on holidays are rare. During most of
their free time they stay within the settlement, not unusually inside their homes,
especially women, children and adolescents. But at the same time, most settlements
are culturally vibrant places where many religious festivals are celebrated. Out of the
home activites but within the settlements are important part of the social life of the poor
in Ahmedabad.
“Earlier I used to take the kids from the neighbourhoods to Kankaria (lake)…some
fifteen-twenty kids…and we will all have fun. But now there are tickets to go inside
[after the lake front development project]… its ten rupees per person, you know? Now if
you go out to the lake and eat and come back in a rickshaw, it would cost at least 200-
300 rupees… who can afford that?” (Male, 45)
The above response indicates an interesting social practice of recreational activities
within the community – a middle-aged person gathers a group of children from the
neighbourhood and takes them to the lake-front or the zoo. He would typically arrange
for couple of shared rickshaws for their outings or would walk to the nearby location.
With the new lake-front development project, the lake and adjoining amenities like the
zoo are now gated and ticketed. This adds additional cost for the outing. The lakefront
has become an exclusive place to go to instead of being an incidental part of the
everyday life in the city. Earlier, the participant could afford an ice-cream for everyone
or the fare for the rickshaws but this additional burden has deterred him from
continuing this practice.
The manner in which modes used by the majority of the poor people, walking and
cycling (for males), are ‘pre-industrial’ or ‘pre-modern’ in nature. This is not to denigrate
these modes but to pose them against the resurgence of walking and cycling ideas and

164
practices in the western societies. The terms ‘pre-industrial/modern’ would rather mean
‘non-modern’ or at least this is how they were and are being viewed largely by the
governments. These modes operate literally on the margins of the roads, which are not
maintained well because the roads are prioritised for the motorised traffic. The people
who are walking or cycling do not consider other motorised modes for their mobility and
they think that walking is ‘obvious’ or ‘natural’ choice’. The use of these modes by poor
people is primarily utilitarian in nature. Women don’t cycle and travel shorter distances
than men by all modes. Even the men who are cycling do not see it as mode for
recreation or leisure.
5.2.2 Affordability and mobility
With many interviewees, a lot of discussions revolved around the cost of transport and
it was regularly mentioned in the conversations. Saving money or minimise cost of
anything including transport was considered a good virtue or practice. People were
conscious about ‘living within the means’.
“We have to live within our means… every day we can’t spend as we like. We can only
stretch our legs as much as the sheet we have [popular proverb]. If we save today then
only we will be able to have good time tomorrow.” (Male, 42)
“There is no need to pay for ‘coming and going’, there is no need to spend money on
that...why should it cost?” (Female, 37)
‘Why should it cost’ is a resounding sentiment while talking about their mobility. There
is an underlying social logic that transport shouldn’t cost as there are more pressing
needs. Transport is viewed as something they could save on – sometimes by exerting
oneself more. Saving one trip’s cost (about INR five to ten) was seen as an
achievement for the day. This attitude directly influenced their mobility choices. Even
when someone got some ‘conveyance to travel’, she/he preferred walking to the
destination. A number of people (mainly women) talked about the availability of

165
‘shuttles’ or the buses, but they chose to walk. In one case, a woman would walk more
than four km and cites reasons that she does not like to wait for the other modes and
she prefers to walk. She also describes her time as precious and that it is divided
between work, child care and household work.
“I come walking and go walking, my house is far off but I just walk. I get the shuttle and
I get the red bus too… but one has to wait for it. The red bus is not worth waiting for.
Sometimes it comes and sometimes it doesn’t. And coming-going in the shuttle
means… one has to wait till all seats are full and on top of it, it is expensive. And my
salary is low so I cannot afford a special rickshaw (direct fare)… And then I have lots of
chores at home and about kids. So I don’t have much time (to spare). I have to reach
my job in time…so I just walk. Walking is better, you are on your own… you don’t have
to wait for any one.” (Female, 32)
“It will take me ten rupees to go to work, but why would I spend? (If I spend money like
this then) what is the point of making ends meet by working? It’s better to walk then to
spend on coming and going…” (Female, 37)
The above cited response shows that the issue of affordability is played out in the
context of unreliability of the municipal bus service and the shared auto-rickshaw
service. But the participants prefer to walk because they don’t want to spend the
money on transport and the transport services are not convenient for their needs. In
many cases, they try and wait for the next bus or the shared auto rickshaw, if it suit
their timings and routes. When these modes are not conveniently available, they end
up preferring to walk. Sometimes, the issues of affordability make the availability of
transport (conveyance) irrelevant in the poor’s life, and sometimes the issues related to
reliability (of time, routes) impedes the use of available transport.
There were similar traits in many participants of minimizing the cost of transport as
much as possible. But there were differences in these views based on their location
within the city and based on the distances they are travelling. Many people living in the
core city settlements had their workplace and amenities closer to their homes. Their

166
commute distances were shorter and they had many options available for travelling.
They saw several merits in the area where they stayed.
Figure 5-7 Auto rickshaws and municipal bus stand in Ahmedabad
‘Everything is nearby, once I go out of here (work place) – there is grain mill, there are
shops, there is milk shop, there are vegetables (vendors). Everything is just there.
Once I come down (my house), I get everything. As I get out of my job, I buy everything
quickly and I go up (to my house). If you are short of something you can always pop
out to buy something and go back…’ (Female, 36)
Ahmedabad’s core city is comprised of a mixture of: historic walled city, diverse
commercial and residential areas along with some important institutions. One set of
settlements studied as part of the ‘core city’ were near the river front close to the
central commercial activities. The other set of settlements were just outside the
historical walled city on the eastern side closer to the industrial and commercial
activities. The participants living in the core city settlement could ‘manage’ their mobility
by walking because their work places were close by. There were many instances that
such arrangement of work places being closer to their residential area existed for many
years. Some of the core city settlements were as old as 50 years. Some of them had
chosen to stay in the core city settlement because of the availability of work nearby.
Some found the work first and then chose to rent a place in these settlements.
“I have been here since long… those were different days. We have been staying here
since there was nothing here… no ‘development’… And I will always prefer to stay
Photos: Center for Urban Equity, CEPT University

167
here. My children tell me that now they want to move out somewhere outside but I tell
them that I am going to stay here till the end. Why should I go out? This place has
given me everything. Everything is nearby. Everyone knows us here…If we go out then
even the crematorium will be far off… [Laughs]” (Male, 60)
The advantage of living in the core city settlements was not only of being close to the
amenities or to the work place but also that it encouraged participants to develop
strong community network, and in some cases beneficial business ties. For example, a
bag-maker or an incense sticks-maker was employed by small commercial shops in the
core city. The incense sticks-maker woman would walk and the bag-maker man would
cycle to their employer to get raw-materials and to supply the prepared items. This
employer gives them small loans when required for social functions. Going to live
somewhere else means breaking this relationship and adding the transport burden to
their earnings. In the beginning of the research, it was assumed that with increase in
the income levels of a household, they will be willing to move out of squatting to formal,
low-end housing. Instead, it was observed that households continue to squat, but
invest in the house and services (like building a toilet or a new roof) and often
negotiating, with the help of some civil society organisations, for more services to the
Municipal Corporation. Residential location and its accessibility emerge as a major
advantage for the poor households, as it minimises their mobility needs.
It is also important to note that many participants were not comfortable talking about
issues related to income or affordability. The poverty situations were often underplayed
in the conversations. Sometimes, ‘walking is better’, ‘cycling is easy’ or ‘we just walk’
responses were generated in contexts, where there were no other obvious options due
to their affordability constraints. ‘Not affordable’ was often projected as ‘not
convenient’. Only when probed further, they would say that besides the public transport
being unreliable, it is also unaffordable. There were ways of saying ‘unaffordable’ –
‘who wants to spend money like that’ or ‘it’s too much for a small ride’ or ‘there is high
inflation everywhere in prices’. Besides, statements such as ‘walking is better’ project

168
that one is exercising a choice, and not giving in to the possible captivity to a certain
mode. This attitude of ‘being on one’s own devices’ was an important part of being a
working woman and man.
5.3 Negotiated mobility amongst the sub-groups of the poor
The previous section (5.2) discussed some general attitudes and perceptions related to
transport mode choices and affordability issues amongst the poor. Besides these
general attitudes, all other issues narrated in other interviews were situation specific.
These situations were based on where participants were living, where they were
working and the kind of work they did. The variations in the mobility pattern and
practices of the participants were based on different locations, livelihood and gender.
The following section discusses these variations. There could be many categories in to
which a population group could be subdivided and analysed. There were possibilities of
exploring other categories such as religious minorities, different age groups and the so-
called lower castes or the Dalit communities. Even the housing-deficient minorities
such as the pavement dwellers or the houseless destitute who don’t even live in the
informal settlements could have been part of the study. But the focus of this thesis and
this particular research question is to showcase how differentials within the poor are
played out within the broad context of poverty-dominated lives. The location, livelihood
and gender offer more fundamental categories and shows strong links with the mobility
patterns and practices. This was found while conducting both, the qualitative interviews
and the quantitative analysis.
5.3.1 Location variations and mobility practices
As explained in Chapter 3, all the surveyed slum settlements are sampled on the basis
of distribution of settlements in the core city, the peripheral areas and resettlement
sites40. The resettlement sites are walk-up apartments of 26.8 sq. metres built by the
40
The informal settlements were selected based on varying distance from the city centre in different directions to ensure the spatial representation. The core city settlements were in and around the historic

169
Ahmedabad Municipal Corporation between the years 2007 and 2013 in the city. This
was the largest public housing project undertaken in the city after almost one and half
decades by the city government. About 18,976 housing units were constructed in 15
different resettlement sites at the periphery of the city. The resettlement colonies were
built with the aid of a major subsidy offered by the Basic Services for the Urban Poor
(BSUP) component under the Jawaharlal Nehru National Urban Renewal Mission
(JnNURM) of the central government. This development-induced displacement was
paid for by the funds meant to be utilised to improve ‘the basic services for the urban
poor’, instead they were used to build new housing stock or resettlement colonies for
the families evicted as part of other infrastructure projects. Many families from various
squatter settlements were forcefully evicted as part of the developmental projects going
on in the city. Some examples are the Sabarmati Riverfront Development project which
evicted 12,000 families, road widening for the Bus Rapid Transit which evicted 2,600
families, and the Kankaria Lakefront Development project which evicted 110 families
(Desai, 2012). These evicted households were referred to as the ‘beneficiaries’ who
were to be provided a flat in the resettlement colonies. The poor households had to pay
about one-third of the cost of the flat through monthly instalments.
As part of the study, four resettlement sites were studied. Three of these were formal
public housing built by the municipal corporation and fourth was a ‘transit camp’ where
‘project affected people’ was housed temporarily before they were given a flat in the
resettlement site. In many cases the ‘transit’ lasted for two to three years. Out of the
four resettlement sites surveyed, two settlements - Trikampura BSUP (11) and
Ganeshnagar (12) – have a distance of more than eight km from the original informal
settlement from which the resettled citizens mainly came. The other two resettlement
colonies (Mahadevnagar and Ajit Mill compound) have a distance of more than four km
between the old settlement and the new one. The out-of-the-city resettlement colonies
walled city of Ahmedabad, which incidentally fall within the 3.5 km radius of the city centre (Bhadra square). The peripheral settlements fall within 3.5 to 7 km radius of the city centre. Two of the resettlement sites were beyond the 7 km radius of the city centre and two of them fall within 7 km radius.

170
like Trikampura and Ganeshnagar particularly are not connected with the rest of the
city. Whereas in Mahadeve Nagar and in Ajit Mill compound were relatively better
connected.
Looking at the modal share by different residential locations of settlements in Table 5-
16, it is evident that there is a marginal difference between the mode share in the core
city and the peripheral settlements. The non-motorised modal shares are comparable
in the core city and the peripheral settlements – 50 and 48 per cent walking and 17 and
14 per cent cycling respectively, whereas the use of motorised modes has marginally
increased – 14 and 16 per cent for shared auto rickshaw and nine and 12 per cent for
the municipal bus.
Table 5-16 Mode use by different residential locations (percentage trips)
Walking Cycle Hand Cart/ Pedal
Rickshaw
AMTS Shared Auto Rickshaw
BRT M2W Auto Rickshaw
Total
Core City Settlements
Female 66 3 1 10 16 0 1 3 100
Male 40 26 6 8 12 0 6 2 100
Over all 50 17 4 9 14 0 4 2 100
Peripheral Settlements
Female 77 1 0 6 12 1 1 2 100
Male 33 21 1 15 17 2 4 7 100
Over all 48 14 0 12 16 1 3 5 100
Resettlement Sites
Female 52 2 1 13 27 0 1 4 100
Male 22 17 1 20 27 0 8 4 100
Over all 34 11 1 17 27 0 5 4 100
This is contrary to the assumption that the poor in the peripheral settlements rely on
motorised modes much more as they need to commute longer distances, like in the
case of Chennai (Srinivasan & Ferreira, 2002). The poor in the periphery also continue
to have a similar kind of mode use as the poor living in the core city areas. However,
this scenario drastically changes in case of the resettlement sites. The combined share
of non-motorised modes drops from 71 per cent in the core settlements and 62 per
cent in the peripheral settlements to 46 per cent in the resettlement colonies. The
combined share of shared auto rickshaw and public bus increases to 44 per cent from

171
25 per cent in the core city settlements and 28 per cent in the peripheral settlements.
Especially the trips of shared auto rickshaw rise to as high as 27 per cent in
resettlement colonies as compared to 14 and 16 in the core and peripheral
settlements. This corroborates the fact that the effective provision of public transport
attractive to the resettled citizens has not really been part of the resettlement process,
so the trips by the poor are either being managed by shared auto rickshaws or the
other modes.
On account of the resettlement, the mean trip lengths per trip have increased for each
mode as given in Table 5-17. The average distance covered by the male cyclists living
in resettlement sites is 7.6 km compared to 4.1 km in other settlements. This is
physically straining, but in order to save money, cyclists continue to carry on with such
commutes which seems ‘long and tiresome’ given the quality of roads and cycle,
vehicular congestion and sometimes with the weight of the luggage being carried. The
mean trip length for the public bus has increased to 9.5 km and for the shared auto
rickshaw 7.2 km (compared with 7.1 and 4.6 km respectively in all other settlements).
The trips by motorised two-wheelers are more than ten km. compared to 5.6 in the
other settlements. The walking trips have remained the same, and in case of women
they have further reduced marginally. It is possible that the women are making only
short walking trips for grocery shopping and other household work as they might have
lost their livelihood. Some women have taken up cycling, travelling about 2.8 km on
average.
Table 5-17 Mean trip lengths (km) by modes, gender and geographic locations
Trips <4 days/ week
Walking Cycle Hand Cart/ Pedal Rickshaw
AMTS Shared Auto Rickshaw
BRT Auto Rickshaw
M2W Overall
Core and periphery settlements
Female 1.4 3.2 3.7 5.0 4.0 4.3 3.8 3.4 2.2
Male 1.4 4.1 3.4 7.7 5.0 7.0 5.8 5.8 4.0
Overall 1.4 4.1 3.3 7.1 4.6 4.3 5.5 5.6 3.4
Resettlement Sites
Female 1.1 2.8 2.0 6.6 6.5 0.0 4.3 10.0 3.7

172
Male 1.5 8.0 5.5 10.8 7.5 0.0 4.9 10.3 7.2
Overall 1.3 7.6 4.3 9.5 7.2 0.0 4.7 10.3 5.7
In the case of the core city slum settlements, about 70 per cent of trips are within the
radius of three km from their locations for both genders (5-18). In the case of the
peripheral settlements, about 60 per cent of trips are within the radius of 3 km from
their location. However, there is a striking dissimilarity with the resettlement sites. Only
about 42 per cent of the trips are more than three km of distance and 36 per cent of
them are more than seven km of distance. The main difference is in the mobility of men
in the resettlement sites: from those only 31 per cent of trips are less than three km.
The distance of their trips starts increasing between one and nine km as a normal
distribution curve but majority of their trips (33 per cent) are above nine km. This
pattern is not seen in the case of the women in the resettlement sites. About 60 per
cent of their trips are less than three km, mirroring the pattern in the core and
peripheral settlements; only about 14 per cent of women travelling more than nine km.
Table 5-18 Distribution of Trips by Distances, Gender and Geographic Location
The mean trip lengths have generally increased in the resettlement sites but there were
significant differences between the motorised trips and the non-motorised trips. The
non-motorised trips in the resettlement sites for men and women were 3.4 km and 1.4
km respectively, whereas the motorised trips were nine km and 6.9 km respectively.
The mean trip lengths for non-motorised trips in the core city and peripheral
Mean Trip Lengths Distribution of trips by distance ranges
All trips Motorised trips
Non-motorised
trips
<1 km 1.1-3 km
3.1-5 km
5.1- 7 km
7.1-9 km
9.1 and more
Total
Core City Settlements
Female 2.8 4.9 1.2 41 39 10 4 1 5 100
Male 3.8 5.8 2.4 30 33 14 8 4 11 100
Overall 3.3 5.4 1.8 34 35 13 6 3 9 100
Periphery Settlements
Female 2.8 5.5 1.7 54 22 11 7 2 4 100
Male 5.0 7.4 2.4 24 27 20 7 8 14 100
Overall 3.9 6.5 2.1 34 25 17 7 6 11 100
Resettlement Sites
Female 4.6 6.9 1.4 35 24 8 12 7 14 100
Male 7.2 9.0 3.4 13 18 11 15 9 33 100
Overall 5.9 8.0 2.4 22 20 10 14 9 26 100

173
settlements were 2.4 km for men in both cases and 1.2 and 1.7 for women
respectively. It is important to note that the non-motorised trips in the core and
peripheral settlements are comparable and there are marginal differences in the
motorised trips only. This is contrary to the classical land use models (Fujita, 1989;
Rodrigue, Comtois & Slack, 2013) where the commuters from the peripheral locations
travel to the city centre for jobs and thus travel longer distances as compared to the
commuters living in the city centre. The Table 5-19 substantiate this point further with
the mean trip lengths for the work purpose trips with varying residential locations.
Table 5-19 Mean trip lengths by trip purpose across residential locations
Residential Location Trip Purpose Mean trip length Std. Deviation
Core city Work 4.4 3.9
Education 1.6 2.3
Other 3.2 3.6
Overall 3.3 3.6
Periphery Work 5.5 5.4
Education 2.7 3.9
Other 3.9 4.5
Overall 4.1 4.8
Resettlement Work 9.3 7.9
Education 3.1 2.9
Other 6.3 6.6
Overall 6.6 6.9
Overall Work 6.0 6.0
Education 2.4 3.1
Other 4.3 5.0
Overall 4.4 5.2
The mean trip lengths appear to have differences based on the residential locations
and the trip purpose. As per Table 5-19, the mean trip length of the work purpose trips
is 4.4 km in core city settlments, 5.5 km in the peripheral settlements but it jumps to 9.3
km in the resettlment sites. All mean trip lengths in resettlement sites increase across
all purposes and their standard deviations increase as well. A one-way Analysis of
Variance (ANOVA) test was conducted to compare mean trip lengths for different trip
purpose with the null hypothesis that all the mean trip lengths for different trip purpose
are equal and comparable. The test result suggests that there was a statistically
significant difference in the mean trip lengths at the p<.05 level for conditions [F (2,

174
3418) = 121.545, p = 0.000]. In other words, there are statistically significant
differences in the mean trips lengths across residential locations based on trip purpose.
Increase in trip lengths for work means rise in tranpsort expenditure as well.
As per the Table 5-20, 59.3 per cent of trips in the core city and peripheral settlements
were zero cost trips, which were reduced to 36.7 per cent trips in the resettlement sites.
In the resettlement sites, about 40 per cent of trips cost more than rupees six per trip
and in city and peripheral settlements only about 22 per cent of trips cost the same.
There is a new burden of long distance motorised trips from the resettlement sites. The
household expenditure on transport has increased above INR 300 to INR 600 in many
households in the resettlement sites, many of whom were not spending much on
transport earlier. This is likely to have adverse impacts on other household budgets,
sometimes replacing other expenditure on items like food, education and health.
Provision of transport services has clearly not been part of the resettlement process
and the displaced poor households had to rely on their own means to access their jobs
and other services in the city.
Table 5-20 Distribution of per trip expenditure by gender and locations
Expenditure per trip (in INR)
Nil 01-05 06-10 11-15 16 and above Total
Core city and periphery settlements (% of trips)
Female 62.5% 20.2% 12.2% 2.3% 2.8% 100
Male 57.5% 17.7% 14.9% 4.6% 5.3% 100
Overall 59.3% 18.6% 13.9% 3.8% 4.4% 100
Resettlement Sites (% of trips)
Female 44.3% 24.7% 20.2% 6.7% 4.2% 100.0%
Male 32.5% 21.1% 28.8% 8.1% 9.5% 100.0%
Overall 36.7% 22.4% 25.7% 7.6% 7.6% 100.0%
Table 5-21: Mean per capita monthly income, mode use and residential location
Mean Per Capita Income (INR)
All Motorised trip makers NMT trip makers
Core city settlements 1345 1612 1289
Periphery settlements 1315 1391 1341
Resettlement sites 1184 1280 1139
Over all 1290 1429 1272

175
The dependence on motorised modes and travelling longer distances had impacted the
household budgets adversely. Mean per capita monthly income of the trip makers from
the resettlement sites were only INR 1,184 compared to INR 1,345 and INR 1,315 in
the periphery and core city settlements respectively. INR 150-200 makes a big
difference in a poor household’s life. In the process of relocation, some jobs may have
been lost or some people are not earning enough to cover the higher costs of
relocation including the transport cost. The motorised trip makers from the core city
earned a per capita mean income of INR 1,612 compared to INR 1,280 of the
motorised trip makers from the resettlement sites. Amongst the poor households
studied, the income levels of the core city dwellers were the highest. Some of these
issues are further re-visited while discussing the qualitative interviews but on the basis
of the comparative income across residential location, it can be safely concluded that
income-poverty is more in the resettlement sites compared to the city or peripheral
settlements. The following section discusses the qualitative narrative in detail.
The narratives from the resettlement colonies
The quantitative findings above indicates the travel distances as having increased in
the resettlement sites, with the motorized mode usage and the transport expenditure
has also increased. The similar characteristics are also verified through qualitative
narratives of the displaced population.
Male, aged 39 living on one of the resettlement sites narrated the changes related to
his travel after having moved to the new housing colony. He is a toy-maker/seller and
his family also helps him make the toys. He also buys some flashy, cheap toys from the
market to sell. He goes to different recreational areas around Kankaria Lake to sell his
toys on cycle. Before the relocation, his zone of work was fixed and he had to go within
two to three km to sell the toys, which he did either by walking or cycling. He lived
closed to the Kankaria Lake from where his family was displaced. Now he needs to
travel beyond six-eight km to sell the toys. After coming to stay in the resettlement

176
estate, he expresses his dissatisfaction that he cannot go to work every day because
of having to cycle long distances.
“Of course, it is tough (to cycle). My legs pain a lot. If one goes for continuously 2-3
days to work, then one needs a break of one or two days. You can’t go out every day.
We also have to make toys every day after travelling so much. One can only go to work
for 12-15 days (in a month) not more...not the full month. Even going for 20 days is
very difficult’’ (Male, 39)
‘’What do I say? Mostly there is a difference in everyone’s life. Some people’s situation
is very bad. Because earlier we never paid any fares for coming and going, we just
lived there…right there. Now there is an additional expense of 1,000 rupees 41 for
everyone (every family). One-third part of the income goes ‘waste’ like this. Just
calculate 10 rupees one way and 10 rupees the other way…mostly in shuttles only…
15/1 (number bus) may come or may not come…who know. Then tell me how much
does it cost, even if two people per family have to travel’’ (Male, 48)
The above cited response clearly shows that after moving to the resettlement colonies,
their mobility situations have worsened, as they have to travel long distances now. With
the unreliable public bus services, they rely much more on the shared auto-rickshaw.
The transport expenditure starts denting the household budgets. The male members
would be given priority to travel longer distances using the modes other than walking.
This would mean that the women and children couldn’t afford to spend anything on
transport. They have to walk and access amenities, which are only accessible through
walking. Besides, the transport disadvantage and long commute by cycle is negotiated
by reducing the number of working days in a month. This practice was widespread
amongst the self-employed persons in the resettlement sites.
The livelihood issues become pressing in the absence of a good transport service.
Male, 36 living in the resettlement colony, describes, in the following paragraph, that
earlier people would get jobs easily, when their residential location was more
accessible, and now they have to make extra efforts to search for work. These extra
41
This interview was conducted in the year 2012. The exchange rate on an average was 1US$=53 INR.

177
efforts mean extra cost on the household budget and it involves more hardships related
to the long commute.
“Earlier, people could go out and buy goods and make things at home… you could go
to Kadiya naka42 and you get work… or you could take out your lari (cart) and sell
things. Everything was near-by. There was lot of work… no one could sit idle, even if
they wanted to. Now, it is not that easy. We have to go searching for work now…
sometimes to the same place. And if you reach late then the work is gone… what to
do”. (Male, 36)
Longer commutes were not the only issue in the resettlement colonies. Many people
lost their livelihood after coming to the resettlement sites. The male members of the
families have started making longer trips as their work place is either located next to
their older residences or now they have found a new job in a new location which
demands longer trips. Most women who could find work easily near their previous
settlements have stopped working, as they don’t have work easily available in the new
location, neither do they have the necessary community or social networks to help
them obtain work. There was no school within the distance of three km near two out of
four resettlements sites studied and many children in these colonies have stopped
attending school, especially girls. Every member of the poor household was adversely
affected by the relocation. The women especially reacted sharply about adjustments
they had been forced to make in the new way of life in the resettlement colonies.
“I always wanted to have a flat of my own but not like this. We left everything behind
and we have come to a new place. Everything has changed. Earlier, everything was so
near-by… even kids could run out and buys something easily. Now, we have to think
before we go out anywhere. I prefer not to go out…I don’t know how long this will go
on. How long will we keep ourselves like this?” (Female, 26)
42
Kadiya naka (literally means masons’ junction) is an informal labour market near the major junctions around the tea-stalls in the city. Such markets emerges on early mornings (7.00 to 8.30 am) at particular junctions where labourers, masons, plumbers and other construction related workers gather and labour contractors, small-time builders or sometimes the clients come to avail their services for small and big repair works.

178
“There are lots of problem here… earlier, the kids could just walk down to school in a
group. We (adults) didn’t have to accompany them at any time. They could go on their
own. Now, the schools are so far. There is an anganwadi (child-care centre for the
children below five years) here but what about the elder ones… and the teacher don’t
come regularly. The quality of food (in the mid-day meal scheme for children) is not
good… my kids who study in 5th and 7th standards, they go in a bus… and I am always
worried… everyone here cannot afford to send their kids to school now. There are no
municipality’s schools and private schools are so expensive.” (Female, 40)
Most of the resettlement colonies are located in the outer periphery of the city, which
are not well served by public transport or even shared auto rickshaw. The resettlement
scheme was primarily based on providing vertical housing for squatters with water-
sanitation to replace the squatter settlements in which these households were living
earlier. However, the services such as transport, schooling or livelihood access were
not really considered. In each colony, there is a child-care and health centre but the
residents complained that those do not function regularly. Besides, there were no
attempts made to provide transport or livelihood options or schooling options for the
children for the displaced communities. It was reported by the participants that when
these issues had been taken up with municipal officials, there had been arrogant
reactions like, “We have given you flats, what more do you want?”
This clearly shows that households have started putting extra efforts into keeping
themselves mobile and they have started using other options. The process of
resettlement and the longer commute means the acceleration of the process of
motorisation amongst the poor. Given the affordability issues, personalised mobility is
not possible for everyone, even if they have a greater preference for it. This male, aged
60, has invested in buying a motorised two-wheeler for his son who is employed in a
factory. He says that he could afford to borrow money from the informal market but it is
not possible for everyone.
“See, I have borrowed money from the (informal) market to buy a (motor) bike for my
son. Now, we will have to pay the higher interest rate (than banks) for a long time to

179
come. Debt is always a bad thing… but that is me. I can afford the loan. The other
people out here… who will give them a loan? How will they repay it? Everyone’s job is
gone.” (Male, 60)
Another man, aged 35, also describes that he may not be able to buy a motor bike
soon as they are also paying the instalments for the flat that they have got. The
expenditure on various things has increased after moving to the resettlement colony
and the household income has dwindled. His wife had to stop working given the longer
commute and increased household responsibility after the relocation. Many people
described that they have gone ‘backwards’ in their lives by a decade or so. This meant
that the resettlement did provide them with housing and allied services but it also
increased their poverty and now many households will take longer to come out of their
poverty situation.
“Earlier, I used to go on a cycle to the factory. It was only 3-4 km. Now, it is 7 km. I
tried cycling for a few days but it was very difficult. And there is so much traffic out
there too… so now I go by the red bus. The bus is good but it takes so much of time.
Firstly, I walk for ten minutes and then the bus is always late... It takes me at least 45
minutes to one hour every day. It is also expensive… it is a 15 rupees ticket, you
know? I told my wife that we better buy a two-wheeler…” (Male, 35)
There were mixed reactions towards the new-found house ownership amongst the
households in the resettlement colonies. On one hand some people shared their
excitement about it; on the other dominant were the many complaints against the
government and a dominant dissatisfaction due to lack of entitlement. The people here
expected the government to do much more for them. They were more dependent on
the government efforts, which they hoped for to take place soon. Both the feeling of
being a victim of displacement and the feeling of the lack-of-entitlement were absent in
people living in the core settlement. This attitude also impacted their ways of dealing
with their mobility. Earlier, they were more in control of their lives as they could access
their jobs and other amenities easily, whereas after the resettlement, they had become

180
more dependent on the city level transport services and they expected the government
to do much more for them.
“Of course, I dreamt all my life to have a house of our own. So we are very happy
about this house… it’s just that there are some problems here. But you always have
some problems everywhere. My brother gifted me a TV set… he was telling me to take
his (old) TV for a long time but where we would keep it. So when we came to stay here,
he told me that you have now become a ‘flatwallah’, so it will suit you now (to have a
TV set)”. (Female, 42)
“The government has given us a flat… but we also gave them the land in return. They
are going to build a five-star hotel there… what did we get in return? What do we do
with this flat? It is so far… if we don’t have a job then what are we going to do with this
flat? Who is going to run it (maintain it)? You can’t eat it (the flat), can you?” (Male, 58)
The allocation of houses was operationalised via computer randomisation to appear to
be ‘unbiased’ in the allocation. This has led to the complete disruption of the well-
developed social networks and community fabric in the resettlement colonies. Life in
the resettlement sites was made more difficult because many families had never lived
in multi-storey apartments or paid for common maintenance bills. There were
complaints about the regularity of water supply, cleaning and solid waste collection.
They expected the government agencies to keep providing the maintenance on their
buildings whereas the government agencies started pulling out slowly from the
resettlement sites. The instances of crime like petty thefts, illicit liquor brewing-selling
and gambling is increasing in the resettlement colonies. Women often blame the men
who have lost their jobs or who are not regularly going for work.
To summarise the findings thus far, the resettlement colonies in Ahmedabad support
the well-known urban planning discourse of transport disadvantages caused by
(forced) resettlement programmes. There are great differences in the way in which
poor people move or travel in the city based on their location. The core city settlements
are the most accessible locations and they are most advantageous in terms of mobility.

181
Living in the core city settlement helps the poor to minimise their travel distances and
costs and in turn they live in more congested housing conditions which lack some basic
services. Surprisingly, the situation of the peripheral squatter settlements is not much
different from the core city settlements. It was assumed at the beginning of this
research based on the international literature that the poor in the peripheral squatter
settlements would be commuting long distances and using more motorised modes
compared to the core city settlements. But the mobility patterns of the core and the
peripheral settlements were similar and comparable. Most people found work nearby in
the peripheral locations or they had chosen to locate there because there were
livelihood options nearby.
The remarkable difference in the mobility patterns of the poor is observed when they
are relocated to the far-off resettlement colonies. This is when they have to start
commuting longer distances and relying on the motorised modes more. The mobility of
women, children and the aged gets restricted further and the poverty situation is
worsened. The attitude of minimising distances and costs in the poor gets subverted in
the resettlement colonies. Of course, there are larger questions of whether there is any
need for resettlement projects in the first place, and the exclusionary modalities of
those projects which make the lives of the poor more difficult. But as far as the mobility
issues are concerned, there are many differentials in their mobility practices based on
their locations. The location advantage or disadvantage is central in framing their
choices for their mobility. This aspect will be discussed further (in section 6.2) when the
shelter-livelihood-transport nexus will be elaborated. The following section discusses
the mobility practices of the poor based on the variations in their livelihood pattern.
5.3.2 Livelihood variations and mobility practices
The livelihood categories amongst the poor in Ahmedabad were quite diverse, as
noted in Table 5-2 at the beginning of this chapter. This diverse set of activities were
aggregated in aggregated into three main categories for the sake of simplification as

182
‘regular waged’, ‘casual or daily wage’ and ‘self-employed’. The regular waged people
were getting a regular salary from per month. For example, – as a cleaner in a hospital,
an office assistant, a salesman in a shop, or as domestic help, etc. The casual or daily
wage earners would generally be doing manual labour particularly in the construction
industry, and they hunt for work almost every day. The third and the most diverse
category were the self-employed people, which includes petty shop-keepers, street
vendors, transport service providers, and home-based workers making various
products or working in any other household-based enterprise.
Table 5-22 Mean household incomes for NMT-MT and livelihood
Table 5-22 shows that the mean household monthly incomes are comparatively more
(INR 7,372) for the regular salaried wage earners. The casual, daily wage earners earn
the least (INR 6,051). There is a significant difference in the mean monthly income of
the motorised trip makers and non-motorised trip makers. The motorised trip makers
have higher incomes across all livelihood categories. The same is reflected in the
mean trip lengths across all livelihood categories for motorised and non-motorised trip
makers. Amongst the working population, the difference in the mean trip lengths
between the motorised and non-motorised trip is four-six km per trip across all
livelihood categories. The daily wage earners using motorised modes travel more than
nine km on average, whereas the regular salaried and the self-employed workers travel
7.4 km each. The mean trip lengths of the self-employed and the regular salaried are
similar, both in motorised and non-motorised trip makers.
Livelihood categories
Mean Monthly Household Income (INR) Mean Trip lengths (km)
Overall Motorised trip
makers NMT trip makers
Overall Motorised trip
makers NMT trip makers
Regular salaried 7372 7877 6833 5.4 7.4 3.3
Casual - daily wage 6051 6508 5429 6.6 9.1 3.3
Self-employed 6385 6458 6310 5.0 7.4 2.6
Overall (working population)
6285 6626 6037 4.5 7.2 2.1
Note: This table represents the data of the working population only. The trips of transport service providers and mobile vendors are eliminated from the regular work purpose trips.

183
The education level also has a strong co-relation with the household income. Table 5-
22 shows mean household monthly income across different education levels for both
non-motorised and motorised trip makers. As the education level increases, the mean
monthly income of the household increases. The graduates earn significantly more
than the people with lower education levels. The non-motorised trip makers earn less
than the motorised trip makers irrespective of the education levels (except for the
university graduates). Within the group of poor households studied, both education and
the livelihood options impact the income of a household. If the children in a poor
household continue to study and complete graduation or similar education level than
there is a higher chance for them to get a regular salaried job and probability for them
to move out of poverty. Transport provision plays a crucial role in making sure that the
young children continue to study without dropping out and that the regular salaried
persons continues with the job without slipping back into self-employment or casual
labour. Thus, transport provision fulfils a ‘protective’ function as well as a
‘transformative’ function.
Table 5-23 Mean per capita income for NMT-MT and education
Given this situation of employment categories and education levels, it becomes crucial
to look at the mobility patterns of some of these categories to understand them in
detail. Based on the various qualitative interviews of the interviewees with different
employment categories, five main groups are identified to discuss in detail. These
groups are casual labourers, street vendors, transport service providers, domestic help
and salaried employees (refer to table 5-2 for the subdivisions based on occupations).
Education levels Average of Per Capita Income
Motorised trip makers NMT trip makers
Illiterate 1198 1218 1178
Literate 1174 1209 1153
Primary education 1241 1378 1140
Matriculation/ up to 12th (high school) 1369 1384 1356
Graduate 1871 1829 2065
Over All – mean monthly h/h income 1350 1429 1272

184
Casual labourers
The casual labourers were generally the poorer amongst the poor and they were both
women and men. They did not have any fixed job on regular basis neither they were
enterprising enough or had access to finance to their own business. Sometimes they
had patrons such as petty shopkeepers or the warehouse-owners, who would employ
them to load or unload goods in their shops or warehouses. The second group of the
casual labourers were the workers who carried the goods in the handcarts or the three-
wheeler goods cycles. 43 The largest group was the third kind who worked in the
construction industries as construction labourers. They typically assisted the masons
by mixing the cement and gravel or carried bricks and other construction materials on
construction sites. Every day in the morning, the construction labourers would gather at
tea-stalls near a fixed location called Kadiya Naka (literally means masons’ junction).
There are a number of such informal ‘employment exchanges’ in the city of
Ahmedabad located around the main cross-roads. The Kadiya Nakas typically operate
between 7.00 am to 8.30 am. A set of labour contractors or individual clients come
here to hire labourers for a day or for a longer period. Once they are employed for the
day or for a few days then, depending upon the location of the construction site, they
either walk or cycle or use the shared auto rickshaw. To get a cycle, they go to a
nearby cycle rental shop after getting the work and hire a cycle to go to the work
location. If the distance is closer, then they would walk. If the distance is far-off then
they might be paid the fares of auto-rickshaw or bus to reach the site.By 9.00 am,
depending upon the work location, most workers would have reached their construction
sites. The peak hours of the motorised traffic in Ahmedabad are between 9.00 am and
11.00 am but the peak hours for these workers is between 8.00 to 9.00 am.
43
The issues related to this group of casual labourers will be discussed under the section titled ‘transport service providers’ separately.

185
‘’… Generally, work is nearby. If it is far like 10-15 km and the contractor feels that
coming on cycle would delay the work, he would ask to leave the cycle, come in a
rickshaw, and also pay the expenses. Otherwise, cycle is always there’’. (Male, 21)
“Sometimes we get work, sometimes we don’t. Sometimes we get work for the
continuous six months and sometimes we don’t even get it for a day. If we get work
then we go or we just have to sit around…so nothing is fixed about how we go around
the city…” (Male, 55)
In the above quote, a 55-year old man talks about the variability and unreliability of
construction work, and therefore the changing patterns of travel. There was much
uncertainty in the everyday life of the casual labourers, which begins with getting work
and hence their mobility changes depending upon the work location. The Kadiya Nakas
are completely dominated by the men. Women contruction workers usually work with
their husbands and travel with them on foot, on cycle or in shared auto rickshaw, if
required. Given their uncertain travel pattern every day, the construction workers would
prefer living in the most accessible and often central locations in the city so that they
could reach any side of the city easily.
Figure 5-8 Cycle renting and repair shop in Baherampura area of Ahmedabad
“… We have to live in the middle of
the city. If we live one side then how
do we reach the other side? So we
don’t want to shift from here. We
have the main (labour) market here
only… we go there and get the work.
If everyone comes here then why do
we want to move out” (Male, 55)
“… I have to cover a long distance to
go to work. I have to go from
Saraspur (residence) to Odhav GIDC (work place). If I go by the red bus then it will
take me 15 rupees one way, so 30 rupees every day. If I rent a cycle then it is 20

186
rupees for the whole day and I don’t have to wait for the bus. I can go wherever I like
and also finish other things on the way…I save 10 rupees” (Male, 28)
Man aged 28 talks about why cycle renting makes sense for him and he offers logic of
affordability and flexibility provided by a personalized mode. Even if he has to cycle
more than ten km on every working day, he ends up saving rupees ten on public
transport by renting a cycle. Cycle is an important ‘conveyance’ for the construction
workers. Many of them couldn’t afford to buy a cycle, so they rent it on regular basis.
The cycle renting practices emerged as the vital service for poor male labourers. The
number of cycle renting shops in the city has reduced over the years due to the
declining use of cycles in everyday life, but still some shops can be found near the
informal settlements or the Kadiya Naka from where the majority of clients are
attracted. The renting rates44 for the full day were INR 20 and for half a day were
rupees 10 and these rates changed in different areas. There were no security deposits
taken from the renters, as the shopkeepers would know their regular customers
through the informal social networks. During this research, the interviewees also
highlighted the details about the informal, used cycle market. Many poor construction
workers prefered used cycle compared to a new one given the cost difference of about
2000 to 3000 rupees.
“Most people will be using ‘second-hand’ cycles. My cycle is ten years old. The new
cycles are so expensive [about 4,000 to 5,000 rupees]. It is better to buy a second-
hand cycle and get it repaired as you like…” (Male, 21)
“I would like to buy my own cycle one day… then I don’t have to rely on others to give
(rent) me the cycle. By Diwali, I would buy it hopefully. I am not in a condition to buy it
now. I will have to save money for it.” (Male, 28)
44
The labourers used typically the roadster kind of cycles, which cost about 3000-3500 INR.

187
There seems to be a wide practice of buying previously owned cycles which are
typically called ‘second-hand’ (in English) cycles. Most cyclist labourers said that they
have been cycling for a long time and they are going to continue doing so.
Many construction workers are ‘seasonal’ migrants from the villages and they come
temporarily to the city when they do not have enough work in the agricultural fields. For
the seasonal or temporary migrant families, it is convenient to stay on the construction
sites to minimise the costs on housing, transport and other services. But there are
many construction labourers who reside permanently in the city. Here, it was observed
that temporary, intra-city migrations overcome distance and minimise mobility needs. If
some workers cannot commute everyday then they will lock up their squatter housing
and build a temporary shelter on the construction site itself. Labouring work is viewed
as a family enterprise and everyone in the family contributes to it depending upon their
capacity. In the absence of any effective regulations, they will be given certain basic
services on the construction site depending upon the site developer. Nonetheless, this
temporary shifting within the city is an extreme social practice to minimise travelling
distance and cost.
Street Vendors and hand-cart pullers
The street vendors are by no means a homogeneous group: a wide variety of vending
activities takes place in the streets of Ahmedabad. There are natural markets formed
along the major streets specializing in cooked food items, vegetable, fruit and
household items and even furniture is sold on the streets. Through the lens of mobility,
the street vendors could be categorised in three groups: one, the mobile vendors who
pull carts and go long distances to sell their goods from neighbourhood to
neighbourhood; two, the semi-mobile vendors who are partly stationary and partly they
travel to sell their goods; three, the stationary street vendors. All three categories have
different economic motivations and situations for their mobility.

188
One female, aged 34, who lives in the core city area, pulls a handcart to collect empty
bottles and cans, which she recycles. Many members from her community are involved
in the recycling of waste materials. Other people collect old newspapers, magazines,
cartons and boxes from the middle class-households. She walks as much as 10-15 km
every alternate day along with her husband pushing a separate cart. They walk to far-
off, wealthier suburban neighbourhoods to collect those materials. When asked why
they have to go so far, she replies:
‘’Earlier we used to go to all these nearby areas but now the Marwari’s (name of a
community) has taken over them. To settle the quarrels, it was decided that they will
take Naranpura-Navarangpura (nearby area) and we will take Satellite-Bopal (far-off
areas). But these areas work for us. Lot of rich people live there and they don’t
negotiate the prices much and we always get a good deal…’’ (Female, 34)
She leaves her elder children at school and on returning from school the children stay
at their neighbours’ place. This participant also said that she takes care of her
neighbour’s children when they are far away for work reasons. The younger child
accompanies her and her husband. Because she has to travel such a long distance,
they do not go there every day. There was a wide practice amongst vendors travelling
longer distances to minimise their working days in a week or in a month. The transport
disadvantage is minimised by working fewer days per month, which results in lower
earnings. Additionally, they prefer to work on the weekends as they their clients are
more likely to be home resulting in good business opportunities. When asked the
reasons for not finding alternative work or a job instead of continuing such physically
strenuous work, she replied –
“See, we are business people. We have been doing this business for many
generations. Our ancestors also did the same… from the times when Ahmedabad was
not even built. We like to do business. When we do business, we decide when to go to
work and how much to work. It is not like you (this researcher) that we have to go for a
job every day for 9.00 to 5.00 and we get salary. We have to find our own money.

189
Today we find money in this then we do this, tomorrow I might sell vegetables. If we
find money in something else then we will change.” (Female, 34)
There was a certain pride evident in the way which she described herself as the
‘business people’. Household enterprises such as this one are complex phenomenon
involving family and kinship labour arrangements and their daily mobility is traded off
within these arrangements. This participant stresses the kind of flexibility and sense of
ownership which comes with her household enterprise. This attitude is often seen
amongst the poor: that they want to be in charge of their own lives, their own
livelihoods, as much as possible. This attitude is also extended in the transport realm
where they prefer the use of individualised modes like walking and cycling. Such
attitudes are further strengthened with the unreliable and expensive public or shared
transport options. In the absence of any efficient public transport, such personalised
mobility is preferred. These participants, who aspire to control their own lives, do
complain and expect the government to do more for them.
There were also variations in travel patterns based on certain occupations, as in the
case of the vegetable or fruit vendors. As a routine, many vendors would get up early
in the morning (by 5.00 am) to reach the wholesale markets in an auto rickshaw shared
collectively45. A group has an informal arrangement with the auto rickshaw drivers to
share the rickshaw on the regular basis. The handcarts are kept somewhere else:
either in the wholesale market or in the nearby locations. And to keep the handcarts
safe, they sometime pay rent informally to the watchmen at the market or to the
property owners. After buying the vegetables from the wholesale market, they disperse
in their own areas. One vendor describes:
“I get up at 5.00 am and go to the [Jamalpur] wholesale market with others. We have a
rickshaw-walah who takes us there every day. He charges us reasonably. Sometimes
45
This is more like auto-rickshaw sharing (like the car sharing concept) where individuals are sharing a ride from the same destination. The service referred as ‘shared auto rickshaw’ service in this thesis is where the auto-rickshaws are playing on pre-fixed routes and the commuters share the ride. Both are shared transport services.

190
we give him some vegetables free. We have to maintain good relations, you know?
From there, we put everything on our cart and come to our area by 8.00 am… Yes,
pulling the cart all the way… then we do rounds in our (residential) area (to sell stuff).
By noon, we go and stand at a junction. By afternoon, we hope to sell everything if it is
a good day. If not then we have to stretch it till the evening…” (Female, 58)
‘’We go walking. We walk through the streets and get customers on the way. If the
goods are sold early, we return back early and if they don’t, we return late. But the
goods must be sold for us to earn something.’’ (Male, 35)
This is the case of the partly mobile and partly stationary vendors. There is a wide
practice of sharing auto rickshaws to go to the wholesale markets in the morning. This
is one major cost that they like to recover through their sales of the day. There is an
informal arrangement of defining territories and earmarking places at the market where
each individual member would be allowed to sell their goods. Informal arrangements
do not mean irregularities or adhoc events: the vending activities happen in a regular
manner for almost all the days in a week. There are fixed patrons-cum-money-lenders
at the wholesale markets; there are fixed routes to travel in informally-assigned
neighbourhoods; there are known customers and fixed places for them to station their
handcarts.
The street vendors in general are one of the most mobile and diverse groups amongst
the poor. Their mobility is crucial for their survival. There are wide varieties of street
vending practices but most cases involve pulling handcarts to distances more than
three to five km. Compared to the casual labourers, the vendors are economically
better off and they are more in control of their lives.
The street vendors are also vulnerable to the police or municipal raids for evictions.
The street vendors are routinely evicted to widen the roads and they are called ‘illegal
encroachers’ in the popular media. Although there are some local NGOs, like the
SEWA (Self-Employed Women’s Association), which are trying to organise them and

191
bring policy change at the national level 46 , the street vendors are viewed as a
‘nuisance’. Recently, about a hundred street vendors protested in front of the municipal
corporation against the re-development of the historical central area where a
pedestrianised plaza is being created, resulting in their eviction (Times News Network,
2013). Both the residential and vending activity locations are crucial for the street
vendors as it is not feasible to travel long distances with the handcarts. The central
location of the various kinds of wholesale market further makes it an imperative for
them to live in the central areas. Any sort of eviction from either location creates
imbalance in their access to amenities and increases in their costs, which leads to the
creation of poverty in the street-vending households.
Transport service providers
Transport service providers are of two kinds: the first are the auto rickshaw drivers who
drive auto rickshaws on shared and direct-fare basis for the commuters; the second are
the handcart or the pedal rickshaw pullers who transport goods as casual labourers.
Ahmedabad doesn’t have pedal rickshaw based commuter services like some other
North Indian cities such as Delhi, Jaipur and Lucknow. The table below shows the per
capita income in the household and the average travelling distance in a day.
Although the sample size is small as the sampling criteria didn’t seek to capture a
minimum quota of transport service providers specifically, the above table is still useful
in giving details about how much on average the transport service provider travels
providers travel during a day. In the case of auto rickshaw drivers, there is a relation
between the travel distance and the per capita income of their households. With longer
travel distance, the auto rickshaw drivers seem to be earning proportionately more.
However, this is only an indication of the income gained and by no means should be
interpreted as their economic well-being unless the complete picture of their household
46
The Indian parliament on 6 September 2013 passed the Street Vendors (Protection of Livelihood and
Regulation of Street Vending) Bill, 2012. The Bill provides for protection of livelihoods rights, social security of street vendors, regulation of urban street vending in the country.

192
is understood. It is notable though that this relation between distances travelled and
per capita income is not visible in the case of the handcart and the pedal rickshaw
pullers.
Table 5-24 Distances covered and per capita income for the transport providers
Per capita monthly Income (INR) Auto Rickshaw Hand Cart/ Pedal Rickshaw
2000+ 71 -
<2000 60 19
<1600 62 20
<1200 51 25
<800 47 22
<400 42 20
Mean distance (km) covered in a day 56 21
Figure 5-9 Pedal rickshaw and handcarts in Ahmedabad
photos by Vineet Diwadkar, URL: http://www.gujaribazaar.org/?page_id=26
Most auto rickshaw drivers who live in the informal settlements do not own their
vehicles. Someone who owns a few rickshaws hires them and they are paid a salary on
the basis of the fare box collection. This is not the same with the handcart or pedal
rickshaw pullers who mostly own these vehicles. Shopkeepers or warehouse-owners
hire them out. Handcart or pedal rickshaw pulling is a low-skill based labour, whereas
auto rickshaw driving requires more skills, basic literacy and a driving license. Auto
rickshaw driving is a better paying job then the non-motorised goods carriers. One auto
rickshaw driver narrates:
“I was working in the Patel mill. When the mill shut down, I did not know what to do. I
kept looking for work…I also thought of going back to my village. But there was no
work there. One day my friend approached me that he knows someone who has an

193
auto rickshaw and he is looking for someone who can drive it. That time, I did not even
have license. So first, I had to spend money in getting a license then only I could start
driving the rickshaw. And I have been driving (rickshaw) for more than 20 years now. I
have my own rickshaw now…” (Male, 56)
Talking to an auto-rickshaw driver gives an insight into how the shared auto rickshaw
service works in Ahmedabad. Especially in Eastern Ahmedabad, the auto rickshaw
drivers run informal, shared auto services on the major city roads. On the prima facie,
this service appears to be a self-organising system which operates based on the daily
demand on certain routes drawing on the driver’s own experiences. If there is low
demand then the routes are changed accordingly. There are a number of auto drivers
who play a dual role of providing a shared auto service as well as exclusive, direct fare
services in a weekly cycle. The days when they get more direct fare passengers, they
run the exclusive services. The days when they don’t get many passengers, they try
running the shared auto service in some other known routes.
Handcart or pedal rickshaw pulling is considered better work compared to physical
labour on a construction site. It is also a better paid job then work on a construction
site, but it has its own uncertainties. The cart or cycle pulling job could fluctuate based
on the market-demand of goods and their seasons. Besides, the goods auto rickshaws
and small commercial vehicles are rapidly replacing the handcarts and pedal
rickshaws. Such non-motorised carriers are more restricted to some of the older areas
of the city, where manuovering is difficult for the motorised modes. A pedal rickshaw
puller narrates his experience of cycling:
“Earlier, there was not so much traffic. It was easier to go… If you shout or whistle (to
give a way), people would listen. Now a days, who would listen? There is no respect
left… and all these big bridges [fly overs]… they are all good ‘development’, I agree
with that… but it is very difficult for us to cross on a (pedal) rickshaw. I tell the
customers that if I have to cross them (on my route) then you must pay me more…”
(Male, 48)

194
The above cited interview excerpt provides an unusual critique to the motor-vehicle
centric road building and total negligence towards the non-motorised modes in the city.
Interestingly, the risks and efforts to cross a flyover are mitigated by a regular practice
of negotiating the fare of the pedal rickshaw trip. Such negotiations are crucial to
understand the mobility practices of the poor pedal rickshaw puller. The auto rickshaw
drivers are a more organised, politically vocal group. In the last decade, they have
been successfully converted to their engines to Compressed Natural Gas (CNG) from
diesel with the support of government subsidies. In contrast, the handcart and pedal
rickshaw pullers are not organised, are more vulnerable as they are a relatively smaller
group in the city. They are also more exposed to the risks caused by motor traffic.
It is important to note here that a diverse set of livelihoods is linked with the regular use
of (two-wheeler) cycles amongst the self-employed workers. These are not typical
transport service providers but they use their cycles innovatively to earn their
livelihoods. A bicycle is not only a transport mode but also a goods carrier and a tool to
provide their services. To give some diverse set of examples – bicycles are used by
milk and newspaper sellers, the knife sharpers, cobblers, key-lock repairer or duplicate
key makers, flower-garland sellers, juice-sellers, home-made food sellers, plumbers,
electricians, masons, postmen and many more kinds of livelihoods are associated with
the regular use of bicycles. In some cases, the wheels of cycles are innovatively used
to generate motion to sharpen knives or to make fruit juice. Many such practices go
unnoticed and the diverse use of cycling is rarely documented in the conventional
transport studies. Such practices are constantly being marginalised by the growing use
of motorised vehicles.
Domestic help
“I never thought I would work in people’s houses. I never did much of housework in my
father’s house. When I came here after my marriage, it all went on well for couple of
years. Then our situation started getting worse. I thought I should work to help him [the
husband]. My mother-in-law said no (to me working) but we had problems even eating

195
two proper meals. I had to start the work. Our relative who was already working got me
some work and I have been working for seven to eight years now. Our situation is
much better now.” (Female, 38)
There are gendered notions of livelihood appropriation and how a working woman sees
herself as ‘helping the husband’ and not the equal wage earner. The work of a typical
domestic help is to clean (sweep and mop) their employer’s house, wash cloths and
clean utensils once or twice in a day. Both women and men work as domestic helps47.
If one person works in at least three houses then that person would earn enough (INR
6,000) to push the household just outside the margins of the official poverty line48. So it
is considered a well-paid job where there is pre-fixed but part-time working involved.
This was a popular job amongst women in the informal settlements are not literate
enough to do other jobs. This female, aged 41, describes her typical working day:
“I get up at 5 in the morning and start doing the household work. I cook and get
everything ready… then I go to work in different houses by 7 am. I work in two houses
then and I return at about 8.30 am and finish cooking. Then again, I go to one more
houses at 11 am and finish that work. Then I come back home to give lunch to my
mother-in-law. She helps with the kids and sends them off to the school in the
morning… again in the afternoon; I make one more round of work to clean the utensils
after the lunch. And I come back and start cooking for the evening meal at 5 pm. that’s
my day…” (Female, 41)
The above description of a daily routine gives insights into the amount of hard work,
tight scheduling and multiple trips taking place between her own house and the other
houses where she works. Her service and presence is crucial not only for her family but
also for other working people in the other houses to reach their jobs on time. To
maintain the balance between her household responsibilities and the demands of the
47
There is a distinct pattern about the men who work as domestic help. The male migrants from the Dungarpur district of the adjoining Rajasthan state work as the domestic help in various houses. It is rare to find a male domestic help in Ahmedabad who is not from Dungarpur or South Rajasthan. Women from various communities and castes work as the domestic help in different areas. Such diversity of socio-religious background is not seen in case of the men who work as domestic help. 48
Each of this is counted as ‘one work’ and they are paid per work about INR 500 to 700 (Year 2012) depending upon the demand. In addition, they are also paid occasional bonus in the festive days.

196
jobs, she has to move quickly between her job locations and her house. She walks to
all the places and she cannot manage if the job shifts out of her ‘comfort zone’ walking
distance. This is when the location of her house and other houses become very crucial
for her to function. She still ends up walking about six to eight km daily. But how often
does she find work within her ‘comfort zone’? When this question was put to someone
working in the core city area, the following answer was given:
“We always find work. We are living in a good locality. There is everything here. There
are so many societies (housing colonies) here…that there is always work. Many times,
I have to refuse work if it doesn’t suit me (financially or in terms of time)…” (Female,
32)
People living in the core city areas never complained about not finding enough work.
As the above respondent says, there are middle-class housing colonies around where
one to could find work. This is largely due to the nature of mixed land use and mixed
housing scenarios in many Indian cities such as Ahmedabad. There are always some
jobs available in the core city areas for poor people. This situation changed in the case
of the resettlement sites and other out of centre locations where the ‘easily available
work’ became difficult to access. And in such cases, the women were first to drop out
of the job market and the children would drop out of the schools.
Many male migrants from South Rajasthan who are working as domestic help try to
find shared housing near their job locations in the middle or upper-middle class
colonies. They try to locate any shared rooms in a nearby informal settlement for rent
or they even find more expensive spare rooms in the middle-class colonies in vacant
houses. And unlike the women who work as domestic help, the men cycle to reach a
greater number of destinations and jobs. This is another example of how poor workers
seek to avoid transport or traveling distances become a problem for them by mitigating
such situations by locating themselves in more accessible places.

197
Regular (salaried) employment
Out of the total population of 3,002 people surveyed, about 304 men had regular,
salaried jobs whereas only 76 women had regular, salaried jobs. And about a similar
number of women and men were employed in the casual, daily wage jobs. Table 5-25
shows that there is still about 50 per cent dependence on the non-motorised modes for
the regular employment trips. About 44 per cent of trips take place in the shared and
public transport modes. So the majority of the poor households continue to use non-
motorised transport even after getting the regular employment. The long distance trips
(seven km and above), in case of the municipal bus and the motorised-two wheelers,
are only total 17 per cent amongst the regular employees.
Earlier it was observed in Table 5-24 that people employed in the regular jobs are
economically better off than the rest of the population. During the qualitative interviews,
it was found that the regular salaried jobs may not always be in the close vicinity of the
informal settlements, unlike many other informal jobs. The informal (casual or self-
employed) jobs were relatively easy to get given the social practices related to such
jobs. For example, if a family member wants a household enterprise of vending, the
person has to volunteer and start working. In contrast, finding a regular salaried job
means doing something different or extra compared to other jobs. The workers will
have to get out of their ‘comfort zone’ of walking and start exploring livelihood
possibilities beyond that. This also means such workers make longer trips to access
their job locations. With regular and salaried jobs, the financial capacity of the worker
increases to afford public or shared transport options.
Table 5-25 Mode use distribution in the regular employment trips (percentage trips)
Walking Cycle AMTS Shared Auto Rickshaw
Multiple Modes (NMT + public transport combination)
BRTS Auto Rickshaw
M2W Total
Female 33.9 3.4 11.9 18.6 27.1 0.0 1.7 3.4 100
Male 17.0 34.7 11.7 9.8 18.9 0.4 1.1 6.4 100
Total 20.1 29.0 11.7 11.4 20.4 0.3 1.2 5.9 100
Mean trip 1.3 4.9 10.2 5.6 5.8 6 6.6 8.5 5.1

198
lengths
However, the tendency to minimise the transport cost doesn’t go away completely. The
use of cycling amongst men increased in the case of regular salaried job compared to
other kind of jobs. Except for the pedestrians, the remaining trip makers travel within
five to ten km for regular employment. However, some of the qualitative narratives
suggested that there is nothing ‘regular’ about trips made for the regular employment.
“Nothing is fixed about my coming and going (to work). I work in LG [hospital]… and it
is about 4 km from here. Sometimes my husband drops me [on cycle]; otherwise, I
walk until the junction and take a shuttle. On some good day, I get the red bus… it’s
cheaper than the rickshaw. And the shuttle drops me right at the gate (of the hospital).
In the red bus, I have to walk a bit. On some days when I have time or if I have a
company while coming back, I just walk all the way... in which case, I can buy some
vegetables (or ration) on the way back (for the evening meal)” (Female, 41)
The above narrative offers a case of everyday changing travel pattern but it also
suggests that the changing pattern is primarily because of the deficiency of public
transport available. The unreliability of the bus service affects the commuters who
instead of fully relying on the bus service make other arrangements. Ideally, they would
not mind going by bus on a regular basis if it was reliable and affordable. Instead they
make other choices and keep looking for alternative ways to reach their destination.
Getting into regular employment activities from any other categories requires efforts or
learning new skills among the poor. Regular employment is also a more dignified job if
not always the best paid compared to the previous employment.
“I used to work in people’s houses (as domestic help)... about 4 years back. When this
(garment) factory was built here, I got a call from my friend that they are some jobs
here. It was not a lot of money but this was a ‘proper job’ and I will get a uniform. I did
not want to be a domestic help all my life. So I joined here as a cleaner. Then I told the
boss that I want to be in packaging. I know how to read-write; they gave training for
that (packaging). Now I want to learn stitching and move up, then it will be all good.”
(Female, 36)

199
It is also noteworthy that for this woman her mobility was not a very big concern as she
lived within two km of her workplace. She walks to work. Earlier as a domestic help too,
she would easily find work in her zone of walking distance. Such advantage of finding
jobs in residential and industrial areas in the close vicinity of her house comes from the
fact that she lives in an area which has mixed land-use with a wide range of mixing of
urban activities. Given this advantage, she could transit easily from an informal job to a
formal job. But such advantages of location are not available to everyone.
“I live here in Rakhiyal and I have to go to Drive-in Road. I work as a (security) guard in
a mall. I used to cycle earlier but I get very tired doing that. So I started using the bus. I
have to start really early from home and then I catch a bus to LalDarwaja (central hub
for the municipal buses) and change a bus there for Thaltej. It takes me one – one and
half-hour every day. Lot of time goes in waiting and I have to reach in time or I lose my
half day’s salary” (Male, 51)
The above quote is from a person who is a ‘captive user’ of the municipal bus service
and travels about 11-12 km every day. For him, a salaried job means travelling long
distances in the municipal bus. He also said further that he doesn’t take a duty in
certain hours, which are better paid because he is not sure of getting the bus. He also
said that he doesn’t want to go back to his job in a factory and he likes his job, which is
now less labour-intensive. But for him, making a better employment choice comes with
the captivity of longer commutes. Although the salaried jobs are better options of
employment, they may not be an option for everyone due to the mobility options
available to the poor, it. This dilemma was observed amongst many others as well. The
regular salaried job means long working hours, longer commutes and less time to take
care of the household duties or the time with the family.
5.3.3 Gender and mobility practices
Like livelihood options and residential location, gender provides an important social
frame to look at the mobility of the poor. Gender roles and their social positioning are
important factors within a household to influence choices individuals make including

200
that of their mobility. The gender disaggregated quantitative data presented in section
5.1 supports the claim that mobility is skewed between the genders. It was observed in
section 5.1 that the trips by poor women were dominated by walking and that they
travelled shorter distances compared to men. Amongst the poor in the city women
experience more mobility constraints compared to men. Amongst the poor in
Ahmedabad, women study less, work less and travel less compared to men in the
same population group. Mobility is gendered, so is work and education, amongst other
things in their lives: women’s mobility constraints need to be seen in a larger scheme.
The mode choices by women and their social dynamics provide an apt explanation to
understand gender and mobility linkages. One major difference observed in the
quantitative dataset between men and women in is the use of cycle. Men use cycles,
whereas women do not. In the overall group of poor people, walking and cycling trips
dominate their total trips in a range of 55-70% based on various other attributes. In
case of women, these trips are mainly walking trips whereas for men the non-motorised
trips are divided between walking and cycling. So the question here is why poor
women do not cycle in Ahmedabad whereas men cycle to work and to other
destinations? It is possible that in a society dominated by patriarchal social norms,
having a personalised mode of transport is linked with giving a certain kind of ‘freedom’
and such ‘freedom’ is not encouraged for women in general. However, this is not the
case at least with the motorised two-wheelers in Ahmedabad, which are extensively
used by women who are not poor, albeit that they are from a different socio-economic
background. Does this mean that the poor are more conservative about women’s
mobility options than the other income groups in Ahmedabad? Patriarchal values or the
imagined subsidiary position of women in a household do not completely explain the
non-use of the cycle amongst the women. Many times it is observed that such attitudes
of restraint are re-structured and negotiated if they are against the logic of economic
benefits or better resource use. The use of cycles might help the poor women go
longer distances and have more options for their jobs than what they can access by

201
walking. This is also observed in the case of the cycling men, that they cover longer
distances as trips compared to men who are walking. So despite having access to
cycles relatively easily, why do poor women refrain from using them? This question
was asked to various women and there was no one clear answer to this mystery.
There were many reasons deliberated by this researcher based on the responses of
women participants for the non-use of cycles amongst the women. Firstly, there is a
high level of malnourishment amongst poor women in the state of Gujarat (which is
otherwise industrialised and urbanized compared to other states). It is possible that
poor women do not have the physical stamina to go longer distances on a cycle and
they find walking more convenient. Secondly, there were issues of road and social
safety, and subsequent vulnerability against other vehicles and other people on the
streets. There are both, perceived and real dangers related to cycling. Women
somehow feel that cycling is more prone to vulnerabilities compared to walking or other
modes and they have expressed so in different interviews. Thirdly, the kind of clothing
(such as typically a saree) worn by the women in most settlements wouldn’t make it
convenient to cycle. However, the patriarchal values and the social position of women
do form an important background within which these different reasons operate. Some
women also said that they would be looked down upon or commented upon if they are
seen to be either as mobile as men or if they are the ‘outgoing’ types.
In the qualitative interviews, women did mention that cycling is not ‘convenient’ and
they all laughed at the idea of women cycling the city, but couldn’t give clear answers
about why they do not prefer cycling. So it will be assumed that the combination of the
reasons given above in the larger context of dominant patriarchal values could give an
explanation about the non-use of cycles amongst the poor women. Some women did
say that given a choice, they will be fascinated to use a motorised two wheeler instead
of a cycle. The non-use of cycling amongst women is also linked with the other
observation that the idea of personalised transport mode for women (whether cycles or

202
otherwise) is not encouraged, especially when the personalised transport modes are
difficult to afford. There is a strong affordability link to the non-used of any personalised
mode operating within the social context of patriarchy. Whenever a poor household
could afford a personalised mode such a cycle or a motorised two-wheeler, the first
claim on its ownership and use is reserved for the men in the house. It was also
observed that the women typically aspired for their husband, son, brother or father to
have a motorised two-wheeler and to have better mobility. When asked about
themselves, they would answer that they don’t need to go too far, so they simply walk
to their destinations. The patriarchal values were observed to be deep-rooted in the
women as well, as they saw themselves – at least in this case their own mobility – as
subservient to the men and their mobility options. Some men also displayed their
‘protective’ attitudes by saying that they like to drop or pick-up the women of their
household so that they do not need to walk. Whichever household amongst the poor
could afford a motorised two-wheeler; it would become a symbol of higher social
status, power and wealth for the household. The men in such households would be
considered ‘successful’ and the women would be the proud back-seat rider.
This patriarchal and gendered attitude to mobility extends to other modes as well. The
men were considered to be the main breadwinners, so their mobility was important
within a household. So even if they could not afford the personalised mode of
transport, the men had a ‘right’ to spend on the motorised mobility such as public bus
or shared rickshaw. This was despite the fact that in many households the women
earned well and sometimes more than the men. Working within the constraints of
walking shorter travelling distances and even after managing the household
responsibilities such as cooking, child-care and shopping, the women provided an
important share of the household income. There are social expectations from the
women to balance household responsibilities with work responsibilities. Many women
have to work in near-by locations and keep their schedules flexible enough to take care
of household or childcare responsibilities. This not only restricts the mobility choices of

203
a woman but also her livelihood choices. There were instances where the women
narrated that they often were not ‘allowed’ by their husbands to work. As in the case of
the 38 year old woman, who was saying that she was only ‘allowed’ to work until ten
years of her marriage. Only when the household income had stopped due to the illness
of husband, she could start working as a domestic help.
Many interesting social practices related to childcare were observed in the poor
neighbourhoods. In households where both the husband and the wife worked,
childcare was an issue. It was sometimes resolved with support of neighbours or kin.
For a working mother employed in a regular job, the children would stay at a
neighbour’s place during the afternoon along with the other kids. If the mother had
flexible job hours and if she worked in a nearby area, then she could come back to look
after the children when needed. All these various kinds of calculation and logic had to
be negotiated by the women while deciding upon their job locations and mobility
options. As a drastic measure, sometimes the children were sent off to the
grandparents’ house in the village so that the husband and wife could continue to work
and survive in a city.
Many women mentioned (Section 5.2) that they sometimes prefer to walk instead of
waiting for the bus or a rickshaw. Beyond the question of financial affordability, this
preference is also borne out of the fact that they cannot afford to spend time waiting for
the motorised modes. It is a better deal to walk for 30 minutes and cover about three
km rather than waiting for an uncertain period for the bus or rickshaw and then
spending money on transport. Poor working women are also ‘time-poor’ where they
have to quickly manage their transition from the social to professional roles and
notably, the most reliable mode for them is walking. With walking, they were sure to
manage their travel time, as they don’t have to rely on any external agency for their
mobility. Given the fact that they were not traveling long distances, unlike in many other
large cities around the world, they could manage their daily travel distances by walking.

204
5.4 Conclusion – negotiated mobility practices
The chapter has presented the mobility patterns and practices of the poor and
explained how the mobility of the poor is best understood through their negotiated
practices. In the beginning of the chapter, the quantitative analysis presented the
following:
1. Out of the total 3428 trips recorded of the poor residents, 62 per cent were the non-
motorised trips, 34 per cent were public or shared transport trips and only 4 per
cent were trips by private modes, mainly motorised two wheeler.
2. 65 per cent of trips by women were by walking whereas 34 per cent of trips
amongst men were by walking and 22 per cent were cycling trips. The walking trips
were typically short trips with mean trip length of less than 1.5 km. The majority of
the poor did not spend any money on transport.
3. The mean trip lengths changed significantly with the changes in the mode. All
motorised trips in public and shared transport had mean trip lengths of five to nine
km.
4. The municipal or public bus has a long waiting time of 25 minutes whereas the
shared auto rickshaws were more reliable and cheaper compared to the public bus.
5. Work and education trips dominated the trip purpose with 55.2 and 29.4 per cent
respectively. The social or recreational trips were meagre 2.1 per cent and the
shopping and other household errands were 11 per cent.
6. Trip length and trip expenditure had a strong co-relation whereas household
income did not have strong co-relation either with the trip expenditure or trip
lengths. Within the group of poor people, the differences in the income level did not
alter their mobility pattern significantly.
7. The mean monthly income of the motorised trip makers was more than that of the
non-motorised trip makers across all the settlements. However, the poor public

205
transport users are incurring more cost per month on transport. That leaves them
poorer as compared to the non-motorised transport users in terms of absolute
income.
8. Compared to the settlements located in the core city and the periphery, there was
an additional burden of motorised trips in the resettlement sites. The mean trip
lengths for work had increased to 9.4 km compared to 4.4 km and 5.5 km in core
city and the peripheral settlements.
9. The regular salaried employed people earned more compared to the other groups
such as the self-employed or the casual workers. But this did not mean that they
travelled more compared to the trip-makers in other livelihood categories. In fact,
within all livelihood groups, there was a great difference in the motorised trip
makers and the non-motorised trip makers.
The qualitative narratives not only corroborated many quantitative findings but they
also presented the nuances related to mobility of the poor in Ahmedabad. Figure 5-8
maps a range of social practices recorded as part of the qualitative interviews. These
social practices are structured as resources (and their constraints), competencies (and
their barriers) and deeper social meanings. There was tacit knowledge, collective
know-how, underlying assumptions and reference patterns of others when it came to
making important decisions around one’s mobility in the city. The resources and their
constraints related to mobility were the most important in poor people’s lives. There is a
great sensitivity to the transport costs. There were tendencies to minimise transport
costs as much as possible or to eliminate them completely. A lot of negotiations and
adjustments were made to make transport costs minimal. Walking and cycling is
functional but these modes are used also to continue to resist any form of motorisation
as it incurs transport costs. However, walking and cycling was not always pleasureable
experience for everyone and some problems were also described related to commuting
long distances.

206
Figure 5-10 Mapping social practices around mobility of the poor
Resources and their constraints
Competencies (or barriers to
competencies)
Meaning and associations

207
A second set of resources were access to transport modes, whether public of private.
The choice dynamics around transport modes were complex. Private motorised modes
were unaffordable, public and shared modes had their own issues of reliability and
affordability and thus, walking and cycling were the most common way of moving
around the city. These mode choices also bring to light the limitations of distance and
time spent. The purchase cost of cycle was not affordable to some people and they
were relying on buying used cycles or using the cycles on rent. Any vehicle was seen
as a household asset and a sense of pride was associated with it.
There were larger structural issues, which influenced the competencies or capabilities
of the poor in everyday life. Poor people were struggling to overcome economic and
social barriers related to livelihood options like education level, skills development,
social positioning, which impacted the kind of jobs individuals could take up or not.
There were spatial barriers being exaggerated by the lack of efficient transport options.
There were information barriers not only in the transport realm but also in dealing with
urban governance in general regarding any issue of housing, infrastructure, transport
or legalities. All these barriers were finally part of the political barriers of not being able
to deal with the government and the elected representatives effectively and feeling
completely disenfranchised. Lastly, there were a number of interesting meanings and
associations developed around one’s mobility – mode-linked identity formation, self-
projection and posturing around righteous practices.
Mobility is a negotiated social practice rooted often as household strategy or individual
choice. Mobility options are an important consideration while navigating through
livelihood options or job locations, especially for women. Convenience of mobility often
determines where to live, where to work or what kind of jobs to look for. In this sense,
the mobility practices are linked with poverty. Trade-offs were made around minimising
travel in the city in most cases. Besides, poor people in the accessible locations didn’t
want to take risks and experiment with their job options. They often followed the

208
livelihood pattern and thus established social practices to access the city. A
construction worker would follow the example of other construction workers in seeking
work and moving around the city. The mobility related social practices were developed
and repeated as collective actions.
The issue of mobility becomes relevant or irrelevant in a poor person’s life based on
her/his locus. This chapter finally analysed how this ‘locus’ could be geographic
(residential location based), social (gender based) or economic (livelihood based).
Based on this locus, trade-offs were made and their mobility was negotiated. The
location, livelihood or gender-based discussion of mobility practices provides diversities
and complexities of these practices within the group of poor people. To what extent
these negotiations help the poor get out of poverty is analysed further in the next
chapter.

209
6. Moving out of poverty and the role of sustainable mobility
Mobility of the poor can be facilitated by adquate infrastructure provision and transport
supply. This infrastructure provision is important not only to generally increase the
mobility of the poor in the city but it should help them move out of poverty in a
sustainable manner. This the central theme of the current chapter which analyses the
second research question about ‘How do findings about the mobility and accessibility
of this group of urban poor inform policies for poverty alleviation and sustainable
mobility?’. This second research question is supported by two sub-questions as the
following:
a. To what extent does the city’s transport system facilitate or constrain the
mobility and accessibility of the poor?
b. How do mobility-related negotiations influence aspects of moving in and out
of poverty and how can they be supported by policy?
This chapter analyses these two specific questions and related issues based on the
analysis of the primary qualitative and quantitative data for Ahmedabad, earlier used in
Chapter 5. Two different subsections of this chapter (6.1 and 6.2) respond to the two
sub-questions whereas Section 6.3 combines the outputs to further answer the main
research question about the implication of the data analysis on the debates related to
poverty alleviation and sustainable mobility.
6.1 The role of transport provision and urban governance
The Municipal Corporation of Ahmedabad is responsible for planning, mananging and
operating the (public) transport system in the city as per the constitutional and legal

210
mandate49. Looking at the most prominent mode use of the poor in Ahmedabad in
Chapter-5, the issues with the official transport provision or supply are divided into two
sections for further analysis; one, public transport including the BRT and two, the non-
motorised transport infrastructure.
6.1.1 Bus rapid transit and public transport in Ahmedabad
The Bus Rapid Transit project of Ahmedabad is one of the largest networks of bus
rapid transit in the country. In fact, the share of Ahmedabad’s BRT route network in the
total BRT network operating in the country is more than 80 per cent. All other cities in
India have not been able to expand the BRT as a network like Ahmedabad; they have
isolated BRT corridors in operation with no expansion taking place. Ahmedabad has
developed 82 km of network in the last seven years with the total cost of INR 10 billions
and there are 0.15 millon commuters using the system per day (Times of India, 2014).
This national government-funded BRT project was seen as a strategic intervention that
seeks to improve the public transit in the city. The BRT proposal was tabled with the
intention of introducing a network of 155 km, with Phase 1 developed in the
Ahmedabad Municipal Corporation area of 58 km, attempting to induce modal shift and
to improve road infrastructure.
As discussed in Section 5.1.1, use of the BRT by the poor is negligible. In order to
investigate this further, three settlements surveyed as part of this thesis which are
located in close vicinity to BRT corridors were studied in detail. Santoshinagar na
Chhapara (North, near Naroda), Hanuman Nagar (East, near CTM) and Sanjay Nagar
(West, near Sola housing) are located within the 200 meters of walking distance from
the BRT bus stop. In total, 117 households were surveyed in these three settlements.
Even within these households, the use of BRT was found to be negligible.
49
As per the Bombay Provincial Municipal Corporations Act of 1949 further amended in the year 1999 and the 74
th Constitutional Amendment Act of 1992, which allocates the urban (transport) planning function to
the city government.

211
Table 6-1 Mode share in settlements located along BRT corridors (percentage trips)
Settlements close to BRT (within 200m)
Walking Cycle Hand Cart/ Paddle
Rickshaw
AMTS Shared Auto
Rickshaw
BRT M2W Auto Rickshaw
Overall
Female 70 1 0 13 12 0 1 2 100
Male 28 21 1 19 16 1 7 6 100
Overall 44 14 1 17 14 1 5 4 100
Table 6-1 presents negligible use of BRT amongst the poor households residing in the
settlements next to the BRT corridor. The table shows that in the settlements closer to
the BRT corridors, the mode share pattern resembles the overall mode share pattern
discussed in Section 5.1.1 and Table 5-4. Non-motorised trips dominate the mode
share in these three settlements followed by the shared auto rickshaw and the
municipal bus. When the data for this study were collected in 2011-12 the BRT network
was 45 km in total. By September 2014 it has been extended to 82 km but the ridership
of the system had not increased in the previous three years (Times of India, 2014).
One master’s thesis (Khanna, 2009) dramatically asks - ‘who are the (real) gainers and
losers of the BRT in Ahmedabad?’ This work discusses the economic analysis of the
project and the distribution of its benefits (time-cost savings, safety, pollution
reduction). It considers consequences across income groups and spatially by
calculating Gini and Theil’s index for the 196 traffic analysis zones (demarcated by the
year 2000 survey data). This study concludes that the higher income groups located
mainly in Western Ahmedabad accrue the largest proportion of the BRT project
benefits compared to that group’s proportion of households in the city and on the same
basis the poor households gain the lowest level of benefit from this project. Based on
the economic analysis of the project and implementation process, Khanna goes on to
claim that the BRT is a ‘regressive project’ and it will increase inequity in the city
(Khanna, 2009: 71, 73). However, Khanna’s work suffers from the non-availability of
the baseline data, both on the spatial distribution of the income groups and
heterogeneity within the traffic analysis zones. The study only takes in account direct

212
project benefits such as the actual use of BRT system and not so much the indirect
benefits of developing the non-motorised infrastructure. Apart from the methodological
and data issues, the typical cost-benefit analysis may be useful in deciding the
effectiveness of the investments in the public transit projects, but it is not the best
approach to understanding the distribution of benefits amongst the different socio-
economic groups. Giving verdicts such as ‘regressive’ even before the BRT was
operationalised in October 2009 is far-fetched and to view the BRT project from the
prism of mutually exclusive categories of ‘gainers vs. losers’ is also limiting the
nuances of the social issues in the transit-related debates.
BRTS is intended to be not only exclusive bus services run in the carriageway median
but also a comprehensive system benefitting various users of public transport, cyclists
and pedestrians (Deng & Nelson, 2011; Suzuki, Cervero & Luchi, 2013). The present
researcher was involved in a study (Mahadevia, Joshi & Datey, 2012) which looked at
two aspects of the BRT project: one, the socio-economic profile of the BRT users to
understand the social outreach of the project and two, the use of corresponding
infrastructure for walking and cycling along the BRT corridors to view the benefits of the
project in totality. The discussion on the second component is given in Section 6.1.2
and the socio-economic profile of the users (sample size 1080 respondents) of the BRT
is highlighted here in Table 6-2.
Table 6-2 Income and gender profile of BRT users
Source: Primary survey, CUE as presented by Mahadevia, Joshi & Datey (2012)
Household Monthly Income (INR)
Percentage of the BRT trips Sex ratio of users Male Female Persons
Upto 2,500 1.7 1.7 1.7 285
2,501-5,000 12.7 9.8 11.9 292
5,001-7,500 12.1 8.0 11.0 253
7,501-10,000 13.9 11.2 13.2 305
10,001-20,000 28.2 27.6 28.1 371
20,001- 30,000 12.5 16.4 13.6 500
30,001- above 18.9 33.2 20.6 400
Total 100.0 100.0 100.0 379

213
Mahadevia, Joshi & Datey (2012) surveyed the BRT users to examines that although
the BRT system is promoted as low-cost public transport in Indian cities, it is not yet
accessible to the urban poor and in particular women among them. This is especially
the case where there are large numbers of slum squatters and low-income housing in
close vicinity to the BRT corridors. Of the total users, only 13.6 per cent belong to
household incomes of up to INR 5,00050. Just one-fourth users had monthly incomes of
up to INR 7,500 and 62.2 per cent were with monthly incomes of more than INR
10,000. Largely middle-income groups are using Ahmedabad BRT with monthly
incomes between INR 10,000-40,000, wherein half the users fall. The cost of the BRT
is higher than the cost of the alternative public transport system, which is the municipal
bus (AMTS) or the shared auto rickshaws. The study by Mahadevia, Joshi and Datey
(2012) corrobarates the findings of the quantitative component of the current thesis that
the BRT system in Ahmedabad does not improve the accessibility of poor households.
However, Mahadevia, Joshi and Datey (2012) did not seek responses from the poor
regarding why they do not use the BRT with either quantitative or qualitative methods.
The present thesis does analyse those narratives; from participants living in the areas
nearby the BRT about why they do not see BRT as a relevant proposition for them –
“Yes, it (BRT) is a good… its goes very fast but I can’t use it. Too expensive tickets…
once in a while it is good to go out but it’s not every day…” (Male, 21)
“Why don’t I use BRT? Because I have my cycle. It takes me where I want to go and it
doesn’t cost… the BRT doesn't go, where I want to go…” (Male, 42)
“This new project is good, there is lot of development all round… but we don’t need to
go in BRT everyday. See, the trains are good too. But do you go in the trains
everyday? No, you only go in there when you want to go far away…” (Male, 62)
50
As per the National Sample Survey’s (NSS’s) Consumption Expenditure data of 2009-10, about 50 per cent of the urban households fall in the monthly household income category of up to INR 5,000 (NSSO, 2011). Hence, it can be safely assumed that about 35 per cent the households will fall below incomes of INR 5,000 per month or less in Ahmedabad. This is also be close the official poverty line of the Gujarat state of INR 4800 for a household size of 5 (INR 32/capita/day).

214
The last quote especially represents the ‘wisdom’ of using BRT sparingly as if it is a
regional transport facility, so it can be used only when one wants to travel to a far off
destination. BRT has expensive fares for the poor. So, the poor are using the biggest
sustainable transport initiative in Ahmedabad very lightly, and in many cases not at all.
The reasons given in the above narratives are expensive tickets, unsuitable routing or
the exclusivity of the system. But a section of poor households do use the public bus
(AMTS) and the shared auto rickshaw for their daily mobility as discussed in the earlier
chapter 5. The planning of the BRT network could have facilitated the mobility of the
poor, if the system had been planned comprehensively and included improving the
regular bus service and the informal transport in the city simultaneously, as attempted
in the case of Johanesberg (Venter, 2013). Unfortunately, the public transport systems
(AMTS and BRT) are not yet integrated with each other in terms of physical access,
fares, ticketing and routing. The public bus (AMTS) does not use the segregated
corridors made for the BRT project instead on certain corridors both kind of buses run
parallel to each other being counter productive for the ridership of both the systems. As
noted in Section 4.4.1, The AMTS services are depleting since the BRT has taken a lot
of the attention and human resource of the authorities. The shared auto rickshaw is
another reliable transport options for the poor, but the traffic police and the municipal
authorities view it as a ‘menace’.
It can also be argued that even if a mass transit system like BRT is not directly serving
all income groups in the city, if it results in modal shift from private vehicles to public
transport then it will result in overall indirect benefits to the city, including for the poor.
However, the stagnation of ridership growth in the past three years, in spite of the
doubling of the network length, is an important indicator that the BRT has not yet been
able to realise its full potential in capturing transport demand even amongst the middle-
income groups. Cervero gives reasons for such short-comings in the case of
Ahmeabad BRT through two of his recent works (Suzuki, Cervero & Luchi, 2013;
Cervero & Dai, 2014). The first one (Suzuki, Cervero & Luchi, 2013) is a World Bank

215
publication, which balances critical commentary with praise for the planning efforts in
the city. But the second publication (Cervero & Dai, 2014) is more candid about the
short-comings of Ahmedabad’s BRT when compared with Bogota’s BRT. Cervero
highlights that near-term mobility gains in Ahmedabad BRT took precedence over
shaping the long-term urban growth and thus the sustained ridership of the system
(Cervero & Dai, 2014, p.133). The policies of land use integration with the BRT system
are not clear and little attention has been paid to the perpendicular (feeder) connectors
to the BRT (ibid, p134). Moreover –
“No secondary feeder systems were designed at the time Janmarg was built to ensure
efficient and safe pedestrian, bikeway, and transit connections to mainline services…
what few pedestrian ways exist near Janmarg stops are often occupied by motorcycles
and fast-moving three-wheel vehicles.” (Cervero & Dai, 2014; Pg.135).
There has been larger debate in the country about the benefits of closed and exclusive
BRT systems, such as that of Ahmedabad, (Pai & Hidalgo, 2009) against open and
shared corridor systems such as that in Delhi (Gandhi, Tiwari & Fazio, 2013). The key
argument being the closed system helps in faster operations of buses and avoids
bunching up of buses at the junctions were as the open system was supposed to have
more flexibility to go in and out of the segregated corridors. Beyond this bi-partisan
debate in India, Alan Gilbert, taking an example of Bogota, argues that BRT system
planning is a continuous process where the settlement of the poor needs to be
integrated physically and the poor households need to be included by making the fares
affordable, by equitably distributing the transport subsidies across the income-classes
(Gilbert, 2008, 2013). Both the qualitative narratives and the quantitative findings from
the poor in Ahmedabad suggested that planning comprehensively for an efficient and
affordable bus-based public transport system would benefit the poor.
The planning of Ahmedabad’s BRT was potentially an opportunity also for reviving the
AMTS by creating an integrated bus-based public transport system for the city. AMTS

216
carries about 0.8 million commuters already and the existing public transport users
would have benefitted from the further improvement of the overall bus system. The
BRT and AMTS are planned, implemented and operated by the same government
agency – the AMC. So the AMC does not need to rely on co-ordinating with other
agencies or to seeking a legal mandate from the state government to undertake
integrated planning. The combined planning for AMTS-BRT integration could have
been managed within the purview of the AMC itself. This integration would have helped
the mobilty of the poor the most, as it was also claimed in the detailed project
(proposal) reports for the BRT.
Besides not being the favoured mode of the poor, the BRT project has directly
impacted the lives of the poor by forcefully evicting about 2,600 families to enable
construction of a number of corridors of the BRT network - mostly in the Wadaj,
Chandola Lake, Dani Limda, Khodiyar Nagar, Shah Alam, Jamalpur, and Soni ni Chali
areas (Figure 6-1). At the time of the evictions it was claimed that this was for routine
road-widening based on what was proposed in the development plan of the city. But
this road-widening never took place for over a decade until the BRT project was
proposed. The BRT project may not be the sole reason for the evictions but it was
surely a trigger. All the displaced families were relocated in the resettlement sites on
the periphery of the city – some of which were studied in detailed as part of this PhD
project (Section 5.3.1). In addition, a local NGO working with street-vendors - SEWA
Union (2010) - has documented how the BRT network development has displaced
more than 2,000 vendors across the city. Many of them have relocated themselves to
side streets along the BRT corridors.
Ahmedabad BRT raises a very pertinent concern, of treating public transport as a
narrowly-focused technological fix rather than a project to achieve wider urban or social
objectives. The examples from Bogota and Johanesberg (Gilbert, 2008; Venter, 2013)
show that to achieve the wider social objectives of facilitating the mobility of the poor

217
requires continuous efforts by the formal public transport systems to be affordable and
reliable. Some of these efforts fall short in the case of Ahmedabad’s BRT and of the
overall public transport system in the city.
Figure 6-1 Forced evictions for the road widening on the BRT corridor - Wadaj
Note: Satellite images of Nava wadaj area in Ahmedabad in Feb and May 2010
6.1.2 Infrastructure for non-motorised transport
“Earlier, I could send the children to school [walking] on their own. One elder kid [from
the neighbourhood] could take care of everyone… but now, I do not trust this traffic. It
is scary for me to cross the roads...How can I let the children go? I have told them (the
children) not to go near the [main] road. I am always worried about them running off [to
the road] and meeting with an accident…” (Female, 38)
“There are no footpaths anywhere, so I like to walk on the road… if you make your
own space and move quickly then there is no problem…” (Male, 28)
Concerns about road safety were reflected in the narratives of some paticipants who
walked for their daily needs. A home-based working woman aged 38 talks about the
mobility of her children (seven, ten and thirteen years old) to the nearby municipal

218
school. She describes that the traffic situation around her settlement has worsened in
the last few years. She accompanies her children walking to school everyday instead
of sending them on their own. The previously established social practice of a group of
children from a neighbourhood walking to school guided by a few older children is
changing fast. The lack of safe walking infrastructure (both footpaths and crossings) for
children results in growing concerns of road safety, which restricts the independent
mobility of the children. The narrow lanes of the settlements are the only outside play
areas for children. They are restricted by their parents not to go near the main road
which is full of traffic. There were some instances of children getting hurt in the road
crashes in this settlement, which further explains the road safety outlook of the
participant.
Figure 6-2 Roads without good quality footpaths in western Ahmedabad
One of the participants, a male construction worker aged 28, describes that he prefers
to walk on the mixed traffic lanes, right next to the mainstream traffic as there are no
footpaths. He asserts that he manages to negotiate space and move quicky. However,
this assertion may not be shared by the people of other age groups. In the absence of
walking-friendly infrastructure, many pedestrians end up walking on the margin of the
mixed traffic lane, in order to evade parked vehicles, unpaved areas, vending or other
activities on the street. This causes a conflict situation between the fast-moving

219
vehicles and slow-moving pedestrians.51 It was difficult to discuss with the participants
what high quality pedestrian infrastructure might mean, as they had no recollection of
walking on proper footpaths in Ahmedabad.
While accepting the view that there is a unique street culture in India (Edensor, 1998;
Anjaria, 2012), facilitated by open-ended designs and adaptive uses, it is equally
important to recognise that road spaces without footpaths or crossings pose great
dangers to pedestrians. Some studies have attempted to measure walkability in
Ahmedabad through primary road-audit surveys (Krambeck, 2006; Osborne, 2012).
These studies show that the footpaths are either non-existent or not usable on the
roads they surveyed. Apart from a few major commercial streets like the Ashram Road
or the CG Road, where the right of way has been designed for various users, the
majority of the streets in Ahmedabad are not designed for all users and they do not
have any usable footpaths. What are sometimes assigned as ‘footpaths’ are in practice
discontinuous side curbs built around trees, light poles, utility boxes or benches (Datey
et al., 2012). It is a conventional practice amongst the municipal engineers to assign
the entire right of way for mixed traffic, ignoring the space for footpaths, on-street
parking, vending or other street amenities. This lack of design particularly marginalises
the poor, the aged or the physically challenged population, as has been covered also in
local media reports (Shastri, 2012; TNN, 2014).
With the entry of the JnNURM (Jawaharlal Nehru National Urban Renewal Mission)
funds backed by the NUTP (National Urban Transport Policy) proclaiming to make
‘streets for people’, and not roads for vehicles, there were promises to bring change in
the way in which streets are designed in Ahmedabad, beginning with the BRT project.
The BRT project should also be seen as the largest street design project in the city;
never before had there been the opportunity to consider hundreds of kilometres of road
space for edge-to-edge development, incorporating the needs of all users. The official
51
Accordingly to an official document (AMC-CEPT, 2008;p3-13), 61 per cent of affected modes in the road fatalities in Ahmedabad are the non-motorised modes.

220
documents like the detailed project reports (DPR) of the BRT (AMC-CEPT, 2007, 2008)
are full of graphics detailing the proposed provision of footpaths and cycle tracks on
every corridor of the network. This initiative was particularly important given the large
share of walk trips in Ahmedabad traffic in general and in the case of poor commuters
in particular as described by the quote below -
“A large proportion of the population either walks or use bicycle. Hence needs for
improvements in related facilities are a necessity.” (AMC, AUDA & CEPT University,
2007;p.5-19)
Figure 6-3 Non-use of cycle tracks on the BRT corridor in the West Ahmedabad
However, in practice, the non-motorised transport (NMT) infrastructure has been not
delivered as promised across the BRT network in the detailed project reports. The non-
motorized transport network planned in conjunction with the bus rapid transit system,
complete with segregated cycle tracks and footpaths, does not exist on most stretches.
Mahadevia, Joshi & Datey, (2012) reported that only 26 per cent of the 45 route-km
had bicycle tracks as part of the design in the year 2012, and wherever this
infrastructure was provided, one-third was affected by obstructions. On the stretches
where the cycle tracks exists, cyclists are unable to use them owing to a variety of
issues such as high curbs, uneven finishing, lack of continuity or visibility, lack of
consideration at signals. In addition, they become impromptu parking spaces blocking
the passage of cycles (Shastri, 2010). The designers’ response to these outcomes was
Photos: Center for Urban Equity, CEPT University

221
to discontinue the policy of providing segregated cycle tracks in future BRT corridor
design (Bansal, 2013). Hence, Ahmedabad’s BRT system has chosen to ignore cycling
by first designing faulty cycle tracks then after the lack of use asserting that it is not
necessary to have segregated cycle tracks as ‘no one uses them’ (TNN, 2012; DNA,
2012).
In the case of footpaths, 84 per cent of the BRT route-km had footpaths in 2012, but
only 53 per cent of these were unobstructed or in good enough condition to be used
(Mahadevia, Joshi & Datey, 2012). To access the central median bus stops of the BRT
from the sides of the roads by walking is difficult and unsafe for pedestrians (Cervero &
Dai, 2014; pg.135). The lost opportunity of building walking and cycling facilities as part
of the BRT corridors would have been another way of facilitating the travel of the urban
poor. Comprehensive walking and cycling plans would have connected poor
households to a large range of services and livelihoods. Without a good network of
walking and cycling, the BRT corridors in Ahmedabad are reduced to only as a bus
system running on the central median lanes and not a comprehensive transport
solution for the city as promised. Delhi’s partially-implemented BRT corridors have
included successful roadway design for pedestrians and cyclists (Tiwari & Jain, 2012;
Roy, 2013), demonstrating that it is possible to provide for walking or cycling in an
Indian city. However, the growing mass of cyclists and pedestrians in Ahmedabad are
mainly the poor who continue to walk or cycle, without any support from the planning
and infrastructure-building activities of the AMC.
6.1.3 The transport system and the poor in Ahmedabad
It is not too drastic to say that there are various ways in which the poor in Ahmedabad
could have benefitted from the otherwise enabling policy and project initiatives. There
was a national transport policy with sustainable mobility objectives (NUTP) backed by
financial resources (JnNURM). There was a major transport project (BRT) in the city
which promised the infrastructure and public transport provision that could have

222
benefitted the poor. A quick assessment of the AMC budget shows that about one-third
is spent on transport sector projects (AMC, 2010, 2013). All modes favorable to the
poor (walking, cycling and public bus) are either not being planned for or are not being
implemented properly in Ahmedabad city. However, it is not so much the issue of
availability of finance or having a right policy at the national level, the mobility of the
poor is not being addressed because of the way in which the local – city level - policies
and budget priorities function. Instead the official plans of augmenting transport system
has actively displaced the poor.
None of the official (transport) planning reports in Ahmedabad consult people or seek
their participation in planning efforts. This is true for all income groups but the poor in
particular have suffered because of these plans. This raises fundamental issues of
citizenship and the participation of the poor in urban governance. There are also the
second level of issues related to empirical research and methodological issues within
planning practices. The transport policies in cities like Ahmedabad operate in the
context of limited data availablity, lack of methodological innovations and lack of
empirical evidences to take crucial decisions about the policy directions. The public
transport planning reports in Ahmedabad have not been collecting disaggregated data
representing various socio-economic classes in the city nor do they analyse or report
the collected data based on demographic categories such as gender or age.
Sometimes, the walks trips are excluded from the analysis or the short-trips are not
considered. The mobility of the poor is rarely studied with a view to it being provided
for. Given such flaws of planning methoodlogies, tools and conceptual short comings, it
should not be surprising that transport planning in Ahmedabad results in marginialising
the mobility needs of the poor further. Poor people operate as the invisible population
of the city which find their own ways to manage their mobility, either by walking or
cycling or by using the informal shared auto rickshaw services. It is however, important
to know to what extent these practices help, or restrict, the poor in moving out of
poverty, which is discussed in the following section.

223
6.2 Mobility practices and moving out of poverty
This section discusses the sub research question – ‘How do mobility-related
negotiations influence aspects of moving in and out of poverty and how can they be
supported by policy?’. To answer this sub-question, mainly the qualitative narratives of
various participants are analysed. This section is also substantiated by re-visiting and
elaborating on some of the issues disscussed in the previous chapter (5). There are
three aspects of poverty and mobility inter-linkages outlined here based on the
quantitative datasets and the qualitative narratives. The first aspect is when and how
the poor become the direct ‘victim’ of the mobility of the others. The second aspect
deals with when and how mobility works in favour of the poor households. And the third
aspect is about whether more mobility always means greater well-being and whether
less mobility always means greater poverty and deprivation.
6.2.1 Mobility related vulnerabilities
The mobility of the others and especially motorisation in general makes the poor
directly vulnerable on a few counts. In terms of health vulnerabilities, the noise and air
pollution affect the poor adversely as they reside or work alongside the major junctions
or major roads (Badami, Tiwari & Mohan, 2004). It was not the focus of this thesis to
measure the health impacts of air or noise pollution in poor households as that would
have required an entirely different disciplinary context and methodological tools. But in
terms of road safety, there were a few accounts of how automobile-friendly
infrastructure impacts the poor adversely both as non-motorised transport users and as
residents around such infrastructure projects in Ahmedabad. A number of studies by
Mohan (Mohan & Tiwari, 1999; Mohan, 2001, 2003) have attempted to pitch road
safety as an equity issue which affects the poor sections of the city more directly. The
following narratives present the case describing what leads to perception of road
danger and how such incidences impact the poor households.

224
Baba Lavlavinagar is one of the informal settlements and is located next to the river
front in the core city area. A new flyover had recently been built next to this informal
settlement. The building of the flyover was justified by claiming that it was required to
let the traffic coming from the river bridge to quickly move across the junction which is
otherwise chaotic, given the existing vegetable market at Jamalpur. The entry to the
informal settlement is right next to the approach of the flyover and since the road
geometry is not clearly resolved, this zone has become a dangerous area for
pedestrians –
“The vehicles come down the slope very fast and it is very scary to cross the road…
We have to cross four roads (lanes). It is very difficult. The kids will have to go all the
way round it to go across... We are completely blocked… I don’t think it is for us... it
has cornered us on one side.” (Female, 36)
“My son got hit by a fast moving bus coming down the slope (of the flyover)… and he is
sitting at home for more than 7-8 months now. There were many fractures in his legs
and it is not healing very well. No body has come to ask us anything after that. We
registered a complaint in the police but nothing has happened. A lawyer asked us to
file a case in the court and he promised that he would get us some compensation from
the government. We will have to give him 15% of the compensation as his fees. But we
do not have any money yet. We have spend so much on my son already and we don't
have anything left now…it seems like we have gone back 10 years in life”(Female, 55)
The above quote is from a self-employed working woman aged 55, whose 21-year-old
son was a victim of a road crash injury. The injury occurred while crossing the road in
front of the settlement. The son used to work as an electrician and he has not been
able to work anymore for the past 10 months. This is a family of self-employed vendors
who sell cloths and clothing material. The son who is a road crash victim had
contributed the highest income in the household and now he is unemployed. There are
larger issues of inefficiencies in delivering justice and the compensation to road crash
victims, along with unaffordable health-care. This situation makes it very difficult for the
poor household to function. She had to borrow money from an informal moneylender at

225
a high interest rate to pay for her son’s treatment. As she claims, the household is
pushed back by ten years in terms of its savings and resources. In a full account, she
also describes the kind of social problems created in her household because of an
injured family member being at home all the time. This account clearly describe how
one road crash incident can push back poor households into the spiral of poverty.
Further to a road crash injury, a road fatality would have a lasting impact on a poor
household and if it involves the earning member of the family, it can have
compounding, socio-economic, long-term effects. As seen in this particular case, even
the non-fatal accidents in the poor households result in debt traps and the loss of
livelihood.
“We see so many accidents here. Something or the other keeps happening every few
days. Last year only, x person’s daughter died. The children are always running
around… how much can you take care! The mother had to go to fetch water on the
other side [of the road]. And this girl followed the mother without her knowledge… we
have a big problem of this big road here…First, they were making this road, then they
made the flyover and then this [BRT]… something keeps happening on this road and
there is so much traffic…” (Male, 55)
Apart from the direct account of one road crash victim at Baba Lavavinagar, other
settlements next to a highway or the ring roads had incidences of road crashes
mentioned in some of the accounts. The above quote described by a factory worker
aged 55 shows the vulnerablility of children living next to a 60 m wide road on the
eastern periphery. The peripheral areas on the eastern side have industrial estates,
warehouses and bulk trading activities providing jobs to the poor. These peripheral
areas also consist of the state and the national highways where the urban traffic is
mixed with the longer-distance highway traffic. The peripheries also have higher
concentrations of poor using the non-motorised modes and para-transit and road traffic
injuries are closely linked with the non-motorised modes (Section 5.3.1). This account
also points out that there are frequent road crashes on this road (not necessarily
involing someone from the settlement), especially when different projects were under-

226
construction. It was difficult for him to estimate the frequency of the road crashes but
there was a strong association of this wide road with frequent road crashes.
Both narratives above have shown the vulnerability of the poor households to road
injuries. It is important to point out that India has the highest number of fatalities due to
road traffic-related crashes globally - nearly 140,000 fatalities in 2012. Despite being a
major public health issue that affects the most vulnerable and also the most productive
sections of society, road safety has not received the attention it deserves (Sundar &
Ghate, 2013), both at the national and the city levels.
6.2.2 Shelter-livelihood-mobility balance to move out of poverty
During the qualitative interviews many people could not talk about their future
aspirations and expressed that they had been stuck in a similar situation in their lives
for a long time. While talking about their lives, transport or other issues, the
circumstances of being poor were always present, even when such circumstances
were not described clearly.
‘’I have many wishes...lots of them... but I couldn’t manage to fulfil any one of them
(laughingly)... what all to tell you… I still have to arrange the marriage of my son...after
that there will be some respite in life…’’ (Female, 58)
‘’What to do, there is no money for anything... I felt really bad when I had to borrow
(old) shoes from my brother to give it to my son to go to school… So I am always
careful about spending money… You can not waste money like that (on shared auto
ride)”. (Female, 33)
Poverty takes many forms and impacts the lives of the poor in multiple ways. Moving
out of poverty is a challenge for poor households. Indeed there was often apparently
no one way of moving out of poverty. In the situations of lack of resources, being
consistent with efforts was seen as as a virtue. Poor people planned their lives in small
steps – individually or at the household levels, sometimes following social practices
and norms or by trying something new. However, there were limited options of trying

227
something new. There were obvious choices of livelihood emerging out of ‘how
everyone is doing things’ - out of social practices of dealing with their livelihood. The
same logic was applied in dealing with their transport needs, based on ‘how things are
done’ or ‘what make sense’. Spending on transport fares was considered being
extravagant.
“Finding work is the main thing. If I get work on daily basis then, there is nothing to
worry about…I must get work, that is it… If it all goes well, then I will buy a cycle by
Diwali”. (Male, 28)
“When I came here (after marriage), the situation was not good in our house. My
husband’s salary was little and the expenditure was large. There is so much of price
rise (inflation) these days… I am not so literate, so who will give me work? Finally, this
person (neighbour) told me that there is work to make incense-sticks. They give you
the raw materials and you get paid by the bundles. That’s how I started working and
now it is been six years…” (Female, 28)
The poor households aspire to achieve a certain level of balance between shelter,
livelihood and transport needs. Getitng a well-paid but less-demanding (in terms of
physical efforts and time) livelihood was seen as improving one’s conditions. Here,
minimising travelling distance becomes a major motivation of the poor households in
making choices related to their livelihoods. Minimising traveling distances or minimising
transport in general means doing a home-based work, or finding jobs close to the
residence. This would give them freedom and flexibility to manage their mobility by
walking and in some cases, walking back and forth a number of times. The locational
advantage is central to poor people’s mobility practices because it helps them manage
the uncertainties in their lives. To an extent that people who have managed to minimise
their transport distances, time and cost for a long time, do not give much thoughts to it
or clearly claim that it is not a problem (as discussed in 5.1.5).
But to what extent can the poor exercise their choices to be in a location where there
are relevant jobs nearby? The way to find accessible residential and employment

228
locations without spending much on housing is to dwell in the informal settlements.
Most people have located in the informal settlements through their community and
social networks. Such informal settlements have always emerged in the accessible
locations because there was always demand in the informal housing market to be
located on such sites. The very fact that these housing sites are informal – and in the
governmental terminology illegal – explains why they become affordable to the poor,
who are otherwise priced out of the central land or housing market in a city like
Ahmedabad. But in the strictly regulated planning and governance regimes, there may
not be enough ‘opportunities for slumming’ or to carry out informal activities and such
examples are seen across the world (Shen, Qing and Sanchez, 2003; Næss, 2005;
Venter & Vokolkova, 2007; Lucas, 2011). In such a context the paradigm of social
exclusion to explain the mobility constraints of the poor or the advantaged groups
makes sense where the poor or the disadvantaged groups have no ‘opportunities’ to
slum in the desirable locations and they feel excluded from the city life altogether. The
paradigm of social exclusion often views the issues of mobility and access from the
lenses of motorisation and making non-motorised trips were seen as exclusion (Wati,
2009; Zuidgeest et al., 2012). This may indeed be the case, especially in the North
American or Australian contexts, where the lack of motorisation leads to possible social
exclusion in cities (Currie et al., 2009; Mattioli, 2012), but in Indian cities, or at least in
Ahmedabad, giving the ‘opportunities for slumming’ in accessible locations provides
locational advantages to minimise transport. It is explained in Chapter 4 how years of
land mis-management coupled with informalised planning from the above (Roy, 2009)
creates ‘planned illegalities’ such as systematic slum formations. This is is seen in the
case of Delhi (Bhan, 2013) and in case of Solapur (Kamath & Deekshit, 2014) in the
recent literature. The escape route for the poor from the motorisation-based paradigm
of social exclusion is to make use of such ‘planned illegalities’ and adopt them for their
own benefits of minimising transport. This thesis argues that an inefficient planning
regime coupled with political patronage has worked as a safety net for the poor.

229
However, this is not a policy recommendation, it will be further discussed in Section 6.3
and Section 7.4.
Interestingly, for Ahmedabad this motivation of minimising transport and relying majorly
on the non-motorised modes is seen even in the informal settlements in the periphery
of the city as well. This is contrary to the conventional assumption that the poor living in
the peripheries might be travelling longer distances and will be dependent on public or
shared transport, like in the case of Chennai (Srinivasan & Rogers, 2005) or in many
Sub-Saharan African cities (Olvera, 2003; Venter & Vokolkova, 2007; Kumar & Barrett,
2008; Diaz Olvera, Plat & Pochet, 2013) where peripherisation of the poor increases
their transport burden. At least in Ahmedabad, this was not observed. The ex-textile
mill workers in the peripheral areas described how the informal settlements evolved in
the eastern part of the city (Section 5.2). The proliferation of the informal settlements
across the city in all directions provided housing to the poor in the desired locations.
Given the polycentric nature of Ahmedabad’s spatial structure, mixed-land use and
mixing of residential, commercial and to an extent industrial activities (also discussed
by Munshi 2013) creates grounds for the poor households to live and work in different
decentralised residential-job complexes. Such poly-centric urban form with mixed land
use and possibilities of finding informal jobs benefits the poor located anywhere in the
city.
The process of slumming takes places through multiple self-organising activities. The
family, together with wider kinship and friendship networks, helps individuals to find
jobs in the informal sector of the urban economy and provides aid in emergencies.
Rural migrants mostly make the first move to a city where they expect to be received
by relatives and friends. They will be offered shelter and food for a while, they will be
introduced to the urban environment. Some of the migrants have a very limited
perspective of the city, and when asked about ‘home’ they always refer to their
residences in their home villages. This limited outlook on the city also translates into

230
minimising movements within the city. This pattern of initial urban association
encourages persons of the same geographical or social origin to form residential
clusters or even ghettos (Dubey & Palmer-jones, 2006; Roberts, 2010). People from
the same geographical or social origin also end up working in similar livelihood options.
Once the pattern of migration, finding residential location and certain livelihood is
established then the newcomers continue to follow the patterns established by their
predecessors or co-workers in the city, and this includes following the established
mobility practices of the associated social groups.
A young man aged 20 living in a peripheral settlement gave a brief account of how his
family came to the city after a few years of his father getting a job in a factory in the
Odhav area. His mother, who used to work as a domestic help, doesn't work any more.
His elder brother has taken a room for rent in a Chali nearby after his marriage but both
brothers work together providing a plumbing service. Their household has
comparatively prospered over the years with more members of the family getting a
fairly stable income. The poor living in the peripheral slums in Ahmedabad either
located themselves there because the jobs were nearby or they found jobs first or then
started residing in the next available informal settlement, which must have been the
respondent’s father’s dilemma when he arrived in the city. However, either situation
doesn’t give the complete picture of the job and work relationship for the household.
Because it is not the job of one person that matters in the poor household but, along
with the main earner (in most cases men), other family members also worked or were
expected to work. After gaining a certain locational advantage, the other members in
the household were either to find nearby jobs or make an effort to ‘mould’ themselves
according to fitting the available jobs, although not everyone might be successful in
developing the skills required for the available work.
The discussion in Section 5.3.1 suggests that there was not much difference between
the mobility patterns of the poor residing in the core city or peripheral settlements and

231
the same was reflected in the qualitative narratives too. The trouble for the poor begins
in the case of forced relocation. Although they are given flats and basic services, the
increased distances to workplaces and other amenities ends up creating more poverty
in the relocated households. The increased distances and longer commutes was
clearly one factor in the creation and persistence of poverty. At one level, it was a
practical problem of reaching somewhere in the city in order to earn. At another level,
the longer commutes led to a feeling of being dispossessed and powerless in the city.
Many in the resettlement colonies had never experienced longer commutes and the
feeling of being cut-off from their jobs, social networks and other amenities. When
distances increased people would mitigate them by reducing the number of working
days (vendors in resettlement colony), or in some cases by changing residential
location back to the informal settlements in the central area if there were still such
opportunities. Many households speculated about renting their new formal housing
allocation and returning themselves to informal housing in the central area. Housing
and services were not their immediate priorities so much as reaching their jobs and
therefore surviving in the city.
To understand the mobility of the poor, there is a need to recategorise the core city and
peripheral settlement as one category of self-determined or self-selected housing,
albeit often informally obtained. Self-determined housing needs to be positioned
against forced relocation. This is explained in the conceptual diagram given in Figure
6-3. Whenever given an opportunity, poor people benefitted from deciding their own
location in the city and thus increasing their access to jobs and other services. This
self-selection of residential location through the informal housing market was found to
be an important characteristic of achieving shelter-livelihood-mobility balance. Another
important component of achieving this balance in a favourable way was having self-
determined or self-selected mobility by walking or cycling, which is flexible and
affordable. In the absense of any state or private sector support for affordable housing

232
or transport, the informally acquired self-determined housing and self-determined
mobility functions for the poor in Ahmedabad.
Figure 6-4 Conceptual diagram of access, mobility and location in Ahmedabad
It becomes crucial for poor households to not only achieve a certain balance between
their shelter–livelihood–mobility options but also to continue stably in this balanced
situation for a long period in order to incrementally move towards well-being. There are
certain negotiated choices or even compromises which are made to create and
maintain this balance. This balance means different things to different people and their
choices are practiced differently. But once they get into these patterns or routinised
practices, they do not lightly want to change them unless they see clear social or
Resettlement sites - Peripheral, low-income
neighbourhood, public housing
- Significant distance from jobs, services and transport nodes
- High mobility but low level of access
Peripheral informal settlements - Peripheral, low-
income informal neighbourhood,
- Close to jobs, services and transport nodes
- Lower mobility but higher level of access
Core-city informal settlements - Inner-city, low-income
informal neighbourhoods,
- Close to jobs, services and transport nodes
- Low mobility and high level of access
Access
Mo
bil
ity
Self-determined
housing
Forced
relocation

233
economic benefits for so doing. Unless something drastic happens, like health issues
in the family or forced relocation, they would continue with what they perceive as the
balanced situation and routinised practices of dealing with their poverty and, to this
end, their mobility.
6.2.3 Mobility paradox of moving out of poverty
“I stopped working the [at a factory in Narol] because it was too far, so it was not suiting
me. I did not enjoy the work anyways… So, I started my own shop. What to do? I will
earn two paisa [pennies] less but I am standing on my own feet… At first, I started my
shop near the [Kalupur] Railways station. But there were daily quarrels with the
policewalah or the municipality (officials). I was not making any money. It was hard…
then I shifted here and slowly, it is picking up…its good here” (Male, 45)
A tea vendor aged 45 in eastern Ahmedabad narrated how he changed his job from
working in a factory because of the long commute on the buses and he has now
stationed himself near a junction close to his house. For people like him, travelling
shorter distances worked better; they made their own choices about livelihood options,
probably at the cost of their income level. However, everyone may not have such
options available to them, like this tea vendor did. The very fact that many people
continue to walk (or cycle in the case of men) for many years means that either these
mobility options worked for their shelter–livelihood-mobility balance or they are trapped
in these options and cannot get out easily. Given their fixed residential locations, if
there are better job options for which the travel distance would ben an increase, then
they start thinking of using shared or public transport on a long-term basis.
“I get many jobs… to work in a hospital or in a mall [as a cleaner]. They say, I will also
get a good salary of ten-twelve thousand [rupees]. But there is no points taking these
jobs… See, now I work in three-four houses and earn about seven-eight [thousand
rupees]. If I take that job, I will have to be away from home whole day and I will also
have to spend on coming and going… What is the advantage then? [If I want to earn
more], then it is better to work in one more house rather than doing these [jobs]”.
(Female, 48)

234
The example of this woman, aged 48, explains what poverty means to her, in her
situation. Poverty is not being able to choose a higher income job and not moving up in
the income hierarchy. Poverty is not being able to use one’s own skills for earning
more. It is often said that the poor are the ‘captive’ non-motorised transport users. This
captivity is often negotiated and contested like in the case of this woman. With
prospects of a better-paying job, she had considered the use of motorised transport but
in the final analysis fell back to her old job which she can manage by walking.
There are aspirations amongst the poor to motorise – and here the verb ‘motorise’ is
used in the broadest sense - of using any motorised mode including public or shared
transport and private transport. Since there is no affordability to make capital
investment in the privately-owned motorised modes, except in a few cases, the
motorisation of the poor usually starts with the public and shared modes, in order to
travel longer distances. When the households are placed into the new situation of
traveling longer distances for some reason (mostly to augment income), they enter into
the paradox of using motorised transport. This paradox essentially is about greater
mobility (travelling longer distances), possibly meaning accessing more destinations,
but also resulting in a higher level of constraints imposed by the motorised modes,
such as affordability and time consumed in waiting and travelling.
When a poor person who is walking or cycling shifts to motorised modes (public or
private), it doesn’t mean that they progress to better life situations or well-being. The
‘motorised poor’ (who may not be as poor as the others in the same settlement) have
their own constraints emerging out of their shelter-livelihood-mobility situations, and
this new negotiation does not necessarily take them out of poverty. The poor
households are likely get stuck in the same situations of travelling longer commutes by
using public or shared modes for many years. In such situations, they may get more
access to the city but they loose their ability to negotiate their mode use, their timings

235
based on the other demands in life. Loosing their ability to negotiate makes them more
vulnerable to adversities, in spite of a possible increase in income.
To be pushed out of the zone of poverty required a prolonged balance between the
shelter, livelihood and mobility options along with incremental incomes, social safety
nets and not being victim to health or other vulnerabilities. This thesis argues that
moving out of poverty will not be possible only by increasing the supply of transport for
the poor or by making them more mobile. The poor should have an agency of their own
to manage their own demand of transport, which actually gets generated, based on
how they view their shelter–livelihood-mobility balance. This is what is called self-
determined mobility in the previous section. Many of their practices such as the use of
non-motorised modes are the low-carbon or zero-carbon activities. Any policy outlook
to simply motorise the poor might be counter productive both from the perspectives of
poverty alleviation and sustainable mobility, which is discussed further in the next
section.
6.3 Discussion – achieving poverty alleviation and sustainable mobility
together
As analysed in the previous sections of this chapter, mobility and poverty are complexly
interwoven. Neither mobility nor poverty are set or static categories, but both are
infused with meaning, contested understanding, linked with specific practices and
social and spatial arrangements, thus continuously reiterated and reproduced. Many of
the central problems associated with a precarious integration into urban society are
reflected in the way people move through the city and the meaning that they attach to
these movements. Therefore, ‘to move or not to move’ is a powerful indicator of the
way societies are ordered and the positions individuals occupy within them. Particularly
in Ahmedabad, mobility is becoming a dominant factor not only in relation to practical
access to goods and opportunities but also in terms of a general sensation of well
being and satisfaction with personal life. Mobility is a structuring element in the lives of

236
the poor. It is part of the larger scheme of (‘stretching legs as much as the length of
your sheet’ as mentioned by a participant or) adjustments, negotiations with the given
situations – essentially, balancing out the situations of shelter and livelihood.
The convergence points for sustainable mobility and poverty alleviation are the
following – many of the practices of the poor do not involve any energy consumption,
such as the non-motorised transport use, which should ideally be encouraged from the
sustainable mobility perspective. But these practices are rooted and operated within
the informality that dominates the urban poor’s life. Whether it is housing choice or
livelihood choice, which makes the non-motorised modes feasible and desirable for the
poor, any attempt to insensitively formalise housing by pushing them out to the
periphery or formalising their livelihood aspects would only work adversely for the poor
by pushing them into higher energy use via motorisation.
This thesis has argued for a practice-based approach of understanding the mobility of
the poor and gathering empirical knowledge to plan based on facilitating the existing
practices of the poor. It is argued in the previous sections how self-determined housing
or self-determined mobility practices have worked for the poor. Both of these need to
be futher facilitated and incrementally integrated with the formal systems in the city.
Government should facilitate the practices of the poor instead of trying to fit them into
some pre-supposed systems which have a low acceptability amongst the poor. The
formal has to reach out to the informal by incrementally including various aspects of the
urban poor’s lives into the formal systems. Finally, poverty is a situation. It is not a
permanent characteristic of households. Poverty can be alleviated by intervening
strategically, through learning from the practices of the poor.
Beginning with self-determination of the mobility of the poor, such a large proportion of
walking and cycling trips means that the formal or public transport system does not
work for them. Hitherto, the poor in Ahmedabad have resisted becoming the dedicated
customers of the formal bus-based transport. This is not to say that they would not

237
benefit from improvement in the public transport in general, which is more relevant to
their needs. Most people would prefer better public transport for better connectivity, but
in the absence of it, they simply walk. However, since there have never been any
previous experiences of ‘better public transport’, this idea didn’t exist for them. Not only
formal public transport but also the majority of the poor do not use any motorised form
of transport. Limited affordabilty means resisting motorisation by making other choices
for their mobility unless motorised transport becomes reliable and affordable. The
current practices of walking and cycling needs to be facilitated by planning for them at
the city level and by providing better infrastructure. There is a need to formalise and
augment the shared auto-rickshaw by legitimising them and professionalising the
services. At the same time, there is a need to overhaul the bus-based public transport
system in the city by integrating the BRT with the conventional buses.
Further with facilitating the self-determination of housing choices by the poor, it must be
clarified at this point that the arguments about the advantages of slumming or informal
occupation of land are not to be glorified or imagined to be the future policy direction.
The current practices of slumming have resulted from land mis-management, conflicts
in land ownership and political patronage of such activities. However, as a starting
point for policy, there is no urgent need for the city government to displace all the slum-
dwellers in the city and it will not be fair to deprive such settlements of basic municipal
services. At the same time, the forced relocation of the poor in formalized housing
colonies has not served them well. A better solution would be to provide tenure security
to the poor incrementally through in-situ upgrading implemented along the lines of the
slum-networking program in Ahmedabad.

238
Figure 6-4 Mobility pathways to move out of poverty for non-motorised poor
To reinforce these points, two conceptual diagrams are prepared as Figure 6-4 and 6-5
to summarise the pathways of moving out of poverty for the non-motorised poor and
the motorised poor. The non-motorised poor are in a vicious circle of living, in
unhygienic conditions, in order to access jobs and service. They continue to remain
poor as they are either vulnerable road users or they end up affecting their own health
and productivity by using cycles or walking longer distances. In order to create a
virtuous cycle for them, safer and better walking and cycling infrastructure needs to be
created (as discussed by Pucher et al., 2008; TERI-UN-HABITAT, 2013) and their
housing can be improved through slum-upgrading as implemented in the Slum
Networking Program in Ahmedabad (Das & Takahashi, 2009; Annez et al., 2012).

239
Figure 6-5 Mobility pathways to move out of poverty for motorised poor
In case of the motorised poor, as shown in Figure 6-5, their vicious circle of mobility is
characterised by long-distance commutes, long waiting and travelling time and adverse
impacts on the household budget due to higher expenditure on their mobility. This
situation can be mitigated through affordable and reliable transport (Carruthers, Dick &
Saurkar, 2005; Serebrisky et al., 2009; Cervero, 2011) and by providing affordable
housing in more accessible locations or by investing in the in-situ slum upgrading
programs. The approach to poverty alleviation should be based on the social practices
of the poor and these practices are already low-energy consuming and thus, in line
with achieving the wider objectives of sustainable mobility. If the poor are walking or
cycling then the challenge is how it can be improved and provided for so that they
continue these practices without being deprived or exhausted. If the poor are living in
informal housing then the challenge is how their living standards can be improved. If
the poor are ‘slumming’ the cities then the slums should be regularised and upgraded

240
on an incremental basis so that the poor can reduce the gap of their housing and
transport accessibilities.
Finally, this chapter has analysed how the transport system supply in Ahmedabad has
its own limitations in providing for the mobility of the poor. The poor face mobility-linked
vulnerabilities and motorisation appears as a paradoxical situation for them to move
out of poverty. The poor seek shelter-livelihood-mobility balance which needs to be
supported by integrated urban policies, including housing and transport components.
Indian cities like Ahmedabad need integrated urban policies and plans that
simultaneously look at the housing, transport and livelihood issues of the poor and
sustain their current practices of minimising transport instead of pushing them towards
any pre-supposed systems of transport and land use planning
.

241
7. Conclusion – Mobility, poverty and the Indian city
The final chapter attempts to close the conceptual and empirical loops presented
earlier in this thesis. In summarising and concluding the arguments presented earlier it
specifically outlines the implications of this work for public policy debates, reflects on
the research process and considers future research directions. Towards the end of the
chapter, specific policy recommendations are also given.
7.1 Main arguments based on the primary data collected
The mobility of the poor is an important lense through which to view their well-being in
the city. This thesis finds that poor people are largely dependent on the human-
powered transport modes like cycling and walking. The mobility of people living in
poverty is often extremely limited, primarily because many cannot afford any mode of
transport faster than walking or cycling. Very few can afford any form of motorised
private transport and the leading motorised mode is shared auto rickshaws followed by
public bus service. Some people cannot afford the purchase cost of even a bicycle.
However, whether or not this low mobility translates into low levels of accessibility is
strongly influenced by a housheold’s location. There are great variations in the mobility
practices of the poor in Ahmedabad based on their location in the city and their
livelihood options. It is also found that the majority of the poor living in the informal
settlements travel shorter distances and try to minimise their transport costs. Working
women in particular have constrained mobility, as they tend to find work close to their
residence as much as possible, irrespective of the location of the household.
The poor households relocated to the resettlement colonies are pushed into the spiral
of longer commutes, dependence on public or shared modes and high-cost of transport
expenditure. Comparatively, poor people living in self-determined housing - the
informal settlements – have advantages in negotiating and minimising their mobility,

242
and this is the case whether or not those informal settlements are in the core or the
periphery of the city. Most of these choices are related to walking and cycling and it
should be recognised that this self-determined mobility based on non-motorised modes
helps the poor access the city. Whenever the poor are acting based on their own
choices, they are in better situations to deal with their lives and thus with their poverty.
This research also argues that the ‘limited’ mobility and ‘constrained’ accessibility
should be viewed in the context of the shelter-livelihood-mobility balance for poor
households. This is a key point in building a deeper understanding of the intimate links
between the low mobility of the poor, their levels of access to urban locations and
opportunities, and their range of housing and employment options. The poor seek
shelter-livelihood-mobility balance in a different way across their locations at the core
city, and differing depending on their livelihoods. They create this balance by either
following social practices or some make conscious trade-off between various options. If
they continue for an extended period of time in a balanced situation across shelter-
livelihood-mobility options then there are more chances for them to move out of
poverty. The prevailing informality in housing or job markets is often helpful for poor
households, not only in aiding them to minimise transport needs but as a result, in the
longer term, to move out of poverty. Where they are not able to move out of poverty
though, limited or constrained mobility doesn’t necessarily translate into deprivation or
poverty.
A range of social practices has been documented as part of this thesis, which are
developed around the low affordability of transport and mobility constraints. These
practices are consolidated again in Table 7-1. The poor household tends to minimise
transport by efficiently locating job or residence, by walking and cycling, by finding
home-based work or by making informal arrangements of child-care or any other social
responsibilities.

243
Table 7-1 Mobility related social practices
Resources
Cost Minimising the transport cost by walking or cycling
Increasing the share of walking in multi-modal trips
Modes M2W - cheaper operational cost, unaffordable owning
cost
Cycles – unaffordable owning cost for some, used
bicycle market, rental markets for daily cycling.
Public/shared mode access - unreliable, expensive
public buses vs more reliable, cheaper shared auto
rickshaws
Infrastructure
Lack of safe infrastructure for walking and cycling
No reference point of ‘good infrastructure’ present
Walking/cycling space is subverted in official plans
Competencies
– overcoming
barriers
Economic barriers - work from home, find work near home, reduce
working days, walking or cycling long distances, seeking flexible work
hours, preferring self-employment
Social barriers (gender) - shared responsibilities for child-care with
neighbours, visit home multiple time, find work in walking distance from
home, dependent on others for mobility in case of private vehicles, wants
vehicles for the male members.
Spatial barriers (location) - reducing working days, by looking for work
nearby or starting any self-employing livelihood, shifting back to the core
city in another informal settlement,
Information Barriers (timings, routes, fares) - Tacit knowledge and
hearsay, based on the past experiences
Political barriers - feel politically voiceless but negotiating with local
leaders and municipal official when needed
Meaning Saving money is a virtue
Hope and feel-good: Everything is fine and we will get by.
Having a choice is empowering: in case of walking or cycling

244
This thesis finally argues that there is a mobility paradox intrinsic to moving out of
poverty. On one side, they resist motorised trips due to low-affordability and on the
other side, even if some of them wants to travel longer distances to access better
opportunities, they do not have affordable and reliable transport service in the city. The
current mobility practices of the poor – walking, cycling and use of shared or public
transport – have low energy consumption and are sustainable compared to the
proliferation of private motorised vehicles in the city. At the same time, it is important to
underscore that the poor are not motorising themselves because of affordability issues.
For example, buying a motorised two-wheeler is the dream of every poor household,
but they cannot afford the credit for investing in the vehicle. With rising incomes, they
are more likely to follow the vicious circle of motorisation unless systematic
investments are made in the shared or public transport, walking and cycling
infrastructure, and thus, removing the current disadavantages attached to them. Trying
to increase the private motorised mobility in the city and imagining it to facilitate the
poor without addressing the issues of affordability will not result in any benefits to the
poor. In fact, the poor are more vulnerable to the external cost of road crashes and
pollution. Besides, it is also a question of the local budget funding the inequitable
infrastructure. If attempts to achieve greater mobility in cities are to help the poor then
they must not focus on private vehicles but on an affordable public transport system
and infrastructure for walking and cycling.
Finally, this thesis contributes to the scarce body of transport studies in India which use
qualitative inquiry alongside quantitative methods. Mixing of methods not only help to
estalish the patterns of mobility of a population group but also brings out nuanced
characteristics of these patterns. With the extensive use of the qualitative data
analysis, this thesis also provides empirical evidences for the mobility of the poor and
Nostalgia and dwelling in the past
Daily struggle and hardships are subsided.

245
various sub-groups within them. Specificlaly, a unique contribution here is developing
links between livelihood patterns and mobility of the poor in the Indian context through
both qualitative and quantitative components. The quantitative component as part of
this thesis also creates a disaggregated database based on age, gender, education
levels, livelihood and residential locations. The qualitative inquiries venture into the
social dimensions of mobility needs of the poor, which again is an original contribution
of this thesis
7.2 Conceptual arguments linking mobility and poverty
Poverty imposes multi-dimentional conditions of deprivation on poor households. While
‘measuring poverty’ has its own reasons to know its intensity and spread, such
approaches are not beneficial in dealing with poverty in policy-making. Approaches to
poverty alleviation should be oriented around the practices of the poor. Poverty may
not be alleviated only by giving welfare hand-outs, nor by depending completely on
markets or economic growth. A bottom-up, practice-oriented approach must develop to
see better results in poverty alleviation. Poor people should have a say in issues
affecting their own life. There are participatory approaches being developed in
measuring poverty and in dealing with poverty. This thesis pushes such agendas and
conceptual positions further by bringing in the discourse related to the mobility of the
poor. To this end the thesis provides a theoretical framework for thinking about mobility
and poverty together in the Indian context.
Mobility and poverty are linked together in multiple ways. Poor households might have
to devote most of their resources to necessary trips and therefore commonly discard
any other movement as too expensive or unnecessary. This unnecessary movement in
many cases constitutes the main way in which individuals can participate in an urban
society. When travelling is devoted mostly to compulsory trips and places, the whole
experience of urban space becomes ruled by the sign of necessity, a space of survival
rather than a space of belonging (Urry, 2002). It affects the way in which poor people

246
view the city space and participate in it. It was observed that the geographical
knowledge and outreach of the city was very limited in most of the cases. Besides, the
sense of belonging was limited to the settlement or the neighborhood, beyond which
there was a limited or purpose-specific engagement with the city. All the slum
settlements presented strong community ties and social networks; most such
settlements were constantly under the threat of evictions. These threats extended the
sense of uncertainty from informal jobs to mobility to housing and such a state of
uncertainty regarding ‘everything’ in an urban life could also be affecting their human
capabilities to carry out their daily activities.
It can be argued that the non-poor in the city also have limited access to the city and
‘marked’ zones in which they move or operate. Commuting struggles and hardships
may be prevalent in the other classes as well and not only amongst the poor. However,
the non-poor may have more resources to remain mobile (more motility) than the poor.
As far as the poor people are concerned; the mobility constraints, limited access and
spread in the city, and uncertainties in daily lives are all linked with their vulnerability.
The constraints of mobility in everyday life limit participation in the way that the low-
income population has traditionally participated in an Indian society. When needed to
fulfill their roles as low-skilled workers, students in poor-quality schools or full-time
house-managers, their current levels of mobility seem quite right, or at least enough.
But when a change in these roles is demanded, when workers ask for quality free time
or skill building opportunities, or house-managers look for a different or better job,
these demands are necessarily limited by their incapacity to reach that these activities
demand. New opportunities to move out of poverty would be given up because of the
limited mobility. Their mobility practices are part of the ‘spiral of poverty’ and thus are
important instruments for moving out of poverty.
Mobility constraints do not necessarily mean complete immobility or ‘social exclusion’.
So at the conceptual level this thesis argues that in spite of its useful contribution in

247
certain contexts (Europe and North America) the transport-led ‘social exclusion’
framework (Preston, 2009; Currie et al., 2009; Lucas, 2012) cannot be applied
universally. The mobility of the poor in Ahmedabad and possibly elsewhere is
characterised by the informal settings of residence and job. The framework of ‘social
exclusion’ is not useful to understand poverty, informality and mobility characteristics of
the poor. The partial exclusion from economic generating activities or recreational
activities in the case of poor households in Ahmedabad is not social in nature. There
are strong ties in the residential communities living in the informal housing and they
have strong informal networks of information sharing and communication. There is also
economic and social exchange with the other income groups. Besides, the self-
determined informal settlements are by no means spatially or socially insulated from
the rest of the city. Whether it is travelling distances or accessibility to different modes,
the poor are not socially or spatially excluded unless they are forcefully evicted from
the city. In many cities, poor people reside close to their workplaces by squatting on
public or private land. They may not be physically secluded by the transport system or
socially excluded by the governing system given the ‘opportunities’ available in the
form of informal transport or housing available in informal settlements. The examination
of social exclusion and mobility in an international setting will not be easy since the
definition of poverty, the urban context, and the transportation systems and what it
means to be socially excluded will vary across contexts. And poverty itself is an all-
encompassing phenomenon, which explains the situation of people more than what
‘social exclusion’ could explain.
Finally, the claims of modernity in Indian cities are re-shaped and re-organised around
neo-liberalism, which has dominated in the developing world including India since the
early 1990s. The neo-liberal social and political approaches of viewing transportation
as economy-generating activity overrides other human development concerns, which is
hampering the needs of the poor in the city like Ahmedabad. Riding on the neo-liberal
wave of economic growth, motorisation and its socio-political constituencies pushes the

248
agenda of promoting the mobility of private motorised vehicles. An unique facet of the
motorization process in India is the sizeable portion of its population living in poverty
and in informal job-work scenarios who will not benefit from the proliferation of private
motorised vehicles. For the state, facilitating the proliferation of private vehicles with
infrastructure building might be a more rewarding proposition politically compared with
running financially complicated and socially challenging public transport services.
There is an urgent need to overhaul urban and transport planing at the city level;
broader policy directions are given in the following section and the specific
recommendations given as part of Section 7.4.
7.3 Implications on the transport planning and policies
The main challenge to the transport policy-makers is to understand the nature of Indian
modernity with its multiple nuances and for them to place the transport needs of a city
in that context. Uni-linear ideas of modernity view the mobility of the poor as if it doesn’t
belong to the city. It is assumed that modernisation means inevitable motorisation
(domination of motorised modes over cityscapes) while viewing the NMT modes as
pre-modern and thus not futuristic. Modernity could also mean constantly seeking new
ideas to bring greater social justice and fairness in the city without the burden of the
past. Comprehensive planning for non-motorised transport in a city can go a long way
in achieving pathways to sustainability while addressing the issues of transport
inequities. This thesis supports a paradigm shift concerning urban transport planning,
which should be more inclusive of the needs of the poor people in Indian cities.
As far as the mobility of the poor is concerned, there are two challenges for public
policy: one, their mobility (or capacity to move) should support their own initiatives and
economic and other opportunities in a city, and two, they should be part of and
beneficiaries of policy interventions and infrastructure investments in the urban
transport sector. It is evident from the data analysis in Chapters 5 and 6 that, in the
case of Ahmedabad, the mobility constraints of the poor make the first challenge more

249
complex than conceived hitherto for public policy intervention, whereas there is a clear
absence of concessionary fares or transit subsidies in respect of the second challenge
in the transport sector.
The road infrastructure design in Indian cities in general and in Ahmedabad in
particular does not ensure the safety of non-motorised mode users. Road traffic injury
needs to be seen as a public health issue (Badami, Tiwari & Mohan, 2004) and it
should be acted upon accordingly. On one side, the road safety should be ensured
through better road infrastructure design and planning, traffic and speed management
in the Indian cities and on the other side; there should be social safety nets, to help
poor households survive the aftermath of household crises caused by members,
perhaps the key income earner, being incapacitated or killed. There should be efficient
systems to deal with the healthcare and post-trauma issues for the victims of road
crashes. Many road crash cases are not reported at all or they are not correctly
reported. This makes it difficult for the victims to pursue justice and therefore to follow-
up on compensation or health-care. Vulnerabilities of being a disadvantaged road user
are further aggravated by the inefficient health-care, law-enforcement and judiciary
systems, which lead poor households to fall back into poverty.
The transport paradigm itself determines the level of accessibility. A transport paradigm
that only looks at mobility and speed would invest in infrastructure that is motorised,
thereby discouraging investments in infrastructure for non-motorised modes that are
predominantly used by the poor. There is a need for more context-sensitive transport
paradigm which is well-intergrated with the land use of the cities in India. There are
strong transport-related reasons to make greater efforts to promote more accessible
locations for urban poor housing. Changes in urban land use patterns can have
important effects upon the viability and attractiveness of the modes of transport that are
most important to the urban poor, non-motorised transport and public transport. These
modes are vital to allowing low-cost mobility and hence access to a range of urban

250
opportunities for the poor including a wider choice of housing than otherwise. Certain
common trends in land use planning as cities motorise have a tendency to undermine
these low-cost modes to the detriment of the mobility of poor.
Transport infrastructure building have many effects on housing for the urban poor. A
key example is eviction and resettlement resulting directly from urban transport
infrastructure projects, which are taking place on a significant scale in Ahmedabad.
There is a need for reforms in order to minimise such evictions. Avoiding displacement
must be made a higher priority in transport planning practice. Transport policies that
reduce the amount of space consumed by transport infrastructure should also help, as
would various reforms to assessment procedures for transport projects. Great harm
can be done to housing affordability by excessive and automobile-oriented standards
and guidelines for transport-related infrastructure and urban design. If displacement is
unavoidable, there is a need for better resettlement procedures, which should also be
more sensitive to access issues. A negotiated outcome to resettlement cases are
always preferable, however excessive secrecy and lack of public participation in
transport planning hinders the chances of fair negotiations.
A central issue connecting mobility and residential choices is that there is a tension
between mobility options and the security of tenure for the low-income residents. In
accessible parts of the city, the poor can afford only sites with insecure tenure,
whereas the affordable sites with more secure tenure tend to be inaccessible and may
involve high costs for commuting. The location patterns of the urban poor were found
to be diverse. The lack of secure tenure means that communities are unable to capture
the benefits of transport improvements and indeed may be threatened with eviction as
a result. Mobility related inequity is fundamentally linked with inequity in housing
access. Poverty and mobility inter-linkages may need much greater attention from a
housing rights perspective. This will help in improving both access levels and
affordable housing for the poor in many cities.

251
Finally, the approach to poverty alleviation should be based on the social practices of
the poor, which may be related or not related to mobility: if the poor are walking then
how can pedestrian facilities be improved; if they are living in informal housing then
how can their living conditions be improved; if the poor are ‘slumming’ the cities then
the slums should be regularised and upgraded on an incremental basis so that the
poor can reduce the gap of their housing and transport accessibilities. Land use plans
should work toward improving the access of poor people by planning for proximity.
Housing rights advocates can and should support transport policies, which restrain
(and remove subsidies to) excessive mobility by high-income groups (mainly in cars)
while promoting low-cost access. Indian cities need integrated urban policies and plans
that simultaneously look at the housing, transport and livelihood issues of the poor and
sustain their current practices of minimising transport instead of pushing them towards
any pre-supposed and ill-informed systems of transport and land use planning.
7.4. Policies for poverty alleviation and sustainable mobility
There are a few specific policy interventions, which needs to be adopted in the
governing system and by civil society organisation as advocacy agenda:
1. For every transport infrastructure related investments, evidences needs to be
collected to justify the investments. Transport surveys involving users needs to be
regularly conducted by various agencies of the Municipal Corporation – road and
traffic department, Ahmedabad Janmarg Limited (AJL) and Ahmedabad Municipal
Transport Services (AMTS). These should be integral to analysis of BRT proposals
and should be allocated funds as a part of the budgeting exercise in the municipal
corporation. There should be a separate budget head for ‘sustainable mobility’.
2. The Municipal Corporation should actively plan and implement comprehensive
network for cycling and walking in Ahmedabad. There should be a non-motorised
planning cell as part of the planning department in the Municipal Corporation.

252
3. The AMTS and the BRT needs to be better integrated with stations sharing, fares
and ticketing as well as marketing. A comprehensive plan should be made to
expand the bus based public transport in Ahmedabad.
4. The shared auto rickshaw services should be recognised as an integral part of the
urban transport system, so that they are not displaced in any privatisation of mass
transit modes (eg: bus or BRT) or PPP (public-private-partnership) initiatives.
5. The Town Planning Scheme (TPS) mechanisms, which is mainly being used for
land re-adjustments, needs to be re-adopted for local area planning exercise
focusing on local accessibility issues along with the municipal services provision.
6. The police department should properly report the road traffic injuries and create
annual database. The post-crash medical treatments should be prioritised. The
traffic police should be given targets of reducing road crashes and needs to be
supported in terms of human resources and technical equipments.
7. The relocation of the poor households should be minimised and if it is inevitable
then the poor households should be housed within three kilometres of their existing
housing.
8. There should be a comprehensive, up gradation and legitimisation of the informal
settlements combining components like land tenure, municipal services, public
health, micro-finance and livelihood promotion.
9. Participatory approaches in urban and transport planning should be promoted in
the official plan making exercises.
10. Civil society organisations, housing and civil rights activists should adopt the
‘mobility’ cause of the poor as well. There is a need of mobilise the poor community
to demand better walking, cycling and public or shared transport.

253
7.5 Reflections on the research process
When this PhD project started, there were number of assumptions about the mobility of
the poor in Ahmedabad city. It was assumed that the motorised two-wheelers would
have penetrated to an extent into the poor households like they have in the middle-
income groups. The narrative about the poor being the ‘disadvantaged commuter’ is
also prominent in the transport literature from the developed world as well. And thus,
there was an option to conduct this study as a traditional accessibility analysis in which
where the physical and social accessiblity issues are measured. With the continuing
data collection and preliminary analysis, it was discovered that the situation is quite
different. Finding that the poor can be living in what are, for them, high-accessibility
locations threw open a very different kind of dynamic about their mobility. The
responses from the participants were quite contrary to them being ‘disadvantaged
commuters’. In fact, this reseacher was encouraged to further explore the concepts in
Indian urban studies like informality and concepts in sociology like social practices.
There were more complexities and variations in the mobility of the poor which needed
to be mapped and understood. The same is recommendated in the future research
agenda as well.
This thesis does not claim that all the complexties and variations amongst the poor are
captured and mapped. Some variations prominantly emerging in the text, like location,
livelihood and gender were given more importance because of their frequent
appearance in the interviews. Besides, like any transport research project focusing on
the travel behaviour of a social group, this study has given a lot of importance to the
work trips of the poor and trying to capture the working poor more compared to the
non-working population. Obtaining and continuing employment is a key factor in
surviving from poverty and it is justified by the focus of the thesis being on poverty that
prominance is given to the working poor. The mobility issues of the non-working poor
are also mentioned as part of the thesis but an exclusive study on the non-working

254
poor and their mobility issues is an important lacuna to be addressed by future
research.
Lastly, the overlaps between various social practices grouped as resources,
competencies and meaning needs to be studied through more detailed qualitative
inquiry such as ethnographic studies. Social practices are embedded in daily routines
and to unravel them beyond what is being narrated by the participants require a
different methodology and a different kind of data collection. This thesis was also
limited to mobility related social practices and not all social practices in the poor
households, which is also the reason why the overlaps between various social
practices are not fully captured and analysis as part of this work.
7.6 Future research directions
There is a continuous need to study various aspects of lives in poverty and including
through the mobility lense. First of all, the class dynamics and the mobility pattern are
not very well studied in the Indian urban context. The aspects related to gender, age,
social hierarchies like caste or religious minorities are not fully explored in the Indian
urban context. Besides -
There is a need to take the conceptual themes developed as part of this study to
other cities for further evaluation. Mobility-linked social practices of the poor and
other income groups needs to be studied across many cities in India. Besides, the
non-working poor and their mobility issues also needs be addressed by future
research.
Understanding attitudes and perceptions of other income groups regarding their
mode choices, especially in the context of climate change should be part of the
future research agenda.
The emerging automobile culture in the Indian cities and how it impacts the urban
transport governance and decision-making is an important area to explore through
innovative methodologies.
It was not possible within the time and resource constraints of this thesis to study
supply-side politics of mobility in Ahmedabad with more rigourous methodologies

255
and in-depth inteviews, whereas this thesis focused on extensive data collection
relating directly to poor people’s mobility experiences through their own narratives.
However, rigorous analysis of the wider political process should surely be part of
the future research agenda.
Urban policy reserch and documentation is also required in the areas of the
benefits of affrodable transport, slum upgrading programs, mass transit systems for
the poor.
Shared, informal transport like the ‘shuttle’ rickshaw service in Ahmedabad needs
to be studied as a business model and about the benefits it brings in for various
income groups.
Land use planning research in India should document and find empirical evidence
to support the claim that mixed used developments help to minimise travel
distances and have larger social benefits in Indian cities.
Finally, improved articulation of the social dimensions of transport should attract
greater research and policy attention in India in future years. Not only transport
research circles but also other relevant disciplines in the areas of livelihood, education
and skills development, public health and wellbeing, housing and sustainable
communities should take the social dimensions of transport issues more seriously in
their research.

256
References
Adhvaryu, B. (2011) Analysing evolution of urban spatial structure: a case study of Ahmedabad, India [online]. Environment and Planning B: Planning and Design. 38 (5), pp. 850–863. [Accessed 3 April 2013].
Adhvaryu, B. (2010) Enhancing urban planning using simplified models: SIMPLAN for Ahmedabad, India [online]. Progress in Planning. 73 (3), pp. 113–207. [Accessed 3 April 2013].
Agarwal, O.P. & Zimmerman, S.L. (2008) Toward Sustainable Mobility in Urban India [online]. Transportation Research Record: Journal of the Transportation Research Board. 2048 (-1), pp. 1–7. [Accessed 10 March 2013].
Alkire, S. & Santos, M.E. (2010) Acute Multidimensional Poverty : A New Index for Developing Countries. OPHI working paper series.
Alkire, S. & Seth, S. (2009) Measuring Multidimensional Poverty in India : A New Proposal. p.pp. 51.
AMC (2013) Ahmedabad Municipal Corporation Budget year 2013-14. Ahmedabad: Ahmedabad Municipal Corporation, Ahmedabad.
AMC (2010) AMTS Budget 2010-11. [online]. Ahmedabad: Ahmedabad Municipal Corporation, Ahmedabad.
AMC, AUDA & CEPT University (2007) Bus Rapid Transit System Ahmedabad Detailed Project report Phase I. Ahmedabad: Ahmedabad Municipal Corporation, Ahmedabad.
AMC-CEPT (2008) Bus Rapid Transit System Plan Phase-II - Detailed Project Report. (April) p.pp. 212.
AMC-CEPT (2007) Detailed Project Report: Bus Rapid Transit System for Ahmedabad Phase-II. [online]. Available from: http://www.ahmedabadbrts.com/images/Ahmedabad BRTS Phase-2 DPR_April 2008.pdf.
AMC-CEPT (2010) Slum Free Cities : A Case for Ahmedabad. [online]. Available from: http://www.chfinternationalindia.org/Upload/SlumFreeWkshp/Ahmedabd_PPT.pdf.
Amis, P. (1995) Making sense of urban poverty. Environment and Urbanization. 7 (1), pp. 145–158.
Anand, A. & Tiwari, G. (2006) A Gendered Perspective of the Shelter–Transport–Livelihood Link: The Case of Poor Women in Delhi [online]. Transport Reviews. 26 (1), pp. 63–80. [Accessed 19 November 2012].
Anand, N. (2006) Disconnecting Experience: Making world-class roads in Mumbai. Symposium: “The Right to the city and the Politics of space”, International and Area Studies, UC, Berkeley.
Anand, S. (2008) Best Practices in Slum Improvement : The Case of Ahmedabad , India. Development Innovations Group. p.pp. 26.

257
Angotti, T. (2006) Apocalyptic anti-urbanism: Mike Davis and his planet of slums [online]. International Journal of Urban and Regional Research. 30 (4), pp. 961–967. [Accessed 7 March 2013].
Anjaria, J.S. (2012) Is there a culture of Indian streets? [online]. Seminar. 636 (August), .
Anjaria, J.S. & McFarlane, C. (2011) Urban navigations: politics, space and the city in South Asia. Jonathan Shapiro Anjaria & Colin Mcfarlane (eds.). [online]. Routledge. [Accessed 3 April 2013].
Annez, P., Bertaud, A., Patel, B., Phatak, V.K. & Clarke Annez, P. (2010) Working with the Market. Approach to Reducing Urban Slums in India. [online]. (November) p.pp. 1–60. Available from: https://openknowledge.worldbank.org/bitstream/handle/10986/3957/WPS5475.pdf?sequence=1.
Annez, P.C., Bertaud, A., Bertaud, M.A., Bhatt, B., Bhatt, C., Patel, B. & Phatak, V. (2012) Ahmedabad: More but Different Government for “Slum Free” and Livable Cities. Policy Research Working Paper No. 6267. (November 2012).
Arabindoo, P. (2011) Rhetoric of the “slum”: Rethinking urban poverty [online]. City. 15 (6), pp. 636–646.
Astrop, A. (1996) The urban travel behaviour and constraints of low income households and females in Pune, India. In: Women’s issues in Transportation, The Second National Conference. 1996 Women’s travel issues, proceedings from the second national conference.
Astrop, A., Palmner, C., Maunder, D. & Babu, D. (1996) The urban travel behaviour and constraints of low income households and females in Pune , India. October. p.pp. 38.
AUDA (2013) Draft Comprehensive Development Plan 2021 (Second Revised). Ahmedabad: Ahmedabad Urban Development Authority, Government of Gujarat, Ahmedabad-Gandhinagar.
Avineri, E. (2012) On the use and potential of behavioural economics from the perspective of transport and climate change [online]. Journal of Transport Geography. 24pp. 512–521. [Accessed 19 May 2014].
Badami, M. & Haider, M. (2007) An analysis of public bus transit performance in Indian cities [online]. Transportation Research Part A: Policy and Practice. 41 (10), pp. 961–981. [Accessed 9 August 2010].
Badami, M., Tiwari, G. & Mohan, D. (2004) Access and mobility for the urban poor in India: Bridging the gaps between policy and needs.
Badami, M.G. (2009) Urban Transport Policy as if People and the environment mattered: pedestrian accessibility the first step [online]. Economic And Political Weekly. xliv (33), pp. 43–51. [Accessed 3 April 2013].
Baker, J., Basu, R., Cropper, M., Lall, S. & Takeuchi, A. (2005) Urban poverty and Transport: The case of Mumbai. World Bank Policy Research Working Paper Series.
Banerjee, A.V. & Duflo, E. (2011) Poor economics: A radical rethinking of the way to fight global poverty. [online]. Random House India.
Banerjee, D. (2012) Shanghai (Hindi). PVR Pictures.

258
Banister, D. (2008) The sustainable mobility paradigm [online]. Transport Policy. 15 (2), pp. 73–80. [Accessed 3 March 2013].
Bansal, R. (2013) Lost track. Down To Earth. [online]. p.pp. 45. Available from: http://www.downtoearth.org.in/content/lost-track.
Barter, P. (2004) Linkages between Transport and Housing for the Urban Poor : Policy Implications and Alternatives. Discussion Paper for UN-Habitat. p.pp. 51.
Baud, I.S. a., Pfeffer, K., Sridharan, N. & Nainan, N. (2009) Matching deprivation mapping to urban governance in three Indian mega-cities [online]. Habitat International. 33 (4), pp. 365–377. [Accessed 7 October 2010].
Beall, J., Crankshaw, O. & Parnell, S. (2000) Victims, Villains and Fixers: The Urban Environment and Johannesburg’s Poor [online]. Journal of Southern African Studies. 26 (4), pp. 833–855. [Accessed 7 October 2010].
Benjamin, S. (2008) Occupancy Urbanism: Radicalizing Politics and Economy beyond Policy and Programs [online]. International Journal of Urban and Regional Research. 32 (3), pp. 719–729. [Accessed 6 April 2013].
Bertaud, A. (2004) The spatial organization of cities: Deliberate outcome or unforeseen consequence?. [online]. p.pp. 27. Available from: http://alain-bertaud.com/images/AB_The_spatial_organization_of_cities_Version_3.pdf.
Bhan, G. (2013) Planned Illegalities: Housing and the “failure” of planning in Delhi: 1947-2010. Economic And Political Weekly. xlviiI (24), pp. 58–71.
Bhaskar, R. & Lawson, T. (2013) Basic texts and developments. In: Margaret Archer, Roy Bhaskar, Andrew Collier, Tony Lawson, & Alan Norrie (eds.). Critical Realism: Essential Readings. 1st edition. [online]. London: Routledge. p. pp. 784. Available from: http://books.google.com/books?id=-wz6N9uBpnYC&pgis=1 [Accessed 13 October 2014].
Bhatt, M.R. (2001) Urban slums reports: The case of Ahmedabad, India. Case studies for the Global Report on Human Settlements 2003. [online]. p.pp. 23. Available from: http://www.ucl.ac.uk/dpu-projects/Global_Report/pdfs/Ahmedabad.pdf.
Bhowmik, S.K. (2005) Street Vendors in Asia : A Review. Economic And Political Weekly. May 28 - Jpp. 2256–2264.
Booth, D., Hanmer, L. & Lovell, E. (2000) Poverty and Transport: A report for the World Bank in collaboration with DFID. London: Overseas Development Institute, London.
Breman, J. (2004) Social exclusion in the context of globalization. ILO working paper series. (18) p.pp. 40.
Brown, A. (2006) Contested Space: Street Trading, Public Space, and Livelihoods in Developing Cities (urban management series). Alison Brown (ed.). [online]. ITDG Publishing, Rugby. [Accessed 23 April 2013].
Brown, A. & Kristiansen, A. (2009) Urban Policies and the Right to the City: Rights, responsibilities and citizenship. MOST-2 Policy Paper Series. p.pp. 58.
Business Standard (2014) MEGA board approves fresh DPR for A’bad metro rail project. Business Standard. 28 February.

259
Carruthers, R., Dick, M. & Saurkar, A. (2005) Affordability of Public Transport in Developing Countries. Transport Papers The World Bank.
Census of India (2011) Census of India 2011: Population Enumeration Data (Final Population). New Delhi: Registrar General of India, Census of India, Ministry of Home Affairs, Government of India.
Census of India (2006) Population projections for India and states 2001-2026: Report of the techanical group on population projections. New Delhi: Office of Registrar General and Census Commissioner, Government of India, New Delhi.
Certeau, M. de (1984) The Practice of Everyday Life. [online]. University of California Press; 3rd Revised edition 2011, London. [Accessed 21 May 2014].
Cervero, R. (2000) Informal Transport in the Developing World. United Nations Center for Human Settlements (Habitat), Nairobi.
Cervero, R. (2011) State Roles in Providing Affordable Mass Transport Services for Low- Income Residents. International Transport Forum Discussion Paper Series, OECD. p.pp. 26.
Cervero, R. & Dai, D. (2014) BRT TOD : Leveraging transit oriented development with bus rapid transit investments. Transport Policy. 36pp. 127–138.
Cervero, R., Sandoval, J.S.O. & Landis, J. (2000) Transportation as stimulus to welfare-to-work: private versus public mobility. University of California Transportation Center working paper series. [online]. 31 (1). Available from: http://dx.doi.org/10.1016/j.apgeog.2010.07.008doi:10.1016/j.apgeog.2010.07.008.
Chakrabarty, D. (2002) Habitations of Modernity - Essays in the Wake of Subaltern Studies. [online]. University Of Chicago Press. [Accessed 3 April 2013].
Chakrabarty, D. (2007) Provincializing Europe: Postcolonial Thought and Historical Difference (New Edition) (Princeton Studies in Culture / Power / History). [online]. Princeton University Press. [Accessed 21 April 2013].
Chamon, M., Mauro, P. & Okawa, Y. (2008) Mass car ownership in emreging market giants. Economic Policy. 23 (54), pp. 243–296.
Chandrasekhar, S. & Mukhopadhyay, A. (2007) Multidimensions of Urban Poverty : Evidence from India. IGIDR working paper series. (June).
Chaplin, S.E. (2011) Indian cities, sanitation and the state: the politics of the failure to provide [online]. Environment and Urbanization. 23 (1), pp. 57–70. [Accessed 26 March 2013].
Chatterjee, P. (2008) Democracy and economic transformation in india. Economic And Political Weekly. 21pp. 53–62.
Chatterjee, P. (2011) Lineages of Political Society: Studies in Postcolonial Democracy. [online]. Columbia University Press. [Accessed 14 May 2014].
Chatterjee, P. (2004) population and political society. In: Reflections on Popular Politics in Most of the World (Leonard Hastings Schoff Lectures). Columbia University Press.
Chatterjee, P. (2006) The Politics of the Governed: Reflections on Popular Politics in Most of the World (Leonard Hastings Schoff Lectures). [online]. Columbia University Press. [Accessed 3 April 2013].

260
Chopra, R. (2003) Neoliberalism as Doxa: Bourdieu’s thoery of the state and the contemporary Indian discourse on globalization and liberalization. Cultural Studies. 17(3/4) (731865727), pp. 419–444.
Chowdhury, S. (2011) Employment in India : what does the latest data show? Economic And Political Weekly. xlvi (32), pp. 2009–2012.
Church, a, Frost, M. & Sullivan, K. (2000) Transport and social exclusion in London [online]. Transport Policy. 7 (3), pp. 195–205.
Clifton, K.J. (2003) Examining Travel Choices of Low-Income Populations : Issues , Methods , and New Approaches. Urban Studies. (August), pp. 10–15.
Corbridge, S., Williams, G., Srivastava, M. & Véron, R. (2005) Seeing the State: Governance and Governmentality in India (Contemporary South Asia). [online]. Cambridge University Press. [Accessed 3 April 2013].
Cox, P. (2009) Moving People: Sustainable Transport Development. Zed Books.
CSE (2011) Clean and Sustainable Mobility for All. In: Clean and Sustainable Mobility for All. Clean and Sustainable Mobility for All Conference. New Delhi. September 28-29, 2011. 2011 Center for Science and Environment, New Delhi.
Currie, G., Richardson, T., Smyth, P., Vella-Brodrick, D., Hine, J., Lucas, K., Stanley, J.J.J.J., Morris, J. & Kinnear, R. (2009) Investigating links between transport disadvantage, social exclusion and well-being in Melbourne—Preliminary results [online]. Transport Policy. 16 (3), pp. 97–105. [Accessed 7 October 2010].
Dargay, J.M. (2001) The effect of income on car ownership : evidence of asymmetry. Transportation Research Part A. 35 (2001), pp. 807–821.
Das, a. K. & Takahashi, L.M. (2009) Evolving Institutional Arrangements, Scaling Up, and Sustainability: Emerging Issues in Participatory Slum Upgrading in Ahmedabad, India [online]. Journal of Planning Education and Research. 29 (2), pp. 213–232. [Accessed 3 April 2013].
Datey, A., Darji, V., Patel, T. & Mahadevia, D. (2012) Walking and Cycling in Indian Cities : A Struggle for Reclaiming Road Edges. CUE Working Paper Series. p.pp. 30.
Davis, M. (2007) Planet of Slums. [online]. Verso. [Accessed 3 April 2013].
Deng, T. & Nelson, J.D. (2011) Recent Developments in Bus Rapid Transit: A Review of the Literature [online]. Transport Reviews. 31 (1), pp. 69–96. [Accessed 10 March 2013].
Denscombe, M. (1998) The Good Research Guide. Open University Press, Buckingham, Philadelphia.
Desai, R. (2012) Governing the Urban Poor : Riverfront Development, Slum resettlement and the politics of inclusion in Ahmedabad. Economic And Political Weekly. xlviI (2), pp. 49–56.
Desai, S.J. (2005) Urban spatial structures and land management mechanisms: A study of three Mega Cities - Ahmedabad, Bangalore and Hyderabad. School of Planning, CEPT University, Ahmedabad.
DES-GoG (2005) Economic census data 2005 - Gujarat State and its districts. Gandhinagar: The Directorate of Economics and Statistics, Government of Gujarat.

261
Diaz Olvera, L., Plat, D. & Pochet, P. (2008) Household transport expenditure in Sub-Saharan African cities: measurement and analysis [online]. Journal of Transport Geography. 16 (1), pp. 1–13. [Accessed 19 November 2012].
Diaz Olvera, L., Plat, D. & Pochet, P. (2013) The puzzle of mobility and access to the city in Sub-Saharan Africa [online]. Journal of Transport Geography. 32pp. 56–64. [Accessed 3 May 2014].
Dimitriou, H. (2006) Urban Mobility and Sustainability in Asia and the Power of Context [online]. Transportation Research Record. 1983 (1), pp. 140–150.
DMRC-AMC (2005) Detailed Project Report: Mass Rapid Transit System for Ahmedabad. Ahmedabad: Delhi Metro Rail Corporation for the Ahmedabad Municipal Corporation.
DNA (2014) Changing Metro route leaves Ahmedabad developers flustered. Daily News Analysis (DNA). 22 Januarypp. 1–2.
DNA (2012) No cycle track on new routes | Latest News & Updates at Daily News & Analysis.
Dombroski, M.A. (2005) Securing access to transportation for the urban poor. Columbia Law Review. 127 (2003), pp. 503–536.
Dubey, A. & Palmer-jones, R. (2006) Surplus Labour , Social Structure and Rural to Urban Migration : Evidence from Indian Data. 18 (1), pp. 86–104.
Dutta, S.S., Batley, R. & Sidhartha, A. (2000) Partnerships in urban development : a review of Ahmedabad ’ s experience. Environment and Urbanization. 12 (1), pp. 13–26.
Edensor, T. (2002) National Identity, Popular Culture and Everyday Life. Oxford, New York.
Edensor, T. (1998) The culture of the Indian street. In: Nicholas R. Fyfe (ed.). Images of the street: Planning, identity and control in public space. Routledge: London. pp. pp. 205–221.
Envall, P. (2007) Accessibility Planning : a chimera ? Pelle Envall. unpublisehd PhD thesis of University of Leeds, Leeds.
Flamm, M. & Kaufmann, V. (2006) Operationalising the Concept of Motility: A Qualitative Study [online]. Mobilities. 1 (2), pp. 167–189. [Accessed 10 March 2013].
Flyvbjerg, B. (2002) Bringing Power to Planning Research: One Researcher’s Praxis Story [online]. Journal of Planning Education and Research. 21 (4), pp. 353–366. [Accessed 10 March 2013].
Flyvbjerg, B. (2007) Cost Overruns and Demand Shortfalls in Urban Rail and Other Infrastructure [online]. Transportation Planning and Technology. 30 (1), pp. 9–30. [Accessed 10 March 2013].
Flyvbjerg, B. (2006) Five Misunderstandings About Case-Study Research [online]. Qualitative Inquiry. 12 (2), pp. 219–245. [Accessed 2 March 2013].
Flyvbjerg, B. (2004) Phronetic planning research: theoretical and methodological reflections [online]. Planning Theory & Practice. 5 (3), pp. 283–306. [Accessed 10 March 2013].
Fujita, M. (1989) Urban Economic Theory: Land Use and City Size. [online]. Cambridge University Press. [Accessed 5 October 2014].
Gakenheimer, R. (1999) Mobility issues in the developing world. Transportation Research. 33.

262
Gandhi, S., Tiwari, G. & Fazio, J. (2013) Comparative Evaluation of Alternate Bus Rapid Transit System (BRTS) Planning, Operation and Design Options. Journal of the East Asia Society of Transportation Studies. 10pp. 1292–1310.
Gannon, C. & Liu, Z. (1997) Poverty and Transport. TWU Papers, Transport Division, The World Bank, Washington DC. (September).
Ghate, A.T. & Sundar, S. (2013) Can We Reduce the Rate of growth of car ownership? Economic & Political Weekly. XLVIII (23), .
Ghertner, D.A. (2008) Analysis of new legal discourse behind Delhi’s slum demolitions. Economic & Political Weekly. 43 (20), pp. 57–66.
Ghertner, D.A. (2011) Calculating without numbers : aesthetic governmentality in Delhi ’ s slums. (911724993), .
Ghosh, J. (2010) Poverty reduction in China and India : Policy implications of recent trends. 11 (92).
Giddens, A. (1986) The Constitution of Society: Outline of the Theory of Structuration. [online]. University of California Press. [Accessed 14 May 2014].
Gilbert, A. (2008) Bus Rapid Transit: Is Transmilenio a Miracle Cure? [online]. Transport Reviews. 28 (4), pp. 439–467. [Accessed 23 September 2010].
Gilbert, A. (2012) De Soto’s The Mystery of Capital: reflections on the book’s public impact [online]. International Development Planning Review. 34 (3), pp. v – xviii. [Accessed 6 April 2013].
Gilbert, A. (2009) Extreme Thinking About Slums and Slum Dwellers: A Critique [online]. SAIS Review. 29 (1), pp. 35–48. [Accessed 29 March 2013].
Gilbert, A. (2013) How to help, and how not to help, the poor in the megacities of the South [online]. City. 17 (5), pp. 628–635. [Accessed 13 October 2014].
Gilbert, A. (2002) On the mystery of capital and the myths of Hernando de Soto: What difference does legal title make? International Development Planning Review. 24 (February), pp. 1–19.
Gilbert, A. (2007) The Return of the Slum: Does Language Matter? [online]. International Journal of Urban and Regional Research. 31 (4), pp. 697–713. [Accessed 6 March 2013].
Gillion, K.L. (1968) Ahmedabad: A Study in Indian Urban History. [online]. University of California Press. [Accessed 7 May 2013].
Giuliano, G. (2003) Travel, location and race/ethnicity [online]. Transportation Research Part A: Policy and Practice. 37 (4), pp. 351–372.
Gotham, K.F.O.X. (2003) Toward an Understanding of the Spatiality of Urban Poverty : The Urban Poor as Spatial Actors. 27 (September), pp. 723–737.
Guha, R. (1983) Subaltern Studies II: Writings on South Asian History and Society. Ranjit Guha (ed.). Oxford University Press, USA.
Gwilliam, K. (2013) Cities on the move – Ten years after [online]. Research in Transportation Economics. 40 (1), pp. 3–18. [Accessed 9 March 2013].

263
Halden, D. (2011) The use and abuse of accessibility measures in UK passenger transport planning [online]. Research in Transportation Business & Management. 2pp. 12–19. [Accessed 10 March 2013].
Harvey, D. (1989) The Condition of Postmodernity: An Enquiry Into the Origins of Cultural Change. [online]. Wiley. [Accessed 3 April 2013].
High court of Delhi (2012) Nyay bhoomi verses GNTC of Delhi. p.pp. 24.
Ihlanfeldt, K.R. & Sjoquist, D.L. (1998) The Spatial Mismatch Hypothesis : A Review of Recent Studies and Their Implications for Welfare Reform. Housing Policy Debate. 9 (4), pp. 849–892.
IIHS (2011) Urban India 2011 : Evidence. Bangalore: Indian Institute for Human Settlements, Bangalore.
Illich, I. (1974) Energy and equity. [online]. London: Calders and Boyares, London. [Accessed 3 April 2013].
Indian Express (2014) Ahmedabad likely to get a new-look , but slower metro. The Indian Express. 28 Februarypp. 7.
Jacobs, G.D., Maunder, D.A.C. & Fouracre, P.R. (1981) Transport Problems of the Urban Poor in Developing Countries. Transport research Lab UK.
John, P. (2014) Metro route to change for third time in eight years. The Times of India. pp. 1–2.
Joshi, S. & Khan, S.M. (2010) Aided self-help: The Million Houses Programme – Revisiting the issues [online]. Habitat International. 34 (3), pp. 306–314. [Accessed 3 April 2013].
Kamath, L. & Deekshit, P. (2014) Planning as Practice? Governing Conjunctures and Informal Urbanisation in Solapur Town. Economic & Political Weekly. XLIX (22), pp. 72–81.
Kaufmann, V., Bergman, M.M. & Joye, D. (2004) Motility : Mobility as Capital. International Journal of Urban and Regional Research. 28.4 (December), pp. 745–756.
Kenyon, S., Rafferty, J. & Lyons, G. (2003) Social exclusion and transport in the UK: a role for virtual accessibility in the alleviation of mobility-related social exclusion? Journal of Social Policy. 32 (3), pp. 317–338.
Khanna, S. (2009) “Where are the actual gainers of the BRTS, Ahmedabad ?”: A study into the spatial and social distribution of benefits of transport development projects. University of Twente.
Khilnani, S. (1999) The Idea of India. [online]. Farrar, Straus and Giroux. [Accessed 7 May 2013].
Knoflacher, H. (2007) Success and failures in urban transport planning in Europe—understanding the transport system [online]. Sadhana. 32 (4), pp. 293–307.
Krambeck, H.V. (2006) The Global Walkability Index. Massachusette Institute of Technology (MIT), Boston.
Krishnaji, N. (2012) Abolish the Poverty Line. Economic And Political Weekly. XLVII (15), pp. 10–11.

264
Kumar, A. & Barrett, F. (2008) Stuck in Traffic: Urban Transport in Africa. Africa Infrastructure Country Diagnostic (AICD) and the World Bank.
Kundu, A. & Mahadevia, D. (2002) Poverty and Vulnerability in a Globalising Metropolis: Ahmedabad. Darshini Mahadevia & Amitabh Kundu (eds.). [online]. New Delhi: Manak Publications. [Accessed 3 April 2013].
Law, R. (1999) Beyond “women and transport”: towards new geographies of gender and daily mobility [online]. Progress in Human Geography. 23 (4), pp. 567–588. [Accessed 1 May 2014].
Law, R. (2002) Gender and daily mobility in a New Zealand city, 1920–1960 [online]. Social & Cultural Geography. 3 (4), pp. 425–445. [Accessed 16 May 2014].
Levy, C. (2013) Travel choice reframed: “deep distribution” and gender in urban transport [online]. Environment and Urbanization. 25 (1), pp. 47–63. [Accessed 30 April 2014].
Lister, R. (2004) Poverty. Cambridge: Polity Press, Cambridge.
Litman, T. (2014) Evaluating Accessibility for Transportation Planning Measuring People’s Ability to Reach Desired Goods and Activities. Victoria Transport Policy Institute.
Lomnitz, L.A. (1977) Networks and Marginality: Life In A Mexican Shantytown. [online]. Academics Press. [Accessed 3 April 2013].
Louis Berger-GIDB (2000) Detailed Project Report: Integrated Public Transport System (IPTS) for Ahmedabad city. Gandhinagar: Louis Berger group for Gujarat Industrial Development Board (GIDB), Government of Gujarat.
Lucas, K. (2011) Making the connections between transport disadvantage and the social exclusion of low income populations in the Tshwane Region of South Africa [online]. Journal of Transport Geography. 19 (6), pp. 1320–1334. [Accessed 21 March 2013].
Lucas, K. (2006) Providing transport for social inclusion within a framework for environmental justice in the UK [online]. Transportation Research Part A: Policy and Practice. 40 (10), pp. 801–809. [Accessed 7 October 2010].
Lucas, K. (2012) Transport and social exclusion: Where are we now? [online]. Transport Policy. 20pp. 105–113. [Accessed 5 March 2013].
Luke, N., Munshi, K. & Rosenzweig, M. (2004) Marriage, Networks, and Jobs in Third World Cities [online]. Journal of the European Economic Association. 2 (2-3), pp. 437–446.
Lyons, G. (2013) Business travel — The social practices surrounding meetings [online]. Research in Transportation Business & Management. 9pp. 50–57. [Accessed 3 May 2014].
Mahadevia, D. (2012) Decent work in Ahmedabad: An integrated approach. ILO Asia-Pacific working paper series. p.pp. 68.
Mahadevia, D. (2011) Tenure security and urban social protection in India (CSP research report 05). Sussex: Centre for social protection, Institute of Development Studies, Sussex.
Mahadevia, D., Joshi, R. & Datey, A. (2012) Low-carbon mobility and the challanges of social inclusion: The bus rapid transit case studies in India. [online]. New Delhi: United Nations Environment Program (UNEP), Riso Center.

265
Manna, G.C. (2012) of the New Poverty Line. Economic And Political Weekly. pp. 11–14.
Markovich, J. & Lucas, K. (2011) The Social and Distributional Impacts of Transport: A Literature Review Julia Markovich and Karen Lucas. (August), .
Martens, K. & Golub, A. (2011) Transport distribution benefits and investment programs. Transportation Research. (January), pp. 1–10.
Martens, K., Golub, A. & Robinson, G. (2012) A justice-theoretic approach to the distribution of transportation benefits: Implications for transportation planning practice in the United States [online]. Transportation Research Part A: Policy and Practice. 46 (4), pp. 684–695. [Accessed 5 March 2013].
Mathur, N. (2012) On the Sabarmati riverfront: urban planning as totalitarian governance in Ahmedabad. Economic And Political Weekly. xlviI (47), pp. 64–76.
Mathur, O.P. (2010) Slum-free cities: Natioanl urban poverty reduction strategy 2010-2020. National Institute of public finance and policy, New Delhi.
Mattioli, G. (2012) Households without a car in Germany , between sustainable transport and social exclusion. (February).
May, V., Burke, H. & Centre, M. (2010) Practical considerations for leading and working on a mixed methods project. Realities. 11 p.pp. 1–5.
Metz, D. (2008) The Myth of Travel Time Saving. Transport Reviews. 28 (3), pp. 321–336.
Miciukiewicz, K. & Vigar, G. (2012) Mobility and Social Cohesion in the Splintered City: Challenging Technocentric Transport Research and Policy-making Practices [online]. Urban Studies. 49 (9), pp. 1941–1957. [Accessed 15 March 2013].
Misturelli, F. & Heffernan, C. (2010) The concept of poverty: a synchronic perspective [online]. Progress in Development Studies. 10 (1), pp. 35–58. [Accessed 7 October 2010].
Mitric, S. (2013) Urban transport lending by the World Bank: The last decade [online]. Research in Transportation Economics. 40 (1), pp. 19–33. [Accessed 10 March 2013].
Mohan, D. (2003) Introduction: Safety as a Human Right [online]. Health and Human Rights. 6 (2), pp. 161.
Mohan, D. (2013) Moving around in Indian Cities. Economic & Political Weekly. XLVIII (48), pp. 40–48.
Mohan, D. (2001) Planning for Public Transport : Integrating Safety , Environment and Economic Issues. TRIPP Working Paper. p.pp. 1–18.
Mohan, D. (2004) The Road Ahead Traffic Injuries and Fatalities in India. TRIPP Working Paper. (April).
Mohan, D. (2002) Work trips and safety of bicyclists. Indian Journal of Transport Management. April-Junepp. 225–232.
Mohan, D. & Tiwari, G. (1999) Sustainable Transport Systems: Linkages between envionrmental issues, public transport, non-motorised transport and safety. Economic & Political Weekly. XXXIV (25), pp. 1580–1596.

266
Munshi, T., Brussel, M. & Zuidgeest, M. (2008) Developing a geo-spatial urban form: Travel behaviour model for the city of Ahmedabad, India. p.pp. 1–11.
Munshi, T., Zuidgeest, M. & Brussel, M. (2011) Development of employment sub-centers in Ahmedabad city. (June).
Munshi, T.G. (2013) Built form, travel behaviour and low carbon development in Ahmedabad, India. Faculty of Geo-Information Science and Earth Observation, University of Twente.
Næss, P. (2005) Residential location affects travel behavior—but how and why? The case of Copenhagen metropolitan area [online]. Progress in Planning. 63 (2), pp. 167–257. [Accessed 3 March 2013].
Naik, A.K. (2009) Informal Sector and Informal Workers in India. Paper presented for IARIW-SAIM Conference, Kathmandu, Nepal. p.pp. 0–12.
Narayan, D., Patel, R., Schafft, K., Rademacher, A. & Koch-Schulte, S. (1999) Can Anyone Hear Us ? Voices from 47 Countries (Voices of the poor, Vol. 1). I (December) p.pp. 280.
Narayan, D., Pritchett, L. & Kapoor, S. (2009) Moving Out of Poverty, Volume 2: Success from the Bottom Up. [online]. World Bank Publications. [Accessed 5 April 2013].
Deepa Narayan & Patti Petesch (eds.) (2007) Moving Out of Poverty (Volume 1): Cross-disciplinary Perspectives on Mobility. [online]. World Bank Publications. [Accessed 5 April 2013].
NBO-MoHUPA (2010) Report of the committee on slum statistics & census. New Delhi: National Building Organisation, Ministry of Housing and Poverty Alleviation, Government of India.
NIUA (2011) Urban Transport Initiatives in India - Best Practices in PPP. [online]. New Delhi: National Institute of Urban Affairs, New Delhi.
Olvera, L. (2003) Transportation conditions and access to services in a context of urban sprawl and deregulation. The case of Dar es Salaam [online]. Transport Policy. 10 (4), pp. 287–298. [Accessed 4 September 2010].
Osborne, J.C. (2012) Indicators that matter : Measuring Transportation Performance in Ahmedabad. Thesis for Masters in City Planning, Massachusetts Institute of Technology.
Pai, M. & Hidalgo, D. (2009) Indian Bus Rapid Transit Systems Funded by the Jawaharlal Nehru National Urban Renewal Mission [online]. Transportation Research Record: Journal of the Transportation Research Board. 2114 (-1), pp. 10–18. [Accessed 10 March 2013].
Panchal, N. (2005) An inquiry into the nature of urban poverty: the case of Ahmedabad. Unpublished Masters thesis, School of Planning, CEPT University, Ahmedabad.
Papacostas, C.S. & Prevedouros, P.D. (2000) Transportation Engineering and Planning (3rd Edition). [online]. Prentice Hall. [Accessed 21 April 2013].
Parikh, M. (2011) Evolution of AMTS and the Challenges It Faces : A Study into Implications for Organizational Effectiveness. Minor report for the doctoral dissertation, CEPT University, Ahmedabad.
Patel, S. & Arputham, J. (2008) Plans for Dharavi: negotiating a reconciliation between a state-driven market redevelopment and residents’ aspirations [online]. Environment and Urbanization. 20 (1), pp. 243–253. [Accessed 27 February 2013].

267
Perlman, J. (1976) The Myth of Marginality: Urban Poverty and Politics in Rio De Janeiro. [online]. Univ of California Pr. [Accessed 4 April 2013].
Perlman, J.E. (2007) Marginality from myth to reality: The Favelas of Rio de Janeiro 1968-2005. Unknown.
Porter, G. (2011) “I think a woman who travels a lot is befriending other men and that”s why she travels’: mobility constraints and their implications for rural women and girls in sub-Saharan Africa [online]. Gender, Place & Culture. 18 (1), pp. 65–81. [Accessed 14 April 2013].
Porter, G. (2002) Living in a Walking World: Rural Mobility and Social Equity Issues in Sub-Saharan Africa [online]. World Development. 30 (2), pp. 285–300.
Porter, G. (2007) Transport planning in sub-Saharan Africa [online]. Progress in Development Studies. 7 (3), pp. 251–257. [Accessed 7 October 2010].
Porter, G. (2008) Transport planning in sub-Saharan Africa II: putting gender into mobility and transport planning in Africa [online]. Progress in Development Studies. 8 (3), pp. 281–289. [Accessed 21 September 2010].
Preston, J. (2009) Epilogue: Transport policy and social exclusion—Some reflections [online]. Transport Policy. 16 (3), pp. 140–142. [Accessed 7 October 2010].
Pucher, J., Buehler, R., Pucher & Buehler (2008) Making Cycling Irresistible: Lessons from The Netherlands, Denmark and Germany [online]. Transport Reviews. 28 (4), pp. 495–528. [Accessed 28 February 2013].
Pucher, J., Korattyswaropam, N., Mittal, N. & Ittyerah, N. (2005) Urban transport crisis in India [online]. Transport Policy. 12 (3), pp. 185–198. [Accessed 7 October 2010].
Pucher, J. & Renne, J.L. (2003) Socioeconomics of Urban Travel : Evidence from the 2001 NHTS. Transportation Quarterly. 57 (3), pp. 49–78.
Rakodi, C. (1995) Poverty Lines or Household Strategies? A Review of Conceptual Issues in the Study of Urban Poverty [online]. Habitat International. 19 (4), pp. 407–426.
Rana, N. (2011) Tracking Ahmedabad Municipal Corporation’s urban growth progress. Daily News Analysis (DNA). 9 January.
Raychaudhuri, S. (2001) Colonialis, Indigenous Elites adn the Transformation of Cities in the Non-Western World: Ahmedabad (Western India), 1890-1947. Modern Asian Studies. 3 (35), pp. 677–726.
Roberts, B.R. (2010) Moving On and Moving Back: Rethinking Inequality and Migration in the Latin American City [online]. Journal of Latin American Studies. 42 (03), pp. 587–614. [Accessed 6 April 2013].
Rodrigue, J.-P., Comtois, C. & Slack, B. (2013) The Geography of Transport Systems: 3rd Edition (Paperback) - Routledge. [online]. Routledge. [Accessed 5 October 2014].
Rogalsky, J. (2010) The working poor and what GIS reveals about the possibilities of public transit [online]. Journal of Transport Geography. 18 (2), pp. 226–237. [Accessed 9 September 2010].
Roy, a. (2009) Why India Cannot Plan Its Cities: Informality, Insurgence and the Idiom of Urbanization [online]. Planning Theory. 8 (1), pp. 76–87. [Accessed 27 October 2012].

268
Roy, A. (2008) Civic governmentality: The politics of inclusion in Beirut and Mumbai [online]. Antipode. 41 (November), pp. 159–179. [Accessed 8 March 2013].
Roy, A. (2011) Slumdog Cities : Rethinking Subaltern Urbanism. International Journal of Urban and Regional Research. 35 (March), .
Roy, A. & Alsayyad, N. (2004) Urban Informality: Transnational perspectives from the Middle East, Latin America and South Asia. Ananya Roy & Nezar Alsayyad (eds.). Lexington.
Roy, D. (2013) Car Sewa : The Iconography of Idle Worship. Economic & Political Weekly. xlviiI (48), pp. 90–94.
Russ, L.W. & Takahashi, L.M. (2012) Exploring the Influence of Participation on Programme Satisfaction: Lessons from the Ahmedabad Slum Networking Project [online]. Urban Studies. 50 (4), pp. 691–708. [Accessed 26 May 2013].
Saith, R. (2001) Social exclusion: the concept and application to developing countries. Queen Elizabeth House Oxford.
Salon, D. & Gulyani, S. (2010) Mobility , Poverty , and Gender : Travel ’ Choices ’ of Slum Residents in Nairobi , Kenya [online]. Transport Reviews. 30 (No. 5), pp. 6451–6657. [Accessed 5 March 2013].
Samad, T. (2006) Institutional Synergies in the Delivery of Urban Upgrading Services : Lessons from the Slum Networking Program in Ahmedabad , India. Massachusetts Institute of Technology.
Sanchez, T. (2008) Poverty, policy, and public transportation [online]. Transportation Research Part A: Policy and Practice. 42 (5), pp. 833–841. [Accessed 7 October 2010].
Sanchez, T.W. (1998) The Connection Between Public Transit and Employment by Center for Urban Studies School of Urban Studies and Planning Portland State University PO Box 751-CUS Portland , OR 97207-0751 Phone : 503-725-8743 Fax : 503-725-8480 Prepared for Presentation at th. (November).
Sanchez, T.W., Stolz, R. & Ma, J.S. (2003) Moving to Equity : Addressing Inequitable Effects of Transportation Policies on Minorities. Transportation.
Satterthwaite, D. (2003) The Millennium Development Goals and urban poverty reduction : great expectations and nonsense statistics. Environment and Urbanization. 15 (2), pp. 181–190.
Scott, J.C. (1998) Seeing like a state: how certain schemes to improve the human condition have failed. [online]. Yale University Press. [Accessed 2 April 2013].
Sen, A. (1999) Development as freedom. Oxford University Press.
Sengupta, A., Kannan, K.P. & Raveendran, G. (2008) india’s common people: Who are they, How Many are they and How Do they live? Economic And Political Weekly. (March 15), pp. 49–63.
Serebrisky, T., Gómez‐ Lobo, A., Estupiñán, N. & Muñoz‐ Raskin, R. (2009) Affordability and Subsidies in Public Urban Transport: What Do We Mean, What Can Be Done? [online]. Transport Reviews. 29 (6), pp. 715–739. [Accessed 16 April 2013].
SEU (Social Exclusion Unit) (2003) Making connections. [online]. Social Exclusion Unit, ODPM, London.

269
SEWA Union (2010) Natural Markets in Ahmedabad. Self Employed Womens Associaion Union, Ahmedabad.
Shastri, P. (2010) Ahmedabad roads most unsafe in Gujarat. Times of India.
Shastri, P. (2012) Where is the walkers paradise of the city? The Times of India. 7 Januarypp. 24.
Sheikh, F. (2009) Study of low-income group cyclists in Ahmedabad. Unpublished Masters Thesis, School of Planning, CEPT University.
Sheller, M. & Urry, J. (2000) The City and the Car. International Journal of Urban and Regional Research. 24 (4), pp. 737–757.
Shen, Qing and Sanchez, T. (2003) Residential location, Transport Mobility and Welfare to work - Milwaukee. p.pp. 301–314.
Shove, E. (2005) Consumers, Producers and Practices: Understanding the invention and reinvention of Nordic walking [online]. Journal of Consumer Culture. 5 (1), pp. 43–64. [Accessed 3 May 2014].
Shove, E., Pantzar, M. & Watson, M. (2012) The dynamics of social practice: Everyday life and how it changes. SAGE Publications Limited.
Shove, E. & Walker, G. (2010) Governing transitions in the sustainability of everyday life [online]. Research Policy. 39 (4), pp. 471–476. [Accessed 1 March 2013].
Sood, A. (2012) A Future for Informal Services ? The Cycle Rickshaw Sector as Case Study. Economic And Political Weekly. xlviI (42), pp. 95–102.
Soto, H. De (2003) The Mystery of Capital: Why Capitalism Triumphs in the West and Fails Everywhere Else. [online]. Basic Books. [Accessed 23 April 2013].
Spicker, P. (2007) The idea of poverty. Policy Press, London.
Spodek, H. (1969) Traditional Culture and Entrepreneurship: A Case Study of Ahmedabad. Economic and Political Weekly. 4 (8), .
Srinivasan, S. & Ferreira, J. (2002) Travel behavior at the household level : understanding linkages with residential choice. Transportation. 7pp. 225–242.
Srinivasan, S. & Rogers, P. (2005) Travel behavior of low-income residents: studying two contrasting locations in the city of Chennai, India [online]. Journal of Transport Geography. 13 (3), pp. 265–274. [Accessed 7 October 2010].
Srivastava, D.K., Bhujanga Rao, C., Vepa, S.S. & Viswanathan, B. (2010) Urban poverty alleviation strategies: A study of six cities (in India) - Monograph 7. Chennai: Madras School of Economics, Chennai.
Strengers, Y. & Communities, C.N. (2010) Conceptualising everyday practices : composition , reproduction and change. (6), pp. 1–21.
Subramanian, S. (2011) The poverty line: getting it wrong again [online]. Economic And Political Weekly. 17 (2), pp. 45.
Sundar, S. & Ghate, A.T. (2013) Accidents and road safety: Not High on the Government’s Agenda. Economic & Political Weekly. xlviII (48), .

270
Suzuki, H., Cervero, R. & Luchi, K. (2013) Transforming cities with transit: Transit and land-use integration for sustainable urban development. First. The World Bank, Washington DC.
Tandon, R. (2013) Why has India’s Calcutta city banned cycling? [online]. BBC. 30 September. Available from: http://www.bbc.co.uk/news/world-asia-india-24237390.
TERI-UN-HABITAT (2013) Pro-poor mobility: Policy guidelines and case studies. New Delhi: The Energy and Resource Institute (TERI) and UN-Habitat.
Tewari, A. (2014) Chinese expert finds flaws in Ahmedabad BRTS. The Times of India. 30 Septemberpp. 3.
Times News Network (2013) Teen Darwaza hawkers protest relocation [online]. Times of India. 11 Septemberpp. 12. Available from: http://articles.timesofindia.indiatimes.com/2013-09-11/ahmedabad/41969627_1_hawkers-street-vending-protest-relocation.
Times of India (2014) Not Yet the first choice. The Times of India. 30 Septemberpp. 2014.
Tiwari, G. (2011) Key mobility challenges in Indian cities. International Transport Forum Discussion Paper Series, OECD. p.pp. 34.
Tiwari, G. (2001) Urban transport priorities meeting the challanges of socio-economic diversity [online]. Cities. 19 (July), pp. 16–20.
Tiwari, G., Arora, A. & Jain, H. (2008) Bicycling in asia: An overview. Geetam Tiwari, Anvita Arora, & Himani Jain (eds.). Interface for Cycling Expertise, I-CE, The Netherlands.
Tiwari, G. & Jain, D. (2012) Accessibility and safety indicators for all road users: case study Delhi BRT [online]. Journal of Transport Geography. 22pp. 87–95. [Accessed 9 April 2013].
TNN (2012) Expect three new bus rapid transit system routes next month - The Times of India.
TNN (2014) Lack of vision leaves blind people at crossroads - The Times of India. The Times of India. February.
Toit, A. (2004) The Sociology of Chronic Poverty in South Africa : challenges for action and research 2 Studying Chronic Poverty. (June), .
Townsend, P. (1979) Poverty in the United Kingdom: A Survey of Household Resources and Standards of Living. [online]. University of California Press. [Accessed 14 May 2014].
Tripathi, D. (1999) Slum networking Ahmedabad: The Sanjay Nagar pilot project. Working Paper No.101, Develoment Planning Unit, University College London. [online]. (101). Available from: http://www.ucl.ac.uk/dpu-projects/drivers_urb_change/urb_governance/pdf_partic_proc/DPU_Tripathi_Ahmedabad_Sanjay_Nagar_Project.pdf.
Unni, J. & Rani, U. (2002) Employment and Income in India : Case of a City Economy (Ahmedabad). Working paper No. 130, Gujarat Institute of Development Research, Ahmedabad. (130).
Urry, J. (2002) Mobility and Proximity [online]. Sociology. 36 (2), pp. 255–274. [Accessed 1 May 2014].
Vasconcellos, A. (1997a) The demand for cars in developing countries. Transportation Research Part A. 31 (3), pp. 245–258.

271
Vasconcellos, E.A. (1997b) The urban transportation crisis in developing countries: Alternative policies for an equitable space. World Transport Policy and Practice. 3 (3), .
Vasconcellos, E.A. de (2005) Urban change, mobility and transport in São Paulo: three decades, three cities [online]. Transport Policy. 12 (2), pp. 91–104. [Accessed 20 November 2012].
Vaz, E. & Venter, C. (2012) The effectiveness of Bus Rapid Transit as part of a poverty-reduction strategy: Some early impacts in Johannesburg. In: 31st Southern African Transport Conference (SATC 2012). 2012 SATC, Pretoria, South Africa. pp. pp. 619–631.
Venter, C. (2013) The lurch towards formalisation: Lessons from the implementation of BRT in Johannesburg, South Africa [online]. Research in Transportation Economics. 39 (1), pp. 114–120.
Venter, C. (2011) Transport expenditure and affordability: The cost of being mobile [online]. Development Southern Africa. 28 (1), pp. 121–140. [Accessed 1 March 2013].
Venter, C. & Vokolkova, V. (2007) Gender , Residential Location , and Household Travel : Empirical Findings from Low-income Urban Settlements in Durban , South Africa. Transport. 27 (6), pp. 653–677.
Wachs, M. & Kumagai, T.G. (1973) Physical accessibility as a social indicator. Socio-Economic Planning Sciences. 7 (5), pp. 437–456.
Wahdan, D. (2010) Governing Livelihoods in Liberalizing States:: A Comparative Study of Passenger Transport in Gurgaon, India and Sitta October, Egypt. [online]. LAP Lambert Academic Publishing. [Accessed 3 April 2013].
Warde, a. (2005) Consumption and Theories of Practice [online]. Journal of Consumer Culture. 5 (2), pp. 131–153. [Accessed 2 March 2013].
Wati, K. (2009) Transport Related Social Exclusion in Ahmedabad Transport Related Social Exclusion in Ahmedabad. Masters thesis, national institute of geo-information science and earth observation, University of Twente.
Webster, N. & Engberg-Pedersen, L. (2002) In the name of the poor: Contesting political space for poverty reduction. Zed Books.
Williams, D., Chatterton, T. & Parkhurst, G. (2013) Assessing the Local Sustainable Transport Fund Submissions in Relation to Disruption. (January) p.pp. 1–12.
World Bank (2002) Cities on the move: A World Bank urban transport strategy review. The World Bank, Washington DC.
World Bank (2004) From Duplicate 2 ( . Poverty and urban mobility in Douala. SSATP Africa Region World Bank.
Wratten, E. (1995) Conceptualizing urban poverty [online]. Environment and Urbanization. 7 (1), pp. 11–38. [Accessed 7 October 2010].
WSAPL-MoUD & WSA-MoUD (2008) Final report: Study on traffic and transportation policies and strategies in urban areas in India. New Delhi: Wilbur Smith Associates for the Ministry of Urban Development, Government of India, New Delhi.
Yin, R.K. (1994) Case study research: Design and methods. 3rd edition. New Delhi: SAGE Publications India Pvt Ltd.

272
Zhen, C. (2013) Geo-spatial modeling for competition-based accessibility to job locations for the urban poor : case study in Ahmedabad. Masters Thesis for Faculty of geo-information scient and earth observation, University of Twente.
Zuidgeest, M., Bosch, F. van den, Quang, N.N., Brussel, M. & Munshi, T. (2012) Measuring accessibility to jobs for the urban poor; case study: Ahmedabad, India (Techanical Report). Enchede: Facuilty of Geo-information Science and Earth Observation (ITC), University of Twente, the Netherlands for the World Bank.
Zuidgeest, M., Brussel, M. & Munshi, T. (2012) Measuring Accessibility to Jobs for the Urban Poor: Case study of Ahmedabad, India. The World Bank, New Delhi.

273
Appendices

274
A1. Qualitative data – semi-structured interviewing guide
(Note: All bulleted points are prompts, which will be used, if the need be, to elaborate the answer and to cover all important issues)
1. Remind participant of the following from the participant information sheet:
Researcher’s introduction and affiliation, purpose of the research and how it is conducted, time taken etc.
What happens to the material collected, provide contact details and take permission for audio recording
2. Please tell me about you and your family.
(Occupation and education levels of the interviewee and his family members etc)
Residential choices
3. How long have you been staying at your current residence?
Under what circumstances/conditions you came here? What options did you have?
What is the history of changing residences before? And if any impacts of moving on the household (asset base, income, jobs, education etc)
4. How do you feel about your current location? Any advantages (or disadvantages) - accessibility to employment, education etc in the household?
Employment choices
5. What kind of work do you do (or used to do)?
Getting work through the year? Any irregularities involved in income, shifts,
locations, security of the job or seasonal migration/ shifting of jobs etc?
6. What kind of changes have come in your employment over the period?
Required any new skill sets/ credit/ Equipments/ Assets etc?
Impacts on the household (asset base, income, jobs, education etc)
Transport-mobility choices
7. Can you describe your travel in the city yesterday? How do you travel every day in a week?
How do you feel about your travel in the city? Something that bothers you?
Under what circumstance do you (or will you) change your travel pattern/mode?
8. Why this option? What were the other options to move around the city?
Can you describe the good and bad things about your way of getting around the
city?
What about other family members? (Try and cover activities, gender, age)
9. There are new transport facilities being created in the city, how do you feel about them?
• What about Municipal bus or Janmarg (BRT) or shared auto rickshaws? Pedestrian or cycling facilities?

275
• Any other concerns about daily travel in the city?
Poverty and Transport
11. How do you feel about your economic situation over the years?
12. What do you think are the most important factor(s) that has helped you ‘survive’ in the city?
13. If you have a choice to change something about where you stay, where you work and how do you get around - what would you prefer to change?
Will that improve your economic situation? Why?
15. What are your plans for future?
What do you see as future transport, especially for your children?
What kind of facility do you want to see improved in the city?
Discuss any other issues they may want to talk about.
Thank participants for their time, help and ideas.
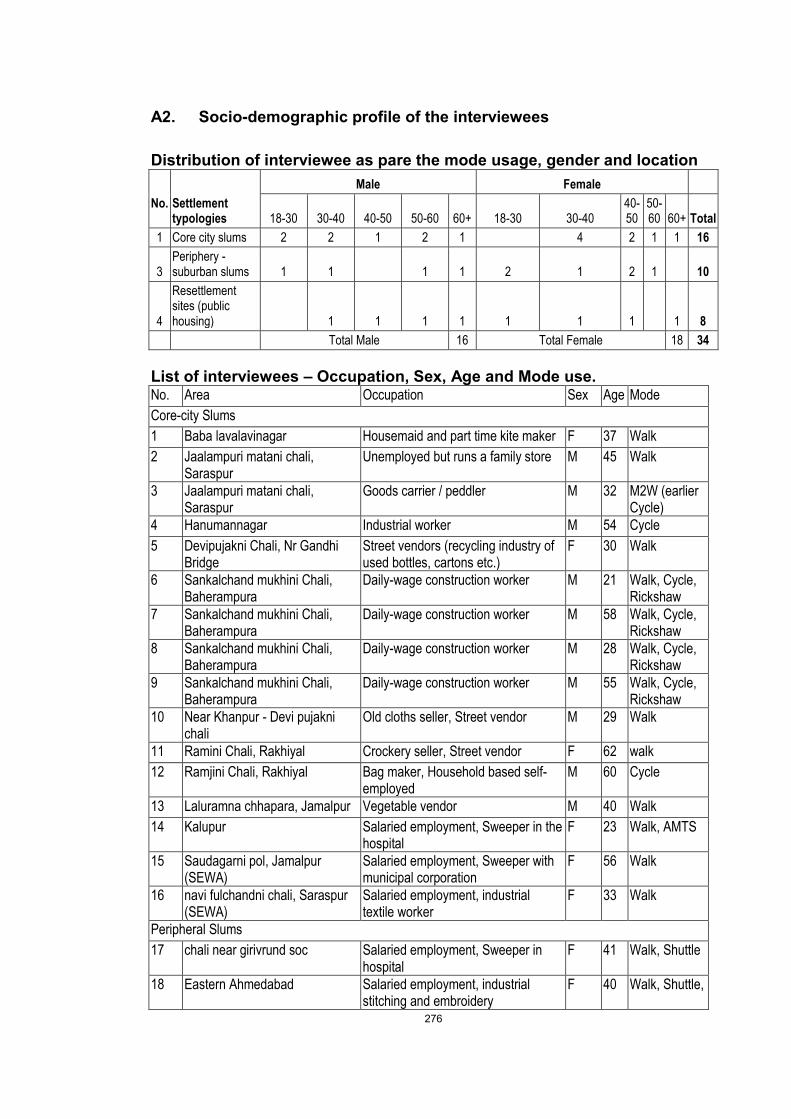
276
A2. Socio-demographic profile of the interviewees
Distribution of interviewee as pare the mode usage, gender and location
No.
Settlement typologies
Male Female
18-30 30-40 40-50 50-60 60+ 18-30 30-40 40-50
50-60 60+ Total
1 Core city slums 2 2 1 2 1
4 2 1 1 16
3 Periphery - suburban slums 1 1
1 1 2 1 2 1
10
4
Resettlement sites (public housing) 1 1 1 1 1 1 1
1 8
Total Male 16 Total Female 18 34
List of interviewees – Occupation, Sex, Age and Mode use. No. Area Occupation Sex Age Mode
Core-city Slums
1 Baba lavalavinagar Housemaid and part time kite maker F 37 Walk
2 Jaalampuri matani chali, Saraspur
Unemployed but runs a family store M 45 Walk
3 Jaalampuri matani chali, Saraspur
Goods carrier / peddler M 32 M2W (earlier Cycle)
4 Hanumannagar Industrial worker M 54 Cycle
5 Devipujakni Chali, Nr Gandhi Bridge
Street vendors (recycling industry of used bottles, cartons etc.)
F 30 Walk
6 Sankalchand mukhini Chali, Baherampura
Daily-wage construction worker M 21 Walk, Cycle, Rickshaw
7 Sankalchand mukhini Chali, Baherampura
Daily-wage construction worker M 58 Walk, Cycle, Rickshaw
8 Sankalchand mukhini Chali, Baherampura
Daily-wage construction worker M 28 Walk, Cycle, Rickshaw
9 Sankalchand mukhini Chali, Baherampura
Daily-wage construction worker M 55 Walk, Cycle, Rickshaw
10 Near Khanpur - Devi pujakni chali
Old cloths seller, Street vendor M 29 Walk
11 Ramini Chali, Rakhiyal Crockery seller, Street vendor F 62 walk
12 Ramjini Chali, Rakhiyal Bag maker, Household based self-employed
M 60 Cycle
13 Laluramna chhapara, Jamalpur Vegetable vendor M 40 Walk
14 Kalupur Salaried employment, Sweeper in the hospital
F 23 Walk, AMTS
15 Saudagarni pol, Jamalpur (SEWA)
Salaried employment, Sweeper with municipal corporation
F 56 Walk
16 navi fulchandni chali, Saraspur (SEWA)
Salaried employment, industrial textile worker
F 33 Walk
Peripheral Slums
17 chali near girivrund soc Salaried employment, Sweeper in hospital
F 41 Walk, Shuttle
18 Eastern Ahmedabad Salaried employment, industrial stitching and embroidery
F 40 Walk, Shuttle,

277
19 Satyamnagar, Amraiwadi road Goods puller (casual labour) F 55 Walk, Shuttle
20 Viratnagar, Periphery Street Vendor (Spices) F 45 Walk, Shuttle
21 Meghani Nagar Salaried employment, Office clearer and help
M 37 Walk, Shuttle
22 Odhav Salaried employment, garment factory
F 24 Walk, AMTS
23 Amraiwadi Salaried employment, peon F 38 Shuttle, BUS
24 Sanjaynagar, Near Parasnagar Casual Labour – daily wage F 34 Auto rickshaw
25 Yogeshwarnagar, Near New APMC
Porter (retired) M 62 Walk
Resettlement sites
26 Trikampura BSUP Toy maker and seller (vendor) M 39 Cycle
27 Ganeshnagar Salaried employment, works as a peon in hospital
F 42 Shuttle,Walk
28 Mahadev Nagar, Ranip Salaried employment, NGO F 27 Bus, Shuttle
29 Trikampura BSUP Casual Labour – daily wage M 21 Walk, Shuttle
30 Ajit Mill ni Chali Casual Labour – daily wage M 45 Walk, Shuttle
31 Trikampura BSUP Goods carrier / peddler M 53 Shuttle
32 Ganesh Nagar Industrial worker in Narol M 35 Cycle
33 Ganesh Nagar Domestic Help, Near Chandola F 36 Walk, Shuttle
34 Ajit Mill ni Chali Domestic Help, F 52 Walk, Shuttle
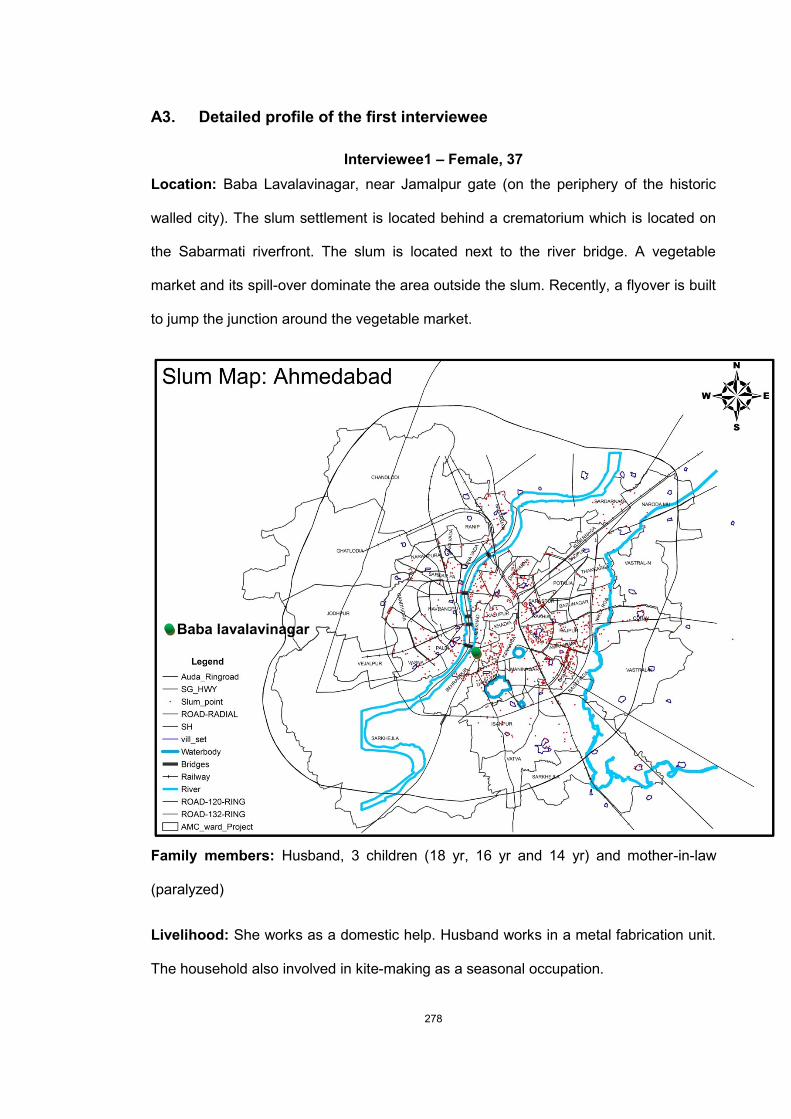
278
A3. Detailed profile of the first interviewee
Interviewee1 – Female, 37
Location: Baba Lavalavinagar, near Jamalpur gate (on the periphery of the historic
walled city). The slum settlement is located behind a crematorium which is located on
the Sabarmati riverfront. The slum is located next to the river bridge. A vegetable
market and its spill-over dominate the area outside the slum. Recently, a flyover is built
to jump the junction around the vegetable market.
Family members: Husband, 3 children (18 yr, 16 yr and 14 yr) and mother-in-law
(paralyzed)
Livelihood: She works as a domestic help. Husband works in a metal fabrication unit.
The household also involved in kite-making as a seasonal occupation.
Baba lavalavinagar

279
Education: She can read and write; same with the husband. The children are studying
in the school – two boys are in Jalgaon (Maharashtra) with her parents and one
daughter (youngest one) stays with her.
She is staying in the same location for 20 years. She moved to Ahmedabad after her
marriage to the house where she is living now. The family has bought the house
informally long time back (she doesn’t know when). The slum settlement at present
doesn’t have any threats of eviction from the municipal corporation and it is believed to
be older than 30 years. About ten years back, the slum was provided with the basic
services like water supply, sanitation (including toilets), stone-paving of streets, street
lights etc. She had paid 2100/- INR as the ‘beneficiaries’ contribution’. This was done
as part of the slum networking program (SNP) called ‘Parivartan’ (literally
transformation) with the help of the local NGO (SEWA) and the municipal corporation.
Before this program, she describes that there was a problem in fetching water and she
had to stand in a queue for almost an hour to get the water. There was no toilet in the
household and no street-lights or street paving. Now she has a two-room house
(including kitchen) and a toilet. There is piped water-supply and sewerage connection
with street lights and paved roads.
She has started working as a domestic help for last 6 years. She works for one hour in
a house and gets about 1000/- INR as a salary. She works in only one house as a
domestic help. She doesn’t want to work in more houses and she is satisfied with her
salary. She also makes kites as a part time job. She gets this work for 4 months before
the kite flying festival, which falls in mid-January. She works for 4 to 6 hours during this
time in the evening and in the night. Her husband and daughter also help her with this
work. Her husband works for a metal fabrication unit. His work stops for at least 3
months in the monsoon and he doesn’t get any salary during those months. He met
with an accident six years back. His employee didn’t pay him any reimbursement or
damages, which created an economic crisis in their household. She started working

280
from that point onwards as a domestic help. It was slowly discovered in the interview
that her husband resisted her to go out and work before this crisis situation was
created. During this time, she also sent her sons to her parents’ house as they could
not afford their education. Her parents insisted to pay for their education and they took
them in.
She walks to work and it takes half an hour. She says that she is happy to walk. While
going, she drops her daughter to school. Sometimes she takes shuttle (shared) auto
rickshaw. The cost of which is about 10 INR for each trip for two people. Her daughter
walks to school along with her but returns on her own. Her husband also walks to work
for half-an-hour to reach the factory. Right now, they don’t face any problem with the
transport as for them everything is easily accessible.
She doesn’t want to invest in transport (mode). When asked about buying a cycle for
her daughter she says that the roads are not very safe for a cyclist. Again when asked
she insists that it is not because it is her daughter, she wouldn’t buy the cycle for her.
She would have done the same for her son too. Her husband doesn’t want to buy a
cycle either. Buying a motor-bike for him is possible only after they manage all their
expenses well. Her families occasionally use the shared rickshaw for social outings.
They don’t use AMTS (municipal bus service) as it is not as convenient to get as the
shared rickshaw.
She points out the difficulties faced by the residents after the construction of the
flyover. The junction below it is more chaotic. To make space for the flyover (and the
side-lanes) some hawkers lost their usual spots. She takes name of a person from the
settlement who lost his hawking space. There are some local NGOs working in the
settlement but which are not directly helpful. She had an account in the micro-finance
group but when she took a loan some years back she was charge very high compound
interest rate after that she doesn’t trust them. All she wants from the government is to
‘regularise’ their house. Otherwise, she doesn’t think that government has done

281
‘anything’ for them. She acknowledges that because of their own efforts, they have
managed to survive through difficult times.
She did not work for first 14 years of her married life. The family has gone through
some crisis in the past which was mitigated by her decision to start working. Only
at the time of crisis she got the consent of her husband.
Two children staying with the grand-parents also indicate their low affordability to
pay for their children’s education.
Residential location is crucial to this household as everyone is dependent on
walking to work or to the school.
Their personal mobility is not really perceived as a problem as they are managing
to access work and education by walking but the roads in general are perceived as
hostile.
Cycling is not considered as an option for anyone in the family because of the
perceived threat of traffic on the roads.
They neither have a say or stakes in the flyover building activities next to their
neighborhood. This has further deteriorated the pedestrian road safety in the area.
Overall, this interview hints at many structural issues of living in poverty such as
informality of housing and job market, no social security for the workers, gender
issues within a household, hostile road environment for cycling, bias towards
motorized vehicles in the urban projects, ineffectiveness of the micro-finance
institutes etc.

282
A4. Specimen Transcripts of two interviews
Female, Age: 41 - Sweeper in a hospital, salaried employee (on contract) Q: What is your name? Tell me about yourself. A: My name is Pratima H Patel. I live in Saiyejpur-Boghar-Kubereshwar Mahadev’s Girimunj society and come from there. We are three people in the house, me, my husband and my son. We have two daughters, but both are married. The son is doing his college in FY (First Year). My husband is working in a garment factory. Q: What is your age? A: My age is 42 years. Q: Is your husband educated? A: No. He has studied only till 3rd class. Q: And you? A: Till 10th class. Q: Where do you live presently? A: I live in Girimunj society; it is a Chali opposite Kubereshwar Mahadev. Q: Since how many years have you been living there? A: I’ve been living there for around 22 years. Q: How did you come to live in that house? A: I had been living in that house on rent but I bought it 5-6years ago from my husband’s elder brother. Q: Where did you stay on rent earlier? A: In a house in the same society. Q: Were you living together? A: No, we lived separately. Q: Can you tell me how did you change houses? A: We used to change house for reasons like the owner having problems or any other reason he would give; and as such no owner allows anyone to live on rent for more than 12 months. Q: So did you change houses every year? A: Yes, in every year or two at the most. Q: So it must be a lot of trouble for you. A: Yes, a lot of trouble. Q: What kind of trouble exactly? A: The children have to study and even then changing house is always troublesome. Q: Not like that. One is the hindrance to your son’s study. What other troubles? Any problem in commuting? A: No, our commuting is that of routine and there is no problem in it. Because we are living in the same area since 22 years. Q: Why did you choose this area only? A: Because we got comfortable in that area and also because my husband’s elder brother lived in that area. He has his own house there since the beginning Q: Did you find any help from anyone in buying the house from any neighbours or relatives? A: No help from anyone. My husband’s brother had sold off the land we had in a village and we bought the house from the money that came by selling it. Q: What do you think about the advantages and disadvantages of now having shifted from living in a rented house to buying a house of your own? A: Living in one’s own house has obvious advantages. We had to pay rent every month and adjust the remaining income. Then have to pay the electricity bill to them, whatever amount they quote. Now after having my own house, we can pay the light bill anytime we want. Q: Since how long have you been doing job here?

283
A: Earlier I used to go (work) in a private hospital. Q: Which private hospital? A: Sterling Hospital. There I worker for around 3-4 years. Q: And here? A: I’ve joined this place 4 months ago. Q: On what post are you working here? A: I’m a maid servant here. Q: So what did you do earlier? A: I did nothing before that. I kept to home. Q: How did you then decide to work? A: As the children grew up and my husband, who was working in a mill, which closed. Q: How long has it been that the mill got closed? A: It has been 18years since the mill got closed. Then he used to do stitching and other works from home. But then it wasn’t enough to make the ends meet. Q: So did he support you in your decision to go out and work? A: Yes Q: What does he do now? A: He goes in a factory. Q: How does he go? A: His work place is around 15-20 minutes away so he goes walking. Q: How did he go earlier? A: He used to go in bus. He used to get the city bus. Q: How did you go for work where you worked earlier? A: I too used the city bus. Q: Direct bus...? A: No there is no direct bus, so I used to have to go to Lal Darwaja. During my morning duty, going via Lal Darwaja was very difficult because it used to be crowded with college going students. Many times in such cases the bus used to not even stop. Even today we face this problem. Q: So what do you do for this? Do you go in a shuttle sometimes? A: Yes, if the bus doesn’t stop, we have to catch a shuttle-rickshaw. Q: How much would it be costing? A: In shuttle, to reach till kalupur from there, it took 7-8 rupees and from Kalupur to the here; another 5 rupees. So everyday it took 12-13 rupees for the onward journey itself. Q: And if you travel in the bus? A: If sometimes I get a direct bus, it takes 6 rupees else 7 rupees. So it takes 15-16 rupees for both going and returning. Q: So do you come back home walking? A: From Income Tax area we have to any way come walking. Q: How much kilometres would that be? A: I’m clueless about the kilometres but it takes 15 minutes. Q: So is walking problematic for you? A: It is problematic. Q: What about the traffic? A: Yes, when we get down and the traffic flow starts, it gets difficult to cross the road. Q: Has something of that sort (accident) happened to you? A: No. It has not happened anytime yet. Q: Yes, so you walk carefully. Q: So even your husband goes walking. What is his age? Does he have any problem in walking? A: His age is above 45. And he does not have any problem in going walking. Q: Does he not drive a cycle? A: No he doesn’t know how to drive a cycle. Q: So you never bought a cycle? A: No, We never bought a cycle.

284
Q: How does your son go to college? A: He travels in bus. Q: And when he used to go in school? A: His school was nearby. Q: Does he (your husband) have to do the same work whole year? A: yes. Q: How much might you be earning? Approximately? A: I get around Rs.5000 Q: How is your shift changed? And how troublesome is it? A: In summers if my shift gets over in the afternoon, then walking from Income tax to home is really troublesome. It rains only sometimes so that is not much problem. Q: Why did you leave your earlier job? A: That place was far and this is nearer. Q: Had you got any training for the job here? A: I got the job based upon my experience. Q: Earlier you didn’t work and now you work, so has there been any change in the habits in your house? A: Earlier only my husband was earning so I had to run the household only from it, my two daughters’ and the son’s education so I used to do some small work like stitching and knitting which gave some relief to me in managing expenses. But now it is relatively good because now I and my husband both work. Q: What are the problems in commuting for job? A: It is problematic that buses don’t stop, many times I have to wait for more than an hour at the bus stand and it gets very late by the time I reach home. In all this many times the expense increases. If the average expense is 15rs, in such cases it becomes 20-25 rupees. Q: if you spend 20-25 rupees in such cases, in what matters of household do you try to economize? A: Yes we do but that is...But then we don’t have any such expense which can be cut down upon. Still, we cut down on vegetables or other groceries. Q: Were you living here only or did you come from other place? A: My maternal side is Pirana Q: So you shifted from there? A: My husband used to work in Ashok Mills in Naroda and he used to find it very far to travel. So we came here. And here his elder brother was staying so we came beside them. Q: What is the reason that you got fixed here then? Why did you decide to finally settle here? A: What can I say about that! Q: No, but then I want to know why and how do people settle! A: Here we get everything in the city. We had a village there and even a farm, but couldn’t adjust with farming. And here if we work somewhere and earn, it is easier to run the house. Q: If you were given an option to change any of these, what would you change: The place where you live or the place where you work? Or would you change your mode of transportation? A: I would change the transportation. I would wish that in less cost I would get to work and get back from work quickly. Q: do you think you financial condition would improve then? A: Yes Q: How would it improve? A: That, as I told you, when we don’t get the buses on time, when we have to hire special rickshaws and when we have to spend 20-25 rupees while if it takes lesser then it would financially create a difference for us. Q: If your income increases, what would you change?

285
A: I would consider what is more important for the household and accordingly would buy that. Q: What would be that important thing? What would be the most necessary thing you would get if your income increases? A: An instrument for transportation. Q: If your income increases then if you buy a vehicle, would you start commuting on it or even then use the public transportation? A: That will depend upon how much my income increases and the affordability. Q: What would you wish to get for your children in future? A: I have thought about my son’s future; if he gets a good post at work then we would buy a four-wheeler. Q: Now, I want to know what are the changes and the problems you have come across from the time of your marriage till now. What are the things that have occurred? I shall not ask you bit by bit so you just tell me at one go. I want to know this because my condition might be different and so would be anyone else’s as much as yours! I want to know how different women run their houses in different circumstances. A: When I got married, my husband was working in a mill, and our in-laws lived in the village so we both were alone here. Even we were living there but then because of the distance we came and settled here in Ahmedabad. When I came here, my first daughter was one and half years old and I was 7 months pregnant when my husband lost his job after the closure of the mill. That time we didn’t have much problem as we got some remuneration from the mill. But after a year, because my husband didn’t have any other skill for any other work, which he doesn’t even now, and kept at home without any work, problems started to increase. We had our second daughter. Two years after that I had a son so gradually problems started to increase even more. I’m not acquainted much with anyone here but my husband’s brother’s wife knew a lady who advised me to work and helped me get work as maid at houses. That work was to wash clothes and utensils at 3-4 houses. I did that for 6-7 years. My children, as they gradually grew, they helped me in domestic work. My elder daughter used to do the domestic chores at the age of 6. There has been a lot of pain in life. Because of my lack of money, I got my both daughters marry in a court. My son has passed 12th class. I have done many different works, domestic jobs at different houses. I joined a stitching class and there I used to get only Rs.700 salary. My husband’s salary used to be very less. The condition of my house was very serious and my parents too helped me a little. Q: But today your condition is good. A: yes, but even today my husband’s salary is very less. His salary is Rs.3000 so I run the household from my salary only.

286
Male, Age: 40 - Street Vendor, Eastern core city Q: Tell me your name and a few things about the people living in your family. A: see; in my family... there is me and my father who was working in Lal Mill but he got paralysed. And he has got no relief from it even today. When we went for his medication, the cost of a Rs.5 lakh treatment was Rs.5o lakh and he died because we didn’t have the capacity to look after his treatment and medication. Q: In which year? A: In which year... It is 2011 right now...he passed away somewhere around 1999. Q: What is your name and who all do you live in your house? A: My name is Samjhibhai Bachubhai Patni. Rekha ben Samjhibhai Patni is my wife and my five children live too. The eldest one, the daughter’s name is Anuben samjhibhai Patni. The second one is Mehulbhai Samjhibhai Patni. The third, Vipulbhai Samjhibhai Patni, The fourth, Sahilbhai Samjhibhai Patni, and the fifth one, is Artiben Samjhibhai Patni. We are these many people and till today we have got no governmental facility, the house is under cutting, we do not get any facility. Even this BPL cards which have come out; we’ve not got them yet. Q: So are you BPL (Below Poverty Line – cards distributed by the government)? A: No Q: had you filled the form for it? A: Yes, we had filled it but our names only have not come in it. So how can we run the household and take care of the kids. I’ve just returned from work and you’ve come. I do business in Maninagar. Q: What business do you do? A: I sell vegetables. I peddle and sell vegetables. Q: from where do you bring the vegetables? A: from Jamalpur. We bring it from Jamalpur and by 7 am we reach Maninagar, do the business and by 4pm.. see, if the work gets over early only then, otherwise I return late. What happened today...There was Mandavdi in Ghodasar. Mandavdi means all the whole-sale business is closed. So we bring little and sell it and earn the living. Q: How much worth of goods do you buy everyday? A: Everyday we purchase around Rs.600-700 worth of goods, due to inflation. And the travel expense comes to Rs.20-30 daily. Q: How do you go to Jamalpur daily? A: We go to Jamalpur in rickshaw. Q: Do you go alone or go in groups? A: We go in groups. How can we afford the charge if we go alone! The charges from here to Jamalpur are Rs.40-45 Q: how many people do you go in one rickshaw? A: In one auto, 4-5 people go together as shuttle and he (the driver) takes Rs.10 each from us. And after loading the goods, the return charges are Rs.20 each. So Rs.30 per day, amounting to Rs.900 per month is my expense. Q: So do you come here and then arrange the goods in your laari (cart)? Where is that cart? A: My laari is here only. I load the card with the goods and we go to Ghodasar. Q: How do you go? A: We go walking. We walk through the alleys and get customers on the way. If the goods are sold early, we return back early and if they don’t, we return late. So the goods must be sold for us to earn something. Q: So if you buy goods for Rs.600-700, then at what amount does it get sold? A: See, if we buy goods worth Rs.600-700, it gets sold off for Rs.800-850; not more than that. Q: So you earn Rs100-200 every day after that? A: I get around Rs.100 every day after cutting all the other expenses of the business. So my monthly income is around Rs.3000

287
Q: Since when are you doing this business? A: I have been doing this business since I was 15 years old. I even left my school for that. When I was studying in 8th class, I saw the condition of my house, that my father was paralysed, mother kept ill ( She has TB and had breathing problems). So since then I am the only one to earn in my house. I had to earn the living and so I left the school. So I used to run the household and at a yound age I was made to marry while my parents were alive. In our society, parents always think of doing good to their children and now I am a father of five children. It happens out of ignorance and then it also becomes very difficult to lead life. We don’t have any governmental support. See, we don’t have a BPL card; the ration my father had made, our name isn’t there in it. My name is there, but when I go to the ration shop I’m said that as my father is dead, my brother is dead (who died in an accident) and everyone is dead, and then even my wife’s name isn’t there; only me and my sister’s names are there now, rest are deleted, so I cannot avail of the ration card. Q: If you want to get her name in it, what would you have to do? A: They’re asking for bribe. They’re asking for Rs.1000-2000. How can we poor people bring that from and give. This is only for a ration card. Q: So you take your cart from here to Ghodasar daily. At which places do you sell there? A: There is Ghodasar, Maninagar, Jawahar Chowk, Dakshini Society, like that. Q: How did you start off from Ghodasar? A: See Sir, this business was done by my parents earlier and in their absence I took over so I knew where they did the business and so according to that I continued. Q: So all the people of your community go there or at different places? A: At different places. There might be 10-20 people of our community and out of the others, some go to Kankaria, some go to Vatva, different places... All of them don’t have contracts at the same place. Q: How many kilometres is Ghodasar from here and how long does it take to go there from here? A: From here it takes 45minutes to 1hour by walking and talking the cart. Q: So while going from here, doesn’t traffic bother you? A: Yes it does and there being some big instruments in it, if a vehicle speeds by, it may hit it and go. So that fear is there. Q: Has that happened to you in these 10-15 years? A: It has happened but it is normal that if a vehicle hits the cars, all the vegetables fall down and makes a loss for me. Nothing apart from that and nothing of dangerous sorts has happened. Q: What is your further future plan? A: My future plan is this Sir, Our house is declared to be in the cutting zone (for road-widening) and I have children. We pray that the government gives us proper ration facility and though wherever but a good accommodation be provided to us. We pray for this. Q: How did you come to know that this is under cutting? A: It has been measured. Many big officers have themselves come here and measured it for cutting. And I already showed you the marking how much it is. More than that, these AMTS buses and the luxury buses run powerfully on this road so our children have a lot of difficulty on this road. Q: Had any one met with an accident here? A: Yes, my brother died in accident here. The place where we are sitting right now, me and my brother were sleeping and at 4am in the morning a vehicle came and ran over him. He hardly lived for 4-5 days and then he died. Q: How long before did this happen? A: This happened 10-12 years ago. We filed a police case in Manavgram Police chowky in Rakhial. What they said was that the tractor that hit him was not insured and so to get the claim we would have to substitute it with another one. My old man was

288
living then; he said that he wanted to claim on the tractor that hit his son. But till today there has been no resolve on the case. And the advocate whom we had hired for this case took away the money and eloped away. So presently we have got no decision. So this is dangerous for our children and I pray for better facilities so that this doesn’t happen again in my lifetime. Q: So what are the luxury (BUSES)’s timings? A: The luxuries (buses) start after 9pm or 10-11pm in the night. Even the tractors and all come after 11-12 in the night. And even the police department is not taking any care this matter. Nobody is there to look into this. Q: Your house has come under cutting (demolition); so how much prior time have they given you. A: Now this year will end, 2011 and in 2012 they will start the demolition and they said something like, asking us to manage the place accordingly. They had gone off saying that but yet they have not come back. They want to make a circle near that cross road. They’ll make circle and for that our house will be demolished, then where do we go, Sir! Q: Today everywhere in Ahmedabad there are talks of growth and development. What do you think of it? What our Chief Minister and everyone else are saying about... A: Listen, now the form we have filled has names of certain people in their name-list and our name is not there at all. We live on the road and our names are not there and those who live on the inner side, their names are there in the BPL list. Q: How did they get the BPL card? A: See, their BPL work they did at the ration shop using their connections and support from each other and there is no support for us. We do not have any connections. Q: You have this demolition in this place; don’t you have any leader amongst yourselves? A: No one. Q: Do you go to and talk to the local political party person of this area or anything of that sort? A: No, nothing of that sort. Lallubhai Ratnabhai is the owner of our moholla. He can be counted as the leader, but he never comes to inform us about any facilities that come. He supports only his relatives and tells them to do this or that. Q: So is this his private land? A: No it not his private property, nor under his ownership. There is someone else, but I don’t know who, who owns it. We’ve inhabited this place since 40-45 years and still no tax-bill has come for us and no water-tax. He is fudging everything. Q: Now that your house is under demolition and if you wish to buy a new house in some other place like Chali, how much money do you think would be required? A: Look today if I want to buy a house, it’d take around Rs.2-3 lakh. But leave Rs.2-3 lakh, we don’t even have Rs.20,000-25,000. Q: Any other Chali of your own community, a chali like this, would cost how much? A: Rs.2-3 lakh or 4 lakh Q: Even for a Chali? A: Even in a Chali. Even if it would be of our own community, It is we who would be the needy in the deal and so whatever they ask, we would have to pay. Q: Where nearby is another such Chali of your community? A: They are Lallu Ratna Ni Chali and Satyadev Ni Chali. Only these are the two in this area. Apart from that there is one in Chandola area. Q: Won’t you go there? A: Yes we can go that far too but then they’d sense that I’m the needy in the deal and would quote me Rs.3-4 lakh for a house that might be actually worth Rs.1 lakh Q: So no help from the community? A: No help. Q: So since how long have you been travelling to Ghodasar by walk?

289
A: My age was around 13-14 years and I was in 7th-8th class, since then. I used to go along my old man (father) to support him. So after my mother and he died, I started doing the business in their place. I left my studies for this. Q: How many years have passed since then? Twenty years? A: Yes, it must have been 20 years since then. Q: So in these 20 years do you find the traffic increasing or as it was. A: No, it does feel to be increasing. It doesn’t seem to be any less. Now we get fear while passing through Ghodasar gam, Khokhra gam and Maninagar railway station at 9 or 10 at night because of hooligans and the powderya. Q: Why? A: We would pass through alone with our carts and they would scare us with knifes and all and rob us. Q: What is powdery. A: Those who intake brown-sugar. And if we don’t give money, they beat us or show us knives. So we leave these places before 9 or 10 in the night; in fact leave off by 7-8pm. So we also trick them this way. Q: So what is the solution for this situation? A: The solution would be whatever the incumbent government brings for the poor people, whether it is Narendra Modi’s government (at the state) or Manmohan Singh’s government (at the centre)... Now whoever has this BPL are getting many good benefits and those who don’t have it aren’t! Even our ration is stalled now. When we go to the ration shop and ask them to make a new card for us, the controllers ask us for money. I have already produced the death certificates of my parents; still they are not giving ration to us. They’re asking Rs.1500 and when we don’t have that kind of money, how can we give it! We earn meagre 50-100 rupees every day and pay 100-200 rupees light (electricity) bill; so poor people like us, where can we go! So the benefits the BPL card holders get, even we, the normal card holders should get. And after this demolition, we should get some housing facilities. This is our humble request. Q: Yes that is correct, but we do not come from the government. We are just doing a research and whatever report we prepare, we send it to the higher authorities and whether or not to work upon it is upon their discretion. So we do not want to give you any false promises. We’re just here to discuss. A: (The wife speaks) Yes, you must be legal people so... Q: No, we’re not even from the legal department. We’re just doing a research. A: Yes, so you officials come for the betterment of the poor people. Q: We do present our case forward to the higher authorities. But the government might not have wanted to work upon it! They’re doing the Kalyan mela scheme but no one here might have come under it. A: Yes, no one in this whole line/stretch has got it. The BPL card which gives benefits of free medication and health services and other things have not been availed by us. Q: Which other means of transportation do you use apart from shuttle-rickshaw? A: Nothing apart from it. If we want to go to some village, we use the railways. Q: What about municipality buses? A: Yes, we use the municipality buses to go to places like Kalupur, Saranpur or Lal Darwaja. But generally I have to wait for the bus for 10-30 minutes and sometimes it comes immediately. Q: Is it cheaper for you? A: It is cheaper. Q: So shuttle-rickshaw is costlier? A: yes it is. A shuttle-rickshaw would coast Rs.10 from here to Kalupur while Bus would cost Rs.5 only.The red-buses are of-course cheap for us. Q: Do most of the people of your community use shuttle-rickshaws too? A: Yes. Q: Anything else, Sir? A: No nothing else.

290
Q: Where will you fill all these details? A: I have recorded it on this (recorder).

291
A5. Quantitative data – Household survey form
1. Reference
Form No. Date: Surveyor name:
Area: Settlement Code: Settlement name:
Name of the head of the household: Name of the respondent:
2. Household Information
Sr. No.
Name
Relation with head of the household
Sex (M/F)
Age Education Main Activity Subsidiary activity
1 2 3 4 5 6 7
1 Head of the Household
1
2
3
4
5
6
7
8
9
Code (Relation with Head of the Household) (2)
Education (5) Activities (6-7)
1. Self 1. Illiterate 1. Salaried employment (regular waged)
2. Wife / Husband 2. Literate 2. Daily Wages employment (casual labour)
3. Son / Daughter 3. Primary education (Upto 8
th)
3. Self Employed (work in h/h enterprise)
4. Grandson / Grand Daughter 4. Matriculation/upto 12th 4. Domestic Worker at Fixed
Rate
5. Mother / Father 5. Graduate 5. Honorary Worker
6. Mother in law / Father in law 6. Certificate Course 6. Home-based paid work
7. Daughter in law 7. Others (Specify) 7. Home-based unpaid work (house manager)
8. Uncle/ Aunt 8. Attending educational institute
9. Others 9. Pensioners/remittance recipient
10. Brother / Sister / Nephew / Niece
10. Unemployed – due to disability
11. Unemployed – seeking work
12. Others - specify
Note for the following table: If there are more families within a household then ask the following questions to one family in detail. If there are more than 4 trips in a day then use an extra sheet of paper to record the same. Let the respondent specify the purpose and the mode of the trip. M1, M2, M3... = member 1, member 2 etc. T1, T2... = trip 1, trip2 and so on for the following table.

292
3. Member-wise trips in the previous working day (A)
No. of the member
Name
Trips
Where all did they travel on the last day?
Trip Purpose
Mode Distance
Time taken (excluding waiting time, if any)
Waiting time (if any)
Expenditure (if any, in Rs.)
How many days in a week?
From To
1 2 3 4 5 6 7 8 9
T1
T2
T3
T4
T1
T2
T3
T4
T1
T2
T3
T4
T1
T2
T3
Child1
T1
T2
T3
Child2
T1
T2
T3
(B) Work trips for People who are changing multiple locations in a day (ie. Self employed people, vendors etc.)
No.
Name
Which areas did they go on last working day?
Mode
Avg. time spent travelling
Avg. Distance travelled (In Km)
If motorised modes then avg. CNG/Diesal/Petrol use in a day.
Expenditure (if any, in Rs.)
How many days in a week?
(C) Road Accidents and risks
1 Have you or someone from the family been a victim of a road crash in last 5 years?
Yes No

293
2 If Yes Please give details
Case Mode used
Mode responsible for the crash
Kind of Injuries/disability
Cost of medical expenses
Days Hospitalized/ Unable to Work
1
2 4. Housing and Living Conditions
1 What is the type of
the house?
Kutcha Semi-Pucca Pucca
2 What is the material
used to build Walls
and Roof?
Wall Material Roof Material
3 What is the tenure
arrangement of the
house you live in?
Tick the right option
Owned Rented Shared
4 If it is Owned, How
much amount did you
pay for it?
Rs. __________________ in___________________(Year)
Have you done any
major investments in
this house? Tick the
right option
Yes No
If Yes, Please
indicate the following
, Purpose
Investment Year Amount (in Rs.)
5 If it is Rented, What
is the rent you pay
for it?
Rs. __________________ /Month
6 Tick and write the
appropriate spaces in
the house
Rooms _________ (no.) Separate Kitchen Floors_____ (no.)
7 What is the area of
the house you have
owned or rented?
Area_______________ ______________(unit)
Do you pay property tax? (Tick and Write the appropriate value)
Yes No Rs.____________
5. Urban Basic Services (Tick the Appropriate)
No. Household level services Tick if yes
1 Water supply Household Tap
2 Toilet Household toilet
3 Sewage Piped sewerage
4 SWM h/h collection
6 Electricity Connection h/h level electricity connection and meter

294
6. Income and Expenditure
1. What is your household
income?
Rs. _________________ /month, or Rs.
______________________/Year
2. Do you save a fixed
amount monthly?
Yes No If Yes Rs. _____________ /month
3 Where do you
generally put your
savings?
Bank Post-
Office
Others_______________(Specify)
Do you have an
insurance of any kind?
Yes No Premium Value Rs.
_____________
4 Household Expenditure
(Last day, month, year)
Daily
(Rs.)
Monthly
(Rs.)
Yearly (Rs.)
Food
Energy (electricity,
kerosene, cooking,
water heating etc.)
Clothes + Footwear
Education – School /
College fees etc.
Health
Transportation
Rent/ Instalments for
house loan if any
All other (consumer
durables, phone bills
etc.)
Debt repayment (on all
debts together)
9. Surveyor’s remarks
_________________________________________________________________________
_________________________________________________________________________
_________________________________________________________________________
_________________________________________________________________

295
A6. Statistical tests – detailed results
1. Mode/Distance – Equality of means tests – One way ANOVA (Table 5-7 and 5-8)
N Mean Std. Deviation
Std. Error
95% Confidence for Mean
Minimum Maximum
Lower Bound
Upper Bound
walking 1381 1.400 1.9576 .0527 1.297 1.504 .2 30.0
Cycle 445 4.661 4.2411 .2010 4.266 5.056 .5 25.0
AMTS 326 7.824 5.5318 .3064 7.221 8.426 .5 31.0
BRTS 14 6.821 4.3572 1.1645 4.306 9.337 1.5 16.0
Auto Rickshaw 109 5.904 4.0440 .3873 5.136 6.671 1.0 18.0
Shared Rickshaw 521 5.233 3.7490 .1642 4.911 5.556 1.0 23.0
M2W 119 7.067 5.7390 .5261 6.025 8.109 1.0 25.0
Hand Cart/ Pedal Rickshaw
67 4.845 3.6775 .4493 3.948 5.742 .3 10.0
Multiple Mode 395 9.608 7.9090 .3979 8.825 10.390 1.2 90.0
Total 3417 4.485 5.1941 .0889 4.311 4.659 .2 90.0
Test of Homogeneity of Variances
Levene Statistic df1 df2 Sig.
75.937 10 3406 .000
ANOVA
Sum of Squares df Mean Square F Sig.
Between Groups 29454.846 10 2945.485 159.995 .000
Within Groups 62704.099 3406 18.410
Total 92158.946 3416
Robust Tests of Equality of Means
Statistica df1 df2 Sig.
Welch 164.914 10 163.001 .000
Brown-Forsythe
125.832 10 472.120 .000
a. Asymptotically F distributed.

296
2. Mode-Distance across gender (independent T-test results) (Table 5-9) Sex N Mean Std. Deviation Std. Error Mean
Distance Male 2165 5.239 5.6899 .1223
Female 1252 3.181 3.8702 .1094
Independent Samples Test
Levene's Test for Equality of Variances
t-test for Equality of Means
F Sig. t df Sig. (2-tailed)
Mean Difference
Std. Error Difference
95% Confidence Interval of the Difference
Lower Upper
Equal variances assumed
105.712 .000 11.370 3415 .000 2.0586 .1810 1.7036 2.4136
Equal variances not assumed
12.548 3327.491 .000 2.0586 .1641 1.7369 2.3803
3. Correlations results – trip length, trip cost & hh income (Table 5-15) Descriptive Statistics
Mean Std. Deviation N
Household income, Monthly 6385.00 3959.304 3427
Distance 4.485 5.1941 3417
Expenditure 4.95 12.095 3417
Trip length Trip cost Household income,
Monthly
Trip length Pearson Correlation 1 0.436** 0.053
Sig. (2-tailed) - 0.000 0.082
N 3417 3408 3416
Trip cost Pearson Correlation 0.436** 1 0.019
Sig. (2-tailed) 0.000 - 0.269
N 3408 3417 3416
Household income, Monthly
Pearson Correlation 0.053 0.019 1
Sig. (2-tailed) 0.082 0.269 -
N 3416 3416 3427
** Correlation is significant at the 0.01 level (2-tailed).

297
4. Mode-Distance by trip purpose and locations - ANOVA (Table 5-19) Case Processing Summary
Cases Included Excluded Total
N % N % N %
Distance * Residential Location
3381 98.6% 47 1.4% 3428 100.0%
Report
Distance
Residential Location Work and nonwork Mean N Std. Deviation
Core city Work 4.429 437 3.9298
Education 1.628 211 2.3264
Other 3.219 842 3.5623
Total 3.349 1490 3.6365
Periphery Work 5.491 262 5.4091
Education 2.686 152 3.9124
Other 3.914 562 4.4883
Total 4.146 976 4.7585
Resettlement Work 9.268 249 7.9335
Education 3.133 144 2.8961
Other 6.275 522 6.6038
Total 6.595 915 6.8661
Total Work 5.993 948 5.9730
Education 2.372 507 3.0999
Other 4.250 1926 4.9827
Total 4.457 3381 5.1877
ANOVA Table
Sum of Squares Df Mean Square F Sig.
Distance * Residential Location
Betwn Groups 6106.544 2 3053.272 121.545 .000
Within Groups 84856.781 3378 25.120
Total 90963.325 3380
Measures of Association
Eta Eta Squared
Distance * Residential Location .259 .067
Household income, Monthly
Mode Mean N Std. Deviation
. 6000.00 2 .000
Walking 5789.15 1383 3659.201
Cycle 6586.07 445 3882.971
AMTS 6175.76 330 2970.210
BRTS 4814.29 14 3307.069
Auto Rickshaw 6718.18 110 3909.907
Shared Rickshaw 6479.35 523 3675.245
M2W 8593.22 118 3846.937
Hand Cart/ Pedal Rickshaw 7462.69 67 4427.286
Multiple Mode 7315.70 395 5053.652

298
A7. Ethical review application and approval
FACULTY OF ENVIRONMENT AND TECHNOLOGY RESEARCH ETHICS SUB-COMMITTEE APPLICATION FOR ETHICAL REVIEW This application form should be completed for any research involving human participants conducted in or by the University. “Human participants” include living human beings, human beings who have recently died (including body parts), embryos and foetuses, human tissue and bodily fluids, and human data and records. Research should not commence until written approval has been received from the University Research Ethics Committee (UREC) or Faculty Research Ethics Sub-Committee (FRESC). You should bear this in mind when setting a start date for the project. This form should be submitted electronically to the Secretary of the Faculty Research Ethics Sub-Committee, Research Office, Room 3Q29 ([email protected]) together with all supporting documentation (see below). A signed hard copy of the application form should also be submitted. You are advised to read the guidance at http://rbi.uwe.ac.uk/intranet/research/ethics/ on ‘How to complete an application for ethical approval’ in conjunction with this form. Please provide all the information requested and justify where appropriate – the spaces will expand to provide additional space. For further guidance please contact Jane Newton or Carolyn Webb in the Faculty Research Office at [email protected], or telephone 0117 328 3102 Project Details:
Project title
Exploring poverty-transport linkages: Mobility practices of the urban poor in Ahmedabad (India)
Project funder UWE (internal)
Proposed project start date
February 2010
Anticipated project end date
January 2013
Applicant Details:
Name of researcher (applicant)
Rutul Joshi
Faculty and School Centre for Transport and Society, Department of Planning

299
and Architecture, Faculty of Environment and Technology
Status (Staff/ Postgraduate Student/ Undergraduate Student)
PG Research Student
Email address [email protected]
Contact postal address
(temporary address) 7 Shraman Apartments, Prabhacolony, Usmanpura, Ahemedabad – 380014 (India)
Contact telephone number
+91-9913590009 (temporary)
(for completion by FETRESC)
Date received: FRESC reference number: Scrutiny – Cttee/CA Outcome: Applicant informed:
For All Applicants:
Has external ethics approval been sought for this research? Yes No - X
If yes, please supply details
Name of co-researchers (where applicable)
N.A.
For student applicants only:
Name of Supervisor (for PG and UG student applicants)¹
Prof. Graham Parkhurst, Centre for Transport and Society, Department of Planning & Architecture, Faculty of Environment and Technology.
Supervisor’s email address
Supervisor’s telephone number
+44 (0)117 32 82133
Details of course/degree for which research is being undertaken
PhD (Transport Studies)
¹For student applications supervisors should ensure that all of the following are satisfied before the study begins: The topic merits further research The student has the skills to carry out the research The participant information sheet or leaflet is appropriate The procedures for recruitment of research participants and obtaining informed consent are appropriate
Supervisor comments:
I agree that people living in poverty should not be classed as intrinsically vulnerable but welcome the use of existing outreach workers known to the interviewees to facilitate interactions with the researcher as a means to minimise associations of the research with authority.

300
Details of the proposed work:
1 Aims and objectives of, and background to the research:
The research aims to explore through a specific city case-study why the poor in developing countries make (or create) their travel and mobility choices and how these choices are influenced by urban transport planning and governance. Travel choices are short time decisions such as mode, destination, route and time or days of trips. Mobility choices are long term decisions such as residential and job location, vehicle ownership and preferences for modes etc.
Urban poverty is a gripping issue in the rapidly urbanizing developing world. Poverty consists of many interlocked aspects such as food security, livelihood, shelter security (including access to water and sanitation), health and education services, social networks etc. One such aspect is transport which determines the crucial links between housing and labour markets. However, transport and poverty linkages in developing cities are largely neglected both in transport studies and in development studies. The social and political approaches of viewing transportation as economy generating activity overrides other human development concerns (like poverty).
There has been a rapid growth in ownership and use of private motor vehicles in the developing cities along with increasing household incomes and escalating industrial-commercial activities in the city regions. Traditional ‘compact’ cities in developing world are beginning to become more dispersed with growing private motor vehicle use, whereas the majority of investments in the transport infrastructure facilitate motor vehicle use. The poor are generally dependent on public and human-powered transport modes which are constantly being degraded with the proliferation of private vehicle usage. Inadequate transport provision coupled with lack of accessibility and mobility affect the urban poor disproportionately compared to others in the city leading to deprivation and increasing vulnerability.
Transport system plays a crucial role in preventing or enabling the poor to access resources which are crucial for their daily activities. Transport-based mobility can be seen as negotiating choices and weighing options between residential mobility (moving residences over time) and labour market mobility (changing job).Relatively little is known about how the urban poor negotiate the complexities of their daily lives in relation to their mobility (and travel) choices viz. existing transport systems, land use structure and the planning policies. This research is one such attempt by understanding the linkages between their transport-mobility and various aspects of living in poverty.
2 Research methodology to be used (include a copy of the interview schedule/ questionnaire/observation schedule where appropriate):
This study has adopted an inductive research strategy based around attempting to ‘build theory’ following the data analysis. In the first instance, this study intends to unpack the ‘mobility of the poor’ as contextualised phenomena rooted in the space-time of everyday life. Further this study will also engage with the choices and attitudes of the poor people involving transport.
The research takes a mixed methods approach involving individual interviewing, quantitative household surveys and key-informants interviews along with secondary documentary analysis. The qualitative components highlight the ‘mobility choices’ or long term decisions related to residential location, employment locations, vehicle ownership and mode to work, including the strategies to cope with deprivation and the constraints of mobility.

301
Individual interviews: Individual interviews will be conducted as part of this component and it will be conducted in local language (Gujarati) with the adult respondents. Respondents will broadly be selected on the basis of varying residential location (including access to public transport), types of job profile (and distance to work), primary transport mode use representing gender balance and covering all communities in the selected low-income settlement.
Key informant interviews: individual interviews will be conducted where government officials, academicians, development professionals with the NGOs etc. will be the respondents.
Household Survey: Quantitative surveys will be used to test the claims arising from the qualitative analysis. The short-term decisions referred to as ‘travel choices’ - frequency of travel for various purposes, mode, destination, route and time of day of trip - will be captured in detail in the quantitative household surveys. This survey will be conducted in the household settings answered by the one adult member of the family.
3 Selection of participants: Will the participants be from any of the following groups?(Tick as appropriate)
Children under 18 Adults who are unable to consent for themselves² Adults who are unconscious, very severely ill or have a terminal illness Adults in emergency situations Adults with mental illness (particularly if detained under Mental Health Legislation)
Prisoners Young Offenders Healthy Volunteers (where procedures may be adverse or invasive) Those who could be considered to have a particularly dependent relationship with the investigator, e.g. those in care homes, medical students
Other vulnerable groups None of the above
(² Please note, the Mental Capacity Act requires all intrusive research involving adults who are unable to consent for themselves to be scrutinised by an NHS Local Research Ethics Committee – Please consult the Chair of your Faculty Research Ethics Sub-Committee or Amanda Longley or Alison Vaughton (RBI) for advice) If any of the above applies, please justify their inclusion in this research There will be no participants from the groups listed above. Note: If you are proposing to undertake research which involves contact with children or vulnerable adults you will generally need to hold a valid Criminal Records Bureau check. Please provide evidence of the check with your application.
4 Please explain how you will determine your sample size/recruitment strategy, and identify, approach and recruit your participants. Please explain arrangements made for participants who may not adequately understand verbal explanations or written information in English; Recruitment: As first step of this research, three municipal wards dominated by

302
informal settlements will be identified in the city of Ahmedabad based on the secondary data such as instances of poverty, varying location from the city centre and also by including views from the local researchers and NGOs. There are local NGOs working with various communities living in almost all informal settlements in Ahmedabad and the field workers of these NGOs belong to the same informal settlement. They become the key facilitators to identify the respondents for the qualitative interviews as they are aware of diversity of socio-economic situations in the settlement and in the municipal ward. Similarly, the local NGOs and their field workers would also help to conduct (quantitative) household surveys in the selected informal settlements. However, to begin with, many casual visits by the researcher in the selected settlements are anticipated for the careful consideration of the suggestion from the field staff members and to build a rapport with the community. Later on, the household surveys will be closely monitored by the researcher to ensure the randomness and to avoid the possible bias by the field staff. SAATH (saath.org) and SEWA (sewa.org) are two prominent NGOs working with the poor communities in Ahmedabad and an association with them is confirmed. For the key informant interviews, the respondents will be identified on the basis of their official positions or based on their publications or work in the related subject matter. Sampling: Quantitative sampling will represent statistically significant sample size based on number of households in the selected informal settlements. For instance, if a municipal ward consisting of 5000 or more households living in the informal settlements is selected then the total sample size for the ward would be around 250 households (about 5%). The household surveys will be conducted in three municipal wards. Stratified random sampling will be employed which will represent unbiased spatial representation as well as including every ‘nth’ house in the survey covering all the streets in the cluster of the selected settlement. The households within a municipal ward will be stratified on the basis of housing conditions defined by the Census of India. Housing condition (material used, structure etc.) can be used as a proxy to income levels to determine the poorer amongst the low-income settlements. Language: Main survey instruments (individual interviews and household survey) dealing with the low-income community are first prepared in the local language (Gujarati) and then translated in English mainly for academic deliberations. This is done to avoid academic jargon and to keep the flair of local language in the original survey instruments. All surveys will be conducted in the local language. The researcher is well familiar with the local language as a native speaker and he is expected to carry out all qualitative interviews by himself. For the quantitative component of household survey, the staff from the local NGOs will be recruited who are again native speakers. Almost all the respondents are expected to be familiar with the local language. The second widely spoken and understood language in Ahmedabad is Hindi. For the respondents who would prefer not to communicate in Gujarati (i.e. non-Gujarati speaking migrants) will be given the option of responding in Hindi. However, whether there is a need to translate the survey instruments in Hindi or not will only be considered after visiting the settlements and deliberating with the local field workers based on the possible number of non-Gujarati speaking respondents. The key-informants interviews can be conducted mainly in English as English is working language in the most government offices, non-governmental organisations and academic institutions. However, if the respondents wish to converse in the local language, it could be facilitated easily.
5 What risks (eg physical, psychological, social, legal or economic), if any, do the participants face in taking part in this research and how will you overcome these risks? The participants will not face any physical, legal or economic risks. Working with the

303
local NGOs is seen here as an advantage to mitigate any possible risk. All interviews/surveys will be within household settings or within the field office of the local NGOs in the semi-public zone such as semi-open spaces etc. The timings of the interviews/surveys will be fixed with the consent of the respondents. Any suitable timing in the day, which doesn’t create hindrance to the economic, social or household activities of the respondents, will be followed. Deliberation with the local field workers also help in being sensitive to local customs and etiquettes. As in common with all research involving human participants, the interviews/surveys carry some social/psychological risk as it involves sensitive issue such as poverty which may lead to possible embarrassing situation. However, the survey instruments are designed to capture such issues implicitly by putting transport or mobility related situations upfront and then, corroboratively constructing scenario about poverty. Some proxies of income such as housing conditions, regularity of employment, expenditure on recreation, vehicle ownerships, credit liabilities etc. will be employed to build scenarios. The survey instruments also avoid using terminology such as ‘poverty’ or ‘deprivation’ instead generic words such ‘situation’ or ‘condition’ are used in the local language to hint at their socio-economic attributes. However, if the respondents want to voice their opinion about their situation voluntarily without any prompts from the researcher then their opinions will be documented. It is important to make sure that respondents feel that their ‘voice is heard’ and any deliberate attempt by the researcher to avoid talking about subject such as poverty might lead to the possible social/psychological risk of being discontent about their ‘voices are not being heard’. One of the risks of conducting such studies is indirectly creating expectations of change or improvements in the individuals and in the communities. Sometimes such expectations can also shape participation and giving a response in the particular way. The participation information sheet would explain this upfront that this is an academic endeavour and neither it is aiming at immediate change in situation nor it is compelled to make any recommendations to the government authorities. In the recruitment process of the respondents also this will be mentioned clearly and repeatedly that the interviews or the surveys are conducted to hear people out and to understand the situation and any change or improvements are not the focus of this study. Unlike certain countries and cultures, giving financial remunerations to the respondents/participants is not practised in India. In absence of such arrangement, introducing remuneration to the respondents for this study alone may affect voluntariness of the response creating unnecessary contestation in the community. And the response itself can be skewed or exaggerated. Given the context, the financial remuneration can be disbursed to the community-based activities, common funds for festivities etc or as a contribution to the existing micro-finance or self-help groups. The decision regarding financial remuneration will be taken after a deliberation with the community leaders and the local NGO.
6 How will you obtain informed consent from the participants (include copies of participant information sheets and consent forms)? What arrangements are in place for participants to withdrawn from the study? Qualitative Interviews (including the key-informants interviews): For the interviews, the consent will be in the written form which will be duly signed. The respondent will be explained the purpose of the interview and shown the participant information sheet with an option of keeping a copy. Agreement to take part in the study and consent for audio recording will also be secured on a verbal basis by

304
ticking the consent form which will be signed by the respondent. If the interview is in the local language then it will be later transcribed professionally into English. Household Survey: For the household surveys, the consent will be in the written form which will be duly signed. Representative of a household approached will have the purpose of the survey explained and shown a copy of the participant information sheet in the local language. There will be an option to keep the sheet. Agreement to take part in the study will be secured on a verbal basis with an appropriate box on the form ticked to confirm this agreement has been solicited. Completion of the interview will include questions about consent regarding use of the data. However, there might be a concern with the literary level of the respondents and thus, the surveyors will be trained to ensure that they speak to the literate family member within the household. If there is no literate family member in the household (which is very rare given the urban literacy levels) then the surveyors will be trained to read out the necessary information to the participants and fill up the form for them. The presence and supervision of the local NGO representative will also help in this situation. Participant information sheets will be issued and signed copies of the consent forms will be retained. It will be made clear verbally that withdrawal is an option.
7 How have you addressed the health and safety concerns of the participants, researchers and any other people impacted by this study, that are greater than those encountered in normal day to day life? The following good practice procedures will be followed. Quantitative data collection – household survey:
The survey team will always work in at least pairs for the surveys, and will act as buddies for each other. Interviewers will be expected to report back in person or by phone at the end of the working day.
Team members will carry ID cards issued by their organisation (the local NGOs) and offer a phone number for their credentials to be checked.
Surveyors will only be expected to approach the respondents in the household settings only.
Risks of exposure to extreme hot weather will be managed by agreeing safe refuges such as covered areas, nearby restaurants, community spaces or the local NGO office. These will also be available for breaks and ‘comfort needs’. The respondents will be asked to carry water bottles/drinks to avoid any health risks due to hot weather.
Qualitative data collection – personal interviews:
The Researcher will carry ID card and offer his visiting card for his credentials to be checked.
The researcher will be accompanied by at least one person (research assistant) who will take notes in addition to the audio recording. The local field worker who will help with the appointment of the respondent is also likely to remain present during the interview.
Sensitivity to gender issues will be ensured. If a woman is being interviewed then it will ensure that the research assistant and the field worker are also women accompanying the researcher. It is observed from the past experience of the researcher that the female respondents in the informal settlements in Ahmedabad would not have problems in talking to a male interviewer. However, if the respondent is not comfortable in conversing with a male

305
interviewer (the researcher) then the accompanying research assistant will be trained to conduct the interview.
Interviews will be held at the semi-public places such as the local NGO office or on the plinth near the house or in the forecourt of the house.
8 Please explain how confidentiality will be maintained: Participants in the household survey and personal interviews will be kept completely anonymous. All documents related to data collection or describing the sampling process (which can identify with urban areas or informal settlements) will be kept in a secured way (See section 9). It will not be possible to offer anonymity for the key informants’ interviews as it will be known or knowable which individuals occupy which official or organisational roles. However confidentiality will be assured using the following arrangements, which will be carefully explained: interviewees will be advised to withhold information which they are not comfortable with sharing. If preferred by the interviewee, the researcher will also offer an additional step of asking respondents to confirm the transcripts or notes after the interview or to confirm specific quotes used in the thesis. However, all participants in the key-informant interviews will be informed professionals, and in general the research activity will be to document and to get insights into the events which are already in the public realm (i.e. local news paper, websites etc).
9 Please describe how you will store information collected in the course of your research and maintain data protection: Working copies of the interview/survey data will be disassociated with the personal identity of interviewees, except for a file relating personal data with ID numbers. This file will be encrypted, password protected, and placed on a secure area of the UWE network. Only the supervisors (Graham Parkhurst, Yusak Susilo and Charles Musselwhite) and the researcher (Rutul Joshi) will know the password. All the survey forms will be carefully destroyed after the data entry is over and random verification done.
10 How will the results of the research be reported and disseminated? (Select all that apply)
Peer reviewed journal Conference presentation Internal report Dissertation/Thesis Other publication Written feedback to research participants Presentation to participants or relevant community groups Other (Please specify below)
11 Are there any other ethical issues that have not been addressed which you would wish to bring to the attention of the Faculty and/or University Research Ethics Committee? Words such as ‘poverty’ or ‘poor people’ are used as part of the research as the main theme which may raise ethical questions given the cultural context of some academic environment. However, the usage of such words does not mean to denigrate or deprecate any individuals, groups or countries. The justification the usage lie in two strong reasons as explained below:
1. The phenomenon of ‘poverty’ is best explained by the usage of this term. Any

306
attempt to describe it as ‘social exclusion’, ‘(multiple) deprivation’, ‘economic vulnerability’ etc does not provide same meaning as the word ‘poverty’ and any such attempt either mislead or dilute the concept of poverty. There has been massive academic literature on poverty issues and for the settings of the developing countries, this concept is widely recognised and re-affirmed through various studies.
2. The international developmental organisations such UN agencies, the Work Bank, Asian/African Development Bank, Oxford Poverty and Human Development Initiative (OPHI) etc use the word ‘poverty’ as part of their wide variety of developmental program and research. The usage of word ‘poverty’ is also to identify with the larger international fraternity and their various activities.
Checklist Please complete before submitting form
Yes/No
Is a copy of the research proposal attached? Yes
Does the project involve human participants? Yes
Have you explained how you will select the participants? Yes
Have you described the ethical issues related to the well-being of participants?
Yes
Have you considered health and safety issues for the participants and researchers?
Yes
Have you included details of data protection including data storage? Yes
Have you described fully how you will maintain confidentiality? Yes
Is a participant consent form attached? Yes
Is a participant information sheet attached? Yes
Is a copy of your questionnaire attached? Yes
Where applicable, is evidence of a current CRB check attached? -
Declaration
Principal Investigator Rutul Joshi
Signed Rutul Joshi – as confirmed by email
Date 19th May 2011
Supervisor or module leader
Prof. Graham Parkhurst
Signed Prof. Graham Parkhurst – to be confirmed by email
Date 19th May 2011
The signed form should be emailed to the Secretary of the Faculty Research Ethics Committee at [email protected] . Any application by/on behalf of a student must be accompanied by an email from the student’s supervisor confirming the content of the form. A paper copy with signatures should be sent to Carolyn Webb in the Research Office, 3Q29, School of the Built and Natural Environment, Frenchay Campus within 5 working days of the electronic version. Attachments:
1. Ethical review application form
2. Research Proposal (detailed version in form of first year progression report)
3. Participant Consent form
4. Participant Information Sheet
5. Questionnaire(s)
a. Draft interview guide
b. Household survey questionnaire (will be submitted at the later date)

307
c.
FACULTY OF ENVIRONMENT & TECHNOLOGY FACULTY RESEARCH ETHICS COMMITTEE Your ethics application was considered under Chair’s Action.
Committee Reference No.
FETREC10-11/30
Name of Applicant
Rutul Joshi
Home Faculty
FET
Title of Proposal
Exploring poverty-transport linkages: Mobility practices of the urban poor in Ahmedabad (India)
Outcome
The Chair is content to approve the application subject to the following:
You notify the Faculty Research Ethics sub Committee in advance if you wish to make significant amendments to the original application;
You notify the Faculty Research Ethics sub Committee if you terminate your research earlier than planned;
You address the three conditions below
Comments The following additional reviewer comments were reported. They are intended to be helpful for you to consider as you finalise your methodology and implement the research. Reviewer Comments On the whole this is a well thought through and sensitive application which takes account of the major issues and sensitivities with this kind of research. The applicant is to be applauded for dealing with the issues so well. However, the following points need to be addressed to the satisfaction of the Chair of the committee before the research begins, particularly the first point relating to consent and the participant information sheet:
Participant information sheet:
The information sheet should normally inform the participant about what taking part will entail such as how long will it take, what form it will take etcetera. This sort of basic information needs to be included otherwise their consent is partial and the information sheet as it currently stands is more of an introduction than an explanation of what the research will entail. The draft interview guide introduction states, ‘Remind participant of the following from the participant information sheet’ and goes on to list,‘Purpose of the research and how it is conducted, time taken etc’ and ‘What happens to the material collected’. However, the information sheet does not

308
contain this information.
Condition 1: I would suggest the information sheet should be extended to include this sort of information to ensure when they sign the consent form they are doing so in a fully informed way.
This is poorly phrased in places (particularly the first and second paragraphs) and given that this is what will be read by the participants (translated in most cases),I think it needs to be addressed.
Condition 2: This original version should be corrected/made clearer. This is an ethical issue in the sense that the information presented to respondents should be as clear as possible and if I think it is unclear then it is likely also to be unclear to the participant.
Application form:
Q6. The section on verbal consent is confusing as it appears to imply verbal consent will be the norm (‘Agreement to take part in the study will be secured on a verbal basis’) but then goes on to state that ‘Participant information sheets and consent forms will be issued and signed copies retained and it will be made clear verbally that withdrawal is an option’. Condition 3: please clarify whether consent is always written or whether verbal consent will be allowable. Consent form: The name of the person to contact in the UK should also be given (i.e. Professor Parkhurst?)
Date
24/5/2011
Signed
Prof Glenn Lyons Chair, Faculty Research Ethics Committee
Copy to Graham Parkhurst