india logistics & warehousing india logistics & warehousing
80
INDIA LOGISTICS & WAREHOUSING REPORT 2014 A DEFINITIVE VIEW ON MUMBAI AND PUNE WAREHOUSING MARKETS RESEARCH INDIA LOGISTICS & WAREHOUSING R E P O RT 2014 A DEFINITIVE VIEW ON MUMBAI AND PUNE WAREHOUSING MARKETS RESEARCH
Transcript of india logistics & warehousing india logistics & warehousing
INDIA LOGISTICS & WAREHOUSINGREPORT 2014
A DEFINITIVE VIEW ON MUMBAI AND PUNE WAREHOUSING MARKETS
RESEARCH
INDIA LOGISTICS & WAREHOUSINGREPORT 2014
A DEFINITIVE VIEW ON MUMBAI AND PUNE WAREHOUSING MARKETS
RESEARCH


FOREWORD
Indian businesses for long have ignored the significance of the logistics sector that continues to remain one of the most under invested sectors in the country. While logistics undertakes the critical role of connecting the production centres with the markets, the inefficiencies in managing it could lead to severe disruption in the entire supply chain network. In India, the experience with regards to this sector has not been very encouraging, thus leading to colossal losses during transportation, distribution and storage of goods.
Today, given the substantial growth in organised retail and manufacturing activities in India, the warehousing market has gradually gained steam within the supply cycle. This was also made possible due to the availability of affordable e-commerce options that further drove demand for warehousing, thereby giving huge impetus to the overall market.
Thus, keeping in view its potential to cater to the current business needs, we are happy to share with you, a comprehensive analysis of the warehousing markets of Pune and Mumbai through our first ever India Logistics & Warehousing Report 2014.
The report is primarily targeted towards institutional investors, real estate developers, high net-worth individuals (HNIs) and private equity funds that plan to participate in the investment opportunities provided by the warehousing sector but have limited understanding of its various nuances. Additionally, the report also serves as a handbook for industry stakeholders that include developers, logistic players and government agencies, among others.
Hope you find the information relevant.
I look forward to hearing from you.
Best Wishes,
Shishir BaijalChairman & Managing DirectorKnight Frank India
4
EXECUTIVE SUMMARY
Indian businesses for long have ignored the significance of the logistics sector that continues to remain one of the most under invested sectors in the country. While logistics undertakes the critical role of connecting the production centres with consumption markets, inefficiencies in managing it could lead to severe disruption in the entire supply chain network. In India, the experience with regards to this sector has not been very encouraging, thus leading to colossal losses during transportation, distribution and storage of goods. In order to attract fresh investment, an in-depth study is needed on the various intricacies of this sector with special emphasis on the demand, feasibility and investor return aspects.
The logistics sector can be broadly classified into three areas-transportation, distribution and storage. While in India, the transportation and distribution sectors have traditionally been a part of many studies with numerous reports and findings affiliated with the sectors. However, it is the storage and warehousing sectors that have mainly remained under-researched. Although the
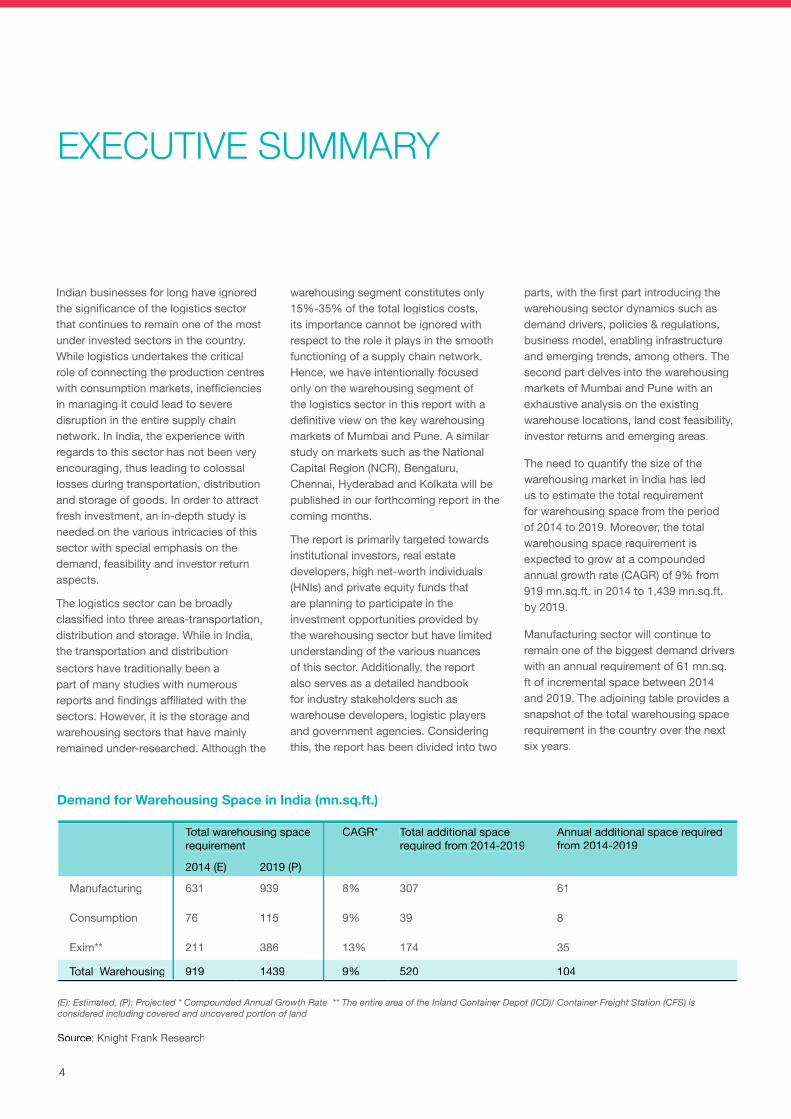
warehousing segment constitutes only 15%-35% of the total logistics costs, its importance cannot be ignored with respect to the role it plays in the smooth functioning of a supply chain network. Hence, we have intentionally focused only on the warehousing segment of the logistics sector in this report with a definitive view on the key warehousing markets of Mumbai and Pune. A similar study on markets such as the National Capital Region (NCR), Bengaluru, Chennai, Hyderabad and Kolkata will be published in our forthcoming report in the coming months.
The report is primarily targeted towards institutional investors, real estate developers, high net-worth individuals (HNIs) and private equity funds that are planning to participate in the investment opportunities provided by the warehousing sector but have limited understanding of the various nuances of this sector. Additionally, the report also serves as a detailed handbook for industry stakeholders such as warehouse developers, logistic players and government agencies. Considering this, the report has been divided into two
(E): Estimated, (P): Projected * Compounded Annual Growth Rate ** The entire area of the Inland Container Depot (ICD)/ Container Freight Station (CFS) is considered including covered and uncovered portion of land
Source: Knight Frank Research
Demand for Warehousing Space in India (mn.sq.ft.)
Total warehousing space requirement
CAGR* Total additional space required from 2014-2019
Annual additional space required from 2014-2019
2014 (E) 2019 (P)
Manufacturing 631 939 8% 307 61
Consumption 76 115 9% 39 8
Exim** 211 386 13% 174 35
Total Warehousing 919 1439 9% 520 104
parts, with the first part introducing the warehousing sector dynamics such as demand drivers, policies & regulations, business model, enabling infrastructure and emerging trends, among others. The second part delves into the warehousing markets of Mumbai and Pune with an exhaustive analysis on the existing warehouse locations, land cost feasibility, investor returns and emerging areas.
The need to quantify the size of the warehousing market in India has led us to estimate the total requirement for warehousing space from the period of 2014 to 2019. Moreover, the total warehousing space requirement is expected to grow at a compounded annual growth rate (CAGR) of 9% from 919 mn.sq.ft. in 2014 to 1,439 mn.sq.ft. by 2019.
Manufacturing sector will continue to remain one of the biggest demand drivers with an annual requirement of 61 mn.sq.ft of incremental space between 2014 and 2019. The adjoining table provides a snapshot of the total warehousing space requirement in the country over the next six years.
4
EXECUTIVE SUMMARY
Indian businesses for long have ignored the significance of the logistics sector that continues to remain one of the most under invested sectors in the country. While logistics undertakes the critical role of connecting the production centres with consumption markets, inefficiencies in managing it could lead to severe disruption in the entire supply chain network. In India, the experience with regards to this sector has not been very encouraging, thus leading to colossal losses during transportation, distribution and storage of goods. In order to attract fresh investment, an in-depth study is needed on the various intricacies of this sector with special emphasis on the demand, feasibility and investor return aspects.
The logistics sector can be broadly classified into three areas-transportation, distribution and storage. While in India, the transportation and distribution sectors have traditionally been a part of many studies with numerous reports and findings affiliated with the sectors. However, it is the storage and warehousing sectors that have mainly remained under-researched. Although the
warehousing segment constitutes only 15%-35% of the total logistics costs, its importance cannot be ignored with respect to the role it plays in the smooth functioning of a supply chain network. Hence, we have intentionally focused only on the warehousing segment of the logistics sector in this report with a definitive view on the key warehousing markets of Mumbai and Pune. A similar study on markets such as the National Capital Region (NCR), Bengaluru, Chennai, Hyderabad and Kolkata will be published in our forthcoming report in the coming months.
The report is primarily targeted towards institutional investors, real estate developers, high net-worth individuals (HNIs) and private equity funds that are planning to participate in the investment opportunities provided by the warehousing sector but have limited understanding of the various nuances of this sector. Additionally, the report also serves as a detailed handbook for industry stakeholders such as warehouse developers, logistic players and government agencies. Considering this, the report has been divided into two
(E): Estimated, (P): Projected * Compounded Annual Growth Rate ** The entire area of the Inland Container Depot (ICD)/ Container Freight Station (CFS) is considered including covered and uncovered portion of land
Source: Knight Frank Research
Demand for Warehousing Space in India (mn.sq.ft.)
Total warehousing space requirement
CAGR* Total additional space required from 2014-2019
Annual additional space required from 2014-2019
2014 (E) 2019 (P)
Manufacturing 631 939 8% 307 61
Consumption 76 115 9% 39 8
Exim** 211 386 13% 174 35
Total Warehousing 919 1439 9% 520 104
parts, with the first part introducing the warehousing sector dynamics such as demand drivers, policies & regulations, business model, enabling infrastructure and emerging trends, among others. The second part delves into the warehousing markets of Mumbai and Pune with an exhaustive analysis on the existing warehouse locations, land cost feasibility, investor returns and emerging areas.
The need to quantify the size of the warehousing market in India has led us to estimate the total requirement for warehousing space from the period of 2014 to 2019. Moreover, the total warehousing space requirement is expected to grow at a compounded annual growth rate (CAGR) of 9% from 919 mn.sq.ft. in 2014 to 1,439 mn.sq.ft. by 2019.
Manufacturing sector will continue to remain one of the biggest demand drivers with an annual requirement of 61 mn.sq.ft of incremental space between 2014 and 2019. The adjoining table provides a snapshot of the total warehousing space requirement in the country over the next six years.
5
RESEARCHINDIA LOGISTICS &
WAREHOUSING REPORT
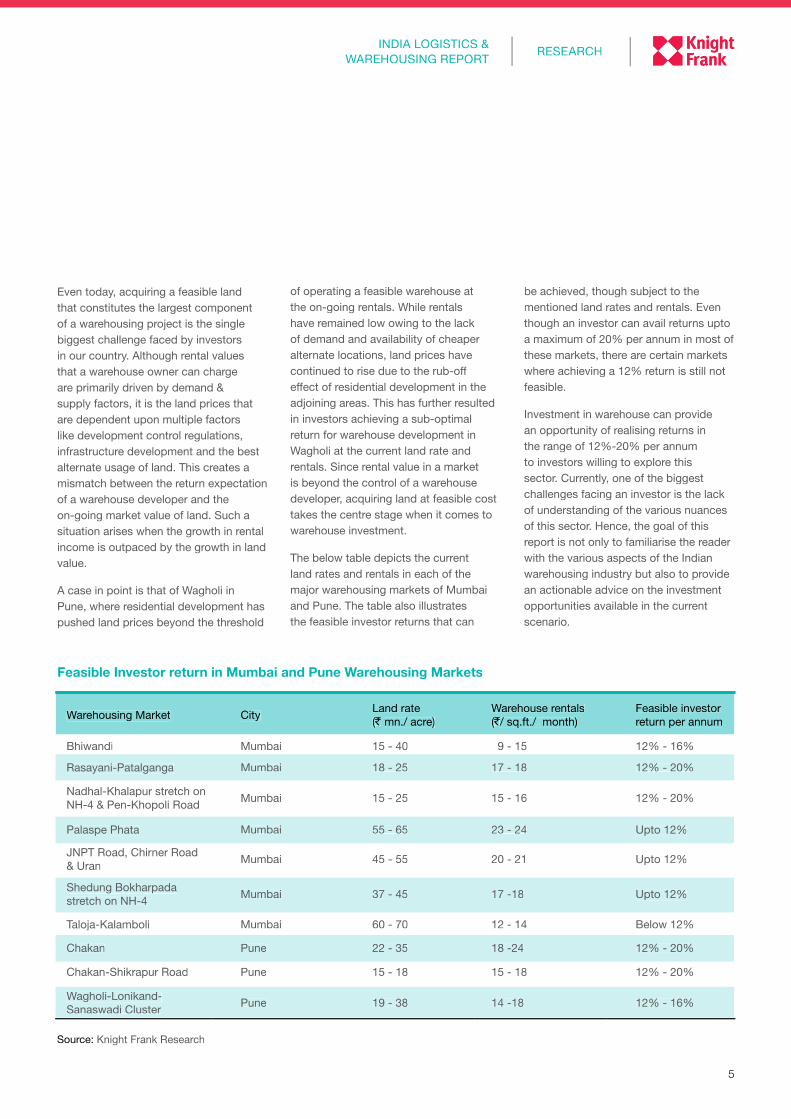
Even today, acquiring a feasible land that constitutes the largest component of a warehousing project is the single biggest challenge faced by investors in our country. Although rental values that a warehouse owner can charge are primarily driven by demand & supply factors, it is the land prices that are dependent upon multiple factors like development control regulations, infrastructure development and the best alternate usage of land. This creates a mismatch between the return expectation of a warehouse developer and the on-going market value of land. Such a situation arises when the growth in rental income is outpaced by the growth in land value.
A case in point is that of Wagholi in Pune, where residential development has pushed land prices beyond the threshold
of operating a feasible warehouse at the on-going rentals. While rentals have remained low owing to the lack of demand and availability of cheaper alternate locations, land prices have continued to rise due to the rub-off effect of residential development in the adjoining areas. This has further resulted in investors achieving a sub-optimal return for warehouse development in Wagholi at the current land rate and rentals. Since rental value in a market is beyond the control of a warehouse developer, acquiring land at feasible cost takes the centre stage when it comes to warehouse investment.
The below table depicts the current land rates and rentals in each of the major warehousing markets of Mumbai and Pune. The table also illustrates the feasible investor returns that can
be achieved, though subject to the mentioned land rates and rentals. Even though an investor can avail returns upto a maximum of 20% per annum in most of these markets, there are certain markets where achieving a 12% return is still not feasible.
Investment in warehouse can provide an opportunity of realising returns in the range of 12%-20% per annum to investors willing to explore this sector. Currently, one of the biggest challenges facing an investor is the lack of understanding of the various nuances of this sector. Hence, the goal of this report is not only to familiarise the reader with the various aspects of the Indian warehousing industry but also to provide an actionable advice on the investment opportunities available in the current scenario.
Feasible Investor return in Mumbai and Pune Warehousing Markets
Warehousing Market City Land rate(` mn./ acre)
Warehouse rentals (`/ sq.ft./ month)
Feasible investor return per annum
Bhiwandi Mumbai 15 - 40 9 - 15 12% - 16%
Rasayani-Patalganga Mumbai 18 - 25 17 - 18 12% - 20%
Nadhal-Khalapur stretch on NH-4 & Pen-Khopoli Road Mumbai 15 - 25 15 - 16 12% - 20%
Palaspe Phata Mumbai 55 - 65 23 - 24 Upto 12%
JNPT Road, Chirner Road & Uran Mumbai 45 - 55 20 - 21 Upto 12%
Shedung Bokharpada stretch on NH-4 Mumbai 37 - 45 17 -18 Upto 12%
Taloja-Kalamboli Mumbai 60 - 70 12 - 14 Below 12%
Chakan Pune 22 - 35 18 -24 12% - 20%
Chakan-Shikrapur Road Pune 15 - 18 15 - 18 12% - 20%
Wagholi-Lonikand-Sanaswadi Cluster Pune 19 - 38 14 -18 12% - 16%
Source: Knight Frank Research
5
RESEARCHINDIA LOGISTICS &
WAREHOUSING REPORT
Even today, acquiring a feasible land that constitutes the largest component of a warehousing project is the single biggest challenge faced by investors in our country. Although rental values that a warehouse owner can charge are primarily driven by demand & supply factors, it is the land prices that are dependent upon multiple factors like development control regulations, infrastructure development and the best alternate usage of land. This creates a mismatch between the return expectation of a warehouse developer and the on-going market value of land. Such a situation arises when the growth in rental income is outpaced by the growth in land value.
A case in point is that of Wagholi in Pune, where residential development has pushed land prices beyond the threshold
of operating a feasible warehouse at the on-going rentals. While rentals have remained low owing to the lack of demand and availability of cheaper alternate locations, land prices have continued to rise due to the rub-off effect of residential development in the adjoining areas. This has further resulted in investors achieving a sub-optimal return for warehouse development in Wagholi at the current land rate and rentals. Since rental value in a market is beyond the control of a warehouse developer, acquiring land at feasible cost takes the centre stage when it comes to warehouse investment.
The below table depicts the current land rates and rentals in each of the major warehousing markets of Mumbai and Pune. The table also illustrates the feasible investor returns that can
be achieved, though subject to the mentioned land rates and rentals. Even though an investor can avail returns upto a maximum of 20% per annum in most of these markets, there are certain markets where achieving a 12% return is still not feasible.
Investment in warehouse can provide an opportunity of realising returns in the range of 12%-20% per annum to investors willing to explore this sector. Currently, one of the biggest challenges facing an investor is the lack of understanding of the various nuances of this sector. Hence, the goal of this report is not only to familiarise the reader with the various aspects of the Indian warehousing industry but also to provide an actionable advice on the investment opportunities available in the current scenario.
Feasible Investor return in Mumbai and Pune Warehousing Markets
Warehousing Market City Land rate(` (` ( mn./ acre)
Warehouse rentals(`(`( / sq.ft./ month)`/ sq.ft./ month)`
Feasible investor return per annum
Bhiwandi Mumbai 15 - 40 9 - 15 12% - 16%
Rasayani-Patalganga Mumbai 18 - 25 17 - 18 12% - 20%
Nadhal-Khalapur stretch on NH-4 & Pen-Khopoli Road Mumbai 15 - 25 15 - 16 12% - 20%
Palaspe Phata Mumbai 55 - 65 23 - 24 Upto 12%
JNPT Road, Chirner Road & Uran Mumbai 45 - 55 20 - 21 Upto 12%
Shedung Bokharpada stretch on NH-4 Mumbai 37 - 45 17 -18 Upto 12%
Taloja-Kalamboli Mumbai 60 - 70 12 - 14 Below 12%
Chakan Pune 22 - 35 18 -24 12% - 20%
Chakan-Shikrapur Road Pune 15 - 18 15 - 18 12% - 20%
Wagholi-Lonikand-Sanaswadi Cluster Pune 19 - 38 14 -18 12% - 16%
Source: Knight Frank Research
TABLE OF CONTENTSTABLE OF CONTENTS
Logistics & Warehousing in India 8
Mumbai Metropolitan Region 48
Pune Metropolitan Region 68
1. Evolution and Overview of the Logistics & Warehousing Sector in India a) Background b) Evolution of Logistics in India c) Global Comparison (US, China and India) d) Demand Drivers of India’s Logistics Sector e) Warehousing Space Demand and Market Size f) Issues and Challenges
2. Policy and regulations a) WDR Act b) FTWZ Act c) Impact of GST on Warehousing Industry
3. Structure and Business Model of Warehousing Industry a) Types of Warehousing Services b) Warehouses as Distribution Centres c) Investment Aspect of Warehouses
4. Infrastructure as an enabler a) Existing Network of Road, Rail and Port Infrastructure b) Major upcoming Infrastructure Projects
5. Future Supply Chain - A case study on Nagpur Distribution Centre
6. Emerging Trends in Warehousing Industry
1. Introduction
2. Major Industrial and Warehousing Clusters in MMR
3. Significant upcoming Infrastructure Projects
a) Virar-Alibaug Multi-modal Corridor
b) Impact of DMIC and DFC on MMR
4. Bhiwandi Warehousing Hub
5. Panvel Warehousing Hub
1. Introduction
2. Major industrial and Warehousing Clusters in Pune
3. Chakan Warehousing Hub
4. Wagholi-Lonikand-Sanaswadi Warehousing Cluster
Logistics & Warehousing in India 8
Mumbai Metropolitan Region 48
Pune Metropolitan Region 68
1. Evolution and Overview of the Logistics & Warehousing Sector in Indiaa) Backgroundb) Evolution of Logistics in Indiac) Global Comparison (US, China and India)d) Demand Drivers of India’s Logistics Sectore) Warehousing Space Demand and Market Sizef) Issues and Challenges
2. Policy and regulationsa) WDR Actb) FTWZ Actc) Impact of GST on Warehousing Industry
3. Structure and Business Model of Warehousing Industrya) Types of Warehousing Services b) Warehouses as Distribution Centresc) Investment Aspect of Warehouses
4. Infrastructure as an enablera) Existing Network of Road, Rail and Port Infrastructureb) Major upcoming Infrastructure Projects
5. Future Supply Chain - A case study on Nagpur Distribution Centre
6. Emerging Trends in Warehousing Industry
1. Introduction
2. Major Industrial and Warehousing Clusters in MMR
3. Significant upcoming Infrastructure Projects
a) Virar-Alibaug Multi-modal Corridor
b) Impact of DMIC and DFC on MMR
4. Bhiwandi Warehousing Hub
5. Panvel Warehousing Hub
1. Introduction
2. Major industrial and Warehousing Clusters in Pune
3. Chakan Warehousing Hub
4. Wagholi-Lonikand-Sanaswadi Warehousing Cluster
8
LOGISTICS & WAREHOUSING IN INDIALOGISTICS & WAREHOUSINGIN INDIA
9
RESEARCHINDIA LOGISTICS &
WAREHOUSING REPORT
EVOLUTION AND OVERVIEW OF THE LOGISTICS & WAREHOUSING SECTOR IN INDIA
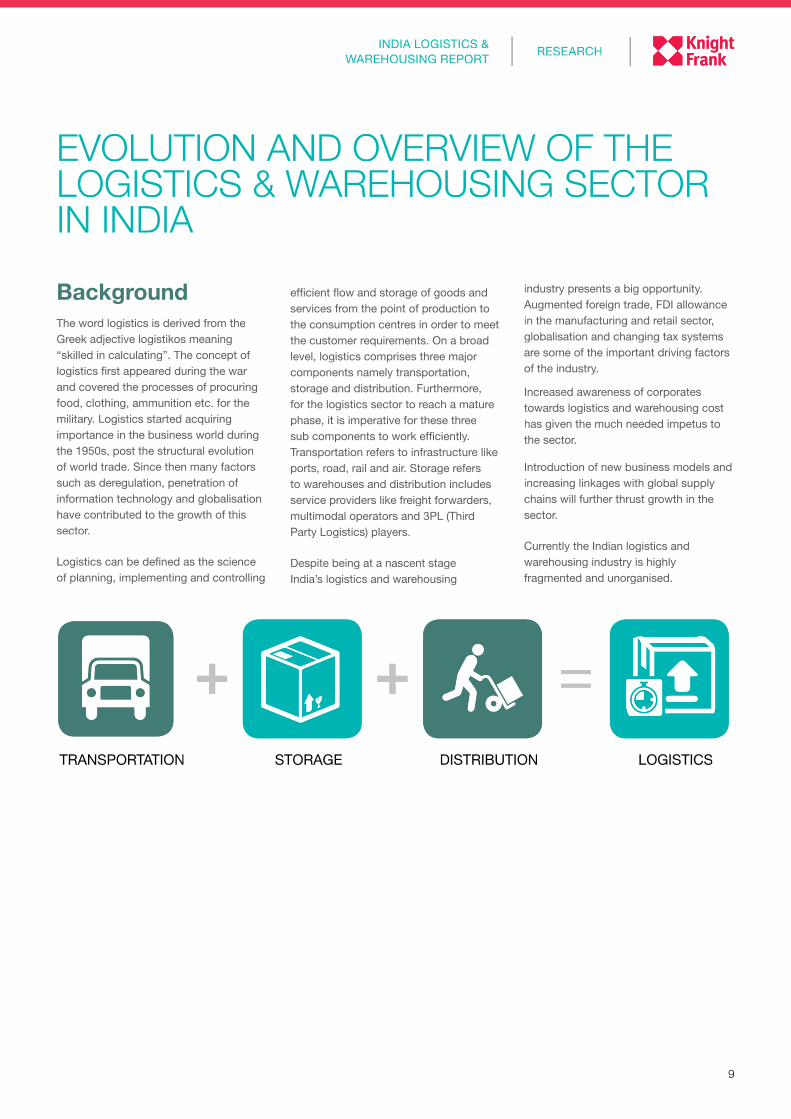
BackgroundThe word logistics is derived from the Greek adjective logistikos meaning “skilled in calculating”. The concept of logistics first appeared during the war and covered the processes of procuring food, clothing, ammunition etc. for the military. Logistics started acquiring importance in the business world during the 1950s, post the structural evolution of world trade. Since then many factors such as deregulation, penetration of information technology and globalisation have contributed to the growth of this sector.
Logistics can be defined as the science of planning, implementing and controlling
TRANSPORTATION STORAGE DISTRIBUTION LOGISTICS
efficient flow and storage of goods and services from the point of production to the consumption centres in order to meet the customer requirements. On a broad level, logistics comprises three major components namely transportation, storage and distribution. Furthermore, for the logistics sector to reach a mature phase, it is imperative for these three sub components to work efficiently. Transportation refers to infrastructure like ports, road, rail and air. Storage refers to warehouses and distribution includes service providers like freight forwarders, multimodal operators and 3PL (Third Party Logistics) players.
Despite being at a nascent stage India’s logistics and warehousing
industry presents a big opportunity. Augmented foreign trade, FDI allowance in the manufacturing and retail sector, globalisation and changing tax systems are some of the important driving factors of the industry.
Increased awareness of corporates towards logistics and warehousing cost has given the much needed impetus to the sector.
Introduction of new business models and increasing linkages with global supply chains will further thrust growth in the sector.
Currently the Indian logistics and warehousing industry is highly fragmented and unorganised.
9
RESEARCHINDIA LOGISTICS &
WAREHOUSING REPORT
EVOLUTION AND OVERVIEW OF THE LOGISTICS & WAREHOUSING SECTOR IN INDIA
BackgroundThe word logistics is derived from the Greek adjective logistikos meaning “skilled in calculating”. The concept of logistics first appeared during the war and covered the processes of procuring food, clothing, ammunition etc. for the military. Logistics started acquiring importance in the business world during the 1950s, post the structural evolution of world trade. Since then many factors such as deregulation, penetration of information technology and globalisation have contributed to the growth of this sector.
Logistics can be defined as the science of planning, implementing and controlling
TRANSPORTATION STORAGE DISTRIBUTION LOGISTICS
efficient flow and storage of goods and services from the point of production to the consumption centres in order to meet the customer requirements. On a broad level, logistics comprises three major components namely transportation, storage and distribution. Furthermore, for the logistics sector to reach a mature phase, it is imperative for these three sub components to work efficiently. Transportation refers to infrastructure like ports, road, rail and air. Storage refers to warehouses and distribution includes service providers like freight forwarders, multimodal operators and 3PL (Third Party Logistics) players.
Despite being at a nascent stage India’s logistics and warehousing
industry presents a big opportunity. Augmented foreign trade, FDI allowance in the manufacturing and retail sector, globalisation and changing tax systems are some of the important driving factors of the industry.
Increased awareness of corporates towards logistics and warehousing cost has given the much needed impetus to the sector.
Introduction of new business models and increasing linkages with global supply chains will further thrust growth in the sector.
Currently the Indian logistics and warehousing industry is highly fragmented and unorganised.
10
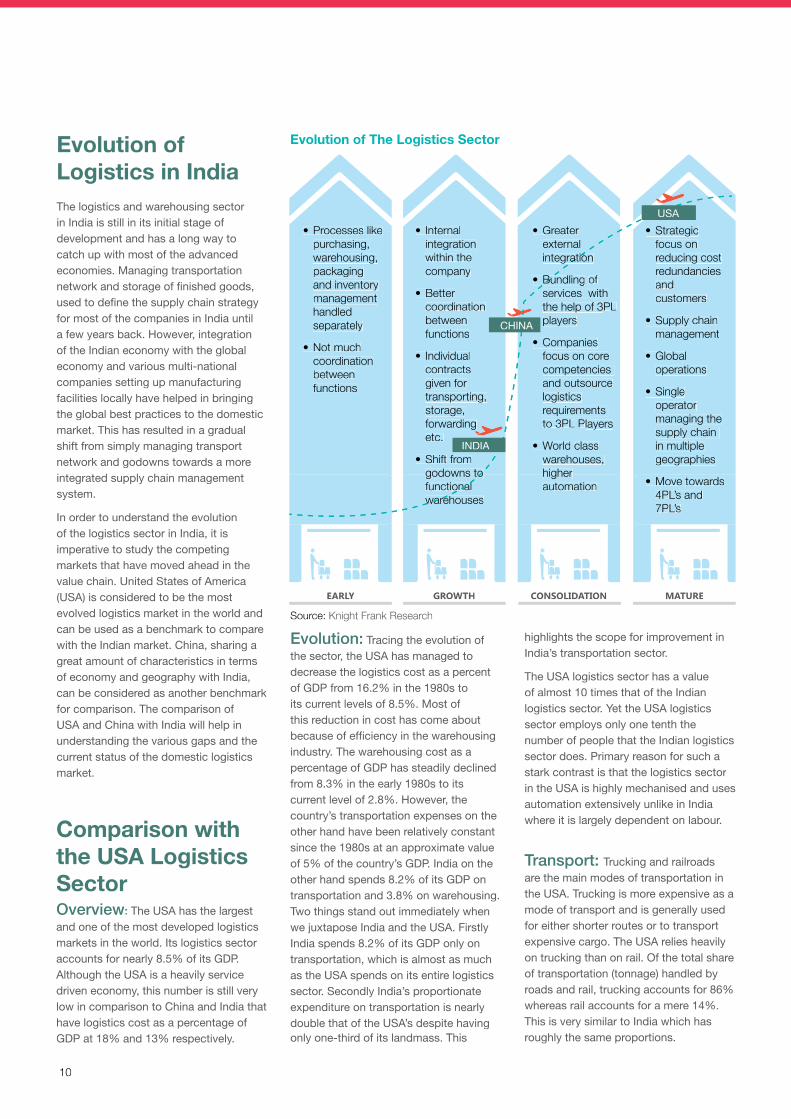
Comparison with the USA Logistics SectorOverview: The USA has the largest and one of the most developed logistics markets in the world. Its logistics sector accounts for nearly 8.5% of its GDP. Although the USA is a heavily service driven economy, this number is still very low in comparison to China and India that have logistics cost as a percentage of GDP at 18% and 13% respectively.
Evolution of Logistics in IndiaThe logistics and warehousing sector in India is still in its initial stage of development and has a long way to catch up with most of the advanced economies. Managing transportation network and storage of finished goods, used to define the supply chain strategy for most of the companies in India until a few years back. However, integration of the Indian economy with the global economy and various multi-national companies setting up manufacturing facilities locally have helped in bringing the global best practices to the domestic market. This has resulted in a gradual shift from simply managing transport network and godowns towards a more integrated supply chain management system.
In order to understand the evolution of the logistics sector in India, it is imperative to study the competing markets that have moved ahead in the value chain. United States of America (USA) is considered to be the most evolved logistics market in the world and can be used as a benchmark to compare with the Indian market. China, sharing a great amount of characteristics in terms of economy and geography with India, can be considered as another benchmark for comparison. The comparison of USA and China with India will help in understanding the various gaps and the current status of the domestic logistics market.
Source: Knight Frank Research
•Processeslikepurchasing, warehousing, packaging and inventory management handled separately
•Notmuchcoordination between functions
• Internalintegration within the company
•Better coordination between functions
• Individualcontracts given for transporting, storage, forwarding etc.
•Shiftfrom godowns to functional warehouses
•Strategicfocus on reducing cost redundancies and customers
•Supplychainmanagement
•Globaloperations
•Singleoperator managing the supply chain in multiple geographies
•Movetowards4PL’s and 7PL’s
EARLY GROWTH CONSOLIDATION MATURE
INDIA
USA•Greater
external integration
•Bundlingofservices with the help of 3PL players
•Companiesfocus on core competencies and outsource logistics requirements to 3PL Players
•Worldclasswarehouses, higher automation
Evolution of The Logistics Sector
Evolution: Tracing the evolution of the sector, the USA has managed to decrease the logistics cost as a percent of GDP from 16.2% in the 1980s to its current levels of 8.5%. Most of this reduction in cost has come about because of efficiency in the warehousing industry. The warehousing cost as a percentage of GDP has steadily declined from 8.3% in the early 1980s to its current level of 2.8%. However, the country’s transportation expenses on the other hand have been relatively constant since the 1980s at an approximate value of 5% of the country’s GDP. India on the other hand spends 8.2% of its GDP on transportation and 3.8% on warehousing.Two things stand out immediately when we juxtapose India and the USA. Firstly India spends 8.2% of its GDP only on transportation, which is almost as much as the USA spends on its entire logistics sector. Secondly India’s proportionate expenditure on transportation is nearly double that of the USA’s despite having only one-third of its landmass. This
highlights the scope for improvement in India’s transportation sector.
The USA logistics sector has a value of almost 10 times that of the Indian logistics sector. Yet the USA logistics sector employs only one tenth the number of people that the Indian logistics sector does. Primary reason for such a stark contrast is that the logistics sector in the USA is highly mechanised and uses automation extensively unlike in India where it is largely dependent on labour.
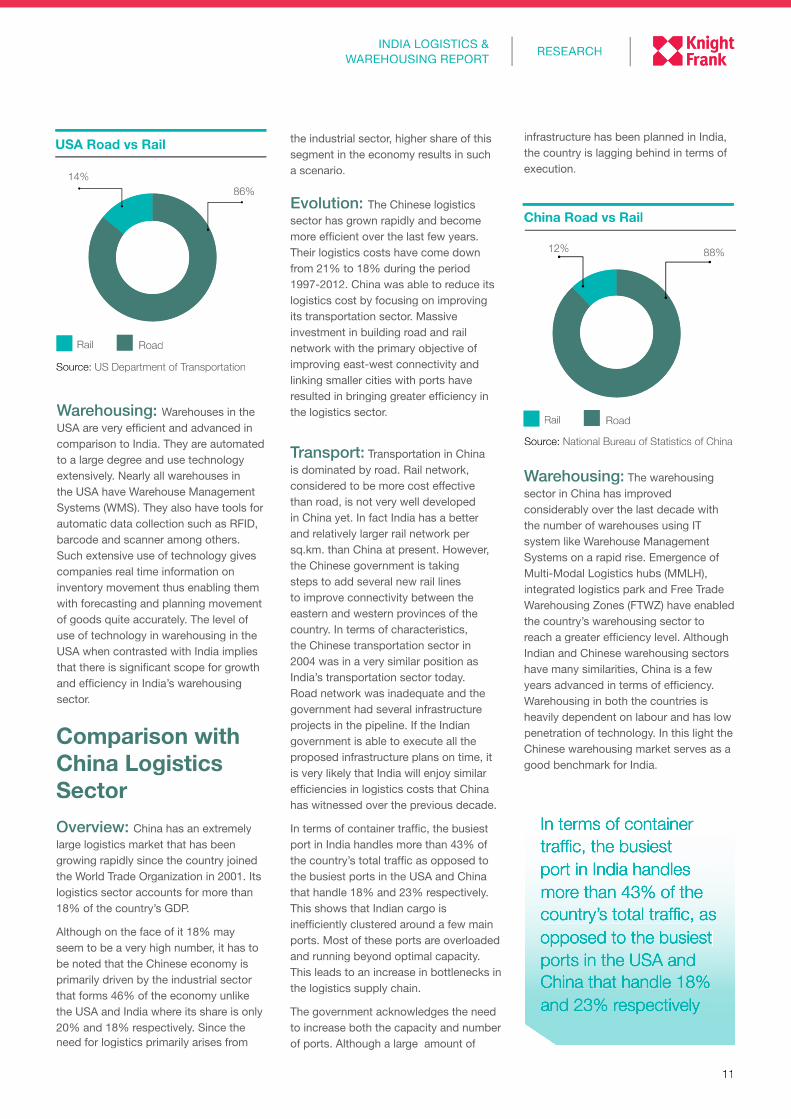
Transport: Trucking and railroads are the main modes of transportation in the USA. Trucking is more expensive as a mode of transport and is generally used for either shorter routes or to transport expensive cargo. The USA relies heavily on trucking than on rail. Of the total share of transportation (tonnage) handled by roads and rail, trucking accounts for 86% whereas rail accounts for a mere 14%. This is very similar to India which has roughly the same proportions.
CHINA
10
Comparison with the USA Logistics SectorOverview: The USA has the largest and one of the most developed logistics markets in the world. Its logistics sector accounts for nearly 8.5% of its GDP. Although the USA is a heavily service driven economy, this number is still very low in comparison to China and India that have logistics cost as a percentage of GDP at 18% and 13% respectively.
Evolution of Logistics in IndiaThe logistics and warehousing sector in India is still in its initial stage of development and has a long way to catch up with most of the advanced economies. Managing transportation network and storage of finished goods, used to define the supply chain strategy for most of the companies in India until a few years back. However, integration of the Indian economy with the global economy and various multi-national companies setting up manufacturing facilities locally have helped in bringing the global best practices to the domestic market. This has resulted in a gradual shift from simply managing transport network and godowns towards a more integrated supply chain management system.
In order to understand the evolution of the logistics sector in India, it is imperative to study the competing markets that have moved ahead in the value chain. United States of America (USA) is considered to be the most evolved logistics market in the world and can be used as a benchmark to compare with the Indian market. China, sharing a great amount of characteristics in terms of economy and geography with India, can be considered as another benchmark for comparison. The comparison of USA and China with India will help in understanding the various gaps and the current status of the domestic logistics market.
Source: Knight Frank Research
•Processes likepurchasing, warehousing, packaging and inventory management handled separately
•Not muchcoordination between functions
• Internalintegration within the company
•Better coordination between functions
• Individualcontracts given for transporting, storage, forwarding etc.
•Shift fromgodowns to godowns to functional warehouses
•Strategicfocus on reducing cost redundancies and customers
•Supply chainmanagement
•Globaloperations
•Singleoperator managing the supply chain in multiple geographies
•Move towards4PL’s and 7PL’s
EARLY GROWTH CONSOLIDATION MATURE
INDIA
USA•Greater
external integration integration
•Bundling•Bundling ofservices with the help of 3PL players
•Companiesfocus on core competencies and outsource logistics requirements to 3PL Players
•World classwarehouses, higher higher automation
Evolution of The Logistics Sector
Evolution: Tracing the evolution of the sector, the USA has managed to decrease the logistics cost as a percent of GDP from 16.2% in the 1980s to its current levels of 8.5%. Most of this reduction in cost has come about because of efficiency in the warehousing industry. The warehousing cost as a percentage of GDP has steadily declined from 8.3% in the early 1980s to its current level of 2.8%. However, the country’s transportation expenses on the other hand have been relatively constant since the 1980s at an approximate value of 5% of the country’s GDP. India on the other hand spends 8.2% of its GDP on transportation and 3.8% on warehousing.Two things stand out immediately when we juxtapose India and the USA. Firstly India spends 8.2% of its GDP only on transportation, which is almost as much as the USA spends on its entire logistics sector. Secondly India’s proportionate expenditure on transportation is nearly double that of the USA’s despite having only one-third of its landmass. This
highlights the scope for improvement in India’s transportation sector.
The USA logistics sector has a value of almost 10 times that of the Indian logistics sector. Yet the USA logistics sector employs only one tenth the number of people that the Indian logistics sector does. Primary reason for such a stark contrast is that the logistics sector in the USA is highly mechanised and uses automation extensively unlike in India where it is largely dependent on labour.
Transport: Trucking and railroads are the main modes of transportation in the USA. Trucking is more expensive as a mode of transport and is generally used for either shorter routes or to transport expensive cargo. The USA relies heavily on trucking than on rail. Of the total share of transportation (tonnage) handled by roads and rail, trucking accounts for 86% whereas rail accounts for a mere 14%. This is very similar to India which has roughly the same proportions.
CHINA
11
RESEARCHINDIA LOGISTICS &
WAREHOUSING REPORT
Warehousing: The warehousing sector in China has improved considerably over the last decade with the number of warehouses using IT system like Warehouse Management Systems on a rapid rise. Emergence of Multi-Modal Logistics hubs (MMLH), integrated logistics park and Free Trade Warehousing Zones (FTWZ) have enabled the country’s warehousing sector to reach a greater efficiency level. Although Indian and Chinese warehousing sectors have many similarities, China is a few years advanced in terms of efficiency. Warehousing in both the countries is heavily dependent on labour and has low penetration of technology. In this light the Chinese warehousing market serves as a good benchmark for India.
the industrial sector, higher share of this segment in the economy results in such a scenario.
Evolution: The Chinese logistics sector has grown rapidly and become more efficient over the last few years. Their logistics costs have come down from 21% to 18% during the period 1997-2012. China was able to reduce its logistics cost by focusing on improving its transportation sector. Massive investment in building road and rail network with the primary objective of improving east-west connectivity and linking smaller cities with ports have resulted in bringing greater efficiency in the logistics sector.
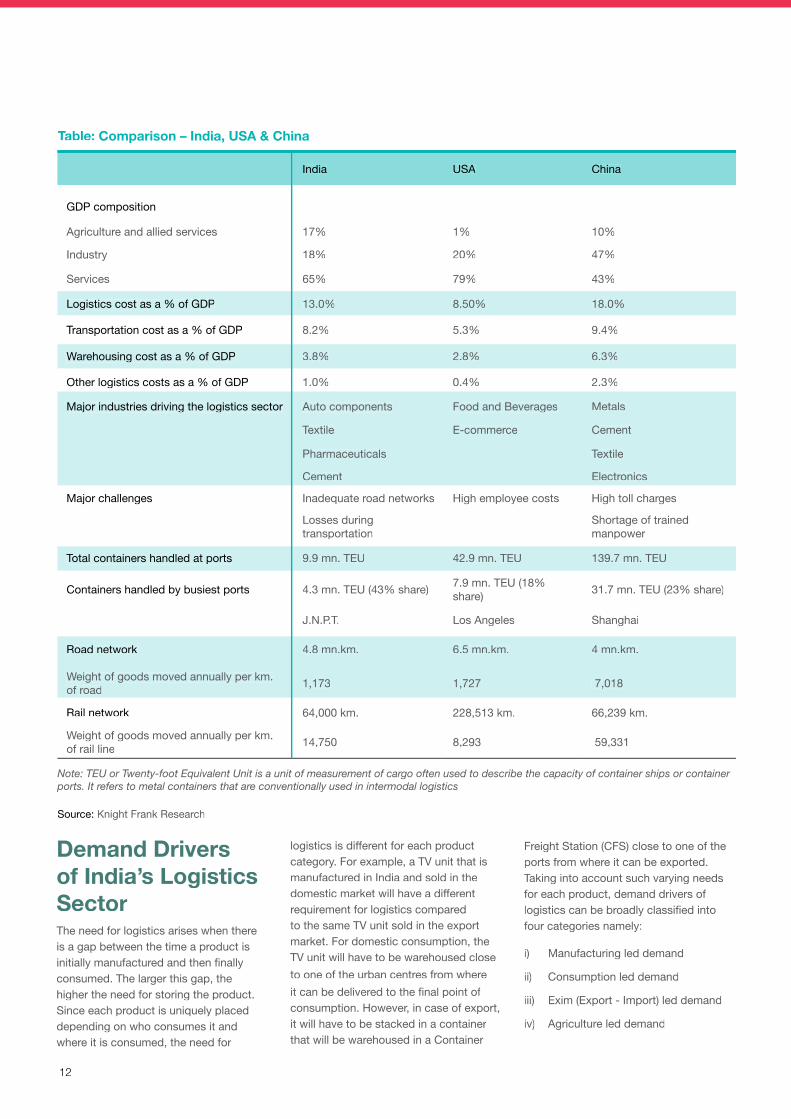
Transport: Transportation in China is dominated by road. Rail network, considered to be more cost effective than road, is not very well developed in China yet. In fact India has a better and relatively larger rail network per sq.km. than China at present. However, the Chinese government is taking steps to add several new rail lines to improve connectivity between the eastern and western provinces of the country. In terms of characteristics, the Chinese transportation sector in 2004 was in a very similar position as India’s transportation sector today. Road network was inadequate and the government had several infrastructure projects in the pipeline. If the Indian government is able to execute all the proposed infrastructure plans on time, it is very likely that India will enjoy similar efficiencies in logistics costs that China has witnessed over the previous decade.
In terms of container traffic, the busiest port in India handles more than 43% of the country’s total traffic as opposed to the busiest ports in the USA and China that handle 18% and 23% respectively. This shows that Indian cargo is inefficiently clustered around a few main ports. Most of these ports are overloaded and running beyond optimal capacity. This leads to an increase in bottlenecks in the logistics supply chain.
The government acknowledges the need to increase both the capacity and number of ports. Although a large amount of
Warehousing: Warehouses in the USA are very efficient and advanced in comparison to India. They are automated to a large degree and use technology extensively. Nearly all warehouses in the USA have Warehouse Management Systems (WMS). They also have tools for automatic data collection such as RFID, barcode and scanner among others. Such extensive use of technology gives companies real time information on inventory movement thus enabling them with forecasting and planning movement of goods quite accurately. The level of use of technology in warehousing in the USA when contrasted with India implies that there is significant scope for growth and efficiency in India’s warehousing sector.
Rail Road
Source: National Bureau of Statistics of China
China Road vs Rail
In terms of container traffic, the busiest port in India handles more than 43% of the country’s total traffic, as opposed to the busiest ports in the USA and China that handle 18% and 23% respectively
Comparison with China Logistics SectorOverview: China has an extremely large logistics market that has been growing rapidly since the country joined the World Trade Organization in 2001. Its logistics sector accounts for more than 18% of the country’s GDP.
Although on the face of it 18% may seem to be a very high number, it has to be noted that the Chinese economy is primarily driven by the industrial sector that forms 46% of the economy unlike the USA and India where its share is only 20% and 18% respectively. Since the need for logistics primarily arises from
14%
Rail Road
USA Road vs Rail
Source: US Department of Transportation
infrastructure has been planned in India, the country is lagging behind in terms of execution.
12% 88%
86%
11
RESEARCHINDIA LOGISTICS &
WAREHOUSING REPORT
Warehousing: The warehousing sector in China has improved considerably over the last decade with the number of warehouses using IT system like Warehouse Management Systems on a rapid rise. Emergence of Multi-Modal Logistics hubs (MMLH), integrated logistics park and Free Trade Warehousing Zones (FTWZ) have enabled the country’s warehousing sector to reach a greater efficiency level. Although Indian and Chinese warehousing sectors have many similarities, China is a few years advanced in terms of efficiency. Warehousing in both the countries is heavily dependent on labour and has low penetration of technology. In this light the Chinese warehousing market serves as a good benchmark for India.
the industrial sector, higher share of this segment in the economy results in such a scenario.
Evolution: The Chinese logistics sector has grown rapidly and become more efficient over the last few years. Their logistics costs have come down from 21% to 18% during the period 1997-2012. China was able to reduce its logistics cost by focusing on improving its transportation sector. Massive investment in building road and rail network with the primary objective of improving east-west connectivity and linking smaller cities with ports have resulted in bringing greater efficiency in the logistics sector.
Transport: Transportation in China is dominated by road. Rail network, considered to be more cost effective than road, is not very well developed in China yet. In fact India has a better and relatively larger rail network per sq.km. than China at present. However, the Chinese government is taking steps to add several new rail lines to improve connectivity between the eastern and western provinces of the country. In terms of characteristics, the Chinese transportation sector in 2004 was in a very similar position as India’s transportation sector today. Road network was inadequate and the government had several infrastructure projects in the pipeline. If the Indian government is able to execute all the proposed infrastructure plans on time, it is very likely that India will enjoy similar efficiencies in logistics costs that China has witnessed over the previous decade.
In terms of container traffic, the busiest port in India handles more than 43% of the country’s total traffic as opposed to the busiest ports in the USA and China that handle 18% and 23% respectively. This shows that Indian cargo is inefficiently clustered around a few main ports. Most of these ports are overloaded and running beyond optimal capacity. This leads to an increase in bottlenecks in the logistics supply chain.
The government acknowledges the need to increase both the capacity and number of ports. Although a large amount of
Warehousing: Warehouses in the USA are very efficient and advanced in comparison to India. They are automated to a large degree and use technology extensively. Nearly all warehouses in the USA have Warehouse Management Systems (WMS). They also have tools for automatic data collection such as RFID, barcode and scanner among others. Such extensive use of technology gives companies real time information on inventory movement thus enabling them with forecasting and planning movement of goods quite accurately. The level of use of technology in warehousing in the USA when contrasted with India implies that there is significant scope for growth and efficiency in India’s warehousing sector.
Rail Road
Source: National Bureau of Statistics of China
China Road vs Rail
In terms of container traffic, the busiest port in India handles more than 43% of the country’s total traffic, as opposed to the busiest ports in the USA and China that handle 18% and 23% respectively
Comparison with China Logistics SectorOverview: China has an extremely large logistics market that has been growing rapidly since the country joined the World Trade Organization in 2001. Its logistics sector accounts for more than 18% of the country’s GDP.
Although on the face of it 18% may seem to be a very high number, it has to be noted that the Chinese economy is primarily driven by the industrial sector that forms 46% of the economy unlike the USA and India where its share is only 20% and 18% respectively. Since the need for logistics primarily arises from
14%
Rail Road
USA Road vs Rail
Source: US Department of Transportation
infrastructure has been planned in India, the country is lagging behind in terms of execution.
12% 88%
86%
12
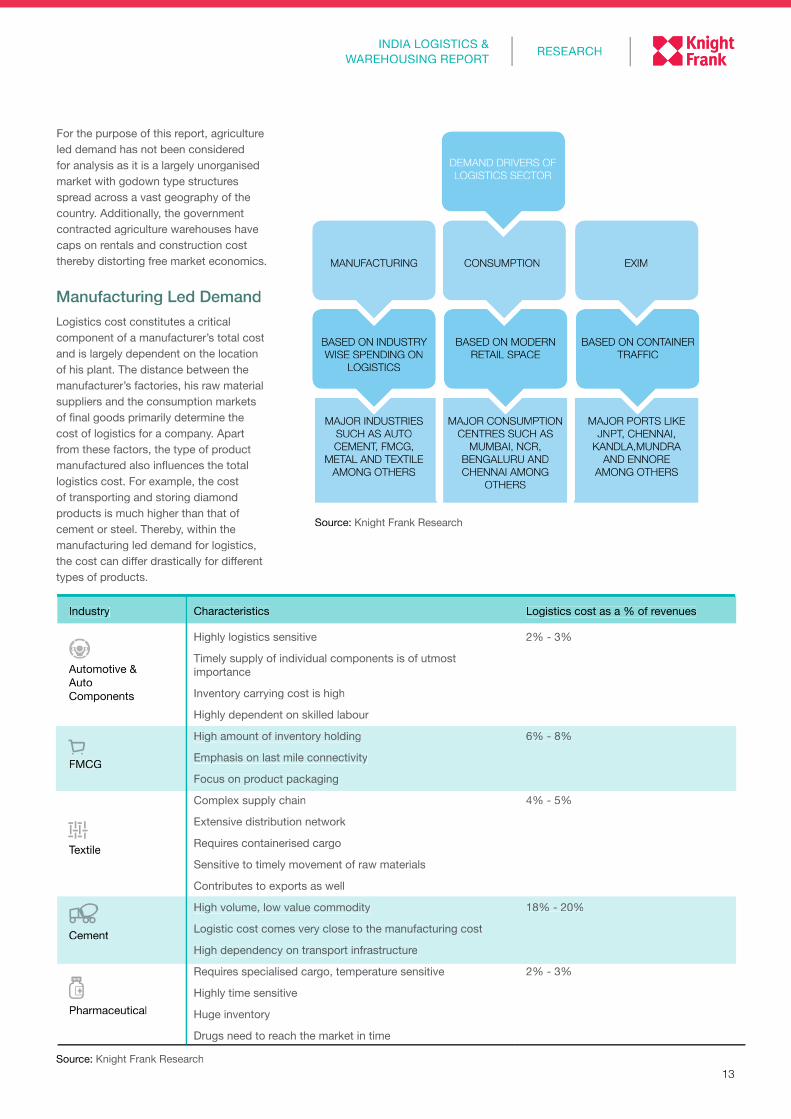
India USA China
GDP composition
Agriculture and allied services 17% 1% 10%
Industry 18% 20% 47%
Services 65% 79% 43%
Logistics cost as a % of GDP 13.0% 8.50% 18.0%
Transportation cost as a % of GDP 8.2% 5.3% 9.4%
Warehousing cost as a % of GDP 3.8% 2.8% 6.3%
Other logistics costs as a % of GDP 1.0% 0.4% 2.3%
Major industries driving the logistics sector Auto components Food and Beverages Metals
Textile E-commerce Cement
Pharmaceuticals Textile
Cement Electronics
Major challenges Inadequate road networks High employee costs High toll charges
Losses during transportation Shortage of trained
manpower
Total containers handled at ports 9.9 mn. TEU 42.9 mn. TEU 139.7 mn. TEU
Containers handled by busiest ports 4.3 mn. TEU (43% share) 7.9 mn. TEU (18% share) 31.7 mn. TEU (23% share)
J.N.P.T. Los Angeles Shanghai
Road network 4.8 mn.km. 6.5 mn.km. 4 mn.km.
Weight of goods moved annually per km. of road 1,173 1,727 7,018
Rail network 64,000 km. 228,513 km. 66,239 km.
Weight of goods moved annually per km. of rail line 14,750 8,293 59,331
Note: TEU or Twenty-foot Equivalent Unit is a unit of measurement of cargo often used to describe the capacity of container ships or container ports. It refers to metal containers that are conventionally used in intermodal logistics
Source: Knight Frank Research
Table: Comparison – India, USA & China
Demand Drivers of India’s Logistics SectorThe need for logistics arises when there is a gap between the time a product is initially manufactured and then finally consumed. The larger this gap, the higher the need for storing the product. Since each product is uniquely placed depending on who consumes it and where it is consumed, the need for
logistics is different for each product category. For example, a TV unit that is manufactured in India and sold in the domestic market will have a different requirement for logistics compared to the same TV unit sold in the export market. For domestic consumption, the TV unit will have to be warehoused close to one of the urban centres from where it can be delivered to the final point of consumption. However, in case of export, it will have to be stacked in a container that will be warehoused in a Container
Freight Station (CFS) close to one of the ports from where it can be exported. Taking into account such varying needs for each product, demand drivers of logistics can be broadly classified into four categories namely:
i) Manufacturing led demand
ii) Consumption led demand
iii) Exim (Export - Import) led demand
iv) Agriculture led demand
12
India USA China
GDP composition
Agriculture and allied services 17% 1% 10%
Industry 18% 20% 47%
Services 65% 79% 43%
Logistics cost as a % of GDP 13.0% 8.50% 18.0%
Transportation cost as a % of GDP 8.2% 5.3% 9.4%
Warehousing cost as a % of GDP 3.8% 2.8% 6.3%
Other logistics costs as a % of GDP 1.0% 0.4% 2.3%
Major industries driving the logistics sector Auto components Food and Beverages Metals
Textile E-commerce Cement
Pharmaceuticals Textile
Cement Electronics
Major challenges Inadequate road networks High employee costs High toll charges
Losses during transportation
Shortage of trained manpower
Total containers handled at ports 9.9 mn. TEU 42.9 mn. TEU 139.7 mn. TEU
Containers handled by busiest ports 4.3 mn. TEU (43% share) 7.9 mn. TEU (18% share) 31.7 mn. TEU (23% share)
J.N.P.T. Los Angeles Shanghai
Road network 4.8 mn.km. 6.5 mn.km. 4 mn.km.
Weight of goods moved annually per km. of road 1,173 1,727 7,018
Rail network 64,000 km. 228,513 km. 66,239 km.
Weight of goods moved annually per km. of rail line 14,750 8,293 59,331
Note: TEU or Twenty-foot Equivalent Unit is a unit of measurement of cargo often used to describe the capacity of container ships or container ports. It refers to metal containers that are conventionally used in intermodal logistics
Source: Knight Frank Research
Table: Comparison – India, USA & China
Demand Drivers of India’s Logistics SectorThe need for logistics arises when there is a gap between the time a product is initially manufactured and then finally consumed. The larger this gap, the higher the need for storing the product. Since each product is uniquely placed depending on who consumes it and where it is consumed, the need for
logistics is different for each product category. For example, a TV unit that is manufactured in India and sold in the domestic market will have a different requirement for logistics compared to the same TV unit sold in the export market. For domestic consumption, the TV unit will have to be warehoused close to one of the urban centres from where it can be delivered to the final point of consumption. However, in case of export, it will have to be stacked in a container that will be warehoused in a Container
Freight Station (CFS) close to one of the ports from where it can be exported. Taking into account such varying needs for each product, demand drivers of logistics can be broadly classified into four categories namely:
i) Manufacturing led demand
ii) Consumption led demand
iii) Exim (Export - Import) led demand
iv) Agriculture led demand
13
RESEARCHINDIA LOGISTICS &
WAREHOUSING REPORT
For the purpose of this report, agriculture led demand has not been considered for analysis as it is a largely unorganised market with godown type structures spread across a vast geography of the country. Additionally, the government contracted agriculture warehouses have caps on rentals and construction cost thereby distorting free market economics.
DEMAND DRIVERS OFLOGISTICS SECTOR
MANUFACTURING
BASED ON INDUSTRYWISE SPENDING ON
LOGISTICS
MAJOR INDUSTRIESSUCH AS AUTOCEMENT, FMCG,
METAL AND TEXTILEAMONG OTHERS
MAJOR CONSUMPTIONCENTRES SUCH AS
MUMBAI, NCR, BENGALURU ANDCHENNAI AMONG
OTHERS
BASED ON MODERNRETAIL SPACE
BASED ON CONTAINERTRAFFIC
MAJOR PORTS LIKEJNPT, CHENNAI,
KANDLA,MUNDRAAND ENNORE
AMONG OTHERS
CONSUMPTION EXIM
Source: Knight Frank Research
Manufacturing Led DemandLogistics cost constitutes a critical component of a manufacturer’s total cost and is largely dependent on the location of his plant. The distance between the manufacturer’s factories, his raw material suppliers and the consumption markets of final goods primarily determine the cost of logistics for a company. Apart from these factors, the type of product manufactured also influences the total logistics cost. For example, the cost of transporting and storing diamond products is much higher than that of cement or steel. Thereby, within the manufacturing led demand for logistics, the cost can differ drastically for different types of products.
Industry Characteristics Logistics cost as a % of revenues
Automotive & Auto Components
Highly logistics sensitive 2% - 3%
Timely supply of individual components is of utmost importance
Inventory carrying cost is high
Highly dependent on skilled labour
FMCG
High amount of inventory holding 6% - 8%
Emphasis on last mile connectivity
Focus on product packaging
Textile
Complex supply chain 4% - 5%
Extensive distribution network
Requires containerised cargo
Sensitive to timely movement of raw materials
Contributes to exports as well
Cement
High volume, low value commodity 18% - 20%
Logistic cost comes very close to the manufacturing cost
High dependency on transport infrastructure
Pharmaceutical
Requires specialised cargo, temperature sensitive 2% - 3%
Highly time sensitive
Huge inventory
Drugs need to reach the market in time
Source: Knight Frank Research13
RESEARCHINDIA LOGISTICS &
WAREHOUSING REPORT
For the purpose of this report, agriculture led demand has not been considered for analysis as it is a largely unorganised market with godown type structures spread across a vast geography of the country. Additionally, the government contracted agriculture warehouses have caps on rentals and construction cost thereby distorting free market economics.
DEMAND DRIVERS OFLOGISTICS SECTOR
MANUFACTURING
BASED ON INDUSTRYWISE SPENDING ON
LOGISTICS
MAJOR INDUSTRIESSUCH AS AUTOCEMENT, FMCG,
METAL AND TEXTILEAMONG OTHERS
MAJOR CONSUMPTIONCENTRES SUCH AS
MUMBAI, NCR, BENGALURU ANDCHENNAI AMONG
OTHERS
BASED ON MODERNRETAIL SPACEPACEP
BASED ON CONTAINERTRAFFIC
MAJOR PORTS LIKEJNPT, CHENNAI,
KANDLA,MUNDRAAND ENNORE
AMONG OTHERS
CONSUMPTION EXIM
Source: Knight Frank Research
Manufacturing Led DemandLogistics cost constitutes a critical component of a manufacturer’s total cost and is largely dependent on the location of his plant. The distance between the manufacturer’s factories, his raw material suppliers and the consumption markets of final goods primarily determine the cost of logistics for a company. Apart from these factors, the type of product manufactured also influences the total logistics cost. For example, the cost of transporting and storing diamond products is much higher than that of cement or steel. Thereby, within the manufacturing led demand for logistics, the cost can differ drastically for different types of products.
Industry Characteristics Logistics cost as a % of revenues
Automotive & Auto Components
Highly logistics sensitive 2% - 3%
Timely supply of individual components is of utmost importance
Inventory carrying cost is high
Highly dependent on skilled labour
FMCG
High amount of inventory holding 6% - 8%
Emphasis on last mile connectivity
Focus on product packaging
Textile
Complex supply chain 4% - 5%
Extensive distribution network
Requires containerised cargo
Sensitive to timely movement of raw materials
Contributes to exports as well
Cement
High volume, low value commodity 18% - 20%
Logistic cost comes very close to the manufacturing cost
High dependency on transport infrastructure
Pharmaceutical
Requires specialised cargo, temperature sensitive 2% - 3%
Highly time sensitive
Huge inventory
Drugs need to reach the market in time
Source: Knight Frank Research
14
The manufacturing sector is a major driver of the logistics industry in India with companies spending anywhere between 2% - 20% of their revenue on this. Growth of the logistics sector is positively related to growth of the manufacturing sector. With the government of India’s renewed focus on expanding the manufacturing sector through various initiatives such as dedicated industrial corridors and investment zones, the logistics sector in the country is bound to reap the benefits in the coming years. Additionally, opening up of various manufacturing sectors to Foreign Direct Investment (FDI) in the last decade has provided a fresh impetus to the logistics sector.
Consumption Led DemandThe changing dynamics of the retail industry has shifted the focus from supplier to consumer in the last two decades with concepts such as delivering the right product at the right time gaining importance. Previously consumers had
few options as most of the retailers were small-time operators facing frequent stock-outs and limited choice of products. The entire retail segment was heavily skewed towards the supplier. However, with the advent of modern retail and emergence of large-sized retail formats the entire focus of retailing has shifted towards consumers.
Today any delay in the delivery of product or stock-outs at the stores could threaten the entire business model of a retailer. This has compelled retailers in maintaining a steady flow of SKUs (Stock Keeping Units) with real time inventory management and order placement.
The changing dynamics of the retail industry in India has resulted in the business model of a modern retailer becoming heavily dependent on a smooth and efficient supply chain network. This has brought the logistics industry at the forefront of this business. Large consumption markets like the NCR, Mumbai, Bengaluru, Chennai and Kolkata among others require a massive amount
of investment in logistics in order to ensure an uninterrupted supply of goods. This has created demand for logistic services like warehousing, last-mile connectivity and inventory management.
Demand for logistic services is strongly linked to growth in the retail industry which is induced by higher consumption spending. The emergence of modern retail in the last decade has accelerated the need for maintaining an efficient supply chain network. Additionally, opening up of the retail industry to the FDI has further boosted demand for logistics services in the last few years as foreign retailers rope in global best practices in the sector.
Exim Led DemandExport-import (Exim) market constitutes the largest demand driver for the logistics sector in India as the cargo that moves through ports requires a huge amount of supporting logistics infrastructure. Services such as transportation (rail, road and sea) and warehousing form the primary activities in Exim related logistics. Currently, majority of the Exim cargo in India is moved through containers that are standard in terms of dimension (twenty-foot equivalent unit or TEU) across the globe. This makes it easier to transport cargo from one modal to another whether it is rail, road or sea.
India’s containerised traffic in TEUs has grown at an annual average growth rate of 11% in the last ten years fuelling robust demand for logistic services. Apart from the huge investment in transportation sector, Inland Container Depots (ICD) and Container Freight Stations (CFS) have also attracted significant traction due to the strong growth achieved in the Exim trade. Currently, India has more than 200 operational ICD & CFS with another 50 expected to become operational in the next five years.
Economic recovery in key western markets of the USA and Europe is expected to further boost India’s Exim trade in the coming years thereby driving the domestic logistics market.
Major Consumption Markets in India
Source: Knight Frank Research
Mumbai
Hyderabad
Chandigarh
New Delhi
Lucknow
KolkataAhmedabad
Pune
Bengaluru Chennai
14
The manufacturing sector is a major driver of the logistics industry in India with companies spending anywhere between 2% - 20% of their revenue on this. Growth of the logistics sector is positively related to growth of the manufacturing sector. With the government of India’s renewed focus on expanding the manufacturing sector through various initiatives such as dedicated industrial corridors and investment zones, the logistics sector in the country is bound to reap the benefits in the coming years. Additionally, opening up of various manufacturing sectors to Foreign Direct Investment (FDI) in the last decade has provided a fresh impetus to the logistics sector.
Consumption Led DemandThe changing dynamics of the retail industry has shifted the focus from supplier to consumer in the last two decades with concepts such as delivering the right product at the right time gaining importance. Previously consumers had
few options as most of the retailers were small-time operators facing frequent stock-outs and limited choice of products. The entire retail segment was heavily skewed towards the supplier. However, with the advent of modern retail and emergence of large-sized retail formats the entire focus of retailing has shifted towards consumers.
Today any delay in the delivery of product or stock-outs at the stores could threaten the entire business model of a retailer. This has compelled retailers in maintaining a steady flow of SKUs (Stock Keeping Units) with real time inventory management and order placement.
The changing dynamics of the retail industry in India has resulted in the business model of a modern retailer becoming heavily dependent on a smooth and efficient supply chain network. This has brought the logistics industry at the forefront of this business. Large consumption markets like the NCR, Mumbai, Bengaluru, Chennai and Kolkata among others require a massive amount
of investment in logistics in order to ensure an uninterrupted supply of goods. This has created demand for logistic services like warehousing, last-mile connectivity and inventory management.
Demand for logistic services is strongly linked to growth in the retail industry which is induced by higher consumption spending. The emergence of modern retail in the last decade has accelerated the need for maintaining an efficient supply chain network. Additionally, opening up of the retail industry to the FDI has further boosted demand for logistics services in the last few years as foreign retailers rope in global best practices in the sector.
Exim Led DemandExport-import (Exim) market constitutes the largest demand driver for the logistics sector in India as the cargo that moves through ports requires a huge amount of supporting logistics infrastructure. Services such as transportation (rail, road and sea) and warehousing form the primary activities in Exim related logistics. Currently, majority of the Exim cargo in India is moved through containers that are standard in terms of dimension (twenty-foot equivalent unit or TEU) across the globe. This makes it easier to transport cargo from one modal to another whether it is rail, road or sea.
India’s containerised traffic in TEUs has grown at an annual average growth rate of 11% in the last ten years fuelling robust demand for logistic services. Apart from the huge investment in transportation sector, Inland Container Depots (ICD) and Container Freight Stations (CFS) have also attracted significant traction due to the strong growth achieved in the Exim trade. Currently, India has more than 200 operational ICD & CFS with another 50 expected to become operational in the next five years.
Economic recovery in key western markets of the USA and Europe is expected to further boost India’s Exim trade in the coming years thereby driving the domestic logistics market.
Major Consumption Markets in India
Source: Knight Frank Research
Mumbai
HyderabadHyderabadHyderabadHyderabadHyderabadHyderabadHyderabadHyderabad
ChandigarhChandigarhChandigarhChandigarhChandigarhChandigarhChandigarh
New DelhiNew DelhiNew DelhiNew DelhiNew DelhiNew DelhiNew DelhiNew DelhiNew DelhiNew Delhi
LucknowLucknowLucknowLucknowLucknow
KolkataKolkataKolkataKolkataKolkataKolkataKolkataKolkataAhmedabadAhmedabadAhmedabadAhmedabadAhmedabadAhmedabadAhmedabad
Pune
BengaluruBengaluruBengaluruBengaluruBengaluruBengaluruBengaluruBengaluruBengaluru Chennai
15
RESEARCHINDIA LOGISTICS &
WAREHOUSING REPORT
Kandla
Mumbai
Mormugao
Visakhapatnam
Paradip
Kolkata
Mangalore
Tuticorin
Chennai
Major Ports in India
Source: Knight Frank Research
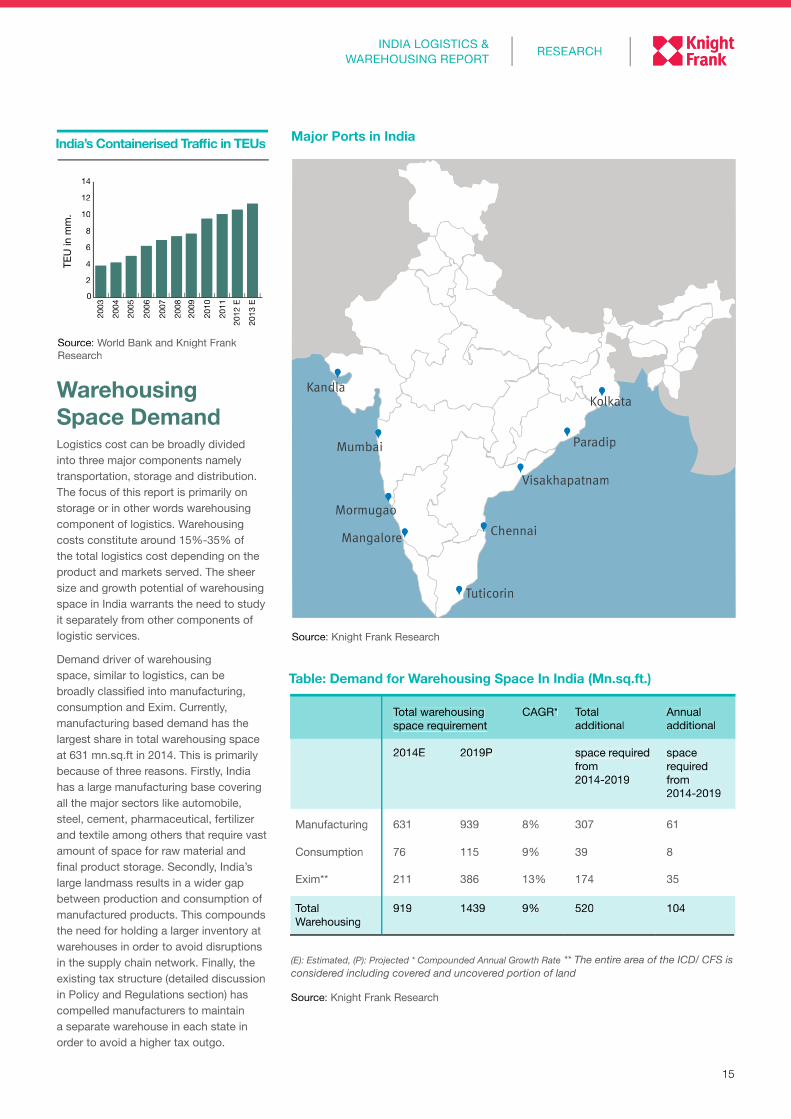
Warehousing Space DemandLogistics cost can be broadly divided into three major components namely transportation, storage and distribution. The focus of this report is primarily on storage or in other words warehousing component of logistics. Warehousing costs constitute around 15%-35% of the total logistics cost depending on the product and markets served. The sheer size and growth potential of warehousing space in India warrants the need to study it separately from other components of logistic services.
Demand driver of warehousing space, similar to logistics, can be broadly classified into manufacturing, consumption and Exim. Currently, manufacturing based demand has the largest share in total warehousing space at 631 mn.sq.ft in 2014. This is primarily because of three reasons. Firstly, India has a large manufacturing base covering all the major sectors like automobile, steel, cement, pharmaceutical, fertilizer and textile among others that require vast amount of space for raw material and final product storage. Secondly, India’s large landmass results in a wider gap between production and consumption of manufactured products. This compounds the need for holding a larger inventory at warehouses in order to avoid disruptions in the supply chain network. Finally, the existing tax structure (detailed discussion in Policy and Regulations section) has compelled manufacturers to maintain a separate warehouse in each state in order to avoid a higher tax outgo.
(E): Estimated, (P): Projected * Compounded Annual Growth Rate ** The entire area of the ICD/ CFS is considered including covered and uncovered portion of land
Source: Knight Frank Research
Total warehousing space requirement
CAGR* Total additional
Annual additional
2014E 2019P space required from 2014-2019
space required from 2014-2019
Manufacturing 631 939 8% 307 61
Consumption 76 115 9% 39 8
Exim** 211 386 13% 174 35
Total Warehousing
919 1439 9% 520 104
Table: Demand for Warehousing Space In India (Mn.sq.ft.)
0
2
2003
2004
2005
2006
2007
2008
2009
2010
2011
2012
E
2013
E4
6
8
10
12
14
TEU
in m
m.
Source: World Bank and Knight Frank Research
India’s Containerised Traffic in TEUs
15
RESEARCHINDIA LOGISTICS &
WAREHOUSING REPORT
KandlaKandlaKandla
MumbaiMumbaiMumbai
MormugaoMormugaoMormugaoMormugaoMormugao
VisakhapatnamVisakhapatnamVisakhapatnam
Paradip
KolkataKolkataKolkataKolkataKolkataKolkata
MangaloreMangaloreMangalore
TuticorinTuticorin
Chennai
Major Ports in India
Source: Knight Frank Research
Warehousing Space DemandLogistics cost can be broadly divided into three major components namely transportation, storage and distribution. The focus of this report is primarily on storage or in other words warehousing component of logistics. Warehousing costs constitute around 15%-35% of the total logistics cost depending on the product and markets served. The sheer size and growth potential of warehousing space in India warrants the need to study it separately from other components of logistic services.
Demand driver of warehousing space, similar to logistics, can be broadly classified into manufacturing, consumption and Exim. Currently, manufacturing based demand has the largest share in total warehousing space at 631 mn.sq.ft in 2014. This is primarily because of three reasons. Firstly, India has a large manufacturing base covering all the major sectors like automobile, steel, cement, pharmaceutical, fertilizer and textile among others that require vast amount of space for raw material and final product storage. Secondly, India’s large landmass results in a wider gap between production and consumption of manufactured products. This compounds the need for holding a larger inventory at warehouses in order to avoid disruptions in the supply chain network. Finally, the existing tax structure (detailed discussion in Policy and Regulations section) has compelled manufacturers to maintain a separate warehouse in each state in order to avoid a higher tax outgo.
(E): Estimated, (P): Projected * Compounded Annual Growth Rate ** The entire area of the ICD/ CFS is considered including covered and uncovered portion of land
Source: Knight Frank Research
Total warehousing space requirement
CAGR* Total additional
Annual additional
2014E 2019P space required from 2014-2019
space required from 2014-2019
Manufacturing 631 939 8% 307 61
Consumption 76 115 9% 39 8
Exim** 211 386 13% 174 35
Total Warehousing
919 1439 9% 520 104
Table: Demand for Warehousing Space In India (Mn.sq.ft.)
0
2
2003
2004
2005
2006
2007
2008
2009
2010
2011
2012
E
2013
E4
6
8
10
12
14
TEU
in m
m.
Source: World Bank and Knight Frank Research
India’s Containerised Traffic in TEUs
16
Such dynamics have shaped a strong demand base for warehousing space in the country from the manufacturing sector.
Demand for warehousing space from Exim sector constitutes the second largest share at 211 mn.sq.ft. in 2014. This is primarily because ICD & CFS require a much larger land area to operate the various material handling equipment and supporting infrastructure like rail sidings. In terms of future growth, Exim led demand is expected to lead with a 13% Compounded Annual Growth Rate (CAGR) from 2014-2019. Strong recovery of the export market and rapid expansion by CFS operators in the coming five years are expected to support such a growth. The total warehousing space demand in India is expected to grow at 9% CAGR from 919 mn.sq.ft. in 2014 to 1,439 mn.sq.ft. by 2019. A total of 520 mn.sq.ft. of incremental warehousing space will be required by the end of 2019 or 104 mn.sq.ft. in each of the coming five years.
Issues and ChallengesDespite showing immense growth potential, the Indian logistics and warehousing industry encounters various issues and challenges today. Success of this Industry will depend largely on the resolution of these. Even though some of the biggest challenges require initiatives at the government level, the private sector will also play an equally important role. Some of the key challenges witnessed by the industry are explained below:
Transport InfrastructureThe logistics and warehousing industry has a very high dependence on physical infrastructure. The challenges pertaining
to it are manifold ranging from lack of ample road and rail network to accessible storage options. India lacks efficient road and rail network to facilitate smooth movement of goods. Also there is overdependence on road infrastructure unlike the developed countries where rail is an equally important mode of freight movement.
The rail network in our country is saturated due to limited addition in tracks during the past decade. Likewise cargo handling capacity of our ports is also inadequate leading to delay in deliveries. The typical turnaround time of Indian ports is twice that of the neighbouring ports of Colombo and Singapore. All the above transport related issues in turn affect the export and import time which in turn pose a challenge for companies.
Information TechnologyThe importance of information technology cannot be undervalued in the logistics sector. Low penetration of IT and absence of efficient communication infrastructure pose a big challenge for logistics companies. Whether it is the use of transport management systems, Radio Frequency Identification Device (RFID) or warehouse management systems, India lacks on every front.
Fragmented MarketThe logistics sector in India is highly unorganised and fragmented. Most of the truck operators are small private players and are unable to contract directly with the clients. As a result of this, mediators come into play and generate business for them and take commission. All this leads to operational inefficiencies and compels the truck owners to overload in order to achieve profit margins. Since the operations are so fragmented, economics of scale cannot be adopted. Presence of multiple check points for trucks is
another challenge. Every state requires certain documentation for a truck to pass the border such as RTO inspection, Octroi and Toll Tax among others leading to huge delays during the journey.
Land AvailabilityAffordable land availability with clear titles in tactical locations is a big challenge currently. Since land is a state subject, it adds to the challenges as different states have different set of procedures pertaining to agriculture land acquisition. Increasing land values even in the peripheral areas of a city further makes it unviable for companies to invest in warehousing.
Lack of StandardisationAs discussed earlier the demand drivers of the logistics industry are varied and have specific requirements. These requirements are further reflected in transportation and warehouse needs. There is lack of standards related to design, safety and type of facilities and amenities of warehouses.
Increasing globalisation and entrance of international players has increased the demand for good quality warehouses which are at par with other countries. Currently there is a dearth of such warehouses which compels companies to invest further in order to support their operations.
Lack of Trained ManpowerThere are limited options of specialised studies on logistics management in the country. Most of the warehousing players lack the required expertise leading to operational inefficiencies. As the industry evolves, the need for experts is also expected to grow.
A majority of logistics players today have limited knowledge of material loading, handling and storage leading to wastage.
17
RESEARCHINDIA LOGISTICS &
WAREHOUSING REPORT
POLICY AND REGULATIONS
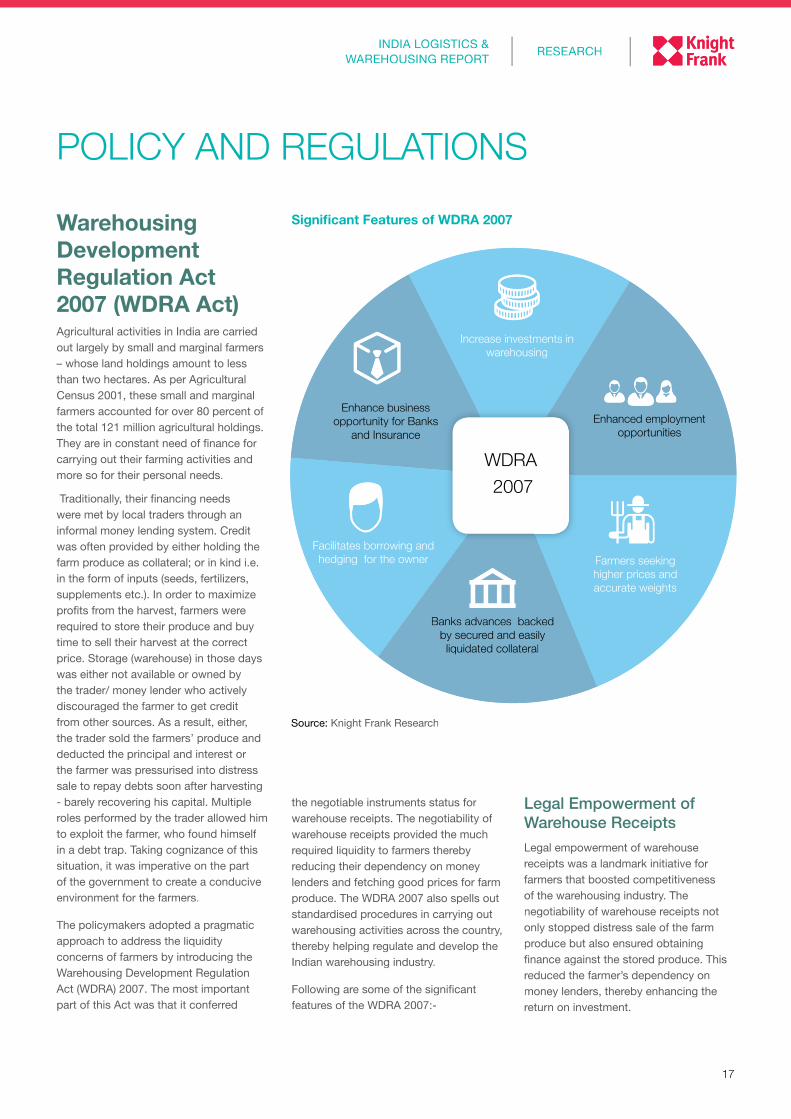
Warehousing Development Regulation Act 2007 (WDRA Act)Agricultural activities in India are carried out largely by small and marginal farmers – whose land holdings amount to less than two hectares. As per Agricultural Census 2001, these small and marginal farmers accounted for over 80 percent of the total 121 million agricultural holdings. They are in constant need of finance for carrying out their farming activities and more so for their personal needs.
Traditionally, their financing needs were met by local traders through an informal money lending system. Credit was often provided by either holding the farm produce as collateral; or in kind i.e. in the form of inputs (seeds, fertilizers, supplements etc.). In order to maximize profits from the harvest, farmers were required to store their produce and buy time to sell their harvest at the correct price. Storage (warehouse) in those days was either not available or owned by the trader/ money lender who actively discouraged the farmer to get credit from other sources. As a result, either, the trader sold the farmers’ produce and deducted the principal and interest or the farmer was pressurised into distress sale to repay debts soon after harvesting - barely recovering his capital. Multiple roles performed by the trader allowed him to exploit the farmer, who found himself in a debt trap. Taking cognizance of this situation, it was imperative on the part of the government to create a conducive environment for the farmers.
The policymakers adopted a pragmatic approach to address the liquidity concerns of farmers by introducing the Warehousing Development Regulation Act (WDRA) 2007. The most important part of this Act was that it conferred
the negotiable instruments status for warehouse receipts. The negotiability of warehouse receipts provided the much required liquidity to farmers thereby reducing their dependency on money lenders and fetching good prices for farm produce. The WDRA 2007 also spells out standardised procedures in carrying out warehousing activities across the country, thereby helping regulate and develop the Indian warehousing industry.
Following are some of the significant features of the WDRA 2007:-
Significant Features of WDRA 2007
WDRA 2007
Increase investments in warehousing
Enhanced employment opportunities
Farmers seeking higher prices and accurate weights
Banks advances backed by secured and easily liquidated collateral
Facilitates borrowing and hedging for the owner
Enhance business opportunity for Banks
and Insurance
Source: Knight Frank Research
Legal Empowerment of Warehouse ReceiptsLegal empowerment of warehouse receipts was a landmark initiative for farmers that boosted competitiveness of the warehousing industry. The negotiability of warehouse receipts not only stopped distress sale of the farm produce but also ensured obtaining finance against the stored produce. This reduced the farmer’s dependency on money lenders, thereby enhancing the return on investment.
17
RESEARCHINDIA LOGISTICS &
WAREHOUSING REPORT
POLICY AND REGULATIONS
Warehousing Development Regulation Act 2007 (WDRA Act)Agricultural activities in India are carried out largely by small and marginal farmers – whose land holdings amount to less than two hectares. As per Agricultural Census 2001, these small and marginal farmers accounted for over 80 percent of the total 121 million agricultural holdings. They are in constant need of finance for carrying out their farming activities and more so for their personal needs.
Traditionally, their financing needs were met by local traders through an informal money lending system. Credit was often provided by either holding the farm produce as collateral; or in kind i.e. in the form of inputs (seeds, fertilizers, supplements etc.). In order to maximize profits from the harvest, farmers were required to store their produce and buy time to sell their harvest at the correct price. Storage (warehouse) in those days was either not available or owned by the trader/ money lender who actively discouraged the farmer to get credit from other sources. As a result, either, the trader sold the farmers’ produce and deducted the principal and interest or the farmer was pressurised into distress sale to repay debts soon after harvesting - barely recovering his capital. Multiple roles performed by the trader allowed him to exploit the farmer, who found himself in a debt trap. Taking cognizance of this situation, it was imperative on the part of the government to create a conducive environment for the farmers.
The policymakers adopted a pragmatic approach to address the liquidity concerns of farmers by introducing the Warehousing Development Regulation Act (WDRA) 2007. The most important part of this Act was that it conferred
the negotiable instruments status for warehouse receipts. The negotiability of warehouse receipts provided the much required liquidity to farmers thereby reducing their dependency on money lenders and fetching good prices for farm produce. The WDRA 2007 also spells out standardised procedures in carrying out warehousing activities across the country, thereby helping regulate and develop the Indian warehousing industry.
Following are some of the significant features of the WDRA 2007:-
Significant Features of WDRA 2007
WDRAWDRAWDRAWDRA 2007 2007 2007 2007
Increase investments in warehousing
Enhanced employment opportunities
Farmers seeking higher prices and accurate weights
Banks advances backed by secured and easily liquidated collateral
Facilitates borrowing and hedging for the owner
Enhance business opportunity for Banks
and Insurance
Source: Knight Frank Research
Legal Empowerment of Warehouse ReceiptsLegal empowerment of warehouse receipts was a landmark initiative for farmers that boosted competitiveness of the warehousing industry. The negotiability of warehouse receipts not only stopped distress sale of the farm produce but also ensured obtaining finance against the stored produce. This reduced the farmer’s dependency on money lenders, thereby enhancing the return on investment.
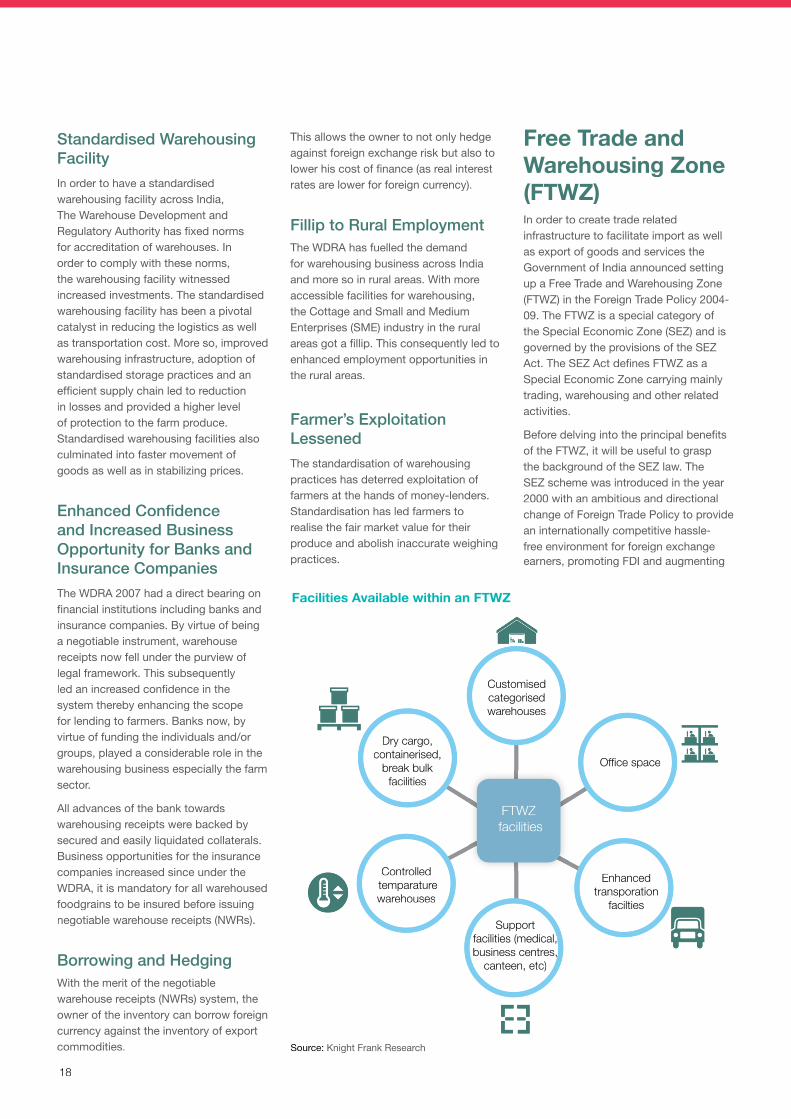
18
Free Trade and Warehousing Zone (FTWZ)In order to create trade related infrastructure to facilitate import as well as export of goods and services the Government of India announced setting up a Free Trade and Warehousing Zone (FTWZ) in the Foreign Trade Policy 2004-09. The FTWZ is a special category of the Special Economic Zone (SEZ) and is governed by the provisions of the SEZ Act. The SEZ Act defines FTWZ as a Special Economic Zone carrying mainly trading, warehousing and other related activities.
Before delving into the principal benefits of the FTWZ, it will be useful to grasp the background of the SEZ law. The SEZ scheme was introduced in the year 2000 with an ambitious and directional change of Foreign Trade Policy to provide an internationally competitive hassle-free environment for foreign exchange earners, promoting FDI and augmenting
Facilities Available within an FTWZ
Source: Knight Frank Research
FTWZ facilities
Customised categorised warehouses
Office space
Enhanced transporation
facilties Support
facilities (medical, business centres,
canteen, etc)
Controlled temparature warehouses
Dry cargo, containerised,
break bulk facilities
Standardised Warehousing FacilityIn order to have a standardised warehousing facility across India, The Warehouse Development and Regulatory Authority has fixed norms for accreditation of warehouses. In order to comply with these norms, the warehousing facility witnessed increased investments. The standardised warehousing facility has been a pivotal catalyst in reducing the logistics as well as transportation cost. More so, improved warehousing infrastructure, adoption of standardised storage practices and an efficient supply chain led to reduction in losses and provided a higher level of protection to the farm produce. Standardised warehousing facilities also culminated into faster movement of goods as well as in stabilizing prices.
Enhanced Confidence and Increased Business Opportunity for Banks and Insurance CompaniesThe WDRA 2007 had a direct bearing on financial institutions including banks and insurance companies. By virtue of being a negotiable instrument, warehouse receipts now fell under the purview of legal framework. This subsequently led an increased confidence in the system thereby enhancing the scope for lending to farmers. Banks now, by virtue of funding the individuals and/or groups, played a considerable role in the warehousing business especially the farm sector.
All advances of the bank towards warehousing receipts were backed by secured and easily liquidated collaterals. Business opportunities for the insurance companies increased since under the WDRA, it is mandatory for all warehoused foodgrains to be insured before issuing negotiable warehouse receipts (NWRs).
Borrowing and Hedging With the merit of the negotiable warehouse receipts (NWRs) system, the owner of the inventory can borrow foreign currency against the inventory of export commodities.
This allows the owner to not only hedge against foreign exchange risk but also to lower his cost of finance (as real interest rates are lower for foreign currency).
Fillip to Rural EmploymentThe WDRA has fuelled the demand for warehousing business across India and more so in rural areas. With more accessible facilities for warehousing, the Cottage and Small and Medium Enterprises (SME) industry in the rural areas got a fillip. This consequently led to enhanced employment opportunities in the rural areas.
Farmer’s Exploitation Lessened The standardisation of warehousing practices has deterred exploitation of farmers at the hands of money-lenders. Standardisation has led farmers to realise the fair market value for their produce and abolish inaccurate weighing practices.
18
Free Trade and Warehousing Zone (FTWZ)In order to create trade related infrastructure to facilitate import as well as export of goods and services the Government of India announced setting up a Free Trade and Warehousing Zone (FTWZ) in the Foreign Trade Policy 2004-09. The FTWZ is a special category of the Special Economic Zone (SEZ) and is governed by the provisions of the SEZ Act. The SEZ Act defines FTWZ as a Special Economic Zone carrying mainly trading, warehousing and other related activities.
Before delving into the principal benefits of the FTWZ, it will be useful to grasp the background of the SEZ law. The SEZ scheme was introduced in the year 2000 with an ambitious and directional change of Foreign Trade Policy to provide an internationally competitive hassle-free environment for foreign exchange earners, promoting FDI and augmenting
Facilities Available within an FTWZ
Source: Knight Frank Research
FTWZ facilities
Customised categorised warehouses
Office space
Enhanced transporation
facilties Support
facilities (medical, facilities (medical, business centres, business centres,
canteen, etc)
Controlled temparature warehouses
Dry cargo, containerised,
break bulk facilities
Standardised Warehousing FacilityIn order to have a standardised warehousing facility across India, The Warehouse Development and Regulatory Authority has fixed norms for accreditation of warehouses. In order to comply with these norms, the warehousing facility witnessed increased investments. The standardised warehousing facility has been a pivotal catalyst in reducing the logistics as well as transportation cost. More so, improved warehousing infrastructure, adoption of standardised storage practices and an efficient supply chain led to reduction in losses and provided a higher level of protection to the farm produce. Standardised warehousing facilities also culminated into faster movement of goods as well as in stabilizing prices.
Enhanced Confidence and Increased Business Opportunity for Banks and Insurance CompaniesThe WDRA 2007 had a direct bearing on financial institutions including banks and insurance companies. By virtue of being a negotiable instrument, warehouse receipts now fell under the purview of legal framework. This subsequently led an increased confidence in the system thereby enhancing the scope for lending to farmers. Banks now, by virtue of funding the individuals and/or groups, played a considerable role in the warehousing business especially the farm sector.
All advances of the bank towards warehousing receipts were backed by secured and easily liquidated collaterals. Business opportunities for the insurance companies increased since under the WDRA, it is mandatory for all warehoused foodgrains to be insured before issuing negotiable warehouse receipts (NWRs).
Borrowing and Hedging With the merit of the negotiable warehouse receipts (NWRs) system, the owner of the inventory can borrow foreign currency against the inventory of export commodities.
This allows the owner to not only hedge against foreign exchange risk but also to lower his cost of finance (as real interest rates are lower for foreign currency).
Fillip to Rural EmploymentThe WDRA has fuelled the demand for warehousing business across India and more so in rural areas. With more accessible facilities for warehousing, the Cottage and Small and Medium Enterprises (SME) industry in the rural areas got a fillip. This consequently led to enhanced employment opportunities in the rural areas.
Farmer’s Exploitation Lessened The standardisation of warehousing practices has deterred exploitation of farmers at the hands of money-lenders. Standardisation has led farmers to realise the fair market value for their produce and abolish inaccurate weighing practices.
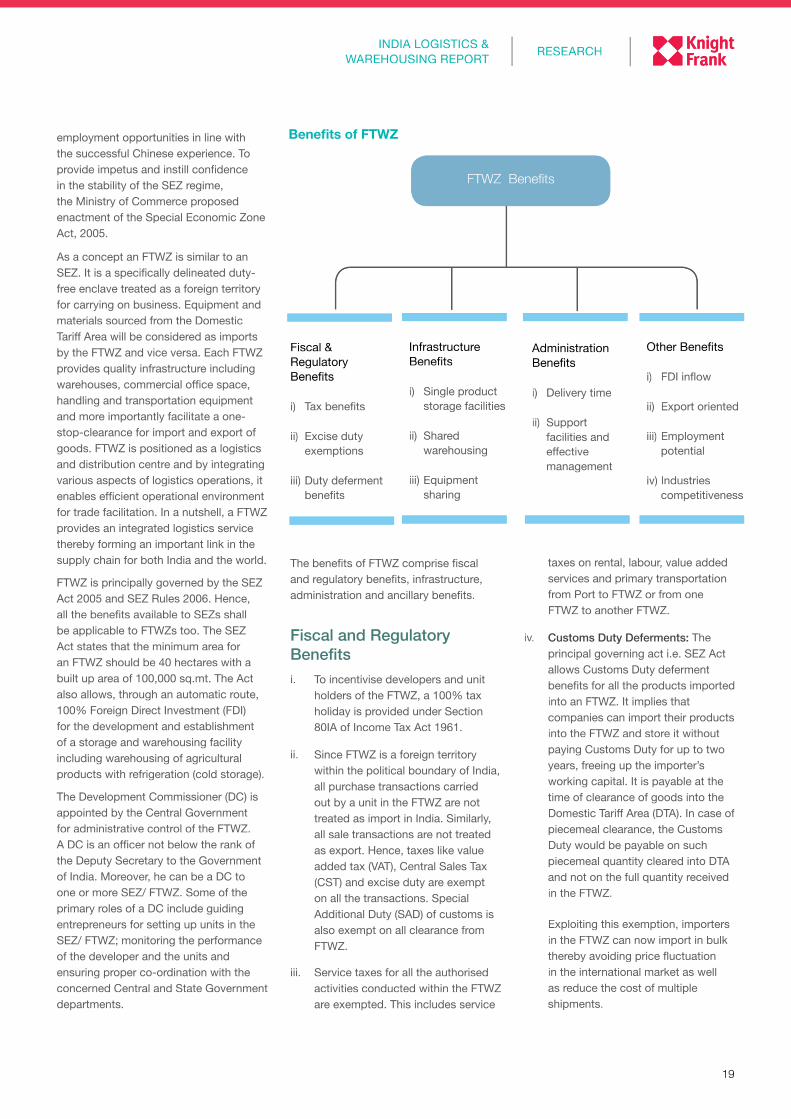
19
RESEARCHINDIA LOGISTICS &
WAREHOUSING REPORT
FTWZ Benefits
Fiscal & Regulatory Benefits
i) Tax benefits
ii) Excise duty exemptions
iii) Duty deferment benefits
Infrastructure Benefits
i) Single product storage facilities
ii) Shared warehousing
iii) Equipment sharing
Administration Benefits
i) Delivery time
ii) Support facilities and effective management
Other Benefits
i) FDI inflow
ii) Export oriented
iii) Employment potential
iv) Industries competitiveness
employment opportunities in line with the successful Chinese experience. To provide impetus and instill confidence in the stability of the SEZ regime, the Ministry of Commerce proposed enactment of the Special Economic Zone Act, 2005.
As a concept an FTWZ is similar to an SEZ. It is a specifically delineated duty-free enclave treated as a foreign territory for carrying on business. Equipment and materials sourced from the Domestic Tariff Area will be considered as imports by the FTWZ and vice versa. Each FTWZ provides quality infrastructure including warehouses, commercial office space, handling and transportation equipment and more importantly facilitate a one-stop-clearance for import and export of goods. FTWZ is positioned as a logistics and distribution centre and by integrating various aspects of logistics operations, it enables efficient operational environment for trade facilitation. In a nutshell, a FTWZ provides an integrated logistics service thereby forming an important link in the supply chain for both India and the world.
FTWZ is principally governed by the SEZ Act 2005 and SEZ Rules 2006. Hence, all the benefits available to SEZs shall be applicable to FTWZs too. The SEZ Act states that the minimum area for an FTWZ should be 40 hectares with a built up area of 100,000 sq.mt. The Act also allows, through an automatic route, 100% Foreign Direct Investment (FDI) for the development and establishment of a storage and warehousing facility including warehousing of agricultural products with refrigeration (cold storage).
The Development Commissioner (DC) is appointed by the Central Government for administrative control of the FTWZ. A DC is an officer not below the rank of the Deputy Secretary to the Government of India. Moreover, he can be a DC to one or more SEZ/ FTWZ. Some of the primary roles of a DC include guiding entrepreneurs for setting up units in the SEZ/ FTWZ; monitoring the performance of the developer and the units and ensuring proper co-ordination with the concerned Central and State Government departments.
The benefits of FTWZ comprise fiscal and regulatory benefits, infrastructure, administration and ancillary benefits.
Fiscal and Regulatory Benefitsi. To incentivise developers and unit
holders of the FTWZ, a 100% tax holiday is provided under Section 80IA of Income Tax Act 1961.
ii. Since FTWZ is a foreign territory within the political boundary of India, all purchase transactions carried out by a unit in the FTWZ are not treated as import in India. Similarly, all sale transactions are not treated as export. Hence, taxes like value added tax (VAT), Central Sales Tax (CST) and excise duty are exempt on all the transactions. Special Additional Duty (SAD) of customs is also exempt on all clearance from FTWZ.
iii. Service taxes for all the authorised activities conducted within the FTWZ are exempted. This includes service
taxes on rental, labour, value added services and primary transportation from Port to FTWZ or from one FTWZ to another FTWZ.
iv. Customs Duty Deferments: The principal governing act i.e. SEZ Act allows Customs Duty deferment benefits for all the products imported into an FTWZ. It implies that companies can import their products into the FTWZ and store it without paying Customs Duty for up to two years, freeing up the importer’s working capital. It is payable at the time of clearance of goods into the Domestic Tariff Area (DTA). In case of piecemeal clearance, the Customs Duty would be payable on such piecemeal quantity cleared into DTA and not on the full quantity received in the FTWZ.
Exploiting this exemption, importers in the FTWZ can now import in bulk thereby avoiding price fluctuation in the international market as well as reduce the cost of multiple shipments.
Benefits of FTWZ
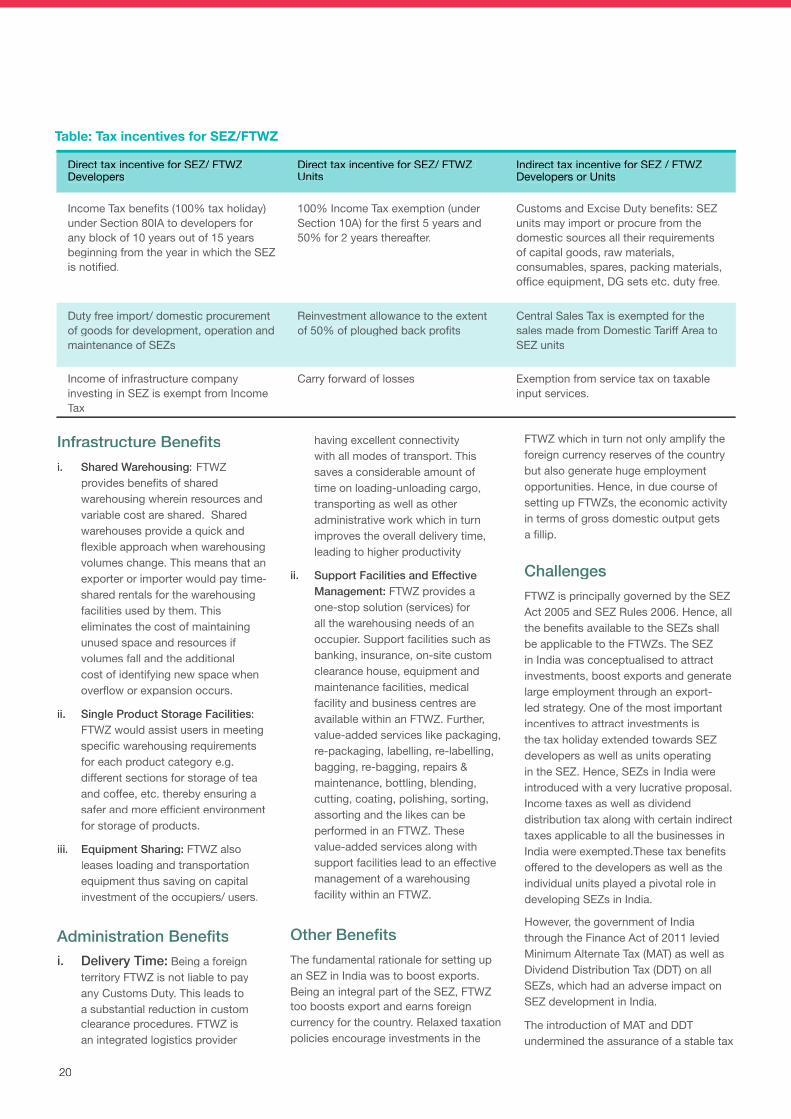
20
Infrastructure Benefitsi. Shared Warehousing: FTWZ
provides benefits of shared warehousing wherein resources and variable cost are shared. Shared warehouses provide a quick and flexible approach when warehousing volumes change. This means that an exporter or importer would pay time-shared rentals for the warehousing facilities used by them. This eliminates the cost of maintaining unused space and resources if volumes fall and the additional cost of identifying new space when overflow or expansion occurs.
ii. Single Product Storage Facilities: FTWZ would assist users in meeting specific warehousing requirements for each product category e.g. different sections for storage of tea and coffee, etc. thereby ensuring a safer and more efficient environment for storage of products.
iii. Equipment Sharing: FTWZ also leases loading and transportation equipment thus saving on capital investment of the occupiers/ users.
Administration Benefitsi. Delivery Time: Being a foreign
territory FTWZ is not liable to pay any Customs Duty. This leads to a substantial reduction in custom clearance procedures. FTWZ is an integrated logistics provider
Direct tax incentive for SEZ/ FTWZ Developers
Direct tax incentive for SEZ/ FTWZ Units
Indirect tax incentive for SEZ / FTWZ Developers or Units
Income Tax benefits (100% tax holiday) under Section 80IA to developers for any block of 10 years out of 15 years beginning from the year in which the SEZ is notified.
100% Income Tax exemption (under Section 10A) for the first 5 years and 50% for 2 years thereafter.
Customs and Excise Duty benefits: SEZ units may import or procure from the domestic sources all their requirements of capital goods, raw materials, consumables, spares, packing materials, office equipment, DG sets etc. duty free.
Duty free import/ domestic procurement of goods for development, operation and maintenance of SEZs
Reinvestment allowance to the extent of 50% of ploughed back profits
Central Sales Tax is exempted for the sales made from Domestic Tariff Area to SEZ units
Income of infrastructure company investing in SEZ is exempt from Income Tax
Carry forward of losses Exemption from service tax on taxable input services.
having excellent connectivity with all modes of transport. This saves a considerable amount of time on loading-unloading cargo, transporting as well as other administrative work which in turn improves the overall delivery time, leading to higher productivity
ii. Support Facilities and Effective Management: FTWZ provides a one-stop solution (services) for all the warehousing needs of an occupier. Support facilities such as banking, insurance, on-site custom clearance house, equipment and maintenance facilities, medical facility and business centres are available within an FTWZ. Further, value-added services like packaging, re-packaging, labelling, re-labelling, bagging, re-bagging, repairs & maintenance, bottling, blending, cutting, coating, polishing, sorting, assorting and the likes can be performed in an FTWZ. These value-added services along with support facilities lead to an effective management of a warehousing facility within an FTWZ.
Other BenefitsThe fundamental rationale for setting up an SEZ in India was to boost exports. Being an integral part of the SEZ, FTWZ too boosts export and earns foreign currency for the country. Relaxed taxation policies encourage investments in the
FTWZ which in turn not only amplify the foreign currency reserves of the country but also generate huge employment opportunities. Hence, in due course of setting up FTWZs, the economic activity in terms of gross domestic output gets a fillip.
ChallengesFTWZ is principally governed by the SEZ Act 2005 and SEZ Rules 2006. Hence, all the benefits available to the SEZs shall be applicable to the FTWZs. The SEZ in India was conceptualised to attract investments, boost exports and generate large employment through an export-led strategy. One of the most important incentives to attract investments is the tax holiday extended towards SEZ developers as well as units operating in the SEZ. Hence, SEZs in India were introduced with a very lucrative proposal. Income taxes as well as dividend distribution tax along with certain indirect taxes applicable to all the businesses in India were exempted.These tax benefits offered to the developers as well as the individual units played a pivotal role in developing SEZs in India.
However, the government of India through the Finance Act of 2011 levied Minimum Alternate Tax (MAT) as well as Dividend Distribution Tax (DDT) on all SEZs, which had an adverse impact on SEZ development in India.
The introduction of MAT and DDT undermined the assurance of a stable tax
Table: Tax incentives for SEZ/FTWZ
20
Infrastructure Benefitsi. Shared Warehousing: FTWZ
provides benefits of shared warehousing wherein resources and variable cost are shared. Shared warehouses provide a quick and flexible approach when warehousing volumes change. This means that an exporter or importer would pay time-shared rentals for the warehousing facilities used by them. This eliminates the cost of maintaining unused space and resources if volumes fall and the additional cost of identifying new space when overflow or expansion occurs.
ii. Single Product Storage Facilities:FTWZ would assist users in meeting specific warehousing requirements for each product category e.g. different sections for storage of tea and coffee, etc. thereby ensuring a safer and more efficient environment for storage of products.
iii. Equipment Sharing: FTWZ also leases loading and transportation equipment thus saving on capital investment of the occupiers/ users.
Administration Benefitsi. Delivery Time: Being a foreign
territory FTWZ is not liable to pay any Customs Duty. This leads to a substantial reduction in custom clearance procedures. FTWZ is an integrated logistics provider
Direct tax incentive for SEZ/ FTWZ Developers
Direct tax incentive for SEZ/ FTWZ Units
Indirect tax incentive for SEZ / FTWZ Developers or Units
Income Tax benefits (100% tax holiday) under Section 80IA to developers for any block of 10 years out of 15 years beginning from the year in which the SEZ is notified.
100% Income Tax exemption (under Section 10A) for the first 5 years and 50% for 2 years thereafter.
Customs and Excise Duty benefits: SEZ units may import or procure from the domestic sources all their requirements of capital goods, raw materials, consumables, spares, packing materials, office equipment, DG sets etc. duty free.
Duty free import/ domestic procurement of goods for development, operation and maintenance of SEZs
Reinvestment allowance to the extent of 50% of ploughed back profits
Central Sales Tax is exempted for the sales made from Domestic Tariff Area to SEZ units
Income of infrastructure company investing in SEZ is exempt from Income Tax
Carry forward of losses Exemption from service tax on taxable input services.
having excellent connectivity with all modes of transport. This saves a considerable amount of time on loading-unloading cargo, transporting as well as other administrative work which in turn improves the overall delivery time, leading to higher productivity
ii. Support Facilities and Effective Management: FTWZ provides a one-stop solution (services) for all the warehousing needs of an occupier. Support facilities such as banking, insurance, on-site custom clearance house, equipment and maintenance facilities, medical facility and business centres are available within an FTWZ. Further, value-added services like packaging, re-packaging, labelling, re-labelling, bagging, re-bagging, repairs & maintenance, bottling, blending, cutting, coating, polishing, sorting, assorting and the likes can be performed in an FTWZ. These value-added services along with support facilities lead to an effective management of a warehousing facility within an FTWZ.
Other BenefitsThe fundamental rationale for setting up an SEZ in India was to boost exports. Being an integral part of the SEZ, FTWZ too boosts export and earns foreign currency for the country. Relaxed taxation policies encourage investments in the
FTWZ which in turn not only amplify the foreign currency reserves of the country but also generate huge employment opportunities. Hence, in due course of setting up FTWZs, the economic activity in terms of gross domestic output gets a fillip.
ChallengesFTWZ is principally governed by the SEZ Act 2005 and SEZ Rules 2006. Hence, all the benefits available to the SEZs shall be applicable to the FTWZs. The SEZ in India was conceptualised to attract investments, boost exports and generate large employment through an export-led strategy. One of the most important incentives to attract investments is the tax holiday extended towards SEZ developers as well as units operating in the SEZ. Hence, SEZs in India were introduced with a very lucrative proposal. Income taxes as well as dividend distribution tax along with certain indirect taxes applicable to all the businesses in India were exempted.These tax benefits offered to the developers as well as the individual units played a pivotal role in developing SEZs in India.
However, the government of India through the Finance Act of 2011 levied Minimum Alternate Tax (MAT) as well as Dividend Distribution Tax (DDT) on all SEZs, which had an adverse impact on SEZ development in India.
The introduction of MAT and DDT undermined the assurance of a stable tax
Table: Tax incentives for SEZ/FTWZ
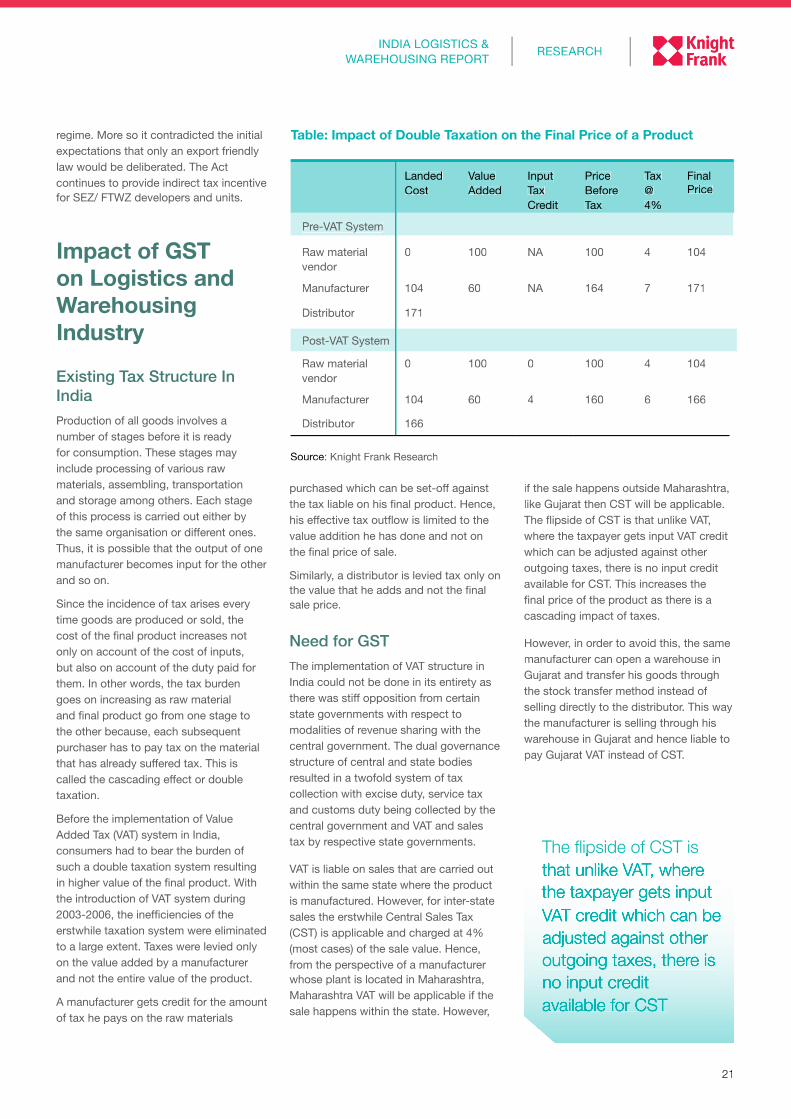
21
RESEARCHINDIA LOGISTICS &
WAREHOUSING REPORT
regime. More so it contradicted the initial expectations that only an export friendly law would be deliberated. The Act continues to provide indirect tax incentive for SEZ/ FTWZ developers and units.
Impact of GST on Logistics and Warehousing Industry
Existing Tax Structure In IndiaProduction of all goods involves a number of stages before it is ready for consumption. These stages may include processing of various raw materials, assembling, transportation and storage among others. Each stage of this process is carried out either by the same organisation or different ones. Thus, it is possible that the output of one manufacturer becomes input for the other and so on.
Since the incidence of tax arises every time goods are produced or sold, the cost of the final product increases not only on account of the cost of inputs, but also on account of the duty paid for them. In other words, the tax burden goes on increasing as raw material and final product go from one stage to the other because, each subsequent purchaser has to pay tax on the material that has already suffered tax. This is called the cascading effect or double taxation.
Before the implementation of Value Added Tax (VAT) system in India, consumers had to bear the burden of such a double taxation system resulting in higher value of the final product. With the introduction of VAT system during 2003-2006, the inefficiencies of the erstwhile taxation system were eliminated to a large extent. Taxes were levied only on the value added by a manufacturer and not the entire value of the product.
A manufacturer gets credit for the amount of tax he pays on the raw materials
purchased which can be set-off against the tax liable on his final product. Hence, his effective tax outflow is limited to the value addition he has done and not on the final price of sale.
Similarly, a distributor is levied tax only on the value that he adds and not the final sale price.
Need for GSTThe implementation of VAT structure in India could not be done in its entirety as there was stiff opposition from certain state governments with respect to modalities of revenue sharing with the central government. The dual governance structure of central and state bodies resulted in a twofold system of tax collection with excise duty, service tax and customs duty being collected by the central government and VAT and sales tax by respective state governments.
VAT is liable on sales that are carried out within the same state where the product is manufactured. However, for inter-state sales the erstwhile Central Sales Tax (CST) is applicable and charged at 4% (most cases) of the sale value. Hence, from the perspective of a manufacturer whose plant is located in Maharashtra, Maharashtra VAT will be applicable if the sale happens within the state. However,
Table: Impact of Double Taxation on the Final Price of a Product
Landed Cost
Value Added
Input Tax Credit
Price Before Tax
Tax @ 4%
Final Price
Pre-VAT System
Raw material vendor
0 100 NA 100 4 104
Manufacturer 104 60 NA 164 7 171
Distributor 171
Post-VAT System
Raw material vendor
0 100 0 100 4 104
Manufacturer 104 60 4 160 6 166
Distributor 166
Source: Knight Frank Research
if the sale happens outside Maharashtra, like Gujarat then CST will be applicable. The flipside of CST is that unlike VAT, where the taxpayer gets input VAT credit which can be adjusted against other outgoing taxes, there is no input credit available for CST. This increases the final price of the product as there is a cascading impact of taxes.
However, in order to avoid this, the same manufacturer can open a warehouse in Gujarat and transfer his goods through the stock transfer method instead of selling directly to the distributor. This way the manufacturer is selling through his warehouse in Gujarat and hence liable to pay Gujarat VAT instead of CST.
The flipside of CST is that unlike VAT, where the taxpayer gets input VAT credit which can be adjusted against other outgoing taxes, there is no input creditavailable for CST
21
RESEARCHINDIA LOGISTICS &
WAREHOUSING REPORT
regime. More so it contradicted the initial expectations that only an export friendly law would be deliberated. The Act continues to provide indirect tax incentive for SEZ/ FTWZ developers and units.
Impact of GST on Logistics and Warehousing Industry
Existing Tax Structure In IndiaProduction of all goods involves a number of stages before it is ready for consumption. These stages may include processing of various raw materials, assembling, transportation and storage among others. Each stage of this process is carried out either by the same organisation or different ones. Thus, it is possible that the output of one manufacturer becomes input for the other and so on.
Since the incidence of tax arises every time goods are produced or sold, the cost of the final product increases not only on account of the cost of inputs, but also on account of the duty paid for them. In other words, the tax burden goes on increasing as raw material and final product go from one stage to the other because, each subsequent purchaser has to pay tax on the material that has already suffered tax. This is called the cascading effect or double taxation.
Before the implementation of Value Added Tax (VAT) system in India, consumers had to bear the burden of such a double taxation system resulting in higher value of the final product. With the introduction of VAT system during 2003-2006, the inefficiencies of the erstwhile taxation system were eliminated to a large extent. Taxes were levied only on the value added by a manufacturer and not the entire value of the product.
A manufacturer gets credit for the amount of tax he pays on the raw materials
purchased which can be set-off against the tax liable on his final product. Hence, his effective tax outflow is limited to the value addition he has done and not on the final price of sale.
Similarly, a distributor is levied tax only on the value that he adds and not the final sale price.
Need for GSTThe implementation of VAT structure in India could not be done in its entirety as there was stiff opposition from certain state governments with respect to modalities of revenue sharing with the central government. The dual governance structure of central and state bodies resulted in a twofold system of tax collection with excise duty, service tax and customs duty being collected by the central government and VAT and sales tax by respective state governments.
VAT is liable on sales that are carried out within the same state where the product is manufactured. However, for inter-state sales the erstwhile Central Sales Tax (CST) is applicable and charged at 4% (most cases) of the sale value. Hence, from the perspective of a manufacturer whose plant is located in Maharashtra, Maharashtra VAT will be applicable if the sale happens within the state. However,
Table: Impact of Double Taxation on the Final Price of a Product
Landed Cost
Value Added
Input Tax Credit
Price Before Tax
Tax @ 4%
Final Price
Pre-VAT System
Raw material vendor
0 100 NA 100 4 104
Manufacturer 104 60 NA 164 7 171
Distributor 171
Post-VAT System
Raw material vendor
0 100 0 100 4 104
Manufacturer 104 60 4 160 6 166
Distributor 166
Source: Knight Frank Research
if the sale happens outside Maharashtra, like Gujarat then CST will be applicable. The flipside of CST is that unlike VAT, where the taxpayer gets input VAT credit which can be adjusted against other outgoing taxes, there is no input credit available for CST. This increases the final price of the product as there is a cascading impact of taxes.
However, in order to avoid this, the same manufacturer can open a warehouse in Gujarat and transfer his goods through the stock transfer method instead of selling directly to the distributor. This way the manufacturer is selling through his warehouse in Gujarat and hence liable to pay Gujarat VAT instead of CST.
The flipside of CST is The flipside of CST is that unlike VAT, where the taxpayer gets input VAT credit which can be adjusted against other outgoing taxes, there is no input creditavailable for CST

22
Source: Knight Frank Research
Landed Cost
Value Added
Input Tax Credit
Price Before Tax
CST @ 4% VAT @ 4% Final Price
Direct sale to distributor with CST implication
Manufacturer 100 60 0 160 6 NA 166
Distributor 166 10 0 176 NA 7 183
Retailer 183 20 7 196 NA 8 204
Consumer 204
Sale through warehouse without CST implication
Manufacturer 100 60 0 160 NA NA 160
Warehouse 160 0 0 160 NA 6 166
Distributor 166 10 6 170 NA 7 177
Retailer 177 20 7 190 NA 8 198
Consumer 198
Table: Impact of CST on Final Price of a Product
Impact of Tax Structure on Warehousing Strategy
Manufacturer Maharashtra
The above two scenarios clearly show that distributors will avoid buying directly from the manufacturer in another state and prefer buying from a warehouse in the same state. Such a tax structure in India has forced companies to locate warehouses in all the states where they operate resulting in an inefficient supply chain. Hence, instead of creating an effective supply chain by strategically locating warehouses, the focus remains on tax efficiencies. This has shaped the need for bringing in an efficient tax structure that eliminates the state boundaries by creating a common market place for India. The concept of Goods and Service Tax (GST) is a move in this direction.
Gujarat VAT Gujarat VAT
Gujarat VAT
Maharashtra VAT
Maharashtra VAT
Stock Transfer
Gujarat
Gujarat
Maharashtra
Maharashtra
Gujarat
Source: Knight Frank Research
CST
Retailer
GujaratRetailer
Retailer
DistributorWarehouse
Gujarat
Distributor
Distributor
22
Source: Knight Frank Research
Landed Cost
Value Added
Input Tax Credit
Price Before Tax
CST @ 4% VAT @ 4% Final Price
Direct sale to distributor with CST implication
Manufacturer 100 60 0 160 6 NA 166
Distributor 166 10 0 176 NA 7 183
Retailer 183 20 7 196 NA 8 204
Consumer 204
Sale through warehouse without CST implication
Manufacturer 100 60 0 160 NA NA 160
Warehouse 160 0 0 160 NA 6 166
Distributor 166 10 6 170 NA 7 177
Retailer 177 20 7 190 NA 8 198
Consumer 198
Table: Impact of CST on Final Price of a Product
Impact of Tax Structure on Warehousing Strategy
Manufacturer Maharashtra
The above two scenarios clearly show that distributors will avoid buying directly from the manufacturer in another state and prefer buying from a warehouse in the same state. Such a tax structure in India has forced companies to locate warehouses in all the states where they operate resulting in an inefficient supply chain. Hence, instead of creating an effective supply chain by strategically locating warehouses, the focus remains on tax efficiencies. This has shaped the need for bringing in an efficient tax structure that eliminates the state boundaries by creating a common market place for India. The concept of Goods and Service Tax (GST) is a move in this direction.
Gujarat VAT Gujarat VAT
Gujarat VAT
Maharashtra VAT
Maharashtra VAT
Stock Transfer
Gujarat
Maharashtra
Maharashtra
Gujarat
Source: Knight Frank Research
CST
Retailer
GujaratRetailer
Retailer
DistributorWarehouse
Gujarat
Gujarat
Distributor
Distributor
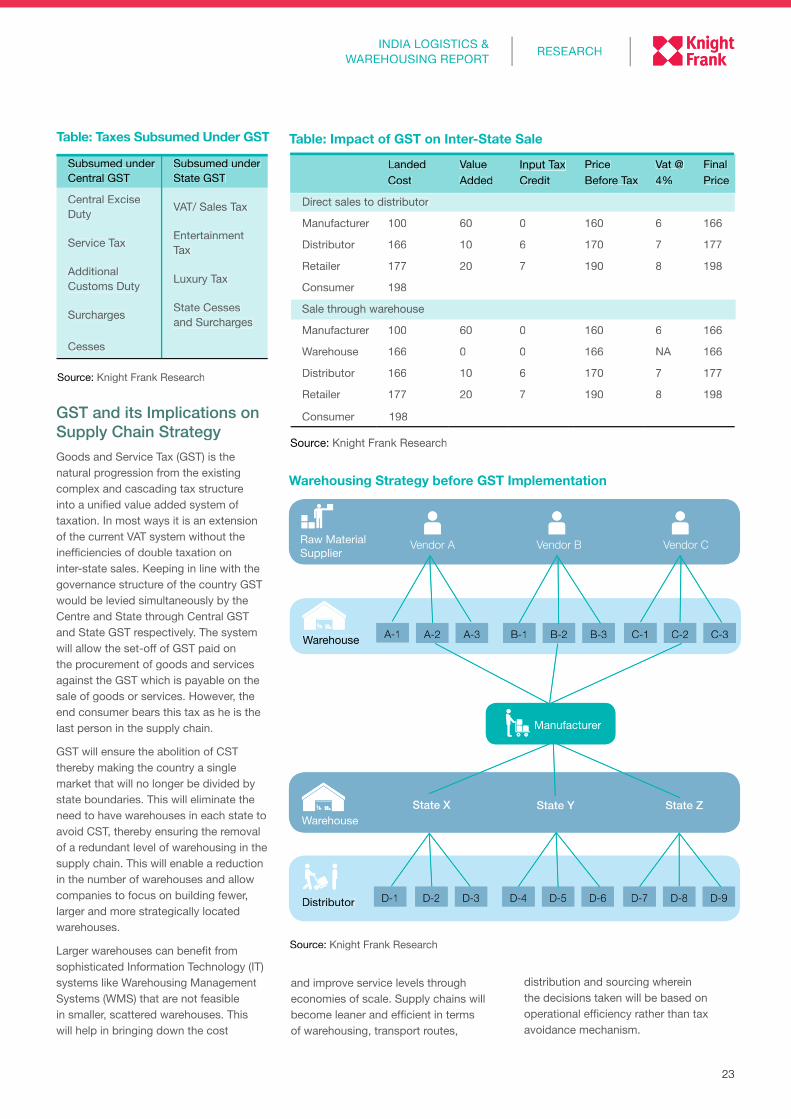
23
RESEARCHINDIA LOGISTICS &
WAREHOUSING REPORT
GST and its Implications on Supply Chain StrategyGoods and Service Tax (GST) is the natural progression from the existing complex and cascading tax structure into a unified value added system of taxation. In most ways it is an extension of the current VAT system without the inefficiencies of double taxation on inter-state sales. Keeping in line with the governance structure of the country GST would be levied simultaneously by the Centre and State through Central GST and State GST respectively. The system will allow the set-off of GST paid on the procurement of goods and services against the GST which is payable on the sale of goods or services. However, the end consumer bears this tax as he is the last person in the supply chain.
GST will ensure the abolition of CST thereby making the country a single market that will no longer be divided by state boundaries. This will eliminate the need to have warehouses in each state to avoid CST, thereby ensuring the removal of a redundant level of warehousing in the supply chain. This will enable a reduction in the number of warehouses and allow companies to focus on building fewer, larger and more strategically located warehouses.
Larger warehouses can benefit from sophisticated Information Technology (IT) systems like Warehousing Management Systems (WMS) that are not feasible in smaller, scattered warehouses. This will help in bringing down the cost
and improve service levels through economies of scale. Supply chains will become leaner and efficient in terms of warehousing, transport routes,
Source: Knight Frank Research
Subsumed under Central GST
Subsumed under State GST
Central Excise Duty VAT/ Sales Tax
Service Tax Entertainment Tax
Additional Customs Duty Luxury Tax
Surcharges State Cesses and Surcharges
Cesses
Table: Taxes Subsumed Under GST
distribution and sourcing wherein the decisions taken will be based on operational efficiency rather than tax avoidance mechanism.
Landed Cost
Value Added
Input Tax Credit
Price Before Tax
Vat @ 4%
Final Price
Direct sales to distributor
Manufacturer 100 60 0 160 6 166
Distributor 166 10 6 170 7 177
Retailer 177 20 7 190 8 198
Consumer 198
Sale through warehouse
Manufacturer 100 60 0 160 6 166
Warehouse 166 0 0 166 NA 166
Distributor 166 10 6 170 7 177
Retailer 177 20 7 190 8 198
Consumer 198
Source: Knight Frank Research
Table: Impact of GST on Inter-State Sale
Warehousing Strategy before GST Implementation
Raw Material Supplier
Warehouse
Warehouse
Distributor
Vendor A
State X
Manufacturer
Vendor B
State Y
Vendor C
State Z
Source: Knight Frank Research
A-1 A-2 A-3 B-1 B-2 B-3 C-1 C-2 C-3
D-1 D-2 D-3 D-4 D-5 D-6 D-7 D-8 D-9
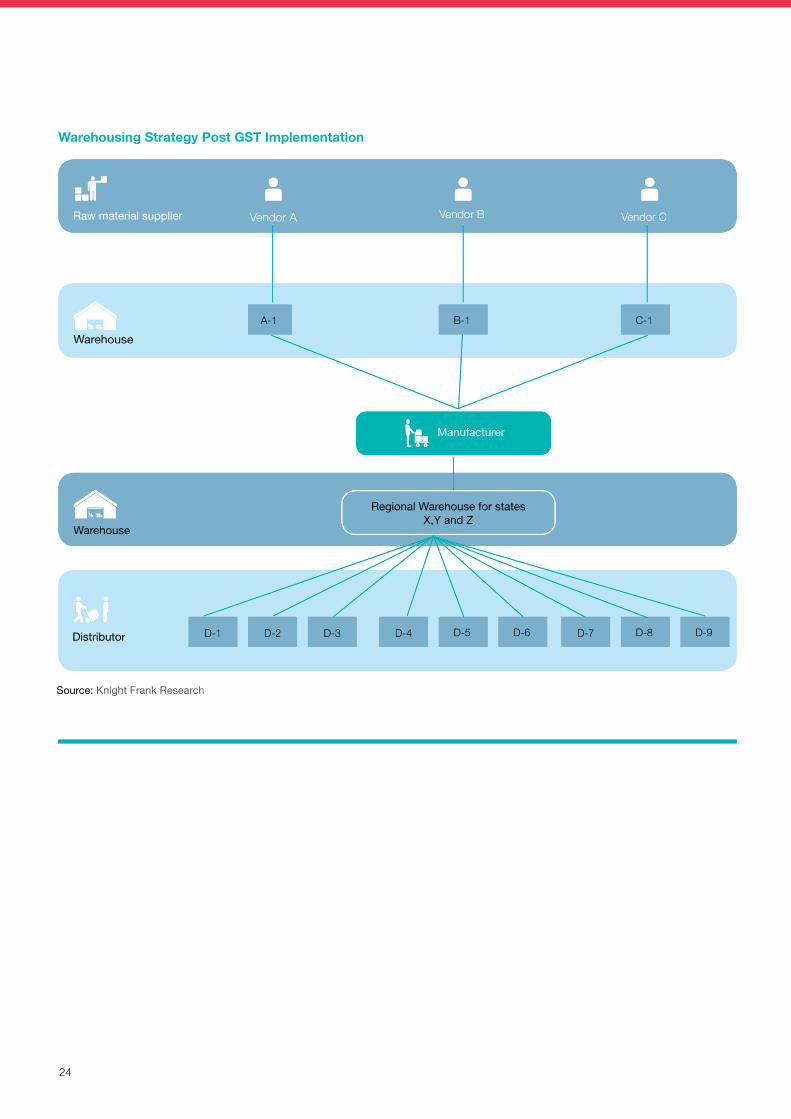
24
Warehousing Strategy Post GST Implementation
Raw material supplier
Warehouse
Warehouse
Distributor
Vendor A Vendor B
Regional Warehouse for states X,Y and Z
Vendor C
Source: Knight Frank Research
A-1 B-1 C-1
Manufacturer
D-1 D-2 D-3 D-4 D-5 D-6 D-7 D-8 D-9
24
Warehousing Strategy Post GST Implementation
Raw material supplier
Warehouse
Warehouse
Distributor
Vendor A Vendor B
Regional Warehouse for statesX,Y and Z
Vendor C
Source: Knight Frank Research
A-1 B-1 C-1
Manufacturer
D-1 D-2 D-3 D-4 D-5 D-6 D-7 D-8 D-9
25
RESEARCHINDIA LOGISTICS &
WAREHOUSING REPORT
25
RESEARCHINDIA LOGISTICS &
WAREHOUSING REPORT
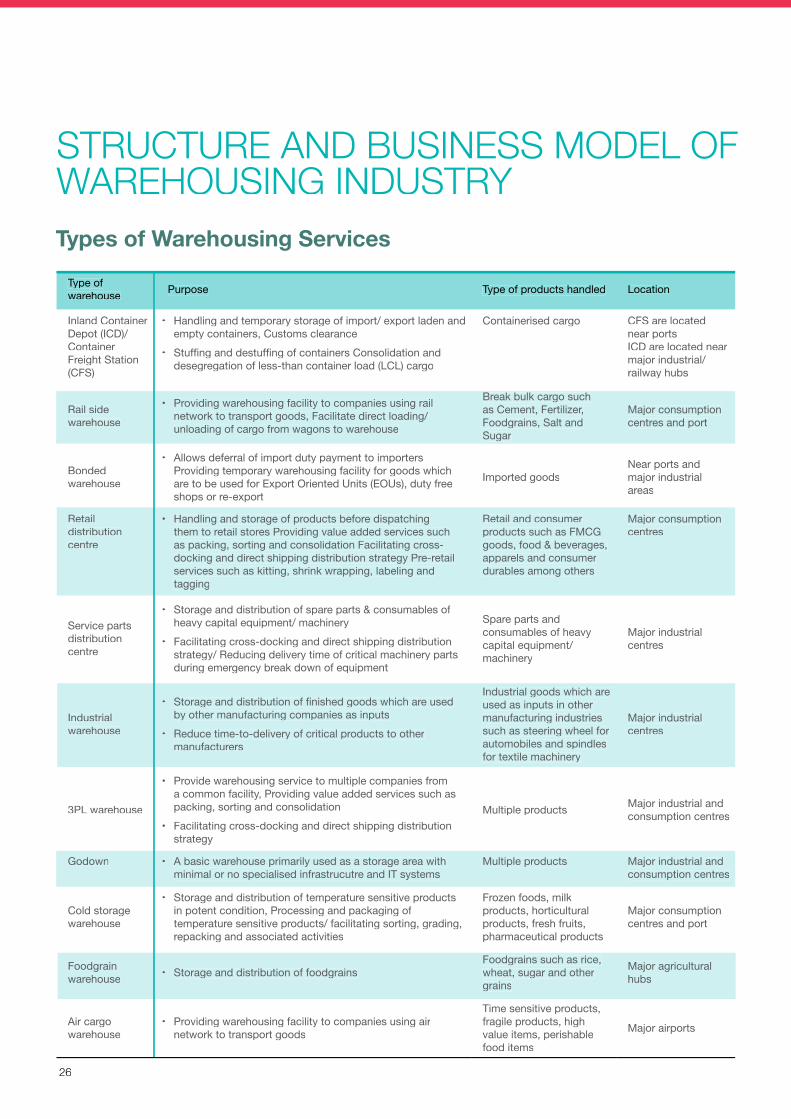
26
STRUCTURE AND BUSINESS MODEL OF WAREHOUSING INDUSTRY
Type of warehouse Purpose Type of products handled Location
Inland Container Depot (ICD)/Container Freight Station (CFS)
• Handling and temporary storage of import/ export laden and empty containers, Customs clearance
• Stuffing and destuffing of containers Consolidation and desegregation of less-than container load (LCL) cargo
Containerised cargo CFS are located near ports ICD are located near major industrial/railway hubs
Rail side warehouse
• Providing warehousing facility to companies using rail network to transport goods, Facilitate direct loading/ unloading of cargo from wagons to warehouse
Break bulk cargo such as Cement, Fertilizer, Foodgrains, Salt and Sugar
Major consumption centres and port
Bonded warehouse
• Allows deferral of import duty payment to importers Providing temporary warehousing facility for goods which are to be used for Export Oriented Units (EOUs), duty free shops or re-export
Imported goodsNear ports and major industrial areas
Retail distribution centre
• Handling and storage of products before dispatching them to retail stores Providing value added services such as packing, sorting and consolidation Facilitating cross-docking and direct shipping distribution strategy Pre-retail services such as kitting, shrink wrapping, labeling and tagging
Retail and consumer products such as FMCG goods, food & beverages, apparels and consumer durables among others
Major consumption centres
Service parts distribution centre
• Storage and distribution of spare parts & consumables of heavy capital equipment/ machinery
• Facilitating cross-docking and direct shipping distribution strategy/ Reducing delivery time of critical machinery parts during emergency break down of equipment
Spare parts and consumables of heavy capital equipment/machinery
Major industrial centres
Industrial warehouse
• Storage and distribution of finished goods which are used by other manufacturing companies as inputs
• Reduce time-to-delivery of critical products to other manufacturers
Industrial goods which are used as inputs in other manufacturing industries such as steering wheel for automobiles and spindles for textile machinery
Major industrial centres
3PL warehouse
• Provide warehousing service to multiple companies from a common facility, Providing value added services such as packing, sorting and consolidation
• Facilitating cross-docking and direct shipping distribution strategy
Multiple products Major industrial and consumption centres
Godown • A basic warehouse primarily used as a storage area with minimal or no specialised infrastrucutre and IT systems
Multiple products Major industrial and consumption centres
Cold storage warehouse
• Storage and distribution of temperature sensitive products in potent condition, Processing and packaging of temperature sensitive products/ facilitating sorting, grading, repacking and associated activities
Frozen foods, milk products, horticultural products, fresh fruits, pharmaceutical products
Major consumption centres and port
Foodgrain warehouse • Storage and distribution of foodgrains
Foodgrains such as rice, wheat, sugar and other grains
Major agricultural hubs
Air cargo warehouse
• Providing warehousing facility to companies using air network to transport goods
Time sensitive products, fragile products, high value items, perishable food items
Major airports
Types of Warehousing Services
26
STRUCTURE AND BUSINESS MODEL OF WAREHOUSING INDUSTRY
Type of warehouse Purpose Type of products handled Location
Inland Container Depot (ICD)/Container Freight Station (CFS)
• Handling and temporary storage of import/ export laden and empty containers, Customs clearance
• Stuffing and destuffing of containers Consolidation and desegregation of less-than container load (LCL) cargo
Containerised cargo CFS are located near portsICD are located near major industrial/railway hubs
Rail side warehouse
• Providing warehousing facility to companies using rail network to transport goods, Facilitate direct loading/ unloading of cargo from wagons to warehouse
Break bulk cargo such as Cement, Fertilizer, Foodgrains, Salt and Sugar
Major consumption centres and port
Bonded warehouse
• Allows deferral of import duty payment to importersProviding temporary warehousing facility for goods which are to be used for Export Oriented Units (EOUs), duty free shops or re-export
Imported goodsNear ports and major industrial areas
Retail distribution centre
• Handling and storage of products before dispatching them to retail stores Providing value added services such as packing, sorting and consolidation Facilitating cross-docking and direct shipping distribution strategy Pre-retail services such as kitting, shrink wrapping, labeling and tagging
Retail and consumer products such as FMCG goods, food & beverages, apparels and consumer durables among others
Major consumption centres
Service parts distribution centre
• Storage and distribution of spare parts & consumables of heavy capital equipment/ machinery
• Facilitating cross-docking and direct shipping distribution strategy/ Reducing delivery time of critical machinery parts during emergency break down of equipment
Spare parts and consumables of heavy capital equipment/machinery
Major industrial centres
Industrial warehouse
• Storage and distribution of finished goods which are used by other manufacturing companies as inputs
• Reduce time-to-delivery of critical products to other manufacturers
Industrial goods which are used as inputs in other manufacturing industries such as steering wheel for automobiles and spindles for textile machinery
Major industrial centres
3PL warehouse
• Provide warehousing service to multiple companies from a common facility, Providing value added services such as packing, sorting and consolidation
• Facilitating cross-docking and direct shipping distribution strategy
Multiple products Major industrial and consumption centres
Godown • A basic warehouse primarily used as a storage area with minimal or no specialised infrastrucutre and IT systems
Multiple products Major industrial and consumption centres
Cold storage warehouse
• Storage and distribution of temperature sensitive products in potent condition, Processing and packaging of temperature sensitive products/ facilitating sorting, grading, repacking and associated activities
Frozen foods, milk products, horticultural products, fresh fruits, pharmaceutical products
Major consumption centres and port
Foodgrain warehouse • Storage and distribution of foodgrains
Foodgrains such as rice, wheat, sugar and other grains
Major agricultural hubs
Air cargo warehouse
• Providing warehousing facility to companies using air network to transport goods
Time sensitive products, fragile products, high value items, perishable food items
Major airports
Types of Warehousing Services
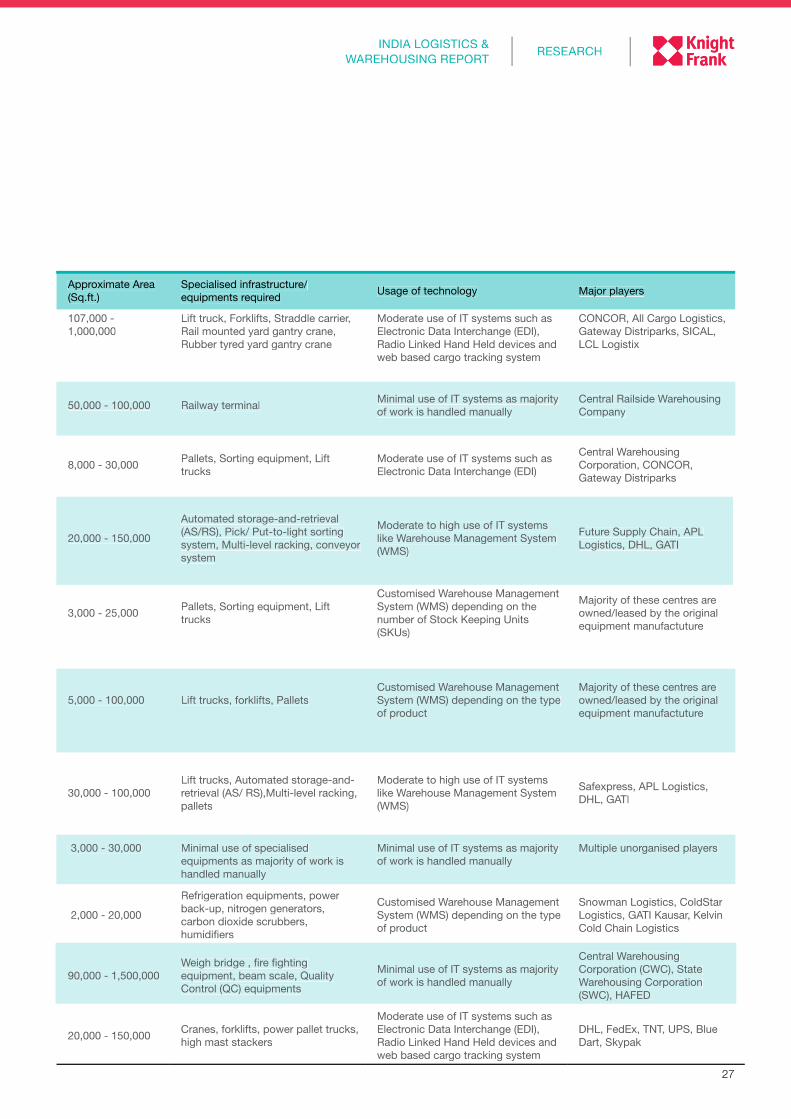
27
RESEARCHINDIA LOGISTICS &
WAREHOUSING REPORT
Approximate Area (Sq.ft.)
Specialised infrastructure/ equipments required Usage of technology Major players
107,000 - 1,000,000
Lift truck, Forklifts, Straddle carrier, Rail mounted yard gantry crane, Rubber tyred yard gantry crane
Moderate use of IT systems such as Electronic Data Interchange (EDI), Radio Linked Hand Held devices and web based cargo tracking system
CONCOR, All Cargo Logistics, Gateway Distriparks, SICAL, LCL Logistix
50,000 - 100,000 Railway terminal Minimal use of IT systems as majority of work is handled manually
Central Railside Warehousing Company
8,000 - 30,000 Pallets, Sorting equipment, Lift trucks
Moderate use of IT systems such as Electronic Data Interchange (EDI)
Central Warehousing Corporation, CONCOR, Gateway Distriparks
20,000 - 150,000
Automated storage-and-retrieval (AS/RS), Pick/ Put-to-light sorting system, Multi-level racking, conveyor system
Moderate to high use of IT systems like Warehouse Management System (WMS)
Future Supply Chain, APL Logistics, DHL, GATI
3,000 - 25,000 Pallets, Sorting equipment, Lift trucks
Customised Warehouse Management System (WMS) depending on the number of Stock Keeping Units (SKUs)
Majority of these centres are owned/leased by the original equipment manufactuture
5,000 - 100,000 Lift trucks, forklifts, PalletsCustomised Warehouse Management System (WMS) depending on the type of product
Majority of these centres are owned/leased by the original equipment manufactuture
30,000 - 100,000Lift trucks, Automated storage-and-retrieval (AS/ RS),Multi-level racking, pallets
Moderate to high use of IT systems like Warehouse Management System (WMS)
Safexpress, APL Logistics, DHL, GATI
3,000 - 30,000 Minimal use of specialised equipments as majority of work is handled manually
Minimal use of IT systems as majority of work is handled manually
Multiple unorganised players
2,000 - 20,000
Refrigeration equipments, power back-up, nitrogen generators, carbon dioxide scrubbers, humidifiers
Customised Warehouse Management System (WMS) depending on the type of product
Snowman Logistics, ColdStar Logistics, GATI Kausar, Kelvin Cold Chain Logistics
90,000 - 1,500,000Weigh bridge , fire fighting equipment, beam scale, Quality Control (QC) equipments
Minimal use of IT systems as majority of work is handled manually
Central Warehousing Corporation (CWC), State Warehousing Corporation (SWC), HAFED
20,000 - 150,000 Cranes, forklifts, power pallet trucks, high mast stackers
Moderate use of IT systems such as Electronic Data Interchange (EDI), Radio Linked Hand Held devices and web based cargo tracking system
DHL, FedEx, TNT, UPS, Blue Dart, Skypak
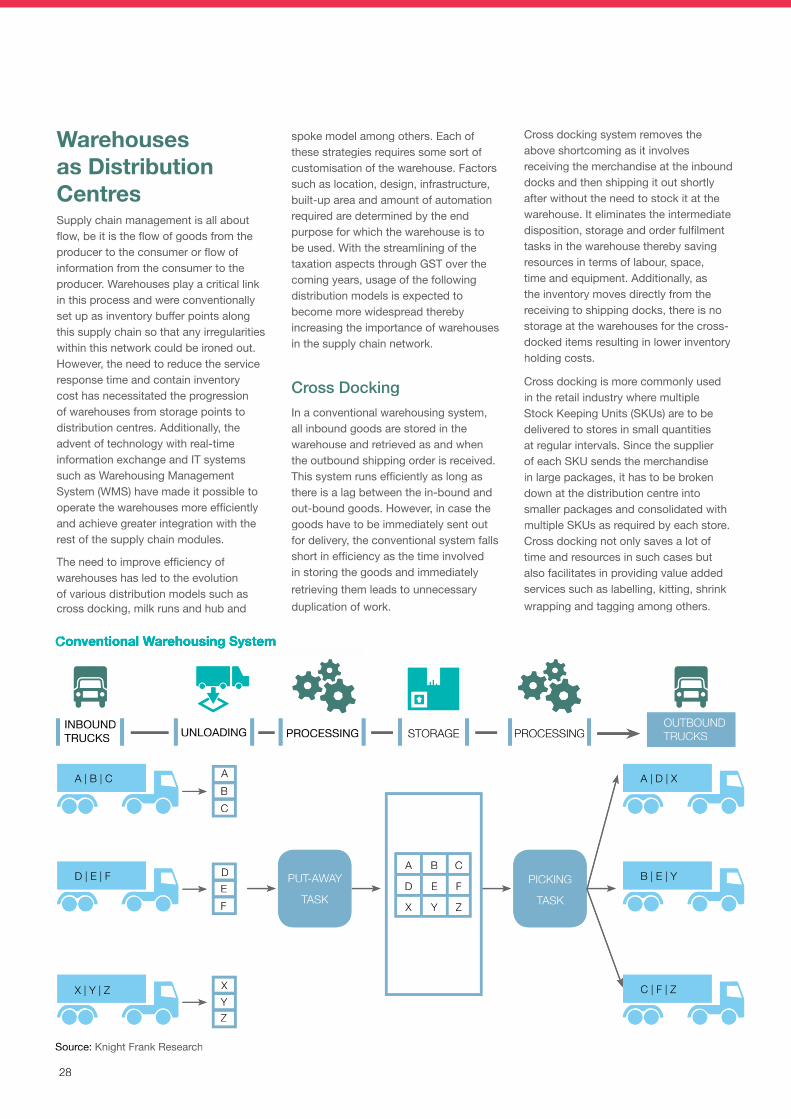
28
Warehouses as Distribution CentresSupply chain management is all about flow, be it is the flow of goods from the producer to the consumer or flow of information from the consumer to the producer. Warehouses play a critical link in this process and were conventionally set up as inventory buffer points along this supply chain so that any irregularities within this network could be ironed out. However, the need to reduce the service response time and contain inventory cost has necessitated the progression of warehouses from storage points to distribution centres. Additionally, the advent of technology with real-time information exchange and IT systems such as Warehousing Management System (WMS) have made it possible to operate the warehouses more efficiently and achieve greater integration with the rest of the supply chain modules.
The need to improve efficiency of warehouses has led to the evolution of various distribution models such as cross docking, milk runs and hub and
spoke model among others. Each of these strategies requires some sort of customisation of the warehouse. Factors such as location, design, infrastructure, built-up area and amount of automation required are determined by the end purpose for which the warehouse is to be used. With the streamlining of the taxation aspects through GST over the coming years, usage of the following distribution models is expected to become more widespread thereby increasing the importance of warehouses in the supply chain network.
Cross DockingIn a conventional warehousing system, all inbound goods are stored in the warehouse and retrieved as and when the outbound shipping order is received. This system runs efficiently as long as there is a lag between the in-bound and out-bound goods. However, in case the goods have to be immediately sent out for delivery, the conventional system falls short in efficiency as the time involved in storing the goods and immediately retrieving them leads to unnecessary duplication of work.
Cross docking system removes the above shortcoming as it involves receiving the merchandise at the inbound docks and then shipping it out shortly after without the need to stock it at the warehouse. It eliminates the intermediate disposition, storage and order fulfilment tasks in the warehouse thereby saving resources in terms of labour, space, time and equipment. Additionally, as the inventory moves directly from the receiving to shipping docks, there is no storage at the warehouses for the cross-docked items resulting in lower inventory holding costs.
Cross docking is more commonly used in the retail industry where multiple Stock Keeping Units (SKUs) are to be delivered to stores in small quantities at regular intervals. Since the supplier of each SKU sends the merchandise in large packages, it has to be broken down at the distribution centre into smaller packages and consolidated with multiple SKUs as required by each store. Cross docking not only saves a lot of time and resources in such cases but also facilitates in providing value added services such as labelling, kitting, shrink wrapping and tagging among others.
OUTBOUND TRUCKS
PUT-AWAY
TASKPICKING
TASK
PROCESSINGUNLOADINGINBOUND TRUCKS STORAGEPROCESSING
A | B | C A | D | X
D | E | F
X | Y | Z
B | E | Y
C | F | Z
A
D
X
B
E
Y
C
F
Z
A B C
D E F
X Y Z
Source: Knight Frank Research
Conventional Warehousing System
28
Warehouses as Distribution CentresSupply chain management is all about flow, be it is the flow of goods from the producer to the consumer or flow of information from the consumer to the producer. Warehouses play a critical link in this process and were conventionally set up as inventory buffer points along this supply chain so that any irregularities within this network could be ironed out. However, the need to reduce the service response time and contain inventory cost has necessitated the progression of warehouses from storage points to distribution centres. Additionally, the advent of technology with real-time information exchange and IT systems such as Warehousing Management System (WMS) have made it possible to operate the warehouses more efficiently and achieve greater integration with the rest of the supply chain modules.
The need to improve efficiency of warehouses has led to the evolution of various distribution models such as cross docking, milk runs and hub and
spoke model among others. Each of these strategies requires some sort of customisation of the warehouse. Factors such as location, design, infrastructure, built-up area and amount of automation required are determined by the end purpose for which the warehouse is to be used. With the streamlining of the taxation aspects through GST over the coming years, usage of the following distribution models is expected to become more widespread thereby increasing the importance of warehouses in the supply chain network.
Cross DockingIn a conventional warehousing system, all inbound goods are stored in the warehouse and retrieved as and when the outbound shipping order is received. This system runs efficiently as long as there is a lag between the in-bound and out-bound goods. However, in case the goods have to be immediately sent out for delivery, the conventional system falls short in efficiency as the time involved in storing the goods and immediately retrieving them leads to unnecessary duplication of work.
Cross docking system removes the above shortcoming as it involves receiving the merchandise at the inbound docks and then shipping it out shortly after without the need to stock it at the warehouse. It eliminates the intermediate disposition, storage and order fulfilment tasks in the warehouse thereby saving resources in terms of labour, space, time and equipment. Additionally, as the inventory moves directly from the receiving to shipping docks, there is no storage at the warehouses for the cross-docked items resulting in lower inventory holding costs.
Cross docking is more commonly used in the retail industry where multiple Stock Keeping Units (SKUs) are to be delivered to stores in small quantities at regular intervals. Since the supplier of each SKU sends the merchandise in large packages, it has to be broken down at the distribution centre into smaller packages and consolidated with multiple SKUs as required by each store. Cross docking not only saves a lot of time and resources in such cases but also facilitates in providing value added services such as labelling, kitting, shrink wrapping and tagging among others.
OUTBOUNDTRUCKS
PUT-AWAY
TASKPICKING
TASK
PROCESSINGUNLOADINGINBOUNDTRUCKS STORAGEPROCESSING
A | B | C A | D | X
D | E | F
X | Y | Z
B | E | Y
C | F | Z
ABC
DEF
XYZ
A B C
D E F
X Y Z
Source: Knight Frank Research
Conventional Warehousing SystemConventional Warehousing SystemConventional Warehousing System
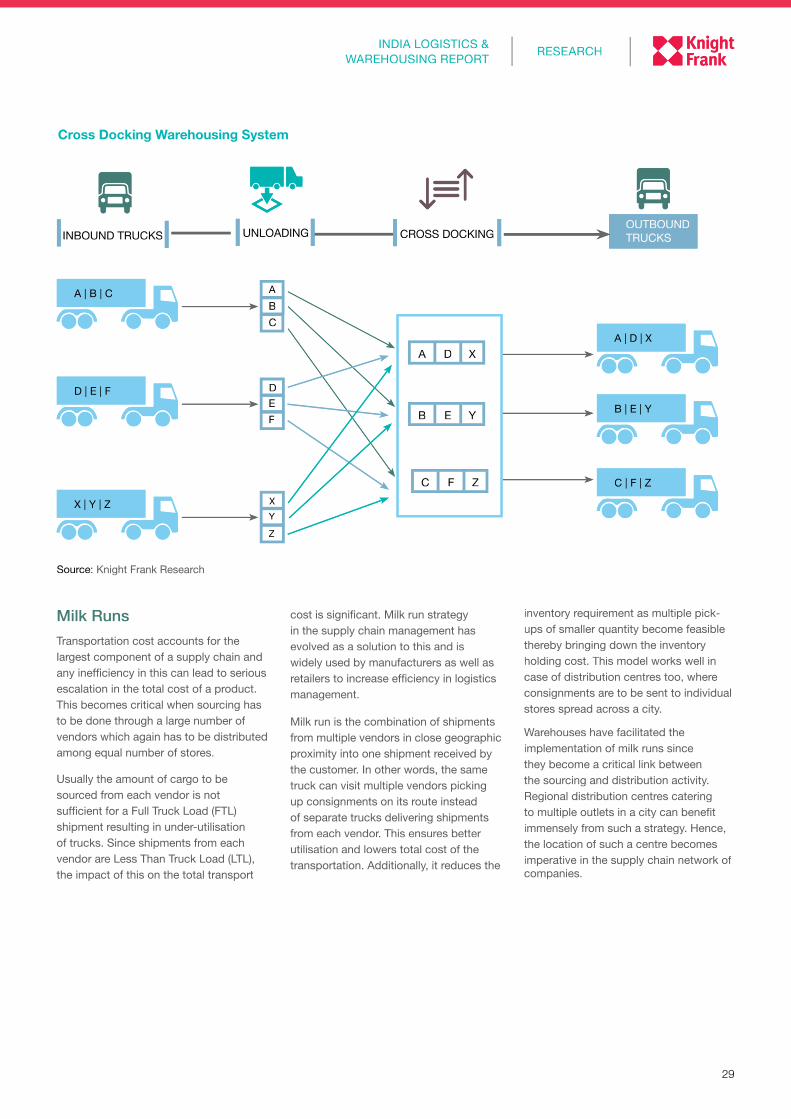
29
RESEARCHINDIA LOGISTICS &
WAREHOUSING REPORT
Milk RunsTransportation cost accounts for the largest component of a supply chain and any inefficiency in this can lead to serious escalation in the total cost of a product. This becomes critical when sourcing has to be done through a large number of vendors which again has to be distributed among equal number of stores.
Usually the amount of cargo to be sourced from each vendor is not sufficient for a Full Truck Load (FTL) shipment resulting in under-utilisation of trucks. Since shipments from each vendor are Less Than Truck Load (LTL), the impact of this on the total transport
cost is significant. Milk run strategy in the supply chain management has evolved as a solution to this and is widely used by manufacturers as well as retailers to increase efficiency in logistics management.
Milk run is the combination of shipments from multiple vendors in close geographic proximity into one shipment received by the customer. In other words, the same truck can visit multiple vendors picking up consignments on its route instead of separate trucks delivering shipments from each vendor. This ensures better utilisation and lowers total cost of the transportation. Additionally, it reduces the
inventory requirement as multiple pick-ups of smaller quantity become feasible thereby bringing down the inventory holding cost. This model works well in case of distribution centres too, where consignments are to be sent to individual stores spread across a city.
Warehouses have facilitated the implementation of milk runs since they become a critical link between the sourcing and distribution activity. Regional distribution centres catering to multiple outlets in a city can benefit immensely from such a strategy. Hence, the location of such a centre becomes imperative in the supply chain network of companies.
Cross Docking Warehousing System
Source: Knight Frank Research
OUTBOUND TRUCKSINBOUND TRUCKS UNLOADING CROSS DOCKING
A | B | C
D | E | F
X | Y | Z
A
D
X
B
E
Y
C
F
Z
A | D | X
B | E | Y
C | F | Z
A D X
B E Y
C F Z
29
RESEARCHINDIA LOGISTICS &
WAREHOUSING REPORT
Milk RunsTransportation cost accounts for the largest component of a supply chain and any inefficiency in this can lead to serious escalation in the total cost of a product. This becomes critical when sourcing has to be done through a large number of vendors which again has to be distributed among equal number of stores.
Usually the amount of cargo to be sourced from each vendor is not sufficient for a Full Truck Load (FTL) shipment resulting in under-utilisation of trucks. Since shipments from each vendor are Less Than Truck Load (LTL), the impact of this on the total transport
cost is significant. Milk run strategy in the supply chain management has evolved as a solution to this and is widely used by manufacturers as well as retailers to increase efficiency in logistics management.
Milk run is the combination of shipments from multiple vendors in close geographic proximity into one shipment received by the customer. In other words, the same truck can visit multiple vendors picking up consignments on its route instead of separate trucks delivering shipments from each vendor. This ensures better utilisation and lowers total cost of the transportation. Additionally, it reduces the
inventory requirement as multiple pick-ups of smaller quantity become feasible thereby bringing down the inventory holding cost. This model works well in case of distribution centres too, where consignments are to be sent to individual stores spread across a city.
Warehouses have facilitated the implementation of milk runs since they become a critical link between the sourcing and distribution activity. Regional distribution centres catering to multiple outlets in a city can benefit immensely from such a strategy. Hence, the location of such a centre becomes imperative in the supply chain network of companies.
Cross Docking Warehousing System
Source: Knight Frank Research
OUTBOUNDTRUCKSINBOUND TRUCKS UNLOADING CROSS DOCKING
A | B | C
D | E | F
X | Y | Z
A
D
X
B
E
Y
C
F
Z
A | D | X
B | E | Y
C | F | Z
A D X
B E Y
C F Z
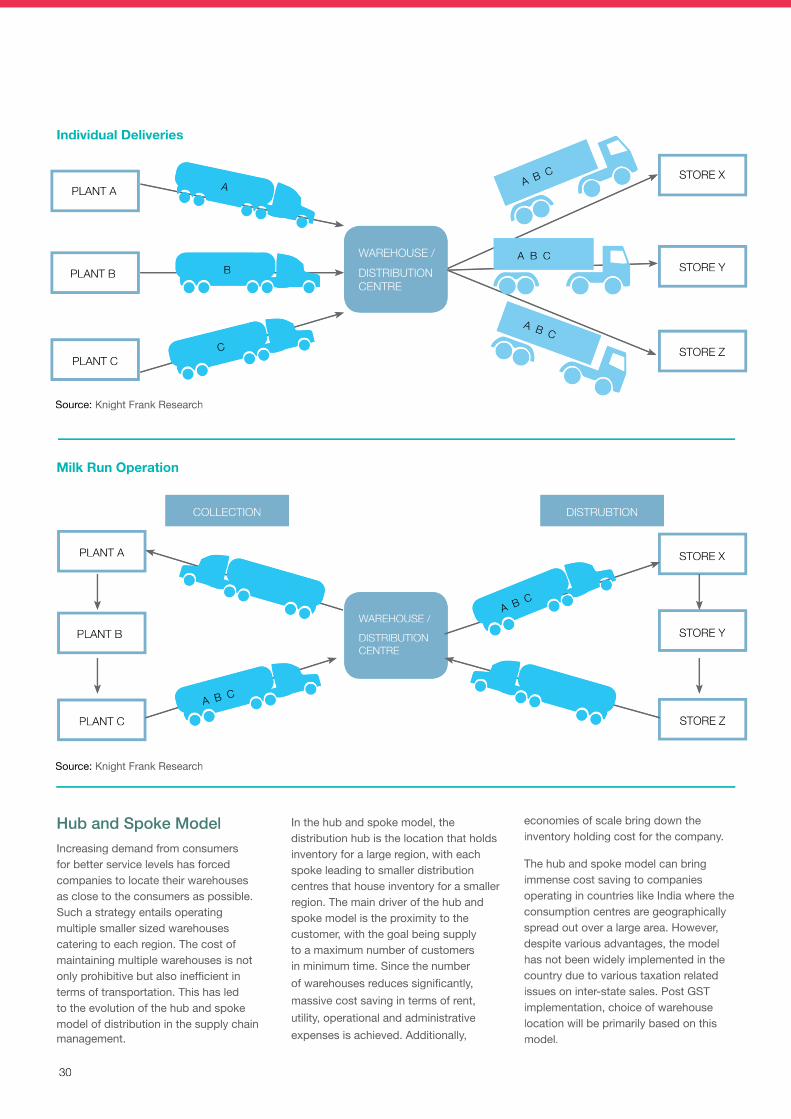
30
Hub and Spoke ModelIncreasing demand from consumers for better service levels has forced companies to locate their warehouses as close to the consumers as possible. Such a strategy entails operating multiple smaller sized warehouses catering to each region. The cost of maintaining multiple warehouses is not only prohibitive but also inefficient in terms of transportation. This has led to the evolution of the hub and spoke model of distribution in the supply chain management.
PLANT A
COLLECTION DISTRUBTION
PLANT A
STORE X
STORE X
STORE Y
STORE Y
STORE Z
STORE Z
PLANT B
PLANT B
WAREHOUSE /DISTRIBUTION CENTRE
WAREHOUSE /
DISTRIBUTION CENTRE
PLANT C
PLANT C
A A B C
A B C
B
C
A B C
Individual Deliveries
Source: Knight Frank Research
Source: Knight Frank Research
Milk Run Operation
A B C
A B C
In the hub and spoke model, the distribution hub is the location that holds inventory for a large region, with each spoke leading to smaller distribution centres that house inventory for a smaller region. The main driver of the hub and spoke model is the proximity to the customer, with the goal being supply to a maximum number of customers in minimum time. Since the number of warehouses reduces significantly, massive cost saving in terms of rent, utility, operational and administrative expenses is achieved. Additionally,
economies of scale bring down the inventory holding cost for the company.
The hub and spoke model can bring immense cost saving to companies operating in countries like India where the consumption centres are geographically spread out over a large area. However, despite various advantages, the model has not been widely implemented in the country due to various taxation related issues on inter-state sales. Post GST implementation, choice of warehouse location will be primarily based on this model.
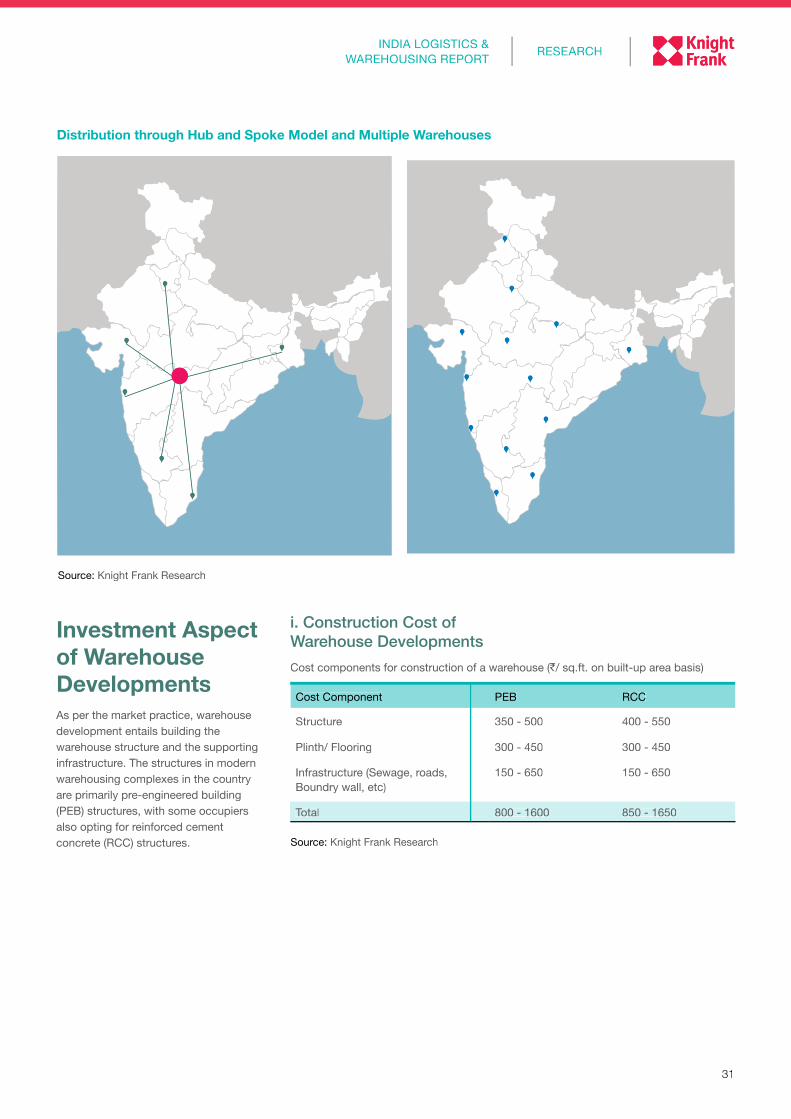
31
RESEARCHINDIA LOGISTICS &
WAREHOUSING REPORT
Distribution through Hub and Spoke Model and Multiple Warehouses
Source: Knight Frank Research
Investment Aspect of Warehouse DevelopmentsAs per the market practice, warehouse development entails building the warehouse structure and the supporting infrastructure. The structures in modern warehousing complexes in the country are primarily pre-engineered building (PEB) structures, with some occupiers also opting for reinforced cement concrete (RCC) structures. Source: Knight Frank Research
Cost Component PEB RCC
Structure 350 - 500 400 - 550
Plinth/ Flooring 300 - 450 300 - 450
Infrastructure (Sewage, roads, Boundry wall, etc)
150 - 650 150 - 650
Total 800 - 1600 850 - 1650
i. Construction Cost of Warehouse DevelopmentsCost components for construction of a warehouse (`/ sq.ft. on built-up area basis)
31
RESEARCHINDIA LOGISTICS &
WAREHOUSING REPORT
Distribution through Hub and Spoke Model and Multiple Warehouses
Source: Knight Frank Research
Investment Aspect of Warehouse DevelopmentsAs per the market practice, warehouse development entails building the warehouse structure and the supporting infrastructure. The structures in modern warehousing complexes in the country are primarily pre-engineered building (PEB) structures, with some occupiers also opting for reinforced cement concrete (RCC) structures. Source: Knight Frank Research
Cost Component PEB RCC
Structure 350 - 500 400 - 550
Plinth/ Flooring 300 - 450 300 - 450
Infrastructure (Sewage, roads, Boundry wall, etc)
150 - 650 150 - 650
Total 800 - 1600 850 - 1650
i. Construction Cost of Warehouse DevelopmentsCost components for construction of a warehouse (`Cost components for construction of a warehouse (`Cost components for construction of a warehouse ( / sq.ft. on built-up area basis)`/ sq.ft. on built-up area basis)`
32
Structure The nature of cargo handled by the occupier determines the choice of structure. Since PEB structures offer relatively more vertical storage space on account of larger floor ceiling height, such structures are preferred by occupiers making use of pallets and electric operated fork lifts for the purpose of stacking cargo. PEB structures generally provide side/ clear height of 24-26 ft. and centre height of 30-32 ft. in contrast to the RCC structures, that provide for just 12-14 ft. of vertical space for storage.
Alternatively, occupiers from industries like consumer durables and electronics that carry high value fragile cargo may not prefer multiple levels of stacking and would prefer an RCC warehouse instead. Similarly, occupiers with a need for climate control through air coolers, for instance pharmaceuticals, prefer the utility of an RCC structure.
In terms of the timeline and cost of construction, it is not only cheaper to build a PEB warehouse than an RCC structure, but also takes lesser time for completion. While a PEB warehouse can be constructed in 6-7 months, an RCC warehouse may require two more months.
Plinth/ Flooring Heavy load movement coupled with usage of machinery like pallet stackers on the warehouse floors increase the incidence of wear and tear. Hence, the plinth/ flooring for a warehouse becomes a critical aspect of development. While the nature of cargo determines the quality of flooring, in most cases warehouse developers provide for Trimix M 25 grade flooring with a load bearing capacity of 5 metric tonnes/ sq.mt.
Infrastructure Infrastructure development is undertaken with respect to the land area for the warehouse project. The ideal size
of a warehouse park is minimum 30 acres. With a ground coverage of 50%, this would translate in to a built-up potential of 6,50,000 sq.ft. Such a size of the project would make it feasible for providing support infrastructure comprising sewage treatment plant, adequate internal roads for truck and trailer movement, boundary walls, fire fighting equipment, parking, administration and security chamber.
ii. Land Cost for Warehouse DevelopmentThe total investment for developing a warehouse would comprise the cost of construction and land cost. The variability of the construction cost is marginal across locations. Hence, it is the land cost that determines the economic viability of a warehouse.
The ideal land cost for a warehouse project would be around `200/ sq.ft. With ground coverage of 50%, the land cost for the warehouse would translate in to `400/ sq.ft. on a built-up area basis.
iii. Return Expectation for Warehouse DevelopmentThe return expectation is a function of the risk associated with the respective real estate asset class. As such it varies across all classes of real estate viz. residential, office, retail, hospitality and warehouse.
Based on the associated risk, organised/ institutional players expect an internal rate of return (IRR) of 16-20% from a warehouse development project. On the other hand, unorganised players underwrite warehouse development projects for as low as 8-16% IRRs.
The reasons for accepting such low returns range from lower opportunity cost of their capital to non-compliance with statutory construction norms and poor construction quality.
iv. Rental Yield for Warehouse DevelopmentThe most important on going measure of investment return for a warehouse property is the rental yield. While the total return from a warehouse investment comprises rental yield and capital appreciation, the rental component is valued highly by investors on account of the relative non-variability associated in contrast to the capital appreciation component.
In India, the gross rental yield for a warehouse, calculated as gross annual rent as a proportion of its capital value, ranges 10-12% pa. For instance, if a warehouse has a rental stream of `10/ sq.ft./ month and is available for sale at `1200/ sq.ft., then the gross rental yield for this warehouse investment would be 10% pa.
However, investors should note that the rent earned from a warehouse will be subject to outgoings on account of common area maintenance (CAM) charges, property taxes, leasing/ marketing fees, building insurance cost, warai/ mathadi charges (payable to local labour union), etc. The extent to which these costs are borne by the landlord (investor) or tenant varies across different warehouse markets and from case to case thereby making it important for the investor to be aware of these outgoings at the time of investing in a warehouse project. Other important terms of tenancy that have a bearing on a warehouse investment are the clauses related to security deposit, rent escalation and lease tenure. The market practice for security deposit is 3-6 months of rent. Rent escalation clause, which determines the quantum and frequency of rental increments, is usually 5% pa. The market practice for lease tenure i.e. the minimum period for which the landlord and tenant are bound to honour the occupancy, varies largely on a case to case basis, usually in excess of five years.
32
StructureThe nature of cargo handled by the occupier determines the choice of structure. Since PEB structures offer relatively more vertical storage space on account of larger floor ceiling height, such structures are preferred by occupiers making use of pallets and electric operated fork lifts for the purpose of stacking cargo. PEB structures generally provide side/ clear height of 24-26 ft. and centre height of 30-32 ft. in contrast to the RCC structures, that provide for just 12-14 ft. of vertical space for storage.
Alternatively, occupiers from industries like consumer durables and electronics that carry high value fragile cargo may not prefer multiple levels of stacking and would prefer an RCC warehouse instead. Similarly, occupiers with a need for climate control through air coolers, for instance pharmaceuticals, prefer the utility of an RCC structure.
In terms of the timeline and cost of construction, it is not only cheaper to build a PEB warehouse than an RCC structure, but also takes lesser time for completion. While a PEB warehouse can be constructed in 6-7 months, an RCC warehouse may require two more months.
Plinth/ FlooringHeavy load movement coupled with usage of machinery like pallet stackers on the warehouse floors increase the incidence of wear and tear. Hence, the plinth/ flooring for a warehouse becomes a critical aspect of development. While the nature of cargo determines the quality of flooring, in most cases warehouse developers provide for Trimix M 25 grade flooring with a load bearing capacity of 5 metric tonnes/ sq.mt.
InfrastructureInfrastructure development is undertaken with respect to the land area for the warehouse project. The ideal size
of a warehouse park is minimum 30 acres. With a ground coverage of 50%, this would translate in to a built-up potential of 6,50,000 sq.ft. Such a size of the project would make it feasible for providing support infrastructure comprising sewage treatment plant, adequate internal roads for truck and trailer movement, boundary walls, fire fighting equipment, parking, administration and security chamber.
ii. Land Cost for Warehouse DevelopmentThe total investment for developing a warehouse would comprise the cost of construction and land cost. The variability of the construction cost is marginal across locations. Hence, it is the land cost that determines the economic viability of a warehouse.
The ideal land cost for a warehouse project would be around `200/ sq.ft. With ground coverage of 50%, the land cost for the warehouse would translate in to `400/ sq.ft. on a built-up area basis.
iii. Return Expectation for Warehouse DevelopmentThe return expectation is a function of the risk associated with the respective real estate asset class. As such it varies across all classes of real estate viz. residential, office, retail, hospitality and warehouse.
Based on the associated risk, organised/ institutional players expect an internal rate of return (IRR) of 16-20% from a warehouse development project. On the other hand, unorganised players underwrite warehouse development projects for as low as 8-16% IRRs.
The reasons for accepting such low returns range from lower opportunity cost of their capital to non-compliance with statutory construction norms and poor construction quality.
iv. Rental Yield for Warehouse DevelopmentThe most important on going measure of investment return for a warehouse property is the rental yield. While the total return from a warehouse investment comprises rental yield and capital appreciation, the rental component is valued highly by investors on account of the relative non-variability associated in contrast to the capital appreciation component.
In India, the gross rental yield for a warehouse, calculated as gross annual rent as a proportion of its capital value, ranges 10-12% pa. For instance, if a warehouse has a rental stream of `10/ sq.ft./ month and is available for sale at `1200/ sq.ft., then the gross rental yield for this warehouse investment would be 10% pa.
However, investors should note that the rent earned from a warehouse will be subject to outgoings on account of common area maintenance (CAM) charges, property taxes, leasing/ marketing fees, building insurance cost, warai/ mathadi charges (payable to local labour union), etc. The extent to which these costs are borne by the landlord (investor) or tenant varies across different warehouse markets and from case to case thereby making it important for the investor to be aware of these outgoings at the time of investing in a warehouse project. Other important terms of tenancy that have a bearing on a warehouse investment are the clauses related to security deposit, rent escalation and lease tenure. The market practice for security deposit is 3-6 months of rent. Rent escalation clause, which determines the quantum and frequency of rental increments, is usually 5% pa. The market practice for lease tenure i.e. the minimum period for which the landlord and tenant are bound to honour the occupancy, varies largely on a case to case basis, usually in excess of five years.
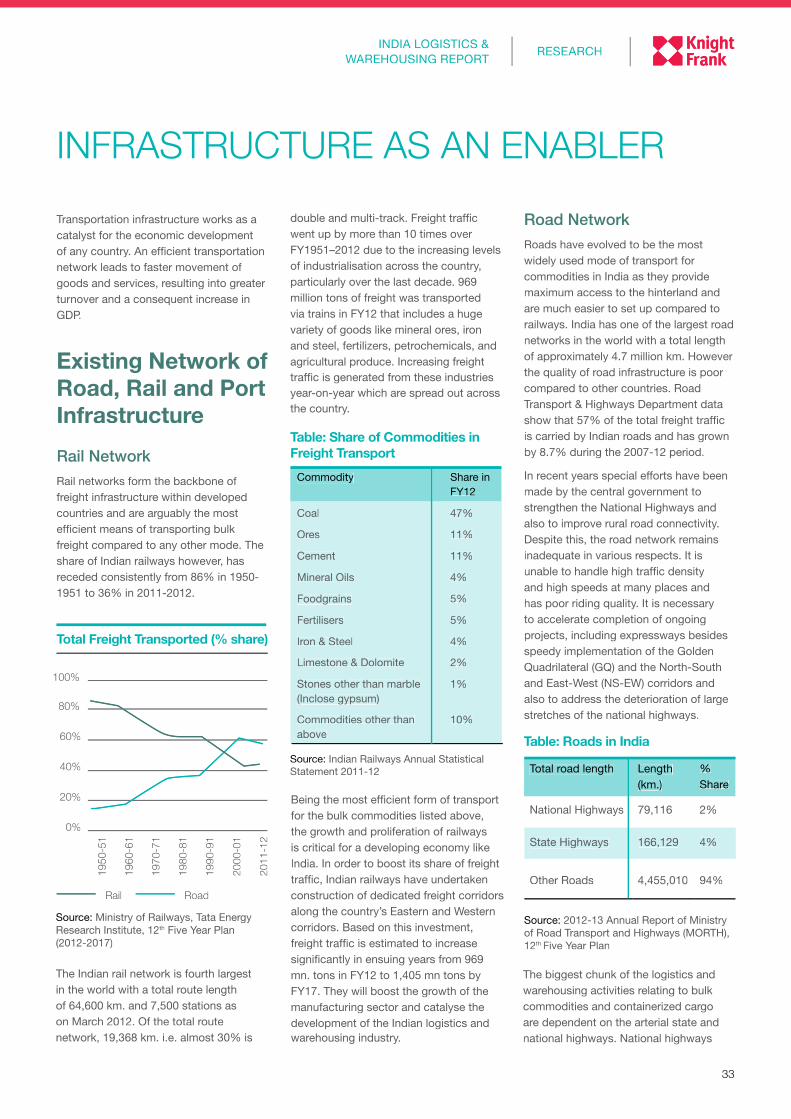
33
RESEARCHINDIA LOGISTICS &
WAREHOUSING REPORT
INFRASTRUCTURE AS AN ENABLER Transportation infrastructure works as a catalyst for the economic development of any country. An efficient transportation network leads to faster movement of goods and services, resulting into greater turnover and a consequent increase in GDP.
Existing Network of Road, Rail and Port InfrastructureRail NetworkRail networks form the backbone of freight infrastructure within developed countries and are arguably the most efficient means of transporting bulk freight compared to any other mode. The share of Indian railways however, has receded consistently from 86% in 1950-1951 to 36% in 2011-2012.
The Indian rail network is fourth largest in the world with a total route length of 64,600 km. and 7,500 stations as on March 2012. Of the total route network, 19,368 km. i.e. almost 30% is
Source: 2012-13 Annual Report of Ministry of Road Transport and Highways (MORTH), 12th Five Year Plan
Being the most efficient form of transport for the bulk commodities listed above, the growth and proliferation of railways is critical for a developing economy like India. In order to boost its share of freight traffic, Indian railways have undertaken construction of dedicated freight corridors along the country’s Eastern and Western corridors. Based on this investment, freight traffic is estimated to increase significantly in ensuing years from 969 mn. tons in FY12 to 1,405 mn tons by FY17. They will boost the growth of the manufacturing sector and catalyse the development of the Indian logistics and warehousing industry.
Source: Indian Railways Annual Statistical Statement 2011-12
Commodity Share in FY12
Coal 47%
Ores 11%
Cement 11%
Mineral Oils 4%
Foodgrains 5%
Fertilisers 5%
Iron & Steel 4%
Limestone & Dolomite 2%
Stones other than marble (Inclose gypsum)
1%
Commodities other than above
10%
Road NetworkRoads have evolved to be the most widely used mode of transport for commodities in India as they provide maximum access to the hinterland and are much easier to set up compared to railways. India has one of the largest road networks in the world with a total length of approximately 4.7 million km. However the quality of road infrastructure is poor compared to other countries. Road Transport & Highways Department data show that 57% of the total freight traffic is carried by Indian roads and has grown by 8.7% during the 2007-12 period.
In recent years special efforts have been made by the central government to strengthen the National Highways and also to improve rural road connectivity. Despite this, the road network remains inadequate in various respects. It is unable to handle high traffic density and high speeds at many places and has poor riding quality. It is necessary to accelerate completion of ongoing projects, including expressways besides speedy implementation of the Golden Quadrilateral (GQ) and the North-South and East-West (NS-EW) corridors and also to address the deterioration of large stretches of the national highways.
Total road length Length (km.)
% Share
National Highways 79,116 2%
State Highways 166,129 4%
Other Roads 4,455,010 94%
Table: Share of Commodities in Freight Transport
Table: Roads in India
100%
80%
60%
40%
20%
0%
1950
-51
1960
-61
1970
-71
1980
-81
1990
-91
2000
-01
2011
-12
Total Freight Transported (% share)
Source: Ministry of Railways, Tata Energy Research Institute, 12th Five Year Plan (2012-2017)
Rail Road
double and multi-track. Freight traffic went up by more than 10 times over FY1951–2012 due to the increasing levels of industrialisation across the country, particularly over the last decade. 969 million tons of freight was transported via trains in FY12 that includes a huge variety of goods like mineral ores, iron and steel, fertilizers, petrochemicals, and agricultural produce. Increasing freight traffic is generated from these industries year-on-year which are spread out across the country.
The biggest chunk of the logistics and warehousing activities relating to bulk commodities and containerized cargo are dependent on the arterial state and national highways. National highways
33
RESEARCHINDIA LOGISTICS &
WAREHOUSING REPORT
INFRASTRUCTURE AS AN ENABLER Transportation infrastructure works as a catalyst for the economic development of any country. An efficient transportation network leads to faster movement of goods and services, resulting into greater turnover and a consequent increase in GDP.
Existing Network of Road, Rail and Port InfrastructureRail NetworkRail networks form the backbone of freight infrastructure within developed countries and are arguably the most efficient means of transporting bulk freight compared to any other mode. The share of Indian railways however, has receded consistently from 86% in 1950-1951 to 36% in 2011-2012.
The Indian rail network is fourth largest in the world with a total route length of 64,600 km. and 7,500 stations as on March 2012. Of the total route network, 19,368 km. i.e. almost 30% is
Source: 2012-13 Annual Report of Ministry of Road Transport and Highways (MORTH), 12th Five Year Plan
Being the most efficient form of transport for the bulk commodities listed above, the growth and proliferation of railways is critical for a developing economy like India. In order to boost its share of freight traffic, Indian railways have undertaken construction of dedicated freight corridors along the country’s Eastern and Western corridors. Based on this investment, freight traffic is estimated to increase significantly in ensuing years from 969 mn. tons in FY12 to 1,405 mn tons by FY17. They will boost the growth of the manufacturing sector and catalyse the development of the Indian logistics and warehousing industry.
Source: Indian Railways Annual Statistical Statement 2011-12
Commodity Share in FY12
Coal 47%
Ores 11%
Cement 11%
Mineral Oils 4%
Foodgrains 5%
Fertilisers 5%
Iron & Steel 4%
Limestone & Dolomite 2%
Stones other than marble(Inclose gypsum)
1%
Commodities other than above
10%
Road NetworkRoads have evolved to be the most widely used mode of transport for commodities in India as they provide maximum access to the hinterland and are much easier to set up compared to railways. India has one of the largest road networks in the world with a total length of approximately 4.7 million km. However the quality of road infrastructure is poor compared to other countries. Road Transport & Highways Department data show that 57% of the total freight traffic is carried by Indian roads and has grown by 8.7% during the 2007-12 period.
In recent years special efforts have been made by the central government to strengthen the National Highways and also to improve rural road connectivity. Despite this, the road network remains inadequate in various respects. It is unable to handle high traffic density and high speeds at many places and has poor riding quality. It is necessary to accelerate completion of ongoing projects, including expressways besides speedy implementation of the Golden Quadrilateral (GQ) and the North-South and East-West (NS-EW) corridors and also to address the deterioration of large stretches of the national highways.
Total road length Length (km.)
% Share
National Highways 79,116 2%
State Highways 166,129 4%
Other Roads 4,455,010 94%
Table: Share of Commodities in Freight Transport
Table: Roads in India
100%
80%
60%
40%
20%
0%
1950
-51
1960
-61
1970
-71
1980
-81
1990
-91
2000
-01
2011
-12
Total Freight Transported (% share)
Source: Ministry of Railways, Tata Energy Research Institute, 12th Five Year Plan (2012-2017)
Rail Road
double and multi-track. Freight traffic went up by more than 10 times over FY1951–2012 due to the increasing levels of industrialisation across the country, particularly over the last decade. 969 million tons of freight was transported via trains in FY12 that includes a huge variety of goods like mineral ores, iron and steel, fertilizers, petrochemicals, and agricultural produce. Increasing freight traffic is generated from these industries year-on-year which are spread out across the country.
The biggest chunk of the logistics and warehousing activities relating to bulk commodities and containerized cargo are dependent on the arterial state and national highways. National highways
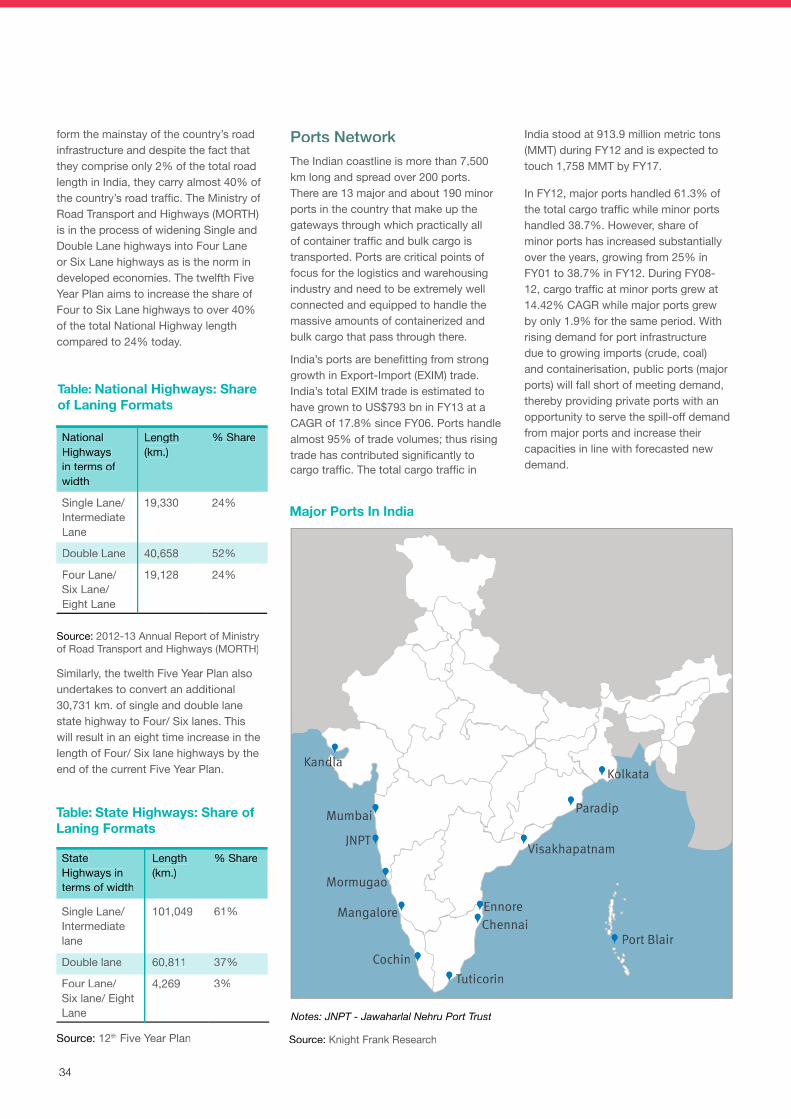
34
Similarly, the twelth Five Year Plan also undertakes to convert an additional 30,731 km. of single and double lane state highway to Four/ Six lanes. This will result in an eight time increase in the length of Four/ Six lane highways by the end of the current Five Year Plan.
National Highways in terms of width
Length (km.)
% Share
Single Lane/ Intermediate Lane
19,330 24%
Double Lane 40,658 52%
Four Lane/ Six Lane/Eight Lane
19,128 24%
State Highways in terms of width
Length (km.)
% Share
Single Lane/ Intermediate lane
101,049 61%
Double lane 60,811 37%
Four Lane/Six lane/ Eight Lane
4,269 3%
Source: 2012-13 Annual Report of Ministry of Road Transport and Highways (MORTH)
Source: 12th Five Year Plan
Ports NetworkThe Indian coastline is more than 7,500 km long and spread over 200 ports. There are 13 major and about 190 minor ports in the country that make up the gateways through which practically all of container traffic and bulk cargo is transported. Ports are critical points of focus for the logistics and warehousing industry and need to be extremely well connected and equipped to handle the massive amounts of containerized and bulk cargo that pass through there.
India’s ports are benefitting from strong growth in Export-Import (EXIM) trade. India’s total EXIM trade is estimated to have grown to US$793 bn in FY13 at a CAGR of 17.8% since FY06. Ports handle almost 95% of trade volumes; thus rising trade has contributed significantly to cargo traffic. The total cargo traffic in
form the mainstay of the country’s road infrastructure and despite the fact that they comprise only 2% of the total road length in India, they carry almost 40% of the country’s road traffic. The Ministry of Road Transport and Highways (MORTH) is in the process of widening Single and Double Lane highways into Four Lane or Six Lane highways as is the norm in developed economies. The twelfth Five Year Plan aims to increase the share of Four to Six Lane highways to over 40% of the total National Highway length compared to 24% today.
Major Ports In India
Notes: JNPT - Jawaharlal Nehru Port Trust
Source: Knight Frank Research
Kandla
Mumbai
JNPT
Mormugao
Visakhapatnam
Paradip
Kolkata
Mangalore
CochinTuticorin
ChennaiPort Blair
Ennore
India stood at 913.9 million metric tons (MMT) during FY12 and is expected to touch 1,758 MMT by FY17.
In FY12, major ports handled 61.3% of the total cargo traffic while minor ports handled 38.7%. However, share of minor ports has increased substantially over the years, growing from 25% in FY01 to 38.7% in FY12. During FY08-12, cargo traffic at minor ports grew at 14.42% CAGR while major ports grew by only 1.9% for the same period. With rising demand for port infrastructure due to growing imports (crude, coal) and containerisation, public ports (major ports) will fall short of meeting demand, thereby providing private ports with an opportunity to serve the spill-off demand from major ports and increase their capacities in line with forecasted new demand.
Table: National Highways: Share of Laning Formats
Table: State Highways: Share of Laning Formats
34
Similarly, the twelth Five Year Plan also undertakes to convert an additional 30,731 km. of single and double lane state highway to Four/ Six lanes. This will result in an eight time increase in the length of Four/ Six lane highways by the end of the current Five Year Plan.
National Highways in terms of width
Length (km.)
% Share
Single Lane/ Intermediate Lane
19,330 24%
Double Lane 40,658 52%
Four Lane/ Six Lane/Eight Lane
19,128 24%
State Highways in terms of width
Length (km.)
% Share
Single Lane/ Intermediate lane
101,049 61%
Double lane 60,811 37%
Four Lane/Six lane/ Eight Lane
4,269 3%
Source: 2012-13 Annual Report of Ministry of Road Transport and Highways (MORTH)
Source: 12th Five Year Plan
Ports NetworkThe Indian coastline is more than 7,500 km long and spread over 200 ports. There are 13 major and about 190 minor ports in the country that make up the gateways through which practically all of container traffic and bulk cargo is transported. Ports are critical points of focus for the logistics and warehousing industry and need to be extremely well connected and equipped to handle the massive amounts of containerized and bulk cargo that pass through there.
India’s ports are benefitting from strong growth in Export-Import (EXIM) trade. India’s total EXIM trade is estimated to have grown to US$793 bn in FY13 at a CAGR of 17.8% since FY06. Ports handle almost 95% of trade volumes; thus rising trade has contributed significantly to cargo traffic. The total cargo traffic in
form the mainstay of the country’s road infrastructure and despite the fact that they comprise only 2% of the total road length in India, they carry almost 40% of the country’s road traffic. The Ministry of Road Transport and Highways (MORTH) is in the process of widening Single and Double Lane highways into Four Lane or Six Lane highways as is the norm in developed economies. The twelfth Five Year Plan aims to increase the share of Four to Six Lane highways to over 40% of the total National Highway length compared to 24% today.
Major Ports In India
Notes: JNPT - Jawaharlal Nehru Port Trust
Source: Knight Frank Research
KandlaKandlaKandla
Mumbai
JNPT
MormugaoMormugaoMormugaoMormugao
VisakhapatnamVisakhapatnamVisakhapatnam
ParadipParadipParadip
KolkataKolkataKolkata
Mangalore
CochinTuticorinTuticorinTuticorin
ChennaiPort Blair
Ennore
India stood at 913.9 million metric tons (MMT) during FY12 and is expected to touch 1,758 MMT by FY17.
In FY12, major ports handled 61.3% of the total cargo traffic while minor ports handled 38.7%. However, share of minor ports has increased substantially over the years, growing from 25% in FY01 to 38.7% in FY12. During FY08-12, cargo traffic at minor ports grew at 14.42% CAGR while major ports grew by only 1.9% for the same period. With rising demand for port infrastructure due to growing imports (crude, coal) and containerisation, public ports (major ports) will fall short of meeting demand, thereby providing private ports with an opportunity to serve the spill-off demand from major ports and increase their capacities in line with forecasted new demand.
Table: National Highways: Share of Laning Formats
Table: State Highways: Share of Laning Formats
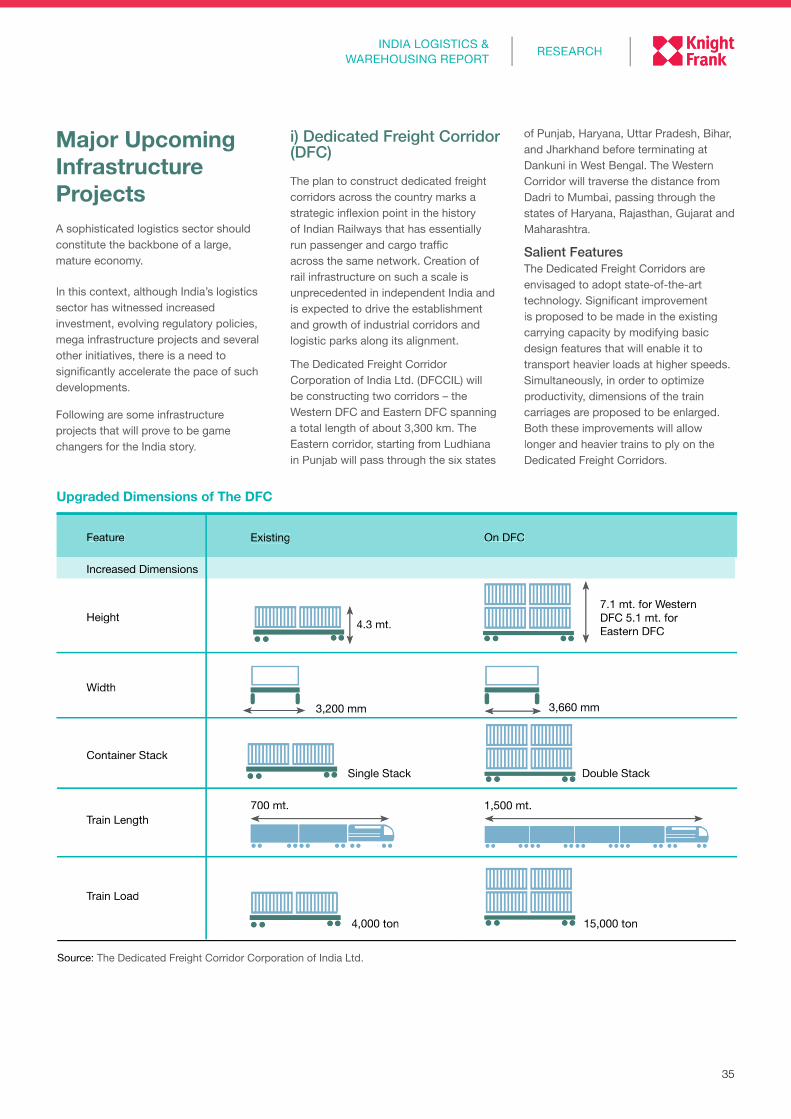
35
RESEARCHINDIA LOGISTICS &
WAREHOUSING REPORT
Major Upcoming Infrastructure ProjectsA sophisticated logistics sector should constitute the backbone of a large, mature economy.
In this context, although India’s logistics sector has witnessed increased investment, evolving regulatory policies, mega infrastructure projects and several other initiatives, there is a need to significantly accelerate the pace of such developments.
Following are some infrastructure projects that will prove to be game changers for the India story.
i) Dedicated Freight Corridor (DFC)The plan to construct dedicated freight corridors across the country marks a strategic inflexion point in the history of Indian Railways that has essentially run passenger and cargo traffic across the same network. Creation of rail infrastructure on such a scale is unprecedented in independent India and is expected to drive the establishment and growth of industrial corridors and logistic parks along its alignment.
The Dedicated Freight Corridor Corporation of India Ltd. (DFCCIL) will be constructing two corridors – the Western DFC and Eastern DFC spanning a total length of about 3,300 km. The Eastern corridor, starting from Ludhiana in Punjab will pass through the six states
of Punjab, Haryana, Uttar Pradesh, Bihar, and Jharkhand before terminating at Dankuni in West Bengal. The Western Corridor will traverse the distance from Dadri to Mumbai, passing through the states of Haryana, Rajasthan, Gujarat and Maharashtra.
Salient Features The Dedicated Freight Corridors are envisaged to adopt state-of-the-art technology. Significant improvement is proposed to be made in the existing carrying capacity by modifying basic design features that will enable it to transport heavier loads at higher speeds. Simultaneously, in order to optimize productivity, dimensions of the train carriages are proposed to be enlarged. Both these improvements will allow longer and heavier trains to ply on the Dedicated Freight Corridors.
Upgraded Dimensions of The DFC
4.3 mt.
4,000 ton 15,000 ton
Single Stack Double Stack
3,660 mm
7.1 mt. for Western DFC 5.1 mt. for Eastern DFC
Feature Existing On DFC
Increased Dimensions
Height
Width
Container Stack
Train Length
Train Load
3,200 mm
700 mt. 1,500 mt.
Source: The Dedicated Freight Corridor Corporation of India Ltd.
35
RESEARCHINDIA LOGISTICS &
WAREHOUSING REPORT
Major Upcoming Infrastructure ProjectsA sophisticated logistics sector should constitute the backbone of a large, mature economy.
In this context, although India’s logistics sector has witnessed increased investment, evolving regulatory policies, mega infrastructure projects and several other initiatives, there is a need to significantly accelerate the pace of such developments.
Following are some infrastructure projects that will prove to be game changers for the India story.
i) Dedicated Freight Corridor (DFC)The plan to construct dedicated freight corridors across the country marks a strategic inflexion point in the history of Indian Railways that has essentially run passenger and cargo traffic across the same network. Creation of rail infrastructure on such a scale is unprecedented in independent India and is expected to drive the establishment and growth of industrial corridors and logistic parks along its alignment.
The Dedicated Freight Corridor Corporation of India Ltd. (DFCCIL) will be constructing two corridors – the Western DFC and Eastern DFC spanning a total length of about 3,300 km. The Eastern corridor, starting from Ludhiana in Punjab will pass through the six states
of Punjab, Haryana, Uttar Pradesh, Bihar, and Jharkhand before terminating at Dankuni in West Bengal. The Western Corridor will traverse the distance from Dadri to Mumbai, passing through the states of Haryana, Rajasthan, Gujarat and Maharashtra.
Salient FeaturesThe Dedicated Freight Corridors are envisaged to adopt state-of-the-art technology. Significant improvement is proposed to be made in the existing carrying capacity by modifying basic design features that will enable it to transport heavier loads at higher speeds. Simultaneously, in order to optimize productivity, dimensions of the train carriages are proposed to be enlarged. Both these improvements will allow longer and heavier trains to ply on the Dedicated Freight Corridors.
Upgraded Dimensions of The DFC
4.3 mt.
4,000 ton 15,000 ton
Single Stack Double Stack
3,660 mm
7.1 mt. for Western DFC 5.1 mt. for Eastern DFC
Feature Existing On DFC
Increased Dimensions
Height
Width
Container Stack
Train Length
Train Load
3,200 mm
700 mt. 1,500 mt.
Source: The Dedicated Freight Corridor Corporation of India Ltd.
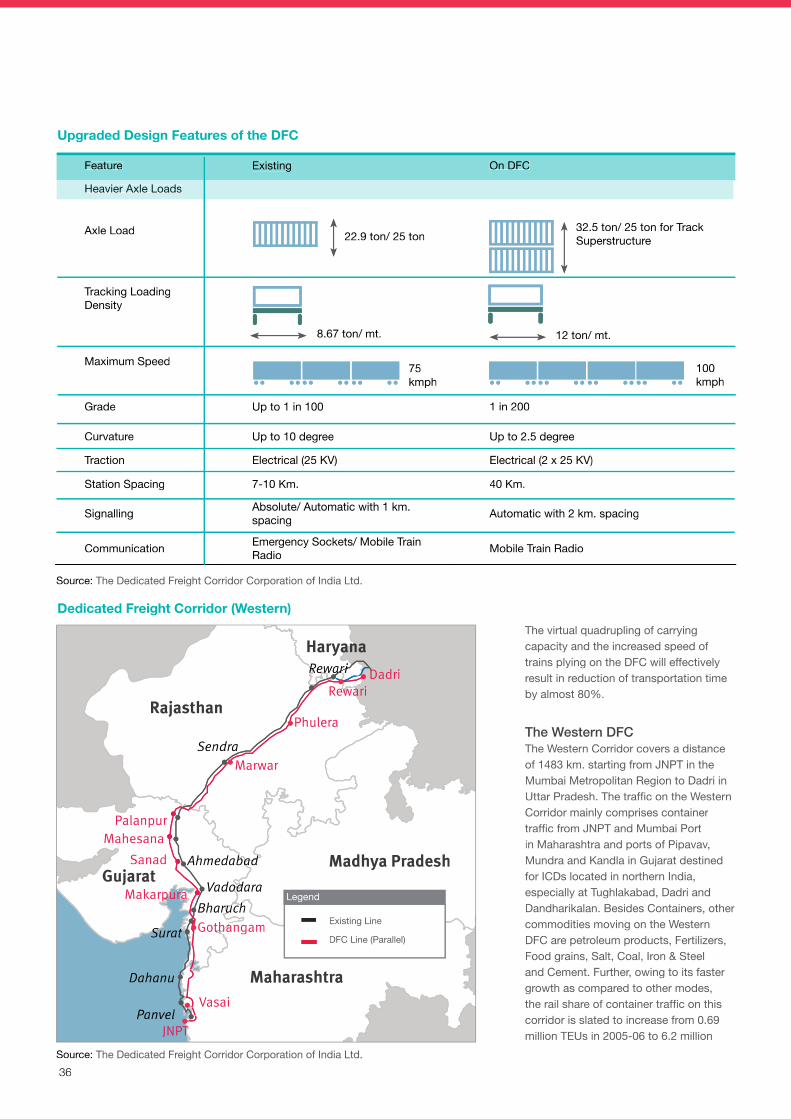
36
JNPT
Vasai
Gothangam
Makarpura
Sanad
MahesanaPalanpur
Panvel
Dahanu
Surat
Bharuch
Vadodara
Ahmedabad
Marwar
Phulera
RewariDadri
Haryana
Rajasthan
Maharashtra
Madhya PradeshGujarat
Sendra
Rewari
The virtual quadrupling of carrying capacity and the increased speed of trains plying on the DFC will effectively result in reduction of transportation time by almost 80%.
The Western DFC The Western Corridor covers a distance of 1483 km. starting from JNPT in the Mumbai Metropolitan Region to Dadri in Uttar Pradesh. The traffic on the Western Corridor mainly comprises container traffic from JNPT and Mumbai Port in Maharashtra and ports of Pipavav, Mundra and Kandla in Gujarat destined for ICDs located in northern India, especially at Tughlakabad, Dadri and Dandharikalan. Besides Containers, other commodities moving on the Western DFC are petroleum products, Fertilizers, Food grains, Salt, Coal, Iron & Steel and Cement. Further, owing to its faster growth as compared to other modes, the rail share of container traffic on this corridor is slated to increase from 0.69 million TEUs in 2005-06 to 6.2 million
Upgraded Design Features of the DFC
Dedicated Freight Corridor (Western)
Feature Existing On DFC
Heavier Axle Loads
Axle Load
Tracking Loading Density
Maximum Speed
Grade Up to 1 in 100 1 in 200
Curvature Up to 10 degree Up to 2.5 degree
Traction Electrical (25 KV) Electrical (2 x 25 KV)
Station Spacing 7-10 Km. 40 Km.
Signalling Absolute/ Automatic with 1 km. spacing Automatic with 2 km. spacing
Communication Emergency Sockets/ Mobile Train Radio Mobile Train Radio
22.9 ton/ 25 ton32.5 ton/ 25 ton for Track Superstructure
8.67 ton/ mt. 12 ton/ mt.
75kmph
100 kmph
Existing Line
DFC Line (Parallel)
Source: The Dedicated Freight Corridor Corporation of India Ltd.
Source: The Dedicated Freight Corridor Corporation of India Ltd.
Legend
36
JNPTJNPTJNPT
Vasai
GothangamGothangamGothangamGothangam
MakarpuraMakarpuraMakarpura
Sanad
MahesanaPalanpur
Panvel
Dahanu
SuratSuratSurat
BharuchBharuchBharuchBharuchBharuchBharuch
VadodaraVadodaraVadodaraVadodara
AhmedabadAhmedabadAhmedabadAhmedabadAhmedabadAhmedabad
Marwar
Phulera
RewariRewariRewariRewariRewariDadriDadri
HaryanaHaryanaHaryana
Rajasthan
Maharashtra
Madhya PradeshGujarat
Sendra
RewariRewariRewariRewariRewari
The virtual quadrupling of carrying capacity and the increased speed of trains plying on the DFC will effectively result in reduction of transportation time by almost 80%.
The Western DFCThe Western Corridor covers a distance of 1483 km. starting from JNPT in the Mumbai Metropolitan Region to Dadri in Uttar Pradesh. The traffic on the Western Corridor mainly comprises container traffic from JNPT and Mumbai Port in Maharashtra and ports of Pipavav, Mundra and Kandla in Gujarat destined for ICDs located in northern India, especially at Tughlakabad, Dadri and Dandharikalan. Besides Containers, other commodities moving on the Western DFC are petroleum products, Fertilizers, Food grains, Salt, Coal, Iron & Steel and Cement. Further, owing to its faster growth as compared to other modes, the rail share of container traffic on this corridor is slated to increase from 0.69 million TEUs in 2005-06 to 6.2 million
Upgraded Design Features of the DFC
Dedicated Freight Corridor (Western)
Feature Existing On DFC
Axle Load
Tracking LoadingDensity
Maximum Speed
Grade Up to 1 in 100 1 in 200
Curvature Up to 10 degree Up to 2.5 degree
Traction Electrical (25 KV) Electrical (2 x 25 KV)
Station Spacing 7-10 Km. 40 Km.
Signalling Absolute/ Automatic with 1 km. spacing Automatic with 2 km. spacing
Communication Emergency Sockets/ Mobile Train Radio Mobile Train Radio
Heavier Axle Loads
22.9 ton/ 25 ton32.5 ton/ 25 ton for Track Superstructure
8.67 ton/ mt. 12 ton/ mt.
75kmph
100 kmph
Existing Line
DFC Line (Parallel)
Source: The Dedicated Freight Corridor Corporation of India Ltd.
Source: The Dedicated Freight Corridor Corporation of India Ltd.
Legend

37
RESEARCHINDIA LOGISTICS &
WAREHOUSING REPORT
Corridor Land to be Acquired
Land Acquired
Eastern DFC
4,807 3,635 (75%)
Western DFC
5,860 5,039 (85%)
Total 10,667 8,673 (81%)
Source: The Dedicated Freight Corridor Corporation of India Ltd.
Construction Work Progress:
Eastern Corridor: (i) Mughalsarai - Sonnagar section• Work of formation and bridges under
progress - 94% completed.
• Contracts for track work of 66 kms section of Mughalsarai-Sonnagar awarded. System tender awarded in May, 2013.
(ii) Khurja-Kanpur section (343 km): Contract for Civil, Structure & Track works awarded and contract agreement signed in March, 2013.
Western Corridor:• Construction works of 54 major
and important bridges in Vaitarna - Bharuch section of Western DFC in progress. 21 major bridges completed.
• Rewari - Iqbalgarh (626 km): Contract for Civil & Track Package awarded in June, 2013.
New Ganjkhwaja
New Karwandiya
Phulera
Ambala
Ludhiana
Meerut
Aligarh
BhaupurKanpur
Allahabad
Madhya Pradesh
Uttar Pradesh
Uttaranchal
Bihar
Haryana
Punjab
Dankunj
Dedicated Freight Corridor (Eastern)
Source: The Dedicated Freight Corridor Corporation of India Ltd.
Sirhind and Dhandarikalan. Consequently, these locations are expected see growth of logistics and warehousing facilities.
Current status of the Dedicated Freight Corridor: Land Acquisition - Being acquired under Railway Amendment Act (RAA) 2008-(units in hectares)
Existing Line
DFC Line (Parallel)
It is proposed to set up Logistics Parks at Mumbai area, particularly in the vicinity of Kalyan-Ulhasnagar or Vashi-Belapur in Navi Mumbai, Vapi in southern Gujarat, Ahmedabad area in Gujarat, Gandhidham in the Kutch region of Gujarat, Jaipur area in Rajasthan, NCR of Delhi. These locations have been selected as they have a good concentration of diverse industries and constitute major production/ consumption centres. These are also well connected by rail and road systems for convenient movement in different directions. These parks are proposed to be developed on Public Private Partnership mode by creating a sub-SPV for the same. DFCCIL proposes to provide rail connectivity to such parks and private players would be asked to develop and provide state of the art infrastructure as a common user facility.
The Eastern DFC Traversing five states of Punjab, Haryana, Uttar Pradesh, Bihar and West Bengal, the Eastern Corridor covers a distance of 1839 km. between Ludhiana in Punjab and Dankunj in West Bengal.
The Eastern Corridor is projected to cater to a number of traffic streams - coal for the power plants in the northern region of U.P., Delhi, Haryana, Punjab and parts of Rajasthan from the Eastern coal fields, finished steel, food grains, cement, fertilizers, lime stone from Rajasthan to steel plants in the east and general goods. The traffic of these commodities is expected to grow by an incremental 92 million tons during the 2005-06 to 2021-22 period, most of which will be diverted to the Dedicated Freight Corridor.
Since the origin and destinations of traffic do not necessarily fall on the DFC, a number of junction arrangements have been planned to transfer traffic from the existing Indian Railway Corridor to the DFC and vice versa. These include Dankunj, Andal, Gomoh, Sonnagar, Ganjkhwaja, Mughalsarai, Jeonathpur, Naini/ Cheoki, Prempur, Bhaupur, Tundla, Daudkhan, Khurja, Kalanaur, Rajpura,
TEUs in 2021-22. The other commodities are projected to increase from 23 million tons in 2005-06 to 40 million tons in 2021-22.
Table: Land Acquisition Status (Units in Hectares)
Legend
37
RESEARCHINDIA LOGISTICS &
WAREHOUSING REPORT
Corridor Land to be Acquired
Land Acquired
Eastern DFC
4,807 3,635 (75%)
Western DFC
5,860 5,039 (85%)
Total 10,667 8,673 (81%)
Source: The Dedicated Freight Corridor Corporation of India Ltd.
Construction Work Progress:
Eastern Corridor: (i) Mughalsarai - Sonnagar section• Work of formation and bridges under
progress - 94% completed.
• Contracts for track work of 66 kms section of Mughalsarai-Sonnagar awarded. System tender awarded in May, 2013.
(ii) Khurja-Kanpur section (343 km): Contract for Civil, Structure & Track works awarded and contract agreement signed in March, 2013.
Western Corridor:• Construction works of 54 major
and important bridges in Vaitarna - Bharuch section of Western DFC in progress. 21 major bridges completed.
• Rewari - Iqbalgarh (626 km): Contract for Civil & Track Package awarded in June, 2013.
New GanjkhwajaNew GanjkhwajaNew GanjkhwajaNew Ganjkhwaja
New KarwandiyaNew KarwandiyaNew KarwandiyaNew KarwandiyaNew KarwandiyaNew KarwandiyaNew Karwandiya
PhuleraPhuleraPhuleraPhulera
AmbalaAmbalaAmbalaAmbalaAmbalaAmbalaAmbala
LudhianaLudhianaLudhianaLudhianaLudhiana
Meerut
Aligarh
BhaupurKanpur
AllahabadAllahabadAllahabadAllahabad
Madhya Pradesh
Uttar Pradesh
Uttaranchal
Bihar
Haryana
PunjabPunjabPunjab
DankunjDankunjDankunj
Dedicated Freight Corridor (Eastern)
Source: The Dedicated Freight Corridor Corporation of India Ltd.
Sirhind and Dhandarikalan. Consequently, these locations are expected see growth of logistics and warehousing facilities.
Current status of the Dedicated Freight Corridor:Land Acquisition - Being acquired under Railway Amendment Act (RAA) 2008-(units in hectares)
Existing Line
DFC Line (Parallel)
It is proposed to set up Logistics Parks at Mumbai area, particularly in the vicinity of Kalyan-Ulhasnagar or Vashi-Belapur in Navi Mumbai, Vapi in southern Gujarat, Ahmedabad area in Gujarat, Gandhidham in the Kutch region of Gujarat, Jaipur area in Rajasthan, NCR of Delhi. These locations have been selected as they have a good concentration of diverse industries and constitute major production/ consumption centres. These are also well connected by rail and road systems for convenient movement in different directions. These parks are proposed to be developed on Public Private Partnership mode by creating a sub-SPV for the same. DFCCIL proposes to provide rail connectivity to such parks and private players would be asked to develop and provide state of the art infrastructure as a common user facility.
The Eastern DFCTraversing five states of Punjab, Haryana, Uttar Pradesh, Bihar and West Bengal, the Eastern Corridor covers a distance of 1839 km. between Ludhiana in Punjab and Dankunj in West Bengal.
The Eastern Corridor is projected to cater to a number of traffic streams - coal for the power plants in the northern region of U.P., Delhi, Haryana, Punjab and parts of Rajasthan from the Eastern coal fields, finished steel, food grains, cement, fertilizers, lime stone from Rajasthan to steel plants in the east and general goods. The traffic of these commodities is expected to grow by an incremental 92 million tons during the 2005-06 to 2021-22 period, most of which will be diverted to the Dedicated Freight Corridor.
Since the origin and destinations of traffic do not necessarily fall on the DFC, a number of junction arrangements have been planned to transfer traffic from the existing Indian Railway Corridor to the DFC and vice versa. These include Dankunj, Andal, Gomoh, Sonnagar, Ganjkhwaja, Mughalsarai, Jeonathpur, Naini/ Cheoki, Prempur, Bhaupur, Tundla, Daudkhan, Khurja, Kalanaur, Rajpura,
TEUs in 2021-22. The other commodities are projected to increase from 23 million tons in 2005-06 to 40 million tons in 2021-22.
Table: Land Acquisition Status(Units in Hectares)
Legend
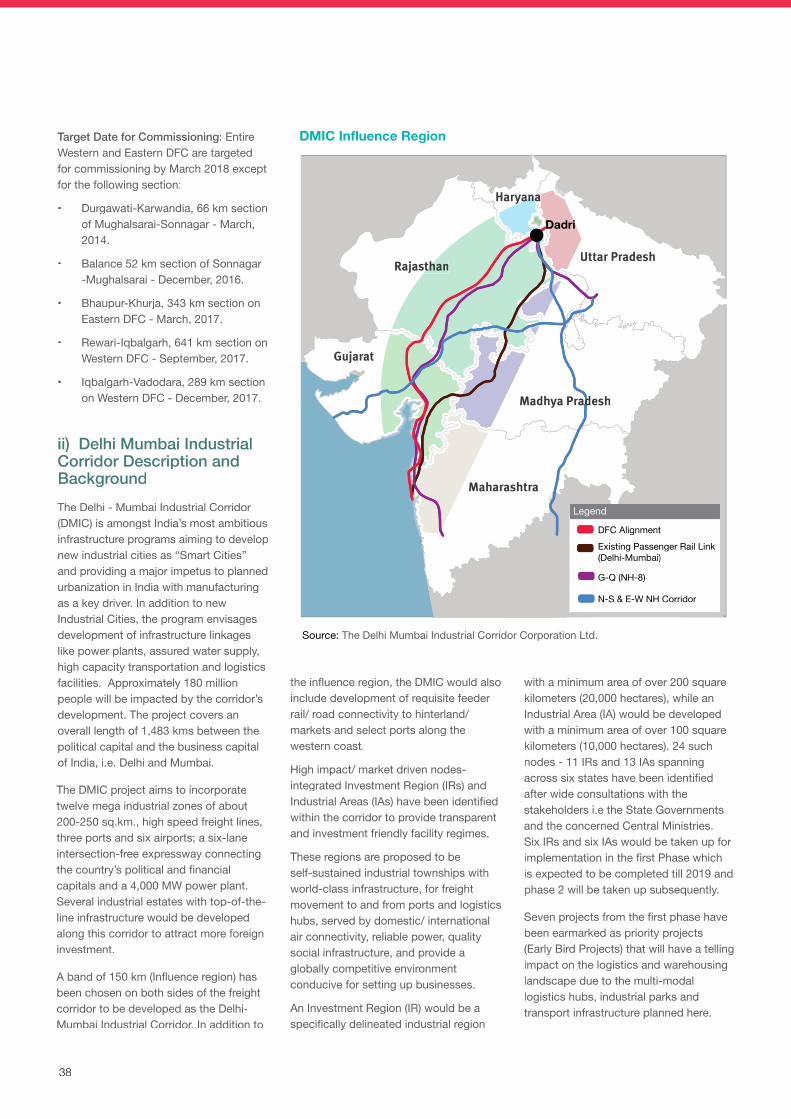
38
Source: The Delhi Mumbai Industrial Corridor Corporation Ltd.
Uttar Pradesh
Madhya Pradesh
Maharashtra
Gujarat
Rajasthan
Haryana
Dadri
The DMIC project aims to incorporate twelve mega industrial zones of about 200-250 sq.km., high speed freight lines, three ports and six airports; a six-lane intersection-free expressway connecting the country’s political and financial capitals and a 4,000 MW power plant. Several industrial estates with top-of-the-line infrastructure would be developed along this corridor to attract more foreign investment.
A band of 150 km (Influence region) has been chosen on both sides of the freight corridor to be developed as the Delhi-Mumbai Industrial Corridor. In addition to
the influence region, the DMIC would also include development of requisite feeder rail/ road connectivity to hinterland/markets and select ports along the western coast.
High impact/ market driven nodes- integrated Investment Region (IRs) and Industrial Areas (IAs) have been identified within the corridor to provide transparent and investment friendly facility regimes.
These regions are proposed to be self-sustained industrial townships with world-class infrastructure, for freight movement to and from ports and logistics hubs, served by domestic/ international air connectivity, reliable power, quality social infrastructure, and provide a globally competitive environment conducive for setting up businesses.
An Investment Region (IR) would be a specifically delineated industrial region
DFC AlignmentExisting Passenger Rail Link (Delhi-Mumbai)
G-Q (NH-8)
N-S & E-W NH Corridor
Target Date for Commissioning: Entire Western and Eastern DFC are targeted for commissioning by March 2018 except for the following section:
• Durgawati-Karwandia, 66 km section of Mughalsarai-Sonnagar - March, 2014.
• Balance 52 km section of Sonnagar -Mughalsarai - December, 2016.
• Bhaupur-Khurja, 343 km section on Eastern DFC - March, 2017.
• Rewari-Iqbalgarh, 641 km section on Western DFC - September, 2017.
• Iqbalgarh-Vadodara, 289 km section on Western DFC - December, 2017.
ii) Delhi Mumbai Industrial Corridor Description and BackgroundThe Delhi - Mumbai Industrial Corridor (DMIC) is amongst India’s most ambitious infrastructure programs aiming to develop new industrial cities as “Smart Cities” and providing a major impetus to planned urbanization in India with manufacturing as a key driver. In addition to new Industrial Cities, the program envisages development of infrastructure linkages like power plants, assured water supply, high capacity transportation and logistics facilities. Approximately 180 million people will be impacted by the corridor’s development. The project covers an overall length of 1,483 kms between the political capital and the business capital of India, i.e. Delhi and Mumbai.
DMIC Influence Region
with a minimum area of over 200 square kilometers (20,000 hectares), while an Industrial Area (IA) would be developed with a minimum area of over 100 square kilometers (10,000 hectares). 24 such nodes - 11 IRs and 13 IAs spanning across six states have been identified after wide consultations with the stakeholders i.e the State Governments and the concerned Central Ministries. Six IRs and six IAs would be taken up for implementation in the first Phase which is expected to be completed till 2019 and phase 2 will be taken up subsequently.
Seven projects from the first phase have been earmarked as priority projects (Early Bird Projects) that will have a telling impact on the logistics and warehousing landscape due to the multi-modal logistics hubs, industrial parks and transport infrastructure planned here.
Legend
38
Source: The Delhi Mumbai Industrial Corridor Corporation Ltd.
Uttar Pradesh
Madhya PradeshMadhya Pradesh
MaharashtraMaharashtra
Gujarat
RajasthanRajasthanRajasthan
HaryanaHaryanaHaryanaHaryanaHaryanaHaryanaHaryanaHaryanaHaryanaHaryanaHaryanaHaryanaHaryanaHaryanaHaryana
DadriDadriDadriDadriDadriDadriDadriDadriDadriDadri
The DMIC project aims to incorporate twelve mega industrial zones of about 200-250 sq.km., high speed freight lines, three ports and six airports; a six-lane intersection-free expressway connecting the country’s political and financial capitals and a 4,000 MW power plant. Several industrial estates with top-of-the-line infrastructure would be developed along this corridor to attract more foreign investment.
A band of 150 km (Influence region) has been chosen on both sides of the freight corridor to be developed as the Delhi-Mumbai Industrial Corridor. In addition to
the influence region, the DMIC would also include development of requisite feeder rail/ road connectivity to hinterland/markets and select ports along the western coast.
High impact/ market driven nodes- integrated Investment Region (IRs) and Industrial Areas (IAs) have been identified within the corridor to provide transparent and investment friendly facility regimes.
These regions are proposed to be self-sustained industrial townships with world-class infrastructure, for freight movement to and from ports and logistics hubs, served by domestic/ international air connectivity, reliable power, quality social infrastructure, and provide a globally competitive environment conducive for setting up businesses.
An Investment Region (IR) would be a specifically delineated industrial region
DFC AlignmentExisting Passenger Rail Link (Delhi-Mumbai)
G-Q (NH-8)
N-S & E-W NH Corridor
Target Date for Commissioning: Entire Western and Eastern DFC are targeted for commissioning by March 2018 except for the following section:
• Durgawati-Karwandia, 66 km section of Mughalsarai-Sonnagar - March, 2014.
• Balance 52 km section of Sonnagar -Mughalsarai - December, 2016.
• Bhaupur-Khurja, 343 km section on Eastern DFC - March, 2017.
• Rewari-Iqbalgarh, 641 km section on Western DFC - September, 2017.
• Iqbalgarh-Vadodara, 289 km section on Western DFC - December, 2017.
ii) Delhi Mumbai Industrial Corridor Description and BackgroundThe Delhi - Mumbai Industrial Corridor (DMIC) is amongst India’s most ambitious infrastructure programs aiming to develop new industrial cities as “Smart Cities” and providing a major impetus to planned urbanization in India with manufacturing as a key driver. In addition to new Industrial Cities, the program envisages development of infrastructure linkages like power plants, assured water supply, high capacity transportation and logistics facilities. Approximately 180 million people will be impacted by the corridor’s development. The project covers an overall length of 1,483 kms between the political capital and the business capital of India, i.e. Delhi and Mumbai.
DMIC Influence Region
with a minimum area of over 200 square kilometers (20,000 hectares), while an Industrial Area (IA) would be developed with a minimum area of over 100 square kilometers (10,000 hectares). 24 such nodes - 11 IRs and 13 IAs spanning across six states have been identified after wide consultations with the stakeholders i.e the State Governments and the concerned Central Ministries. Six IRs and six IAs would be taken up for implementation in the first Phase which is expected to be completed till 2019 and phase 2 will be taken up subsequently.
Seven projects from the first phase have been earmarked as priority projects (Early Bird Projects) that will have a telling impact on the logistics and warehousing landscape due to the multi-modal logistics hubs, industrial parks and transport infrastructure planned here.
Legend
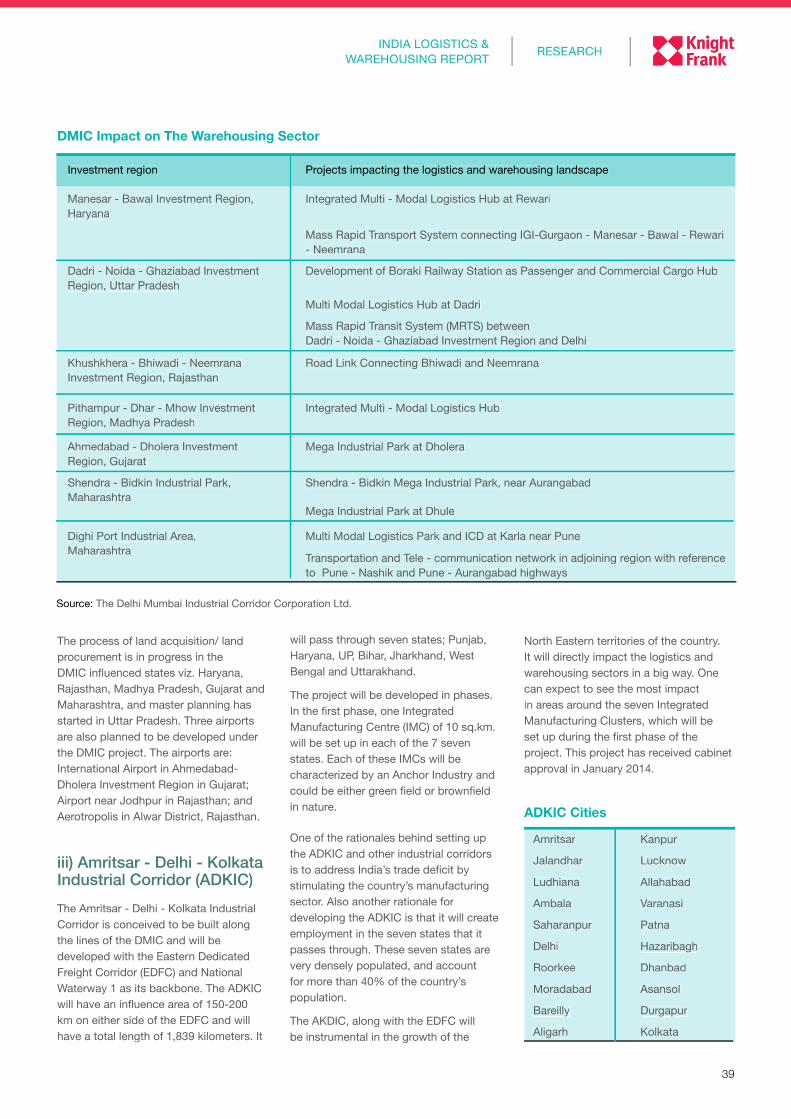
39
RESEARCHINDIA LOGISTICS &
WAREHOUSING REPORT
DMIC Impact on The Warehousing Sector
ADKIC Cities
The process of land acquisition/ land procurement is in progress in the DMIC influenced states viz. Haryana, Rajasthan, Madhya Pradesh, Gujarat and Maharashtra, and master planning has started in Uttar Pradesh. Three airports are also planned to be developed under the DMIC project. The airports are: International Airport in Ahmedabad-Dholera Investment Region in Gujarat; Airport near Jodhpur in Rajasthan; and Aerotropolis in Alwar District, Rajasthan.
iii) Amritsar - Delhi - Kolkata Industrial Corridor (ADKIC)The Amritsar - Delhi - Kolkata Industrial Corridor is conceived to be built along the lines of the DMIC and will be developed with the Eastern Dedicated Freight Corridor (EDFC) and National Waterway 1 as its backbone. The ADKIC will have an influence area of 150-200 km on either side of the EDFC and will have a total length of 1,839 kilometers. It
Amritsar Kanpur
Jalandhar Lucknow
Ludhiana Allahabad
Ambala Varanasi
Saharanpur Patna
Delhi Hazaribagh
Roorkee Dhanbad
Moradabad Asansol
Bareilly Durgapur
Aligarh Kolkata
will pass through seven states; Punjab, Haryana, UP, Bihar, Jharkhand, West Bengal and Uttarakhand.
The project will be developed in phases. In the first phase, one Integrated Manufacturing Centre (IMC) of 10 sq.km.will be set up in each of the 7 seven states. Each of these IMCs will be characterized by an Anchor Industry and could be either green field or brownfield in nature.
One of the rationales behind setting up the ADKIC and other industrial corridors is to address India’s trade deficit by stimulating the country’s manufacturing sector. Also another rationale for developing the ADKIC is that it will create employment in the seven states that it passes through. These seven states are very densely populated, and account for more than 40% of the country’s population.
The AKDIC, along with the EDFC will be instrumental in the growth of the
Source: The Delhi Mumbai Industrial Corridor Corporation Ltd.
Investment region Projects impacting the logistics and warehousing landscape
Manesar - Bawal Investment Region, Haryana
Integrated Multi - Modal Logistics Hub at Rewari
Mass Rapid Transport System connecting IGI-Gurgaon - Manesar - Bawal - Rewari - Neemrana
Dadri - Noida - Ghaziabad Investment Region, Uttar Pradesh
Development of Boraki Railway Station as Passenger and Commercial Cargo Hub
Multi Modal Logistics Hub at Dadri
Mass Rapid Transit System (MRTS) between Dadri - Noida - Ghaziabad Investment Region and Delhi
Khushkhera - Bhiwadi - Neemrana Investment Region, Rajasthan
Road Link Connecting Bhiwadi and Neemrana
Pithampur - Dhar - Mhow Investment Region, Madhya Pradesh
Integrated Multi - Modal Logistics Hub
Ahmedabad - Dholera Investment Region, Gujarat
Mega Industrial Park at Dholera
Shendra - Bidkin Industrial Park, Maharashtra
Shendra - Bidkin Mega Industrial Park, near Aurangabad
Mega Industrial Park at Dhule
Dighi Port Industrial Area, Maharashtra
Multi Modal Logistics Park and ICD at Karla near Pune
Transportation and Tele - communication network in adjoining region with reference to Pune - Nashik and Pune - Aurangabad highways
North Eastern territories of the country. It will directly impact the logistics and warehousing sectors in a big way. One can expect to see the most impact in areas around the seven Integrated Manufacturing Clusters, which will be set up during the first phase of the project. This project has received cabinet approval in January 2014.
39
RESEARCHINDIA LOGISTICS &
WAREHOUSING REPORT
DMIC Impact on The Warehousing Sector
ADKIC Cities
The process of land acquisition/ land procurement is in progress in the DMIC influenced states viz. Haryana, Rajasthan, Madhya Pradesh, Gujarat and Maharashtra, and master planning has started in Uttar Pradesh. Three airports are also planned to be developed under the DMIC project. The airports are: International Airport in Ahmedabad-Dholera Investment Region in Gujarat; Airport near Jodhpur in Rajasthan; and Aerotropolis in Alwar District, Rajasthan.
iii) Amritsar - Delhi - Kolkata Industrial Corridor (ADKIC)The Amritsar - Delhi - Kolkata Industrial Corridor is conceived to be built along the lines of the DMIC and will be developed with the Eastern Dedicated Freight Corridor (EDFC) and National Waterway 1 as its backbone. The ADKIC will have an influence area of 150-200 km on either side of the EDFC and will have a total length of 1,839 kilometers. It
Amritsar Kanpur
Jalandhar Lucknow
Ludhiana Allahabad
Ambala Varanasi
Saharanpur Patna
Delhi Hazaribagh
Roorkee Dhanbad
Moradabad Asansol
Bareilly Durgapur
Aligarh Kolkata
will pass through seven states; Punjab, Haryana, UP, Bihar, Jharkhand, West Bengal and Uttarakhand.
The project will be developed in phases. In the first phase, one Integrated Manufacturing Centre (IMC) of 10 sq.km.will be set up in each of the 7 seven states. Each of these IMCs will be characterized by an Anchor Industry and could be either green field or brownfield in nature.
One of the rationales behind setting up the ADKIC and other industrial corridors is to address India’s trade deficit by stimulating the country’s manufacturing sector. Also another rationale for developing the ADKIC is that it will create employment in the seven states that it passes through. These seven states are very densely populated, and account for more than 40% of the country’s population.
The AKDIC, along with the EDFC will be instrumental in the growth of the
Source: The Delhi Mumbai Industrial Corridor Corporation Ltd.
Investment region Projects impacting the logistics and warehousing landscape
Manesar - Bawal Investment Region, Haryana
Integrated Multi - Modal Logistics Hub at Rewari
Mass Rapid Transport System connecting IGI-Gurgaon - Manesar - Bawal - Rewari - Neemrana
Dadri - Noida - Ghaziabad Investment Region, Uttar Pradesh
Development of Boraki Railway Station as Passenger and Commercial Cargo Hub
Multi Modal Logistics Hub at Dadri
Mass Rapid Transit System (MRTS) betweenDadri - Noida - Ghaziabad Investment Region and Delhi
Khushkhera - Bhiwadi - Neemrana Investment Region, Rajasthan
Road Link Connecting Bhiwadi and Neemrana
Pithampur - Dhar - Mhow Investment Region, Madhya Pradesh
Integrated Multi - Modal Logistics Hub
Ahmedabad - Dholera Investment Region, Gujarat
Mega Industrial Park at Dholera
Shendra - Bidkin Industrial Park, Maharashtra
Shendra - Bidkin Mega Industrial Park, near Aurangabad
Mega Industrial Park at Dhule
Dighi Port Industrial Area,Maharashtra
Multi Modal Logistics Park and ICD at Karla near Pune
Transportation and Tele - communication network in adjoining region with reference to Pune - Nashik and Pune - Aurangabad highways
North Eastern territories of the country. It will directly impact the logistics and warehousing sectors in a big way. One can expect to see the most impact in areas around the seven Integrated Manufacturing Clusters, which will be set up during the first phase of the project. This project has received cabinet approval in January 2014.
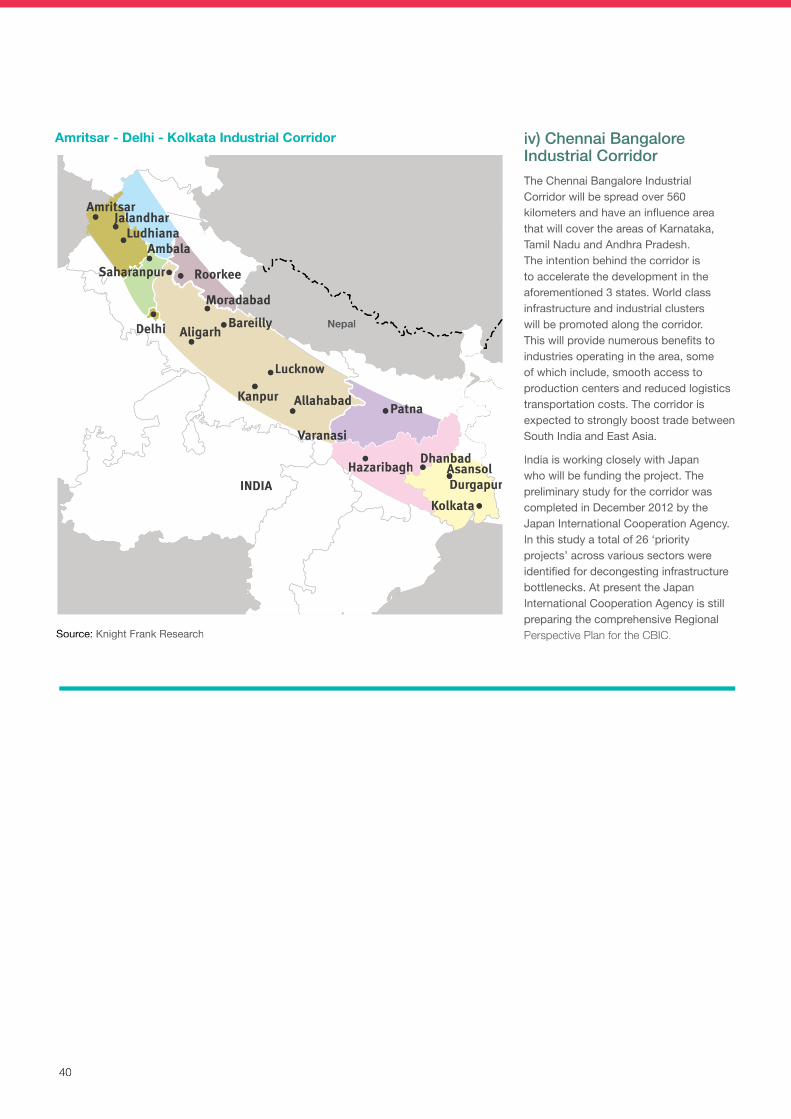
40
Source: Knight Frank Research
Amritsar - Delhi - Kolkata Industrial Corridor iv) Chennai Bangalore Industrial CorridorThe Chennai Bangalore Industrial Corridor will be spread over 560 kilometers and have an influence area that will cover the areas of Karnataka, Tamil Nadu and Andhra Pradesh. The intention behind the corridor is to accelerate the development in the aforementioned 3 states. World class infrastructure and industrial clusters will be promoted along the corridor. This will provide numerous benefits to industries operating in the area, some of which include, smooth access to production centers and reduced logistics transportation costs. The corridor is expected to strongly boost trade between South India and East Asia.
India is working closely with Japan who will be funding the project. The preliminary study for the corridor was completed in December 2012 by the Japan International Cooperation Agency. In this study a total of 26 ‘priority projects’ across various sectors were identified for decongesting infrastructure bottlenecks. At present the Japan International Cooperation Agency is still preparing the comprehensive Regional Perspective Plan for the CBIC.
Nepal
INDIA
Varanasi
Kanpur Allahabad
Lucknow
BareillyAligarh
Roorkee
Moradabad
Patna
HazaribaghDhanbad
DurgapurKolkata
Asansol
JalandharLudhiana
Saharanpur
Ambala
Amritsar
Delhi
40
Source: Knight Frank Research
Amritsar - Delhi - Kolkata Industrial Corridor iv) Chennai Bangalore Industrial CorridorThe Chennai Bangalore Industrial Corridor will be spread over 560 kilometers and have an influence area that will cover the areas of Karnataka, Tamil Nadu and Andhra Pradesh. The intention behind the corridor is to accelerate the development in the aforementioned 3 states. World class infrastructure and industrial clusters will be promoted along the corridor. This will provide numerous benefits to industries operating in the area, some of which include, smooth access to production centers and reduced logistics transportation costs. The corridor is expected to strongly boost trade between South India and East Asia.
India is working closely with Japan who will be funding the project. The preliminary study for the corridor was completed in December 2012 by the Japan International Cooperation Agency. In this study a total of 26 ‘priority projects’ across various sectors were identified for decongesting infrastructure bottlenecks. At present the Japan International Cooperation Agency is still preparing the comprehensive Regional Perspective Plan for the CBIC.
Nepal
INDIA
VaranasiVaranasiVaranasiVaranasiVaranasiVaranasiVaranasi
KanpurKanpurKanpur Allahabad Allahabad
LucknowLucknowLucknowLucknow
BareillyBareillyBareillyBareillyBareillyAligarh Aligarh
RoorkeeRoorkeeRoorkee
MoradabadMoradabadMoradabadMoradabadMoradabadMoradabadMoradabadMoradabadMoradabad
PatnaPatnaPatna
HazaribaghHazaribaghHazaribaghHazaribaghHazaribaghHazaribaghHazaribaghHazaribaghHazaribaghHazaribaghDhanbadDhanbadDhanbadDhanbad
DurgapurDurgapurDurgapurKolkataKolkataKolkata
Asansol Asansol Asansol Asansol
JalandharJalandharJalandharJalandharJalandharJalandharJalandharJalandharJalandharLudhianaLudhianaLudhianaLudhianaLudhianaLudhianaLudhianaLudhianaLudhianaLudhiana
Saharanpur Saharanpur Saharanpur Saharanpur Saharanpur Saharanpur Saharanpur Saharanpur Saharanpur Saharanpur
AmbalaAmbalaAmbalaAmbalaAmbalaAmbalaAmbalaAmbalaAmbalaAmbala
AmritsarAmritsarAmritsarAmritsarAmritsarAmritsar
Delhi Delhi Delhi Delhi Delhi Delhi Delhi Delhi Delhi Delhi Delhi Delhi Delhi Delhi
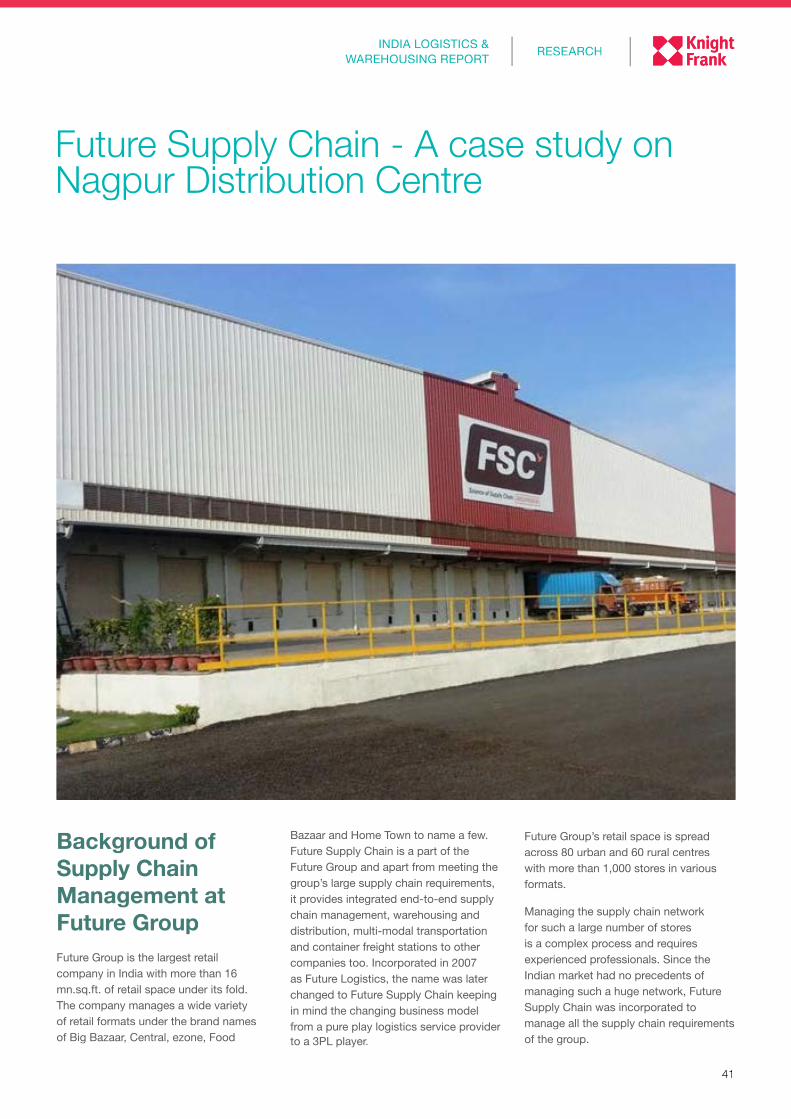
41
RESEARCHINDIA LOGISTICS &
WAREHOUSING REPORT
Future Supply Chain - A case study on Nagpur Distribution Centre
Background of Supply Chain Management at Future GroupFuture Group is the largest retail company in India with more than 16 mn.sq.ft. of retail space under its fold. The company manages a wide variety of retail formats under the brand names of Big Bazaar, Central, ezone, Food
Bazaar and Home Town to name a few. Future Supply Chain is a part of the Future Group and apart from meeting the group’s large supply chain requirements, it provides integrated end-to-end supply chain management, warehousing and distribution, multi-modal transportation and container freight stations to other companies too. Incorporated in 2007 as Future Logistics, the name was later changed to Future Supply Chain keeping in mind the changing business model from a pure play logistics service provider to a 3PL player.
Future Group’s retail space is spread across 80 urban and 60 rural centres with more than 1,000 stores in various formats.
Managing the supply chain network for such a large number of stores is a complex process and requires experienced professionals. Since the Indian market had no precedents of managing such a huge network, Future Supply Chain was incorporated to manage all the supply chain requirements of the group.
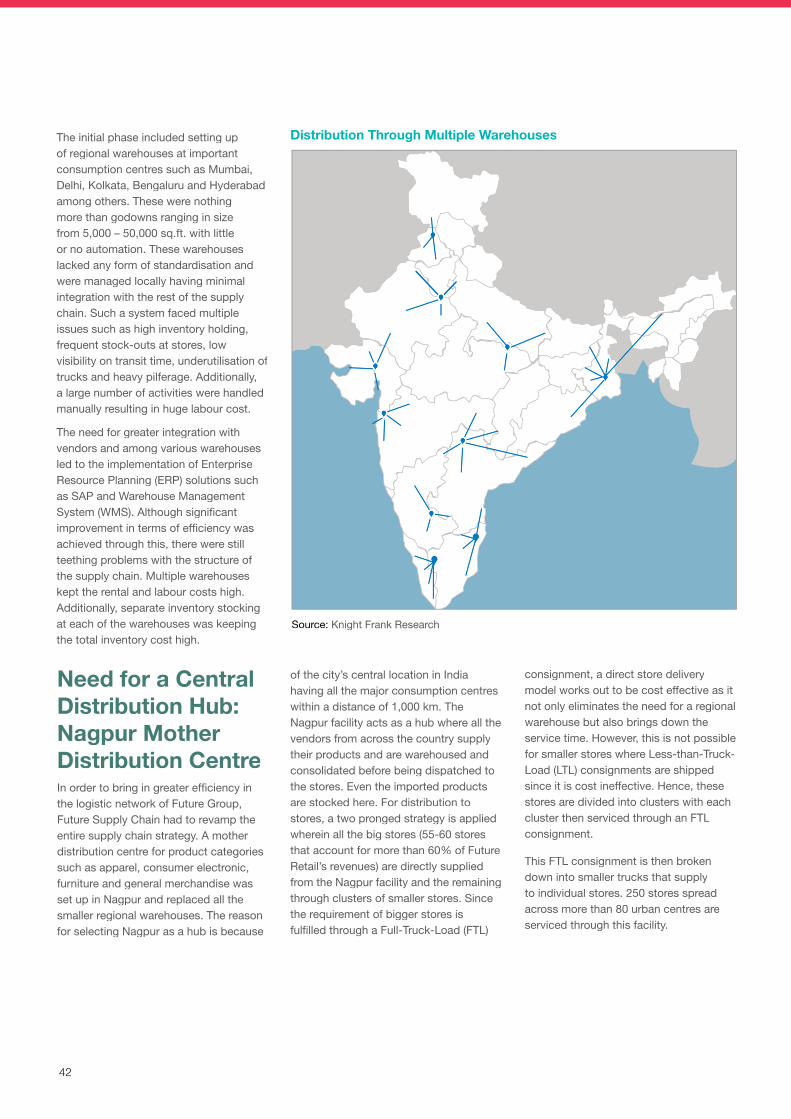
42
The initial phase included setting up of regional warehouses at important consumption centres such as Mumbai, Delhi, Kolkata, Bengaluru and Hyderabad among others. These were nothing more than godowns ranging in size from 5,000 – 50,000 sq.ft. with little or no automation. These warehouses lacked any form of standardisation and were managed locally having minimal integration with the rest of the supply chain. Such a system faced multiple issues such as high inventory holding, frequent stock-outs at stores, low visibility on transit time, underutilisation of trucks and heavy pilferage. Additionally, a large number of activities were handled manually resulting in huge labour cost.
The need for greater integration with vendors and among various warehouses led to the implementation of Enterprise Resource Planning (ERP) solutions such as SAP and Warehouse Management System (WMS). Although significant improvement in terms of efficiency was achieved through this, there were still teething problems with the structure of the supply chain. Multiple warehouses kept the rental and labour costs high. Additionally, separate inventory stocking at each of the warehouses was keeping the total inventory cost high.
Need for a Central Distribution Hub: Nagpur Mother Distribution CentreIn order to bring in greater efficiency in the logistic network of Future Group, Future Supply Chain had to revamp the entire supply chain strategy. A mother distribution centre for product categories such as apparel, consumer electronic, furniture and general merchandise was set up in Nagpur and replaced all the smaller regional warehouses. The reason for selecting Nagpur as a hub is because
consignment, a direct store delivery model works out to be cost effective as it not only eliminates the need for a regional warehouse but also brings down the service time. However, this is not possible for smaller stores where Less-than-Truck-Load (LTL) consignments are shipped since it is cost ineffective. Hence, these stores are divided into clusters with each cluster then serviced through an FTL consignment.
This FTL consignment is then broken down into smaller trucks that supply to individual stores. 250 stores spread across more than 80 urban centres are serviced through this facility.
Source: Knight Frank Research
of the city’s central location in India having all the major consumption centres within a distance of 1,000 km. The Nagpur facility acts as a hub where all the vendors from across the country supply their products and are warehoused and consolidated before being dispatched to the stores. Even the imported products are stocked here. For distribution to stores, a two pronged strategy is applied wherein all the big stores (55-60 stores that account for more than 60% of Future Retail’s revenues) are directly supplied from the Nagpur facility and the remaining through clusters of smaller stores. Since the requirement of bigger stores is fulfilled through a Full-Truck-Load (FTL)
Distribution Through Multiple Warehouses
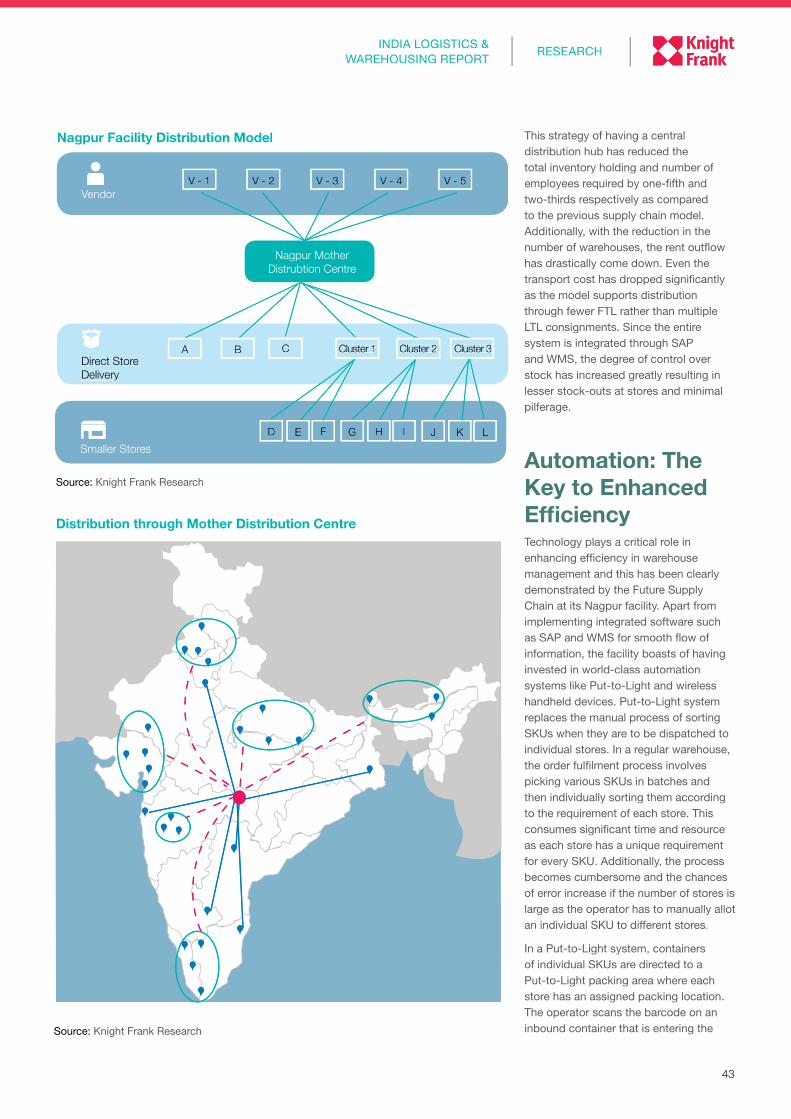
43
RESEARCHINDIA LOGISTICS &
WAREHOUSING REPORT
Source: Knight Frank Research
Source: Knight Frank Research
This strategy of having a central distribution hub has reduced the total inventory holding and number of employees required by one-fifth and two-thirds respectively as compared to the previous supply chain model. Additionally, with the reduction in the number of warehouses, the rent outflow has drastically come down. Even the transport cost has dropped significantly as the model supports distribution through fewer FTL rather than multiple LTL consignments. Since the entire system is integrated through SAP and WMS, the degree of control over stock has increased greatly resulting in lesser stock-outs at stores and minimal pilferage.
Automation: The Key to Enhanced EfficiencyTechnology plays a critical role in enhancing efficiency in warehouse management and this has been clearly demonstrated by the Future Supply Chain at its Nagpur facility. Apart from implementing integrated software such as SAP and WMS for smooth flow of information, the facility boasts of having invested in world-class automation systems like Put-to-Light and wireless handheld devices. Put-to-Light system replaces the manual process of sorting SKUs when they are to be dispatched to individual stores. In a regular warehouse, the order fulfilment process involves picking various SKUs in batches and then individually sorting them according to the requirement of each store. This consumes significant time and resource as each store has a unique requirement for every SKU. Additionally, the process becomes cumbersome and the chances of error increase if the number of stores is large as the operator has to manually allot an individual SKU to different stores.
In a Put-to-Light system, containers of individual SKUs are directed to a Put-to-Light packing area where each store has an assigned packing location. The operator scans the barcode on an inbound container that is entering the
Distribution through Mother Distribution Centre
Nagpur Facility Distribution Model
Smaller Stores
Vendor
Direct StoreDelivery
Nagpur Mother Distrubtion Centre
D G JE H KF I L
V - 4 V - 5V - 3V - 2V - 1
A B C Cluster 1 Cluster 2 Cluster 3
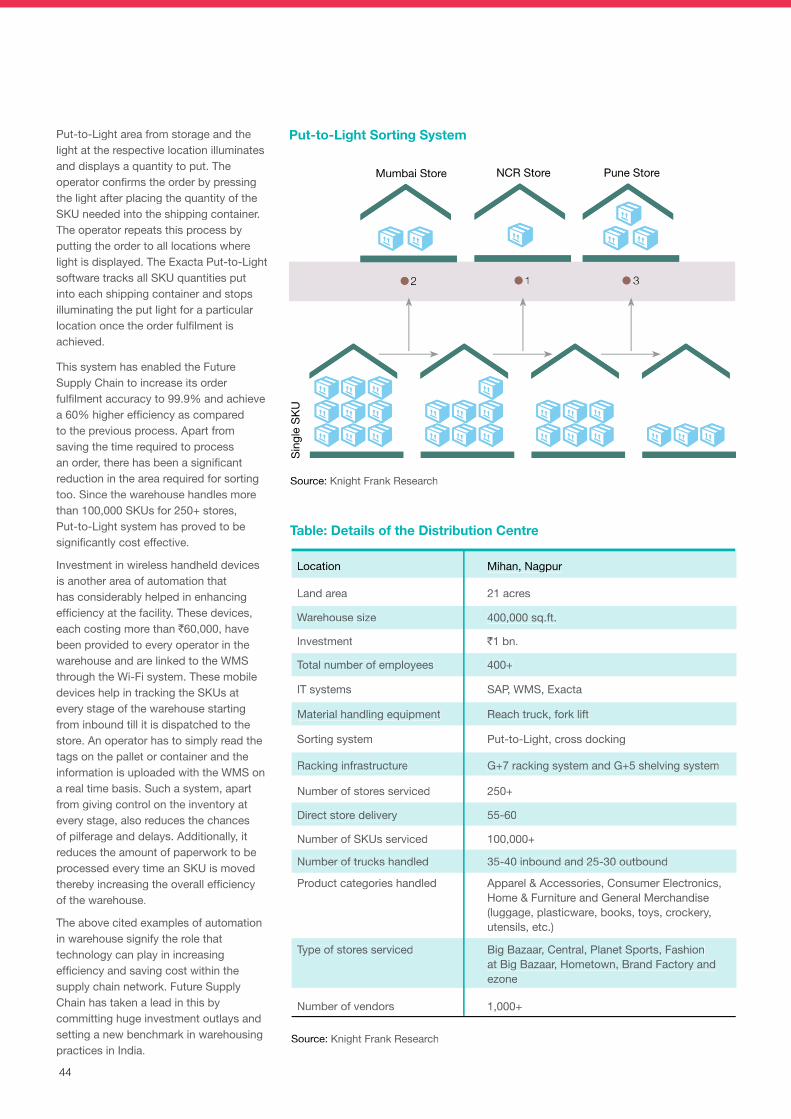
44
Source: Knight Frank Research
Table: Details of the Distribution Centre
Location Mihan, Nagpur
Land area 21 acres
Warehouse size 400,000 sq.ft.
Investment `1 bn.
Total number of employees 400+
IT systems SAP, WMS, Exacta
Material handling equipment Reach truck, fork lift
Sorting system Put-to-Light, cross docking
Racking infrastructure G+7 racking system and G+5 shelving system
Number of stores serviced 250+
Direct store delivery 55-60
Number of SKUs serviced 100,000+
Number of trucks handled 35-40 inbound and 25-30 outbound
Product categories handled Apparel & Accessories, Consumer Electronics, Home & Furniture and General Merchandise (luggage, plasticware, books, toys, crockery, utensils, etc.)
Type of stores serviced Big Bazaar, Central, Planet Sports, Fashion at Big Bazaar, Hometown, Brand Factory and ezone
Number of vendors 1,000+
Source: Knight Frank Research
Sing
le S
KU
Mumbai Store
2
Pune Store
31
NCR Store
Put-to-Light Sorting SystemPut-to-Light area from storage and the light at the respective location illuminates and displays a quantity to put. The operator confirms the order by pressing the light after placing the quantity of the SKU needed into the shipping container. The operator repeats this process by putting the order to all locations where light is displayed. The Exacta Put-to-Light software tracks all SKU quantities put into each shipping container and stops illuminating the put light for a particular location once the order fulfilment is achieved.
This system has enabled the Future Supply Chain to increase its order fulfilment accuracy to 99.9% and achieve a 60% higher efficiency as compared to the previous process. Apart from saving the time required to process an order, there has been a significant reduction in the area required for sorting too. Since the warehouse handles more than 100,000 SKUs for 250+ stores, Put-to-Light system has proved to be significantly cost effective.
Investment in wireless handheld devices is another area of automation that has considerably helped in enhancing efficiency at the facility. These devices, each costing more than `60,000, have been provided to every operator in the warehouse and are linked to the WMS through the Wi-Fi system. These mobile devices help in tracking the SKUs at every stage of the warehouse starting from inbound till it is dispatched to the store. An operator has to simply read the tags on the pallet or container and the information is uploaded with the WMS on a real time basis. Such a system, apart from giving control on the inventory at every stage, also reduces the chances of pilferage and delays. Additionally, it reduces the amount of paperwork to be processed every time an SKU is moved thereby increasing the overall efficiency of the warehouse.
The above cited examples of automation in warehouse signify the role that technology can play in increasing efficiency and saving cost within the supply chain network. Future Supply Chain has taken a lead in this by committing huge investment outlays and setting a new benchmark in warehousing practices in India.
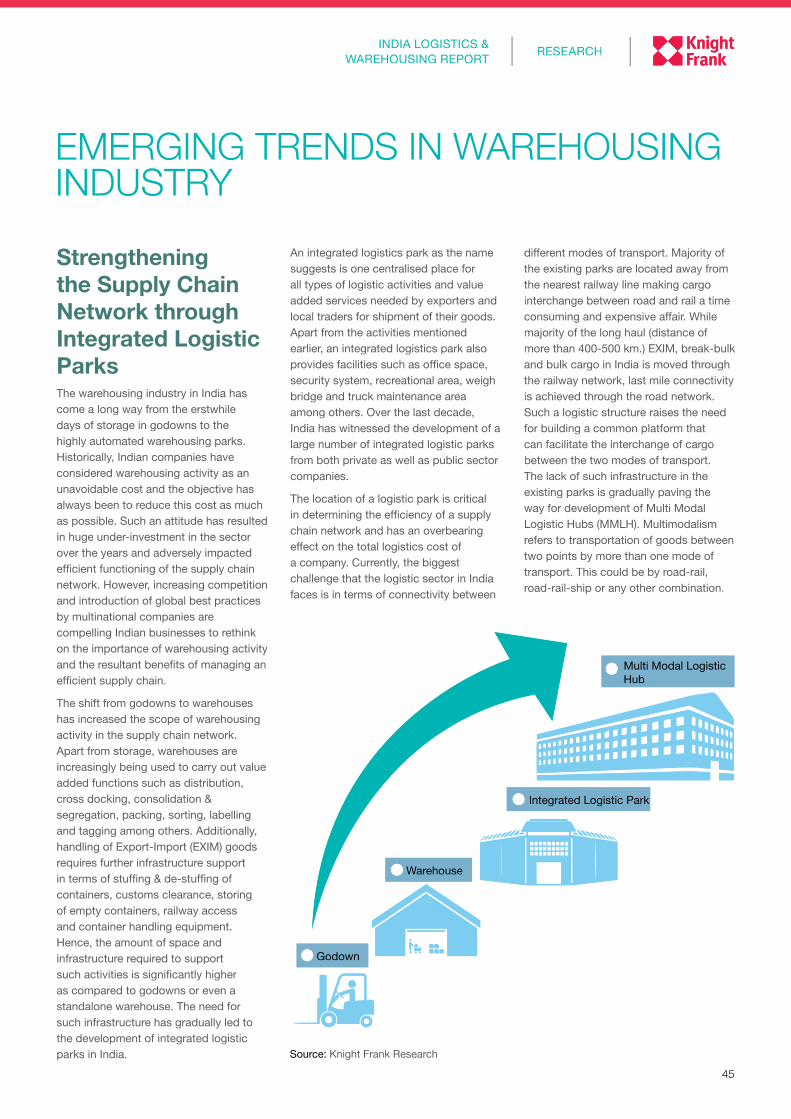
45
RESEARCHINDIA LOGISTICS &
WAREHOUSING REPORT
EMERGING TRENDS IN WAREHOUSING INDUSTRY
Strengthening the Supply Chain Network through Integrated Logistic ParksThe warehousing industry in India has come a long way from the erstwhile days of storage in godowns to the highly automated warehousing parks. Historically, Indian companies have considered warehousing activity as an unavoidable cost and the objective has always been to reduce this cost as much as possible. Such an attitude has resulted in huge under-investment in the sector over the years and adversely impacted efficient functioning of the supply chain network. However, increasing competition and introduction of global best practices by multinational companies are compelling Indian businesses to rethink on the importance of warehousing activity and the resultant benefits of managing an efficient supply chain.
The shift from godowns to warehouses has increased the scope of warehousing activity in the supply chain network. Apart from storage, warehouses are increasingly being used to carry out value added functions such as distribution, cross docking, consolidation & segregation, packing, sorting, labelling and tagging among others. Additionally, handling of Export-Import (EXIM) goods requires further infrastructure support in terms of stuffing & de-stuffing of containers, customs clearance, storing of empty containers, railway access and container handling equipment. Hence, the amount of space and infrastructure required to support such activities is significantly higher as compared to godowns or even a standalone warehouse. The need for such infrastructure has gradually led to the development of integrated logistic parks in India.
An integrated logistics park as the name suggests is one centralised place for all types of logistic activities and value added services needed by exporters and local traders for shipment of their goods. Apart from the activities mentioned earlier, an integrated logistics park also provides facilities such as office space, security system, recreational area, weigh bridge and truck maintenance area among others. Over the last decade, India has witnessed the development of a large number of integrated logistic parks from both private as well as public sector companies.
The location of a logistic park is critical in determining the efficiency of a supply chain network and has an overbearing effect on the total logistics cost of a company. Currently, the biggest challenge that the logistic sector in India faces is in terms of connectivity between
different modes of transport. Majority of the existing parks are located away from the nearest railway line making cargo interchange between road and rail a time consuming and expensive affair. While majority of the long haul (distance of more than 400-500 km.) EXIM, break-bulk and bulk cargo in India is moved through the railway network, last mile connectivity is achieved through the road network. Such a logistic structure raises the need for building a common platform that can facilitate the interchange of cargo between the two modes of transport. The lack of such infrastructure in the existing parks is gradually paving the way for development of Multi Modal Logistic Hubs (MMLH). Multimodalism refers to transportation of goods between two points by more than one mode of transport. This could be by road-rail, road-rail-ship or any other combination.
Godown
Warehouse
Integrated Logistic Park
Multi Modal Logistic Hub
Source: Knight Frank Research
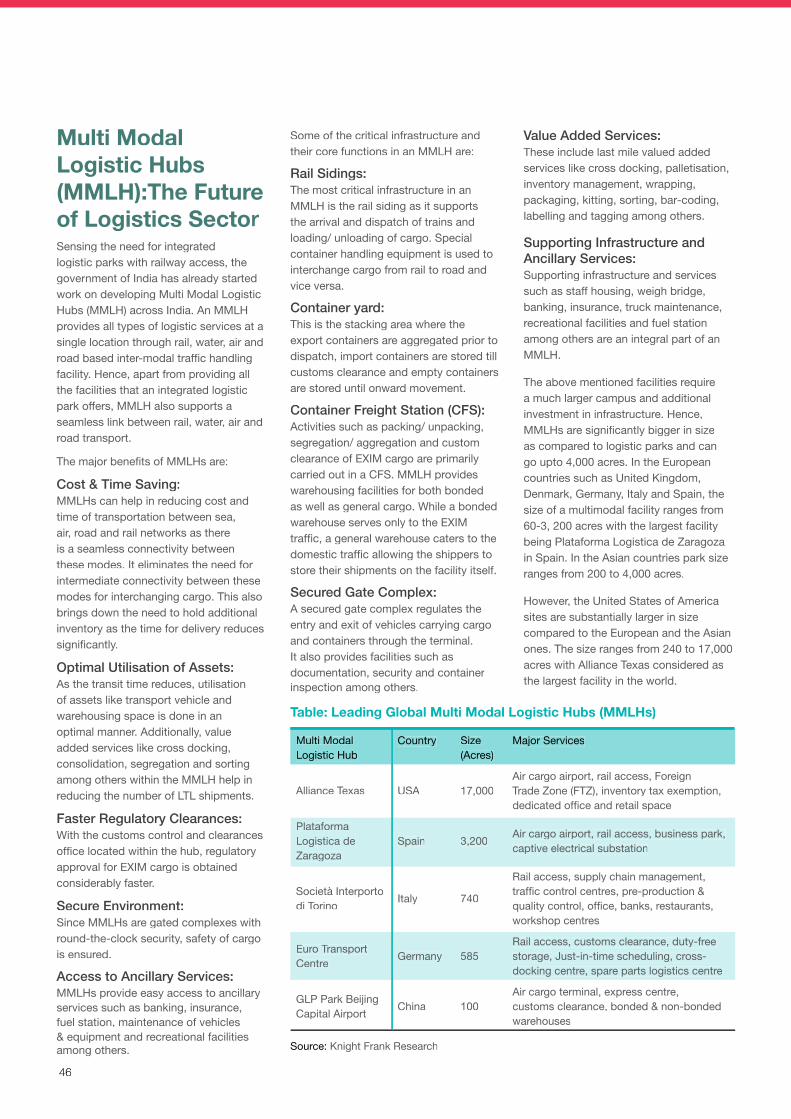
46
Multi Modal Logistic Hubs (MMLH):The Future of Logistics SectorSensing the need for integrated logistic parks with railway access, the government of India has already started work on developing Multi Modal Logistic Hubs (MMLH) across India. An MMLH provides all types of logistic services at a single location through rail, water, air and road based inter-modal traffic handling facility. Hence, apart from providing all the facilities that an integrated logistic park offers, MMLH also supports a seamless link between rail, water, air and road transport.
The major benefits of MMLHs are:
Cost & Time Saving: MMLHs can help in reducing cost and time of transportation between sea, air, road and rail networks as there is a seamless connectivity between these modes. It eliminates the need for intermediate connectivity between these modes for interchanging cargo. This also brings down the need to hold additional inventory as the time for delivery reduces significantly.
Optimal Utilisation of Assets: As the transit time reduces, utilisation of assets like transport vehicle and warehousing space is done in an optimal manner. Additionally, value added services like cross docking, consolidation, segregation and sorting among others within the MMLH help in reducing the number of LTL shipments.
Faster Regulatory Clearances: With the customs control and clearances office located within the hub, regulatory approval for EXIM cargo is obtained considerably faster.
Secure Environment: Since MMLHs are gated complexes with round-the-clock security, safety of cargo is ensured.
Access to Ancillary Services: MMLHs provide easy access to ancillary services such as banking, insurance, fuel station, maintenance of vehicles & equipment and recreational facilities among others.
Some of the critical infrastructure and their core functions in an MMLH are:
Rail Sidings: The most critical infrastructure in an MMLH is the rail siding as it supports the arrival and dispatch of trains and loading/ unloading of cargo. Special container handling equipment is used to interchange cargo from rail to road and vice versa.
Container yard: This is the stacking area where the export containers are aggregated prior to dispatch, import containers are stored till customs clearance and empty containers are stored until onward movement.
Container Freight Station (CFS): Activities such as packing/ unpacking, segregation/ aggregation and custom clearance of EXIM cargo are primarily carried out in a CFS. MMLH provides warehousing facilities for both bonded as well as general cargo. While a bonded warehouse serves only to the EXIM traffic, a general warehouse caters to the domestic traffic allowing the shippers to store their shipments on the facility itself.
Secured Gate Complex: A secured gate complex regulates the entry and exit of vehicles carrying cargo and containers through the terminal. It also provides facilities such as documentation, security and container inspection among others.
Multi Modal Logistic Hub
Country Size (Acres)
Major Services
Alliance Texas USA 17,000Air cargo airport, rail access, Foreign Trade Zone (FTZ), inventory tax exemption, dedicated office and retail space
Plataforma Logistica de Zaragoza
Spain 3,200 Air cargo airport, rail access, business park, captive electrical substation
Società Interporto di Torino Italy 740
Rail access, supply chain management, traffic control centres, pre‐production & quality control, office, banks, restaurants, workshop centres
Euro Transport Centre Germany 585
Rail access, customs clearance, duty-free storage, Just-in-time scheduling, cross-docking centre, spare parts logistics centre
GLP Park Beijing Capital Airport China 100
Air cargo terminal, express centre, customs clearance, bonded & non-bonded warehouses
Source: Knight Frank Research
Table: Leading Global Multi Modal Logistic Hubs (MMLHs)
Value Added Services: These include last mile valued added services like cross docking, palletisation, inventory management, wrapping, packaging, kitting, sorting, bar‐coding, labelling and tagging among others.
Supporting Infrastructure and Ancillary Services: Supporting infrastructure and services such as staff housing, weigh bridge, banking, insurance, truck maintenance, recreational facilities and fuel station among others are an integral part of an MMLH.
The above mentioned facilities require a much larger campus and additional investment in infrastructure. Hence, MMLHs are significantly bigger in size as compared to logistic parks and can go upto 4,000 acres. In the European countries such as United Kingdom, Denmark, Germany, Italy and Spain, the size of a multimodal facility ranges from 60‐3, 200 acres with the largest facility being Plataforma Logistica de Zaragoza in Spain. In the Asian countries park size ranges from 200 to 4,000 acres.
However, the United States of America sites are substantially larger in size compared to the European and the Asian ones. The size ranges from 240 to 17,000 acres with Alliance Texas considered as the largest facility in the world.
46
Multi Modal Logistic Hubs (MMLH):The Future of Logistics SectorSensing the need for integrated logistic parks with railway access, the government of India has already started work on developing Multi Modal Logistic Hubs (MMLH) across India. An MMLH provides all types of logistic services at a single location through rail, water, air and road based inter-modal traffic handling facility. Hence, apart from providing all the facilities that an integrated logistic park offers, MMLH also supports a seamless link between rail, water, air and road transport.
The major benefits of MMLHs are:
Cost & Time Saving:MMLHs can help in reducing cost and time of transportation between sea, air, road and rail networks as there is a seamless connectivity between these modes. It eliminates the need for intermediate connectivity between these modes for interchanging cargo. This also brings down the need to hold additional inventory as the time for delivery reduces significantly.
Optimal Utilisation of Assets: As the transit time reduces, utilisation of assets like transport vehicle and warehousing space is done in an optimal manner. Additionally, value added services like cross docking, consolidation, segregation and sorting among others within the MMLH help in reducing the number of LTL shipments.
Faster Regulatory Clearances: With the customs control and clearances office located within the hub, regulatory approval for EXIM cargo is obtained considerably faster.
Secure Environment:Since MMLHs are gated complexes with round-the-clock security, safety of cargo is ensured.
Access to Ancillary Services: MMLHs provide easy access to ancillary services such as banking, insurance, fuel station, maintenance of vehicles & equipment and recreational facilities among others.
Some of the critical infrastructure and their core functions in an MMLH are:
Rail Sidings: The most critical infrastructure in an MMLH is the rail siding as it supports the arrival and dispatch of trains and loading/ unloading of cargo. Special container handling equipment is used to interchange cargo from rail to road and vice versa.
Container yard: This is the stacking area where the export containers are aggregated prior to dispatch, import containers are stored till customs clearance and empty containers are stored until onward movement.
Container Freight Station (CFS): Activities such as packing/ unpacking, segregation/ aggregation and custom clearance of EXIM cargo are primarily carried out in a CFS. MMLH provides warehousing facilities for both bonded as well as general cargo. While a bonded warehouse serves only to the EXIM traffic, a general warehouse caters to the domestic traffic allowing the shippers to store their shipments on the facility itself.
Secured Gate Complex: A secured gate complex regulates the entry and exit of vehicles carrying cargo and containers through the terminal. It also provides facilities such as documentation, security and container inspection among others.
Multi Modal Logistic Hub
Country Size (Acres)
Major Services
Alliance Texas USA 17,000Air cargo airport, rail access, Foreign Trade Zone (FTZ), inventory tax exemption, dedicated office and retail space
Plataforma Logistica de Zaragoza
Spain 3,200 Air cargo airport, rail access, business park, captive electrical substation
Società Interporto di Torino Italy 740
Rail access, supply chain management, traffic control centres, pre‐production & quality control, office, banks, restaurants, workshop centres
Euro Transport Centre Germany 585
Rail access, customs clearance, duty-free storage, Just-in-time scheduling, cross-docking centre, spare parts logistics centre
GLP Park Beijing Capital Airport China 100
Air cargo terminal, express centre, customs clearance, bonded & non-bonded warehouses
Source: Knight Frank Research
Table: Leading Global Multi Modal Logistic Hubs (MMLHs)
Value Added Services: These include last mile valued added services like cross docking, palletisation, inventory management, wrapping, packaging, kitting, sorting, bar‐coding, labelling and tagging among others.
Supporting Infrastructure and Ancillary Services: Supporting infrastructure and services such as staff housing, weigh bridge, banking, insurance, truck maintenance, recreational facilities and fuel station among others are an integral part of an MMLH.
The above mentioned facilities require a much larger campus and additional investment in infrastructure. Hence, MMLHs are significantly bigger in size as compared to logistic parks and can go upto 4,000 acres. In the European countries such as United Kingdom, Denmark, Germany, Italy and Spain, the size of a multimodal facility ranges from 60‐3, 200 acres with the largest facility being Plataforma Logistica de Zaragoza in Spain. In the Asian countries park size ranges from 200 to 4,000 acres.
However, the United States of America sites are substantially larger in size compared to the European and the Asian ones. The size ranges from 240 to 17,000 acres with Alliance Texas considered as the largest facility in the world.
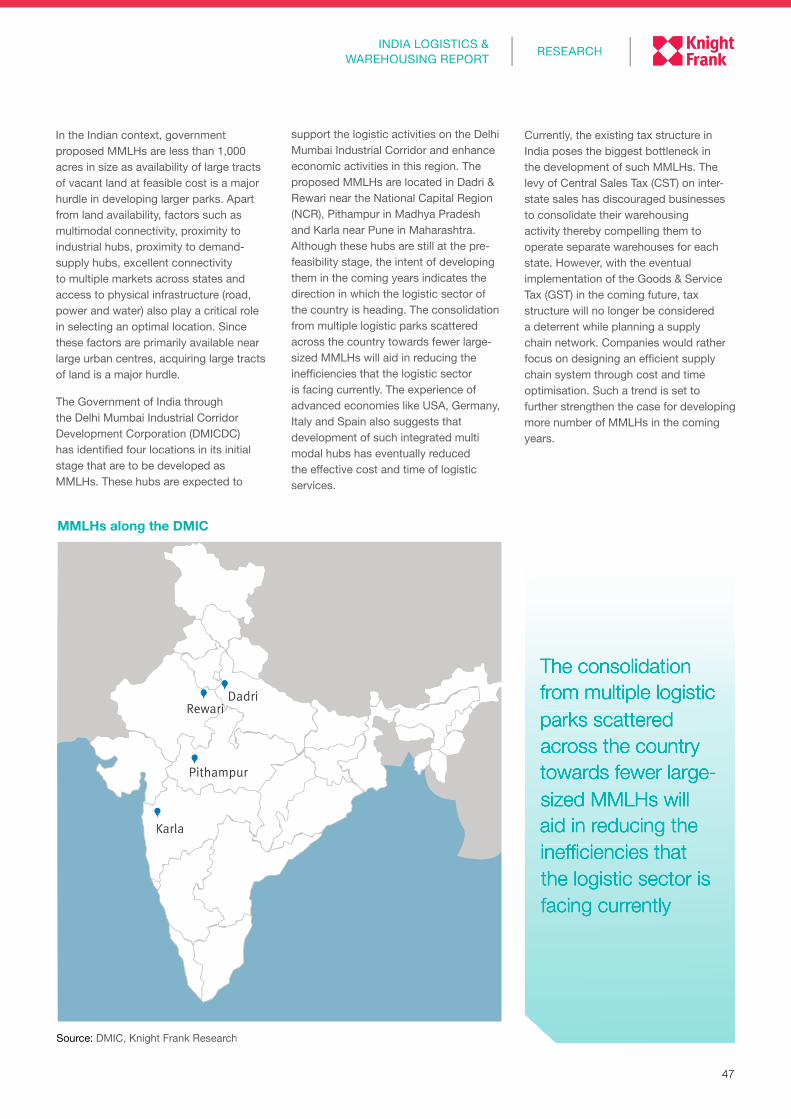
47
RESEARCHINDIA LOGISTICS &
WAREHOUSING REPORT
The consolidation from multiple logistic parks scattered across the country towards fewer large-sized MMLHs will aid in reducing the inefficiencies that the logistic sector is facing currently
In the Indian context, government proposed MMLHs are less than 1,000 acres in size as availability of large tracts of vacant land at feasible cost is a major hurdle in developing larger parks. Apart from land availability, factors such as multimodal connectivity, proximity to industrial hubs, proximity to demand-supply hubs, excellent connectivity to multiple markets across states and access to physical infrastructure (road, power and water) also play a critical role in selecting an optimal location. Since these factors are primarily available near large urban centres, acquiring large tracts of land is a major hurdle.
The Government of India through the Delhi Mumbai Industrial Corridor Development Corporation (DMICDC) has identified four locations in its initial stage that are to be developed as MMLHs. These hubs are expected to
Currently, the existing tax structure in India poses the biggest bottleneck in the development of such MMLHs. The levy of Central Sales Tax (CST) on inter-state sales has discouraged businesses to consolidate their warehousing activity thereby compelling them to operate separate warehouses for each state. However, with the eventual implementation of the Goods & Service Tax (GST) in the coming future, tax structure will no longer be considered a deterrent while planning a supply chain network. Companies would rather focus on designing an efficient supply chain system through cost and time optimisation. Such a trend is set to further strengthen the case for developing more number of MMLHs in the coming years.
Source: DMIC, Knight Frank Research
Karla
DadriRewari
Pithampur
MMLHs along the DMIC
support the logistic activities on the Delhi Mumbai Industrial Corridor and enhance economic activities in this region. The proposed MMLHs are located in Dadri & Rewari near the National Capital Region (NCR), Pithampur in Madhya Pradesh and Karla near Pune in Maharashtra. Although these hubs are still at the pre-feasibility stage, the intent of developing them in the coming years indicates the direction in which the logistic sector of the country is heading. The consolidation from multiple logistic parks scattered across the country towards fewer large-sized MMLHs will aid in reducing the inefficiencies that the logistic sector is facing currently. The experience of advanced economies like USA, Germany, Italy and Spain also suggests that development of such integrated multi modal hubs has eventually reduced the effective cost and time of logistic services.
47
RESEARCHINDIA LOGISTICS &
WAREHOUSING REPORT
The consolidation from multiple logistic parks scattered across the country towards fewer large-sized MMLHs will aid in reducing the inefficiencies that the logistic sector is facing currently
In the Indian context, government proposed MMLHs are less than 1,000 acres in size as availability of large tracts of vacant land at feasible cost is a major hurdle in developing larger parks. Apart from land availability, factors such as multimodal connectivity, proximity to industrial hubs, proximity to demand-supply hubs, excellent connectivity to multiple markets across states and access to physical infrastructure (road, power and water) also play a critical role in selecting an optimal location. Since these factors are primarily available near large urban centres, acquiring large tracts of land is a major hurdle.
The Government of India through the Delhi Mumbai Industrial Corridor Development Corporation (DMICDC) has identified four locations in its initial stage that are to be developed as MMLHs. These hubs are expected to
Currently, the existing tax structure in India poses the biggest bottleneck in the development of such MMLHs. The levy of Central Sales Tax (CST) on inter-state sales has discouraged businesses to consolidate their warehousing activity thereby compelling them to operate separate warehouses for each state. However, with the eventual implementation of the Goods & Service Tax (GST) in the coming future, tax structure will no longer be considered a deterrent while planning a supply chain network. Companies would rather focus on designing an efficient supply chain system through cost and time optimisation. Such a trend is set to further strengthen the case for developing more number of MMLHs in the coming years.
Source: DMIC, Knight Frank Research
Karla
DadriRewariRewariRewariRewari
Pithampur
MMLHs along the DMIC
support the logistic activities on the Delhi Mumbai Industrial Corridor and enhance economic activities in this region. The proposed MMLHs are located in Dadri & Rewari near the National Capital Region (NCR), Pithampur in Madhya Pradesh and Karla near Pune in Maharashtra. Although these hubs are still at the pre-feasibility stage, the intent of developing them in the coming years indicates the direction in which the logistic sector of the country is heading. The consolidation from multiple logistic parks scattered across the country towards fewer large-sized MMLHs will aid in reducing the inefficiencies that the logistic sector is facing currently. The experience of advanced economies like USA, Germany, Italy and Spain also suggests that development of such integrated multi modal hubs has eventually reduced the effective cost and time of logistic services.

48
MUMBAI METROPOLITAN REGION (MMR)MUMBAI METROPOLITAN REGION (MMR)
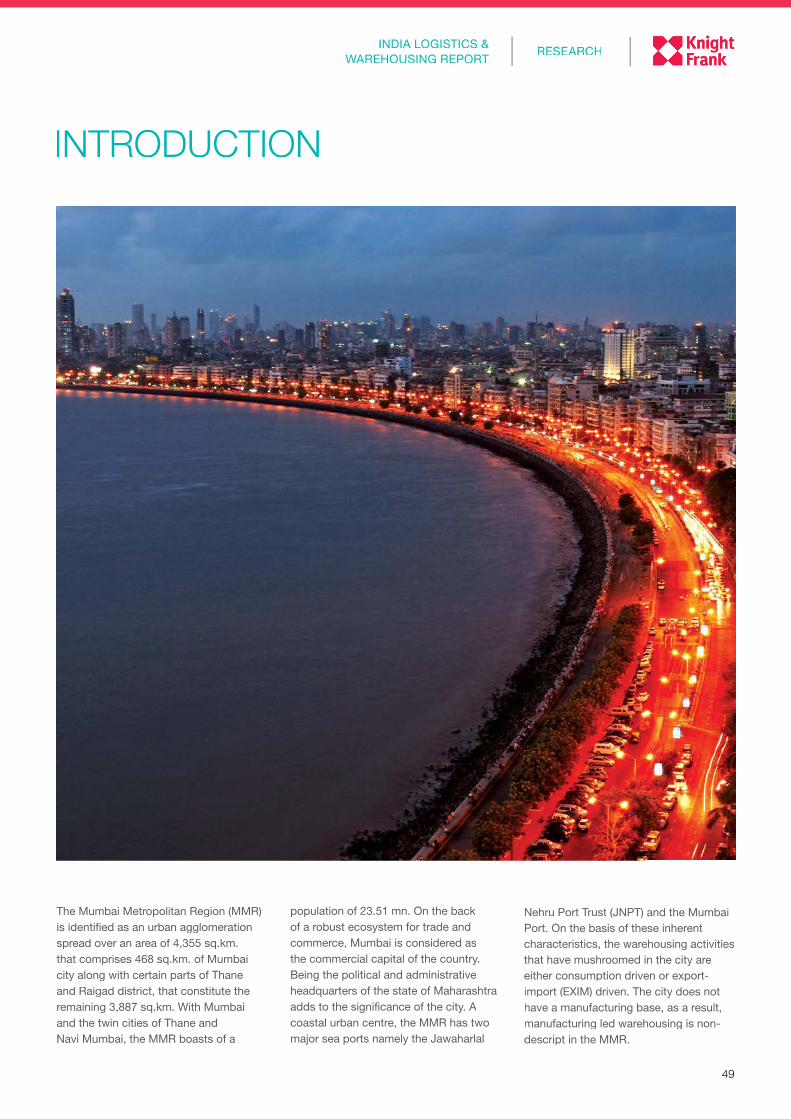
49
RESEARCHINDIA LOGISTICS &
WAREHOUSING REPORT
INTRODUCTION
The Mumbai Metropolitan Region (MMR) is identified as an urban agglomeration spread over an area of 4,355 sq.km. that comprises 468 sq.km. of Mumbai city along with certain parts of Thane and Raigad district, that constitute the remaining 3,887 sq.km. With Mumbai and the twin cities of Thane and Navi Mumbai, the MMR boasts of a
population of 23.51 mn. On the back of a robust ecosystem for trade and commerce, Mumbai is considered as the commercial capital of the country. Being the political and administrative headquarters of the state of Maharashtra adds to the significance of the city. A coastal urban centre, the MMR has two major sea ports namely the Jawaharlal
Nehru Port Trust (JNPT) and the Mumbai Port. On the basis of these inherent characteristics, the warehousing activities that have mushroomed in the city are either consumption driven or export-import (EXIM) driven. The city does not have a manufacturing base, as a result, manufacturing led warehousing is non-descript in the MMR.
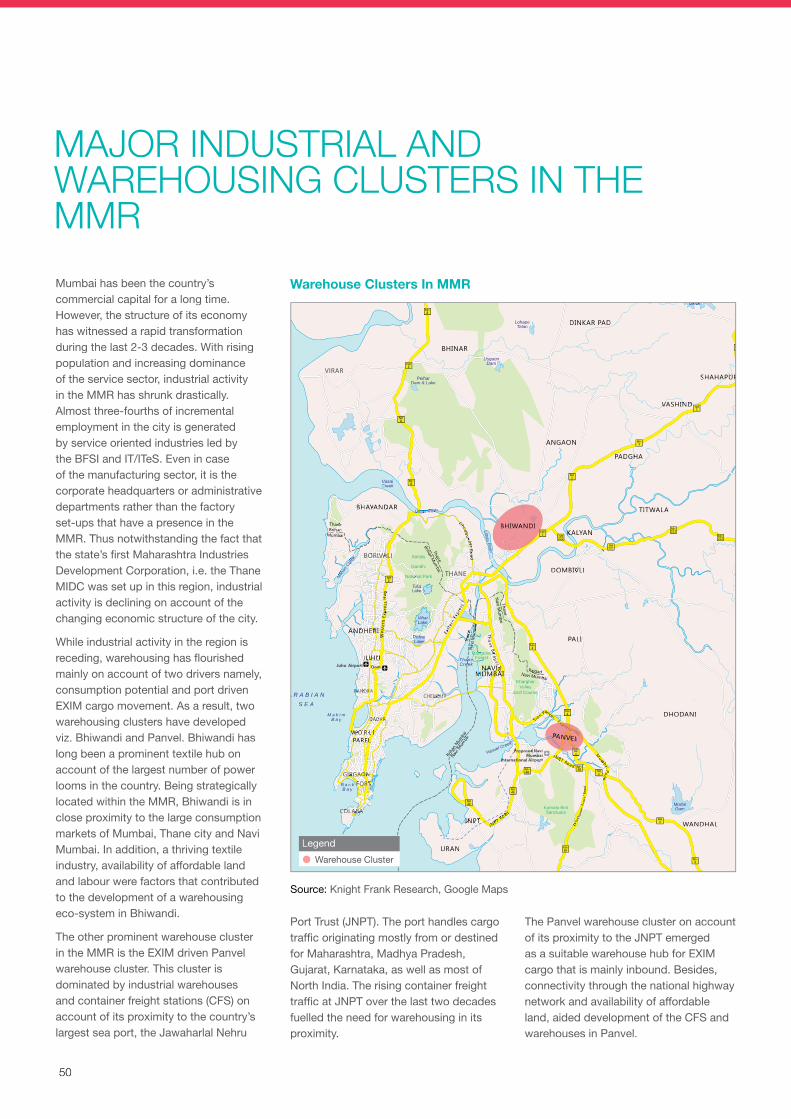
50
Mumbai has been the country’s commercial capital for a long time. However, the structure of its economy has witnessed a rapid transformation during the last 2-3 decades. With rising population and increasing dominance of the service sector, industrial activity in the MMR has shrunk drastically. Almost three-fourths of incremental employment in the city is generated by service oriented industries led by the BFSI and IT/ITeS. Even in case of the manufacturing sector, it is the corporate headquarters or administrative departments rather than the factory set-ups that have a presence in the MMR. Thus notwithstanding the fact that the state’s first Maharashtra Industries Development Corporation, i.e. the Thane MIDC was set up in this region, industrial activity is declining on account of the changing economic structure of the city.
While industrial activity in the region is receding, warehousing has flourished mainly on account of two drivers namely, consumption potential and port driven EXIM cargo movement. As a result, two warehousing clusters have developed viz. Bhiwandi and Panvel. Bhiwandi has long been a prominent textile hub on account of the largest number of power looms in the country. Being strategically located within the MMR, Bhiwandi is in close proximity to the large consumption markets of Mumbai, Thane city and Navi Mumbai. In addition, a thriving textile industry, availability of affordable land and labour were factors that contributed to the development of a warehousing eco-system in Bhiwandi.
The other prominent warehouse cluster in the MMR is the EXIM driven Panvel warehouse cluster. This cluster is dominated by industrial warehouses and container freight stations (CFS) on account of its proximity to the country’s largest sea port, the Jawaharlal Nehru
Port Trust (JNPT). The port handles cargo traffic originating mostly from or destined for Maharashtra, Madhya Pradesh, Gujarat, Karnataka, as well as most of North India. The rising container freight traffic at JNPT over the last two decades fuelled the need for warehousing in its proximity.
The Panvel warehouse cluster on account of its proximity to the JNPT emerged as a suitable warehouse hub for EXIM cargo that is mainly inbound. Besides, connectivity through the national highway network and availability of affordable land, aided development of the CFS and warehouses in Panvel.
Warehouse Clusters In MMR
Source: Knight Frank Research, Google Maps
MAJOR INDUSTRIAL AND WAREHOUSING CLUSTERS IN THE MMR
Juhu Airport
Proposed NaviMumbai
International Airport
Dom.
Briha
n M
umba
i
Navi M
umba
i
ThaneBrihan
Mumbai
Thane
Brihan Mum
bai
RaigadNavi Mumbai
Thane
Navi M
umbai
Than
eN
avi M
umba
i
ViharLake
TulsiLake
Ulhas River
Ulhas R
iver
VasaiCreek
UsgaonDam
PelharDam & Lake
LohapeTalao
PowaiLake
M a h i mB a y
A R A B I A NS E A
B a c kB a y
Man
ori C
reek
Panvel Creek
MorbeDam
BarviLake
Tansa
ThaneCreek
Sanjay
Gandhi
National Park
Karnala BirdSanctuary
MangroveForest
KhargharValley
Golf Course
Ghodbunder R
oad
Th
ane Belapur Rd
Kany
akum
ari P
a nve
l Ro
ad
JNPT Road
JNPT Road
Sion Panvel
East
ern
Expr
ess
Wes
t ern
Exp
res s
Hw
y
Mum
bai Pune
NH8
NH8
NH8
NH8
NH8
NH4
NH3 NH
222
NH222
NH222
NH222
NH3
NH3
NH3
NH3
NH4
4
NH4
NH4
NH66
NH4B
NH4B
NH4B
NH4B
NH4
FORT
JNPT
URAN
W O R L I
DADAR
THANE
CHEMBUR
JUHU
GIRGAON
COLABA
ANDHERI
BHAYANDAR
VIRAR
BHINAR
ANGAON
DINKAR PAD
PADGHA
TITWALA
DHODANI
PALI
WANDHAL
VASHIND
SHAHAPUR
DOMBIVLI
KALYAN
NAVIMUMBAI
BANDRA
PAREL
BORIVALI
BHIWANDI
PANVEL
LegendWarehouse Cluster
50
Mumbai has been the country’s commercial capital for a long time. However, the structure of its economy has witnessed a rapid transformation during the last 2-3 decades. With rising population and increasing dominance of the service sector, industrial activity in the MMR has shrunk drastically. Almost three-fourths of incremental employment in the city is generated by service oriented industries led by the BFSI and IT/ITeS. Even in case of the manufacturing sector, it is the corporate headquarters or administrative departments rather than the factory set-ups that have a presence in the MMR. Thus notwithstanding the fact that the state’s first Maharashtra Industries Development Corporation, i.e. the Thane MIDC was set up in this region, industrial activity is declining on account of the changing economic structure of the city.
While industrial activity in the region is receding, warehousing has flourished mainly on account of two drivers namely, consumption potential and port driven EXIM cargo movement. As a result, two warehousing clusters have developed viz. Bhiwandi and Panvel. Bhiwandi has long been a prominent textile hub on account of the largest number of power looms in the country. Being strategically located within the MMR, Bhiwandi is in close proximity to the large consumption markets of Mumbai, Thane city and Navi Mumbai. In addition, a thriving textile industry, availability of affordable land and labour were factors that contributed to the development of a warehousing eco-system in Bhiwandi.
The other prominent warehouse cluster in the MMR is the EXIM driven Panvel warehouse cluster. This cluster is dominated by industrial warehouses and container freight stations (CFS) on account of its proximity to the country’s largest sea port, the Jawaharlal Nehru
Port Trust (JNPT). The port handles cargo traffic originating mostly from or destined for Maharashtra, Madhya Pradesh, Gujarat, Karnataka, as well as most of North India. The rising container freight traffic at JNPT over the last two decades fuelled the need for warehousing in its proximity.
The Panvel warehouse cluster on account of its proximity to the JNPT emerged as a suitable warehouse hub for EXIM cargo that is mainly inbound. Besides, connectivity through the national highway network and availability of affordable land, aided development of the CFS and warehouses in Panvel.
Warehouse Clusters In MMR
Source: Knight Frank Research, Google Maps
MAJOR INDUSTRIAL AND WAREHOUSING CLUSTERS IN THE MMR
Juhu AirporJuhu AirporJuhu AirporJuhu AirporJuhu AirporJuhu Airporttt
PropPropPropPropProposed Naosed Naosed Naosed Naosed NaviMumbaiMumbaiMumbaiMumbaiMumbaiMumbaiMumbai
International AirporInternational AirporInternational AirporInternational AirporInternational AirporInternational AirporInternational AirporInternational AirporInternational AirporInternational AirporInternational AirporInternational AirporInternational AirporInternational AirporInternational AirporInternational Airport
Dom.Dom.Dom.Dom.Dom.Dom.Dom.Dom.Dom.Dom.Dom.
Briha
n M
umba
i
Navi M
umbaba
i
ThaneThaneThaneThaneThaneThaneBrihanBrihanBrihanBrihanBrihan
MumbMumbMumbMumbMumbai
Thane
Brihan Mum
Brihan Mum
bai
RaigadRaigadRaigadNavi MumbNavi MumbNavi MumbNavi Mumbaiai
ThaneThane
Navi M
umb
Navi M
umbaiai
Than
eTh
ane
Than
eTh
ane
Nav
i Mum
bN
avi M
umb
Nav
i Mum
bN
avi M
umb
Nav
i Mum
baiaiaiaiai
VihaVihaVi rLakeLakeLak
TulsulsulsTulsT iiiLakeeeLakeLak
Ulhas RiveUlhas RiveUlhas RiveUlhas RiveUlhas RiveUlhas RiveUlhas RiveUlhas Riverrrr
Ulhas R
iverU
lhas River
Ulhas R
iverU
lhas River
Ulhas R
iverU
lhas River
VasaiCreek
UsgaonUsgaonUsgaonUsgaonUsgaonUsgaonDamDam
PelharDam & LakeDam & LakeDam & Lak
LohapeTalao
PowaiPowaiPowaiPowaiPowaiPowaiPowaiLakLakLakLakLakeeeeeLakeLakLakeLakLakeLakLakeLakLakeLak
M a h i mB a y
A R A B I A NS E A
B a c kB a y
Man
ori C
ree
Man
ori C
ree
Man
ori C
ree
Man
ori C
reekkkk
Panvel Creek
Panvel Creek
Panvel Creek
Panvel Creek
MorbeDam
TTTansansansTansT aaa
ThaneThaneThaneThaneCreekCreek
Sanjay
Gandhi
National ParNational ParNational Park
Karnala BirdSanctuary
MangrovMangrovMangrovMangrovMangroveeeeForesForesForesForest
KhargharValley
Golf CourseGolf CourseGolf CourseGolf CourseGolf Course
GGGhhhooodddbbbuuunnnddddeeeerrrr
RRRRRoooooaaaddd
Th
aneBeeelappp
ur RRRdddRdR
KKKKaaaaanyyyyy
aaaakkkkkummmmm
aaaaaarrrriii P
aaaaa nnnnnvvvveee
llllRRRRooooo
aaaaaddd
JJJJJJJNPT
NPT NPT NPT NPT NPT RoRoRoRoRoadadadadad
JJJJJJNPT NPT NPT NPT NPT RoRoRoadadad
SSSSSioioion n n PPPPaaaPaPPaPnnnana vvvvvveeellllll
Eaasstt
ern
EEExxppr
eeessssssss
WWWWWWWeeeeeeeeesssssssss
tttttt eeeeeeerrrrrrrnnnnn
EEEEExxxxxppppppppprrrrrr
eeeessssssssssssss
HHHHHHHwwwww
yyyyyyy
MMMuuummm
bbbaaaaiii PPPuuuuunnnnnnneeeee
NH8
NH8
NH8
NH8
NH8
NH4
NH3 NH
222
NH222
NH222
NH222
NH3
NH3
NH3
NH4
NH4
NH4
NH66
NH4B
NH4B
NH4B
NH4B
NH4
FORFORFORFORFORFORFORFORFORFORFORFORFORFORFORFORFORFORFORFORFORTTTTTTTTTTTT
JNPTJNPTJNPTJNPTJNPTJNPTJNPTJNPTJNPTJNPTJNPT
URAN
W O R LW O R LW O R LW O R LW O R LW O R LW O R LW O R LW O R LW O R LW O R LW O R LW O R LW O R LW O R LW O R LW O R LW O R LW O R LW O R LW O R LW O R LW O R LW O R L IIIII
DADADADADADADADADADADADADADADADADADADADADADADARRRRRRRR
THANETHANETHANETHANE
CHEMBUCHEMBUCHEMBUCHEMBUCHEMBUCHEMBUCHEMBUCHEMBUCHEMBUCHEMBURRRRR
JJJJJJJUHUUHUUHUUHUUHUUHUUHUUHUUHUUHUUHUUHUUHUUHUUHUUHUUHUUHUUHUUHUUHUUHUUHUUHUUHU
GIRGAGIRGAGIRGAGIRGAGIRGAGIRGAGIRGAGIRGAGIRGAGIRGAGIRGAGIRGAGIRGAGIRGAGIRGAGIRGAGIRGAGIRGAGIRGAGIRGAGIRGAGIRGAGIRGAGIRGAGIRGAGIRGAGIRGAGIRGAGIRGAGIRGAGIRGAGIRGAGIRGAGIRGAONONONONONONONONONONONONONONONONONONON
CCCCOLABAOLABAOLABAOLABAOLABAOLABAOLABAOLABAOLABAOLABAOLABAOLABAOLABAOLABAOLABA
ANDHERANDHERANDHERANDHERANDHERANDHERANDHERANDHERANDHERANDHERANDHERANDHERANDHERANDHERANDHERANDHERANDHERANDHERANDHERANDHERANDHERANDHERANDHERANDHERANDHERANDHERANDHERANDHERANDHERANDHERANDHERIIIIIIIIII
BHBHBHAYAYAYANANANAYANAYAYANAYAYANAY DADADAR
VIRAR
BHINAR
ANGAANGAANGAON
DINKAR PAD
PADGHAGHA
TITWALA
DHODANI
PALILILI
WANDHAL
VAVASHINSHINDD
SHAHAPURHAHAPUR
DOMBIVLOMBIVLOMBIVLI
KAKAKAKALYANLYANLY
NANANANANAVIVIVIVIVIMMMMMUMBAIUMBAIUMBAIUMBAIUMBAIUMBAIUMBAIUMBAIUMBAIUMBAIUMBAI
d
UMBAI
d
BANDRBANDRBANDRBANDRBANDRBANDRBANDRBANDRBANDRBANDRBANDRBANDRBANDRBANDRA
PAPAPAPAPAPAPAPAPAPAPAPAPAPARERERERERERERERERERERELLLL
BORIVBORIVBORIVBORIVBORIVBORIVBORIVBORIVBORIVBORIVBORIVBORIVBORIVBORIVBORIVBORIVBORIVBORIVBORIVBORIVBORIVBORIVBORIVBORIVBORIVBORIVBORIVALIALIALIALIALIALIALIALIALIALIALIALIALIALIALI
BHIWBHIWBHIWBHIWBHIWBHIWBHIWANDIANDIANDIANDIANDIANDIANDIANDIANDIANDIANDIANDIANDIANDIANDIANDIANDIANDIANDIANDIANDIANDIANDIANDIANDIANDIANDI
PPPPPPPPPPPPPPPPPPPPPPPPPPANVELANVELANVELANVELANVELANVELANVELANVELANVELANVELANVELANVELANVELANVELANVELANVELANVELANVELANVELANVELANVELANVELANVELANVELANVELANVELANVELANVELANVELANVELANVELANVELANVELANVELANVELANVELANVELANVELANVELANVELANVELANVELANVELANVELANVELANVELANVELANVELANVELANVELANVELANVELANVELANVELANVELANVELANVELANVELANVEL
LegendWarehouse Cluster
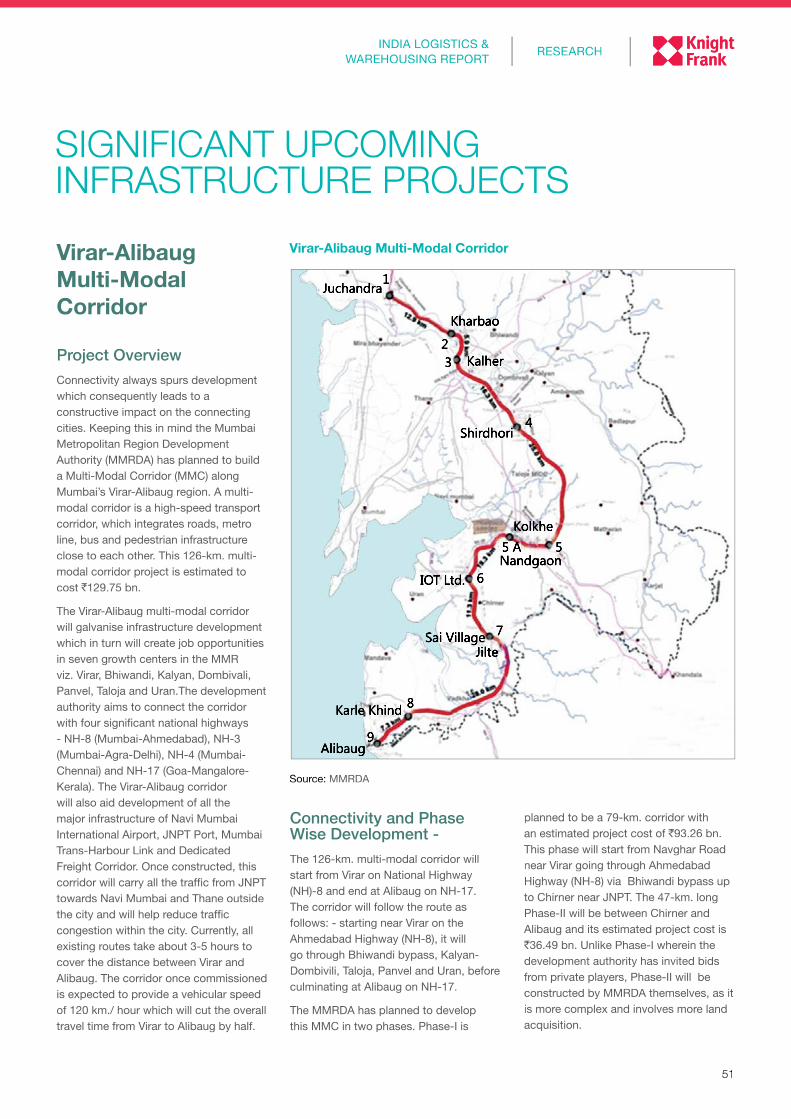
51
RESEARCHINDIA LOGISTICS &
WAREHOUSING REPORT
Virar-Alibaug Multi-Modal CorridorVirar-Alibaug Multi-Modal Corridor
Project OverviewConnectivity always spurs development which consequently leads to a constructive impact on the connecting cities. Keeping this in mind the Mumbai Metropolitan Region Development Authority (MMRDA) has planned to build a Multi-Modal Corridor (MMC) along Mumbai’s Virar-Alibaug region. A multi-modal corridor is a high-speed transport corridor, which integrates roads, metro line, bus and pedestrian infrastructure close to each other. This 126-km. multi-modal corridor project is estimated to cost `129.75 bn.
The Virar-Alibaug multi-modal corridor will galvanise infrastructure development which in turn will create job opportunities in seven growth centers in the MMR viz. Virar, Bhiwandi, Kalyan, Dombivali, Panvel, Taloja and Uran.The development authority aims to connect the corridor with four significant national highways - NH-8 (Mumbai-Ahmedabad), NH-3 (Mumbai-Agra-Delhi), NH-4 (Mumbai-Chennai) and NH-17 (Goa-Mangalore-Kerala). The Virar-Alibaug corridor will also aid development of all the major infrastructure of Navi Mumbai International Airport, JNPT Port, Mumbai Trans-Harbour Link and Dedicated Freight Corridor. Once constructed, this corridor will carry all the traffic from JNPT towards Navi Mumbai and Thane outside the city and will help reduce traffic congestion within the city. Currently, all existing routes take about 3-5 hours to cover the distance between Virar and Alibaug. The corridor once commissioned is expected to provide a vehicular speed of 120 km./ hour which will cut the overall travel time from Virar to Alibaug by half.
SIGNIFICANT UPCOMING INFRASTRUCTURE PROJECTS
Connectivity and Phase Wise Development - The 126-km. multi-modal corridor will start from Virar on National Highway (NH)-8 and end at Alibaug on NH-17. The corridor will follow the route as follows: - starting near Virar on the Ahmedabad Highway (NH-8), it will go through Bhiwandi bypass, Kalyan-Dombivili, Taloja, Panvel and Uran, before culminating at Alibaug on NH-17.
The MMRDA has planned to develop this MMC in two phases. Phase-I is
planned to be a 79-km. corridor with an estimated project cost of `93.26 bn. This phase will start from Navghar Road near Virar going through Ahmedabad Highway (NH-8) via Bhiwandi bypass up to Chirner near JNPT. The 47-km. long Phase-II will be between Chirner and Alibaug and its estimated project cost is `36.49 bn. Unlike Phase-I wherein the development authority has invited bids from private players, Phase-II will be constructed by MMRDA themselves, as it is more complex and involves more land acquisition.
Source: MMRDA
Kharbao
Kolkhe
NandgaonIOT Ltd.
Sai Village
Karle Khind
Alibaug
Jilte
Juchandra
Kalher
1
23
4
5
6
7
8
9
5 A
Shirdhori
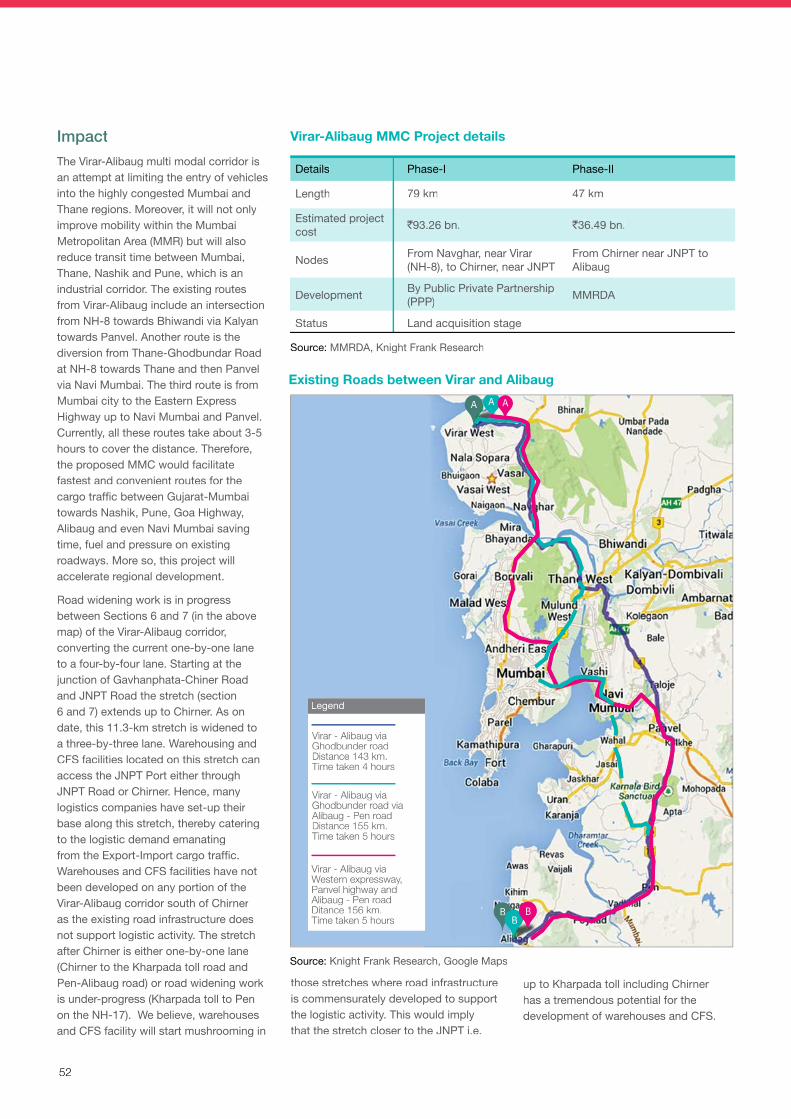
52
ImpactThe Virar-Alibaug multi modal corridor is an attempt at limiting the entry of vehicles into the highly congested Mumbai and Thane regions. Moreover, it will not only improve mobility within the Mumbai Metropolitan Area (MMR) but will also reduce transit time between Mumbai, Thane, Nashik and Pune, which is an industrial corridor. The existing routes from Virar-Alibaug include an intersection from NH-8 towards Bhiwandi via Kalyan towards Panvel. Another route is the diversion from Thane-Ghodbundar Road at NH-8 towards Thane and then Panvel via Navi Mumbai. The third route is from Mumbai city to the Eastern Express Highway up to Navi Mumbai and Panvel. Currently, all these routes take about 3-5 hours to cover the distance. Therefore, the proposed MMC would facilitate fastest and convenient routes for the cargo traffic between Gujarat-Mumbai towards Nashik, Pune, Goa Highway, Alibaug and even Navi Mumbai saving time, fuel and pressure on existing roadways. More so, this project will accelerate regional development.
Road widening work is in progress between Sections 6 and 7 (in the above map) of the Virar-Alibaug corridor, converting the current one-by-one lane to a four-by-four lane. Starting at the junction of Gavhanphata-Chiner Road and JNPT Road the stretch (section 6 and 7) extends up to Chirner. As on date, this 11.3-km stretch is widened to a three-by-three lane. Warehousing and CFS facilities located on this stretch can access the JNPT Port either through JNPT Road or Chirner. Hence, many logistics companies have set-up their base along this stretch, thereby catering to the logistic demand emanating from the Export-Import cargo traffic. Warehouses and CFS facilities have not been developed on any portion of the Virar-Alibaug corridor south of Chirner as the existing road infrastructure does not support logistic activity. The stretch after Chirner is either one-by-one lane (Chirner to the Kharpada toll road and Pen-Alibaug road) or road widening work is under-progress (Kharpada toll to Pen on the NH-17). We believe, warehouses and CFS facility will start mushrooming in
Source: MMRDA, Knight Frank Research
those stretches where road infrastructure is commensurately developed to support the logistic activity. This would imply that the stretch closer to the JNPT i.e.
up to Kharpada toll including Chirner has a tremendous potential for the development of warehouses and CFS.
Virar-Alibaug MMC Project details
Details Phase-I Phase-II
Length 79 km 47 km
Estimated project cost `93.26 bn. `36.49 bn.
Nodes From Navghar, near Virar (NH-8), to Chirner, near JNPT
From Chirner near JNPT to Alibaug
Development By Public Private Partnership (PPP) MMRDA
Status Land acquisition stage
Source: Knight Frank Research, Google Maps
Existing Roads between Virar and Alibaug
A
BB
B
A A
Legend
Virar - Alibaug via Ghodbunder road Distance 143 km. Time taken 4 hours
Virar - Alibaug via Ghodbunder road via Alibaug - Pen road Distance 155 km. Time taken 5 hours
Virar - Alibaug via Western expressway, Panvel highway and Alibaug - Pen road Ditance 156 km. Time taken 5 hours
52
ImpactThe Virar-Alibaug multi modal corridor is an attempt at limiting the entry of vehicles into the highly congested Mumbai and Thane regions. Moreover, it will not only improve mobility within the Mumbai Metropolitan Area (MMR) but will also reduce transit time between Mumbai, Thane, Nashik and Pune, which is an industrial corridor. The existing routes from Virar-Alibaug include an intersection from NH-8 towards Bhiwandi via Kalyan towards Panvel. Another route is the diversion from Thane-Ghodbundar Road at NH-8 towards Thane and then Panvel via Navi Mumbai. The third route is from Mumbai city to the Eastern Express Highway up to Navi Mumbai and Panvel. Currently, all these routes take about 3-5 hours to cover the distance. Therefore, the proposed MMC would facilitate fastest and convenient routes for the cargo traffic between Gujarat-Mumbai towards Nashik, Pune, Goa Highway, Alibaug and even Navi Mumbai saving time, fuel and pressure on existing roadways. More so, this project will accelerate regional development.
Road widening work is in progress between Sections 6 and 7 (in the above map) of the Virar-Alibaug corridor, converting the current one-by-one lane to a four-by-four lane. Starting at the junction of Gavhanphata-Chiner Road and JNPT Road the stretch (section 6 and 7) extends up to Chirner. As on date, this 11.3-km stretch is widened to a three-by-three lane. Warehousing and CFS facilities located on this stretch can access the JNPT Port either through JNPT Road or Chirner. Hence, many logistics companies have set-up their base along this stretch, thereby catering to the logistic demand emanating from the Export-Import cargo traffic. Warehouses and CFS facilities have not been developed on any portion of the Virar-Alibaug corridor south of Chirner as the existing road infrastructure does not support logistic activity. The stretch after Chirner is either one-by-one lane (Chirner to the Kharpada toll road and Pen-Alibaug road) or road widening work is under-progress (Kharpada toll to Pen on the NH-17). We believe, warehouses and CFS facility will start mushrooming in
Source: MMRDA, Knight Frank Research
those stretches where road infrastructure is commensurately developed to support the logistic activity. This would imply that the stretch closer to the JNPT i.e.
up to Kharpada toll including Chirner has a tremendous potential for the development of warehouses and CFS.
Virar-Alibaug MMC Project details
Details Phase-I Phase-II
Length 79 km 47 km
Estimated project cost `93.26 bn. `36.49 bn.
Nodes From Navghar, near Virar (NH-8), to Chirner, near JNPT
From Chirner near JNPT to Alibaug
Development By Public Private Partnership (PPP) MMRDA
Status Land acquisition stage
Source: Knight Frank Research, Google Maps
Existing Roads between Virar and Alibaug
A
BB
B
A A
Legend
Virar - Alibaug via Ghodbunder roadDistance 143 km. Time taken 4 hours
Virar - Alibaug via Ghodbunder road via Alibaug - Pen road Distance 155 km. Time taken 5 hours
Virar - Alibaug via Western expressway, Panvel highway and Alibaug - Pen road Ditance 156 km.Time taken 5 hours
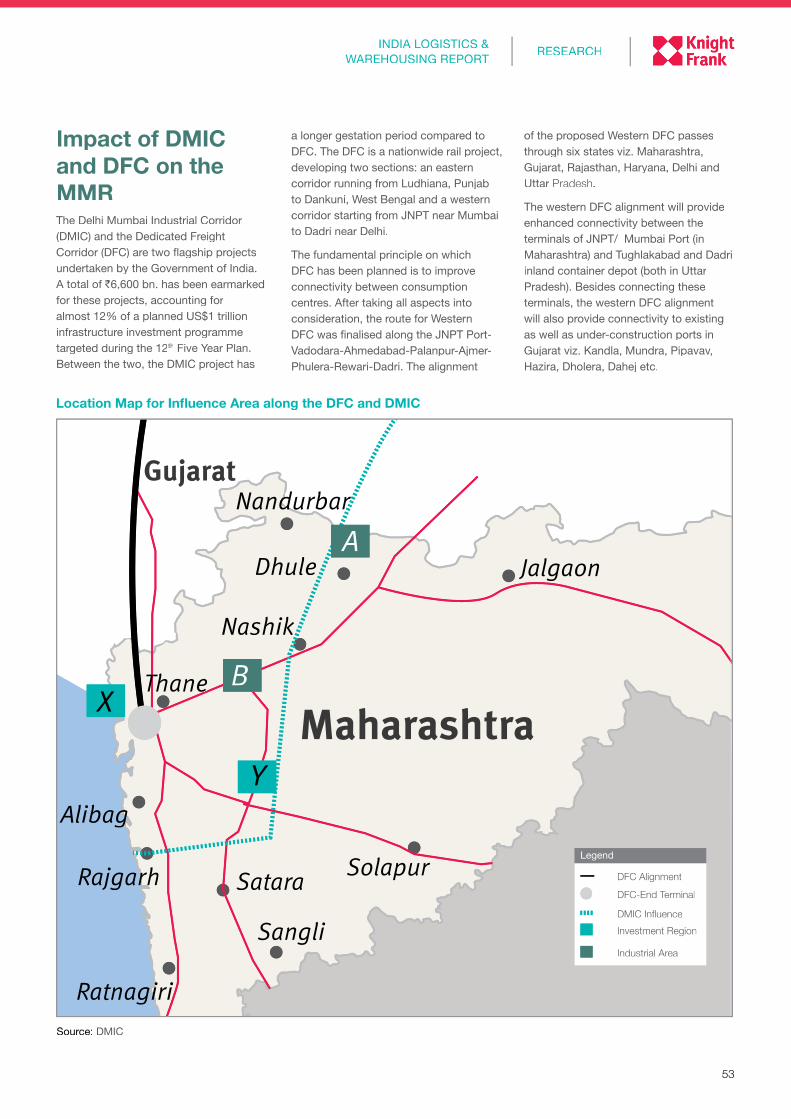
53
RESEARCHINDIA LOGISTICS &
WAREHOUSING REPORT
Source: DMIC
Location Map for Influence Area along the DFC and DMIC
Impact of DMIC and DFC on the MMR The Delhi Mumbai Industrial Corridor (DMIC) and the Dedicated Freight Corridor (DFC) are two flagship projects undertaken by the Government of India. A total of `6,600 bn. has been earmarked for these projects, accounting for almost 12% of a planned US$1 trillion infrastructure investment programme targeted during the 12th Five Year Plan. Between the two, the DMIC project has
a longer gestation period compared to DFC. The DFC is a nationwide rail project, developing two sections: an eastern corridor running from Ludhiana, Punjab to Dankuni, West Bengal and a western corridor starting from JNPT near Mumbai to Dadri near Delhi.
The fundamental principle on which DFC has been planned is to improve connectivity between consumption centres. After taking all aspects into consideration, the route for Western DFC was finalised along the JNPT Port-Vadodara-Ahmedabad-Palanpur-Ajmer-Phulera-Rewari-Dadri. The alignment
Rajgarh
Alibag
Nandurbar
Ratnagiri
Sangli
Solapur
Jalgaon
Satara
Maharashtra
Gujarat
Dhule
Nashik
X
Y
B
A
Thane
of the proposed Western DFC passes through six states viz. Maharashtra, Gujarat, Rajasthan, Haryana, Delhi and Uttar Pradesh.
The western DFC alignment will provide enhanced connectivity between the terminals of JNPT/ Mumbai Port (in Maharashtra) and Tughlakabad and Dadri inland container depot (both in Uttar Pradesh). Besides connecting these terminals, the western DFC alignment will also provide connectivity to existing as well as under-construction ports in Gujarat viz. Kandla, Mundra, Pipavav, Hazira, Dholera, Dahej etc.
Legend
DFC Alignment
DFC-End Terminal
DMIC InfluenceInvestment Region
Industrial Area
53
RESEARCHINDIA LOGISTICS &
WAREHOUSING REPORT
Source: DMIC
Location Map for Influence Area along the DFC and DMIC
Impact of DMIC and DFC on the MMR The Delhi Mumbai Industrial Corridor (DMIC) and the Dedicated Freight Corridor (DFC) are two flagship projects undertaken by the Government of India. A total of `6,600 bn. has been earmarked for these projects, accounting for almost 12% of a planned US$1 trillion infrastructure investment programme targeted during the 12th Five Year Plan. Between the two, the DMIC project has
a longer gestation period compared to DFC. The DFC is a nationwide rail project, developing two sections: an eastern corridor running from Ludhiana, Punjab to Dankuni, West Bengal and a western corridor starting from JNPT near Mumbai to Dadri near Delhi.
The fundamental principle on which DFC has been planned is to improve connectivity between consumption centres. After taking all aspects into consideration, the route for Western DFC was finalised along the JNPT Port-Vadodara-Ahmedabad-Palanpur-Ajmer-Phulera-Rewari-Dadri. The alignment
RajgarhRajgarhRajgarh
AlibagAlibagAlibag
NandurbarNandurbarNandurbar
RatnagiriRatnagiriRatnagiriRatnagiri
Sangli
Solapur
Jalgaon
Satara
Maharashtra
GujaratGujarat
Dhule
Nashik
X
Y
B
A
ThaneThaneThane
of the proposed Western DFC passes through six states viz. Maharashtra, Gujarat, Rajasthan, Haryana, Delhi and Uttar Pradesh.
The western DFC alignment will provide enhanced connectivity between the terminals of JNPT/ Mumbai Port (in Maharashtra) and Tughlakabad and Dadri inland container depot (both in Uttar Pradesh). Besides connecting these terminals, the western DFC alignment will also provide connectivity to existing as well as under-construction ports in Gujarat viz. Kandla, Mundra, Pipavav, Hazira, Dholera, Dahej etc.
Legend
DFC Alignment
DFC-End Terminal
DMIC InfluenceInvestment Region
Industrial Area
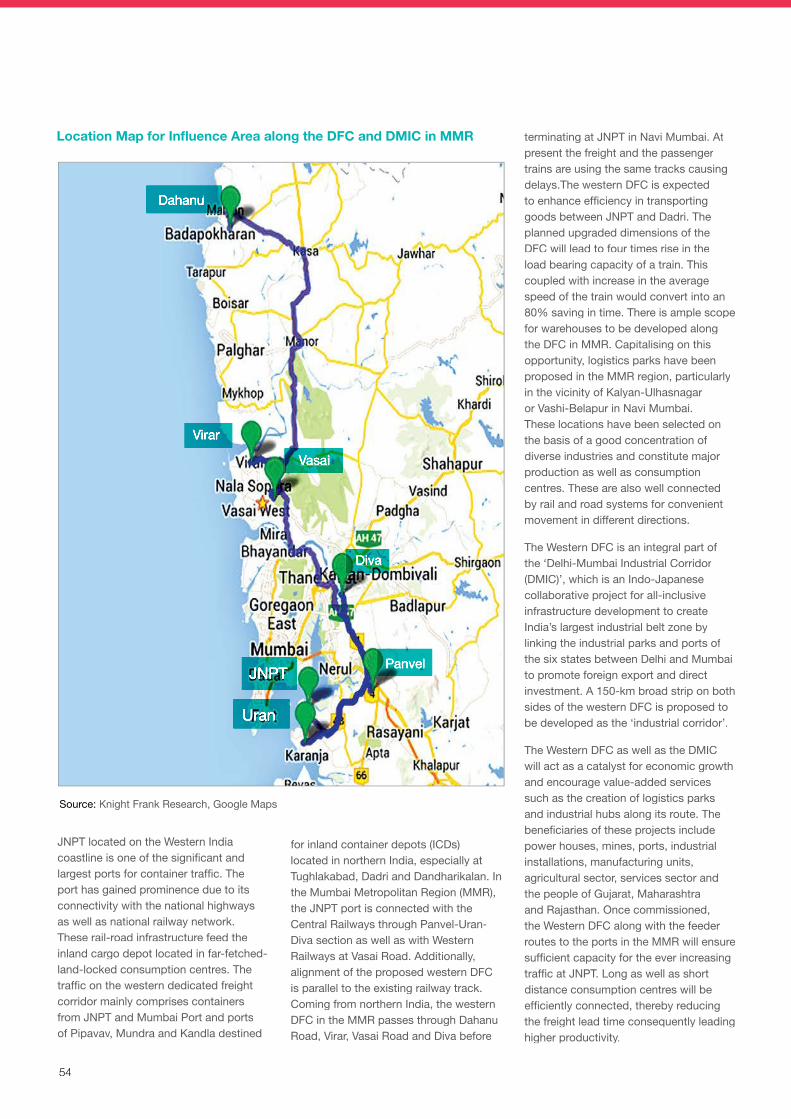
54
Source: Knight Frank Research, Google Maps
Location Map for Influence Area along the DFC and DMIC in MMR
Dahanu
Virar
Diva
PanvelJNPT
Uran
Vasai
JNPT located on the Western India coastline is one of the significant and largest ports for container traffic. The port has gained prominence due to its connectivity with the national highways as well as national railway network. These rail-road infrastructure feed the inland cargo depot located in far-fetched-land-locked consumption centres. The traffic on the western dedicated freight corridor mainly comprises containers from JNPT and Mumbai Port and ports of Pipavav, Mundra and Kandla destined
for inland container depots (ICDs) located in northern India, especially at Tughlakabad, Dadri and Dandharikalan. In the Mumbai Metropolitan Region (MMR), the JNPT port is connected with the Central Railways through Panvel-Uran-Diva section as well as with Western Railways at Vasai Road. Additionally, alignment of the proposed western DFC is parallel to the existing railway track. Coming from northern India, the western DFC in the MMR passes through Dahanu Road, Virar, Vasai Road and Diva before
terminating at JNPT in Navi Mumbai. At present the freight and the passenger trains are using the same tracks causing delays.The western DFC is expected to enhance efficiency in transporting goods between JNPT and Dadri. The planned upgraded dimensions of the DFC will lead to four times rise in the load bearing capacity of a train. This coupled with increase in the average speed of the train would convert into an 80% saving in time. There is ample scope for warehouses to be developed along the DFC in MMR. Capitalising on this opportunity, logistics parks have been proposed in the MMR region, particularly in the vicinity of Kalyan-Ulhasnagar or Vashi-Belapur in Navi Mumbai. These locations have been selected on the basis of a good concentration of diverse industries and constitute major production as well as consumption centres. These are also well connected by rail and road systems for convenient movement in different directions.
The Western DFC is an integral part of the ‘Delhi-Mumbai Industrial Corridor (DMIC)’, which is an Indo-Japanese collaborative project for all-inclusive infrastructure development to create India’s largest industrial belt zone by linking the industrial parks and ports of the six states between Delhi and Mumbai to promote foreign export and direct investment. A 150-km broad strip on both sides of the western DFC is proposed to be developed as the ‘industrial corridor’.
The Western DFC as well as the DMIC will act as a catalyst for economic growth and encourage value-added services such as the creation of logistics parks and industrial hubs along its route. The beneficiaries of these projects include power houses, mines, ports, industrial installations, manufacturing units, agricultural sector, services sector and the people of Gujarat, Maharashtra and Rajasthan. Once commissioned, the Western DFC along with the feeder routes to the ports in the MMR will ensure sufficient capacity for the ever increasing traffic at JNPT. Long as well as short distance consumption centres will be efficiently connected, thereby reducing the freight lead time consequently leading higher productivity.
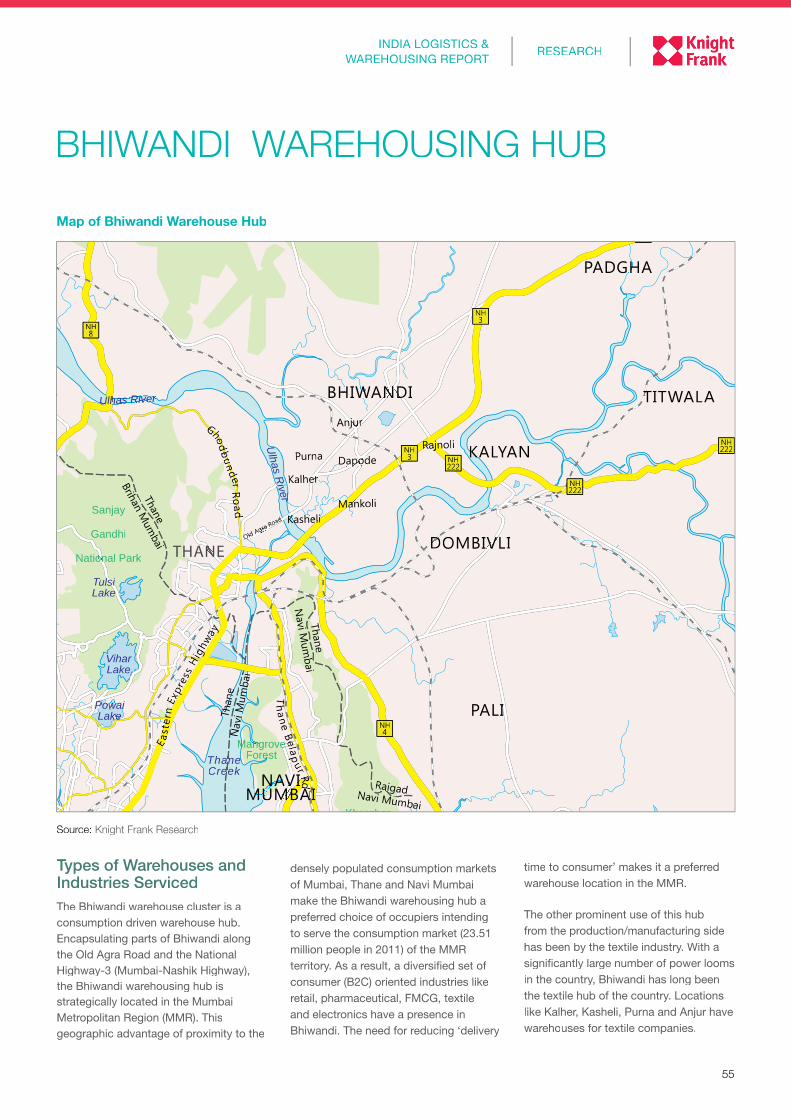
55
RESEARCHINDIA LOGISTICS &
WAREHOUSING REPORT
BHIWANDI WAREHOUSING HUB
Juhu Airport
Proposed NaviMumbai
International Airport
Dom.
Briha
n M
umba
i
Navi M
umba
i
ThaneBrihan
Mumbai
Thane
Brihan Mum
bai
Anjur
Purna
Kalher
KasheliOld Agra Road
Dapode
Mankoli
Rajnoli
RaigadNavi Mumbai
Thane
Navi M
umbai
Than
eN
avi M
umba
i
ViharLake
TulsiLake
Ulhas River
Ulhas R
iver
VasaiCreek
UsgaonDam
PelharDam & Lake
LohapeTalao
PowaiLake
M a h i mB a y
A R A B I A NS E A
B a c kB a y
Man
ori C
reek
Panvel Creek
MorbeDam
BarviLake
Tansa
ThaneCreek
Sanjay
Gandhi
National Park
Karnala BirdSanctuary
MangroveForest
KhargharValley
Golf Course
Ghodbunder R
oad
Th
ane Belapur Rd
Kany
akum
ari P
a nve
l Ro
ad
JNPT Road
JNPT Road
Sion Panvel
E ast
ern
Expr
ess
Hig
hway
Wes
t ern
Exp
res s
Hw
y
Mum
bai Pune
NH8
NH8
NH8
NH8
NH8
NH4
NH3 NH
222
NH222
NH222
NH222
NH3
NH3
NH3
NH3
NH4
NH4
NH4
NH4
NH66
NH4B
NH4B
NH4B
NH4B
NH4
FORT
JNPT
URAN
W O R L I
DADAR
THANE
CHEMBUR
JUHU
GIRGAON
COLABA
ANDHERI
BHAYANDAR
VIRAR
BHINAR
ANGAON
DINKAR PAD
PADGHA
TITWALA
DHODANI
PALI
WANDHAL
VASHIND
SHAHAPUR
DOMBIVLI
KALYAN
NAVIMUMBAI
BANDRA
PAREL
BORIVALI
BHIWANDI
PANVEL
Map of Bhiwandi Warehouse Hub
Source: Knight Frank Research
Types of Warehouses and Industries ServicedThe Bhiwandi warehouse cluster is a consumption driven warehouse hub. Encapsulating parts of Bhiwandi along the Old Agra Road and the National Highway-3 (Mumbai-Nashik Highway), the Bhiwandi warehousing hub is strategically located in the Mumbai Metropolitan Region (MMR). This geographic advantage of proximity to the
densely populated consumption markets of Mumbai, Thane and Navi Mumbai make the Bhiwandi warehousing hub a preferred choice of occupiers intending to serve the consumption market (23.51 million people in 2011) of the MMR territory. As a result, a diversified set of consumer (B2C) oriented industries like retail, pharmaceutical, FMCG, textile and electronics have a presence in Bhiwandi. The need for reducing ‘delivery
time to consumer’ makes it a preferred warehouse location in the MMR.
The other prominent use of this hub from the production/manufacturing side has been by the textile industry. With a significantly large number of power looms in the country, Bhiwandi has long been the textile hub of the country. Locations like Kalher, Kasheli, Purna and Anjur have warehouses for textile companies.
55
RESEARCHINDIA LOGISTICS &
WAREHOUSING REPORT
BHIWANDI WAREHOUSING HUB
Thane
Brihan Mum
Brihan Mum
bai
AnjuAnjuAnjuAnjuAnjurrr
Purna
KalherKalherKalherKalherKalher
KasheliKasheliKasheliKasheliKasheliKasheliKasheliKasheliKasheliKasheliOld Agra
Old Agra
Old Agra
Old Agra
Old Agra
Old Agra
Old Agra
Old Agra RoRoRoadadad
DapodeDapodeDapodeDapodeDapodeDapode
MankMankMankMankoli
RajnolRajnolRajnolRajnolRajnoli
RaigadRaigadRaigadNavi MumNavi MumNavi Mumbabai
ThaneThane
Navi M
umN
avi Mum
babaii
Than
Than
Than
Than
eeeeN
avi M
umb
Nav
i Mum
bN
avi M
umb
Nav
i Mum
bN
avi M
umba
iaiaiaiai
VihaVihaVi rLakeLakeLak
TulsulsulsTulsT iiiLakeeeLakeLak
Ulhas RiveUlhas RiveUlhas RiveUlhas RiveUlhas RiveUlhas RiveUlhas RiveUlhas Riverrrr
Ulhas R
iverU
lhas River
Ulhas R
iverU
lhas River
Ulhas R
iverU
lhas River
PowaiPowaiPowaiPowaiPowaiPowaiPowaiLakLakLakLakLakeeeeeLakeLakLakeLakLakeLakLakeLakLakeLak
ThaneThaneThaneThaneCreekCreek
Sanjay
Gandhi
National ParNational ParNational Park
MangrovMangrovMangrovMangrovMangroveeeeForesForesForesForest
Kharghar
GGGhhhooodddbbbuuunnnddddeeeerrrr
RRRRRoooooaaaddd
Th
aneBeeelappp
ur RRRdddRdR
EE aasst
ern
tern
tern
tern
tern
tern
EExpppr
eress
HHHiggg
hwaaayyyyyy
NH8
NH4
NH3 NH
222
NH222
NH222
NH3
THANETHANETHANETHANE
AR
PADGHAGHA
TITITITWALA
PALILILI
DDDOMBIVLOMBIVLOMBIVLI
KALKALKALKALYAN
NANANANANAVIVIVIVIVIMUMBAIMUMBAIMUMBAIMUMBAIMUMBAIMUMBAIMUMBAIMUMBAIMUMBAIMUMBAIMUMBAIMUMBAIMUMBAI
d
MUMBAI
d
BHIWBHIWBHIWBHIWBHIWBHIWBHIWANDIANDIANDIANDIANDIANDIANDI
Map of Bhiwandi Warehouse Hub
Source: Knight Frank Research
Types of Warehouses and Industries ServicedThe Bhiwandi warehouse cluster is a consumption driven warehouse hub. Encapsulating parts of Bhiwandi along the Old Agra Road and the National Highway-3 (Mumbai-Nashik Highway), the Bhiwandi warehousing hub is strategically located in the Mumbai Metropolitan Region (MMR). This geographic advantage of proximity to the
densely populated consumption markets of Mumbai, Thane and Navi Mumbai make the Bhiwandi warehousing hub a preferred choice of occupiers intending to serve the consumption market (23.51 million people in 2011) of the MMR territory. As a result, a diversified set of consumer (B2C) oriented industries like retail, pharmaceutical, FMCG, textile and electronics have a presence in Bhiwandi. The need for reducing ‘delivery
time to consumer’ makes it a preferred warehouse location in the MMR.
The other prominent use of this hub from the production/manufacturing side has been by the textile industry. With a significantly large number of power looms in the country, Bhiwandi has long been the textile hub of the country. Locations like Kalher, Kasheli, Purna and Anjur have warehouses for textile companies.
56
LocationThe Bhiwandi warehousing cluster is strategically located within the Mumbai Metropolitan Region (MMR). The warehouses are mainly concentrated on the Old Agra Road and the NH-3 (Mumbai-Nasik Highway). Kalher, Kasheli, Purna and Anjur on the Old Agra Road and the Mankoli to Padgha stretch of the NH-3 are the locations where warehouses are concentrated.
On account of Bhiwandi’s strategic location with good connectivity to a large part of the MMR, occupiers intending to serve the MMR consumption market prefer occupying a warehouse here. Bhiwandi is connected with Thane and Mumbai through the Old Agra Road and NH-3. It is connected with Navi Mumbai through NH-4 and the Thane-Belapur Road.
Table: Major Industries Catered to by the Bhiwandi Warehouse Hub
Industry Companies
Textiles Raymond, Peter England, Pepe Jeans
FMCG Pepsi, Henkel, Reckitt Benckiser, HUL
Auto & auto ancillary Goodyear Tyres, Tata Motors
Consumer durables Samsung, Videocon, Phillips, LG, Toshiba, Sansui, Kelvinator, Electrolux, Vijay Sales
Home furnishing Asian Paints, Berger paints, Nippon Paint, Nilkamal
Retail Tesco, Croma, Future Group, Shoppers Stop, Hypercity, Flipkart
Pharmaceutical Cipla, GSK, Novartis, Wyeth
Logistics DHL, Blue Dart, TCI, Fedex, XPS, Gati, Allcargo
Source: Knight Frank Research
Source: Knight Frank Research
Rent and Quality of WarehousesMost warehouses on Old Agra Road (Kalher, Kasheli, Purna) and Dapode Road are old developments with G+1 RCC structures that provide just 12-14 ft. of vertical space for storage. These are primarliy dominated by occupiers from textiles, pharmaceutical and consumer durables. Occupiers from industries like consumer durables and electronics that carry high value fragile cargo and do not require large floor ceiling height prefer these RCC warehouses. Similarly, occupiers with a need for climate control through air coolers, for instance
Table: Road Distance and Transit Time to Important Locations from Bhiwandi Warehouse Hub
Location Approximate distance (km.) Approximate transit time (hours)
Mumbai city (Dadar) 35 1-1.5
Thane city 10 0.5 -1.0
Navi Mumbai (Vashi) 25 1-1.5
JNPT Port 50 1.5 - 2
Mumbai Port 45 1.5 - 2
Mumbai International Airport
30 1-1.5
Pune (Hinjewadi) 150 2.5 - 3.0
Source: Knight Frank Research
Indicator Unit Value
Land rate ` mn./ acre 15 - 40
Land rate `/ sq.mt. 3,700 - 9,900
Rent `/ sq.ft./month
9 - 15
Table: Indicative Land Rate and Rents for Warehouse Developments
pharmaceuticals prefer these structures. The rental here is `9-12/ sq.ft./ month for ground floor and `4-6/ sq.ft./ month for the first floor. The CAM charges are 3-5% of the rent.
Warehouses along the NH-3 can be categorised as modern warehouse complexes with sizes in excess of 1 mn.sq.ft. Mostly, warehouse parks of PEB structures with supporting internal infrastructure can be found along this 20 km. stretch from Mankoli to Padgha Toll Naka. The rent here ranges between `10-15/ sq.ft./ month. The higher side of rent is prevalent in warehouses with quality construction and support infrastructure comprising a sewage treatment plant, adequate internal roads
for truck and trailer movement, fire fighting equipment, parking and security.
The total warehousing space in the Bhiwandi warehousing hub is approximately 60 mn.sq.ft.
56
LocationThe Bhiwandi warehousing cluster is strategically located within the Mumbai Metropolitan Region (MMR). The warehouses are mainly concentrated on the Old Agra Road and the NH-3 (Mumbai-Nasik Highway). Kalher, Kasheli, Purna and Anjur on the Old Agra Road and the Mankoli to Padgha stretch of the NH-3 are the locations where warehouses are concentrated.
On account of Bhiwandi’s strategic location with good connectivity to a large part of the MMR, occupiers intending to serve the MMR consumption market prefer occupying a warehouse here. Bhiwandi is connected with Thane and Mumbai through the Old Agra Road and NH-3. It is connected with Navi Mumbai through NH-4 and the Thane-Belapur Road.
Table: Major Industries Catered to by the Bhiwandi Warehouse Hub
Industry Companies
Textiles Raymond, Peter England, Pepe Jeans
FMCG Pepsi, Henkel, Reckitt Benckiser, HUL
Auto & auto ancillary Goodyear Tyres, Tata Motors
Consumer durables Samsung, Videocon, Phillips, LG, Toshiba, Sansui, Kelvinator, Electrolux, Vijay Sales
Home furnishing Asian Paints, Berger paints, Nippon Paint, Nilkamal
Retail Tesco, Croma, Future Group, Shoppers Stop, Hypercity, Flipkart
Pharmaceutical Cipla, GSK, Novartis, Wyeth
Logistics DHL, Blue Dart, TCI, Fedex, XPS, Gati, Allcargo
Source: Knight Frank Research
Source: Knight Frank Research
Rent and Quality of WarehousesMost warehouses on Old Agra Road (Kalher, Kasheli, Purna) and Dapode Road are old developments with G+1 RCC structures that provide just 12-14 ft. of vertical space for storage. These are primarliy dominated by occupiers from textiles, pharmaceutical and consumer durables. Occupiers from industries like consumer durables and electronics that carry high value fragile cargo and do not require large floor ceiling height prefer these RCC warehouses. Similarly, occupiers with a need for climate control through air coolers, for instance
Table: Road Distance and Transit Time to Important Locations from Bhiwandi Warehouse Hub
Location Approximate distance (km.) Approximate transit time (hours)
Mumbai city (Dadar) 35 1-1.5
Thane city 10 0.5 -1.0
Navi Mumbai (Vashi) 25 1-1.5
JNPT Port 50 1.5 - 2
Mumbai Port 45 1.5 - 2
Mumbai International Airport
30 1-1.5
Pune (Hinjewadi) 150 2.5 - 3.0
Source: Knight Frank Research
Indicator Unit Value
Land rate ` mn./ acre 15 - 40
Land rate `/ sq.mt.`/ sq.mt.` 3,700 - 9,900
Rent `/ sq.ft./`/ sq.ft./`month
9 - 15
Table: Indicative Land Rate and Rents for Warehouse Developments
pharmaceuticals prefer these structures. The rental here is `9-12/ sq.ft./ month for ground floor and `4-6/ sq.ft./ month for the first floor. The CAM charges are 3-5%of the rent.
Warehouses along the NH-3 can be categorised as modern warehouse complexes with sizes in excess of 1 mn.sq.ft. Mostly, warehouse parks of PEB structures with supporting internal infrastructure can be found along this 20 km. stretch from Mankoli to Padgha Toll Naka. The rent here ranges between `10-15/ sq.ft./ month. The higher side of rent is prevalent in warehouses with quality construction and support infrastructure comprising a sewage treatment plant, adequate internal roads
for truck and trailer movement, fire fighting equipment, parking and security.
The total warehousing space in the Bhiwandi warehousing hub is approximately 60 mn.sq.ft.
57
RESEARCHINDIA LOGISTICS &
WAREHOUSING REPORT
Existing Warehousing PlayersBhiwandi has a large number of small unorganised players operating as warehouse developers. Besides, there are also about a dozen large warehouse complexes with leaseable area in excess of 1 mn.sq.ft. Significant warehouse projects are by Indian Logistics Group, Acorn-Milestone, Arham Logiparc, Shree Sai Dhara, Sumeet Logistics and Renaissance Infra. These warehouse complexes have a diversified set of corporates as occupiers. Besides, prominent 3PL operators like DHL, Blue Dart, TCI, Fedex, XPS, Gati and Allcargo have leased space in this hub.
Warehouse Operators
Arham Logiparc
Jai Bhagwan
Renaissance Infra
Indian Logistics Group
Shree Sai Dhara
Sumeet Logistics
Acorn - Milestone
Table: Warehouse Operators
Source: Knight Frank Research
InfrastructureThe Bhiwandi warehousing cluster has come up as an unplanned development with a large number of projects being developed in village areas between the cities of Thane and Bhiwandi. Initially the reason for these warehouse developments was that these locations were outside the Octroi Zone of both, the Thane Municipal Corporation and Bhiwandi Municipal Corporation. Warehouses that have come up in areas like Kalher, Kasheli, Purna, Anjur, Dapode are part of the villages on the Old Agra Road and hence regulated by gram panchayats of the respective village. As a result, the infrastructure development in terms of roads, water, sewerage and power was lagging. However, in recent years there has been an improvement in the quality of main roads like the Old Agra Road and Dapode Road. The Old
Competitive AdvantageThe biggest competitive advantage of the Bhiwandi warehouse hub is its proximity to the densely populated consumption hub of Mumbai, Thane and Navi Mumbai. This advantage makes it a preferred location for consumer oriented (B2C) companies that can serve the MMR consumption market (23.51 million people in 2011) from their warehouse in Bhiwandi.
Warehouse occupiers are very sensitive to rentals and thus warehousing clusters that are in a position to offer affordable space would enjoy a competitive advantage over the others. With warehouse rentals in the range of `9-15/ sq.ft./ month, Bhiwandi fares well. The rentals in Bhiwandi are significantly attractive in comparison to competing warehousing hubs like Panvel, that commands rentals of `18-23/ sq.ft./month. A significant size of the warehouse market, estimated at 60 mn.sq.ft., coupled with a large quantum of vacant space, implies that rentals will continue to remain affordable for a considerable time.
Availability of man power is another factor that lends competitive strength to the Bhiwandi warehouse hub. The MMR is a
Agra Road is a four-lane road and has got a divider recently, that has improved traffic movement on the route. The supply of power, now with a private enterprise Torrent Power, has witnessed a marked improvement in recent years.
The NH-3 (Mumbai-Nashik highway) stretch has witnessed ample development of modern warehouse parks over the last 3-5 years. The 20 km. stretch from Mankoli to Padgha Toll Naka is the most preferred stretch. The NH-3 is a well-built four-lane national highway. Besides, Bhiwandi has connectivity through NH-4 (Mumbai-Pune) and NH-222 (Mumbai-Ahmednagar). Through the 23 km. Chinchoti Anjurphata Road, Bhiwandi is also connected with the NH-8 (Mumbai-Ahmedabad).
JNPT, the country’s largest container port, is at a distance of 50 km. from the Bhiwandi warehouse hub. The Mumbai Port is also 45 km. away.
densely populated urban agglomeration and presence of residential catchments for all income groups in and around Bhiwandi ensures an abundant supply of skilled, semi skilled as well as unskilled workers.
The other advantage of this hub is its proximity to the country’s largest container port Jawaharlal Nehru Port Trust (JNPT) as well as the Mumbai Port. At a distance of barely 50 km. and 45 km. respectively, transit time to the port is only 1.5-2 hours. Such proximity to the port attracts occupiers who import cargo from international production centres and set up a distribution centre in Bhiwandi. The imported container cargo is unloaded in Bhiwandi and then transported across the country.
ChallengesThe Bhiwandi warehouse market has its fair share of challenges that make it probably the most difficult market to comprehend. Being an unplanned warehousing cluster spread across several densely populated villages, the complexities of developing and operating a warehouse have also increased.
The first set of challenges arise on account of the land. Identifying warehouse projects with a clear land title is a big challenge in Bhiwandi. This challenge arises on account of improper land records mainly in the hands of the local gram panchayat. The ideal size of a warehouse development is minimum 30 acres. On account of tiny and scattered land holdings in the hands of several villagers, identifying a contiguous land parcel of the relevant size for warehouse development is an issue.
The other critical issue is that the land use is changing in favour of residential development. With rising population in the MMR, housing has received the top most priority for land development. While warehouse developments in this hub command `1,500-2,500/ sq.ft., residential prices are significantly higher in comparison to warehouse developments. In the neighbouring Thane city the residential projects command `7,000 -10,000/ sq.ft. Residential prices in the adjoining Kalyan hover at `4,000-
57
RESEARCHINDIA LOGISTICS &
WAREHOUSING REPORT
Existing Warehousing PlayersBhiwandi has a large number of small unorganised players operating as warehouse developers. Besides, there are also about a dozen large warehouse complexes with leaseable area in excess of 1 mn.sq.ft. Significant warehouse projects are by Indian Logistics Group, Acorn-Milestone, Arham Logiparc, Shree Sai Dhara, Sumeet Logistics and Renaissance Infra. These warehouse complexes have a diversified set of corporates as occupiers. Besides, prominent 3PL operators like DHL, Blue Dart, TCI, Fedex, XPS, Gati and Allcargo have leased space in this hub.
Warehouse Operators
Arham Logiparc
Jai Bhagwan
Renaissance Infra
Indian Logistics Group
Shree Sai Dhara
Sumeet Logistics
Acorn - Milestone
Table: Warehouse Operators
Source: Knight Frank Research
InfrastructureThe Bhiwandi warehousing cluster has come up as an unplanned development with a large number of projects being developed in village areas between the cities of Thane and Bhiwandi. Initially the reason for these warehouse developments was that these locations were outside the Octroi Zone of both, the Thane Municipal Corporation and Bhiwandi Municipal Corporation. Warehouses that have come up in areas like Kalher, Kasheli, Purna, Anjur, Dapode are part of the villages on the Old Agra Road and hence regulated by gram panchayats of the respective village. As a result, the infrastructure development in terms of roads, water, sewerage and power was lagging. However, in recent years there has been an improvement in the quality of main roads like the Old Agra Road and Dapode Road. The Old
Competitive AdvantageThe biggest competitive advantage of the Bhiwandi warehouse hub is its proximity to the densely populated consumption hub of Mumbai, Thane and Navi Mumbai. This advantage makes it a preferred location for consumer oriented (B2C) companies that can serve the MMR consumption market (23.51 million people in 2011) from their warehouse in Bhiwandi.
Warehouse occupiers are very sensitive to rentals and thus warehousing clusters that are in a position to offer affordable space would enjoy a competitive advantage over the others. With warehouse rentals in the range of `9-15/ sq.ft./ month, Bhiwandi fares well. The rentals in Bhiwandi are significantly attractive in comparison to competing warehousing hubs like Panvel, that commands rentals of `18-23/ sq.ft./month. A significant size of the warehouse market, estimated at 60 mn.sq.ft., coupled with a large quantum of vacant space, implies that rentals will continue to remain affordable for a considerable time.
Availability of man power is another factor that lends competitive strength to the Bhiwandi warehouse hub. The MMR is a
Agra Road is a four-lane road and has got a divider recently, that has improved traffic movement on the route. The supply of power, now with a private enterprise Torrent Power, has witnessed a marked improvement in recent years.
The NH-3 (Mumbai-Nashik highway) stretch has witnessed ample development of modern warehouse parks over the last 3-5 years. The 20 km. stretch from Mankoli to Padgha Toll Naka is the most preferred stretch. The NH-3 is a well-built four-lane national highway. Besides, Bhiwandi has connectivity through NH-4 (Mumbai-Pune) and NH-222 (Mumbai-Ahmednagar). Through the 23 km. Chinchoti Anjurphata Road, Bhiwandi is also connected with the NH-8 (Mumbai-Ahmedabad).
JNPT, the country’s largest container port, is at a distance of 50 km. from the Bhiwandi warehouse hub. The Mumbai Port is also 45 km. away.
densely populated urban agglomeration and presence of residential catchments for all income groups in and around Bhiwandi ensures an abundant supply of skilled, semi skilled as well as unskilled workers.
The other advantage of this hub is its proximity to the country’s largest container port Jawaharlal Nehru Port Trust (JNPT) as well as the Mumbai Port. At a distance of barely 50 km. and 45 km. respectively, transit time to the port is only 1.5-2 hours. Such proximity to the port attracts occupiers who import cargo from international production centres and set up a distribution centre in Bhiwandi. The imported container cargo is unloaded in Bhiwandi and then transported across the country.
ChallengesThe Bhiwandi warehouse market has its fair share of challenges that make it probably the most difficult market to comprehend. Being an unplanned warehousing cluster spread across several densely populated villages, the complexities of developing and operating a warehouse have also increased.
The first set of challenges arise on account of the land. Identifying warehouse projects with a clear land title is a big challenge in Bhiwandi. This challenge arises on account of improper land records mainly in the hands of the local gram panchayat. The ideal size of a warehouse development is minimum 30 acres. On account of tiny and scattered land holdings in the hands of several villagers, identifying a contiguous land parcel of the relevant size for warehouse development is an issue.
The other critical issue is that the land use is changing in favour of residential development. With rising population in the MMR, housing has received the top most priority for land development. While warehouse developments in this hub command `1,500-2,500/ sq.ft., residential prices are significantly higher in comparison to warehouse developments. In the neighbouring Thane city the residential projects command`7,000 -10,000/ sq.ft. Residential prices in the adjoining Kalyan hover at `4,000-
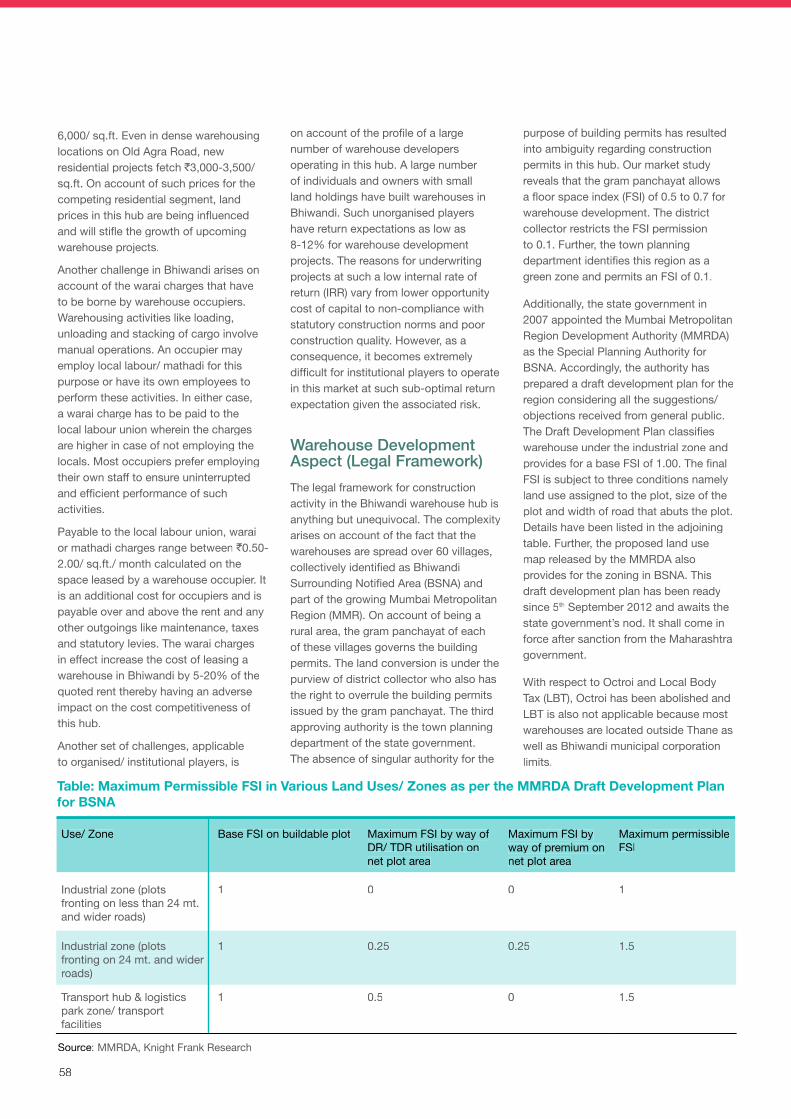
58
Table: Maximum Permissible FSI in Various Land Uses/ Zones as per the MMRDA Draft Development Plan for BSNA
Source: MMRDA, Knight Frank Research
Use/ Zone Base FSI on buildable plot Maximum FSI by way of DR/ TDR utilisation on net plot area
Maximum FSI by way of premium on net plot area
Maximum permissible FSI
Industrial zone (plots fronting on less than 24 mt. and wider roads)
1 0 0 1
Industrial zone (plots fronting on 24 mt. and wider roads)
1 0.25 0.25 1.5
Transport hub & logistics park zone/ transport facilities
1 0.5 0 1.5
purpose of building permits has resulted into ambiguity regarding construction permits in this hub. Our market study reveals that the gram panchayat allows a floor space index (FSI) of 0.5 to 0.7 for warehouse development. The district collector restricts the FSI permission to 0.1. Further, the town planning department identifies this region as a green zone and permits an FSI of 0.1.
Additionally, the state government in 2007 appointed the Mumbai Metropolitan Region Development Authority (MMRDA) as the Special Planning Authority for BSNA. Accordingly, the authority has prepared a draft development plan for the region considering all the suggestions/ objections received from general public. The Draft Development Plan classifies warehouse under the industrial zone and provides for a base FSI of 1.00. The final FSI is subject to three conditions namely land use assigned to the plot, size of the plot and width of road that abuts the plot. Details have been listed in the adjoining table. Further, the proposed land use map released by the MMRDA also provides for the zoning in BSNA. This draft development plan has been ready since 5th September 2012 and awaits the state government’s nod. It shall come in force after sanction from the Maharashtra government.
With respect to Octroi and Local Body Tax (LBT), Octroi has been abolished and LBT is also not applicable because most warehouses are located outside Thane as well as Bhiwandi municipal corporation limits.
6,000/ sq.ft. Even in dense warehousing locations on Old Agra Road, new residential projects fetch `3,000-3,500/ sq.ft. On account of such prices for the competing residential segment, land prices in this hub are being influenced and will stifle the growth of upcoming warehouse projects.
Another challenge in Bhiwandi arises on account of the warai charges that have to be borne by warehouse occupiers. Warehousing activities like loading, unloading and stacking of cargo involve manual operations. An occupier may employ local labour/ mathadi for this purpose or have its own employees to perform these activities. In either case, a warai charge has to be paid to the local labour union wherein the charges are higher in case of not employing the locals. Most occupiers prefer employing their own staff to ensure uninterrupted and efficient performance of such activities.
Payable to the local labour union, warai or mathadi charges range between `0.50- 2.00/ sq.ft./ month calculated on the space leased by a warehouse occupier. It is an additional cost for occupiers and is payable over and above the rent and any other outgoings like maintenance, taxes and statutory levies. The warai charges in effect increase the cost of leasing a warehouse in Bhiwandi by 5-20% of the quoted rent thereby having an adverse impact on the cost competitiveness of this hub.
Another set of challenges, applicable to organised/ institutional players, is
on account of the profile of a large number of warehouse developers operating in this hub. A large number of individuals and owners with small land holdings have built warehouses in Bhiwandi. Such unorganised players have return expectations as low as 8-12% for warehouse development projects. The reasons for underwriting projects at such a low internal rate of return (IRR) vary from lower opportunity cost of capital to non-compliance with statutory construction norms and poor construction quality. However, as a consequence, it becomes extremely difficult for institutional players to operate in this market at such sub-optimal return expectation given the associated risk.
Warehouse Development Aspect (Legal Framework)The legal framework for construction activity in the Bhiwandi warehouse hub is anything but unequivocal. The complexity arises on account of the fact that the warehouses are spread over 60 villages, collectively identified as Bhiwandi Surrounding Notified Area (BSNA) and part of the growing Mumbai Metropolitan Region (MMR). On account of being a rural area, the gram panchayat of each of these villages governs the building permits. The land conversion is under the purview of district collector who also has the right to overrule the building permits issued by the gram panchayat. The third approving authority is the town planning department of the state government. The absence of singular authority for the
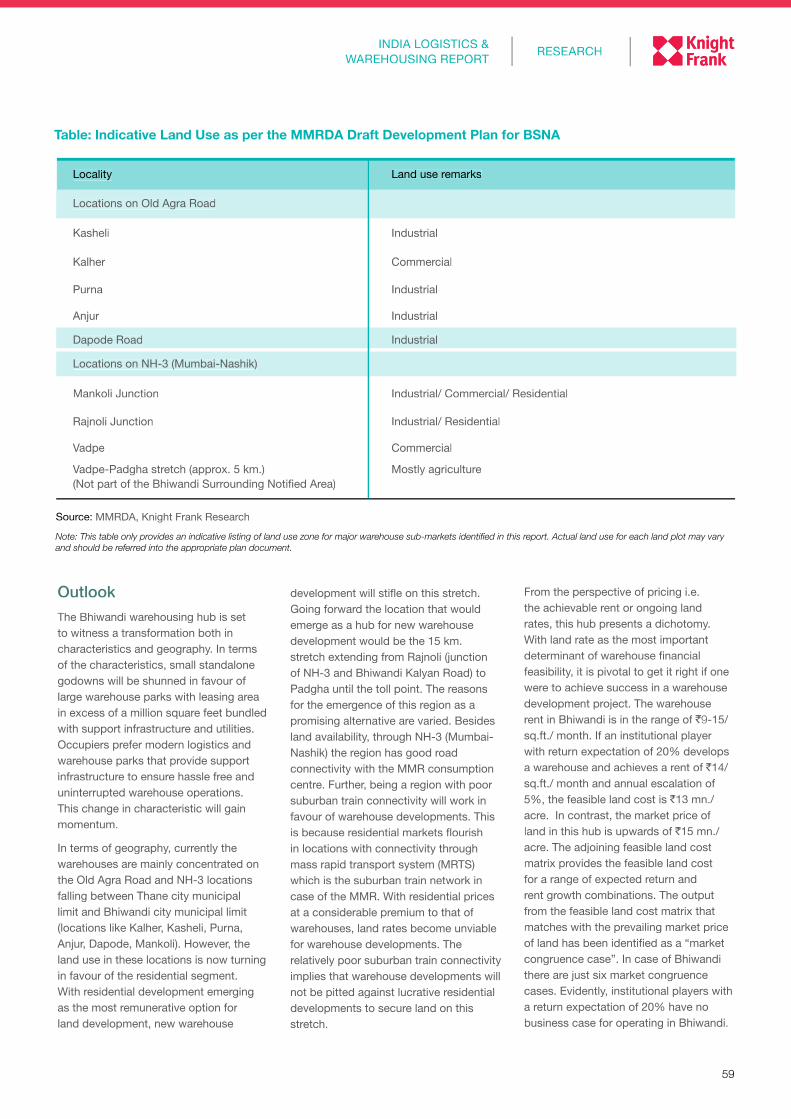
59
RESEARCHINDIA LOGISTICS &
WAREHOUSING REPORT
Table: Indicative Land Use as per the MMRDA Draft Development Plan for BSNA
Source: MMRDA, Knight Frank Research
Note: This table only provides an indicative listing of land use zone for major warehouse sub-markets identified in this report. Actual land use for each land plot may vary and should be referred into the appropriate plan document.
Locality Land use remarks
Locations on Old Agra Road
Kasheli Industrial
Kalher Commercial
Purna Industrial
Anjur Industrial
Dapode Road Industrial
Locations on NH-3 (Mumbai-Nashik)
Mankoli Junction Industrial/ Commercial/ Residential
Rajnoli Junction Industrial/ Residential
Vadpe Commercial
Vadpe-Padgha stretch (approx. 5 km.) (Not part of the Bhiwandi Surrounding Notified Area)
Mostly agriculture
OutlookThe Bhiwandi warehousing hub is set to witness a transformation both in characteristics and geography. In terms of the characteristics, small standalone godowns will be shunned in favour of large warehouse parks with leasing area in excess of a million square feet bundled with support infrastructure and utilities. Occupiers prefer modern logistics and warehouse parks that provide support infrastructure to ensure hassle free and uninterrupted warehouse operations. This change in characteristic will gain momentum.
In terms of geography, currently the warehouses are mainly concentrated on the Old Agra Road and NH-3 locations falling between Thane city municipal limit and Bhiwandi city municipal limit (locations like Kalher, Kasheli, Purna, Anjur, Dapode, Mankoli). However, the land use in these locations is now turning in favour of the residential segment. With residential development emerging as the most remunerative option for land development, new warehouse
development will stifle on this stretch. Going forward the location that would emerge as a hub for new warehouse development would be the 15 km. stretch extending from Rajnoli (junction of NH-3 and Bhiwandi Kalyan Road) to Padgha until the toll point. The reasons for the emergence of this region as a promising alternative are varied. Besides land availability, through NH-3 (Mumbai-Nashik) the region has good road connectivity with the MMR consumption centre. Further, being a region with poor suburban train connectivity will work in favour of warehouse developments. This is because residential markets flourish in locations with connectivity through mass rapid transport system (MRTS) which is the suburban train network in case of the MMR. With residential prices at a considerable premium to that of warehouses, land rates become unviable for warehouse developments. The relatively poor suburban train connectivity implies that warehouse developments will not be pitted against lucrative residential developments to secure land on this stretch.
From the perspective of pricing i.e. the achievable rent or ongoing land rates, this hub presents a dichotomy. With land rate as the most important determinant of warehouse financial feasibility, it is pivotal to get it right if one were to achieve success in a warehouse development project. The warehouse rent in Bhiwandi is in the range of `9-15/ sq.ft./ month. If an institutional player with return expectation of 20% develops a warehouse and achieves a rent of `14/ sq.ft./ month and annual escalation of 5%, the feasible land cost is `13 mn./ acre. In contrast, the market price of land in this hub is upwards of `15 mn./ acre. The adjoining feasible land cost matrix provides the feasible land cost for a range of expected return and rent growth combinations. The output from the feasible land cost matrix that matches with the prevailing market price of land has been identified as a “market congruence case”. In case of Bhiwandi there are just six market congruence cases. Evidently, institutional players with a return expectation of 20% have no business case for operating in Bhiwandi.
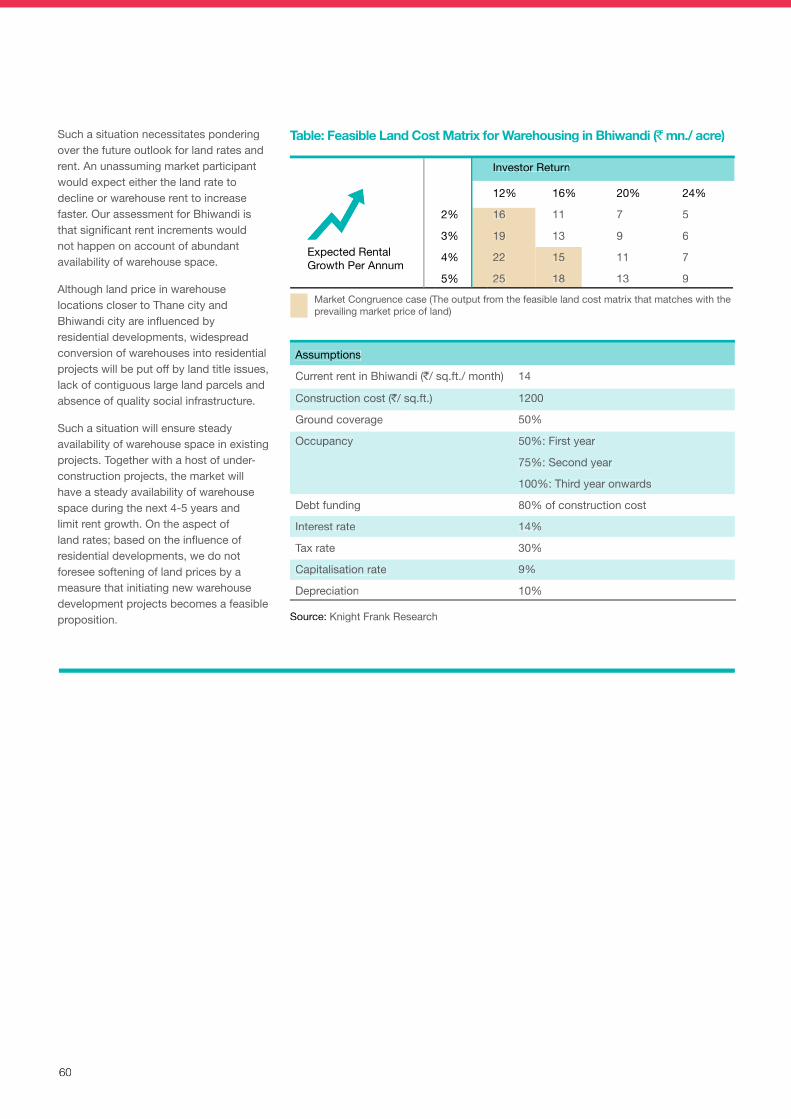
60
Such a situation necessitates pondering over the future outlook for land rates and rent. An unassuming market participant would expect either the land rate to decline or warehouse rent to increase faster. Our assessment for Bhiwandi is that significant rent increments would not happen on account of abundant availability of warehouse space.
Although land price in warehouse locations closer to Thane city and Bhiwandi city are influenced by residential developments, widespread conversion of warehouses into residential projects will be put off by land title issues, lack of contiguous large land parcels and absence of quality social infrastructure.
Such a situation will ensure steady availability of warehouse space in existing projects. Together with a host of under-construction projects, the market will have a steady availability of warehouse space during the next 4-5 years and limit rent growth. On the aspect of land rates; based on the influence of residential developments, we do not foresee softening of land prices by a measure that initiating new warehouse development projects becomes a feasible proposition.
Market Congruence case (The output from the feasible land cost matrix that matches with the prevailing market price of land)
Assumptions
Current rent in Bhiwandi (`/ sq.ft./ month) 14
Construction cost (`/ sq.ft.) 1200
Ground coverage 50%
Occupancy 50%: First year
75%: Second year
100%: Third year onwards
Debt funding 80% of construction cost
Interest rate 14%
Tax rate 30%
Capitalisation rate 9%
Depreciation 10%
Source: Knight Frank Research
Expected Rental Growth Per Annum
Investor Return
12% 16% 20% 24%
2% 16 11 7 5
3% 19 13 9 6
4% 22 15 11 7
5% 25 18 13 9
Table: Feasible Land Cost Matrix for Warehousing in Bhiwandi (` mn./ acre)
60
Such a situation necessitates pondering over the future outlook for land rates and rent. An unassuming market participant would expect either the land rate to decline or warehouse rent to increase faster. Our assessment for Bhiwandi is that significant rent increments would not happen on account of abundant availability of warehouse space.
Although land price in warehouse locations closer to Thane city and Bhiwandi city are influenced by residential developments, widespread conversion of warehouses into residential projects will be put off by land title issues, lack of contiguous large land parcels and absence of quality social infrastructure.
Such a situation will ensure steady availability of warehouse space in existing projects. Together with a host of under-construction projects, the market will have a steady availability of warehouse space during the next 4-5 years and limit rent growth. On the aspect of land rates; based on the influence of residential developments, we do not foresee softening of land prices by a measure that initiating new warehouse development projects becomes a feasible proposition.
Market Congruence case (The output from the feasible land cost matrix that matches with the prevailing market price of land)
Assumptions
Current rent in Bhiwandi (`Current rent in Bhiwandi (`Current rent in Bhiwandi ( / sq.ft./ month)`/ sq.ft./ month)` 14
Construction cost (`Construction cost (`Construction cost ( / sq.ft.)`/ sq.ft.)` 1200
Ground coverage 50%
Occupancy 50%: First year
75%: Second year
100%: Third year onwards
Debt funding 80% of construction cost
Interest rate 14%
Tax rate 30%
Capitalisation rate 9%
Depreciation 10%
Source: Knight Frank Research
Expected Rental Growth Per Annum
Investor Return
12% 16% 20% 24%
2% 16 11 7 5
3% 19 13 9 6
4% 22 15 11 7
5% 25 18 13 9
Table: Feasible Land Cost Matrix for Warehousing in Bhiwandi (`Table: Feasible Land Cost Matrix for Warehousing in Bhiwandi (`Table: Feasible Land Cost Matrix for Warehousing in Bhiwandi ( mn./ acre)` mn./ acre)`
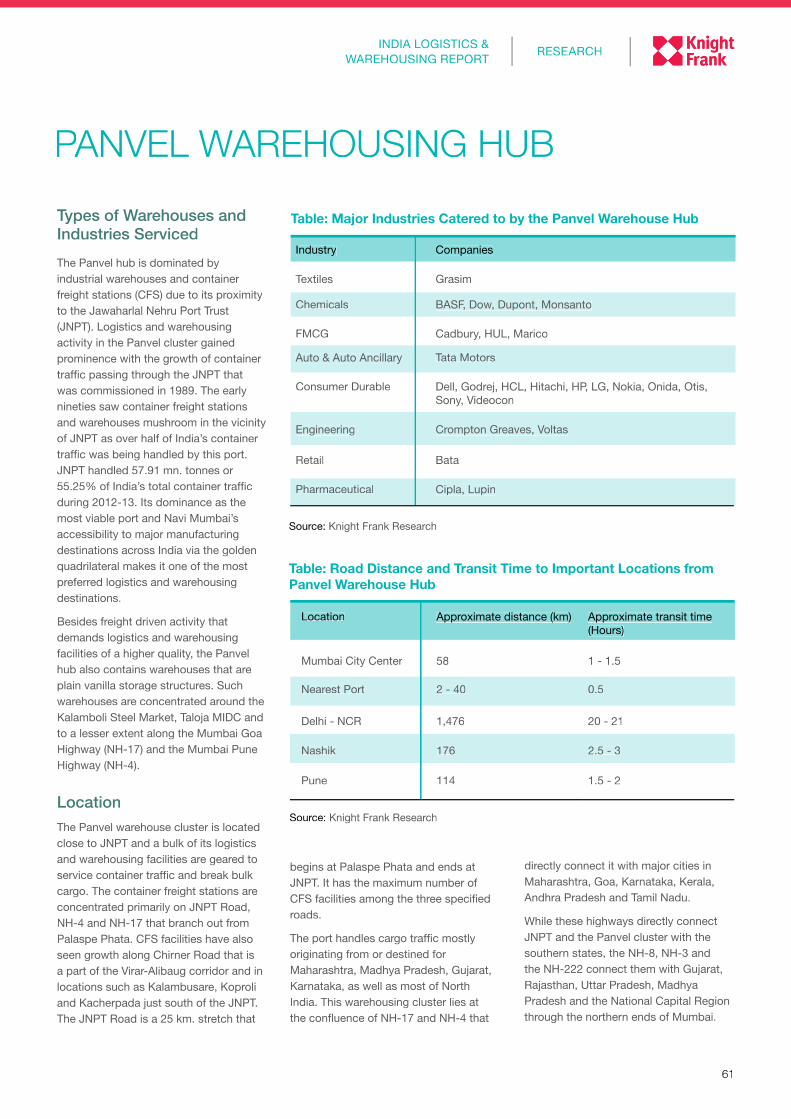
61
RESEARCHINDIA LOGISTICS &
WAREHOUSING REPORT
Source: Knight Frank Research
PANVEL WAREHOUSING HUBTypes of Warehouses and Industries ServicedThe Panvel hub is dominated by industrial warehouses and container freight stations (CFS) due to its proximity to the Jawaharlal Nehru Port Trust (JNPT). Logistics and warehousing activity in the Panvel cluster gained prominence with the growth of container traffic passing through the JNPT that was commissioned in 1989. The early nineties saw container freight stations and warehouses mushroom in the vicinity of JNPT as over half of India’s container traffic was being handled by this port. JNPT handled 57.91 mn. tonnes or 55.25% of India’s total container traffic during 2012-13. Its dominance as the most viable port and Navi Mumbai’s accessibility to major manufacturing destinations across India via the golden quadrilateral makes it one of the most preferred logistics and warehousing destinations.
Besides freight driven activity that demands logistics and warehousing facilities of a higher quality, the Panvel hub also contains warehouses that are plain vanilla storage structures. Such warehouses are concentrated around the Kalamboli Steel Market, Taloja MIDC and to a lesser extent along the Mumbai Goa Highway (NH-17) and the Mumbai Pune Highway (NH-4).
LocationThe Panvel warehouse cluster is located close to JNPT and a bulk of its logistics and warehousing facilities are geared to service container traffic and break bulk cargo. The container freight stations are concentrated primarily on JNPT Road, NH-4 and NH-17 that branch out from Palaspe Phata. CFS facilities have also seen growth along Chirner Road that is a part of the Virar-Alibaug corridor and in locations such as Kalambusare, Koproli and Kacherpada just south of the JNPT. The JNPT Road is a 25 km. stretch that
begins at Palaspe Phata and ends at JNPT. It has the maximum number of CFS facilities among the three specified roads.
The port handles cargo traffic mostly originating from or destined for Maharashtra, Madhya Pradesh, Gujarat, Karnataka, as well as most of North India. This warehousing cluster lies at the confluence of NH-17 and NH-4 that
Table: Major Industries Catered to by the Panvel Warehouse Hub
Industry Companies
Textiles Grasim
Chemicals BASF, Dow, Dupont, Monsanto
FMCG Cadbury, HUL, Marico
Auto & Auto Ancillary Tata Motors
Consumer Durable Dell, Godrej, HCL, Hitachi, HP, LG, Nokia, Onida, Otis, Sony, Videocon
Engineering Crompton Greaves, Voltas
Retail Bata
Pharmaceutical Cipla, Lupin
directly connect it with major cities in Maharashtra, Goa, Karnataka, Kerala, Andhra Pradesh and Tamil Nadu.
While these highways directly connect JNPT and the Panvel cluster with the southern states, the NH-8, NH-3 and the NH-222 connect them with Gujarat, Rajasthan, Uttar Pradesh, Madhya Pradesh and the National Capital Region through the northern ends of Mumbai.
Location Approximate distance (km) Approximate transit time (Hours)
Mumbai City Center 58 1 - 1.5
Nearest Port 2 - 40 0.5
Delhi - NCR 1,476 20 - 21
Nashik 176 2.5 - 3
Pune 114 1.5 - 2
Table: Road Distance and Transit Time to Important Locations from Panvel Warehouse Hub
Source: Knight Frank Research
61
RESEARCHINDIA LOGISTICS &
WAREHOUSING REPORT
Source: Knight Frank Research
PANVEL WAREHOUSING HUBPANVEL WAREHOUSING HUBPTypes of Warehouses and Industries ServicedThe Panvel hub is dominated by industrial warehouses and container freight stations (CFS) due to its proximity to the Jawaharlal Nehru Port Trust (JNPT). Logistics and warehousing activity in the Panvel cluster gained prominence with the growth of container traffic passing through the JNPT that was commissioned in 1989. The early nineties saw container freight stations and warehouses mushroom in the vicinity of JNPT as over half of India’s container traffic was being handled by this port. JNPT handled 57.91 mn. tonnes or 55.25% of India’s total container traffic during 2012-13. Its dominance as the most viable port and Navi Mumbai’s accessibility to major manufacturing destinations across India via the golden quadrilateral makes it one of the most preferred logistics and warehousing destinations.
Besides freight driven activity that demands logistics and warehousing facilities of a higher quality, the Panvel hub also contains warehouses that are plain vanilla storage structures. Such warehouses are concentrated around the Kalamboli Steel Market, Taloja MIDC and to a lesser extent along the Mumbai Goa Highway (NH-17) and the Mumbai Pune Highway (NH-4).
LocationThe Panvel warehouse cluster is located close to JNPT and a bulk of its logistics and warehousing facilities are geared to service container traffic and break bulk cargo. The container freight stations are concentrated primarily on JNPT Road, NH-4 and NH-17 that branch out from Palaspe Phata. CFS facilities have also seen growth along Chirner Road that is a part of the Virar-Alibaug corridor and in locations such as Kalambusare, Koproli and Kacherpada just south of the JNPT. The JNPT Road is a 25 km. stretch that
begins at Palaspe Phata and ends at JNPT. It has the maximum number of CFS facilities among the three specified roads.
The port handles cargo traffic mostly originating from or destined for Maharashtra, Madhya Pradesh, Gujarat, Karnataka, as well as most of North India. This warehousing cluster lies at the confluence of NH-17 and NH-4 that
Table: Major Industries Catered to by the Panvel Warehouse Hub
Industry Companies
Textiles Grasim
Chemicals BASF, Dow, Dupont, Monsanto
FMCG Cadbury, HUL, Marico
Auto & Auto Ancillary Tata Motors
Consumer Durable Dell, Godrej, HCL, Hitachi, HP, LG, Nokia, Onida, Otis, Sony, Videocon
Engineering Crompton Greaves, Voltas
Retail Bata
Pharmaceutical Cipla, Lupin
directly connect it with major cities in Maharashtra, Goa, Karnataka, Kerala, Andhra Pradesh and Tamil Nadu.
While these highways directly connect JNPT and the Panvel cluster with the southern states, the NH-8, NH-3 and the NH-222 connect them with Gujarat, Rajasthan, Uttar Pradesh, Madhya Pradesh and the National Capital Region through the northern ends of Mumbai.
Location Approximate distance (km) Approximate transit time (Hours)
Mumbai City Center 58 1 - 1.5
Nearest Port 2 - 40 0.5
Delhi - NCR 1,476 20 - 21
Nashik 176 2.5 - 3
Pune 114 1.5 - 2
Table: Road Distance and Transit Time to Important Locations from Panvel Warehouse Hub
Source: Knight Frank Research
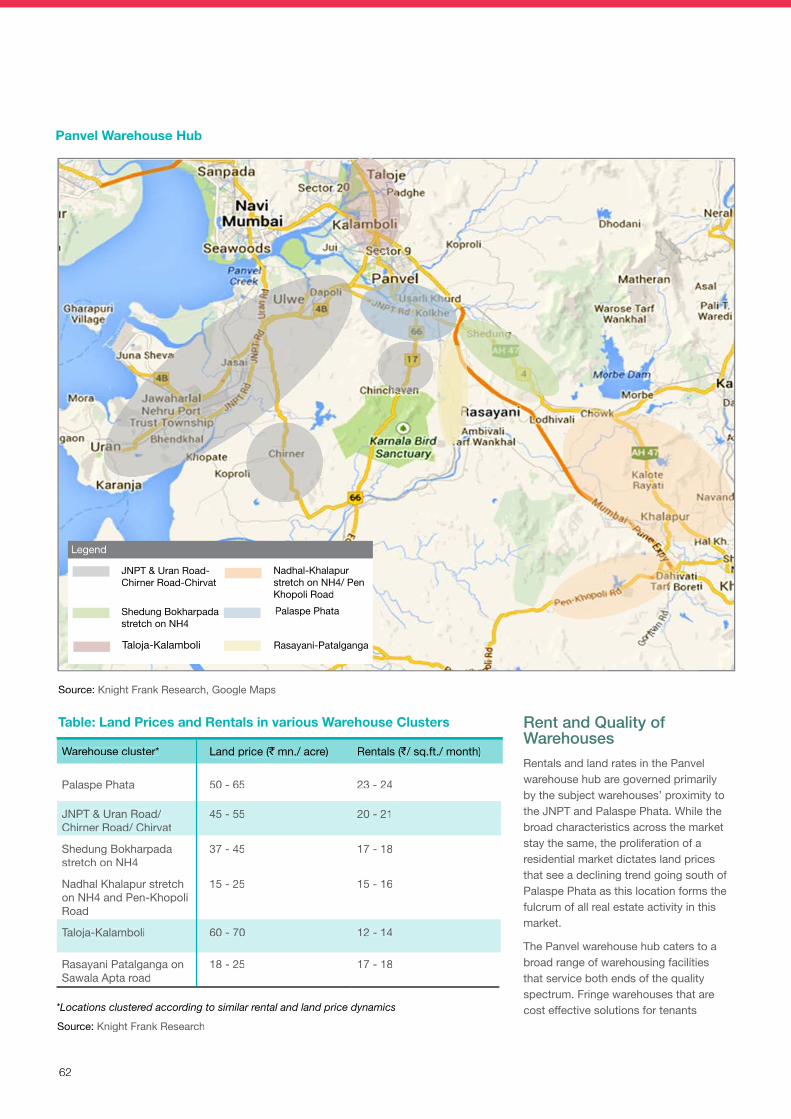
62
Warehouse cluster* Land price (` mn./ acre) Rentals (`/ sq.ft./ month)
Palaspe Phata 50 - 65 23 - 24
JNPT & Uran Road/ Chirner Road/ Chirvat
45 - 55 20 - 21
Shedung Bokharpada stretch on NH4
37 - 45 17 - 18
Nadhal Khalapur stretch on NH4 and Pen-Khopoli Road
15 - 25 15 - 16
Taloja-Kalamboli 60 - 70 12 - 14
Rasayani Patalganga on Sawala Apta road
18 - 25 17 - 18
*Locations clustered according to similar rental and land price dynamics
Source: Knight Frank Research
Source: Knight Frank Research, Google Maps
Rent and Quality of WarehousesRentals and land rates in the Panvel warehouse hub are governed primarily by the subject warehouses’ proximity to the JNPT and Palaspe Phata. While the broad characteristics across the market stay the same, the proliferation of a residential market dictates land prices that see a declining trend going south of Palaspe Phata as this location forms the fulcrum of all real estate activity in this market.
The Panvel warehouse hub caters to a broad range of warehousing facilities that service both ends of the quality spectrum. Fringe warehouses that are cost effective solutions for tenants
Panvel Warehouse Hub
Table: Land Prices and Rentals in various Warehouse Clusters
Legend
JNPT & Uran Road- Chirner Road-Chirvat
Palaspe Phata
Taloja-Kalamboli
Shedung Bokharpada stretch on NH4
Rasayani-Patalganga
Nadhal-Khalapur stretch on NH4/ Pen Khopoli Road
62
Warehouse cluster* Land price (`Land price (`Land price ( mn./ acre) Rentals (`Rentals (`Rentals ( / sq.ft./ month)`/ sq.ft./ month)`
Palaspe Phata 50 - 65 23 - 24
JNPT & Uran Road/ Chirner Road/ Chirvat
45 - 55 20 - 21
Shedung Bokharpada stretch on NH4
37 - 45 17 - 18
Nadhal Khalapur stretch on NH4 and Pen-Khopoli Road
15 - 25 15 - 16
Taloja-Kalamboli 60 - 70 12 - 14
Rasayani Patalganga on Sawala Apta road
18 - 25 17 - 18
*Locations clustered according to similar rental and land price dynamics
Source: Knight Frank Research
Source: Knight Frank Research, Google Maps
Rent and Quality ofWarehousesRentals and land rates in the Panvel warehouse hub are governed primarily by the subject warehouses’ proximity to the JNPT and Palaspe Phata. While the broad characteristics across the market stay the same, the proliferation of a residential market dictates land prices that see a declining trend going south of Palaspe Phata as this location forms the fulcrum of all real estate activity in this market.
The Panvel warehouse hub caters to a broad range of warehousing facilities that service both ends of the quality spectrum. Fringe warehouses that are cost effective solutions for tenants
Panvel Warehouse Hub
Table: Land Prices and Rentals in various Warehouse Clusters
Legend
JNPT & Uran Road-Chirner Road-Chirvat
Palaspe Phata
Taloja-Kalamboli
Shedung Bokharpada stretch on NH4
Rasayani-Patalganga
Nadhal-Khalapur stretch on NH4/ Pen Khopoli Road
63
RESEARCHINDIA LOGISTICS &
WAREHOUSING REPORT
are mostly located in Kalamboli and to a lesser extent in Taloja in the Taloja-Kalamboli cluster. These are characterised by G+1 RCC or PEB structures that might not have basic facilities like serviceable approach roads or security. Consequently these are used to house low value products for the pharmaceuticals, consumer durables, metals and textile industry. Rents in these warehouses range between `12-15/ sq.ft.
The highest priced warehouse products on offer in the Panvel cluster are located in the areas within a 5 km. radius of Palaspe Phata and locations on the JNPT, Uran and Chirner roads closer to the port. These are typically warehousing parks offering integrated logistics solutions that could include pick-up, packaging and delivery facilities. State-of-the-art construction quality with PEB structures having high ceilings (30-35 ft.), climate control, sewage treatment plants, adequate security and internal roads characterise these facilities and command a rental rate of `20-24/ sq.ft.
There is a mid-range of warehouse facilities available in the range of `16-18/ sq.ft. that offer good infrastructure but cannot command higher rentals due to their distance from the port. These are located on the NH-4 and their rentals progressively reduce from `18/ sq.ft.to `16/ sq.ft.as one moves further south on the highway. Warehouses priced at `18/ sq.ft.can be found on the NH4 starting approximately 6 kms away from Palaspe Phata at Shedung till Bhokarpada and on the Sawala Apta Road that branches out from the NH-4 toward Rasayani. Rates drop to `16/ sq.ft.beyond Bhokrpada till Khalapur that is almost 40 km. away and on the Pen-Khopoli Road.
Warehousing facilities on the NH-17 are priced relatively higher than those on the NH-4 due to their proximity to the JNPT, the dearth of warehousing products on offer and the relative scarcity of land on this stretch of the highway. Any development can only take place on the NH-17 on a 7 km. stretch starting from Palaspe Phata due to the presence of the Karnala Bird Sanctuary beyond that boundary. Warehouse facilities are thus priced higher at `20/ sq.ft.on the 4
km. stretch starting from Chirvat till the boundary of the Karnala Bird Sanctuary.
Overall, the total warehousing space in the Panvel warehouse hub is approximately 15 mn.sq.ft.
Table: Indicative Land Rate and Rents for Warehouse Developments
Existing Warehousing Players
Indicator Unit Value
Land rate ` mn./ acre 15 - 70
Land rate `/ sq.mt. 3,700 -17,300
Rent `/ sq.ft./month
12 - 24
Source: Knight Frank Research
Source: Knight Frank Research
Existing Warehousing Players
CCI Logistics Park
JWC Logistics
Paras Group
Singh & Chedda Logistics
Jyoti Logistics
Sumeet Logistics
InfrastructureThe Panvel warehousing hub is very well served by the national highways around which logistics and warehousing activity has evolved. Internal roads however do not meet the same quality, especially off the JNPT and Uran Road. These roads are in a poor condition and difficult to negotiate even by trucks in some cases. A significant number of internal roads are just two-lanes sans dividers, barely enough to let two trucks cross each other. This causes frequent traffic jams, delays and increases vehicle maintenance cost.
There is adequate power supply in this warehouse hub that has improved in recent years as the Maharashtra State Electricity Distribution Company (MSEDC)
now sources enough power to fulfil the needs of industries and warehouses in the Panvel hub. Water supply and sewerage are also significantly better compared to the Bhiwandi hub as ground water is extensively used.
The City and Industrial Corporation (CIDCO) of Maharashtra has been named the Special Planning Authority for the Navi Mumbai Airport Influence Notified Area (NAINA) in January, 2013. Earlier, CIDCO’s reach was limited till Palaspa leaving vast stretches on the NH-4 and NH-17 that form a large part of the market, out of its reach. This move has ensured that infrastructure initiatives, especially the development of roads in this market, will receive a huge boost in the times to come. CIDCO has recently undertaken work on the Dronagiri Coastal Road that will link the JNPT and Dronagiri area to the Pune and Goa highways facilitating fast movement of containers from JNPT directly to the highways.
Competitive AdvantageThe single largest advantage that supports the Panvel warehouse hub’s survival and growth is its proximity to the JNPT. The fact that more than half of india’s container traffic is routed through this port virtually cements its position as the one of the strongest warehousing hubs in India as nearly all containerised exim cargo requires CFS or warehouse facilities. This also enables it to command significantly higher rental and occupancy levels than Mumbai’s only other major warehouse cluster of Bhiwandi. Efficient access to most container traffic destinations via the national highway network (NH-17, NH-4, NH-3, NH-222, NH-8) is also a critical factor aiding this market’s growth.
A large portion of the Panvel warehousing hub has always been under the jurisdiction of CIDCO and has aided in building sustainable infrastructure in terms of roads, power and water availability. The fact that the CIDCO’s geographical boundaries have been extended to envelope the entire hub enhances its prospects further. The focus of the DMIC and DFC projects on the
63
RESEARCHINDIA LOGISTICS &
WAREHOUSING REPORT
are mostly located in Kalamboli and to a lesser extent in Taloja in the Taloja-Kalamboli cluster. These are characterised by G+1 RCC or PEB structures that might not have basic facilities like serviceable approach roads or security. Consequently these are used to house low value products for the pharmaceuticals, consumer durables, metals and textile industry. Rents in these warehouses range between `12-15/ sq.ft.
The highest priced warehouse products on offer in the Panvel cluster are located in the areas within a 5 km. radius of Palaspe Phata and locations on the JNPT, Uran and Chirner roads closer to the port. These are typically warehousing parks offering integrated logistics solutions that could include pick-up, packaging and delivery facilities. State-of-the-art construction quality with PEB structures having high ceilings (30-35 ft.), climate control, sewage treatment plants, adequate security and internal roads characterise these facilities and command a rental rate of `20-24/ sq.ft.
There is a mid-range of warehouse facilities available in the range of `16-18/ sq.ft. that offer good infrastructure but cannot command higher rentals due to their distance from the port. These are located on the NH-4 and their rentals progressively reduce from `18/ sq.ft.to `16/ sq.ft.as one moves further south on the highway. Warehouses priced at `18/ sq.ft.can be found on the NH4 starting approximately 6 kms away from Palaspe Phata at Shedung till Bhokarpada and on the Sawala Apta Road that branches out from the NH-4 toward Rasayani. Rates drop to `16/ sq.ft.beyond Bhokrpada till Khalapur that is almost 40 km. away and on the Pen-Khopoli Road.
Warehousing facilities on the NH-17 are priced relatively higher than those on the NH-4 due to their proximity to the JNPT, the dearth of warehousing products on offer and the relative scarcity of land on this stretch of the highway. Any development can only take place on the NH-17 on a 7 km. stretch starting from Palaspe Phata due to the presence of the Karnala Bird Sanctuary beyond that boundary. Warehouse facilities are thus priced higher at `20/ sq.ft.on the 4
km. stretch starting from Chirvat till the boundary of the Karnala Bird Sanctuary.
Overall, the total warehousing space in the Panvel warehouse hub is approximately 15 mn.sq.ft.
Table: Indicative Land Rate and Rents for Warehouse Developments
Existing Warehousing Players
Indicator Unit Value
Land rate ` mn./ acre 15 - 70
Land rate `/ sq.mt.`/ sq.mt.` 3,700 -17,300
Rent `/ sq.ft./`/ sq.ft./`month
12 - 24
Source: Knight Frank Research
Source: Knight Frank Research
Existing Warehousing Players
CCI Logistics Park
JWC Logistics
Paras Group
Singh & Chedda Logistics
Jyoti Logistics
Sumeet Logistics
InfrastructureThe Panvel warehousing hub is very well served by the national highways around which logistics and warehousing activity has evolved. Internal roads however do not meet the same quality, especially off the JNPT and Uran Road. These roads are in a poor condition and difficult to negotiate even by trucks in some cases. A significant number of internal roads are just two-lanes sans dividers, barely enough to let two trucks cross each other. This causes frequent traffic jams, delays and increases vehicle maintenance cost.
There is adequate power supply in this warehouse hub that has improved in recent years as the Maharashtra State Electricity Distribution Company (MSEDC)
now sources enough power to fulfil the needs of industries and warehouses in the Panvel hub. Water supply and sewerage are also significantly better compared to the Bhiwandi hub as ground water is extensively used.
The City and Industrial Corporation (CIDCO) of Maharashtra has been named the Special Planning Authority for the Navi Mumbai Airport Influence Notified Area (NAINA) in January, 2013. Earlier, CIDCO’s reach was limited till Palaspa leaving vast stretches on the NH-4 and NH-17 that form a large part of the market, out of its reach. This move has ensured that infrastructure initiatives, especially the development of roads in this market, will receive a huge boost in the times to come. CIDCO has recently undertaken work on the Dronagiri Coastal Road that will link the JNPT and Dronagiri area to the Pune and Goa highways facilitating fast movement of containers from JNPT directly to the highways.
Competitive AdvantageThe single largest advantage that supports the Panvel warehouse hub’s survival and growth is its proximity to the JNPT. The fact that more than half of india’s container traffic is routed through this port virtually cements its position as the one of the strongest warehousing hubs in India as nearly all containerised exim cargo requires CFS or warehouse facilities. This also enables it to command significantly higher rental and occupancy levels than Mumbai’s only other major warehouse cluster of Bhiwandi. Efficient access to most container traffic destinations via the national highway network (NH-17, NH-4, NH-3, NH-222, NH-8) is also a critical factor aiding this market’s growth.
A large portion of the Panvel warehousing hub has always been under the jurisdiction of CIDCO and has aided in building sustainable infrastructure in terms of roads, power and water availability. The fact that the CIDCO’s geographical boundaries have been extended to envelope the entire hub enhances its prospects further. The focus of the DMIC and DFC projects on the
64
OutlookThe Panvel warehousing hub represents the higher end of logistics and warehousing facilities in the Mumbai market and is continuously evolving as a greater number of logistics parks bring about consolidation of warehousing activities. As occupiers increasingly prefer outsourcing their logistics and warehousing operations to third party experts and demand seamless operations, the market will continue to see growth in terms of sheer volume and improved operations. The JNPT Port is already working at 120% capacity on an installed capacity of 3.8 mn. TEUs and is expected to add another terminal, more than doubling its capacity to 10 mn. TEUs by 2016. This will consequently result in an increase in demand for logistics and warehousing activities in the Panvel cluster.
The land-use is largely favourable for industrial and warehouse development in the Panvel hub. The 25 km. stretch on the JNPT Road between the JNPT and Palaspe Phata is peppered with CFS facilities and as land rates have gone up, there is comparatively less scope for further development there as commercial viability is an issue. The last five years have seen high quality warehouses come up in a 5 km. radius from Palaspe Phata but it is unlikely that further
JNPT will only boost the attractiveness of this market. Abundant availability of skilled and unskilled labour in Navi Mumbai and the absence of specific local labour issues like the payment of a “Warai” charge that is commonplace in the Bhiwandi market also makes logistics and warehousing activity in Panvel more viable.
ChallengesIn spite of the fundamental factors that support the growth of a thriving warehouse hub, the Panvel cluster has its fair share of challenges. The announcement of the Special Economic Zone in 2002 and the upcoming Navi Mumbai airport, led to Panvel and its surrounding locations being touted as the next big residential hub. Unavailability of viable land for warehousing and its spiralling prices due to a burgeoning residential market that has kept spreading its boundaries are by far the most pressing issues in this cluster.
Prices in residential projects within a 3 km. radius of Palaspe Phata have crossed `5,000/ sq.ft.while nearby residential markets like Kharghar and Kamothe are priced between `6,500-9,000/ sq.ft. Residential projects have started coming up as far as Khalapur on the NH4 and have found buyers at `5,000/ sq.ft.albeit such instances are quite limited currently.
Land owners are more tempted to partner with residential developers who offer quicker returns compared to warehouse operators in which case the pay-out is more spread out over time. Over the years, the growing residential market has pushed land prices up especially in locations close to Palaspe Phata, while rentals have not gone up at the same pace due to a lull in the market. The relative paucity of contiguous land and fragmented land holdings also pose challenges in identifying viable land for development.
Warehouse Development Aspect (Legal Framework) It must be noted that modern warehouse developers do not exceed 0.5 FSI as half
the plot area is required for roads and allied infrastructure and such warehouses cannot be built as storeyed structures due to 25-30 ft. high ceilings and stacking requirements.
warehouse development will come up in this area as land owners here will favour residential development due to the more lucrative proposition that it represents. The on-going widening of the Sion Panvel Highway into a 10 lane road that meets expressway standards, planned introduction of fast trains on the harbour line and increasing the frequency of train services on the Diva-Panvel-Somatane route are among the infrastructure developments that will vastly reduce travel time to Mumbai’s business districts and encourage people to shift residence here. The unviability of land prices closer to Palaspe Phata will push warehouse development further south towards the periphery of the NH-17 where land prices are still feasible enough to support a business case for this property type.
Land cost forms the most critical component of warehouse development and influences realisable return to a great extent. The adjoining tables depict the existing land rates and realisable rents in various location clusters within the Panvel warehouse hub. They also show which of these clusters can enable warehouse developers achieve an expected return of 12%-24% per annum given the existing rent and land cost dynamics. For example, with a return expectation of 16% per annum and an expected annual rental growth rate of 2%, the feasible land cost needs to be `21 mn./ acre if the prevailing rent is `18/ sq.ft./ month. In other words, an investor can achieve 16% per annum return only if he is able to purchase land today below `21 mn./ acre. As the purchase price of land goes
Indicator Details
Land use Industrial
Base FSI (Development Potential) As decided by relevant local authority
FSI Remark FSI is subject to three conditions namely land use assigned to the plot, size of the plot and width of road that abuts the plot.
Maximum Ground coverage 50%
Approval authority CIDCO, Gram panchayat
Octroi/ Local Body Tax (LBT) LBT has replaced Octroi in Navi Mumbai since April 2013
Source: Knight Frank Research
Table: Legal Framework
64
OutlookThe Panvel warehousing hub represents the higher end of logistics and warehousing facilities in the Mumbai market and is continuously evolving as a greater number of logistics parks bring about consolidation of warehousing activities. As occupiers increasingly prefer outsourcing their logistics and warehousing operations to third party experts and demand seamless operations, the market will continue to see growth in terms of sheer volume and improved operations. The JNPT Port is already working at 120% capacity on an installed capacity of 3.8 mn. TEUs and is expected to add another terminal, more than doubling its capacity to 10 mn. TEUs by 2016. This will consequently result in an increase in demand for logistics and warehousing activities in the Panvel cluster.
The land-use is largely favourable for industrial and warehouse development in the Panvel hub. The 25 km. stretch on the JNPT Road between the JNPT and Palaspe Phata is peppered with CFS facilities and as land rates have gone up, there is comparatively less scope for further development there as commercial viability is an issue. The last five years have seen high quality warehouses come up in a 5 km. radius from Palaspe Phata but it is unlikely that further
JNPT will only boost the attractiveness of this market. Abundant availability of skilled and unskilled labour in Navi Mumbai and the absence of specific local labour issues like the payment of a “Warai” charge that is commonplace in the Bhiwandi market also makes logistics and warehousing activity in Panvel more viable.
ChallengesIn spite of the fundamental factors that support the growth of a thriving warehouse hub, the Panvel cluster has its fair share of challenges. The announcement of the Special Economic Zone in 2002 and the upcoming Navi Mumbai airport, led to Panvel and its surrounding locations being touted as the next big residential hub. Unavailability of viable land for warehousing and its spiralling prices due to a burgeoning residential market that has kept spreading its boundaries are by far the most pressing issues in this cluster.
Prices in residential projects within a 3 km. radius of Palaspe Phata have crossed `5,000/ sq.ft.while nearby residential markets like Kharghar and Kamothe are priced between `6,500-9,000/ sq.ft. Residential projects have started coming up as far as Khalapur on the NH4 and have found buyers at `5,000/ sq.ft.albeit such instances are quite limited currently.
Land owners are more tempted to partner with residential developers who offer quicker returns compared to warehouse operators in which case the pay-out is more spread out over time. Over the years, the growing residential market has pushed land prices up especially in locations close to Palaspe Phata, while rentals have not gone up at the same pace due to a lull in the market. The relative paucity of contiguous land and fragmented land holdings also pose challenges in identifying viable land for development.
Warehouse DevelopmentAspect (Legal Framework)It must be noted that modern warehouse developers do not exceed 0.5 FSI as half
the plot area is required for roads and allied infrastructure and such warehouses cannot be built as storeyed structures due to 25-30 ft. high ceilings and stacking requirements.
warehouse development will come up in this area as land owners here will favour residential development due to the more lucrative proposition that it represents. The on-going widening of the Sion Panvel Highway into a 10 lane road that meets expressway standards, planned introduction of fast trains on the harbour line and increasing the frequency of train services on the Diva-Panvel-Somatane route are among the infrastructure developments that will vastly reduce travel time to Mumbai’s business districts and encourage people to shift residence here. The unviability of land prices closer to Palaspe Phata will push warehouse development further south towards the periphery of the NH-17 where land prices are still feasible enough to support a business case for this property type.
Land cost forms the most critical component of warehouse development and influences realisable return to a great extent. The adjoining tables depict the existing land rates and realisable rents in various location clusters within the Panvel warehouse hub. They also show which of these clusters can enable warehouse developers achieve an expected return of 12%-24% per annum given the existing rent and land cost dynamics. For example, with a return expectation of 16% per annum and an expected annual rental growth rate of 2%, the feasible land cost needs to be `21 mn./ acre if the prevailing rent is `18/ sq.ft./ month. In other words, an investor can achieve 16% per annum return only if he is able to purchase land today below `21 mn./ acre. As the purchase price of land goes
Indicator Details
Land use Industrial
Base FSI (Development Potential) As decided by relevant local authority
FSI Remark FSI is subject to three conditions namely land use assigned to the plot, size of the plot and width of road that abuts the plot.
Maximum Ground coverage 50%
Approval authority CIDCO, Gram panchayat
Octroi/ Local Body Tax (LBT) LBT has replaced Octroi in Navi Mumbai since April 2013
Source: Knight Frank Research
Table: Legal Framework
65
RESEARCHINDIA LOGISTICS &
WAREHOUSING REPORT
higher, the realisable return reduces. Similarly, as the expected annual rental growth increases, feasibility of land also goes up.
The adjoining feasible land cost matrices provide the feasible land cost for a range of expected return and rent growth combinations for a given rental level. The output from the feasible land cost matrix that matches with the prevailing market price of land has been highlighted and identified as a “market congruence case”.
Land prices and rentals on the Sawala Apta Road leading to Rasayani/ Patalganga and on the Nadhal - Khalapur stretch on the NH-4 including parts of the Pen-Khopoli Road are the only clusters that support a convincing case for warehouse development in the Panvel warehouse hub today.
There is adequate land available for development in these clusters that would ensure supply in the foreseeable future and also restrict significant price increases. Land prices in other clusters within the Panvel hub do not have a convincing business case for warehouse development as prevailing land rates there barely feature on the land price matrices.
From the adjoining table it can be seen that warehouse developers can potentially avail an investment return of up to 20% after acquiring industrial land at the prevailing rate of `18 - 25 mn./ acre at Rasayani-Patalganga and rental growth expectation of 2% - 5%.
Investor Return
12% 16% 20% 24%
Expected Rental Growth Per Annum
2% 29 21 15 11
3% 32 23 17 12
4% 35 26 19 14
5% 39 28 21 16
Investor Return
12% 16% 20% 24%
Expected Rental Growth Per Annum
2% 22 16 11 8
3% 26 18 13 9
4% 29 21 15 11
5% 32 23 17 12
Table: Feasible Land Cost Matrix for Warehousing in Rasayani-Patalganga (` mn./ acre)
Table: Feasible Land Cost Matrix for Warehousing on the Nadhal-Khalapur Stretch and Pen-Khopoli Road on NH-4 (` mn./ acre)
Table: Feasible Land Cost Matrix for Warehousing at Taloja-Kalamboli (` mn./ acre)
Market Congruence case (The output from the feasible land cost matrix that matches with the prevailing market price of land)
Market Congruence case (The output from the feasible land cost matrix that matches with the prevailing market price of land)
The Nadhal-Khalapur stretch on NH-4 and the Pen-Khopoli road are also potentially as feasible for warehouse development as Rasayani-Patalganga even though prevailing rentals in these locations are nearly 11% lower while land prices are largely comparable at `15-25 mn./ acre.
The Taloja-Kalamboli cluster does not support warehouse development under any land cost-rent combination as land is only available at over `60 mn./ acre. While other warehousing clusters such as Taloja-Kalamboli, Palaspe Phata and the JNPT & Uran Road-Chirner Road-Chirvat cluster have one feasibility case that supports a 12% investor return at the most aggressive rent growth assumption of 5%, we do not believe that these clusters support a convincing case for warehouse development
Expected Rental Growth Per Annum
Investor Return
12% 16% 20% 24%
2% 16 11 7 5
3% 19 13 9 6
4% 22 15 11 7
5% 25 18 13 9
Market Congruence case (The output from the feasible land cost matrix that matches with the prevailing market price of land)
65
RESEARCHINDIA LOGISTICS &
WAREHOUSING REPORT
higher, the realisable return reduces. Similarly, as the expected annual rental growth increases, feasibility of land alsogoes up.
The adjoining feasible land cost matrices provide the feasible land cost for a range of expected return and rent growth combinations for a given rental level. The output from the feasible land cost matrix that matches with the prevailing market price of land has been highlighted and identified as a “market congruence case”.
Land prices and rentals on the Sawala Apta Road leading to Rasayani/ Patalganga and on the Nadhal - Khalapur stretch on the NH-4 including parts of the Pen-Khopoli Road are the only clusters that support a convincing case for warehouse development in the Panvel warehouse hub today.
There is adequate land available for development in these clusters that would ensure supply in the foreseeable future and also restrict significant price increases. Land prices in other clusters within the Panvel hub do not have a convincing business case for warehouse development as prevailing land rates there barely feature on the land price matrices.
From the adjoining table it can be seen that warehouse developers can potentially avail an investment return of up to 20% after acquiring industrial land at the prevailing rate of `18 - 25 mn./ acre at Rasayani-Patalganga and rental growth expectation of 2% - 5%.
Investor Return
12% 16% 20% 24%
Expected Rental Growth Per Annum
2% 29 21 15 11
3% 32 23 17 12
4% 35 26 19 14
5% 39 28 21 16
Investor Return
12% 16% 20% 24%
Expected Rental Growth Per Annum
2% 22 16 11 8
3% 26 18 13 9
4% 29 21 15 11
5% 32 23 17 12
Table: Feasible Land Cost Matrix for Warehousing in Rasayani-Patalganga (` Patalganga (` Patalganga ( mn./ acre)
Table: Feasible Land Cost Matrix for Warehousing on the Nadhal-Khalapur Stretch and Pen-Khopoli Road on NH-4 (`Khalapur Stretch and Pen-Khopoli Road on NH-4 (`Khalapur Stretch and Pen-Khopoli Road on NH-4 ( mn./ acre)` mn./ acre)`
Table: Feasible Land Cost Matrix for Warehousing at Taloja-Kalamboli (`Table: Feasible Land Cost Matrix for Warehousing at Taloja-Kalamboli (`Table: Feasible Land Cost Matrix for Warehousing at Taloja-Kalamboli ( mn./ acre)` mn./ acre)`
Market Congruence case (The output from the feasible land cost matrix that matches with the prevailing market price of land)
Market Congruence case (The output from the feasible land cost matrix that matches with the prevailing market price of land)
The Nadhal-Khalapur stretch on NH-4 and the Pen-Khopoli road are also potentially as feasible for warehouse development as Rasayani-Patalganga even though prevailing rentals in these locations are nearly 11% lower while land prices are largely comparable at `15-25 mn./ acre.
The Taloja-Kalamboli cluster does not support warehouse development under any land cost-rent combination as land is only available at over `60 mn./ acre. While other warehousing clusters such as Taloja-Kalamboli, Palaspe Phata and the JNPT & Uran Road-Chirner Road-Chirvat cluster have one feasibility case that supports a 12% investor return at the most aggressive rent growth assumption of 5%, we do not believe that these clusters support a convincing case for warehouse development
Expected Rental Growth Per Annum
Investor Return
12% 16% 20% 24%
2% 16 11 7 5
3% 19 13 9 6
4% 22 15 11 7
5% 25 18 13 9
Market Congruence case (The output from the feasible land cost matrix that matches with the prevailing market price of land)
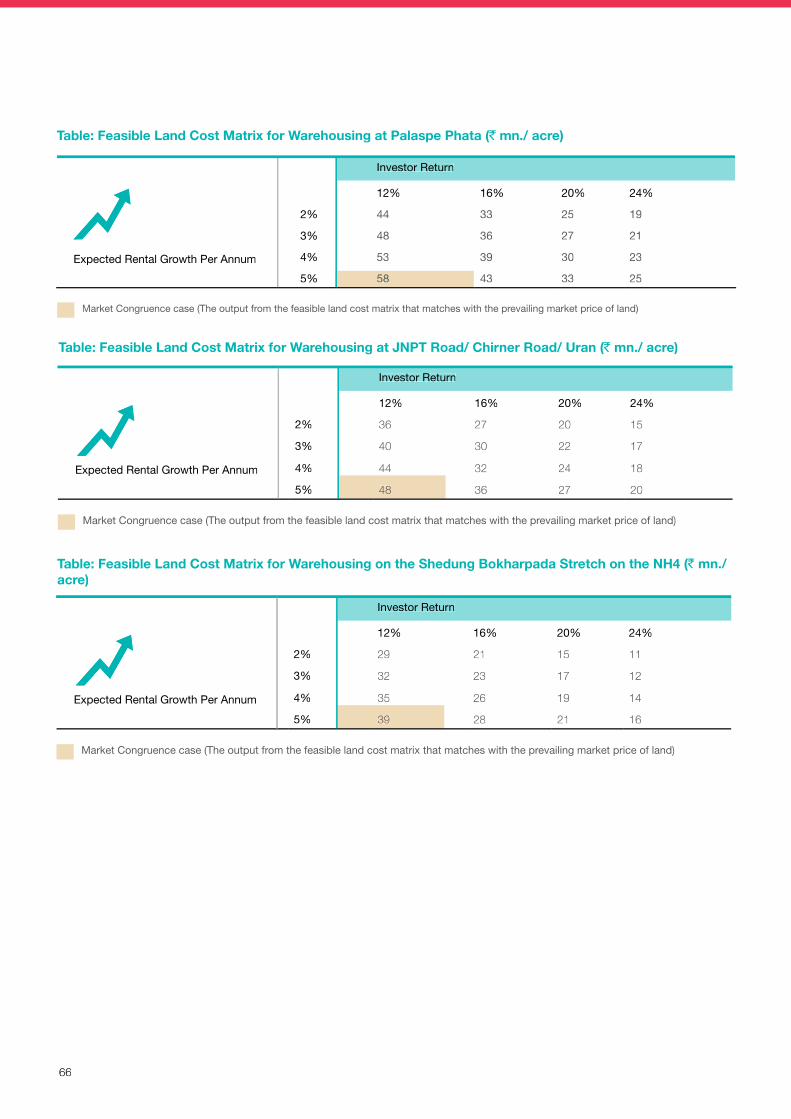
66
Table: Feasible Land Cost Matrix for Warehousing at Palaspe Phata (` mn./ acre)
Expected Rental Growth Per Annum
Investor Return
12% 16% 20% 24%
2% 44 33 25 19
3% 48 36 27 21
4% 53 39 30 23
5% 58 43 33 25
Market Congruence case (The output from the feasible land cost matrix that matches with the prevailing market price of land)
Expected Rental Growth Per Annum
Investor Return
12% 16% 20% 24%
2% 36 27 20 15
3% 40 30 22 17
4% 44 32 24 18
5% 48 36 27 20
Expected Rental Growth Per Annum
Investor Return
12% 16% 20% 24%
2% 29 21 15 11
3% 32 23 17 12
4% 35 26 19 14
5% 39 28 21 16
Market Congruence case (The output from the feasible land cost matrix that matches with the prevailing market price of land)
Market Congruence case (The output from the feasible land cost matrix that matches with the prevailing market price of land)
Table: Feasible Land Cost Matrix for Warehousing at JNPT Road/ Chirner Road/ Uran (` mn./ acre)
Table: Feasible Land Cost Matrix for Warehousing on the Shedung Bokharpada Stretch on the NH4 (` mn./ acre)
66
Table: Feasible Land Cost Matrix for Warehousing at Palaspe Phata (`Table: Feasible Land Cost Matrix for Warehousing at Palaspe Phata (`Table: Feasible Land Cost Matrix for Warehousing at Palaspe Phata ( mn./ acre)` mn./ acre)`
Expected Rental Growth Per Annum
Investor Return
12% 16% 20% 24%
2% 44 33 25 19
3% 48 36 27 21
4% 53 39 30 23
5% 58 43 33 25
Market Congruence case (The output from the feasible land cost matrix that matches with the prevailing market price of land)
Expected Rental Growth Per Annum
Investor Return
12% 16% 20% 24%
2% 36 27 20 15
3% 40 30 22 17
4% 44 32 24 18
5% 48 36 27 20
Expected Rental Growth Per Annum
Investor Return
12% 16% 20% 24%
2% 29 21 15 11
3% 32 23 17 12
4% 35 26 19 14
5% 39 28 21 16
Market Congruence case (The output from the feasible land cost matrix that matches with the prevailing market price of land)
Market Congruence case (The output from the feasible land cost matrix that matches with the prevailing market price of land)
Table: Feasible Land Cost Matrix for Warehousing at JNPT Road/ Chirner Road/ Uran (`Table: Feasible Land Cost Matrix for Warehousing at JNPT Road/ Chirner Road/ Uran (`Table: Feasible Land Cost Matrix for Warehousing at JNPT Road/ Chirner Road/ Uran ( mn./ acre)` mn./ acre)`
Table: Feasible Land Cost Matrix for Warehousing on the Shedung Bokharpada Stretch on the NH4 (`Table: Feasible Land Cost Matrix for Warehousing on the Shedung Bokharpada Stretch on the NH4 (`Table: Feasible Land Cost Matrix for Warehousing on the Shedung Bokharpada Stretch on the NH4 ( mn./ ` mn./ `acre)
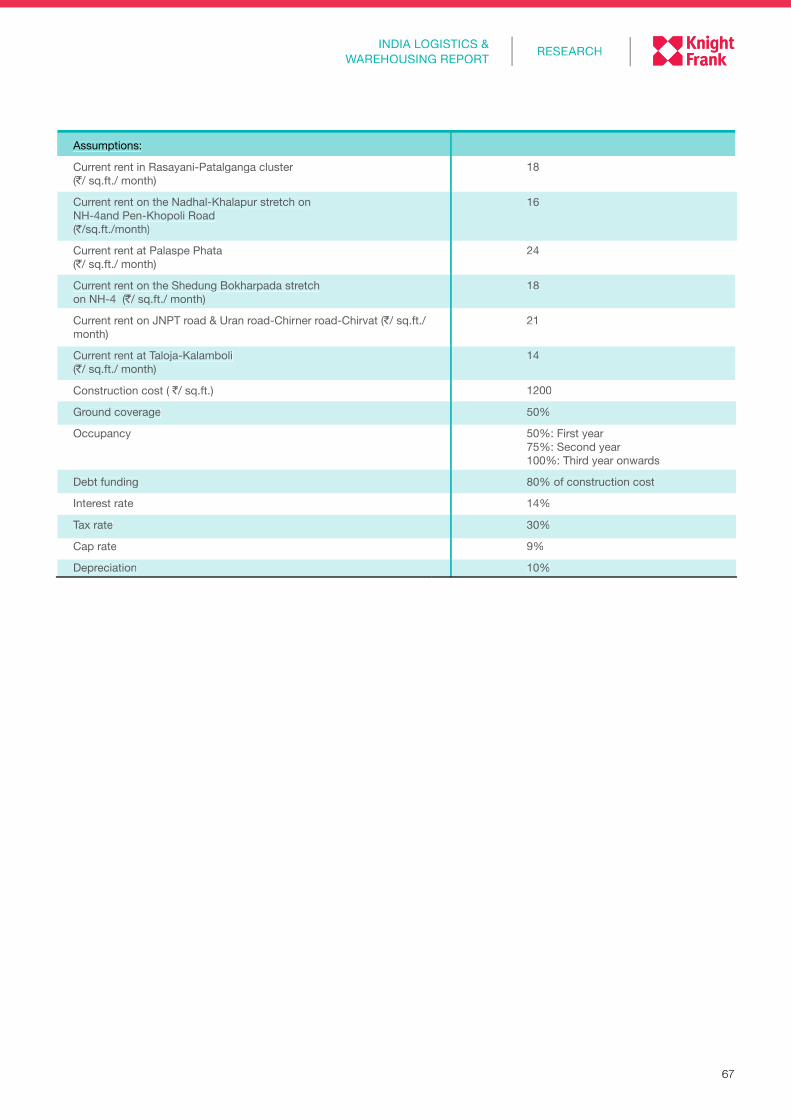
67
RESEARCHINDIA LOGISTICS &
WAREHOUSING REPORT
Assumptions:
Current rent in Rasayani-Patalganga cluster (`/ sq.ft./ month)
18
Current rent on the Nadhal-Khalapur stretch on NH-4and Pen-Khopoli Road (`/sq.ft./month)
16
Current rent at Palaspe Phata (`/ sq.ft./ month)
24
Current rent on the Shedung Bokharpada stretch on NH-4 (`/ sq.ft./ month)
18
Current rent on JNPT road & Uran road-Chirner road-Chirvat (`/ sq.ft./ month)
21
Current rent at Taloja-Kalamboli (`/ sq.ft./ month)
14
Construction cost ( `/ sq.ft.) 1200
Ground coverage 50%
Occupancy 50%: First year 75%: Second year 100%: Third year onwards
Debt funding 80% of construction cost
Interest rate 14%
Tax rate 30%
Cap rate 9%
Depreciation 10%
67
RESEARCHINDIA LOGISTICS &
WAREHOUSING REPORT
Assumptions:
Current rent in Rasayani-Patalganga cluster(`(`( / sq.ft./ month)`/ sq.ft./ month)`
18
Current rent on the Nadhal-Khalapur stretch on NH-4and Pen-Khopoli Road (`(`( /sq.ft./month)`/sq.ft./month)`
16
Current rent at Palaspe Phata (`(`( / sq.ft./ month)`/ sq.ft./ month)`
24
Current rent on the Shedung Bokharpada stretch on NH-4 (`on NH-4 (`on NH-4 ( / sq.ft./ month)`/ sq.ft./ month)`
18
Current rent on JNPT road & Uran road-Chirner road-Chirvat (`Current rent on JNPT road & Uran road-Chirner road-Chirvat (`Current rent on JNPT road & Uran road-Chirner road-Chirvat ( / sq.ft./ `/ sq.ft./ `month)
21
Current rent at Taloja-Kalamboli (`(`( / sq.ft./ month)`/ sq.ft./ month)`
14
Construction cost ( `/ sq.ft.)`/ sq.ft.)` 1200
Ground coverage 50%
Occupancy 50%: First year75%: Second year100%: Third year onwards
Debt funding 80% of construction cost
Interest rate 14%
Tax rate 30%
Cap rate 9%
Depreciation 10%
68
PUNE METROPOLITAN REGION (PMR)PUNE METROPOLITAN REGION (PMR)
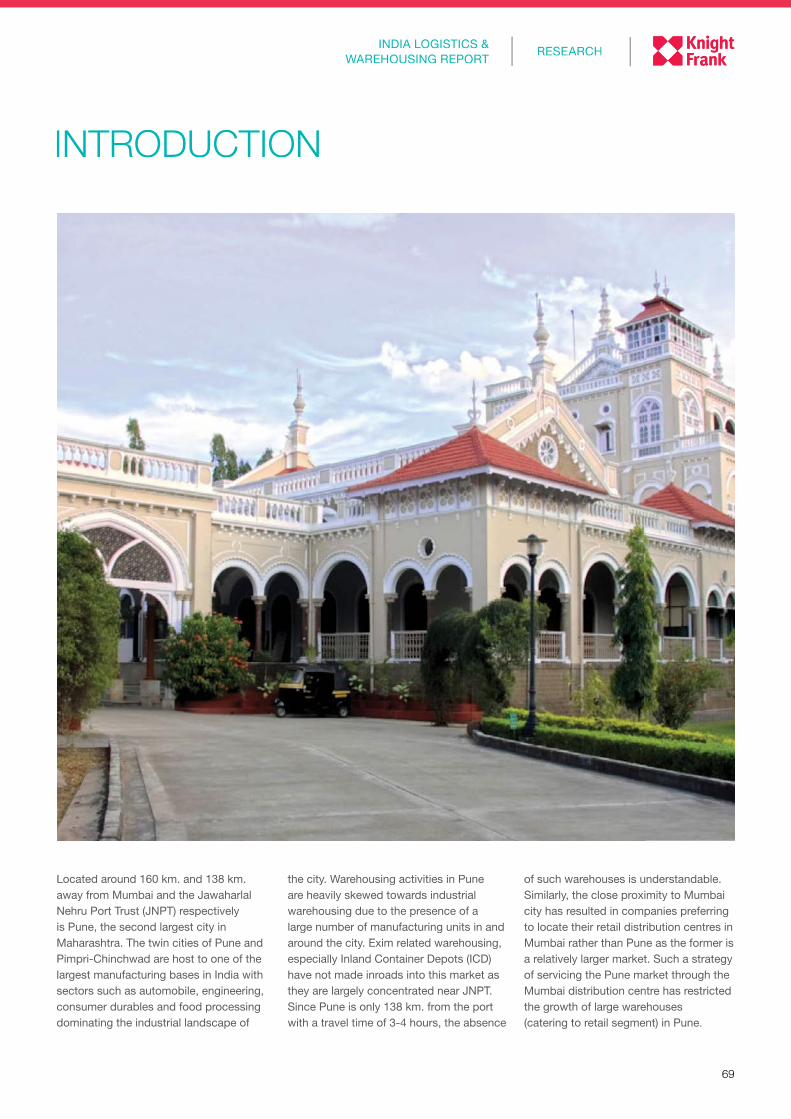
69
RESEARCHINDIA LOGISTICS &
WAREHOUSING REPORT
INTRODUCTION
Located around 160 km. and 138 km. away from Mumbai and the Jawaharlal Nehru Port Trust (JNPT) respectively is Pune, the second largest city in Maharashtra. The twin cities of Pune and Pimpri-Chinchwad are host to one of the largest manufacturing bases in India with sectors such as automobile, engineering, consumer durables and food processing dominating the industrial landscape of
the city. Warehousing activities in Pune are heavily skewed towards industrial warehousing due to the presence of a large number of manufacturing units in and around the city. Exim related warehousing, especially Inland Container Depots (ICD) have not made inroads into this market as they are largely concentrated near JNPT. Since Pune is only 138 km. from the port with a travel time of 3-4 hours, the absence
of such warehouses is understandable. Similarly, the close proximity to Mumbai city has resulted in companies preferring to locate their retail distribution centres in Mumbai rather than Pune as the former is a relatively larger market. Such a strategy of servicing the Pune market through the Mumbai distribution centre has restricted the growth of large warehouses (catering to retail segment) in Pune.
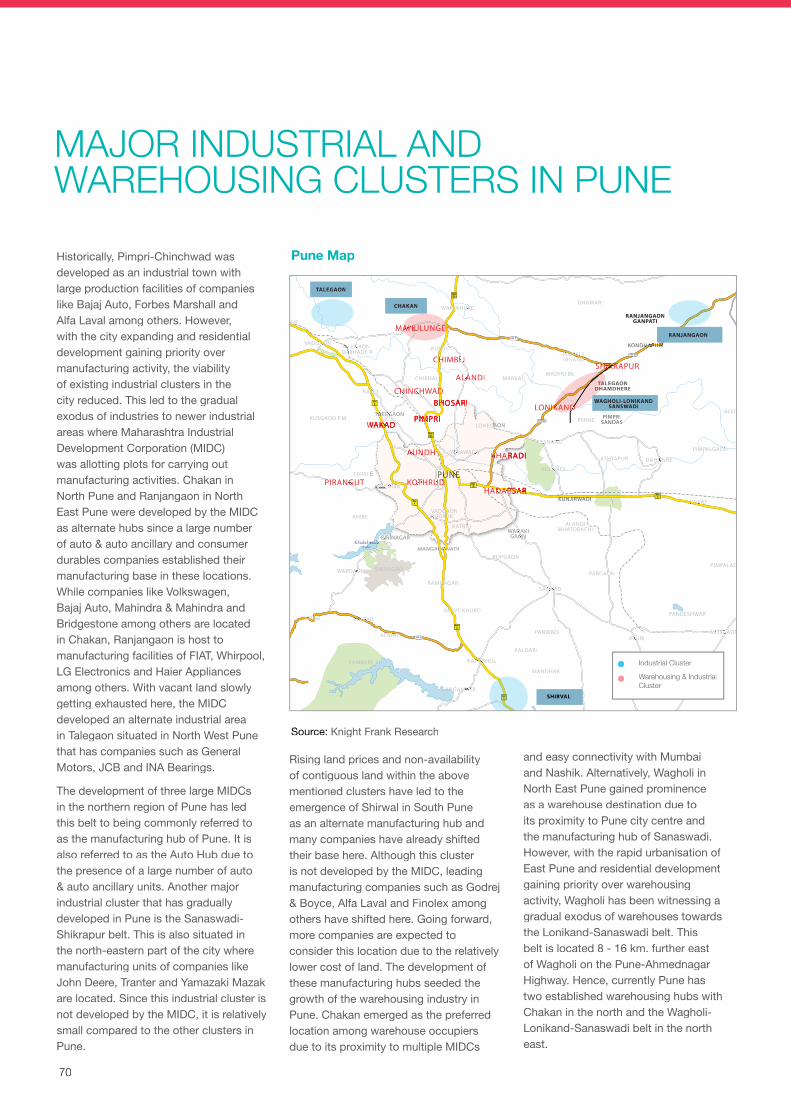
70
Historically, Pimpri-Chinchwad was developed as an industrial town with large production facilities of companies like Bajaj Auto, Forbes Marshall and Alfa Laval among others. However, with the city expanding and residential development gaining priority over manufacturing activity, the viability of existing industrial clusters in the city reduced. This led to the gradual exodus of industries to newer industrial areas where Maharashtra Industrial Development Corporation (MIDC) was allotting plots for carrying out manufacturing activities. Chakan in North Pune and Ranjangaon in North East Pune were developed by the MIDC as alternate hubs since a large number of auto & auto ancillary and consumer durables companies established their manufacturing base in these locations. While companies like Volkswagen, Bajaj Auto, Mahindra & Mahindra and Bridgestone among others are located in Chakan, Ranjangaon is host to manufacturing facilities of FIAT, Whirpool, LG Electronics and Haier Appliances among others. With vacant land slowly getting exhausted here, the MIDC developed an alternate industrial area in Talegaon situated in North West Pune that has companies such as General Motors, JCB and INA Bearings.
The development of three large MIDCs in the northern region of Pune has led this belt to being commonly referred to as the manufacturing hub of Pune. It is also referred to as the Auto Hub due to the presence of a large number of auto & auto ancillary units. Another major industrial cluster that has gradually developed in Pune is the Sanaswadi-Shikrapur belt. This is also situated in the north-eastern part of the city where manufacturing units of companies like John Deere, Tranter and Yamazaki Mazak are located. Since this industrial cluster is not developed by the MIDC, it is relatively small compared to the other clusters in Pune.
Rising land prices and non-availability of contiguous land within the above mentioned clusters have led to the emergence of Shirwal in South Pune as an alternate manufacturing hub and many companies have already shifted their base here. Although this cluster is not developed by the MIDC, leading manufacturing companies such as Godrej & Boyce, Alfa Laval and Finolex among others have shifted here. Going forward, more companies are expected to consider this location due to the relatively lower cost of land. The development of these manufacturing hubs seeded the growth of the warehousing industry in Pune. Chakan emerged as the preferred location among warehouse occupiers due to its proximity to multiple MIDCs
and easy connectivity with Mumbai and Nashik. Alternatively, Wagholi in North East Pune gained prominence as a warehouse destination due to its proximity to Pune city centre and the manufacturing hub of Sanaswadi. However, with the rapid urbanisation of East Pune and residential development gaining priority over warehousing activity, Wagholi has been witnessing a gradual exodus of warehouses towards the Lonikand-Sanaswadi belt. This belt is located 8 - 16 km. further east of Wagholi on the Pune-Ahmednagar Highway. Hence, currently Pune has two established warehousing hubs with Chakan in the north and the Wagholi-Lonikand-Sanaswadi belt in the north east.
Source: Knight Frank Research
MAJOR INDUSTRIAL AND WAREHOUSING CLUSTERS IN PUNE
PARGAON
KHOPODI
KEDAGAON
PIMPALACHIWALI
PIMPALGAON
DAHITANE
NHAVARE
ALEGAON
NIMONE
KONDHAPURI
PIMPALEJAGATAP
PERNE
AMBLE
PUNELAVALE
PIRANGUT
KUSGAON P.M.
RAVET
BHOSARI
KURULI
AHIRE
GIRINAGAR
SINHAGADWARDADE
RAMNAGAR
MANGADEWADI
SASWAD
BOPGAON
PANWADI
ALANDIMHATOBACHI
VARVE KHURD
SANGAMNER
KALDARI
PARGAON
WADAKIGAON
VALHE GAON
JEJURI
MUDHALE
MURTI
MODHAVE
LONIBHAPKAR
NAROLI
DADWADI
KARHATI
PANDESHWAR
MANDHAR
ADWALI
KAMBARE Kh. KAPURHOL
VINZARVELHE
MORGAON
VADGAONBUDRUK
KATRAJ
BAVDHAN
LOHEGAON
MARKAL
SHIKRAPUR
TALEGAONDHAMDHERE
ASHTAPUR
KUNJIRWADI
PIMPRISANDAS
KOLWADI
KESNAND
YAWAT
YERAWADA
VADGAON
KANHE
THERGAON
TALEGAONDABHADE R
WAKI KHURD
WADHU Bk.
DHAMARI
RANJANGAONGANPATI
CHIKHALI
ChinchiniDam
MulshiDam
KhadakwaslaLake
NH50
NH50
NH9
NH4
NH4
NH4
NH4
NH4
NH9
NH9
SH 65
SH 55
SH 60
SH 60
SH 65
SHIRVAL
WAGHOLI-LONIKANDSANSWADI
RANJANGAON
CHAKAN
TALEGAON
KOTHRUD
WAKAD
HADAPSAR
ALANDI
KHARADIAUNDH
CHINCHWAD
MAHULUNGE
PIMPRI
CHIMBLI
LONIKAND
Industrial Cluster
Warehousing & Industrial Cluster
Pune Map
70
Historically, Pimpri-Chinchwad was developed as an industrial town with large production facilities of companies like Bajaj Auto, Forbes Marshall and Alfa Laval among others. However, with the city expanding and residential development gaining priority over manufacturing activity, the viability of existing industrial clusters in the city reduced. This led to the gradual exodus of industries to newer industrial areas where Maharashtra Industrial Development Corporation (MIDC) was allotting plots for carrying out manufacturing activities. Chakan in North Pune and Ranjangaon in North East Pune were developed by the MIDC as alternate hubs since a large number of auto & auto ancillary and consumer durables companies established their manufacturing base in these locations. While companies like Volkswagen, Bajaj Auto, Mahindra & Mahindra and Bridgestone among others are located in Chakan, Ranjangaon is host to manufacturing facilities of FIAT, Whirpool, LG Electronics and Haier Appliances among others. With vacant land slowly getting exhausted here, the MIDC developed an alternate industrial area in Talegaon situated in North West Pune that has companies such as General Motors, JCB and INA Bearings.
The development of three large MIDCs in the northern region of Pune has led this belt to being commonly referred to as the manufacturing hub of Pune. It is also referred to as the Auto Hub due to the presence of a large number of auto & auto ancillary units. Another major industrial cluster that has gradually developed in Pune is the Sanaswadi-Shikrapur belt. This is also situated in the north-eastern part of the city where manufacturing units of companies like John Deere, Tranter and Yamazaki Mazak are located. Since this industrial cluster is not developed by the MIDC, it is relatively small compared to the other clusters in Pune.
Rising land prices and non-availability of contiguous land within the above mentioned clusters have led to the emergence of Shirwal in South Pune as an alternate manufacturing hub and many companies have already shifted their base here. Although this cluster is not developed by the MIDC, leading manufacturing companies such as Godrej & Boyce, Alfa Laval and Finolex among others have shifted here. Going forward, more companies are expected to consider this location due to the relatively lower cost of land. The development of these manufacturing hubs seeded the growth of the warehousing industry in Pune. Chakan emerged as the preferred location among warehouse occupiers due to its proximity to multiple MIDCs
and easy connectivity with Mumbai and Nashik. Alternatively, Wagholi in North East Pune gained prominence as a warehouse destination due to its proximity to Pune city centre and the manufacturing hub of Sanaswadi. However, with the rapid urbanisation of East Pune and residential development gaining priority over warehousing activity, Wagholi has been witnessing a gradual exodus of warehouses towards the Lonikand-Sanaswadi belt. This belt is located 8 - 16 km. further east of Wagholi on the Pune-Ahmednagar Highway. Hence, currently Pune has two established warehousing hubs with Chakan in the north and the Wagholi-Lonikand-Sanaswadi belt in the north east.
Source: Knight Frank Research
MAJOR INDUSTRIAL AND WAREHOUSING CLUSTERS IN PUNE
PIMPALACHIWALI
PIMPALGAONPIMPALGAON
DAHITANEDAHITANEDAHITANEDAHITANEDAHITANEDAHITANE
ALEGAON
KONDHAPURIKONDHAPURIKONDHAPURI
PIMPALEPIMPALEPIMPALEJAGATAPJAGATAPJAGATAP
PERNE
PUNEPUNEPUNEPUNEPUNEPUNEPUNELAVALELAVALE
PIRANGUTPIRANGUTPIRANGUT
KUSGAON P.M.
RAVETRAVETRAVETRAVETRAVET
BHOSARIBHOSARIBHOSARIBHOSARIBHOSARIBHOSARIBHOSARI
KURULIKURULIKURULIKURULIKURULI
AHIRE
GIRINAGARGIRINAGARGIRINAGAR
SINHAGADWARDADEWARDADEWARDADEWARDADE
RAMNAGARRAMNAGARRAMNAGAR
MANGADEWADIMANGADEWADIMANGADEWADIMANGADEWADIMANGADEWADIMANGADEWADI
SASWADSASWADSASWADSASWADSASWADSASWADSASWAD
BOPGAONBOPGAON
PANWADI
ALANDIMHATOBACHI
VARVE KHURDVARVE KHURDVARVE KHURD
SANGAMNERSANGAMNERSANGAMNERSANGAMNERSANGAMNER
KALDARI
PARGAONPARGAONPARGAON
WADAKIWADAKIWADAKIGAONGAONGAON
JEJURIJEJURIJEJURI
PANDESHWAR
MANDHAR
ADWALIADWALIADWALI
KAMBARE Kh.KAMBARE Kh.KAMBARE Kh. KAPURHOLKAPURHOLKAPURHOLKAPURHOLKAPURHOLKAPURHOLKAPURHOL
VINZARVINZARVINZARVELHEVELHEVELHE
MORGAONMORGAONMORGAONMORGAONMORGAON
VADGAONVADGAONVADGAONBUDRUKBUDRUKBUDRUKBUDRUKBUDRUK
KATRAJKATRAJKATRAJ
BAVDHANBAVDHANBAVDHANBAVDHANBAVDHAN
LOHEGAONLOHEGAONLOHEGAON
MARKALMARKAL
SHIKRAPURSHIKRAPURSHIKRAPURSHIKRAPURSHIKRAPUR
TALEGAONDHAMDHERE
ASHTAPUR
KUNJIRWADIKUNJIRWADIKUNJIRWADI
PIMPRIPIMPRISANDASSANDAS
KOLWADIKOLWADIKOLWADIKOLWADIKOLWADI
KESNANDKESNANDKESNANDKESNANDKESNANDKESNAND
YAWATYAWATYAWAT
YERAWADAYERAWADAYERAWADAYERAWADAYERAWADAYERAWADA
VADGAONVADGAONVADGAONVADGAONVADGAON
KANHEKANHEKANHEKANHEKANHE
THERGAONTHERGAONTHERGAONTHERGAONTHERGAONTHERGAONTHERGAON
TALEGAONTALEGAONTALEGAONTALEGAONDABHADE RDABHADE RDABHADE RDABHADE R
WAKI KHURDWAKI KHURDWAKI KHURDWAKI KHURD
WADHU Bk.
DHAMARI
RANJANGAONGANPATI
CHIKHALICHIKHALICHIKHALI
KhadakwaslaKhadakwaslaKhadakwaslaKhadakwaslaKhadakwaslaLakeLakeLake
NH50
NH50
NH9
NH4
NH4
NH4
NH9
SH 65
SH 55
SH 60
SH 60
TALEGAONDHAMDHERE
NH4 SHIRVAL
WAGHOLI-LONIKANDSANSWADI
RANJANGAON
CHAKAN
TALEGAON
KOTHRUDKOTHRUDKOTHRUDKOTHRUDKOTHRUDKOTHRUDKOTHRUDKOTHRUDKOTHRUD
WAKADWAKADWAKADWAKADWAKADWAKAD
HADAPSARHADAPSARHADAPSARHADAPSARHADAPSARHADAPSARHADAPSARHADAPSARHADAPSARHADAPSAR
ALANDIALANDIALANDIALANDI
KHARADIKHARADIKHARADIKHARADIKHARADIKHARADIAUNDHAUNDHAUNDHAUNDHAUNDH
CHINCHWADCHINCHWADCHINCHWADCHINCHWADCHINCHWADCHINCHWADCHINCHWAD
MAHULUNGEMAHULUNGEMAHULUNGEMAHULUNGEMAHULUNGEMAHULUNGEMAHULUNGEMAHULUNGEMAHULUNGE
PIMPRIPIMPRIPIMPRIPIMPRIPIMPRIPIMPRIPIMPRI
CHIMBLICHIMBLICHIMBLICHIMBLICHIMBLI
LONIKANDLONIKANDLONIKANDLONIKANDLONIKANDLONIKANDLONIKANDLONIKANDLONIKAND
Industrial Cluster
Warehousing & IndustrialCluster
Pune Map
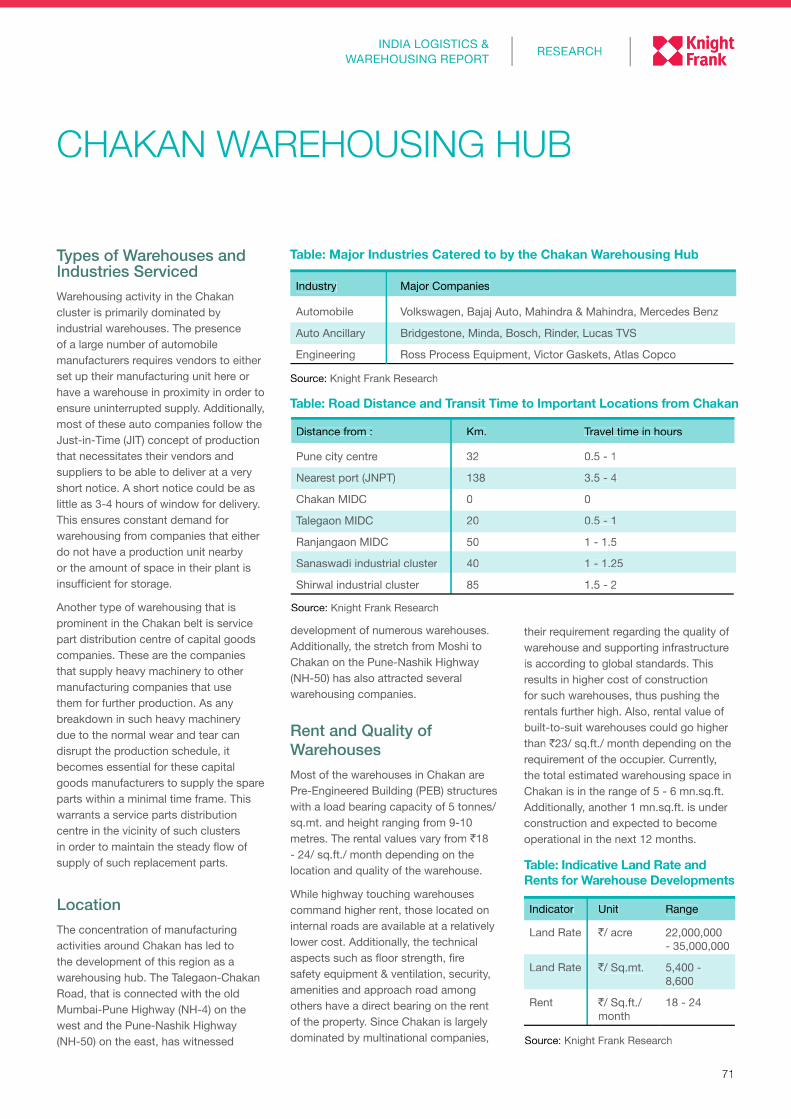
71
RESEARCHINDIA LOGISTICS &
WAREHOUSING REPORT
Types of Warehouses and Industries ServicedWarehousing activity in the Chakan cluster is primarily dominated by industrial warehouses. The presence of a large number of automobile manufacturers requires vendors to either set up their manufacturing unit here or have a warehouse in proximity in order to ensure uninterrupted supply. Additionally, most of these auto companies follow the Just-in-Time (JIT) concept of production that necessitates their vendors and suppliers to be able to deliver at a very short notice. A short notice could be as little as 3-4 hours of window for delivery. This ensures constant demand for warehousing from companies that either do not have a production unit nearby or the amount of space in their plant is insufficient for storage.
Another type of warehousing that is prominent in the Chakan belt is service part distribution centre of capital goods companies. These are the companies that supply heavy machinery to other manufacturing companies that use them for further production. As any breakdown in such heavy machinery due to the normal wear and tear can disrupt the production schedule, it becomes essential for these capital goods manufacturers to supply the spare parts within a minimal time frame. This warrants a service parts distribution centre in the vicinity of such clusters in order to maintain the steady flow of supply of such replacement parts.
LocationThe concentration of manufacturing activities around Chakan has led to the development of this region as a warehousing hub. The Talegaon-Chakan Road, that is connected with the old Mumbai-Pune Highway (NH-4) on the west and the Pune-Nashik Highway (NH-50) on the east, has witnessed
CHAKAN WAREHOUSING HUB
Industry Major Companies
Automobile Volkswagen, Bajaj Auto, Mahindra & Mahindra, Mercedes Benz
Auto Ancillary Bridgestone, Minda, Bosch, Rinder, Lucas TVS
Engineering Ross Process Equipment, Victor Gaskets, Atlas Copco
Source: Knight Frank Research
Source: Knight Frank Research
Distance from : Km. Travel time in hours
Pune city centre 32 0.5 - 1
Nearest port (JNPT) 138 3.5 - 4
Chakan MIDC 0 0
Talegaon MIDC 20 0.5 - 1
Ranjangaon MIDC 50 1 - 1.5
Sanaswadi industrial cluster 40 1 - 1.25
Shirwal industrial cluster 85 1.5 - 2
development of numerous warehouses.Additionally, the stretch from Moshi to Chakan on the Pune-Nashik Highway (NH-50) has also attracted several warehousing companies.
Rent and Quality of WarehousesMost of the warehouses in Chakan are Pre-Engineered Building (PEB) structures with a load bearing capacity of 5 tonnes/sq.mt. and height ranging from 9-10 metres. The rental values vary from `18 - 24/ sq.ft./ month depending on the location and quality of the warehouse.
While highway touching warehouses command higher rent, those located on internal roads are available at a relatively lower cost. Additionally, the technical aspects such as floor strength, fire safety equipment & ventilation, security, amenities and approach road among others have a direct bearing on the rent of the property. Since Chakan is largely dominated by multinational companies,
their requirement regarding the quality of warehouse and supporting infrastructure is according to global standards. This results in higher cost of construction for such warehouses, thus pushing the rentals further high. Also, rental value of built-to-suit warehouses could go higher than `23/ sq.ft./ month depending on the requirement of the occupier. Currently, the total estimated warehousing space in Chakan is in the range of 5 - 6 mn.sq.ft. Additionally, another 1 mn.sq.ft. is under construction and expected to become operational in the next 12 months.
Indicator Unit Range
Land Rate `/ acre 22,000,000 - 35,000,000
Land Rate `/ Sq.mt. 5,400 - 8,600
Rent `/ Sq.ft./ month
18 - 24
Source: Knight Frank Research
Table: Major Industries Catered to by the Chakan Warehousing Hub
Table: Road Distance and Transit Time to Important Locations from Chakan
Table: Indicative Land Rate and Rents for Warehouse Developments
71
RESEARCHINDIA LOGISTICS &
WAREHOUSING REPORT
Types of Warehouses and Industries ServicedWarehousing activity in the Chakan cluster is primarily dominated by industrial warehouses. The presence of a large number of automobile manufacturers requires vendors to either set up their manufacturing unit here or have a warehouse in proximity in order to ensure uninterrupted supply. Additionally, most of these auto companies follow the Just-in-Time (JIT) concept of production that necessitates their vendors and suppliers to be able to deliver at a very short notice. A short notice could be as little as 3-4 hours of window for delivery. This ensures constant demand for warehousing from companies that either do not have a production unit nearby or the amount of space in their plant is insufficient for storage.
Another type of warehousing that is prominent in the Chakan belt is service part distribution centre of capital goods companies. These are the companies that supply heavy machinery to other manufacturing companies that use them for further production. As any breakdown in such heavy machinery due to the normal wear and tear can disrupt the production schedule, it becomes essential for these capital goods manufacturers to supply the spare parts within a minimal time frame. This warrants a service parts distribution centre in the vicinity of such clusters in order to maintain the steady flow of supply of such replacement parts.
LocationThe concentration of manufacturing activities around Chakan has led to the development of this region as a warehousing hub. The Talegaon-Chakan Road, that is connected with the old Mumbai-Pune Highway (NH-4) on the west and the Pune-Nashik Highway (NH-50) on the east, has witnessed
CHAKAN WAREHOUSING HUB
Industry Major Companies
Automobile Volkswagen, Bajaj Auto, Mahindra & Mahindra, Mercedes Benz
Auto Ancillary Bridgestone, Minda, Bosch, Rinder, Lucas TVS
Engineering Ross Process Equipment, Victor Gaskets, Atlas Copco
Source: Knight Frank Research
Source: Knight Frank Research
Distance from : Km. Travel time in hours
Pune city centre 32 0.5 - 1
Nearest port (JNPT) 138 3.5 - 4
Chakan MIDC 0 0
Talegaon MIDC 20 0.5 - 1
Ranjangaon MIDC 50 1 - 1.5
Sanaswadi industrial cluster 40 1 - 1.25
Shirwal industrial cluster 85 1.5 - 2
development of numerous warehouses.Additionally, the stretch from Moshi to Chakan on the Pune-Nashik Highway (NH-50) has also attracted several warehousing companies.
Rent and Quality ofWarehousesMost of the warehouses in Chakan are Pre-Engineered Building (PEB) structures with a load bearing capacity of 5 tonnes/sq.mt. and height ranging from 9-10 metres. The rental values vary from `18 - 24/ sq.ft./ month depending on the location and quality of the warehouse.
While highway touching warehouses command higher rent, those located on internal roads are available at a relatively lower cost. Additionally, the technical aspects such as floor strength, fire safety equipment & ventilation, security, amenities and approach road among others have a direct bearing on the rent of the property. Since Chakan is largely dominated by multinational companies,
their requirement regarding the quality of warehouse and supporting infrastructure is according to global standards. This results in higher cost of construction for such warehouses, thus pushing the rentals further high. Also, rental value of built-to-suit warehouses could go higher than `23/ sq.ft./ month depending on the requirement of the occupier. Currently, the total estimated warehousing space in Chakan is in the range of 5 - 6 mn.sq.ft. Additionally, another 1 mn.sq.ft. is under construction and expected to become operational in the next 12 months.
Indicator Unit Range
Land Rate `/ acre`/ acre` 22,000,000 - 35,000,000
Land Rate `/ Sq.mt.`/ Sq.mt.` 5,400 - 8,600
Rent `/ Sq.ft./ `/ Sq.ft./ `month
18 - 24
Source: Knight Frank Research
Table: Major Industries Catered to by the Chakan Warehousing Hub
Table: Road Distance and Transit Time to Important Locations from Chakan
Table: Indicative Land Rate and Rents for Warehouse Developments
72
Existing Warehousing PlayersChakan is dominated by warehousing operators that primarily cater to the manufacturing sector. Indospace Industrial & Logistics Park is one of the largest players with a development potential of more than 3.5 mn.sq.ft. While most of the existing space within Indospace Park is leased out to manufacturing companies on a built-to-suit basis, there are some logistics and 3PL players too who have leased space here. Other operators like TCI, OM Logistics and TVS Logistics have warehouses catering to the auto & auto ancillary sectors. Apart from these, there are numerous regional players operational in this cluster with warehousing space ranging from 20,000 – 100,000 sq.ft.
InfrastructureA large part of the Chakan industrial area is developed and managed by MIDC. Since MIDC is a special planning authority, units within the MIDC area have access to the infrastructure facilities provided by it in terms of power connectivity, sewerage treatment, internal roads, water supply and other common amenities. However, units outside the MIDC campus fall under the local gram panchayat area and have to invest in their own infrastructure. Although power and water is supplied by the government agencies, construction of internal roads and sewerage treatment plants need huge investments.
Chakan is connected with the old Mumbai Pune Highway (NH-4) and Pune Nashik Highway (NH-50) by a
Warehouse Operators
Indospace
TCI
ABHI Impact Logistics
OM Logistics
TVS Logistics
Baphana Warehousing
Source: Knight Frank Research
The rapid urbanisation being witnessed around Chakan, Talegaon and Moshi could tilt the preference of land owners towards residential development in the distant future. This could pose a serious threat to warehousing activity
two lane state highway known as the Talegaon-Chakan Highway. Although this road is narrower compared to the national highways, multiple exit and entry points to the MIDC keeps it relatively free flowing without any major traffic congestion. Additionally, a large number of warehouses are located on the Pune-Nashik Highway (NH-50) which is a four-lane road with divider. Internal roads in non-MIDC areas within this cluster are in a relatively poor condition.
The upcoming Pune Ring Road on the periphery of Pune city will provide a major boost to the heavy vehicles as it will bypass the city traffic once constructed. The ring road will connect the Mumbai-Pune Highway (NH-4), Pune-Nashik Highway (NH-50), Pune-Ahmednagar Highway, Pune-Solapur Highway (NH-9) and the Pune-Bengaluru Highway (NH-4). As the alignment of this road is through Chakan, warehousing activity in this cluster will benefit immensely on the back of this road. However, the project is still at the conceptualization stage and will take another 4-5 years to become fully operational.
Competitive AdvantageThe biggest competitive advantage of this cluster is the location of two major MIDCs in its vicinity namely Chakan MIDC and Talegaon MIDC. Additionally, it is also very well connected with the Ranjangaon MIDC and Sanaswadi industrial area which are at a distance of 50 km. and 40 km. respectively.
Hence, a warehouse in Chakan is within an hour’s drive from four major manufacturing hubs of western India. Apart from this, JNPT and three major cities of Maharashtra namely Mumbai, Nashik and Ahmednagar are linked via highways from Chakan.
Another advantage is the availability of talent pool due to the large number of educational institutes present in Pune. Also, affordable residential development around Pimpri, Chinchwad, Moshi and Chikhali of north Pune has ensured availability of skilled and semi-skilled labour.
Table: Warehouse Operators
73
RESEARCHINDIA LOGISTICS &
WAREHOUSING REPORT
OutlookChakan is expected to further consolidate its position as a manufacturing hub with the MIDC expanding its area beyond the existing cluster. Additionally, the
ChallengesLand availability is the biggest challenge in Chakan as the real estate cost has already shot up drastically during the last couple of years. With land rates of highway touching properties on the Talegaon-Chakan Highway already breaching `22 mn./ acre, the viability of warehousing activity within this cluster is questionable. Land cost above `20 mn./ acre could render warehousing activity unaffordable as the implied rent could breach the already inflated rate of `20/ sq.ft./ month. Although the official rate for industrial plots in Chakan MIDC is `3,325/ sq.mt., there are very few vacant plots available. The market rate for similar plots is anywhere in the range of `5,400 – 8,600/ sq.mt. Such a trend could eventually compel warehouse operators to shift to alternative locations within the industrial hub.
Scarcity of land has paved the way for innovative deals between the land owners and warehouse operator/ occupier. The warehouse operator/ occupier pays 18-20 months’ rent in advance to the land owner who uses this money for constructing the warehouse. This helps both the parties as the operator/ occupier is able to keep his balance sheet light by not capitalising the asset and the land owner gets construction funding in terms of advance. Although such a model ensures a built-to-suit property for the operator/ occupier, he runs the risk of facing delays in delivery.
Another challenge is the gradual expansion of Pune’s urban area. Although Chakan is around 30 km. north of Pune city centre, the rapid urbanisation being witnessed around Chakan, Talegaon and Moshi could tilt the preference of land owners towards residential development in the distant future. This could pose a serious threat to warehousing activity as viability of non-MIDC land will reduce further due to better remuneration from residential development.
Source: Knight Frank Research
Table: Legal Framework
Indicator Details
Land use norms:
MIDC land No conversion is required as it is already converted to industrial land by MIDC
Non-MIDC land As most of the vacant land is agricultural, it has to be converted to commercial use through the local gram panchayat
Construction permit:
MIDC land MIDC
Non-MIDC land Local gram panchayat
Maximum ground coverage:
MIDC land 0.5 for MIDC land
Non-MIDC land As decided by the local gram panchayat
Local Body Tax (LBT) Not applicable as Chakan is outside municipal limits
presence of various automobile majors will continue to attract auto ancillary and engineering sector companies. With rising land rates and unaffordable rentals, warehouses are expected to gradually move towards the periphery of the Talegaon-Chakan Highway. Warehouse rents within Chakan have already moved beyond `20/ sq.ft./ month and any further increase could render such activity unviable. Besides, demand for industrial land from the manufacturing sector could pose a challenge to warehousing activity as the threshold of paying rent by manufacturing units is comparatively higher. Additionally, the rapid development of residential projects in the vicinity could threaten the feasibility of warehouse operations in the area.
Going forward, construction of the Pune International Airport near Chakan could pose as a serious threat to warehousing activity in this region. Airport development could lead to a sharp appreciation of land prices in the adjoining localities and this could further push rent expectation of land owners. Although the airport project is still at a very nascent stage with the final site yet to be decided, the explicit intention of the state government to locate the project near Chakan could pose a challenge to warehousing activity in the coming years.
Land cost forms the most critical component of warehousing development and influences the realisable return to a great extent. The adjoining feasible land cost matrix for warehousing explains the feasible land cost in Chakan that an investor should ideally pay in order to achieve an expected return in the range of 12%-24% per annum. For example, with a return expectation of 16% per annum and an expected annual rental growth rate of 3%, the feasible land cost comes to `27 mn./ acre. In other words, an investor can fetch 16% per annum return only if he is able to purchase land at or below ` 27 mn./ acre today. As the purchase price of land goes higher, the realisable return reduces. Similarly, as the expected annual rental growth increases, the feasibility of higher cost land also goes up.
The warehouse rent in Chakan is in the range of `18-24/ sq.ft./ month. If an investor with a return expectation of 20% develops a warehouse and achieves a rent of `20/ sq.ft./ month and an annual escalation of 5%, the feasible land cost is `25 mn./ acre. Since the current asking land rate in Chakan is between `22 – 35 mn./ acre, it is feasible to develop a warehouse here at the lower-end of the range. However, achieving a 5% per annum rental growth may be difficult in
73
RESEARCHINDIA LOGISTICS &
WAREHOUSING REPORT
OutlookChakan is expected to further consolidate its position as a manufacturing hub with the MIDC expanding its area beyond the existing cluster. Additionally, the
ChallengesLand availability is the biggest challenge in Chakan as the real estate cost has already shot up drastically during the last couple of years. With land rates of highway touching properties on the Talegaon-Chakan Highway already breaching `22 mn./ acre, the viability of warehousing activity within this cluster is questionable. Land cost above `20 mn./ acre could render warehousing activity unaffordable as the implied rent could breach the already inflated rate of `20/ sq.ft./ month. Although the official rate for industrial plots in Chakan MIDC is`3,325/ sq.mt., there are very few vacant plots available. The market rate for similar plots is anywhere in the range of `5,400 – 8,600/ sq.mt. Such a trend could eventually compel warehouse operators to shift to alternative locations within the industrial hub.
Scarcity of land has paved the way for innovative deals between the land owners and warehouse operator/ occupier. The warehouse operator/ occupier pays 18-20 months’ rent in advance to the land owner who uses this money for constructing the warehouse. This helps both the parties as the operator/ occupier is able to keep his balance sheet light by not capitalising the asset and the land owner gets construction funding in terms of advance. Although such a model ensures a built-to-suit property for the operator/ occupier, he runs the risk of facing delays in delivery.
Another challenge is the gradual expansion of Pune’s urban area. Although Chakan is around 30 km. north of Pune city centre, the rapid urbanisation being witnessed around Chakan, Talegaon and Moshi could tilt the preference of land owners towards residential development in the distant future. This could pose a serious threat to warehousing activity as viability of non-MIDC land will reduce further due to better remuneration from residential development.
Source: Knight Frank Research
Table: Legal Framework
Indicator Details
Land use norms:
MIDC land No conversion is required as it is already converted to industrial land by MIDC
Non-MIDC land As most of the vacant land is agricultural, it has to be converted to commercial use through the local gram panchayat
Construction permit:
MIDC land MIDC
Non-MIDC land Local gram panchayat
Maximum ground coverage:
MIDC land 0.5 for MIDC land
Non-MIDC land As decided by the local gram panchayat
Local Body Tax (LBT) Not applicable as Chakan is outside municipal limits
presence of various automobile majors will continue to attract auto ancillary and engineering sector companies. With rising land rates and unaffordable rentals, warehouses are expected to gradually move towards the periphery of the Talegaon-Chakan Highway. Warehouse rents within Chakan have already moved beyond `20/ sq.ft./ month and any further increase could render such activity unviable. Besides, demand for industrial land from the manufacturing sector could pose a challenge to warehousing activity as the threshold of paying rent by manufacturing units is comparatively higher. Additionally, the rapid development of residential projects in the vicinity could threaten the feasibility of warehouse operations in the area.
Going forward, construction of the Pune International Airport near Chakan could pose as a serious threat to warehousing activity in this region. Airport development could lead to a sharp appreciation of land prices in the adjoining localities and this could further push rent expectation of land owners. Although the airport project is still at a very nascent stage with the final site yet to be decided, the explicit intention of the state government to locate the project near Chakan could pose a challenge to warehousing activity in the coming years.
Land cost forms the most critical component of warehousing development and influences the realisable return to a great extent. The adjoining feasible land cost matrix for warehousing explains the feasible land cost in Chakan that an investor should ideally pay in order to achieve an expected return in the range of 12%-24% per annum. For example, with a return expectation of 16% per annum and an expected annual rental growth rate of 3%, the feasible land cost comes to `27 mn./ acre. In other words, an investor can fetch 16% per annum return only if he is able to purchase land at or below ` 27 mn./ acre today. As the purchase price of land goes higher, the realisable return reduces. Similarly, as the expected annual rental growth increases, the feasibility of higher cost land also goes up.
The warehouse rent in Chakan is in the range of `18-24/ sq.ft./ month. If an investor with a return expectation of 20% develops a warehouse and achieves a rent of `20/ sq.ft./ month and an annual escalation of 5%, the feasible land cost is `25 mn./ acre. Since the current asking land rate in Chakan is between `22 – 35 mn./ acre, it is feasible to develop a warehouse here at the lower-end of the range. However, achieving a 5% per annum rental growth may be difficult in
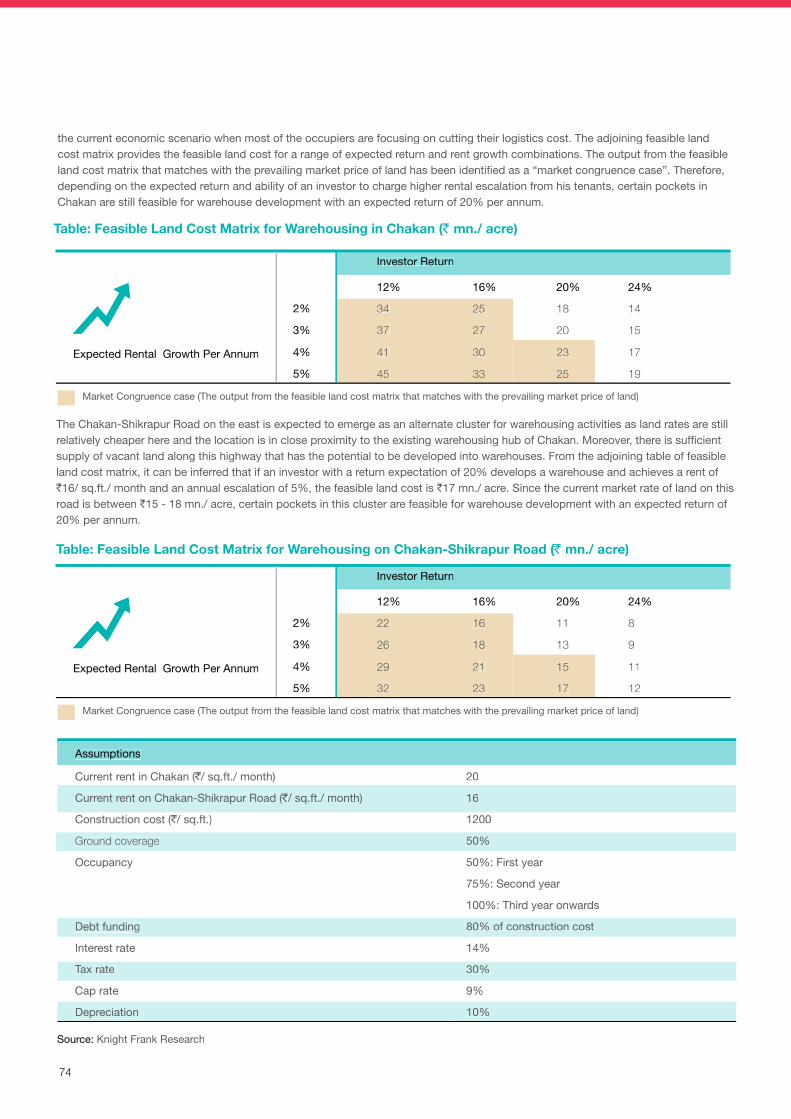
74
Assumptions
Current rent in Chakan (`/ sq.ft./ month) 20
Current rent on Chakan-Shikrapur Road (`/ sq.ft./ month) 16
Construction cost (`/ sq.ft.) 1200
Ground coverage 50%
Occupancy 50%: First year
75%: Second year
100%: Third year onwards
Debt funding 80% of construction cost
Interest rate 14%
Tax rate 30%
Cap rate 9%
Depreciation 10%
Source: Knight Frank Research
Table: Feasible Land Cost Matrix for Warehousing in Chakan (` mn./ acre)
Table: Feasible Land Cost Matrix for Warehousing on Chakan-Shikrapur Road (` mn./ acre)
The Chakan-Shikrapur Road on the east is expected to emerge as an alternate cluster for warehousing activities as land rates are still relatively cheaper here and the location is in close proximity to the existing warehousing hub of Chakan. Moreover, there is sufficient supply of vacant land along this highway that has the potential to be developed into warehouses. From the adjoining table of feasible land cost matrix, it can be inferred that if an investor with a return expectation of 20% develops a warehouse and achieves a rent of `16/ sq.ft./ month and an annual escalation of 5%, the feasible land cost is `17 mn./ acre. Since the current market rate of land on this road is between `15 - 18 mn./ acre, certain pockets in this cluster are feasible for warehouse development with an expected return of 20% per annum.
Expected Rental Growth Per Annum
Investor Return
12% 16% 20% 24%
2% 34 25 18 14
3% 37 27 20 15
4% 41 30 23 17
5% 45 33 25 19
Expected Rental Growth Per Annum
Investor Return
12% 16% 20% 24%
2% 22 16 11 8
3% 26 18 13 9
4% 29 21 15 11
5% 32 23 17 12
Market Congruence case (The output from the feasible land cost matrix that matches with the prevailing market price of land)
Market Congruence case (The output from the feasible land cost matrix that matches with the prevailing market price of land)
the current economic scenario when most of the occupiers are focusing on cutting their logistics cost. The adjoining feasible land cost matrix provides the feasible land cost for a range of expected return and rent growth combinations. The output from the feasible land cost matrix that matches with the prevailing market price of land has been identified as a “market congruence case”. Therefore, depending on the expected return and ability of an investor to charge higher rental escalation from his tenants, certain pockets in Chakan are still feasible for warehouse development with an expected return of 20% per annum.
74
Assumptions
Current rent in Chakan (`Current rent in Chakan (`Current rent in Chakan ( / sq.ft./ month)`/ sq.ft./ month)` 20
Current rent on Chakan-Shikrapur Road (`Current rent on Chakan-Shikrapur Road (`Current rent on Chakan-Shikrapur Road ( / sq.ft./ month)`/ sq.ft./ month)` 16
Construction cost (`Construction cost (`Construction cost ( / sq.ft.)`/ sq.ft.)` 1200
Ground coverage 50%
Occupancy 50%: First year
75%: Second year
100%: Third year onwards
Debt funding 80% of construction cost
Interest rate 14%
Tax rate 30%
Cap rate 9%
Depreciation 10%
Source: Knight Frank Research
Table: Feasible Land Cost Matrix for Warehousing in Chakan (` Table: Feasible Land Cost Matrix for Warehousing in Chakan (` Table: Feasible Land Cost Matrix for Warehousing in Chakan ( mn./ acre)
Table: Feasible Land Cost Matrix for Warehousing on Chakan-Shikrapur Road (` Table: Feasible Land Cost Matrix for Warehousing on Chakan-Shikrapur Road (` Table: Feasible Land Cost Matrix for Warehousing on Chakan-Shikrapur Road ( mn./ acre)
The Chakan-Shikrapur Road on the east is expected to emerge as an alternate cluster for warehousing activities as land rates are still relatively cheaper here and the location is in close proximity to the existing warehousing hub of Chakan. Moreover, there is sufficient supply of vacant land along this highway that has the potential to be developed into warehouses. From the adjoining table of feasible land cost matrix, it can be inferred that if an investor with a return expectation of 20% develops a warehouse and achieves a rent of `16/ sq.ft./ month and an annual escalation of 5%, the feasible land cost is `17 mn./ acre. Since the current market rate of land on this road is between `15 - 18 mn./ acre, certain pockets in this cluster are feasible for warehouse development with an expected return of 20% per annum.
Expected Rental Growth Per Annum
Investor Return
12% 16% 20% 24%
2% 34 25 18 14
3% 37 27 20 15
4% 41 30 23 17
5% 45 33 25 19
Expected Rental Growth Per Annum
Investor Return
12% 16% 20% 24%
2% 22 16 11 8
3% 26 18 13 9
4% 29 21 15 11
5% 32 23 17 12
Market Congruence case (The output from the feasible land cost matrix that matches with the prevailing market price of land)
Market Congruence case (The output from the feasible land cost matrix that matches with the prevailing market price of land)
the current economic scenario when most of the occupiers are focusing on cutting their logistics cost. The adjoining feasible land cost matrix provides the feasible land cost for a range of expected return and rent growth combinations. The output from the feasible land cost matrix that matches with the prevailing market price of land has been identified as a “market congruence case”. Therefore, depending on the expected return and ability of an investor to charge higher rental escalation from his tenants, certain pockets in Chakan are still feasible for warehouse development with an expected return of 20% per annum.

75
RESEARCHINDIA LOGISTICS &
WAREHOUSING REPORT
Source: Knight Frank Research
WAGHOLI-LONIKAND AND SANASWADIWAREHOUSING CLUSTERTypes of Warehouses and Industries ServicedHistorically, warehousing activities in Pune have been concentrated in Wagholi with a large number of warehouses mushrooming here post 1995. These warehouses were primarily serving the Pune consumption market acting as the regional retail distribution centres. Since most of the development around Wagholi happened before 2005, the area is dominated by RCC type structures with poor supporting infrastructure and amenities. Most of these warehouses are owned/ operated by local players and are much smaller in size compared to those in Chakan or Bhiwandi. Post 2005, Wagholi witnessed large scale residential development due to its proximity to the city centre and employment hubs of Kharadi and Hadapsar. Capital value of residential projects in Wagholi has appreciated substantially during the last five years with the on-going quoted rate hovering around 3,500 - 4,200/ sq.ft. making it much more remunerative for land owners to opt for residential development instead of warehousing. Such a trend has resulted in a gradual exodus of warehouses further east on the Pune-Ahmednagar Highway towards Lonikand and Sanaswadi.
Lonikand and Sanaswadi are home to a large number of engineering and auto ancillary companies and these markets are slowly emerging as alternate warehousing clusters to Wagholi. Lower land prices, absence of residential development and presence of manufacturing majors like John Deere, Tranter, Kalyani Forge and Comau India among others have attracted the interest of warehouse developers/ occupiers. The warehouses located here are a mix of industrial warehouses and retail distribution centres.
Table: Major Industries Catered by the Wagholi-Lonikand-Sanaswadi Warehousing Hub
Table: Road Distance and Transit Time to Important Locations
Industry Major Companies
Engineering Tranter, Yamazaki Mazak, FEMCO India, SECO Tools, Praj Industries, Kalyani Forge, Comau India
Auto Ancillary Visteon Automotives, Bright Autoplast, Craftsman Automation, ZF Lenksysteme
Automobile John Deere
Source: Knight Frank Research
Distance from Km. Travel time in hours
Pune city centre 34 0.5 - 1
Nearest port (JNPT) 170 4 - 4.5
Lonikand-Sanaswadi industrial cluster
0 0
Chakan MIDC 40 1 - 1.5
Talegaon MIDC 60 1.5 - 2
Ranjangaon MIDC 22 0.25 - 0.5
Shirwal industrial cluster 80 1.5 - 2
Rent and Quality of WarehousesThe Wagholi-Lonikand-Sanaswadi cluster has a mix of retail distribution centres and industrial warehouses. While
Wagholi has a higher concentration of retail distribution centres due to its proximity to the city centre, Lonikand and Sanaswadi are dominated by industrial warehouses. Additionally, the quality of warehouses in Wagholi is comparatively inferior to those in Lonikand and Sanaswadi as most of the construction activity in the area took place before 2005. Many of these structures resemble the erstwhile godowns with poor flooring, ventilation, lightning and fire fighting systems. In contrast to this, the warehouses in Lonikand and Sanaswadi are relatively new PEB structures with higher load bearing capacity and height ranging between 8-10 metres.
The rental value is highest in Wagholi and decreases gradually as one moves towards Lonikand and Sanaswadi. This is primarily because of the high cost of land in Wagholi. However, due to the relatively
LocationThe Wagholi-Lonikand-Sananswadi warehousing cluster is located in the north eastern part of Pune along the Pune-Ahmednagar Highway more commonly referred to as the Nagar Road. Warehouses are scattered across the entire 16-20 km. stretch starting from Wagholi till Sanaswadi. However, Wagholi, Lonikand and Sanaswadi have the highest concentration of warehouses along this belt. Lonikand and Sananswadi are at a distance of 8 km. and 16 km. respectively from Wagholi.
75
RESEARCHINDIA LOGISTICS &
WAREHOUSING REPORT
Source: Knight Frank Research
WAGHOLI-LONIKAND AND SANASWADIWAREHOUSING CLUSTERTypes of Warehouses and Industries ServicedHistorically, warehousing activities in Pune have been concentrated in Wagholi with a large number of warehouses mushrooming here post 1995. These warehouses were primarily serving the Pune consumption market acting as the regional retail distribution centres. Since most of the development around Wagholi happened before 2005, the area is dominated by RCC type structures with poor supporting infrastructure and amenities. Most of these warehouses are owned/ operated by local players and are much smaller in size compared to those in Chakan or Bhiwandi. Post 2005, Wagholi witnessed large scale residential development due to its proximity to the city centre and employment hubs of Kharadi and Hadapsar. Capital value of residential projects in Wagholi has appreciated substantially during the last five years with the on-going quoted rate hovering around 3,500 - 4,200/ sq.ft. making it much more remunerative for land owners to opt for residential development instead of warehousing. Such a trend has resulted in a gradual exodus of warehouses further east on the Pune-Ahmednagar Highway towards Lonikand and Sanaswadi.
Lonikand and Sanaswadi are home to a large number of engineering and auto ancillary companies and these markets are slowly emerging as alternate warehousing clusters to Wagholi. Lower land prices, absence of residential development and presence of manufacturing majors like John Deere, Tranter, Kalyani Forge and Comau India among others have attracted the interest of warehouse developers/ occupiers. The warehouses located here are a mix of industrial warehouses and retail distribution centres.
Table: Major Industries Catered by the Wagholi-Lonikand-Sanaswadi Warehousing Hub
Table: Road Distance and Transit Time to Important Locations
Industry Major Companies
Engineering Tranter, Yamazaki Mazak, FEMCO India, SECO Tools, Praj Industries, Kalyani Forge, Comau India
Auto Ancillary Visteon Automotives, Bright Autoplast, Craftsman Automation, ZF Lenksysteme
Automobile John Deere
Source: Knight Frank Research
Distance from Km. Travel time in hours
Pune city centre 34 0.5 - 1
Nearest port (JNPT) 170 4 - 4.5
Lonikand-Sanaswadi industrial cluster
0 0
Chakan MIDC 40 1 - 1.5
Talegaon MIDC 60 1.5 - 2
Ranjangaon MIDC 22 0.25 - 0.5
Shirwal industrial cluster 80 1.5 - 2
Rent and Quality of WarehousesThe Wagholi-Lonikand-Sanaswadi cluster has a mix of retail distribution centres and industrial warehouses. While
Wagholi has a higher concentration of retail distribution centres due to its proximity to the city centre, Lonikand and Sanaswadi are dominated by industrial warehouses. Additionally, the quality of warehouses in Wagholi is comparatively inferior to those in Lonikand and Sanaswadi as most of the construction activity in the area took place before 2005. Many of these structures resemble the erstwhile godowns with poor flooring, ventilation, lightning and fire fighting systems. In contrast to this, the warehouses in Lonikand and Sanaswadi are relatively new PEB structures with higher load bearing capacity and heightranging between 8-10 metres.
The rental value is highest in Wagholi and decreases gradually as one moves towards Lonikand and Sanaswadi. This is primarily because of the high cost of land in Wagholi. However, due to the relatively
LocationThe Wagholi-Lonikand-Sananswadi warehousing cluster is located in the north eastern part of Pune along the Pune-Ahmednagar Highway more commonly referred to as the Nagar Road. Warehouses are scattered across the entire 16-20 km. stretch starting from Wagholi till Sanaswadi. However, Wagholi, Lonikand and Sanaswadi have the highest concentration of warehouses along this belt. Lonikand and Sananswadi are at a distance of 8 km. and 16 km. respectively from Wagholi.
76
better quality of construction in Lonikand and Sanaswadi, the rental value of a large chunk of warehouses is equally high in these locations too. In fact some of the old godown type structures in Wagholi quote a much lower rent despite being located on an expensive piece of land due to their poor quality of construction and lack of supporting infrastructure. Hence, depending on the location and quality of construction, the rental value in this cluster ranges from `14 - 18/ sq.ft./ month. However, rent for built-to-suit structures with higher quality of construction and better amenities could go beyond `18/sq.ft./month.
Currently, the total estimated warehousing space in the Wagholi-Lonikand-Sanaswadi cluster is in the range of 4 - 5 mn.sq.ft with another 0.5 mn.sq.ft. expected to become operational in the next 8 months.
InfrastructureUnlike Chakan, the Wagholi-Lonikand-Sanaswadi belt has not been developed by the MIDC and the manufacturing units located here have been primarily developed on private land. This has led to sporadic development on both sides of the entire 16 km. stretch with no common infrastructure facilities. The Pune-Ahmednagar Highway is a four-lane road connecting to Ranjangaon in the east and Chakan in the north-west via the Chakan-Shikrapur Road. It is also connected with the Pune-Nashik Highway (NH-50) through the Alandi-Markal Road which is a two-lane road passing through Phulgaon and Alandi. Although the quality of this road is relatively poor as compared to the Pune-Ahmednagar Highway, it is a shorter route from Lonikand towards Chakan. The traffic on these roads is usually fast moving except for certain junctions near Wagholi due to the presence of various residential projects here.
The upcoming Pune Ring Road is expected to further boost the connectivity of this hub with all the major highways on the periphery of Pune. The ring road will connect Wagholi with the Pune-Nashik Highway (NH-50), Mumbai-Pune Highway (NH-4), Pune-Solapur Highway (NH-9) and Pune-Bengaluru Highway (NH-4) thereby giving an easy access to cities like Nashik, Mumbai, Solapur and Kolhapur. As the alignment of this road is through Wagholi, warehousing activity in this cluster will benefit immensely on the back of this road. However, the project is still at the conceptualisation stage and will take another 4-5 years to become fully operational.
Indicator Unit Range
Land Rate `/ acre 19,000,000 - 38,000,000
Land Rate `/ sq.mt. 4,400 - 9,400
Rent `/ Sq.ft./ month
14 - 18
Source: Knight Frank Research
Source: Knight Frank Research
Warehouse Operators
Phoenix Warehousing
Sanghvi
ABHI Impact Logistics
Storewell Warehousing
Chamadia Group
Baphana Warehousing
Competitive AdvantageThe biggest advantage of the Wagholi-Lonikand-Sanaswadi warehousing cluster is its proximity to the city centre. Wagholi is located barely 16-18 km. from the Pune railway station and 10-12 km. from the prominent retail destinations of the city. The travel time taken for the last mile distribution to the various parts of the city is less than an hours’ drive from Wagholi, thereby increasing its attractiveness. Additionally, the connectivity with major industrial hubs of Sanaswadi, Ranjangaon and Chakan is excellent from this cluster as these hubs are located at a drivable distance of 5 minutes, 30 minutes and 60 minutes respectively. With the completion of the proposed Pune Ring Road in another 4-5 years, travel time to the Pune-Solapur Highway (NH-9) and Pune-Bengaluru Highway (NH-4) will also reduce significantly. This will provide an inherent competitive advantage for industrial warehousing activity in this cluster as all the major manufacturing hubs are easily accessible from here.
ChallengesExpansion of municipal limit by the Pune Municipal Corporation (PMC) beyond Wagholi could pose a serious challenge to warehouse developers as the already high cost of land could inch up further. Additionally, the Development Plan (DP) of the PMC could restrict the zoning of this cluster to residential development thereby forcing warehouses to relocate further north east in the coming years. Wagholi is already witnessing such a trend with residential projects rapidly replacing erstwhile warehouses. While Lonikand and Sanaswadi have substituted Wagholi as the new warehousing hubs in the last 4-5 years, it is only a matter of time that these areas will witness a similar type of urbanisation leading to further exodus of warehousing activities.
The current rental range of `14 - 18/sq.ft./ month for warehousing activity within this cluster is already very steep for retail distribution centres as compared to similar markets in Bhiwandi, Mumbai.
Existing Warehousing PlayersThe entire belt of Wagholi-Lonikand-Sanaswadi is dotted by numerous regional and local warehousing players with the absence of any major national player. While Wagholi is dominated by smaller warehouses catering to the retail distribution segment, warehouses in Lonikand and Sananswadi are relatively larger in size, primarily catering to the industrial segment. Majority of the warehouses located here are in the range of 5,000 - 50,000 sq.ft. Most of these warehouses are occupied by 3PL and logistics companies that cater to the needs of regional distribution centres of retail companies.
Table: Indicative Land Rate and Rents for Warehouse Developments
Table: Warehouse Operators
76
better quality of construction in Lonikand and Sanaswadi, the rental value of a large chunk of warehouses is equally high in these locations too. In fact some of the old godown type structures in Wagholi quote a much lower rent despite being located on an expensive piece of land due to their poor quality of construction and lack of supporting infrastructure. Hence, depending on the location and quality of construction, the rental value in this cluster ranges from `14 - 18/ sq.ft./ month. However, rent for built-to-suit structures with higher quality of construction and better amenities could go beyond `18/sq.ft./month.
Currently, the total estimated warehousing space in the Wagholi-Lonikand-Sanaswadi cluster is in the range of 4 - 5 mn.sq.ft with another 0.5 mn.sq.ft. expected to become operational in the next 8 months.
InfrastructureUnlike Chakan, the Wagholi-Lonikand-Sanaswadi belt has not been developed by the MIDC and the manufacturing units located here have been primarily developed on private land. This has led to sporadic development on both sides of the entire 16 km. stretch with no common infrastructure facilities. The Pune-Ahmednagar Highway is a four-lane road connecting to Ranjangaon in the east and Chakan in the north-west via the Chakan-Shikrapur Road. It is also connected with the Pune-Nashik Highway (NH-50) through the Alandi-Markal Road which is a two-lane road passing through Phulgaon and Alandi. Although the quality of this road is relatively poor as compared to the Pune-Ahmednagar Highway, it is a shorter route from Lonikand towards Chakan. The traffic on these roads is usually fast moving except for certain junctions near Wagholi due to the presence of various residential projects here.
The upcoming Pune Ring Road is expected to further boost the connectivity of this hub with all the major highways on the periphery of Pune. The ring road will connect Wagholi with the Pune-Nashik Highway (NH-50), Mumbai-Pune Highway (NH-4), Pune-Solapur Highway (NH-9) and Pune-Bengaluru Highway (NH-4) thereby giving an easy access to cities like Nashik, Mumbai, Solapur and Kolhapur. As the alignment of this road is through Wagholi, warehousing activity in this cluster will benefit immensely on the back of this road. However, the project is still at the conceptualisation stage and will take another 4-5 years to become fully operational.
Indicator Unit Range
Land Rate `/ acre`/ acre` 19,000,000 - 38,000,000
Land Rate `/ sq.mt.`/ sq.mt.` 4,400 - 9,400
Rent `/ Sq.ft./ `/ Sq.ft./ `month
14 - 18
Source: Knight Frank Research
Source: Knight Frank Research
Warehouse Operators
Phoenix Warehousing
Sanghvi
ABHI Impact Logistics
Storewell Warehousing
Chamadia Group
Baphana Warehousing
Competitive AdvantageThe biggest advantage of the Wagholi-Lonikand-Sanaswadi warehousing cluster is its proximity to the city centre. Wagholi is located barely 16-18 km. from the Pune railway station and 10-12 km. from the prominent retail destinations of the city. The travel time taken for the last mile distribution to the various parts of the city is less than an hours’ drive from Wagholi, thereby increasing its attractiveness. Additionally, the connectivity with major industrial hubs of Sanaswadi, Ranjangaon and Chakan is excellent from this cluster as these hubs are located at a drivable distance of 5 minutes, 30 minutes and 60 minutes respectively. With the completion of the proposed Pune Ring Road in another 4-5 years, travel time to the Pune-Solapur Highway (NH-9) and Pune-Bengaluru Highway (NH-4) will also reduce significantly. This will provide an inherent competitive advantage for industrial warehousing activity in this cluster as all the major manufacturing hubs are easily accessible from here.
ChallengesExpansion of municipal limit by the Pune Municipal Corporation (PMC) beyond Wagholi could pose a serious challenge to warehouse developers as the already high cost of land could inch up further. Additionally, the Development Plan (DP) of the PMC could restrict the zoning of this cluster to residential development thereby forcing warehouses to relocate further north east in the coming years. Wagholi is already witnessing such a trend with residential projects rapidly replacing erstwhile warehouses. While Lonikand and Sanaswadi have substituted Wagholi as the new warehousing hubs in the last 4-5 years, it is only a matter of time that these areas will witness a similar type of urbanisation leading to further exodus of warehousing activities.
The current rental range of The current rental range of The current rental range of `14 - 18/sq.ft./ month for warehousing activity within this cluster is already very steep for retail distribution centres as compared to similar markets in Bhiwandi, Mumbai.
Existing Warehousing PlayersThe entire belt of Wagholi-Lonikand-Sanaswadi is dotted by numerous regional and local warehousing players with the absence of any major national player. While Wagholi is dominated by smaller warehouses catering to the retail distribution segment, warehouses in Lonikand and Sananswadi are relatively larger in size, primarily catering to the industrial segment. Majority of the warehouses located here are in the range of 5,000 - 50,000 sq.ft. Most of these warehouses are occupied by 3PL and logistics companies that cater to the needs of regional distribution centres of retail companies.
Table: Indicative Land Rate and Rents for Warehouse Developments
Table: Warehouse Operators
77
RESEARCHINDIA LOGISTICS &
WAREHOUSING REPORT
Indicator Details
Land use norms As most of the vacant land is agricultural, it has to be converted to commercial use through the local gram panchayat
Construction permit Local gram panchayat
Maximum ground coverage
As decided by the local gram panchayat
Local Body Tax (LBT) Not applicable as the cluster is outside municipal limits
Source: Knight Frank Research
Table: Legal Framework
OutlookThe location of a retail distribution centre is primarily driven by the urban centres it services apart from rental and transportation cost. As India prepares to move towards a GST regime, consolidation of such warehouses is inevitable in the coming future. Since Pune is only a 3-4 hours drive from Mumbai, any move towards such consolidation is expected to shift the retail distribution activities in favour of locations closer to Mumbai. With rentals in Bhiwandi quoting much lower rates than the Wagholi-Lonikand-Sanaswadi cluster, it would make more sense for retail companies to make Bhiwandi the regional hub and supply to the Pune market from here. Additionally, the sheer size of the Mumbai retail market skews the need for locating a regional distribution centre here instead of Pune. Such a trend could eventually limit the need for having a separate distribution centre in Pune in the coming years and restrict the growth of such centres in the Wagholi-Lonikand-Sanaswadi cluster.
Contrary to retail distribution centres, demand for industrial warehousing is expected to remain strong in this cluster as manufacturing companies from the engineering and auto ancillary sectors continue to prefer locating here. Additionally, the accessibility to Ranjangaon MIDC and Chakan MIDC will work in favour of this belt due to its central location. The proposed Pune Ring Road will further boost the attractiveness of this belt as it will connect the
The warehousing rentals in Bhiwandi today are in the range of `9 - 15/ sq.ft./ month. Although location of retail distribution centres is dependent upon multiple factors such as transportation cost, proximity to retail markets, quality of warehouse, supporting infrastructure and availability of manpower among others, the most critical factor is the rental cost. Even a small difference in rents can have an overbearing effect on the choice of location. Since rents in the Wagholi-Lonikand-Sanaswadi cluster are already higher than Bhiwandi, any further increase could drive away the retail distribution warehousing business from here.
Pune-Solapur Highway (NH-9) and Pune-Bengaluru Highway (NH-4) with Wagholi. Hence, the profile of warehouse occupiers is expected to gradually shift towards industrial warehouses from retail distribution centres.
The rapid urbanisation of this belt could put further pressure on land rates and render warehousing an unviable activity here. With rental value in certain warehouses already touching `18/ sq.ft./ month, it is only a matter of time that occupiers will begin scouting for alternate cheaper locations. Unlike Chakan, where there is a designated government planning authority (MIDC) that restricts the land use to industrial activities, development of the Wagholi-Lonikand-Sanaswadi cluster has primarily taken place on private land. This could tilt the preference of land owners towards residential development if such an opportunity presents itself in the near future. This scenario could open up the possibility of warehousing activities shifting towards the Chakan-Shikrapur Road in the north. While the cost of land is relatively cheaper here, they share similar characteristics with the Wagholi-Lonikand-Sanaswadi cluster in terms of connectivity and could emerge as an alternate warehousing hub in the coming years.
Land cost forms the most critical component of warehousing development and influences the realisable return to a great extent. The adjoining table explains the feasible land cost in the Wagholi-Lonikand-Sanaswadi cluster that an investor should ideally pay in order to achieve an expected return of 12%-24% per annum. For example, with a return expectation of 16% per annum and an
expected annual rental growth rate of 3%, the feasible land cost comes to `18 mn./ acre. In other words, an investor can fetch 16% per annum return only if he is able to purchase land today at or below `18 mn./ acre. As the purchase price of land goes higher, the realisable return reduces. Similarly, as the expected annual rental growth increases, the feasibility of higher cost land also goes up.
The warehouse rent in the Wagholi-Lonikand-Sanaswadi cluster is in the range of `14-18/ sq.ft./ month. If an investor with a return expectation of 16% develops a warehouse and achieves a rent of `16/ sq.ft./ month and an annual escalation of 5%, the feasible land cost is `23 mn./ acre. Since the current asking land rates in this cluster are between `19 -38 mn./ acre, it is feasible to develop a warehouse here at the lower-end of the range. However, achieving a 5% per annum rental growth may be difficult in the current economic scenario when most of the occupiers are focusing on cutting their logistics cost. The adjoining feasible land cost matrix provides the feasible land cost for a range of expected return and rent growth combinations. The output from the feasible land cost matrix that matches with the prevailing market price of land has been identified as a “market congruence case”. Therefore, depending on the expected return and ability of an investor to charge higher rental escalation from his tenants, certain pockets in the Wagholi-Lonikand-Sanaswadi cluster are still feasible for warehouse development at an expected return of 16% per annum. However, achieving investor return above 16% per annum may not be possible considering the current land rates in this cluster.
77
RESEARCHINDIA LOGISTICS &
WAREHOUSING REPORT
Indicator Details
Land use norms As most of the vacant land is agricultural, it has to be converted to commercial use through the local gram panchayat
Construction permit Local gram panchayat
Maximum ground coverage
As decided by the local gram panchayat
Local Body Tax (LBT) Not applicable as the cluster is outside municipal limits
Source: Knight Frank Research
Table: Legal Framework
OutlookThe location of a retail distribution centre is primarily driven by the urban centres it services apart from rental and transportation cost. As India prepares to move towards a GST regime, consolidation of such warehouses is inevitable in the coming future. Since Pune is only a 3-4 hours drive from Mumbai, any move towards such consolidation is expected to shift the retail distribution activities in favour of locations closer to Mumbai. With rentals in Bhiwandi quoting much lower rates than the Wagholi-Lonikand-Sanaswadi cluster, it would make more sense for retail companies to make Bhiwandi the regional hub and supply to the Pune market from here. Additionally, the sheer size of the Mumbai retail market skews the need for locating a regional distribution centre here instead of Pune. Such a trend could eventually limit the need for having a separate distribution centre in Pune in the coming years and restrict the growth of such centres in the Wagholi-Lonikand-Sanaswadi cluster.
Contrary to retail distribution centres, demand for industrial warehousing is expected to remain strong in this cluster as manufacturing companies from the engineering and auto ancillary sectors continue to prefer locating here. Additionally, the accessibility to Ranjangaon MIDC and Chakan MIDC will work in favour of this belt due to its central location. The proposed Pune Ring Road will further boost the attractiveness of this belt as it will connect the
The warehousing rentals in Bhiwandi today are in the range of `9 - 15/ sq.ft./ month. Although location of retail distribution centres is dependent upon multiple factors such as transportation cost, proximity to retail markets, quality of warehouse, supporting infrastructure and availability of manpower among others, the most critical factor is the rental cost. Even a small difference in rents can have an overbearing effect on the choice of location. Since rents in the Wagholi-Lonikand-Sanaswadi cluster are already higher than Bhiwandi, any further increase could drive away the retail distribution warehousing business from here.
Pune-Solapur Highway (NH-9) and Pune-Bengaluru Highway (NH-4) with Wagholi. Hence, the profile of warehouse occupiers is expected to gradually shift towards industrial warehouses from retail distribution centres.
The rapid urbanisation of this belt could put further pressure on land rates and render warehousing an unviable activity here. With rental value in certain warehouses already touching `18/ sq.ft./ month, it is only a matter of time that occupiers will begin scouting for alternate cheaper locations. Unlike Chakan, where there is a designated government planning authority (MIDC) that restricts the land use to industrial activities, development of the Wagholi-Lonikand-Sanaswadi cluster has primarily taken place on private land. This could tilt the preference of land owners towards residential development if such an opportunity presents itself in the near future. This scenario could open up the possibility of warehousing activities shifting towards the Chakan-Shikrapur Road in the north. While the cost of land is relatively cheaper here, they share similar characteristics with the Wagholi-Lonikand-Sanaswadi cluster in terms of connectivity and could emerge as an alternate warehousing hub in the coming years.
Land cost forms the most critical component of warehousing development and influences the realisable return to a great extent. The adjoining table explains the feasible land cost in the Wagholi-Lonikand-Sanaswadi cluster that an investor should ideally pay in order to achieve an expected return of 12%-24% per annum. For example, with a return expectation of 16% per annum and an
expected annual rental growth rate of 3%, the feasible land cost comes to `18 mn./ acre. In other words, an investor can fetch 16% per annum return only if he is able to purchase land today at or below `18 mn./ acre. As the purchase price of land goes higher, the realisable return reduces. Similarly, as the expected annual rental growth increases, the feasibility of higher cost land also goes up.
The warehouse rent in the Wagholi-Lonikand-Sanaswadi cluster is in the range of range of range of `14-18/ sq.ft./ month. If an investor with a return expectation of 16% develops a warehouse and achieves a rent of `16/ sq.ft./ month and an annual escalation of 5%, the feasible land cost is `23 mn./ acre. Since the current asking land rates in this cluster are between `19 -38 mn./ acre, it is feasible to develop a warehouse here at the lower-end of the range. However, achieving a 5% per annum rental growth may be difficult in the current economic scenario when most of the occupiers are focusing on cutting their logistics cost. The adjoining feasible land cost matrix provides the feasible land cost for a range of expected return and rent growth combinations. The output from the feasible land cost matrix that matches with the prevailing market price of land has been identified as a “market congruence case”. Therefore, depending on the expected return and ability of an investor to charge higher rental escalation from his tenants, certain pockets in the Wagholi-Lonikand-Sanaswadi cluster are still feasible for warehouse development at an expected return of 16% per annum. However, achieving investor return above 16% per annum may not be possible considering the current land rates in this cluster.
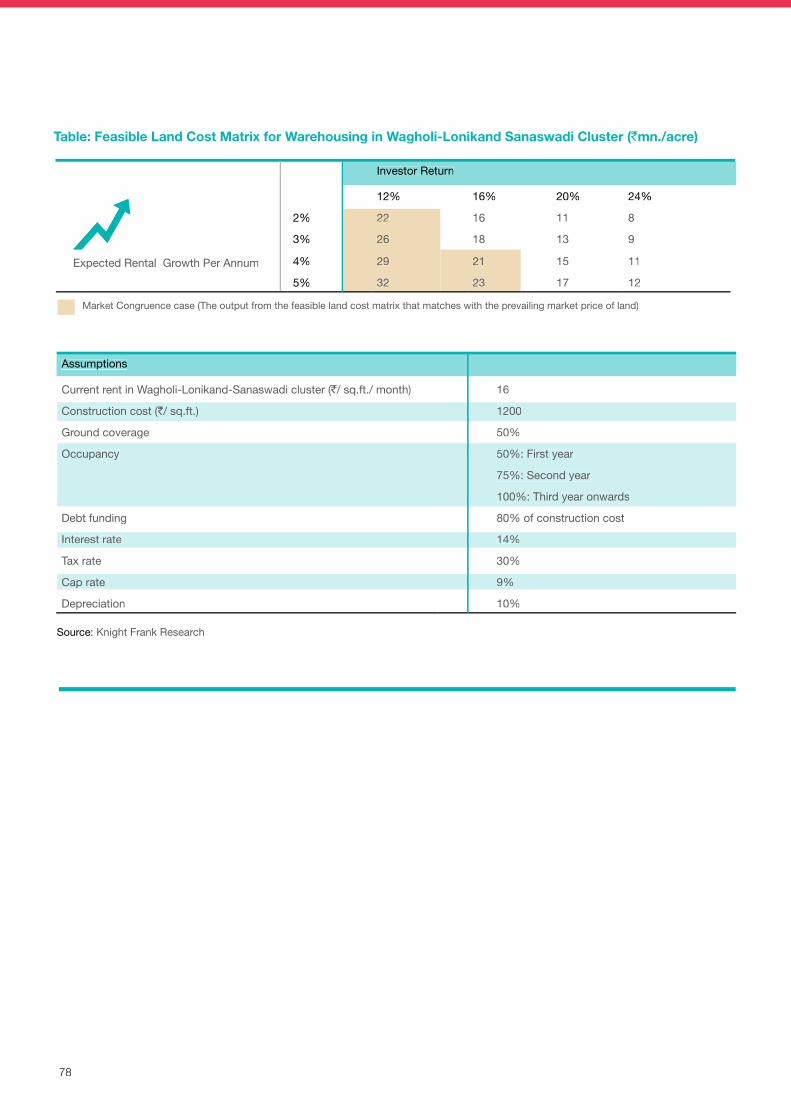
78
Assumptions
Current rent in Wagholi-Lonikand-Sanaswadi cluster (`/ sq.ft./ month) 16
Construction cost (`/ sq.ft.) 1200
Ground coverage 50%
Occupancy 50%: First year
75%: Second year
100%: Third year onwards
Debt funding 80% of construction cost
Interest rate 14%
Tax rate 30%
Cap rate 9%
Depreciation 10%
Source: Knight Frank Research
Table: Feasible Land Cost Matrix for Warehousing in Wagholi-Lonikand Sanaswadi Cluster (`mn./acre)
Expected Rental Growth Per Annum
Investor Return
12% 16% 20% 24%
2% 22 16 11 8
3% 26 18 13 9
4% 29 21 15 11
5% 32 23 17 12
Market Congruence case (The output from the feasible land cost matrix that matches with the prevailing market price of land)
78
Assumptions
Current rent in Wagholi-Lonikand-Sanaswadi cluster (`Current rent in Wagholi-Lonikand-Sanaswadi cluster (`Current rent in Wagholi-Lonikand-Sanaswadi cluster ( / sq.ft./ month)`/ sq.ft./ month)` 16
Construction cost (`Construction cost (`Construction cost ( / sq.ft.)`/ sq.ft.)` 1200
Ground coverage 50%
Occupancy 50%: First year
75%: Second year
100%: Third year onwards
Debt funding 80% of construction cost
Interest rate 14%
Tax rate 30%
Cap rate 9%
Depreciation 10%
Source: Knight Frank Research
Table: Feasible Land Cost Matrix for Warehousing in Wagholi-Lonikand Sanaswadi Cluster (`Table: Feasible Land Cost Matrix for Warehousing in Wagholi-Lonikand Sanaswadi Cluster (`Table: Feasible Land Cost Matrix for Warehousing in Wagholi-Lonikand Sanaswadi Cluster ( mn./acre)
Expected Rental Growth Per Annum
Investor Return
12% 16% 20% 24%
2% 22 16 11 8
3% 26 18 13 9
4% 29 21 15 11
5% 32 23 17 12
Market Congruence case (The output from the feasible land cost matrix that matches with the prevailing market price of land)
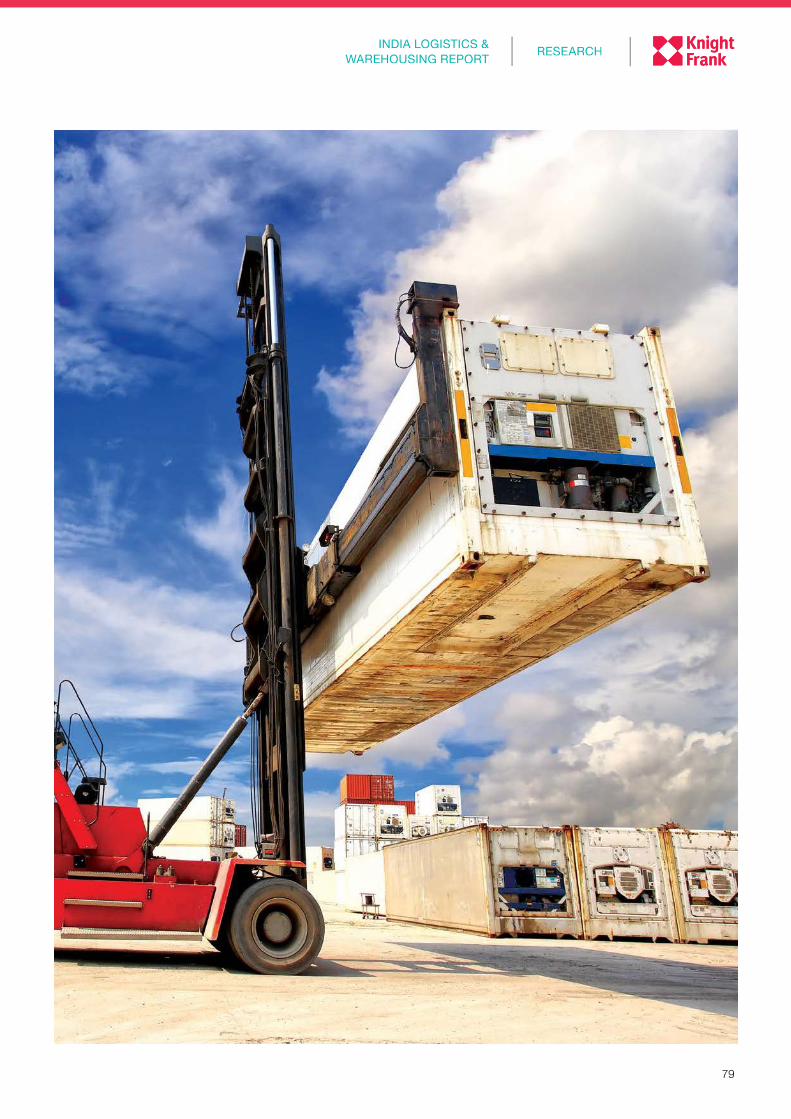
79
RESEARCHINDIA LOGISTICS &
WAREHOUSING REPORT
79
RESEARCHINDIA LOGISTICS &
WAREHOUSING REPORT
Financial Analysis ofThe Real Estate Companies
Is It The Dawn of TheIndian Real Estate
E&R@Glance
FINANCIAL ANALYSIS OF THE REAL ESTATE COMPANIESMarch 2014
ALL INDIA ANALYSIS NORTH WEST SOUTHIMPACT ON REAL ESTATE IMPACT ON INDUSTRIES IMPACT ON INFRASTRUCTURE
Impact of the Right to Fair Compensation
and Transparency in Land Acquisition,
Rehabilitation and Resettlement Act, 2013
Land AcquisitionRehabilitation and Resettelment Act 2013
E&R@Glance
FINANCIAL ANALYSIS OF THE REAL ESTATE COMPANIESMarch 2014
ALL INDIA ANALYSIS NORTH WEST SOUTH
FICCI-Knight Frank
REAL ESTATE SENTIMENT INDExQ1 2014The real estate sentiment index is jointly developed by
Knight Frank India and FICCI. The objective is to capture the
perceptions and expectations of the industry leaders in
order to judge the sentiment of the real estate market.
Sentiment Index Q1 2014
RECENT MARKET-LEADING RESEARCH PUBLICATIONS
Knight Frank Research Reports are available at KnightFrank.com/Research VelocitaBrand.com
© Knight Frank India Pvt.LtdThis report is published for general information only and not to be relied upon in any way. Although high standards have been used in the preparation of the information, analysis, views and projections presented in this report, no responsibility or liability whatsoever can be accepted by Knight Frank for any loss or damage resultant from any use of, reliance on or reference to the contents of this document. As a general report, this material does not necessarily represent the view of Knight Frank in relation to particular properties or projects. Reproduction of this report in whole or in part is not allowed without prior written approval of Knight Frank to the form and content within which it appears.
Dr. Samantak Das
Chief Economist & Director - Research & Advisory Services
+91 22 6745 0155
Vivek Rathi
Assistant Vice President - Research
+91 22 6745 0119
Hetal Bachkaniwala
Assistant Vice President - Research
+91 22 6745 0118
Yashwin Bangera
Lead Consultant - Research
+91 22 6745 0149
Hitendra Gupta
Consultant - Research
+91 22 6745 0138
For the latest news, views and analysisof the commercial property market, visitknightfrankblog.com/commercial-briefing/
COMMERCIAL BRIEFING
Knight Frank India research provides development and strategic advisory to a wide range of clients worldwide. We regularly produce detailed and informative research reports which provide valuable insights on the real estate market. Our strength lies in analyzing existing trends and predicting future trends in the real estate sector from the data collected through market surveys and interactions with real estate agents, developers, funds and other stakeholders.
Financial Analysis ofFinancial Analysis ofThe Real Estate CompaniesCompanies
Is It The Dawn of TheIndian Real Estate
E&R@Glance
FINANCIAL ANALYFINANCIAL ANALYFINANCIAL ANAL SIS OF THE REAL ESTAOF THE REAL ESTAOF THE REAL EST TE ATE ACOMPANIESOMPANIESOMPMarch 2014
ALL INDIA ANALYALL INDIA ANALYALL INDIA ANAL SIS NORTHNORTHNOR WEST SOUTHIMPAIMPAIMP CT ON REAL ESTAAL ESTAAL EST TEATEA IMPAIMPAIMP CT ON INDUSTRIES IMPAIMPAIMP CT ON INFRASTRUCTURE
Impact of the Right to Fair Compensation
and Transparency in Land Acquisition,
Rehabilitation and Resettlement Act, 2013
Land AcquisitionLand AcquisitionRehabilitation and Resettelment Act 2013
FICCI-Knight FrankCI-Knight FrankCI-Knight
REAL ESTREAL ESTREAL A ESTA EST TE ATE ASENTIMENTINDExQ1 2014The real estate sentiment index is jointly developed by
Knight Frank India and FICCI. The objective is to capture the
perceptions and expectations of the industry leaders in
order to judge the sentiment of the real estate market.
Sentiment Index Q1 2014
RECENT MARKET-LEADING RESEARCH PUBLICATIONS
Knight Frank Research Reports are available at KnightFrank.com/Research VelocitaBrand.com
© Knight Frank India Pvt.LtdThis report is published for general information only and not to be relied upon in any way. Although high standards have been used in the preparation of the information, analysis, views and projections presented in this report, no responsibility or liability whatsoever can be accepted by Knight Frank for any loss or damage resultant from any use of, reliance on or reference to the contents of this document. As a general report, this material does not necessarily represent the view of Knight Frank in relation to particular properties or projects. Reproduction of this report in whole or in part is not allowed without prior written approval of Knight Frank to the form and content within which it appears.
Dr. Samantak Das
Chief Economist & Director - Research & Advisory Services
+91 22 6745 0155
Vivek Rathi
Assistant Vice President - Research
+91 22 6745 0119
Hetal Bachkaniwala
Assistant Vice President - Research
+91 22 6745 0118
Yashwin Bangera
Lead Consultant - Research
+91 22 6745 0149
Hitendra Gupta
Consultant - Research
+91 22 6745 0138
For the latest news, views and analysisof the commeof the commeof rcial property market, visitknightfrankblog.com/commercial-briefing/
COMMERCIAL BRIEFING
Knight Frank India research provides development and strategic advisory to a wide range of clients worldwide. We regularly produce detailed and informative research reports which provide valuable insights on the real estate market. Our strength lies in analyzing existing trends and predicting future trends in the real estate sector from the data collected through market surveys and interactions with real estate agents, developers, funds and other stakeholders.