India-Japan Economic Partnership Agreement: Gains · PDF fileIndia-Japan Economic Partnership...
54
India-Japan Economic Partnership Agreement: Gains and Future Prospects Geethanjali Nataraj Visiting Scholar Policy Research Institute, Ministry of Finance, Government of Japan & Senior Economist National Council of Applied Economic Research ( NCAER) New Delhi, India. 26 November 2010, Tokyo , Japan
Transcript of India-Japan Economic Partnership Agreement: Gains · PDF fileIndia-Japan Economic Partnership...

India-Japan Economic Partnership Agreement: Gains
and Future Prospects
Geethanjali NatarajVisiting Scholar
Policy Research Institute, Ministry of Finance, Government of Japan
&Senior Economist
National Council of Applied Economic Research ( NCAER)New Delhi, India.
26 November 2010, Tokyo , Japan
Objectives of the Study
• Documenting bilateral trade in goods at HS 2 and HS 6 digit levels
• Computing revealed comparative advantage of India’s and Japan’s exports
• Identifying complementary sectors and possible impact of the agreement ( Economic Partnership Agreement, EPA) on various sectors: losers versus gainers
• Attempt to document existing levels of import tariffs and non-tariff barriers i.e. to analyse the NTBs and SPS measures faced by Indian exporters in Japan and vice versa;
• Identifying the possibilities of enhanced trade in agricultural goods and processed foods

Objectives cont…
• Identifying other areas of economic cooperation• Documenting relative strengths of India and Japan for
trade in services including the identification of imports and exports of services
• Steps required to encourage bilateral investment flows i.e. to explore the potential areas for Indian investment in Japan and vice versa with special emphasis on SME and service sector and analyse the issue of fair and legal treatment to the investors.

Salient features of Japanesebusiness in India
• Third “India boom” in Japan since 1991• Concentration in auto and related industries• Consider India as a country that is important in the
“long-run”• India’s foremost importance for Japanese ODA

Recent progress inJapan-India relationship
• Prime minister’s visit every year• Cooperation in defense matters• EPA expected in 2011• DMIC/DFC and IIT Hyderabad plan• Increase in FDI and trade• More knowledge accumulation on India• Huge amount of portfolio investment• Large-scale M&A by Japanese multinationals• Increasing presence of NRI in Japan

Progress yet to be made
• Increase Japan’s rank as a trade partner in India• Not enough diversification in trade/investment• Limited investment by Japanese SMEs• Stagnant market share of Indian IT firms in Japan• Very limited BPO by Indian companies in Japan• Politically difficult to support India’s nuclear
programme• Still limited people-to-people contact

India-Japan Historic Relations
• Asia: power centre of the world with Japan, India Korea and China at the forefront.
• India and Japan share common values such as democracy, human rights and market economy.
• Exchanges since the 6th Century A.D. when Buddhism was introduced to Japan. Diplomatic ties were established in 1952
• The start of negotiations on India-Japan Economic Partnership Agreement in January 2007, mark the beginning of a new phase in India’s economic relations with Japan.

GDP Growth Rates
Year India Japan1991 1.06 3.352001 5.22 0.182005 9.35 1.932006 9.67 2.042007 9.06 2.392008 7.09 -0.702009 6.80 -5.30
Source: WDI 2010

India-Japan GDP Growth Rate

Macro Economic Indicators of Japan and India for 2008 (US$ Billion)
India Japan
GDP (Market Price) 1159.17 4910.84
Exports 290.86 895.23
Imports 371.62 877.89
Current Account Balance -36.09 156.63
Foreign Exchange Reserves
257.42 1030.76
Foreign Trade as % of GDP
57.15 36.11
Savings as % of GDP 38.00 29.00
Source: World Development Indicators, 2010

India-Japan Trade

India-Japan Trade cont…

India-Japan Bi-lateral Trade
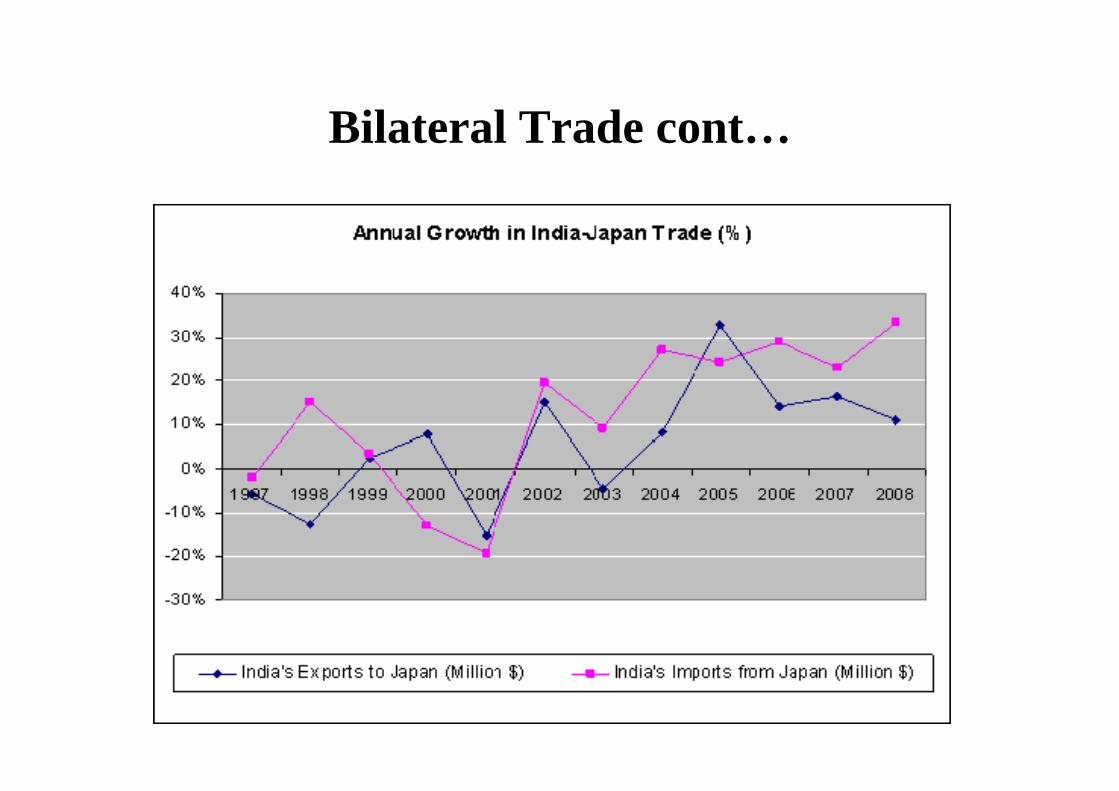
Bilateral Trade cont…

Foreign Trade as a percentage of GDP in India and Japan

Top Trade Partners of India and Japan India Japan
Leading Export Partners ( %)
Leading Import Partners ( %)
Leading Export Partners ( %)
Leading Import Partners ( %)
USA ( 12.3), Europe( 13), UAE ( 9.4), China ( 9.3)
China ( 11.1), Saudi Arabia ( 7.5) , USA( 6.6), UAE, Iran, Singapore and Germany
USA ( 17.8), China ( 16), South Korea (7.6), Hong Kong ( 5.1),
China ( 18.9), USA ( 10.4), Saudi Arabia, Australia, Australia and Indonesia.
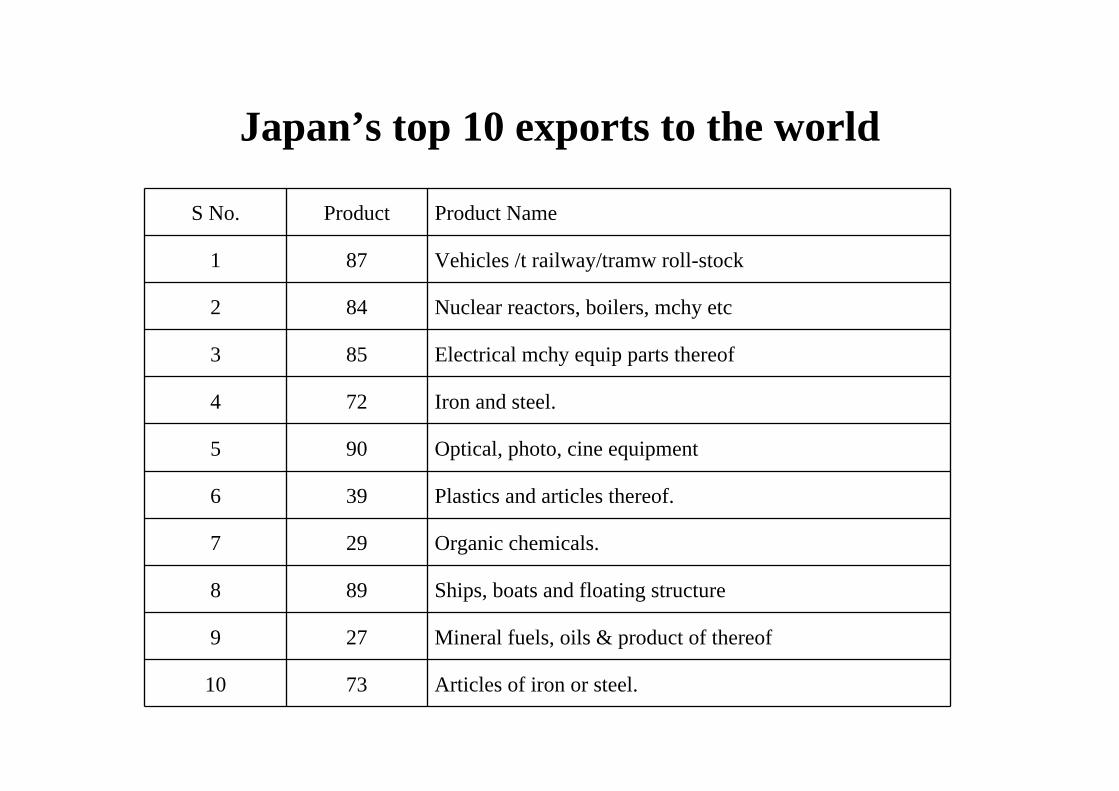
Japan’s top 10 exports to the world
S No. Product Product Name
1 87 Vehicles /t railway/tramw roll-stock
2 84 Nuclear reactors, boilers, mchy etc
3 85 Electrical mchy equip parts thereof
4 72 Iron and steel.
5 90 Optical, photo, cine equipment
6 39 Plastics and articles thereof.
7 29 Organic chemicals.
8 89 Ships, boats and floating structure
9 27 Mineral fuels, oils & product of thereof
10 73 Articles of iron or steel.

India’s top 10 exports to the world
S No. Product Product Name
1 27 Mineral fuels, oils & product of th
2 71 Natural/cultured pearls, precious stone
3 72 Iron and steel.
4 84 Nuclear reactors, boilers, mchy & m
5 29 Organic chemicals.
6 26 Ores, slag and ash.
7 85 Electrical mchy equip parts thereof
8 73 Articles of iron or steel.
9 87 Vehicles o/t railw/tramw roll-stock
10 62 Art of apparel & clothing access, n

Japan’s top 10 exports to India
S No. Product Product Name
1 84 Nuclear reactors, boilers, mchy & m
2 85 Electrical mchy equip parts thereof
3 72 Iron and steel.
4 27 Mineral fuels, oils & product of th
5 87 Vehicles o/t railw/tramw roll-stock
6 90 Optical, photo, cine equipment etc
7 73 Articles of iron or steel.
8 29 Organic chemicals.
9 39 Plastics and articles thereof.
10 82 Tool, implement, cutlery, spoon & f

Japan's Top 5 Exports to India (% shares)

India’s top 10 exports to Japan
S No. Product Product Name
1 27 Mineral fuels, oils & product of th
2 71 Natural/cultured pearls, precious stone
3 23 Residues & waste from the food
4 26 Ores, slag and ash.
5 72 Iron and steel.
6 03 Fish & crustacean, mollusc & other
7 29 Organic chemicals.
8 62 Art of apparel & clothing access, n
9 84 Nuclear reactors, boilers, mchy & m
10 52 Cotton.

India's Top 5 Exports to Japan (% shares)

Summary of India-Japan Trade
• Bilateral trade between India and Japan steadily increasing and touched nearly US $ 11 billion in 2009.
• Japan ranks 10th among India’s export destinations where as India ranks 26th among Japan’s export destinations.
• India’s exports to Japan mainly comprise of raw materials and minerals such as marine products and iron ore.
• Other items include agricultural products, handicrafts, cotton, carpets and leather garments.

Summary of India-Japan Trade cont…
• India mainly imports from Japan heavy machines, transport equipment, electronics, pharmaceuticals, bio-technological products and toys.

Export Competitiveness
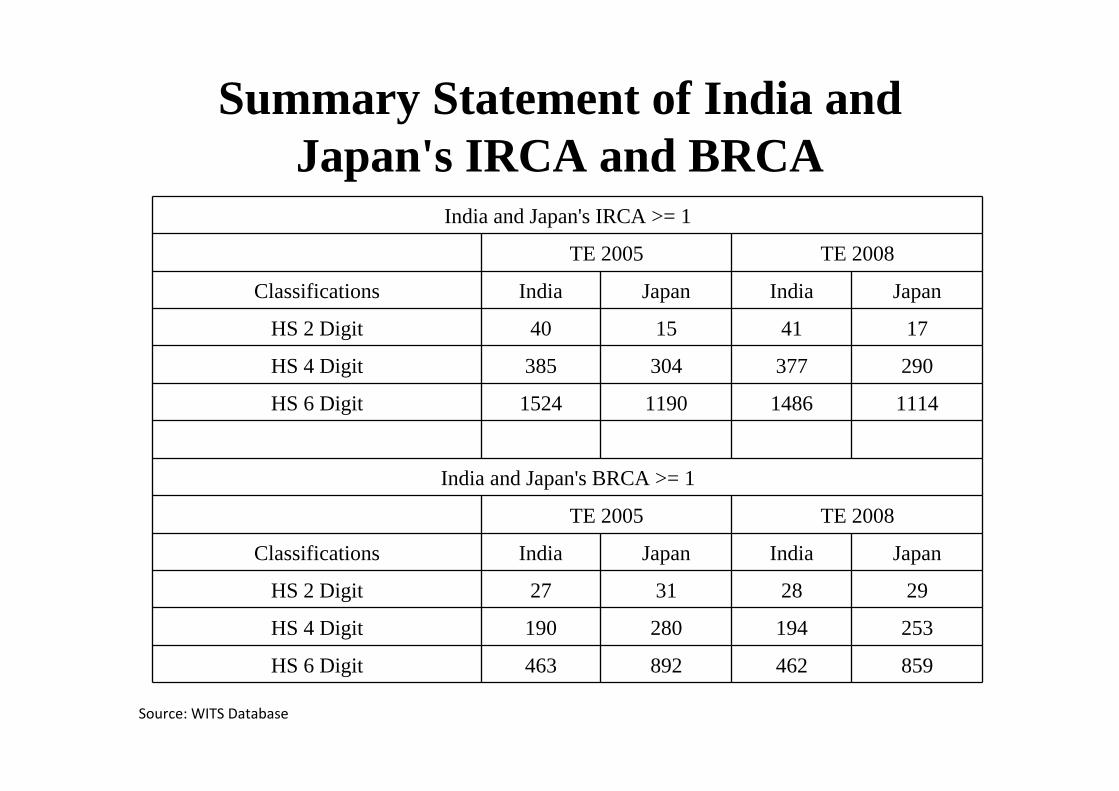
Summary Statement of India and Japan's IRCA and BRCA
India and Japan's IRCA >= 1
TE 2005 TE 2008
Classifications India Japan India Japan
HS 2 Digit 40 15 41 17
HS 4 Digit 385 304 377 290
HS 6 Digit 1524 1190 1486 1114
India and Japan's BRCA >= 1
TE 2005 TE 2008
Classifications India Japan India Japan
HS 2 Digit 27 31 28 29
HS 4 Digit 190 280 194 253
HS 6 Digit 463 892 462 859
Source: WITS Database

Summary Statement of India and Japan's Export Dynamic Commodities
Classifications India Japan
HS 2 Digit 0 1
HS 4 Digit 4 13
HS 6 Digit 10 23
S. No. Product Code Product Name
1 47 Pulp of wood/of other fibrous material
Export Dynamic Commodities of Japan (2 Digit Level)

Export Dynamic Commodities of Japan (4 Digit Level)
S. No. Product Code Product Name1 0806 Grapes, fresh or dried.2 2707 Oils and other products of the dist3 3906 Acrylic polymers in primary forms.4 3915 Waste, parings and scrap, of plastic5 3920 Other plates, sheets, film, foil an6 4908 Transfers (decalcomanias).7 7106 Silver (including silver plated wit8 7115 Other articles of precious metal or9 7204 Ferrous waste and scrap; remelting10 8426 Ships' derricks; cranes, including11 8429 Self-propelled bulldozers, angledoz
12 8430 Other moving, grading, levelling, equip

Export Dynamic Commodities of Japan at 6 Digit Level
S. No. Product Code Product Name
1 080610 Fresh
2 200930 Juice of any other single citrus fr
3 270730 Xylole
4 300510 Adhesive dressings and other article
5 380110 Artificial graphite
6 390690 Other
7 390799 Other polyesters :-- Other
8 391510 Of polymers of ethylene
9 391520 Of polymers of styrene
10 391590 Of other plastics
11 470790 Other, including unsorted waste and
12 490890 Other
13 711590 Other
14 720449 Other waste and scrap :-- Other
15 840682 Other turbines :-- Of an output not
16 842199 Parts :-- Other
17 842649 Other machinery, self-propelled :--
18 842952 Mechanical shovels, excavators and
19 843149 Of machinery of heading No. 84.26,
20 843230 Seeders, planters and transplanters
21 870410 Dumpers designed for off-highway us
22 870422 Other, with compression-ignition in
23 902129 Artificial teeth and dental fitting

Export Dynamic Commodities of India (4 Digit Level)
S. No. Product Code Product Name
1 0401 Milk and cream, not concentrated no
2 3211 Prepared driers.
3 8431 Parts suitable for use solely or pr
4 8481 Taps, cocks, valves and similar app

Export Dynamic Commodities of India at 6 Digit Level
S. No. Product Code Product Name1 040610 Fresh (unripened or uncured) cheese2 320619 Pigments and preparations based on
3 321100 Prepared driers.4 380890 Other5 401199 Other6 410129 Other hides and skins of bovine ani7 551229 Containing 85 % or more by weight o8 630210 Bed linen, knitted or crocheted9 841480 Other10 848180 Other appliances

Export Specialization Index with Japan Product Product Name 2008
37 Photographic or cinematographic goo -99.979 Zinc and articles thereof. -99.691 Clocks and watches and parts thereo -99.689 Ships, boats and floating structure -99.686 Railw/tramw locom, rolling-stock & -99.148 Paper & paperboard; art of paper pu -98.480 Tin and articles thereof. -98.431 Fertilisers. -97.934 Soap, organic surface-active agents -96.382 Tool, implement, cutlery, spoon & f -95.584 Nuclear reactors, boilers, mchy & m -92.939 Plastics and articles thereof. -92.440 Rubber and articles thereof. -91.787 Vehicles o/t railw/tramw roll-stock -91.660 Knitted or crocheted fabrics. -91.524 Tobacco and manufactured tobacco su 91.920 Prep of vegetable, fruit, nuts or o 92.052 Cotton. 92.342 Articles of leather; saddlery/harne 92.997 Works of art, collectors' pieces an 93.057 Carpets and other textile floor co 95.264 Footwear, gaiters and the like; par 96.150 Silk. 96.415 Animal/veg fats & oils & their clea 98.661 Art of apparel & clothing access, 99.013 Lac; gums, resins & other vegetable 99.126 Ores, slag and ash. 99.223 Residues & waste from the food indu 99.503 Fish & crustacean, mollusc & other 99.653 Other vegetable textile fibres; pap 99.816 Prep of meat, fish or crustaceans, 99.862 Art of apparel & clothing access, n 99.906 Live tree & other plant; bulb, root 99.910 Cereals 99.904 Dairy prod; birds' eggs; natural ho 99.905 Products of animal origin, nes or 100.009 Coffee, tea, matï and spices. 100.008 Edible fruit and nuts; peel of citr 100.0
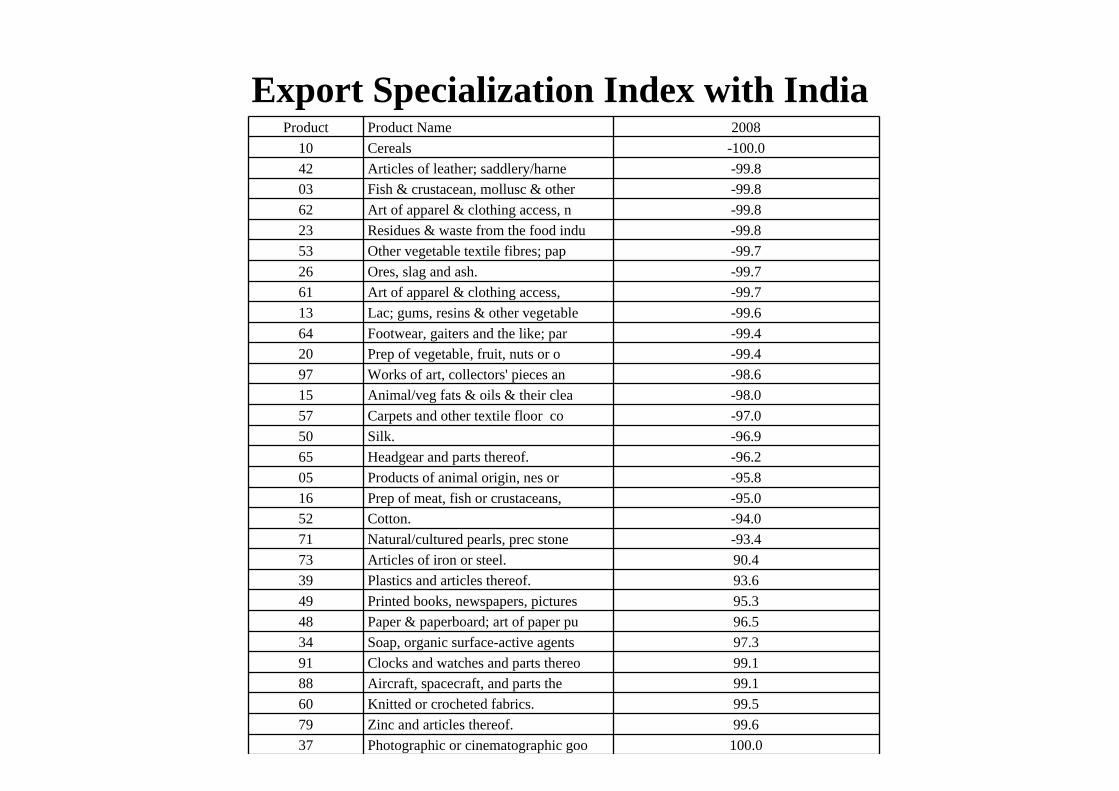
Export Specialization Index with IndiaProduct Product Name 2008
10 Cereals -100.042 Articles of leather; saddlery/harne -99.803 Fish & crustacean, mollusc & other -99.862 Art of apparel & clothing access, n -99.823 Residues & waste from the food indu -99.853 Other vegetable textile fibres; pap -99.726 Ores, slag and ash. -99.761 Art of apparel & clothing access, -99.713 Lac; gums, resins & other vegetable -99.664 Footwear, gaiters and the like; par -99.420 Prep of vegetable, fruit, nuts or o -99.497 Works of art, collectors' pieces an -98.615 Animal/veg fats & oils & their clea -98.057 Carpets and other textile floor co -97.050 Silk. -96.965 Headgear and parts thereof. -96.205 Products of animal origin, nes or -95.816 Prep of meat, fish or crustaceans, -95.052 Cotton. -94.071 Natural/cultured pearls, prec stone -93.473 Articles of iron or steel. 90.439 Plastics and articles thereof. 93.649 Printed books, newspapers, pictures 95.348 Paper & paperboard; art of paper pu 96.534 Soap, organic surface-active agents 97.391 Clocks and watches and parts thereo 99.188 Aircraft, spacecraft, and parts the 99.160 Knitted or crocheted fabrics. 99.579 Zinc and articles thereof. 99.637 Photographic or cinematographic goo 100.0

Summary of Export Competitiveness
• Export competitiveness of both countries decreasing in the world market at all levels of HS classification since 2003.
• Even though efforts are on to boost bilateral trade between the two countries, competitiveness of Indian and Japanese goods in each other’s markets has also declined.
• Even though Japan’s international competitiveness has declined in traded goods, quite a few of its exports have shown consistently high growth rates and are termed export dynamic.
• The export specialization index shows that Japan is importing from India in 2008 and India is exporting more to Japan in 2008 as the values are closer to positive 100 in the case of India and negative 100 in the case of Japan.
Features of India-Japan EPA
• The EPA as opposed to CEPA expected to be signed in 2011.( could have been signed in October 2010 during the Indian PM’s visit to Japan but the Japanese Parliament is yet to ratify the agreement).
• The agreement a win-win situation for both the countries given the complimentarity in sectors, similarity in political set-ups and commitment to a market economy.

Features of Indian-Japan EPA cont…
• The EPA to phase out tariffs on 90 per cent of Japan’s exports to India and 97 per cent of India’s exports to Japan.
• EPA to reduce tariffs on 8000 products including drugs, apparel, agricultural products etc thereby increasing exports from India to Japan.
• The EPA to cover 87 per cent of 12,000 tariff lines of India and 93 per cent of Japan’s 9000 tariff lines.

Features of India-Japan CEPA cont…
• Duties on 80 per cent of Japan’s tariff lines will be eliminated but duties will be brought down to zero only on 25 per cent of India’s tariff lines ( mainly textiles).
• Duties on 75 per cent of India’s tariff lines will be removed over a period of 10 years.
• But in the India-Korea CEPA signed in 2009, the duty on India’s tariff lines will be phased out in 8 years. It is important that the Japanese govt quickly ratifies the agreement .

Gains from the EPA• The EPA is expected to help Japan effectively compete
with South Korea in the Indian markets.• Given the growing protests against using Japanese
products in China , India-Japan EPA will enhance export opportunities for Japan.
• A major boost to Japanese auto parts manufacturers who can export duty free to India. It is infact the Japanese auto sector which has lobbied hard for this agreement.
• Enhance competition in the area of generic drugs.• Help India in expanding its role as a global centre for
manufacturing.

Barriers to Trade
• Trade Barriers in India• According to the WTO, India is one among the
countries with highest tariff rates though applied tariff rate (16.4 percent) is far below the average bound rate (34.9 percent).
• India’s high tariff rates in agriculture affects exports of Japanese products like different varieties of fish.
• Complex tariff structure, multiple exemptions and Lack of official publication in India require extensive documentation and time.

Barriers to trade in India cont…
• Non-transparency and unpredictability in unofficial policy. For instance, unofficial policies of revising edible oil reference prices once every two weeks.
• Some products can be imported from only designated ports. For example, motor vehicles.
• Imports of certain products, like electrical appliances are subject to license from Bureau of Indian Standards (BIS). For this BIS needs to first inspect the production facility and then give the license to the exporter. According to some foreign companies, licensing and inspection cost imposed on them is very high.

Barriers to trade in Japan
• Issues regarding Japan’s unwillingness to lower tariffs on certain products of export interest to India as well as concerns over technical barriers to trade (TBT) and Japan’s stringent sanitary and phytosanitary (SPS) measures which act as non-tariff barriers to trade have been raised by India in the negotiations of EPA

Barriers to Trade in Japan cont…
• Moreover, Japan maintains tariff-rate quotas (TRQs) for some commodities, including:
-Rice and rice flour.-Wheat and wheat flour.-Butter and milk powder.
Imports outside the TRQs face high tariffs. Since India is a major exporter of Agricultural products, it faces strict entry barriers to Japan as Japan tries to protect its farmers.

Barriers to Trade in Japan Cont…
• Japan's trade policies also protect certain food processing industries.
• Strict government control over wheat, rice, dairy, and sugar products encourages processing of foods made from those commodities in Japan.
• Despite the protection of flour milling, sugar refining, and butter and powder production, Japan's imports of processed foods and beverages have grown steadily.
Difficulties faced by Indian Exporters
• FICCI study as questioned the role played by Japanese trading houses positioned in India. Many believe that they overall benefit the Indian exports but also it is at the cost of India’s exports to Japan.
• Japan has a complex distribution system making it difficult for Indian exports to penetrate the market.
Sectors subject to Stringent standards
• The export of the following items have been seriously hampered by high standards set by Japan
- Chemicals, textiles and leather, food/processed food and sea food.
- Paper and paper products- Pharmaceuticals- Transportation and delivery- Visa/connectivity
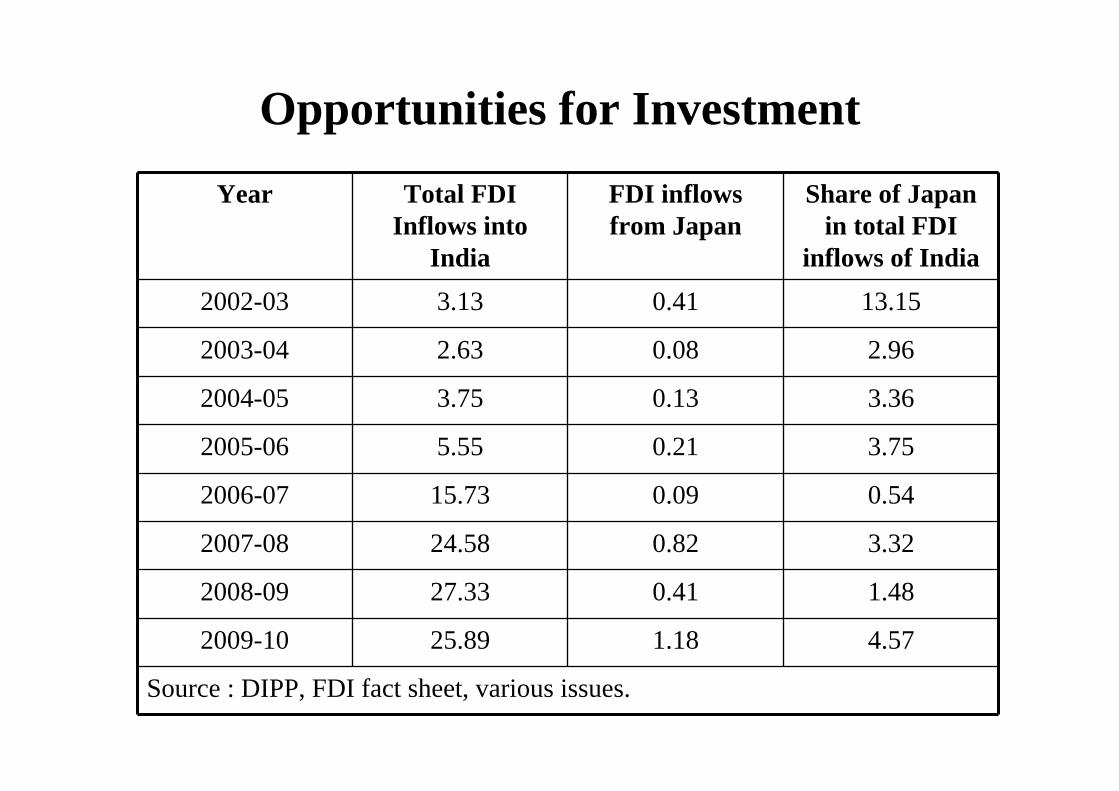
Opportunities for InvestmentYear Total FDI
Inflows into India
FDI inflows from Japan
Share of Japan in total FDI
inflows of India2002-03 3.13 0.41 13.15
2003-04 2.63 0.08 2.96
2004-05 3.75 0.13 3.36
2005-06 5.55 0.21 3.75
2006-07 15.73 0.09 0.54
2007-08 24.58 0.82 3.32
2008-09 27.33 0.41 1.48
2009-10 25.89 1.18 4.57
Source : DIPP, FDI fact sheet, various issues.

Top Investing Countries in India during 2000 to 2009
Rank Country/Region % share of FDI inflow
1 Mauritius 43.682 Singapore 8.943 US 7.674 UK 5.585 Netherlands 4.096 Japan 3.277 Cyprus 3.088 Germany 2.609 France 1.4510 UAE 1.15
Source : DIPP

Reasons for Poor Investment in India
• India’s poor infrastructure• Bureaucracy and complicated tax scheme• Labour Unions and lack of labour reforms• Difficult human resource management• Living environment in India

Trade in Services• The services sector is an important part of both the Japanese and Indian
economies. It contributes over 50 per cent of GDP in India and above two-thirds in Japan.
• India is an increasingly successful provider of business services to a broadrange of developed countries, while Japan is importing such services fromother nations, notably China.
• Japan is a significant global exporter of services, often linked with overseas investment, yet the presence of Japanese servicesand firms in the Indian market is much less than in other parts of Asia.
• Demographic trends in India and Japan also suggest significant potentialcomplementarities between the two services sectors well into the future.

Share in world trade in Services
Year India Japan
2001 1.13 4.36
2002 1.20 4.14
2003 1.29 3.92
2004 1.71 4.04
2005 2.10 4.12
2006 2.52 4.09
2007 2.60 3.77

Other Areas of Cooperation • Cooperation in IT sector: strong hardware industry in Japan and India is
world recognized for software industry
• Science and Technology: India is endowed with well educated S&T personal and Japan has resources
• Pharmaceutical Industry: India has both R&D facilities and humancapital to leverage upon. On the other hand, Japan is focusing on R&D in pharmaceutical sector
• Broadcasting: India is well recognized for its content. Japan is specialized in drama, digital and mobile broadcasting technologies.
• Tourism: strong ancient historical and cultural linkages- Buddhism
• Construction and Related Services: India requires both capital and technology, Japan has reputed construction companies with strong technological capability.
• Human Resource Development: Share of productive age group in India is rising, Japan: aging population
• Healthcare
Other areas of co-operation cont…
• Bio-technology, nano-technology and energy saving techniques and energy security key sectors for India to learn from Japan.
• The agreement is expected to increase exchanges in IT, ITES, financial services, construction, transportation and health-care services.
• Work permit for 3 years to Japanese workers from the automobile industry.
• Japan to benefit in the area of auto-parts, export of high grade steel and high technology consumer items to cater to the growing middle class in India.
Conclusion • EPA will contribute to the stable industrial structure that will help
small and medium companies with high-end technology and open management expand into the global market.
• Given the differences in economic structure between Japan and India, the benefits of these changes will probably outweigh the risks of increased competition from one another’s countries.
• Good for India’s “Look East” policy to reduce dependency on western markets and provide an alternative centre of international production to Japan after China.
• Bilateral relations will be further solidified and the EPA would send signals to the world that the two countries are committed to free trade and are against protectionism.
• Overall, the India-Japan EPA is a step in the right direction given the slowdown of world trade. The reduction and abolitions of tariffs through the EPA will result in an increase in trade and investment relations between two of the largest economies in Asia.

Thank You
&Season’s greetings