India - iuj.ac.jp over 50 years it has been a source of information on business ... In 1526 a...
63
Country Profile 2005 India This Country Profile is a reference work, analysing the countrys history, politics, infrastructure and economy. It is revised and updated annually. The Economist Intelligence Units Country Reports analyse current trends and provide a two-year forecast. The full publishing schedule for Country Profiles is now available on our website at http://www.eiu.com/schedule The Economist Intelligence Unit 15 Regent St, London SW1Y 4LR United Kingdom
Transcript of India - iuj.ac.jp over 50 years it has been a source of information on business ... In 1526 a...

Country Profile 2005
IndiaThis Country Profile is a reference work, analysing thecountry�s history, politics, infrastructure and economy. It isrevised and updated annually. The Economist IntelligenceUnit�s Country Reports analyse current trends and provide atwo-year forecast.
The full publishing schedule for Country Profiles is nowavailable on our website at http://www.eiu.com/schedule
The Economist Intelligence Unit15 Regent St, London SW1Y 4LRUnited Kingdom

The Economist Intelligence Unit
The Economist Intelligence Unit is a specialist publisher serving companies establishing and managingoperations across national borders. For over 50 years it has been a source of information on businessdevelopments, economic and political trends, government regulations and corporate practice worldwide.
The Economist Intelligence Unit delivers its information in four ways: through its digital portfolio, where itslatest analysis is updated daily; through printed subscription products ranging from newsletters to annualreference works; through research reports; and by organising seminars and presentations. The firm is amember of The Economist Group.
LondonThe Economist Intelligence Unit15 Regent StLondonSW1Y 4LRUnited KingdomTel: (44.20) 7830 1007Fax: (44.20) 7830 1023E-mail: [email protected]
New YorkThe Economist Intelligence UnitThe Economist Building111 West 57th StreetNew YorkNY 10019, USTel: (1.212) 554 0600Fax: (1.212) 586 0248E-mail: [email protected]
Hong KongThe Economist Intelligence Unit60/F, Central Plaza18 Harbour RoadWanchaiHong KongTel: (852) 2585 3888Fax: (852) 2802 7638E-mail: [email protected]
Website: www.eiu.com
Electronic deliveryThis publication can be viewed by subscribing online at www.store.eiu.com
Reports are also available in various other electronic formats, such as CD-ROM, Lotus Notes, on-line databasesand as direct feeds to corporate intranets. For further information, please contact your nearest EconomistIntelligence Unit office
Copyright© 2005 The Economist Intelligence Unit Limited. All rights reserved. Neither this publication norany part of it may be reproduced, stored in a retrieval system, or transmitted in any form or by any means,electronic, mechanical, photocopying, recording or otherwise, without the prior permissionof The Economist Intelligence Unit Limited.
All information in this report is verified to the best of the author's and the publisher's ability. However, theEconomist Intelligence Unit does not accept responsibility for any loss arising from reliance on it.
ISSN 1473-9127
Symbols for tables�n/a� means not available; ��� means not applicable
Printed and distributed by Patersons Dartford, Questor Trade Park, 151 Avery Way, Dartford, Kent DA1 1JS, UK.

DarjilingDarjiling
PAKISTAN
AFGHANISTAN
CHINA
MYANMAR
SRILANKA
BANGLADESH
TAJIKISTAN
BHUTANNEPAL
INDIAINDIA
ANDHRAPRADESHANDHRAPRADESH
ANDAMANAND NICOBAR
ISLANDSLAKSHADWEEP
KARNATAKAKARNATAKA
MAHARASHTRAMAHARASHTRA
GUJARATGUJARAT
RAJASTHANRAJASTHAN
PUNJABPUNJAB
MADHYA PRADESHMADHYA PRADESH
CHHATTISGARHCHHATTISGARHORISSA
BIHARBIHAR
JHARKHANDJHARKHAND
UTTAR PRADESHUTTAR PRADESH
RALAKERALA
GOA
TAMILNADUTAMILNADU
NEW DELHINEW DELHI
Kolkata(Calcutta)Kolkata(Calcutta)
Chennai(Madras)BangaloreBangalore
HyderabadHyderabad
NagpurNagpur
BhopalBhopalIndoreIndore
AhmadabadAhmadabad
JaipurJaipurKanpurKanpur
Mumbai(Bombay)
SuratSurat
NasikNasik AurangabadAurangabad
NandedNanded
AkolaAkola
PunePune
HubliHubliBelgaumBelgaum
Gandhidham
BhavnagarBhavnagar
Rann ofKachchh
Cuttack
Port Blair
Puri
CoimbatoreCoimbatore
Puduchcheri (Pondicherry)
Nagappattinam
Vizagapatam (Vishakhapatnam)
Cocanada (Kakinada)
MachilipatnamKurnoolKurnool
NizamabadNizamabad
ChandrapurChandrapur
Nellore
Vizianagaram
Brahmapur
MysoreMysore
SalemSalem
Mangalore
hitradurgaChitradurga
VijayawadaVijayawada
KhandwaKhandwa
RaichurRaichur
Kochi (Cochin)
Kollam (Quilon)
Kozhikode(Calicut)
Thiruvananthapuram(Trivandrum) Nagercoil
MaMadurai
TuticTuticorin
SolapurSolapurGulbargaGulbarga
purKolhapur
Madgaon
SambalpurSambalpur
KharagpurKharagpur
Agartala
GoalparaGoalpara
ItanagarItanagar
ShiliguriShiliguri
JamshedpurJamshedpur
BilaspurBilaspur
RanchiRanchi
RaipurRaipur
JhansiJhansi
JabalpurJabalpur
MurwaraMurwara
PatnaPatna
GayaGaya
GorakhpurGorakhpur
BhagalpurBhagalpurVaranasi�Varanasi�AllahabadAllahabad
DhanbadDhanbad
Baleshwar
BarddhamanBarddhaman
BaharampurBaharampur
ImphalImphal
AizawlAizawl
KargilSrinagarSrinagar
JammuJammu
AmritsarAmritsar
LudhianaLudhianaJalandharJalandhar
AgraAgra
BikanerBikaner
Jodhpur
UdaipurUdaipur
Ajmer
Sikar AligarhAligarh
KotaKota
GwaliorGwaliorEtawahEtawah LucknowLucknow
ShahjahanpurShahjahanpur
Leh
UnderChinesecontrol
ChandigarhChandigarhDehra DunDehra Dun
SaharanpurSaharanpur
MeerutMeerutMoradabadMoradabad
ShillongShillong
GuwahatiGuwahati
DibrugarhDibrugarhNorth LakhimpurNorth Lakhimpur
KohimaKohima
RajkotRajkot VadodaraVadodaraPorbandar
Veraval
BhujBhuj
Bay of Bengal
AndamanIslands
NicobarIslands
INDIAN OCEAN
LaccadiveIslands
Arabian Sea
Line of Control
Gulf of Kachch h
Gulf ofKhambhat
Gulf ofMannar
Palk Strait
Brahmaputra R.
Brahmaputra R.
Yamuna R.
Yamuna R.
Ghaghara R.
Ghaghara R.
Son R.Son R.
Mahanadi R.
Kris hn a R.Kris hn a R.
Godav ari R.
Narmada R.
Narmada R.
Tapi R.Tapi R.
D e c c a nD e c c a n
Ea
ster
nE
ast
ern
Ghats
Western
Wes te rn
Gh
a tsG
ha ts
Ganga
R.
0 km 200 400 600 800
0 miles 200 400
' The Economist Intelligence Unit Limited 2005
August 2005
Main railway
Main road
International boundary
Province boundary
Main airport
Capital
Major town
Other town
ARUNACHAL PRADESH1
1
2
1515
2
33
44
ASSAM2
CHANDIGARH3
DADRA AND NAGAR HAVELI4
DAMAN AND DIU5
5
6
HIMACHAL PRADESH7
JAMMU AND KASHMIR8
MANIPUR9
9
MEGHALAYA10
10
MIZORAM11
11
NAGALAND12
12
PONDICHERRY13
13
13
13
SIKKIM14
14
15
TRIPURA15
17
17
HARYANA
6
7
8
UTTARANCHALWEST BENGAL
16
16

Country Profile 2005 www.eiu.com © The Economist Intelligence Unit Limited 2005
Comparative economic indicators, 2004
Gross domestic product(US$ bn)
Sources: Economist Intelligence Unit estimates; national sources.
0 50 100 150 200 250 300
Afghanistan
Sri Lanka
Vietnam
Bangladesh
Pakistan
Singapore
Indonesia
India
0.0 0.2 0.4 0.6 0.8 1.0 1.2
Afghanistan
Bangladesh
Vietnam
Pakistan
India
Sri Lanka
Indonesia
Singapore
0 2 4 6 8 10 12 14 16
Singapore
Bangladesh
India
Indonesia
Pakistan
Sri Lanka
Vietnam
Afghanistan
0 2 4 6 8 10
Pakistan
Indonesia
Sri Lanka
Bangladesh
India
Afghanistan
Vietnam
Singapore
Gross domestic product(% change, year on year)
Sources: Economist Intelligence Unit estimates; national sources.
Consumer prices(% change, year on year)
Sources: Economist Intelligence Unit estimates; national sources.
Gross domestic product per head(US$ �000)
Sources: Economist Intelligence Unit estimates; national sources.
658.00 25.2

India 1
© The Economist Intelligence Unit Limited 2005 www.eiu.com Country Profile 2005
Contents
India
3 Basic data
4 Politics4 Political background5 Recent political developments9 Constitution, institutions and administration10 Political forces15 International relations and defence
21 Resources and infrastructure21 Population22 Education23 Health24 Natural resources and the environment24 Transport, communications and the Internet27 Energy provision
29 The economy29 Economic structure30 Economic policy33 Economic performance35 Regional trends
36 Economic sectors36 Agriculture37 Mining and semi-processing38 Manufacturing40 Construction41 Financial services42 Other services
42 The external sector42 Trade in goods43 Invisibles and the current account44 Capital flows and foreign debt45 Foreign reserves and the exchange rate
47 Regional overview47 Membership of organisations
48 Appendices48 Sources of information50 Reference tables50 Population statistics50 Transport statistics50 Energy statistics51 Government finances

2 India
Country Profile 2005 www.eiu.com © The Economist Intelligence Unit Limited 2005
51 Gross domestic product52 Nominal gross domestic product by expenditure52 Real gross domestic product by expenditure53 Gross domestic product by sector, at constant prices53 Gross domestic product by sector, at factor cost53 Money supply54 Interest rates54 Prices and earnings54 Availability of selected consumption items55 Agricultural production55 Minerals production56 Industrial production56 Gross domestic savings56 Stockmarket indicators57 Main composition of trade57 Main trading partners58 Balance of payments, IMF series58 Balance of payments, national series59 External debt, World Bank series59 Foreign reserves59 Exchange rates

India 3
© The Economist Intelligence Unit Limited 2005 www.eiu.com Country Profile 2005
India
Basic data
3,287,263 sq km (including Indian-administered Kashmir); 57% is agriculturalland and 16% forest area
1.07bn (mid-2003)
Population in millions, 2001 census
Mumbai (Bombay) 16.4Kolkata (Calcutta) 13.2Delhi 12.8Chennai (Madras) 6.4Bangalore 5.7Hyderabad 5.5
Varied; humid subtropical in Ganges basin, semi-arid in north-west, tropicalhumid in north-east and most of peninsula, tundra in Himalayas; all areasreceive rain from the south-west monsoon in June-September; the south is alsoserved by the north-east monsoon in January-March
Hottest month, May, 26-41°C (average daily minimum and maximum); coldestmonth, January, 7-21°C; driest month, November, 4 mm average rainfall; wettestmonth, July, 180 mm average rainfall
Hindi is the national language and primary tongue of 30% of the population.There are 14 other official languages: Bengali, Telugu, Marathi, Tamil, Urdu,Gujarati, Malayalam, Kannada, Oriya, Punjabi, Assamese, Kashmiri, Sindhi andSanskrit. English is widespread in business circles and as a second language
Hindu (80.5% in 2001 census); Muslim (13.4%); Christian (2.3%); Sikh (1.9%);Buddhist (0.8%); Jain (0.4%)
Metric system. Numbers are often written in lakhs (100,000) and crores (10m)
Rupee (Rs)=100 paise. Average exchange rate in 2004: Rs45.30:US$1. Exchangerate on July 29th 2005: Rs43.44:US$1
April 1st-March 31st
5 hours 30 minutes ahead of GMT
January 26th; August 15th; October 2nd; also major Hindu, Muslim, Christianand other religious holidays
Land area
Population
Main towns
Climate
Weather in New Delhi(altitude 218 metres)
Languages
Measures
Currency
Fiscal year
Time
Public holidays
Religion

4 India
Country Profile 2005 www.eiu.com © The Economist Intelligence Unit Limited 2005
Politics
India is a parliamentary federal democracy with an indirectly elected president,Abdul Kalam. The prime minister, Manmohan Singh, leads the UnitedProgressive Alliance (UPA), a coalition dominated by the Congress party, whichfell short of a majority in the May 2004 general election. The minority UPAgovernment is currently being supported by the Left Front, a group of left-wingparties dominated by the Communist Party of India (Marxist).
Political background
The urban Indus civilisation flourished in west and north-west India around5,000 years ago. India was a major exporter of textiles and spices and tradedwith Arabia, Egypt, Rome, south-east Asia and China. Migrants and invadersfrom central and western Asia have entered India many times since, if notbefore, Alexander the Great did so in the 4th century BC. As a result, India, theworld�s second-largest country by population and sixth-largest in terms of area,exhibits a great diversity of people, religions and culture.
In 1526 a central Asian warrior, Babur, invaded India and established theMughal empire. After Vasco Da Gama discovered the sea route to India via theCape of Good Hope in 1498, a series of European chartered companies!Portuguese, British, Dutch, French and Danish!set up trading posts andcolonies in India. The British East India Company eventually dominated, and in1757 the Mughal emperor granted it the right to administer Bengal. By then theMughal dynasty was in decline and the Marathas from the west had becomethe dominant power. After the East India Company defeated the Marathas in1818, it had no military rival. Following a major Indian revolt in 1857, the EastIndia Company deposed the last Mughal emperor, Bahadur Shah. Withinmonths, its charter to trade with India was abrogated by the Britishgovernment, which annexed the Company�s Indian territories.
British rule in India ended in 1947 after a sustained campaign for independence,led by the Indian National Congress (Congress). British India was partitioned,amid great bloodshed, to create Muslim-majority Pakistan and the secular stateof India. India�s first prime minister was the Congress leader, Jawaharlal Nehru.Under his government, India established a complex system of socialisteconomic controls that remained in place until the 1980s. Congress and itssuccessor!Congress (Indira), or Congress (I), named after Nehru�s daughter,Indira Gandhi, who became prime minister in 1966!dominated politics inIndia until the 1990s. Indira Gandhi�s administration continued to implementan inward-looking economic policy but adopted increasingly authoritarianmeasures. In 1975 she declared a state of emergency that lasted for two years.Civil rights were suspended, the press was controlled, many of her critics wereimprisoned and her son, Sanjay, began an unpopular mass-sterilisationprogramme to stem population growth. In the 1977 general election, votersrejected Mrs Gandhi. Her party was defeated and she lost her seat.
Early history
Independence and dominanceof Congress

India 5
© The Economist Intelligence Unit Limited 2005 www.eiu.com Country Profile 2005
Having returned as prime minister in 1980, Mrs Gandhi tacitly supported aviolent movement against the Akali Dal, the ruling Sikh party in Punjab.However, the violence became uncontrollable and she finally ordered thearmy to storm the Golden Temple, the prime Sikh shrine in Amritsar, and killthe terrorists� leader. In retaliation, in 1984 she was assassinated by her Sikhbodyguards, and her elder son, Rajiv Gandhi, succeeded her as prime minister.He won an unprecedented majority in an election later that year, and hisadministration began cautious steps towards economic liberalisation. How-ever, Congress lost its majority in the 1989 general election amid a series ofcorruption scandals, and Mr Gandhi stepped down. He was assassinated by aSri Lankan Tamil extremist during the 1991 election campaign.
Following the 1991 general election, Congress formed a minority governmentunder Narasimha Rao that initiated a series of economic reforms. The May 1996elections returned another hung parliament. The Hindu-nationalist BharatiyaJanata Party (BJP) formed a government that lasted just 13 days; this wasfollowed by a left-leaning United Front (UF) coalition, which was supportedfrom the backbenches by Congress. The UF government continued toimplement the economic reforms begun under Congress, but when Congresswithdrew its support in November 1997 the government fell. A general electionheld in February-March 1998 produced yet another hung parliament. The BJPfinally formed a governing coalition, the National Democratic Alliance (NDA),with 22 other parties under the leadership of Atal Behari Vajpayee, a moderate.
In April 1999 the NDA government collapsed after narrowly losing a vote ofconfidence. It remained as a caretaker administration for six months beforere-establishing itself in power following a general election held in September-October 1999. The alliance of more than 20 parties included a number ofsmaller regional and cast-base parties, which exercised disproportionateinfluence in government, often holding the administration to ransom to gainconcessions in their home states. Coalition governance has become a con-tinuing feature of Indian politics on the federal, and increasingly on the state,level since 1996. On both levels it seems that coalition governments have foundit hard to push through policies, particularly those requiring legislative action.
Recent political developments
The BJP government in 1998 gave the go-ahead for the testing of nuclearbombs!a reflection of the party�s determination to raise India�s profile as anaspiring world power!even at the cost of economic sanctions. Economically,the BJP remained pragmatic during its time in government and pursuedreformist policies. Politically, the BJP had to abandon some of the party�s policycornerstones, including the building a Hindu temple on the site of the Ayodhyamosque and abolishing India"s separate civil code for India"s Muslims to get thesupport of secular parties. Mr Vajpayee�s popularity and integrity did much tomove the party towards the political mainstream and put pragmatism overideology. Consistent with this attempt to reinvent the essentially still Hindunationalist party, the BJP government toned down its hardline Hindu-nationalist rhetoric in a bid to appeal to more mainstream voters as the 2004
The BJP leads a coalitiongovernment from 1998 to 2004
The age of coalition politics

6 India
Country Profile 2005 www.eiu.com © The Economist Intelligence Unit Limited 2005
general election approached. It presented itself both as a party that deliveredeconomic prosperity and as a steward of a strong India with a presence on theglobal stage. The BJP promoted its �India is shining� campaign, which aimed tocapitalise on a buoyant economy!partly the result of its economic reforms, butalso of good fortune. In contrast, the opposition Congress party presented itselfas the defender of India�s inclusive, secular heritage. It tried to appeal to votersacross castes and religions, as well as to the poor, who had not seen the fruitsof economic reform.
The �India is shining� campaign backfired, with poor rural voters denied anynew-found prosperity, and in a surprise victory a Congress-led coalition, theUnited Progressive Alliance (UPA), was narrowly elected to power in the May2004 general election!the Congress party (on its own) won only eight seatsmore than the BJP. However, the UPA fell short of a majority and is beingsupported in parliament by the Left Front group of communist parties, althoughthese parties have chosen not to join the government and are supporting it�from outside�. The minority government is led by Mr Singh, who was swornin as prime minister following the refusal of the Congress leader, Sonia Gandhi,to take up the post. Mrs Gandhi remains the Congress party president and isthe Congress leader in parliament. Mr Singh, who has held many importantpositions in the economic and civil service hierarchy in India, is a respectedeconomist, a pragmatist, and is highly regarded across the political spectrum. Inhis first year in government, the prime minister has managed to hold togetheran unwieldy coalition and has pursued a gradualist economic reform agenda.On the foreign policy front, Mr Singh, a Sikh born in the Pakistani portion ofPunjab province, has continued a policy of rapprochement with Pakistan andhas pushed India�s bid for a permanent seat on the reformed UNSecurity Council.
The new cabinet consists of non-reformist Congress stalwarts, alliancemembers, and two pro-reformers in key positions, namely Mr Singh as primeminister and Palaniappan Chidambaram as finance minister. Forces within thecabinet will pull in both a pro-reform and an anti-reform direction. As underthe previous administration, the government�s performance is likely to behampered by pervasive lobbying of the government by coalition partners forspending and concessions benefiting narrow interest groups. Concerns that theBJP may regain power if the government falls are likely to deter coalitionpartners from withdrawing support. However, the minority government isinherently unstable, and may not last its entire five-year term.
Congress returns to power

India 7
© The Economist Intelligence Unit Limited 2005 www.eiu.com Country Profile 2005
Composition of the Lok Sabhaa, Jun 2004United Progressive Alliance (governing coalition) 217 Indian National Congress 145 Rashtriya Janata Dal 21 Dravida Munnetra Kazhagam 16 Nationalist Congress Party 9 Pattali Makkal Katchi 6 Telengana Rajya Sabha 5 Jharkhand Mukti Morcha 5 Marumalarchi DMK 4 Lok Jan Shakti Party 3 J&K People�s Democratic Party 1 Republican Party (Ambedkar) 1 Muslim League 1Left Front (supporting the governing coalition) 59 Communist Party of India (Marxist) 43 Communist Party of India 10 Others 6National Democratic Alliance (opposition) 185 Bharatiya Janata Party (BJP) 138 Shiv Sena 12 Biju Janata Dal 11 Shiromani Akali Dal 8 Janata Dal (United) 7 Telugu Desam Party 5 All India Trinamool Congress 2 Nagaland People�s Front 1 Mizo National Front 1
Other parties 78 Samajwadi Party 36 Bahujan Samaj Party 19 Other parties 19Independents 4Presidential appointees 2Total 545
a The lower house of parliament.
Source: Lok Sabha.
Important recent events
June 2001
India calls off the ceasefire in Kashmir and invites Pakistan�s leader, General PervezMusharraf, to meet in India to discuss relations between the two countries, includingthe Kashmir issue.
December 2001
Four terrorists try to enter the Indian parliament and are killed after a four-hourshoot-out. India accuses Pakistan of having instigated the attack, and moves troops tothe border.

8 India
Country Profile 2005 www.eiu.com © The Economist Intelligence Unit Limited 2005
February 2002
A Muslim mob attacks Hindu volunteers travelling back from Ayodhya in Godhra inGujarat. Fifty-seven are burnt alive in a railway carriage. Riots follow in Gujarat inwhich 900 people are killed and over 100,000 rendered homeless.
October 2002
India announces that it will begin to withdraw its troops from its border withPakistan, and Pakistan reciprocates.
April 2003
The prime minister, Atal Behari Vajpayee, begins moves to defuse tensions withPakistan, re-establishing communication and diplomatic links.
June 2003
India and China reach de facto agreement over the status of Tibet and also ofSikkim!a state whose accession to India in 1975 China still refuses to recogniseofficially!in a crossborder trade agreement.
November 2003
India matches Pakistan�s offer of a ceasefire along the Line of Control in Kashmir.Pakistan�s unilateral offer followed measures announced unexpectedly by the Indiangovernment in October to improve ties with its neighbour.
December 2003
India and Pakistan agree to resume direct air links and to allow overflights. India hadsuspended air links after the December 2001 attack on the Indian parliament, whichit blamed on Pakistani terrorists.
January 2004
A groundbreaking meeting is held between the Indian government and moderateKashmiri separatists, marking a new chapter in the 14-year stand-off between theIndian government and the separatists.
February 2004
Formal peace talks over the disputed region of Kashmir are held in the Pakistanicapital, Islamabad.
May 2004
A general election returns the Congress-led United Progressive Alliance to poweragainst all expectations. Sonia Gandhi, the Congress leader, refuses to become primeminister. Manmohan Singh, a former finance minister and reformer, is sworn in asprime minister.
September 2004
India, along with Brazil, Germany and Japan, launches a campaign for a permanentseat on the UN Security Council.
December 2004
Thousands die in the Asian tsunami; the Andaman and Nicobar Islands aredevastated.

India 9
© The Economist Intelligence Unit Limited 2005 www.eiu.com Country Profile 2005
April 2005
A bus service between Srinagar, in Indian-controlled Kashmir, and Muzaffarabad, inPakistani-controlled Kashmir, comes into operation.
July 2005
Islamist militants attack a holy site in Ayodhya!the flash-point of Hindu-Muslimstrife in 1992--raising concerns over possible renewed inter-community violence inIndia and a stalling of improving relations between India and Pakistan.
Constitution, institutions and administration
The Republic of India is a constitutional federal democracy made up of28 states and seven union territories. The Indian constitution defines thedivision of most powers between the centre and the states, although the centretakes precedence in relation to residual powers. Representation in parliamenthas been frozen on the basis of the results of the 1971 census. Given thatpopulation growth is much higher in the northern states, the relative value ofvotes cast in the north in terms of political representation has fallen. TheNational Population Council has recommended an extension of the �freeze�on representation until 2026. This is likely to become a source of major tensionbetween the country�s northern and southern states. India�s federal structureoften leads to demands for further devolution of powers to the states, as wellas demands for new states to be created. In 2000 three new states!Chhattisgarh, Jharkhand and Uttaranchal (all three northern states with strongtribal representations)!were formed from Madhya Pradesh, Bihar and UttarPradesh respectively.
The Indian constitution provides for an independent judiciary, with highcourts in every state and a Supreme Court in New Delhi. There are two housesof parliament. The lower house, or Lok Sabha (house of the people), is electedevery five years by universal adult suffrage. The prime minister is elected bythe Lok Sabha. Members of the upper house, or Rajya Sabha (house of thestates), are elected by their respective state legislatures, according to statequotas based on population. The president is elected every five years by bothhouses of parliament and the state legislatures. He is confined to acting on theadvice of the Council of Ministers, which is chosen by the prime minister.
India is the world�s most populous democracy and has held regular and largelyfree elections since 1947. For members of parliament, the chances of re-electionto the Lok Sabha are low (as anti-incumbency is a key trend in Indian politics),tending to increase the incentives for politicians to maximise their personalgains rather than working for the welfare of their electorate. The ElectionCommission of India (ECI) has wide powers to requisition the governmentmachinery for elections and has ensured fairly orderly elections; in 2003 it wonthe right to make candidates disclose criminal records. However, there areoccasional cases of poll rigging and intimidation; spending limits on candidatesare poorly enforced and candidates with criminal records are sometimeselected, particularly to the state assemblies. A high level of political awarenessand the sheer size of the electorate nevertheless generally ensures that the final
Federalism
The judiciary and thelegislature
Democracy and corruption

10 India
Country Profile 2005 www.eiu.com © The Economist Intelligence Unit Limited 2005
results reflect the wishes of the people, and the ousting of incumbentadministrations is increasingly frequent.
Congress, which led the agitation for independence, emerged as the dominantparty thereafter and won elections in most states in the 1950s and 1960s,although the communists and Tamil separatists occasionally won state-levelelections. The situation changed following the 1975-77 state of emergency. Casteand regional splinters from the opposition alliance that won the 1977 electionwere increasingly successful in state elections. In the current political landscape,none of the three national parties!Congress, the BJP and the Communist Partyof India (Marxist)!can hope to win a majority in the central government on itsown, and each needs to ally itself with more localised parties.
India�s 28 states vary enormously in size, population and natural resources. Thecentre�s powers to tax income, production and foreign trade give it far greateraccess to revenue, a large part of which is shared out among the states by theplanning commission and by finance commissions that are appointed everyfive years. The states cannot borrow without the centre�s permission. However,as the central government has become increasingly reliant on the support ofregional allies, it has found it harder to refuse the states� demands to managetheir own finances. The deficits of both the centre and the states are largelyfinanced by banks and financial institutions, which channel public savings tothe governments. This pre-emption of bank funds to finance excessconsumption by the government!amounting to about 10% of GDP per year!has become a drag on economic growth.
As central controls on industry, finance and foreign trade have been relaxed inthe past decade, industry has received the freedom to relocate but has facedgreater competition. These competitive pressures have been passed on to thestates, which have tried to attract and retain industry. In this competition, theadvanced western and southern states have been more successful: as foreigntrade has become freer, industry has moved closer to Gujarat, Maharashtra,Karnataka and Tamil Nadu. In an effort to cut costs, producers have alsomoved closer to suppliers and markets. This has led to a prolonged slump inlong-distance road transport, from which it is now slowly emerging.
Political forces
Congress led the campaign for independence and has remained a powerfulforce in Indian politics, transcending religious, ethnic and caste divisions.However, it is also a party tightly focused on its heritage: members of theNehru-Gandhi family have led the party throughout most of its history. India�sfirst prime minister, Jawaharlal Nehru, was succeeded by Lal Bahadur Shastri,who died within a year of taking office. The party then turned to Nehru�sdaughter, Indira Gandhi, who remained leader until her assassination in 1984when her son, Rajiv, took over as party leader. Rajiv was assassinated in 1991and Congress is now led by his widow, Sonia.
The centre versus the states
The Congress party

India 11
© The Economist Intelligence Unit Limited 2005 www.eiu.com Country Profile 2005
The decline of Congress began when Indira Gandhi declared a state ofemergency. Her opponents combined to form the Janata Party, which won the1977 election. In 1980 Indira Gandhi brought down the Janata government andreturned to power. Rajiv came to power in 1984 with the largest majority everand the aim of liberalising and modernising government, but he was soonmired in a corruption scandal and lost the 1989 election. He too managed tosplit and finally bring down the Janata Dal government that followed him, buthe was killed before the 1991 general election. Although falling just short of amajority, Congress formed a government after the election and, under the spurof a balance-of-payments crisis, carried out considerable economic liberalis-ation. That did not, however, save it from defeat in the 1996 election.
As repeated efforts to form a national alternative failed, the electorate turned toregional and caste-based parties. Following Congress�s poor performance in the1998 general election, Rajiv Gandhi�s Italian-born widow, Sonia, gave in torepeated requests and took over as party leader. However, her foreign birth hasprompted criticism in parts of Congress as well as from the BJP. Three Congressparty members were expelled from the party for challenging Mrs Gandhi�scredentials for the leadership; they included a powerful senior figure, SharadPawar, who went on to establish the Nationalist Congress Party (NCP) in theelectorally significant state of Maharashtra!where Congress and the NCP makeup a coalition state government.
The stability of the current Congress-led government depends crucially on howreadily the Left Front group of communist parties withdraws its support in caseof disagreement over policy. Experience so far suggests that instability at thestate level could unsettle the UPA�s coalition at the centre. For instance,Congress�s most important coalition partner, the Rashtriya Janata Dal (RJD)party, saw its fortunes wane in state elections in Bihar in February 2005. Withno coalition to form a government, the state has been placed under presidentialrule for at least six months. State assembly elections in West Bengal andKerala!the two bastions of the Communist Party of India (Marxist), or CPI (M),on whose support the UPA relies!will test the coalition in 2006. Equallyimportant, however, are divisions within Congress that could result ingovernment instability. Loyalties in the Council of Ministers are likely to be splitbetween Mr Singh and Mrs Gandhi. Mrs Gandhi will have to reconcile thedemands of individual members of the government as well as interest groupswithin the diverse Congress party in order to secure a stable government.
Congress�s success in the 2004 general election is evidence that the dynasticclaim still exerts considerable force, particularly in rural areas. Congress profitedfrom the excitement created by the candidacy of Rahul Gandhi, Mrs Gandhi�sson, and her charismatic daughter, Priyanka. Both are widely believed to belikely future candidates to lead the party.
The Bharatiya Janata Party (BJP) traces its roots back to the Bharatiya Jan Sangh,a party representing traditional Hindu values and the interests of smallbusinessmen, traders and the middle class. It is the political wing of a group ofinterconnected cultural and religious movements!the Sangh Parivar!of whichthe most politically significant is the RSS (Rashtriya Swayamsevak Sangh), a
The BJP

12 India
Country Profile 2005 www.eiu.com © The Economist Intelligence Unit Limited 2005
disciplined cadre organisation that counts the leader of the BJP, Lal KrishnaAdvani, and the BJP�s chairman, Atal Behari Vajpayee, among its formermembers. The RSS, one of whose members assassinated Mahatma Gandhi, isseen by its critics as a sinister, anti-Muslim group.
The BJP emerged as a significant force in the 1989 general election, winning 88seats. A central campaign issue was the demand that a Hindu temple beconstructed on the site of the Babri mosque in Ayodhya in Uttar Pradesh!which many Hindus believe was built upon the site of a temple marking thebirthplace of the Hindu god-king Ram. In the 1991 election, the BJP establisheditself as the main national opposition and won power in four states. InDecember 1992 Sangh Parivar activists demolished the Babri mosque, triggeringcommunal riots that left thousands dead. In the 1993 state elections, the BJPsuffered setbacks and won just one state administration, but in the 1996 generalelection it won 160 seats in the Lok Sabha.
In May 1996 the BJP formed its first national government, led by Mr Vajpayee,which lasted just 13 days. The BJP re-emerged as the power broker in 1998,when it won 182 seats in the general election and cobbled together a coalitionof 13 parties under Mr Vajpayee�s leadership. The coalition proved unwieldy,collapsing in April 1999. However, Mr Vajpayee proved himself able to rallyparties of disparate political persuasions to form a government. Anotherelection in September-October 1999 returned a BJP-led coalition of 20 partnersto power. Members of the new coalition, the National Democratic Alliance,campaigned under a common platform and won 302 seats. Despite theincreased majority, however, the range of parties involved in government leftthe alliance vulnerable to the whims of smaller regional parties.
Mr Vajpayee sought to rein in the party�s more extreme Hindu nationalistmembers, particularly in relation to questions of economic reform. But theparty�s reformist credentials proved increasingly shaky in the face of conflictingdemands from coalition members and resistance from the BJP�s nationalistwing. The close relations the party cultivated with leading industrialists alsoresulted in increased protection for some industries from foreign competition.On the foreign policy front, Mr Vajpayee sought improved relations withneighbouring Pakistan and paved the way for further confidence-buildingmeasures implemented by the UPA government, including the partial with-drawal of Indian troops from Kashmir in November 2004 and the establish-ment of a crossborder bus link in April 2005.
Since the electoral defeat in May 2004, the BJP has been in disarray. Following afurther electoral defeat in October of that year in the politically important stateof Maharashtra, the party appointed Lal Krishna Advani, one of the founders ofthe BJP and previously Mr Vajpayee�s right-hand man, as party president. TheBJP�s identity crisis worsened in June 2005 when Mr Advani offered to stepdown as party president following a trip to an official visit to Pakistan, duringwhich he described Pakistan�s founder, Mohammed Ali Jinnah, as a �secular�leader. The comments, possibly made by Mr Advani in an attempt to shed hisimage as a hardliner and to move the party more towards the mainstream,divided the BJP right down the middle and created an outrage with Hindunationalist organisations close to the BJP!one of the cardinal tenets of modern

India 13
© The Economist Intelligence Unit Limited 2005 www.eiu.com Country Profile 2005
Indian historiography is that Mr Jinnah was the non-secular architect of thetwo-nation theory (an India for Hindus and a Pakistan for Muslims). Shortlyafterwards Mr Advani retracted his resignation offer. As a result, althoughnominally still in charge, Mr Advani�s position as party president has weakenedand a struggle for party leadership has ensued. The outcome of the struggle islikely to determine whether the BJP will go back to its traditional values ofHindu nationalism or evolve into a more moderate force in Indian politics.
The Communist Party of India (CPI) emerged from Congress, splitting from theIndian National Congress during the second world war. The CPI itself later splitto form a Marxist group, the Communist Party of India (Marxist) or CPI (M).The CPI (M) is strongest in West Bengal, where it has been in power for twodecades, and it has frequently held power in Kerala. Although the �third force�includes several powerful regional parties that are increasingly important in afractured political scene, these parties have no strong ideological commitmentto a common agenda. Instead, they are motivated by state or caste interests thatcan often be better served through alliances with the BJP or Congress. Morerecently, the Left Front group of communist parties decided not to formally jointhe Congress-led UPA government, but to support it from �the outside�. TheCommunists strongly oppose the deregulation of the labour market andprivatisation, but have at times been more pragmatic on other policy issuessuch as foreign investment.
Main political figures
Manmohan Singh
Prime minister. Mr Singh has held many important positions in the economic andcivil service hierarchy including governor of the Reserve Bank (the central bank) anddeputy chairman of the Planning Commission. An Oxford-educated economist, MrSingh is widely respected across political parties and has a reputation of being apragmatist. However, his critics argue that he is a weak political figure governing atthe request of Sonia Gandhi. Throughout his political life he has been an appointee!he has never won a seat in India�s lower house of parliament, the Lok Sabha.
Sonia Gandhi
Congress party leader in parliament and Congress party president. Mrs Gandhi (neeMaino) is the Italian-born widow of a former prime minister, Rajiv Gandhi. She ledCongress to success in the 2004 general election but declined the offered post ofprime minister. This move enhanced her moral stature in a culture with a longhistory of renunciation. She retains significant appeal in rural areas, although herItalian origins often count against her.
Rahul and Priyanka Gandhi
Mrs Gandhi"s children and heirs to the Nehru-Gandhi dynasty. In the 2004 electioncampaign, Rahul and his sister, Priyanka, emerged as the Congress�s star cam-paigners, galvanising the campaign by their youth and emphasising the fact that thecentury-old Gandhi-Nehru dynasty remains India�s most powerful and charismaticpolitical family. Rahul was elected to the lower house of parliament for the first timeand is being groomed as the next leader of the Congress party. Since 2004 he haskept a low profile, leaving all major decisions to his mother and the prime minister.
The communist parties
14 India
Country Profile 2005 www.eiu.com © The Economist Intelligence Unit Limited 2005
Palaniappan Chidambaram
Finance minister. Mr Chidambaram is a suave, articulate politician from the southernIndian state of Tamil Nadu. He is well known for his pro-market reforms, particularlytax reform and budgetary discipline, during his tenure as finance minister in 1996-98.A Harvard-educated lawyer and a strong supporter of the World Trade Organisation,Mr Chidambaram is popular with businessmen.
Shivraj Patil
Interior minister. A respected and experienced politician, he held several ministriesunder the Congress governments of Indira and Rajiv Gandhi. His appointment to thekey position of interior minister came as surprise because he lost his seat in the May2004 general election.
Natwar Singh
External affairs minister and Gandhi confidant. A career diplomat and formerambassador to Pakistan, Mr Singh was a junior minister in Rajiv Gandhi�s cabinet.
Pranab Mukherjee
Defence minister. A prominent Gandhi family loyalist, Mr Mukherjee held at leasthalf a dozen important ministries in past Congress governments, including financeand external affairs. He has close links with the left.
Laloo Prasad Yadav
Railway minister. Informally rules the most lawless state of Bihar by proxy. TheRashtriya Janata Dal (RJD) leader made his wife, Rabri Devi, the chief minister of thestate in 1997, following a corruption scandal that forced him to resign. He formed theRJD in 1997, after breaking away from the Janata Dal party. His party is a key ally ofCongress in the United Progressive Alliance (UPA) government.
Lal Krishna Advani
Leader of the opposition Bharatiya Janata Dal (BJP) party. The former deputy primeminister under Mr Vajpayee is often described as a soft-spoken hardliner. He createda major controversy in 1992 by leading a rath yatra (chariot journey) to the city ofAyodhya, a trip that culminated in the destruction of the Babri mosque. Mr Advaniis credited with making the BJP a major political force since 1984, when it held onlytwo parliamentary seats.
Atal Behari Vajpayee
Former prime minister and former foreign minister (in a left-right anti-Indira Gandhicoalition in the late 1970s). Mr Vajpayee has had a distinguished parliamentarycareer. Following the BJP�s defeat in the May 2004 general election, he is now theparty�s chairman, a newly created and largely symbolic position, and is likely to actas an elder statesman guiding the party.
Abdul Kalam
President of India. A former scientist and founding father of India�s nuclear-missileprogramme. A Muslim, Mr Kalam, who is widely respected, was elected president byan overwhelming majority in July 2002.

India 15
© The Economist Intelligence Unit Limited 2005 www.eiu.com Country Profile 2005
Somnath Chatterjee
Lok Sabha speaker. A veteran Marxist leader, Mr Chatterjee is the first communistleader to occupy this position. A member of parliament for the tenth time,Mr Chatterjee has established a rapport with politicians across party lines.
Mulayam Singh Yadav
Chief minister of Uttar Pradesh, India�s most populous state. Leader of the UttarPradesh-based Samajwadi Party and former defence minister in the United Front(UF) coalition. Important among the new breed of �backward caste� politicians.
International relations and defence
India became independent in 1947 at the start of the cold war. Mr Nehru hadvisited the Soviet Union in the 1930s and felt that it provided the best economicmodel for India�s development. Consequently, India did not join the Westernalliance, and instead followed a policy of neutrality between the two blocs.Pakistan, meanwhile, joined the US-led South-east Asian Treaty Organisation.India�s defeat by China in a short war in 1962 brought the US and India brieflycloser, but, as Indian relations with Pakistan deteriorated, US sympathy forIndia waned. In 1971, when Hindu refugees from East Pakistan flooded intoIndia, India decided to attack Pakistan and, to ward off the US, entered into atreaty with the Soviet Union. The treaty provided India with low-cost securityfor the next 18 years.
Since the collapse of the Soviet Union, India has built closer relations with theUS and the West. Its liberal reforms in the early 1990s also made it morereceptive to foreign trade and investment, and led Western countries to take agreater interest in India. The 1998 nuclear tests caused a glitch in the process,but it has continued nevertheless. Indian-US relations entered a new era in2005 when the two countries agreed to deepen their co-operation in the area ofdefence, including joint weapons production, greater technology sharing andincreased trade in arms. In July 2005 the US president, George W Bush, camevery close to recognising India as a nuclear power when he offered the country�full civil nuclear energy co-operation and trade�, thereby ending sanctions inplace against India since its refusal to sign the Nuclear Non-Proliferation Treaty(NPT). (Since 1968 it has been a tenet of US foreign policy that only countriesthat sign the NPT are permitted access to US nuclear technology.) Nevertheless,Mr Bush side-stepped the issue of backing India�s bid for permanentmembership on the UN Security Council by arguing that the UN first requireda series of �administrative� reforms. Meanwhile, India has stepped up itsmilitary expenditure considerably in the past five years.
India has fought three wars with Pakistan and one with China sinceindependence. Disputes with Pakistan have been mainly territorial. In 1947Pakistani tribesmen invaded the mainly Muslim princely state of Jammu andKashmir, and Indian forces intervened at the request of the state�s Hindumaharaja. The resulting war left about one-third of Kashmir with Pakistan andthe remainder with India (in 1963 Pakistan ceded some of the territory itcontrolled to China). Kashmir remains the subject of bitter dispute between the
Relations with Pakistan look alittle brighter
Independence and itsaftermath

16 India
Country Profile 2005 www.eiu.com © The Economist Intelligence Unit Limited 2005
two countries. A short war was fought in 1965 over a Pakistani incursion intodisputed territory in Kutch. Another was fought over the exodus of Hindurefugees from East Pakistan in 1971; it ended with the separation of East andWest Pakistan, and the creation of Bangladesh.
The victory of the BJP-led coalition at the general election in 1998 produced anotable cooling in relations with Pakistan, compounded by both countries�nuclear tests in May that year. Talks between the two sides resumed in October1998, culminating in the so-called bus diplomacy that saw Mr Vajpayee journeyacross the border for talks with his Pakistani counterpart, Nawaz Sharif, thefollowing year. However, any thaw was quickly undone when Pakistani-backedinsurgents crossed the Line of Control (LoC) dividing Indian and Pakistanipositions in Kashmir, capturing several high-altitude Indian border posts in theKargil sector in May 1999. During two months of intense fighting each side losthundreds of men, and the conflict threatened to escalate into all-out war. Thecrisis was resolved in July, when the Pakistani government agreed to withdrawthe intruders. Three months later the commander-in-chief of the Pakistani army,General Pervez Musharraf, staged a coup and removed Mr Sharif�s electedgovernment.
In November 2000, two years after the failed bus diplomacy of 1998, Indiaagain took the initiative on Kashmir, announcing, and subsequently extending,a unilateral ceasefire. At the end of May 2001 Mr Vajpayee called off theceasefire and invited General Musharraf for talks in Agra in July. On the secondday of talks, General Musharraf said that an agreement on Kashmir must comebefore other normalising measures. His Indian hosts were embarrassed, andthe talks broke up without an understanding being reached.
After the September 11th 2001 terrorist attacks in the US, General Musharrafsupported US action against the Taliban in Afghanistan and subsequentlybanned some terrorist organisations operating from Pakistan. India gaveGeneral Musharraf a list of 20 wanted terrorists, but Pakistan refused to handthem over. After the aborted attack on India�s parliament in December 2001,India identified the attackers and their handler as Pakistanis. India reduceddiplomatic representation in Pakistan, suspended bus, train and air services,and stopped Pakistani overflights. The number of terrorist attacks in Jammuand Kashmir increased in the next six months, and in early 2002 both countriesmoved troops to the border. In October 2002, however, the People�s DemocraticParty (PDP) was elected to government in Jammu and Kashmir, forming anadministration with the support of Congress. The PDP is committed toreconciliation, and at the invitation of the new chief minister, MuftiMohammad Sayeed, Mr Vajpayee addressed a public meeting in Srinagar inApril 2003, when he �extended the hand of friendship� to Pakistan.
In November 2003 India matched Pakistan�s unilateral offer of a ceasefire alongthe LoC in Kashmir. The offer followed measures announced unexpectedly bythe Indian government to improve ties with its neighbour a month earlier. InDecember 2003 India and Pakistan then agreed to resumed air links and toallow overflights. A groundbreaking meeting was also held between the Indiangovernment and moderate Kashmir separatists in December 2003, marking anew chapter in the 14-year stand-off between the Indian government and the

India 17
© The Economist Intelligence Unit Limited 2005 www.eiu.com Country Profile 2005
Kashmiri separatists. In February 2004 formal peace talks over the disputedregion of Kashmir were held in the Pakistani capital, Islamabad.
The rapprochement between the two nuclear neighbours has continued underthe new Congress-led government since May 2004. India began a partial troopwithdrawal from Kashmir in November 2004. In January 2005 India andPakistan agreed to the single most important confidence-building measure inthe last 50 years!a bus route that links Indian- and Pakistani-controlledKashmir. Following their meeting in the Indian capital, New Delhi, in April,General Musharraf and the new Indian prime minister, Manmohan Singh,declared the peace process �irreversible�. Nevertheless, relations soured soonafter, when in June Pakistan�s information minister, Sheikh Rashid, admittedthat he had accommodated militant Kashmiri separatists in one of his resi-dences in the 1980s. Moreover, despite the recent positive rhetoric, the Kashmirissue remains unresolved and the situation in Kashmir remains volatile.
India�s relations with China have long been delicate. In 1957 India discoveredthat China had built a road across what it regarded as the north-east corner ofKashmir. (There was no administrative presence in this remote and arid deserttract, so that the road was not immediately noticed.) China rejected India�sterritorial claims, and a series of violent clashes between border guards tookplace over the next five years. In 1962, after a particularly bloody clash, MrNehru ordered the army to throw out the Chinese. The army was poorlyequipped and inadequately trained for mountain warfare, however, andwhereas the Chinese had built roads to the border, the Indian army had toascend along mule paths. The Chinese army dealt it a crushing defeat, but thendeclared a ceasefire. The defeat has made India circumspect. Despite the factthat China has a military alliance with Pakistan, and has given Pakistanconsiderable military assistance, the Sino-Indian border has been quiet for 40years. In the 1980s the two countries began talks to demarcate their frontier,although the work has progressed only slowly. In 2005, when the Chineseprime minister, Wen Jiabao, visited New Delhi, China formally abandoned itsclaim to Sikkim (whose accession to India in 1975 China had previously refusedto recognise officially) and pledged to support a larger role for India in theinternational arena. In recent years, Sino-Indian relations have increasinglybeen driven by economics. Bilateral trade between India and China hasincreased more than tenfold since the early 1990s and China is now India�ssecond-largest export market, and ranks fifth as a source of Indian imports.
The 1971 India-Pakistan war ended with the surrender of Pakistan�s entire armyin the east and the establishment of Bangladesh as an independent state.Relations between India and Bangladesh are nevertheless close, if notparticularly friendly. Various issues between the two countries remainunresolved, including Bangladeshi immigration into India, the sale of naturalgas to India, water-sharing of the many common rivers, and Bangladesh�salleged role in harbouring Indian insurgents. The Bangladeshi political scene ispolarised between the heirs of those who fought for independence fromPakistan on one hand, and the pan-Islamists, to whom the present governing
Relations with China haveimproved
Relations with Bangladesh arestrained

18 India
Country Profile 2005 www.eiu.com © The Economist Intelligence Unit Limited 2005
party is close, on the other. India is Bangladesh�s closest source of many goods,especially yarn for its export-oriented textile industry.
India intervened in Sri Lanka�s ethnic conflict when Indira Gandhi agreed toaid the Liberation Tigers of Tamil Eelam (LTTE, or Tamil Tigers) in the early1980s, although her son, Rajiv, later sent the Indian army in as peacekeepers.After a series of Tamil attacks, the army soon found itself embroiled in theconflict. India subsequently agreed to help the Sri Lankan government subduethe LTTE. After the Indian army suffered losses, the next prime minister, V PSingh, withdrew the defence force. In May 1991 an LTTE suicide squad killedRajiv Gandhi and since then India has steered clear of Sri Lankan affairs. As SriLanka has become more confident of India�s neutrality and as economic linkswith a fast-growing India have become more important, relations between thetwo countries have improved. Sri Lanka has built up Colombo into atransshipment port for imports destined for minor Indian ports. After Norwayarranged a ceasefire between the Sri Lankan government and the LTTE, bothsides asked for India�s involvement, but the Indian government is wary ofgetting involved again and of doing anything that would imply a recognition ofthe LTTE.
India conducted its first atomic test in 1974, after which Pakistan embarkedupon its own nuclear programme. By 1994 it was widely accepted that Pakistanhad acquired both the atom bomb and Chinese-supplied ballistic missiles.India has developed its own intermediate-range ballistic missile. In 1998 Indiatested nuclear devices, and Pakistan followed suit. The US president at the time,Bill Clinton, tried to persuade India to sign the Treaty on the Non-Proliferationof Nuclear Weapons (NPT) and the Comprehensive Test Ban Treaty (CTBT).However, India�s political establishment regards the two treaties as �nuclearapartheid� and refused to sign them as a matter of principle. The US came toaccept that it was highly unlikely that India would ever sign the treaties. In2005, in an effort to upgrade ties with India, the US changed its stance to theentire issue by stating that �as a responsible state with advanced nucleartechnology, India should acquire the same benefits and advantages as othersuch states� and offered India sensitive civil nuclear technology. It thereby defacto accepted India as a nuclear power.
India maintains the second-largest army in the world, with total armed forcesof 1.33m active servicemen and first-line reserves of another 535,000. However,its soldiers are poorly equipped, particularly for the demanding conditionsfaced in Kashmir. The army has a strictly non-political role, although the armedforces are often called upon to help beleaguered police forces in areas facingsecessionist movements, such as Kashmir and the north-east. Defenceexpenditure stood at US$19.1bn in 2004/05 or about 3% of GDP and, in view ofhistorically tense relations with Pakistan, is likely to remain high.
The armed forces is the secondlargest in the world
India�s approach to Sri Lankais now neutral
India is accepted as a de factonuclear power

India 19
© The Economist Intelligence Unit Limited 2005 www.eiu.com Country Profile 2005
Military forces, 2004/05India Pakistan China
ArmyPersonnel 1,100,000 550,000 1,600,000a
Main battle tanks 3,898 >2,461 7,580NavyPersonnel 55,000 24,000 255,000a
Frigates 16 7 42Submarines 16 11 69Air forcePersonnel 170,000 45,000 400,000Combat aircraft 679 415 >1,900
a Estimate.
Source: International Institute for Strategic Studies, The Military Balance 2004/05.
Security risk in India
Armed conflict
India has fought three wars with Pakistan!two over the disputed territory ofKashmir and one during Bangladesh�s war of independence!as well as a majorskirmish in Kargil in 1999 between Pakistan-backed militants and the Indian army.Shelling along the Line of Control (LoC), the de facto border that divides Indian andPakistani Kashmir, is commonplace. India accuses Pakistan of giving military backingto Kashmiri separatists and Islamic militants fighting against India in Kashmir, butPakistan claims only to give moral support to the insurgents and accuses India ofrepressing Muslims in Kashmir.
Tensions between the two nuclear powers have been high since an attack on India�sparliament building in December 2001, which India blamed on Pakistani-basedmilitant groups. Both countries mobilised troops, and stood on the brink of war.Hostility between the two countries has remained intractable, owing to theunderlying Kashmir dispute: each country faces considerable domestic pressure notto make concessions to the other in relation to Kashmir. However, in April 2003relations began to improve significantly, largely as a result of a US-backedinternational initiative to diffuse the crisis. India began a partial troop withdrawalfrom Kashmir in November 2004. The rapprochement with Pakistan has continuedunder the new Congress-led government. In April 2005, in the most importantpeace-building measure between the nuclear neighbours in four decades, a busservice between Srinagar in Indian-controlled Kashmir and Muzaffarabad inPakistani-controlled Kashmir came into operation!the first bus route across the LoCin over 50 years.
In the past, peace talks have floundered over the question of the relative importanceof Kashmir. India has argued that the Kashmir dispute is one of several issues thatneed to be resolved, and has attempted to improve bilateral relations through, forexample, the establishment of commercial links, in the hope that with betterrelations the Kashmir dispute will diminish in relative importance. In contrast,Pakistan argues that the Kashmir dispute is the central issue and the reason behindthe two countries� poor relations, and that without its resolution other confidence-

20 India
Country Profile 2005 www.eiu.com © The Economist Intelligence Unit Limited 2005
building measures will be impossible. Pakistan fears that, should militancy inKashmir end, India will feel little compulsion to offer Pakistan any concessionsregarding Kashmir.
India fought a war with China in 1962. Relations between the two countries arenevertheless generally neighbourly, although part of their common border in north-east India remains disputed. India�s relationship with Bangladesh is also reasonable,despite occasional clashes between border guards.
Terrorism
India suffers from occasional bomb attacks, often occurring on buses or trains, or atbus stations. Such low-level attacks are generally blamed on Pakistan�s intelligenceagency and Pakistani-backed militants. Numerous subnationalist groups operatewithin India, and although their activities are generally confined to specific areas,Kashmiri militants have conducted attacks in Delhi. The most daring of theseoccurred in December 2001, when a group of militants entered India�s parliamentbuilding, killing at least seven people. Kashmiri militants have also taken foreignhostages, notably in 1995 when four foreigners were kidnapped in Kashmir!the fourare presumed dead. Apart from Kashmiri militants, several other groups operate innorth-east India, campaigning for state status, or independence, for their regions.Maoist rebels operate in the tribal-dominated areas of central India, and are thoughtto be linked to the Communist Party of Nepal (Maoist).
Civil unrest
Religious clashes between Hindus and Muslims are not infrequent and, as events inGujarat showed in 2002, can escalate rapidly. In February 2002 a gang of Muslimsattacked a train carrying Hindus from Ayodhya, killing 57 people. Hindus respondedby attacking Muslims throughout Gujarat, and up to 1,000 are thought to have died.Communal clashes are often sparked or exacerbated by, for instance, property orcommercial disputes, rather than simply by religious intolerance. Such riots usuallytake place in poor districts of cities in northern India. Anti-Western protests haveoccurred in the past, often organised by Hindu extremist groups targeting Westernfood outlets, although incidents have declined since the Bharatiya Janata Party (BJP)took power in 1999 and attempted to attract foreign investment.
Crime
Petty crime is common in India. According to the National Crime Records Bureau(NCRB), in 2001 there were over 250,000 incidents of theft and over 100,000 ofburglary. Such statistics are likely to understate the prevalence of crime. Many crimesgo unreported, owing to a lack of confidence in the police. Bag-snatching andpick-pocketing is fairly common, particularly in crowded tourist areas. According tothe NCRB, there were over 36,000 murders in 2001.
Drug smuggling and organised crime
Organised crime is a concern in India, particularly in Mumbai. Protection andextortion rackets have flourished, particularly in the film industry and the mediagenerally, including cable companies. Some gangs are believed to have moved intotrade unionism. This problem is likely to have been exacerbated by the number ofpoliticians!particularly in state assemblies!with criminal records.

India 21
© The Economist Intelligence Unit Limited 2005 www.eiu.com Country Profile 2005
The worst incident connected to India�s underworld took place in Mumbai in 1993.A number of bomb explosions occurred, resulting in 257 deaths. The stock exchange,several hotels and other offices were hit, and hand-grenades were thrown at theinternational airport. The incidents were blamed on a combination of theunderworld and the Pakistani intelligence agency.
Resources and infrastructure
Population
According to the 2001 census, India�s population stood at 1.027bn on March 1stof that year. Even under fairly optimistic assumptions about the pace of futurefertility decline, India�s population is likely reach 1.4bn by 2025. Around half ofthe 400m increase in population is likely to occur in the northern states ofBihar, Madhya Pradesh, Rajasthan and Uttar Pradesh. The future fertilitydeclines in these states will determine the country�s demographics. In 2003India�s total fertility rate stood at 2.9 births per woman. However, regionaldifferences are vast. Uttar Pradesh�s total fertility rate stands at 4.7, whereas thatfor Kerala is 1.8!below the replacement level of 2.1 births per woman. Thenumber of females per 1,000 males was 933; the difference is due to femaleinfanticide, the neglect of female children and, lately, the abortion of femalefoetuses, although sex determination of the foetus is banned. The labourparticipation rate was 39% (52% for males and 26% for females). �Main� (that is,more or less fully employed) workers accounted for 78% of all workers (87% ofmales and 57% of females). The rest were �marginal� workers. Populationgrowth averaged 1.9% per year in 1991-2001, down from an average of 2.1% in1981-91 and 2.3% in the 1960s.
Life expectancy at birth increased to 63 years for men and 64 years for womenin 2001, from 32 years for both men and women in 1951. This comparesunfavourably with figures for China (69 years for men and 73 years for women)or Sri Lanka (70 years for men and 76 years for women). Mortality rates for theunder-fives have fallen significantly, from 127 per 1,000 population in 1970 to 67per 1,000 in 2001. However, the male mortality rate is significantly lower thanthe rate for females.
Population breakdown, 2001Total (m) % of total
Male Female Total Male Female TotalPopulation 531 496 1,027 51.7 48.3 100.0 Rural 381 361 742 37.1 35.1 72.3 Urban 150 135 285 14.6 13.2 27.8Aged 6 or below 82 76 158 8.0 7.4 15.4Literacy 340 227 567 33.1 22.1 55.2
Workers 276 127 402 26.8 12.4 39.2 Main 241 73 313 23.4 7.1 30.5 Marginal 35 54 89 3.4 5.3 8.7
Source: Census of India, 2001.
The population exceeds 1bnin 2001

22 India
Country Profile 2005 www.eiu.com © The Economist Intelligence Unit Limited 2005
The rate of contraceptive use for women between the ages of 15 and 49 in 2000was 52%. This compares with 83% in the same year in China. Increased use offamily planning methods is believed to have reduced the population growthrate to about 1.5%. If the present difference in fertility rates continues, India isexpected to overtake China as the world�s most populous country by 2030,with the population stabilising at around 1.5bn.
India has a relatively low level of urbanisation compared with most otherdeveloping countries in Asia: almost 60% of Indians live in villages with apopulation of less than 5,000. However, the rate of migration from rural tourban areas is increasing. The urban population constituted 28% of the total in2001, up from just over 25% in the mid-1990s, and is likely to reach 36% around2025. In 2001 there were 35 cities with a population above 1m; the number ofsuch cities is likely to rise to 70 by 2025, when they will contain about one-halfof the country�s urban inhabitants. The urban population is growing fastest instates like Bihar and Uttar Pradesh, which have comparatively low levels ofurbanisation. More developed states like Maharashtra and Tamil Naduexperience lower urban growth as their populations do not grow as fast. Thelargest urban agglomerations are Mumbai (16.4m in 2001), Kolkata (13.2m),Delhi (12.8m), Chennai (6.4m), Bangalore (5.7m) and Hyderabad (5.5m).
India�s population is extremely diverse, differentiated by language, religion,caste and class. A significant political divide exists between Hindus (81% of thepopulation) and other religious groups, including Muslims (13%), Sikhs andChristians. However, Hinduism is itself a highly stratified religion, and a largenumber of Hindus, particularly among the lower castes, do not have a politicalaffinity with Hindu nationalist movements. Another important distinction isthat between the primarily Hindi-speaking north, and the south, where anumber of vernacular languages are in use, together with English. English is alingua franca throughout the country, however, and competence in thelanguage is more a function of class than region.
Income, or consumption, differentials are significant but not high by develop-ing-country standards: the top fifth of India�s population accounts for around46% of income or consumption, whereas the bottom fifth accounts for around8%. About 25% of the population, or 260m people, were below the poverty line,as measured by an income level of less than one US dollar a day, in 2000.
Education
Rates of literacy among the population aged seven years and over have risenconsiderably during the 1990s. The 2001 census recorded literacy rates of 65.2%,up from 52.2% in 1991!the highest rise ever in a single decade. The male literacyrate was 75.6% in 2001 (up from 56% in 1981 and 27% in 1951), compared with54% for women (30% in 1981 and 9% in 1951). The 2001 census indicated adecline in the total number of illiterate people for the first time sinceindependence, with 21.5m fewer illiterate males and 10.5m fewer illiteratefemales in 2001 than in 1991. In spite of recent progress, India still lags behindin educational standards, both absolutely and compared with other developing
Population growth iscontrolled
Migration is shifting from ruralto urban
The population is diverse
The picture is mixed

India 23
© The Economist Intelligence Unit Limited 2005 www.eiu.com Country Profile 2005
countries: it has 17% of the world�s population, but some 40% of the world�silliterates. India also possesses a large pool of highly educated and vocationallyqualified people, although they make up a small fraction of the population.There are considerable regional variations in literacy rates: Kerala has a rate of91%, whereas Bihar has a rate of only 49%.
The rate of enrolment in primary schools has risen significantly in recentdecades, from 61% of the eligible age group in 1960 to over 98% in 1991. Thecorresponding rate of enrolment for girls rose from 40% to 83% in the sameperiod. The overall rate of enrolment in secondary schools rose from 20% in1960 to 44% in 1991 (with the female rate rising from 13% to 32%). The rate ofenrolment in higher education for males and females was 9% in 1990, thehighest by far for a low-income developing country, and up from 3% in 1960.
India has more than 225 universities, 6,800 affiliated colleges and 1,128polytechnics. Higher education is highly competitive, increasingly so as theeconomy has opened up and has created more well-paid jobs in the privatesector as a result. However, subsidies for higher education and a system ofpositive discrimination have resulted in a skewed education system. A greatnumber of students are accepted on the basis of caste or religion rather thanability, and cheating is a serious problem. India has also become a majorinternational centre for the recruitment of high-quality information technology(IT) staff. The renowned Indian Institute of Technology (IIT) has a distinguishedand international alumni including the CEO of the UK�s largest firm, Vodafone.
Health
Health indicators have improved significantly since independence, but theoverall level of healthcare remains poor. Life expectancy has risen from just 29years at independence to around 64 years, and child mortality rates have comedown. India has the largest HIV/AIDS epidemic in the world in absolutenumbers!about 5.1m people had acquired the infection by 2003. Whiletuberculosis and malaria are the biggest killers in India, it is quite possible that,in the absence of a scaled-up response, AIDS could become the leading causeof death at least in some parts of the country. Some progress has been made onnutrition, but malnutrition is widespread: according to the National NutritionMonitoring Bureau, less than 15% of the population are adequately nourished,although 96% receive adequate calorie intake. Daily average calorie intake in1998 was estimated at 2,280 kcal, compared with an Asian average of 2,770 kcal.Although there is one doctor per 1,916 head of population (1998 figures), doctorsare concentrated in urban areas, and this is reflected in health indicators.
Public spending on health in India stands at around 1% of GDP, equivalent toabout US$4 per person per year, and is lower than in many countries with asimilar level of development. Access to healthcare is a function of wealth.Private expenditure on healthcare accounts for 4% of GDP, or 81.6% of totalhealthcare spending. India has a rudimentary public healthcare system ofhospitals and clinics, but in general healthcare and medicines must be bought.It is estimated that only 10% of Indians have any form of health insurance, and
Universities dominate
Health indicators improveslowly
Access to healthcare is largelya function of wealth

24 India
Country Profile 2005 www.eiu.com © The Economist Intelligence Unit Limited 2005
most policies are inadequate. There are huge differences between states interms of health spending. In Kerala and Tamil Nadu, for example, public healthspending per head is double that in Bihar and Madhya Pradesh.
Natural resources and the environment
India is not well endowed with natural resources. The country accounts for2.4% of the world�s surface, but sustains around 17% of the world�s populationso the pressure on resources is intense. India�s main mineral reserves are coal,iron ore and bauxite. The vast majority of oil and gas are imported. Geo-graphical and climatic differences are large and partly explain the variation ineconomic performance across India�s regions. Unlike in developed countriessuch as the US, where about 2% of the labour force feeds the whole population,in India around 60% of the labour force is employed in agriculture. Migration islimited and the vast majority of Indians remain �bound to the land�. Around40% of cultivated land is irrigated, leaving most farmers dependent entirely onthe annual monsoon. A large proportion of the population live in tropical, arid,or highland ecozones. Unlike in China, where 30% of the population live intemperate ecozones, in India�s case this figure is zero. India�s position in termsof coastal access is at a comparative disadvantage with only 38% of thepopulation living within 100 km of coast of sea-navigable waterways,compared with 45% in China and 90% in western Europe.
The government heavily subsidises nuclear power, with the objective of raisingrural electrification. The consumption of traditional fuels such as logs, dung andcrop residue is rising in absolute terms, although its share of total energyconsumption has fallen from over 70% in 1951 to around 35% in the mid-1990s.The burning of traditional fuels remains one of the leading sources of pollution-related mortality in India.
Transport, communications and the Internet
The poor condition of India�s infrastructure is a major hindrance to growth.Although recent government pronouncements have increasingly emphasisedthe need to secure investment in major infrastructure projects, real progress hasonly been made in the �new economy� telecommunications sector, andrecently in road construction.
India�s railways are in many ways impressive. The country has the world�smost extensive rail network, at 63,221 km. Indian Railways employs 1.5m staffand is the world�s largest non-military employer, although this is likely to fall to1.2m by 2010. The railways suffer from chronic underinvestment and under-pricing, insufficient progress on regulatory reform and unsound cross-subsidis-ation policies. Passenger traffic is heavily subsidised by higher freight charges,increasingly forcing freight onto the roads. Although revenue-earning freighttraffic increased from 391m tonnes in 1995/96 to 557m tonnes in 2003/04,extremely low levels of labour productivity have prevented more dramaticrates of growth. Railway safety has also become an issue of considerableconcern after frequent accidents, underlining a lack of investment.
The pressure on resources isintense
Standards of infrastructureare low
Railways

India 25
© The Economist Intelligence Unit Limited 2005 www.eiu.com Country Profile 2005
India�s poor road network has received renewed emphasis in recent years.There are 3m km of roads, most of which are badly maintained. Nationalhighways cover just 57,700 km and carry around 45% of total road transport.The ambitious National Highways Development Project seeks to expand morethan 13,000 km of highway to between four and six lanes in two key areas!between India�s four metropolitan centres, Delhi, Mumbai, Chennai andKolkata (the so-called Golden Quadrilateral!GQ!project), and in the north-south and east-west corridors. About 75% of the GQ project had beencompleted in mid-2005, with the remaining 25% due for completion by the endof the year. The north-south and east-west corridors are scheduled to come intooperation by end-2007.
A Central Road Fund established in November 2000, funded by a levy onpetrol and diesel, will help to guarantee funds for the upkeep and developmentof the road network, including rural roads. Concessions on imports of equip-ment to construct national highways have been extended to other road con-struction projects. In an effort to attract private-sector investment, proposals forup to 100% foreign-equity participation in the construction of roads andbridges will receive automatic approval up to a ceiling of around US$300m.
India has 12 major ports, seven on the west coast and five on the east, whichare managed by the Port Trust of India. An additional 185 minor ports, managedby state governments, account for 15% of total cargo handled. India�s largestcontainer port, Jawaharlal Nehru Port (Mumbai), handled roughly 2.3m TEUs(twenty-foot equivalent units) in 2003/04!about half of the volume handled bythe tenth-largest port in the world (Antwerp). The major ports, which handle75% of all cargo, handled 345m tonnes of cargo in 2003/04, compared with acapacity of 390m tonnes. India�s ports are plagued by inefficiency. The averageturnaround time is 4.7 days, and pre-berth waiting times are around 0.9 days.Poor port governance and inefficient customs clearing translate into high costs.An identical shipment of textiles to the US from India costs, on average, 20%more than from Thailand and 35% more than from China.
Government initiatives to increase private-sector participation include auto-matic approval for up to 100% foreign equity in port and harbour constructionprojects; establishing a Tariff Authority for Major Ports (TAMP) to fix portcharges collected by private providers; and setting up a Maritime StatesDevelopment Council (MSDC) to help frame an integrated port developmentpolicy. Gujarat, Maharashtra and Andhra Pradesh have made particularly goodprogress towards attracting private-sector participation in port development.The government has also drawn up plans to promote joint ventures betweenmajor Indian ports and minor foreign ports in a bid to attract new technologyand improve management practices.
India�s aviation industry has grown rapidly in recent years, with air passengertraffic rising by 25% in 2004 alone. Private operators, notably Jet Airways andSahara, have steadily increased their market share at the expense of the oncedominant state-owned Indian Airlines. The entry of budget airlines!a total ofeight are expected to serve the domestic market at end-2005!has furtherintensified competition. As a result, air travel has become increasingly
Airlines
Roads
Ports

26 India
Country Profile 2005 www.eiu.com © The Economist Intelligence Unit Limited 2005
affordable. In mid-2005 Indian Airlines ordered planes worth US$12bn in amove to meet rising demand and regain market share, and at the Paris air showIndian companies placed orders for over 200 aircraft. The state-ownedinternational carrier, Air India, has continued to suffer losses. The governmenthas given up trying to privatise Indian Airlines and Air India as a result ofstrong political resistance. Plans to lease out Mumbai, Delhi, Chennai andKolkata international airports have been drawn up, and three newinternational airports will be constructed with private-sector participation inBangalore, Hyderabad and Goa.
India�s telecommunications sector has registered rapid growth in recent years,spurred by reforms to introduce greater competition to the sector. However, at6.6% at end-2003, the rate of teledensity remains low by internationalstandards. The corresponding figure for China is 42%. Cellular telecoms serviceshave been liberalised since 1994, but only in 2000 did the number of cellularsubscribers register exceptionally strong growth. The number of mobile-phoneconnections exceeded fixed-line connections at end-2004 to reach 45m, up froma mere 3.2m at end-2000. There is an average of one public phone for every 383people living in India�s cities, and 5.2m out of a total of 6m villages currentlyhave a public telephone.
Steps to introduce a powerful Communications Commission of India toregulate and issue licences in the communications, information and entertain-ment industries appear to be on hold. The proposed commission is to facilitateconvergence in telecoms, broadcasting and the Internet by establishing aone-stop shop for licences, replacing the existing Telecoms Regulatory Authorityof India (TRAI). The courts have now removed obstacles to the government�sdecision to allow fixed-service operators to use wireless in local loop (WLL)technology to offer limited mobility services (which cellular phone operatorsclaimed encroached on the services for which they had purchased licences).However, the government remains committed to a rapid expansion ofteledensity and to the promotion of a conducive telecoms environment. VSNL,the state-owned international call carrier, lost its monopoly and was privatised(sold to the TATA Group) on April 1st 2002. Long-distance services have beenopen to private competition since January 2000. Rates for long-distance andinternational calls have fallen, but remain high by international standards.Internet connectivity remains low at six users per 1,000 people, compared with26 per 1,000 in China.
India has a network of more than 150,000 post offices, of which around 90%are in rural areas. An emphasis on universal provision has meant the serviceoperates at a loss, despite an upward revision in postal charges. In an attemptto improve performance, a number of services have been introduced to capturethe business market, as have steps towards computerising sorting offices.
India has a free and diverse press, published in Hindi, English and vernacularlanguages. In 2001 there were 5,638 daily newspapers with a combinedcirculation of 57.8m copies, and 45,974 periodicals with a total circulation of56.9m. In June 2005 the government liberalised the print media industryfurther, allowing foreign newspapers to publish in the country. Foreign
Post
Media services
Telecommunications

India 27
© The Economist Intelligence Unit Limited 2005 www.eiu.com Country Profile 2005
newspapers are already allowed to own stakes in Indian publications. Indiaalso produces the largest number of films in the world. There is rapid growth indemand for satellite and cable television. Foreign ownership of terrestrialchannels is banned, and foreign participation in satellite channels is limited to49% of equity.
Energy provision
Although total power generated has continued to increase, reaching633.3bn kwh in 2003/04, shortages amounted to around 6% of total demand,rising to over 12% at peak times. Problems in the energy sector are manifold:they include the grossly inefficient State Electricity Boards (SEBs), high levels ofpower theft, unsound cross-subsidisation policies and chronic under-investment. The average cost of power in India exceeds Rs4 per unit. Thiscompares with less than Rs2 in the US and Rs2.5 in both South Korea andTaiwan. Official targets for increased generation capacity have been set belowrequired levels for decades, and even these have not been met. As a result, thetenth plan period (2002-07) started off with a massive 27,000-mw shortfall!aserious constraint on economic growth. Around 84% of India�s power isgenerated by thermal stations. India has abundant coal reserves!commerciallyproven reserves are sufficient to cover current demand for over 100 years atcurrent rates of extraction. Nuclear power accounts for 3% of total electricitysupply. Hydroelectric power generation contributed 13% to total supply, buthydropower potential is thought to be three to four times the existing output.
India�s power sector urgently requires substantial investment. However, afterdecades of neglect the public sector lacks the necessary resources, and theprivate sector is unwilling to fill the gap, deterred by the fact that the mainelectricity purchasers, the state-owned SEBs, are bankrupt. The fundamentalproblem is the pricing structure!several classes of consumers pay less than thecost of generation. Despite a great deal of discussion, this skewed pricingstructure has remained largely intact as strong political lobbies have activelyundermined any reduction of subsidies despite frequent power outages.Farmers pay little!in some states nothing!for the power that they use forirrigation. Only industry is charged a market rate, and over 25% of powergenerated is lost in transmission and distribution, much of it stolen. The centralgovernment has now drawn up an agreement with the state administrationswhereby SEBs charge users market rates for electricity, reserving subsidies forthose genuinely in need. In return, the central government covers the US$5.6bnowed by SEBs to power generators, through the issue of long-term bonds.
In an effort to stimulate further investment in the power sector, proposals for100% foreign direct investment (FDI) in electricity generation, transmission anddistribution projects up to around US$300m receive automatic approval. So-called mega-projects (with a capacity of at least 1,500 mw for thermal projectsor of over 500 mw for hydroelectric plants) qualify for exemption from customsand countervailing duties. Power transmission has been opened to the privatesector, and funding is available for investors keen to tap India�s vast potentialfor generating hydroelectric power, which currently accounts for less than 20%
Energy capacity shortfall is amajor constraint on growth
Private investment is urgentlyneeded

28 India
Country Profile 2005 www.eiu.com © The Economist Intelligence Unit Limited 2005
of total electricity generated. However, as long as the SEBs have a monopoly ofdistribution and an opaque pricing and subsidy structure exists, investors willbe hesitant, particularly given the collapse of the Dabhol power project!India�slargest-ever FDI project!and the withdrawal of most foreign companies frompower-generating projects.
India�s total coal reserves are estimated at around 200bn tonnes. Coal is India�sprimary fuel for power generation, but a high ash content makes it a pollutingand inefficient source of energy. Low levels of mining productivity!around 0.5tonnes per man-shift in deep mines and 2 tonnes per man-shift overall!are aserious problem. In an attempt to promote greater investment, regulation hasbeen reduced and coal and lignite mining no longer require licences.
India is a net importer of oil. In 2003/04 it produced 33.4 tonnes of crude, buthad to import 90.4m tonnes to satisfy rising demand. A sharp rise in oil pricesin 2004-05 highlighted India�s dependence on imported oil. Oil accounts forabout 30% of India�s total energy consumption; 70% of India�s oil requirementis met by imports and 30% of the import bill constitutes oil. Rising industrialactivity has driven up demand, and the International Energy Agency (IEA)projects that the country�s dependence on imports to meet its demand for oilwill exceed 90% by 2020. India is building strategic oil reserve facilities covering15 days of its requirement on its southern and eastern coasts, to minimise theeffects of future supply disruptions.
Price and distribution controls that were introduced at the time of the oil crisisin the 1970s were finally removed on April 1st 2002, and a number of Indianand foreign companies have received licences to open petrol stations. Mostproduction originates from government refineries; their prices are controlled bythe Ministry of Petroleum and Natural Gas. In 2002 a bill was passed providingfor the establishment of a Petroleum Regulatory Board to regulate the supplyof petrol.
Consumption levels of natural gas have grown faster than that of any othersource of energy in the past decade. Consumption rose from 0.6trn cu ft peryear in 1995 to 0.9trn cu ft in 2002. Significantly, Gujarat State PetroleumCorporation (GSPC) in June 2005 made the country"s biggest natural-gasdiscovery off the coast of Andhra Pradesh in the south-east of the country. Thefind is estimated to hold 20trn cu ft of gas, worth US$50bn. Nevertheless,domestic sources will be insufficient to meet the rising demand. The Indiangovernment has been negotiating the construction of a number of pipelineprojects, including a pipeline to import gas from Iran via Pakistan.
Coal, oil and gas

India 29
© The Economist Intelligence Unit Limited 2005 www.eiu.com Country Profile 2005
The economy
Economic structureMain economic indicators, 2004(Economist Intelligence Unit estimates unless otherwise indicated)
Real GDP growth (%) 7.0 a
Consumer price inflation (av; %) 3.8 b
Current-account balance (US$ m) -4,055.2Exchange rate (av; Rs:US$) 45.3 b
Population (m) 1,080.3
External debt (year-end; US$ m) 118,642.9
a Fiscal year April 2004-March 2005. b Actual.
Source: Economist Intelligence Unit, CountryData.
India is a two-tier economy, with a cutting-edge and globally competitiveknowledge-driven service sector that employs the brightest of the middleclasses on the one hand, and a sprawling largely rain-fed agricultural sectorthat employs the majority of the vast and poorly educated labour force, on theother. India�s manufacturing sector has traditionally been poor (with areputation for low-quality goods) although there are signs that this isbeginning to change. The agricultural sector, with fishing and forestry, accountsfor around 20% of GDP, services 53% and manufacturing 27%.
The manufacturing sector relies on the income generated by the agriculturalsector!about two-thirds of the labour force work in agriculture. Although theeconomy�s dependence on agriculture has declined in recent years, fluctuationsin overall GDP growth are still largely a function of the outcome of the annualmonsoon. The majority of landholdings are farmed at subsistence level, andmany farming families live below the poverty line. India has some of thelowest human development indicators in the world, particularly in rural areas.
At the other end of the scale, India also has a large number of highly qualifiedprofessionals, as well as several internationally established industrial groups.Economic development has been spread unevenly across states. Economicgrowth and progress in human development indicators has been much faster inthe southern and western states than in the north. Without a rapid andsustained increase in economic growth and higher investment in primaryeducation and healthcare, reducing poverty will remain a considerablechallenge for the authorities.
Agricultural production, mainly of foodgrains, is an important determinant ofoverall economic growth and a huge employer of the rural populace. Totalfoodgrain production in fiscal year 2004/05 (April-March) amounted to 206.4mtonnes, including 87.8m tonnes of rice and 73.0m tonnes of wheat. However,yields per hectare remain low by international standards. Other major cropsgrown include oilseeds, cotton, pulses, sugar, tea, coffee, rubber, juteand potatoes. Some economists argue that for annual GDP growth to sustain 7-8%, the agricultural economy will have to grow about twice as fast as the 2%recorded in recent years. However, agricultural growth has remained low.
Agriculture

30 India
Country Profile 2005 www.eiu.com © The Economist Intelligence Unit Limited 2005
Comparative economic indicators, 2004Indiaa China a Pakistana Bangladesh a Sri Lankaa
GDP (US$ bn) 658.2 1,681.3 94.9b 55.9 19.8b
GDP per head (US$) 609 1,293 617 373 1,028
GDP per head (US$ at PPP) 3,049 5,811 2,223 1,583 3,585Consumer price inflation (av; %) 3.8b 3.9 b 7.4b 3.2 7.6b
Current-account balance (US$ bn) -4.1 68.7 b -1.5 -0.2 -0.6Current-account balance (% of GDP) -0.6 4.1 -1.6 -0.4 -3.1Exports of goods fob (US$ bn) 67.7 593.4 b 14.6 8.1 5.7
Imports of goods fob (US$ bn) -91.3 -534.4 b -18.9 -11.1 -7.1External debt (US$ bn) 118.6 232.7 36.0 20.4 10.9
Debt-service ratio, paid (%) 10.0 6.3 19.3 8.0 9.8
a Economist Intelligence Unit estimates. b Actual.
Source: Economist Intelligence Unit, CountryData.
The size of India�s industrial sector compares unfavourably with other countriesin Asia. At about 27% of GDP, the sector is about half as large as China�s. India�srigid labour laws are the main obstacle to an increased role for manufacturing,which nevertheless has seen unprecedented growth as an anti-export bias ineconomic policy has been reduced and more resources have been moved intolabour-intensive industries. Historically, a policy of import substitution in thedecades after independence encouraged the development of a broad industrialbase, but a lack of competition contributed to poor product quality andinefficiencies in production. Several sectors have now been opened up toforeign participation under India�s liberalising reform programme, contributingto a significant expansion in the production of durable consumer goodsincluding cars, scooters, consumer electronics, computer systems and whitegoods. However, a large proportion of heavy industry is still publicly owned.
The services sector has proved to be the most dynamic in recent years, withtelecoms and information technology (IT) registering particularly rapid growth.Services, including airlines, banks, construction and small-scale private traders,as well as the public sector, accounted for 51.7% of GDP in 2004/05. It is one ofthe anomalies of India�s rapid economic growth since the 1990s that, as inother sectors, growth in the services sector has largely been �jobless�. Thegovernment has drawn up plans to open the retail sector to foreign directinvestment (FDI) and has eased restrictions in other sectors. In 2004 aviationwas liberalised and a number of low-cost airlines started services. However,privatisation of the domestic telecoms company, Bharat Sanchar NigamLimited (BSNL), and of the national and international carriers, Indian Airlinesand Air India, has stalled. The predominance of inefficient state-ownedenterprises, particularly in the banking sector, remains a brake on growth.
Economic policy
Economic growth remains severely constrained by an unsustainably large fiscaldeficit. A concerted effort will be required to bring about a substantialreduction in the fiscal imbalance: fiscal restraint brought the deficit down to4.1% in 1996/97. The succession of weak coalition governments that followed
Industry
Services
The fiscal position isunsustainable

India 31
© The Economist Intelligence Unit Limited 2005 www.eiu.com Country Profile 2005
allowed it to rise again, to 5.4% in 2002/03, while the states ran a deficit equalto an additional 4.2% of GDP. Strong economic growth in the past few yearspushed the deficit down to an estimated 4.5% in 2004/05, but the underlyingfiscal position remains weak. While private savings and public investment inIndia are comparable with those of East Asia, public savings and private invest-ment are markedly lower. Private investment continues to be crowded out byunproductive public consumption, resulting in a reduced rate of GDP growth.
The magnitude of the required fiscal adjustment is huge!a radical departurefrom current policy is needed in order to address India�s single most importantrisk to macroeconomic stability. The policies required to reduce the fiscal deficitare easy to list but politically difficult to implement. Reducing subsidies, raisingthe tax take (only about 2m people pay income tax), cutting governmentemployment and closing or privatising loss-making public-sector enterprises areall measures opposed by powerful interest groups. A Fiscal Responsibility andBudget Management Bill, designed to place a statutory limit on governmentborrowing, became effective in July 2004. The bill gives the central governmentthe mandate to eliminate the revenue deficit (the gap between governmentcurrent spending and revenue) by March 2009 and to reduce the fiscal deficit inincrements each year to reach 3% of GDP by March 2008. However, the latterhas not been adhered to!in the 2005/06 budget speech the finance ministerstated that he had been forced to press the �pause button� on reducing thefiscal deficit.
The objective of the Reserve Bank of India (RBI, the central bank) is to maintainprice stability and ensure an adequate flow of credit to the economy. Importantchanges to the institutional set-up of the RBI have resulted in improvedmonetary control. In recent years, inflation has fallen to levels of around 4-5%,down from double-digit inflation in the first half of the 1990s. The objective ofprice stability has gained further importance following the opening up of theeconomy and far-reaching reform in the financial sector. Furthermore, theauthorities are aware that inflation hits the poor hardest since they possess nohedges. The RBI targets broad money, interest rates, credit availability to theproductive sectors, and the exchange rate when formulating policy. In recentyears, large capital inflows have exerted upward pressure on the exchange rate,which the RBI has sought to limit by actively selling rupees/buying dollars inthe foreign-exchange market. The by-product of this policy has been theaccumulation of foreign reserves, which stood at around US$140bn in mid-May2005. The rationale of this policy is apparently to protect Indian exportcompetitiveness, particularly with respect to China.
Attempts to liberalise the economy were made by the Janata Party in 1977 andat the beginning of Rajiv Gandhi�s first administration in the mid-1980s. TheJanata government fell after reducing some industrial and import controls, andRajiv�s administration quickly became mired in scandal and lost the power tooverride party members who enjoyed the benefits of controls. In 1991 Indiawas forced to borrow from the IMF and the World Bank to overcome a balance-of-payments crisis. The conditions of the loans included fiscal correction andtrade liberalisation, and the government also embraced a broader package of re-
Monetary control hasimproved
India�s big bang

32 India
Country Profile 2005 www.eiu.com © The Economist Intelligence Unit Limited 2005
forms covering subsidies, banking, industrial and exchange controls. A spec-tacular export and industrial boom ensued, making the reforms more accept-able. However, once the crisis was over and foreign-exchange reserves becamecomfortable, pressure from party members again slowed the reform process.
The adoption of a command economy with severe restrictions on the privatesector led to the growth of large and inefficient enterprises unaccustomed tocompetition. Moves to open up the economy met opposition from vestedinterests including politicians, unions, bureaucrats and some industrialists. Thereform process has nevertheless continued, if slowly, since 1991. The impositionof economic sanctions in 1998, in the aftermath of India�s nuclear tests, was thelatest catalyst for reform, although initial reform proposals were often laterdiluted.
Significant steps have been taken to reduce bureaucratic restrictions on industryand encourage FDI. In particular, the financial and insurance sectors have beenopened to private and foreign participation, as have the telecoms sector andmany sectors of manufacturing industry. The government has also removed theremaining quantitative restrictions (QRs) on imports, in line with its obligationsto the World Trade Organisation (WTO)!although it has raised agriculturaltariffs and imposed many anti-dumping duties to mollify domestic lobbies.
Main economic reforms
Despite the continued slow pace of reform, cumulative reforms since 1991 have beensubstantial.• Progressively more sectors were opened to private investment, including power,
steel, oil refining and exploration, road construction, air transport,telecommunications, ports, mining, pharmaceuticals and the financial sector.Sectors such as garments and textiles that were previously reserved for small-scale industries were also delicensed.
• Policymakers sought to encourage foreign direct investment (FDI; except in a few�strategic� sectors) and portfolio investment. Red tape was significantly reduced.
• Most industries were delicensed (previously the government issued licences tocompanies that permitted them to produce a fixed number of items) toencourage competition.
• Trade policy was liberalised. Some import quotas were converted into tariffs,and the tariff system was simplified to reduce the number of bands and achievea reduction in overall rates imposed. From April 2001 all remaining quantitativerestrictions (QRs) on imports were removed, although tariffs remain high.
• Some aspects of business decision-making, such as the location of newenterprises and technology transfer, were taken out of the state�s control.(Labour relations and the shutting down of loss-making enterprises, or �exitpolicy�, remain strictly regulated.)
• The exchange-rate regime was liberalised, with the devaluation of the rupee by22% against the US dollar in two instalments in July 1991. A market-determinedexchange rate was introduced in March 1993, and current-account convertibilitybegan in August 1994. Since July 1995 all official foreign debt-service paymentshave been channelled through the interbank market. However, the rupee is notyet fully convertible on the capital account.
The reform process proves tobe difficult

India 33
© The Economist Intelligence Unit Limited 2005 www.eiu.com Country Profile 2005
• Capital markets were reformed. Private mutual funds, foreign institutionalinvestors and country funds are active investors, and the stockmarket is subjectto more rigorous regulation, although scandals every few years suggest thatthere is still some way to go.
As central controls have receded, states have acquired more freedom to manoeuvre.Some states, such as Andhra Pradesh, Karnataka and Maharashtra, have shownconsiderable initiative in raising additional finance, including issuing bonds andencouraging private investment in irrigation, roads, bridges, software development,and agricultural and horticultural projects. However, most states have made littleprogress.
Economic performance
Between 1981 and 2004 the Indian economy grew by an annual average of 5.8%(real GDP at factor cost). This performance followed three decades of growth ofjust 3.5% per year (equivalent to GDP growth per head of only 1.5%)!what hadbecome known as the �Hindu rate of growth�. GDP growth eased back in thefive-year period from 1997/98 to 2002/03 and averaged 5.2% per year, downfrom 6.7% per year in 1992/93-1996/97. This slowdown was mainly the result of asignificant fall in industrial and agricultural output, whereas services growthcontinued its rapid expansion and has become the main engine of economicgrowth. More worryingly, output in the agricultural sector slowed to around 1%in 1997/98-2002/03, down from 4.7% in the previous five years, but in 2003/04the best monsoon rains in a decade generated growth of 10%, and continuingrobust services sector growth lifted GDP at factor cost to 8.6%. An unprece-dented expansion in manufacturing in 2004/05 and solid growth in theservices sector ensured that the economy grew at an estimated 7% in 2004/05.
Economic performance still varies dramatically among states and industrialsectors. However, global investors increasingly sense that India�s growthprospects have changed fundamentally in recent years. The country alreadybenefits a great deal from its huge stock of highly skilled workers and hasbecome an important location of research and development (R&D) facilities formultinational companies!especially in the IT, software and pharmaceuticalsectors. The opening up of the economy has led to an influx of foreign capital,technology and management skills, making India increasingly attractive as abase for medium and high value added manufacturing.
The low level of productivity in the large state sector is a major constraint onhigher GDP growth. The state employs 70% of the 28m workers in organisedemployment in India. Most public-sector enterprises are hugely overstaffed,debt-ridden and inefficient. A high level of unionisation, and politicalexpediency, have restricted labour reforms and technological advances thatcould threaten jobs, and have thus deterred potential investors. However, in2004, in an effort to woo the middle class just prior to the elections, theprevious government sold substantial blocks of stocks in major public-sectorcorporations. However, the United Progressive Alliance (UPA) coalition-ledgovernment has back-tracked on this strategy as the Left Front, on which theminority government relies for support in parliament, is opposed to theprivatisation of state-owned enterprises.
From the �Hindu rate ofgrowth� to a star performer

34 India
Country Profile 2005 www.eiu.com © The Economist Intelligence Unit Limited 2005
India�s private companies have responded better to the reform process, withmergers in several sectors helping to improve efficiency. Although borrowingcosts are still high in India, the cost of finance has fallen steadily in recentyears with interest rates hitting a 32-year low at the beginning of 2005. As aresult, financial constraints to companies� expansion plans have eased andtheir overall financial position has improved. However, overall economicgrowth has been severely hampered by weak infrastructure, including poortransport networks and insufficient and erratic power supplies, which havealso limited investment.
India�s rigid labour laws are perhaps the biggest hindrance to employmentcreation and the development of a competitive manufacturing sector. Theexisting labour legislation prevents the transition of the vast majority of thelabour force!90% of workers are employed in the informal economy!fromsubsistence agriculture or low-productivity informal (without employmentcontracts) employment to high-productivity employment in the formal sector.Companies with more than 100 employees still require the go-ahead from theirrespective state government to make workers redundant and permission isalmost never granted. Given the political constraints to labour market reforms,the government has tried to use export processing zones (EPZs) to fostercompetition among states and promote the growth of manufacturing. The aimis to provide an internationally competitive environment for exporters,circumventing strict labour laws and high tariffs. Apart from creating theconditions for a more competitive manufacturing sector, the EPZs have becomean important vehicle for pioneering policy and institutional reforms that aredifficult to introduce within the normal parliamentary process!via �back-door�liberalisation. Nevertheless, the 2005 parliamentary bill on EPZs was watereddown by Left Front objections and labour restrictions in EPZs still remain.
In the boom years between 1992 and 1996 the annual rate of inflationaveraged close to 10%. Between 1997 and 2004 the rate averaged around 6%per year, largely owing to improved productivity, an appreciating currency andimproved monetary management by the central bank. Furthermore, globallylower inflation and low commodity prices (until 2003) contributed to areduction in the inflation rate. Another factor is that India�s cost of living indexis heavily weighted in favour of food, prices of which were ratcheted up as aresult of price-support operations by the government. However, thegovernment has moderated the annual increases in support prices (thuslowering overall inflation), and has tried to reduce food stocks through publicworks programmes, poor relief and exports. More recently, rising prices of oiland other commodities have led to a marginal increase in inflation. However,the pass-through into core inflation has remained limited and the mainmacroeconomic impact of higher oil prices has been a deterioration in thecounty�s current-account. This is largely owing to sound fiscal and monetarypolicies that limited the effect of the high oil prices.
Inflation is largely undercontrol

India 35
© The Economist Intelligence Unit Limited 2005 www.eiu.com Country Profile 2005
Increasing trade integration with the rest of the world, the dynamism of IndiaIT and other services sectors and the emergence of India as an importantdestination for FDI have all contributed to the country�s improved externalposition in recent years. Rising current-account surpluses were one of the newfeatures of India�s balance-of-payments position from 2001/02 to 2003/04.While the predominantly export-oriented South-east Asian economies� stronggrowth in merchandise exports has been the main driver behind the current-account surpluses, India has traditionally maintained a deficit on themerchandise trade account. However, buoyant invisible inflows, particularlyremittances from non-resident Indians, along with software services exports,have been instrumental in creating the current-account surpluses for India. In2003/04 the surplus on the current account contributed about one-third of theUS$31bn in reserve accumulation. However, in 2004/05 high oil prices led to anabout-turn and India�s current account went into deficit again.
Regional trends
India�s national performance in many aspects masks considerable interstatevariation in terms of economic growth, economic policy, population andhuman development. Since 1991 Gujarat and Maharashtra have been thefastest-growing states, enjoying growth rates of around 6-8%, comparable withthe East Asian economies. High-growth private-sector industries are concen-trated around Mumbai in Maharashtra and parts of Gujarat; around Delhi,including Haryana and western Uttar Pradesh; and in the corridor fromBangalore in Karnataka to Chennai in Tamil Nadu. The process of economicpolicy reform that began in 1991 had important implications for state-levelgrowth. Data suggest that the growth differential between states has intensified.Bihar, the poorest state, grew at a rate nearly ten times lower than that ofGujarat, whereas Assam�s economy contracted during the post-reform period.The prosperous states with better-performing administrations appear to havebenefited the most in the post-1991 period.
The 1990s have seen faster improvements in human development indicators,especially in literacy and life expectancy. Generally, fertility and mortality arelower in southern and western states compared with most of the northernstates. The speed of fertility decline has been slowest in Bihar and UttarPradesh, where the number of births per woman is still between four and five,way above the all-India average of around three. As trade was liberalised andindustry freed to locate where it wished, industrial development becameconcentrated in the south and along the west coast. The northern states havefallen further behind. The software export boom has also been largelyconcentrated in the southern and western cities of Chennai, Bangalore,Mumbai and Hyderabad.
India�s external position isfundamentally sound

36 India
Country Profile 2005 www.eiu.com © The Economist Intelligence Unit Limited 2005
Economic sectors
Agriculture
India�s agricultural sector employs about 60% of the country�s workforce andaccounts for one-fifth of GDP. Unlike in East Asian countries, the shift of thelabour force from agriculture to non-agriculture in India is peculiarly slow,largely attributable to rigid labour laws in both the agricultural and industrialsectors. The agricultural sector strengthened in the post-reform period (fiscalyears 1992/93-1996/97, beginning in April) with average growth at 4.7%, up froman average of 3.6% in the 1980s. However, growth slowed to around 1% per yearbetween 1997/98 and 2002/03. In 2003/04 the best monsoon rains in a decadegenerated growth of 10% in the agricultural sector. The main reasons for thedeceleration in recent years (excluding 2003/04) are the high level of govern-ment intervention and the consequent skewed incentive structure. Despitegovernment intervention, public investment in agriculture fell by one-fifthbetween 1994/95 and 2000/01.
Inadequate road linkages remain a major constraint for the development ofwell-functioning agricultural markets. A continuing fragmentation of land-holdings, poor maintenance of existing irrigation systems and declining soilfertility in some areas are other factors. Production growth and yields in prin-cipal crops, accounting for some 70% of value added in agriculture, declinedsignificantly during the 1990s compared with the 1980s and remain low bydeveloped-country standards. Another reason for which there is increasingempirical support is that with increasing opportunities in the countryside,incentives, traditional agricultural labourers have begun engaging in servicessector activities in the informal sector, and are partly neglecting their plots.
The introduction of high-yield crop varieties and new fertilising and irrigationtechniques over several decades!the so-called Green Revolution!dramaticallyincreased productivity in some regions. India has been self-sufficient in foodsince the mid-1970s, maintaining buffer stocks adequate to meet demanddespite failed harvests and seasonal fluctuations. However, given agriculture�sdiminishing yet still huge importance for India�s overall growth prospects, therecent slowdown in the sector is a cause for concern and calls for a change inthe government�s agricultural policy. Some academic research suggests that inorder for India to sustain GDP growth of around 7% or more, agriculture has togrow at, or in excess of, 4%.
Food support prices for wheat and rice have given farmers little incentive todiversify and have filled government storage facilities to overflowing, whilekeeping the market price of foodgrains artificially high. Current agriculturalpolicy, which supports cereal production, is exceedingly expensive and will beunable to deal with the likely scenario of a shift in consumption from cerealfood towards non-cereal food. A lack of market infrastructure also hampers themovement of crops, leading to sudden shortages. India has considerablepotential as an exporter of rice, cotton, many types of fruit and even flowers,but this has so far not been tapped.
Agricultural growth hasdecelerated

India 37
© The Economist Intelligence Unit Limited 2005 www.eiu.com Country Profile 2005
Less than one-third of cropland is irrigated, making agricultural output heavilydependent on the annual monsoon. The main foodgrain crops (the kharif orautumn crop!predominantly rice, harvested in September-October) and somecash crops (oilseeds, cotton, jute and sugar) depend on the south-westmonsoon. This brings 80% of India�s rain, usually within a three-month periodfrom June to mid-September. A second, north-east monsoon brings lighter rainsto the south of the country from mid-October to December. Winter rain innorth-west India from October to March waters a crop of wheat and coarsegrains (the rabi crop, harvested in April-May). The 2002 south-west monsoonwas disastrous, causing the autumn grain harvest to fall by 18% year on year. In2004 the sector stagnated in comparison to the previous year when the bestmonsoon rains in a decade generated growth of around 10% in the agriculturalsector. Excessive rainfall in 2005 caused severe flooding in Maharashtra.
Monsoon performance(Jun-Sep)
1997 1998 1999 2000 2001 2002 2003 2004Meteorological subdivisions with normal/excess rainfall (no.) 32 33 28 28 29 15 31 23
Meteorological subdivisions with deficient/scanty rainfall (no.) 3 2 7 7 6 21 5 13Districts with normal/excess rainfall for all-India (%) 81 83 67 65 68 37 76 57
Deviation from long-term average rainfall for all-India (%) 2 5 -4 -8 -9 -19 5 -13Growth in the agricultural sector (%) -1.5 5.9 0.6 0.1 5.9 -5.6 9.6 1.1
Source: India Meteorological Department.
Mining and semi-processing
India derives little wealth from its mining sector, which accounts for less than2% of GDP. Nevertheless, a range of non-hydrocarbons minerals is extracted. Inaddition to those listed below, India produces significant amounts of mica,manganese, dolomite, limestone, chromite, magnesite, apatite and phosphorite.Private-sector participation in the mining sector is on the increase.
India has one of the world�s largest reserves of iron ore, at around 19.2bntonnes, and is one of the world�s lowest-cost sources. Around 50% of iron oreexports is destined for China; the remainder is taken mainly by South Koreaand Japan. Almost one-half of the output comes from privately owned minesin Goa.
India also has large reserves of bauxite, at around 2bn tonnes or 11% of theglobal total, and is the fifth-largest bauxite producer in the world. Ambitiousplans have been drawn up to expand smelting and aluminium production forhome consumption and export.
Although India has substantial reserves of copper (estimated at 422m tonnes), itis a net copper importer. Reserves of lead and zinc are estimated at 360mtonnes. A complex with a lead-zinc capacity of 70,000 tonnes has cut importdemand for both metals.
Iron ore
Bauxite
Non-ferrous metals

38 India
Country Profile 2005 www.eiu.com © The Economist Intelligence Unit Limited 2005
Foreign investors have shown considerable interest in joint ventures to minefor gold, particularly the state-run mine at Kolar in Karnataka. In addition,more than 20 companies, including the UK-based De Beers and Cluff, haveregistered an interest in diamond prospecting in the country.
ManufacturingIndustrial production(fiscal years Apr-Mar; 1993/94=100; % change year on year)
2000/01 2001/02 2002/03 2003/04 2004/05a
Basic goods 3.9 2.6 4.9 5.4 5.5Capital goods 1.8 -3.4 10.5 13.6 13.3
Intermediate goods 4.7 1.5 3.9 6.4 5.9Consumer durables 14.5 11.5 -6.3 11.6 14.5
Consumer non-durables 5.8 4.1 12.0 5.8 10.6All (index of industrial
production) 5.0 2.7 5.9 7.0 8.2
a Preliminary.
Source: Central Statistical Organisation (CSO).
Industrial growth averaged 7.1% per year in the 1980s. It accelerated slightly to7.6% per year in the first five years following the beginning of the economicpolicy reform process in 1991, which led to an investment boom, particularly inindustry. In the second half of the 1990s industrial growth trended lower ataround 5% per year. However, since 2002/03 industrial growth has acceleratedmarkedly on the back of recent strong GDP growth. Rising disposable incomes,easy access to finance and the changing attitudes of India�s rapidly risingmiddle class (with a traditional focus on savings) have resulted in a consumerlending boom. Industrial growth rose above 8% in 2004/05, with consumerdurables and non-durables showing exceptionally strong growth. Capital-goodsproduction has been growing at double-digit rates since 2002/03, suggestingincreased investment in the industrial sector and the economy as a whole.Industrial production in India still follows a normal historical pattern ofindustrial buoyancy after a good agricultural year, but sustained industrialgrowth for three consecutive years suggests that this historically closecorrelation may be weakening.
Although reforms have reduced licensing and regulation, heavy industry is stilldominated by public-sector enterprises. State-owned companies haveaccounted for the bulk of activity in steel, non-ferrous metals (virtually 100% forcopper, lead and zinc, and about 50% for aluminium), shipbuilding,engineering, chemicals and paper. The government had pledged to reduce itsholdings in non-strategic public-sector undertakings to a maximum of 26%, andto close down non-viable enterprises but opposition to this measure from theLeft Front has, for all practical purposes, shelved this proposal. The previousBharatiya Janata Party (BJP)-led government had begun to make some progresstowards these goals, and had sold off controlling interests or brought inminority managing partners in a number of public enterprises. Onerous labourregulations, as well as a shortage of cheap credit, limit opportunities forrestructuring and so continue to restrain rates of GDP growth.
Gold and diamonds
Industrial growth

India 39
© The Economist Intelligence Unit Limited 2005 www.eiu.com Country Profile 2005
India produced 31.8m tonnes of crude steel in 2004/05, putting it among the tenlargest producers in the world. A variety of grades are produced and the qualityis at par with producers such as South Korea and the US!one of the mainreasons behind the acceptance of Indian steel in the world market. Increaseddemand from China as well as strong domestic demand, particularly byconsumer-durables and automotive manufacturers and the construction sector,are the main drivers of production growth. Around 40% of output is producedin integrated steel plants; the remainder comes from mini-plants (electric arcfurnaces), of which over 180 exist, almost all in the private sector. Reforms tothe sector have lifted controls on prices, distribution and imports of industrialinputs. However, the government maintains a floor on the price of imports ofsteel products in order to protect the domestic industry.
Textiles account for around one-fifth of total export earnings. Because thegovernment discriminated for decades against integrated textile mills, with theaim of helping cottage handlooms, most mills closed down. Mills currentlyproduce only 4% of textiles output. Despite government assistance, the share ofhandlooms in total output is only 18%; the remainder is produced by powerlooms located in sheds outside the mills, which allow them to escape therestrictions. Production in the textile industry is based on a decentralisedsystem with continuing small-scale reservation for many items. The phasingout of the Agreement on Textiles and Clothing (ACT) at the beginning of 2005is likely to benefit the Indian textile industry. The industry has a naturalcompetitive advantage in terms of a strong and large multi-fibre base, abundantcheap skilled labour and presence across the entire value chain of the industryranging from spinning and weaving to the final manufacture of garments.
India�s information technology (IT) and service industry has grown at anaverage annual rate of around 50% per year since 1993, to reach a turnover ofUS$22bn in 2004/05, equivalent to around 3% of the country�s GDP. Theindustry is highly export-oriented!the domestic IT market accounts for about40% of the total. Out of an estimated 5,000 IT software and service companiesin India, about 60% are domestic players and 40% are multinational corpor-ations. The latter account for about 65% of the industry�s revenue. IT products!mainly software!accounted for 11% of current-account receipts in 2004/05.
The most important market is the US, which absorbs about 70% of India�ssoftware exports, followed by the UK with 14% and Europe (excluding the UK)with 9%. Indian firms are especially strong in software for banks, financehouses and insurance companies. Software exports grew at an average of 36%between 1995/96 and 2003/04. The bursting of the dotcom bubble in the US inthe early 2000s had a negative effect on the Indian industry. Although thebigger companies largely held their own, smaller exporters suffered.Nevertheless, the Indian IT industry has withstood the shock reasonably well.It has also been forced to increase diversification in non-US markets such asEurope and Asia in areas such as the management for clients of IT-relatedbusiness processes. At the other end of the market, call services and IT-enabledservices, which use cheap labour and do not require a knowledge of softwareengineering, are growing rapidly in India.
Steel
Textiles
Electronics and software

40 India
Country Profile 2005 www.eiu.com © The Economist Intelligence Unit Limited 2005
The rapid growth of software exports has attracted thousands of people intothe industry and has stimulated the demand for computers. Sales of personalcomputers rose by 20% in 2004/05, to 3.6m. Import liberalisation and the entryof foreign manufacturers has transformed this industry, which, until five yearsago, was tiny and dominated by a few Indian manufacturers. The ease ofimporting components has nurtured hundreds of unbranded assemblers,which command 62% of the market. Only three major Indian brands remain.The growth of the IT hardware sector has traditionally lagged behind thesoftware and services segment and hardware exports remain insignificant, with90% of the industry�s revenue sourced from the domestic market.Among foreign manufacturers, the largest branded supplier isCompaq/Hewlett Packard.
The automotive industry�s turnover stood at US$19.1bn in 2003/04 and hasbeen one of the fastest-growing sectors in recent years. Rising income levels,continuing poor public transport systems, wider availability of car finance andthe increase in the young population are the main drivers of growth. Totalproduction of vehicles rose from 4.2m units in 1998/99 to 7.3m units in 2003/04.In volume terms, vehicle production is dominated by two-wheelers, whichaccounted for 5.6m units of total production in 2003/04. Hero Honda is thedominant player in the two-wheeler market, with a market share of around50%. The once-dominant Bajaj has been left behind, owing to its concentrationon scooters, but its partnership with Kawasaki has enabled it to introduce newmotorcycle models.
The production of passengers cars stood at 842,000 units in 2003/04, followedby three-wheelers (340,000), commercial vehicles (275,000) and multi-purposevehicles (146,000). Most local production is sold domestically, but rising qualityhas contributed to a surge in vehicle exports, which registered growth rates ofover 50% in 2002/03 and 2003/04. With 11 producers, the Indian car market ishighly fragmented and competition has intensified in recent years. In July 2003the government sold a 25% share in Maruti Udyog, its joint venture with SuzukiMotor Corporation of Japan, leaving the government holding about 20% ofMaruti and Suzuki about 54%. At the time, the initial public offering (IPO) wasthe largest-ever domestic share offer for privatisation in India�s capital marketand laid the groundwork for other privatisation efforts.
Construction
Construction accounts for around 5% of GDP, employing an estimated3.5m people full-time and a further 6.5m seasonally. The construction industrycontributes more incremental value added per unit of investment than anyother sector, and has been a focus of government investment in an effort tokick-start other industries, particularly steel and cement. Construction accountsfor around 40% of public-sector plan outlays, and more than 1m workers areengaged in public-sector construction projects. Large-scale public-sector projectslike the Golden Quadrilateral (GQ) project that aims to link the cities of Delhi,Kolkata, Mumbai and Chennai via national highways, the need for fast
Vehicles
Computer hardware

India 41
© The Economist Intelligence Unit Limited 2005 www.eiu.com Country Profile 2005
development of urban infrastructure combined with fast-rising demand forresidential housing have contributed to a boom in the sector in recent years.
India has a serious housing shortage. Under a Special Action Plan on housing,2m units will be constructed each year!700,000 in urban areas and 1.3m inrural areas. Around 50m people in urban areas live in what are officiallydesignated as slums. Rural housing conditions are also poor.
Financial services
The financial services sector has long been dominated by state-ownedinstitutions. During the second world war, the government introduced controlson public issues and used pricing formulas that under-priced share issues. As aresult, although India had a large number of stock exchanges, little money wasraised through public issues, the floating stock was small and the markets werespeculative and volatile. In the 1950s the government set up long-term financialinstitutions that supplied the bulk of industry�s debt and equity finance, and in1970 it nationalised banks.
The central government owns four long-term financial institutions!theIndustrial Development Bank of India (IDBI), the Industrial FinanceCorporation of India (IFCI), the Small Industries Development Bank of India(SIDBI) and the Industrial Investment Bank of India (IIBI)!and is the largestshareholder in the Industrial Capital and Investment Corporation ofIndia (ICICI). These institutions, in turn, own three venture-capital funds: IDBIowns the Indian Venture Capital Fund (IVCF) and the Technology FinanceCorporation of India (TFCI), and ICICI owns the ICICI Venture Fund. Inaddition, the Unit Trust of India (UTI), the Life Insurance Corporation (LIC)and the General Insurance Corporation (GIC) also provide finance.
The public-sector character of finance in India is a matter of concern. The 27public-sector commercial banks hold around three-quarters of the assets ofIndia�s 96 commercial lenders. Issues of moral hazard in lending, poor riskassessment, conflicting interests arising from the role of the government as aregulator and owner of banks and the fiscal implications of unlimited liabilityof the government are among the main problems. In February 2005 theReserve Bank of India (RBI, the central bank) announced its roadmap for thepresence of foreign banks in India, which allows foreign banks unprecedentedroom to operate, but stops short of introducing the degree of competitionrequired to break the dominance of state-owned banks. A more competitivebanking sector environment is expected only in 2009, when the second phaseof the roadmap will allow foreign banks to compete more freely.
The size and liquidity of the Indian stockmarket has risen notably in recentyears. The Bombay Stock Exchange benchmark index BSE 100 rose by 87.5% and15.3% in 2003 and 2004 respectively. In July 2005 the benchmark index reachedan all-time high as the timely arrival of the monsoon heralded another year ofrapid economic expansion. Unprecedented portfolio investment of aboutUS$8.9bn from overseas!still the preferred route of foreign investment!underpinned a buoyant stockmarket in 2004. Market capitalisation rose by an
The housing shortage
The stockmarket
State-owned financialinstitutions dominate

42 India
Country Profile 2005 www.eiu.com © The Economist Intelligence Unit Limited 2005
annual 39% to US$388bn that year. Market capitalisation of listed companies asa percentage of GDP stood at around 25% in 2002, up from 13% in 1990 and 5%in 1980. This compares with an average of 33% in developing countries. Sincethe government relaxed guidelines governing the issue of foreign-currencyconvertible bonds in March 2003, Indian corporates have begun raisingresources from overseas markets.
Other services
India has more than 5m retail outlets, and the retail sector is underdeveloped,unorganised and dominated by small, family-owned firms. Although theorganised retail sector has begun to develop rapidly, particularly in the fourlargest cities (Mumbai, Kolkata, Delhi and Chennai), it faces major impedimentsto growth. In particular, inflexible labour laws and high supply-chain costs, aswell as a preference for known retailers, work against the sector�s development.In 2005 there was much discussion about permitting foreign investment in theretail sector. However, owing to the concerns of the Left Front parties, this hasso far not been approved.
In 2003/04 a revival of international interest in India as a tourist destinationwas reflected in an increase of 18.5% in tourist arrivals to an estimated 20m.However, India has so far failed to exploit its tourism potential, attracting amere 0.4% of the world�s total tourists and 1% of total spending on tourism.Tourism receipts have grown (to around US$4bn), but net tourism receipts havefallen as more Indians have travelled overseas. The tourism industry ishampered by a perception of India as poor, politically unstable and requiringprecautions against disease. There is also a shortage of hotel rooms to attractforeign visitors. However, special tax incentives have helped to encourageprojects targeting middle-range business clients and tourists.
The external sector
Trade in goods
The balance-of-payments crisis in 1991 was tackled with a remarkablysuccessful fiscal correction and currency devaluation. According to the ReserveBank of India (RBI, the central bank), the trade deficit was reduced to US$1bnby fiscal year 1993/94 (April-March). Since then, however, imports have risenmore rapidly than exports as the ensuing investment boom sucked in moreimports. The trade deficit stood at US$12.7bn in 2002/03. Strong domesticdemand, rising commodity prices and an appreciating currency resulted in awidening trade deficit in 2003/04. The drivers of a widening trade deficitremained largely unchanged in 2004/05, but a steep rise in oil prices pushed upthe deficit to US$38.1bn. In balance-of-payments terms, imports surged by 48.4%year on year in 2004/05 to US$119bn, reflecting a rising oil import bill and apick-up in industrial activity, and outpacing exports, which advanced by 24.8%.
The trade deficit widens
Tourism remains a smallsector

India 43
© The Economist Intelligence Unit Limited 2005 www.eiu.com Country Profile 2005
Main trading partners, 2003/04(US$ bn)
Exports to:US 11.5UAE 5.1Hong Kong 3.3UK 3.0China 3.0Germany 2.5Singapore 2.1Imports from:US 4.9China 4.1Belgium 3.9Switzerland 3.3UK 3.2Germany 2.9Japan 2.6
Note. Imports do not include crude petroleum and products.
Source: Centre for Monitoring Indian Economy.
India�s major goods exports have long been textiles and gems re-exported aftercutting. Recently, however, the country has developed significant exports ofchemicals, principally drugs and dyes and automotive components. India alsoexports relatively cheap machinery. Its largest import is mineral oils. Domesticcrude oil meets only about 30% of India�s needs. Recently, with importliberalisation, electronic goods imports have also grown. The legalisation ofgold imports has meant that gold, which used to be smuggled in, has begun tobe imported legally and now constitutes a major import.
When it removed the last quantitative import restrictions in 2001, thegovernment feared a big rise in imports of agricultural goods, and raised tariffson cereals and edible oils to over 60%. The fears proved groundless: imports ofthe 300 �sensitive� items that the government had decided to monitor showedno significant growth following the elimination of import restrictions. Most ofthe imports were edible oils, cotton and silk, which India already imported.The only new categories of goods being imported were fruit and vegetables.India is beginning to import out-of-season and exotic fruit from countriesincluding Australia, South Africa and Thailand. Foreign garment and shoeproducers have set up shops or obtained outlets in the major cities. AlthoughIndia is slowly opening up to consumer-goods imports, the government hasintroduced non-tariff barriers on cars, fruit, meat, vegetable oils and otheragricultural products.
Invisibles and the current account
The current account moved into surplus in 2001/02 for the first time in 24 years,in spite of a sizeable trade deficit. This was largely because of a sharp increasein remittances from overseas Indians on the invisibles side of the currentaccount and strong services exports. After the September 11th 2001 terrorist
Textiles and gems have beenthe key exports
The external accounts aresound, but vulnerable to oil

44 India
Country Profile 2005 www.eiu.com © The Economist Intelligence Unit Limited 2005
attacks on the US, a crackdown on unofficial remittances (aimed at preventingterrorist financing) through the hawala system, an informal channel fortransferring funds, is likely to have increased officially transferred funds.Furthermore, a large interest differential between India and most developedeconomies also encourages remittances to India. As a percentage of GDP,workers� remittances have risen from 0.7% in 1990/91 to 3.2% in 2003/04,making India one of the largest global recipients of such inflows. A sharp fall inremittance flows would be a cause for concern as India�s external balancecrucially depends on these transfer payments.
India was a net creditor from 2001/02 to 2003/04!its current account was insurplus in those years!but the current account came under pressure in 2004/05owing to rapid import growth, fuelled by high oil prices and buoyant industrialgrowth. While remittances rose further to US$20.4bn, they could only partlyoffset the pronounced deterioration in the trade balance. According to the RBI,imports grew by a phenomenal 48.4% to US$118.9bn, while exports expandedby 24.9% to US$80.8bn. India�s oil import bill, which accounts for about one-third of total imports, rose by 45% during the period, highlighting thevulnerability of India�s external accounts to large swings in international oilprices. The resulting trade deficit was US$22.7bn higher than the previous year,pushing the current-account balance into a US$6.4bn deficit, compared with aUS$10.6bn surplus in 2003/04.
Income from software services exports is the main driver of the servicessurplus of the current account. After a brief decline in 2000/01 to US$2.5bn(from US$4.1bn in the previous year) as the software boom collapsed in the US,the services surplus bounced back to US$4.6bn in 2001/02. Thereafter it grew ata phenomenal rate and reached US$16.6bn in 2004/05. Rapid future growth insoftware services is likely to continue to support the current account andincreasingly offset the risk of a sudden fall in remittances. India�s incomebalance on the current account has traditionally been in deficit and stood atUS$4bn in 2004/05.
Capital flows and foreign debt
India�s position on the capital account has strengthened considerably in recentyears. According to the RBI, in 2004/05 the capital-account surplus stood atUS$32.2bn, up from US$20.5bn in the previous fiscal year. Rising internationalinvestor confidence in the Indian economy has been reflected in a surge ofportfolio investment and the upward revision of international credit ratings.With the current account in deficit in 2004/05, the rising capital-account surplushas become increasingly instrumental in earning foreign exchange. The level offoreign investment flows!comprising largely of portfolio investment by foreigninstitutional investors (FII)!has risen dramatically in recent years. Portfolioinvestment inflows amounted to US$8.9bn in 2004/05, up from US$2bn in2001/02, the highest in any year since the opening of Indian stock exchanges toforeign capital in 1992/93. Foreign direct investment (FDI) inflows stood atUS$5.5bn, up from the previous year�s level of US$4.7bn, but still only accountsfor around 1% of GDP. The fast-growing services sector was the largest recipientof FDI inflows. Net inflows from non-resident Indians (NRIs) into NRI deposit
The capital-account positionhas strengthened

India 45
© The Economist Intelligence Unit Limited 2005 www.eiu.com Country Profile 2005
schemes turned into an outflow of US$1.1bn in 2004/05, reversing an inflow ofUS$3.6bn in 2003/04, as domestic banks lowered interest rates on foreign-currency deposits to bring them in line with international rates and severallong-term bonds reached maturity. Another significant development on thecapital account in recent years has been the rapid increase in commercialborrowing by Indian corporates in international capital markets!net borrowingrose to US$5.9bn in 2004/05.
India�s total external debt has risen from US$83.8bn in 1991 to US$123.3bn at theend of March 2005 (government measure). However, the ratio of debt to GDPhas fallen from 28.7% to 17.4% over the same period. Commercial finance isincreasingly replacing foreign aid. India is still the World Bank�s biggestborrower, but nearly one-half of the funds are lent on near-commercial terms.Sanctions imposed on India in 1998 forced the World Bank to freeze lending for�non-humanitarian� programmes, although lending has subsequently resumed.OECD aid to India is co-ordinated by the World Bank-sponsored IndiaDevelopment Forum. India has not needed IMF funds since the 1991 financialcrisis, when it borrowed US$4.5bn (which have been repaid).
India�s current debt stock and foreign payment obligations are manageable.Rising foreign-exchange reserves allowed the government to prepay US$3.7bnof its more expensive external debt owed to multilateral and bilateral lenders in2003/04. Restrictions on external commercial borrowings have gradually beenlifted, with total annual borrowing permitted up to a ceiling of US$8.5bn.Foreign banks can guarantee rupee borrowings by Indian companies, andcompanies with foreign-exchange earnings can raise up to US$500m throughexternal commercial borrowings. Furthermore, the end use of externalcommercial borrowings was enlarged to include overseas direct investment injoint ventures in order to allow Indian corporates to diversify into internationalmarkets. India has never defaulted on its external debt, and its external riskassessment is now generally positive.
Foreign reserves and the exchange rate
India�s foreign-exchange reserves have grown significantly since 1991. Thereserves, which stood at US$5.8bn in the immediate aftermath of the balance-of-payment crisis in 1991, rose to around US$25bn in 1995. The second half ofthe 1990s saw a further improvement with reserves touching a level ofUS$38bn in 2000. At the end of June 2005 India�s foreign-exchange reserveshad surged to US$133.6bn, making the stock of reserves the fifth-largest amongemerging-market economies and the sixth-largest in the world. The sterilisationof capital inflows by the RBI was the main cause of the rapid accretion ofreserves. In fact, the capital account has been the main source of the reservebuild-up in the period 1991-2005. It contributed US$149bn to the accretion, faroutweighing the drag on reserves exerted by the current account at aroundUS$23bn. Foreign investment dominated as a source of reserve build-upthrough the capital account at a net US$77.3bn, or 52% of the total, followed byNRI deposits (22%), external commercial borrowing (14%) and externalassistance (7%). As in many other Asian countries, the build-up of reserves in
Foreign-exchange reservesgrow
Exchange-rate policy drivesreserves build-up
The foreign debt position isimproving

46 India
Country Profile 2005 www.eiu.com © The Economist Intelligence Unit Limited 2005
India has accelerated since the US dollar commenced its slide in 2002 as theRBI purchased the capital inflows in order to smooth the rupee�s appreciationand deliver a low volatility of the nominal exchange rate.
During the 1990s and early 2000s the RBI oversaw a managed decline in thevalue of the rupee against the US dollar, intervening only to prevent a sharp fallin the currency. After a devaluation in July 1993, the rupee remained constant ataround Rs31.37:US$1 for two years, before a nominal depreciation in 1995. Itthen gradually weakened to reach Rs48.92:US$1 in early June 2002. Thereafter,the rupee appreciated against the US dollar, driven by high capital inflows andgeneral US dollar weakness in international currency markets, until the generalelection in May 2004, when uncertainty about the new Indian government�seconomic policy led to temporary capital outflows. But the rupee�sdepreciation was short-lived, capital inflows resumed and the currency tradedat levels of Rs43.5:US$1 in mid-July 2005. During the recent period ofconsiderable volatility in international currency markets, the rupee:dollarexchange rate remained roughly stable in nominal terms, confirming that theRBI is, although not officially, targeting the nominal rate against the US dollar.The real effective exchange rate, however, depreciated owing to the rupee�sdepreciation against most free-floating currencies, namely the euro, the yen andpound sterling.
India has taken a gradualist approach to capital-account convertibility and hasmoved in this direction at a slow pace, although the capital account remainsrelatively closed. Starting from current-account convertibility in 1994, fullcapital-account convertibility was introduced for NRIs in early 2002. Thetransfer of capital abroad by resident Indians is still subject to controls. Furtherreforms in the real sector and the financial system are required in order tominimise the risk of a loss of macroeconomic stability that could result from afull convertibility of the capital account. At present, a weak banking sector anda high fiscal deficit remain the main obstacles to full convertibility. Restrictionson capital outflows stem mainly from concern over the domestic impact ofexcessive capital flows on interest rates and money supply growth and the fearthat an open capital account would expose the rupee to speculative attacks,depleting foreign-exchange reserves. The recent build-up in foreign-exchangereserves acts as insurance against such an attack and allows the RBI to respondquickly to short-term capital movements, resulting in unfavourable movementsin the exchange rate.
The rupee�s managed slidecomes to a halt
Full capital-account con-vertibility a distant possibility

India 47
© The Economist Intelligence Unit Limited 2005 www.eiu.com Country Profile 2005
Regional overview
Membership of organisations
The South Asian Association for Regional Co-operation (SAARC), whichcomprises India, Pakistan, Sri Lanka, Bangladesh, Nepal, the Maldives andBhutan, was established in 1985 at a meeting in Bangladesh. SAARC�s aimsinclude promoting welfare, accelerating economic growth, eradicating povertyand improving relations between member states. Summit meetings areintended to be held annually and are complemented by technical committees,meetings of foreign ministers and a standing committee of the foreignsecretaries (civil servants) of each country. An under-resourced secretariat,based in Kathmandu, co-ordinates SAARC�s activities.
In the early years, agreements were made to establish a food security reserve(an agreement that has never been implemented), to establish a meteorologicalcentre, to combat terrorism and to create various cultural exchanges betweenmember states. Together with micro-level issues, SAARC has also proposed thecreation of a South Asian Free-Trade Area (SAFTA). SAFTA is seen as areplacement for the South Asian Preferential Trading Arrangement, which wasagreed in 1995 and which had by 1996 identified more than 2,000 products aseligible for preferential treatment. At the 12th SAARC summit in January 2004,SAARC member countries signed an accord that schedules the creation ofSAFTA for January 1st 2006. A customs union is to be created by 2015 and aneconomic union by 2020. Political factors weigh against this timetable, however.
The 2004 summit, held in the Pakistani capital, Islamabad, was dominated bylandmark talks between the leaders of India and Pakistan over the disputedborder territory of Kashmir. In spite of a recent gradual improvement, tensionsbetween India and Pakistan continue to hamper SAARC�s progress on widerissues, although the association has been relatively effective in providing a forumfor meetings of non-governmental organisations and professional groupings.There is pressure on SAARC from the smaller countries for the association to dealwith bilateral issues; much of this pressure stems from the problematicrelationship between India and Pakistan. There is a consensus that this issueprevents multilateral progress, thus leading to a growing emphasis on bilateraltrading relationships. India has signed bilateral free-trade agreements, effectivelybypassing SAARC, with Nepal (1996) and Sri Lanka (2000). Bhutan and India alsohave a free-trade agreement. Much of SAARC�s work is also likely to besuperseded by World Trade Organisation (WTO) regulations.
SAARC�s ability to reposition itself as the preferred conduit for bilateralrelationships within South Asia is likely to determine the success or otherwiseof the organisation. SAARC�s success in arranging greater civil society linkageswithin South Asia contrasts strongly with its failure to boost government-levelties. Improved relations between India and Pakistan, the largest members ofSAARC, remain a prerequisite for closer economic co-operation in the region;the potential gains from increased trade are immense. At present, intra-regionaltrade accounts for only about 5% of total trade by SAARC nations. The nextSAARC summit will be held in November 2005 in Bangladesh.
The South Asian Associationfor Regional Co-operation

48 India
Country Profile 2005 www.eiu.com © The Economist Intelligence Unit Limited 2005
Appendices
Sources of information
A great number of detailed statistics are available, of variable but often highquality. Three sources stand out: the annual Economic Survey of the Ministry ofFinance is an excellent summary of most key economic data; the Reserve Bankof India produces a steady stream of data in its weekly, monthly and annualpublications; and the Mumbai-based Centre for Monitoring the IndianEconomy (CMIE) produces monthly and annual data in great detail and variety.
For economic data, the daily Business Line is the most comprehensivenewspaper, although Business Standard and The Economic Times can be quickeroff the mark.
For primary data, the following sources are the most important.
Census of India, 2001
Central Statistical Office (CSO), Annual National Accounts Statistics, New Delhi
CSO, Estimates of National Product, Savings and Capital Formation (annual),New Delhi
CSO, Monthly Abstract of Statistics, New Delhi
Directorate General of Commercial Intelligence and Statistics (DGCIS), TradeStatistics of the DGCIS (monthly and annual), Kolkata. The DGCIS alsopublishes a shorter summary entitled Foreign Trade Statistics of India (PrincipalCommodities and Countries), which is reasonably detailed
Ministry of Finance, Budget of the Central Government (annual), New Delhi(although Indian budgetary conventions are arcane and require someinterpretation)
Reserve Bank of India (RBI, the central bank), Bulletin (monthly), Mumbai
RBI, Report on Currency and Finance (annual), Mumbai
Bank for International Settlements, International Banking and Financial MarketDevelopments (quarterly)
IMF, International Financial Statistics (monthly)
International Institute for Strategic Studies, The Military Balance (annual)
OECD, Geographical Distribution of Financial Flows to Developing Countries(annual)
UN, Monthly Bulletin of Statistics
UN, World Investment Report (annual)
World Bank, World Development Report (annual)
National statistical sources
International statistical sources

India 49
© The Economist Intelligence Unit Limited 2005 www.eiu.com Country Profile 2005
Business World (weekly), Business India and Business Today (both fortnightly) arethe chief business magazines
Economic and Political Weekly is a left-wing academic journal with high-qualityanalysis
India Today and Outlook are weekly magazines that concentrate on politics
For those wishing to get a general feel for Indian society, the best source is India�snovelists. Particularly recommended are R K Narayan (especially the Malgudinovels), Vikram Seth (A Suitable Boy), Amit Chaudhuri (A Strange and SublimeAddress), Ruth Prawer Jhabwala, Ved Mehta (Portrait of India, Face to Face), GitaMehta, Anita Desai, Mulk Raj Anand, Nayantara Sahgal and Sunil Gangopadhyay
Academic analyses of the background to the economic reform programme are inBimal Jalan (ed), The Indian Economy: Problems and Prospects, New Delhi,Viking/Penguin, 1992, and in Vijay Joshi and Ian Little (eds), Indian EconomicReform, Oxford University Press, 1995. A more up-to-date discussion of India�seconomic reforms is contained in India in the Era of Economic Reforms, edited byAshutosh Varshney and Jeffrey Sachs, Oxford University Press, 2000
An integrated account of India�s population, development and economy can befound in Tim Dyson et al, Twenty-First Century India, Oxford UniversityPress, 2004
A regional perspective of economic growth in India can be found in M Baddeley,K McNay and R H Cassen, Divergence in India: Economic Growth at the State Level,1990-7, London School of Economics, 2003
Major historical works are Louis Fischer�s Life of Mahatma Gandhi (Granada,1951) and Jawaharlal Nehru�s The Discovery of India (Meridian, London, 1945).Two more recent additions include Patrick French�s Liberty or Death (HarperCollins, 1997) and Sunil Khilnani�s The Idea of India (Hamish Hamilton, 1997)
Election Commission of India: www.eci.gov.in/
Ministry of Finance: www.nic.in/finmin/
The best all-encompassing news site is www.samachar.com
Select bibliography andwebsites
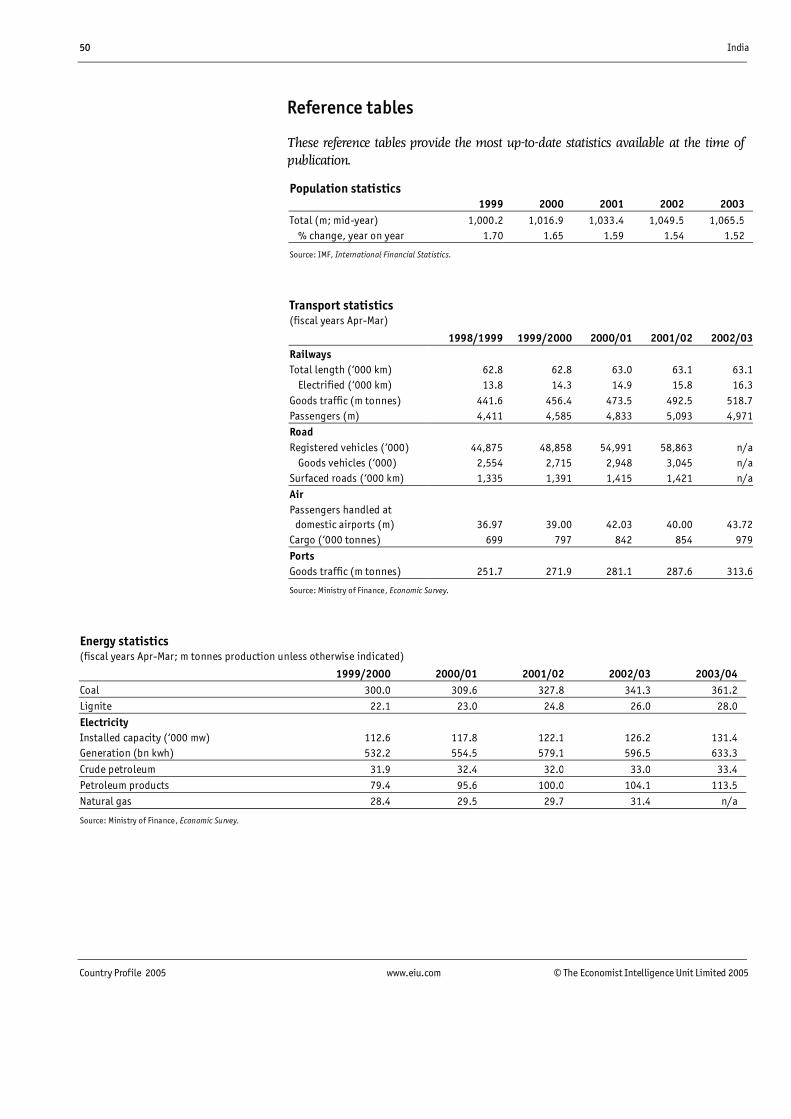
50 India
Country Profile 2005 www.eiu.com © The Economist Intelligence Unit Limited 2005
Reference tables
These reference tables provide the most up-to-date statistics available at the time ofpublication.
Population statistics1999 2000 2001 2002 2003
Total (m; mid-year) 1,000.2 1,016.9 1,033.4 1,049.5 1,065.5 % change, year on year 1.70 1.65 1.59 1.54 1.52
Source: IMF, International Financial Statistics.
Transport statistics(fiscal years Apr-Mar)
1998/1999 1999/2000 2000/01 2001/02 2002/03RailwaysTotal length (�000 km) 62.8 62.8 63.0 63.1 63.1 Electrified (�000 km) 13.8 14.3 14.9 15.8 16.3Goods traffic (m tonnes) 441.6 456.4 473.5 492.5 518.7Passengers (m) 4,411 4,585 4,833 5,093 4,971RoadRegistered vehicles (�000) 44,875 48,858 54,991 58,863 n/a Goods vehicles (�000) 2,554 2,715 2,948 3,045 n/aSurfaced roads (�000 km) 1,335 1,391 1,415 1,421 n/a
AirPassengers handled at
domestic airports (m) 36.97 39.00 42.03 40.00 43.72Cargo (�000 tonnes) 699 797 842 854 979
PortsGoods traffic (m tonnes) 251.7 271.9 281.1 287.6 313.6
Source: Ministry of Finance, Economic Survey.
Energy statistics(fiscal years Apr-Mar; m tonnes production unless otherwise indicated)
1999/2000 2000/01 2001/02 2002/03 2003/04Coal 300.0 309.6 327.8 341.3 361.2Lignite 22.1 23.0 24.8 26.0 28.0
ElectricityInstalled capacity (�000 mw) 112.6 117.8 122.1 126.2 131.4Generation (bn kwh) 532.2 554.5 579.1 596.5 633.3
Crude petroleum 31.9 32.4 32.0 33.0 33.4Petroleum products 79.4 95.6 100.0 104.1 113.5Natural gas 28.4 29.5 29.7 31.4 n/a
Source: Ministry of Finance, Economic Survey.

India 51
© The Economist Intelligence Unit Limited 2005 www.eiu.com Country Profile 2005
Government finances(fiscal years Apr-Mar; Rs bn unless otherwise indicated)
1999/2000 2000/01 2001/02 2002/03 2003/04Total revenue 2,980 3,256 3,624 4,142 4,714 Current 1,815 1,926 2,014 2,317 2,639 Taxa 1,283 1,367 1,337 1,594 1,870 Non-tax 532 559 678 723 769 Capital 1,165 1,330 1,610 1,824 2,075 Recovered loans 101 121 164 342 673 Borrowings & other liabilities 1,047 1,188 1,410 1451 1,233 Other 17 21 36 32 170
Total expenditure 2,981 3,256 3,625 4,142 4,714 Current 2,491 2,779 3,016 3,396 3,621 Interest payments 902 993 1,075 1,178 1,241 Subsidies 245 268 312 435 443 Capital 490 478 608 745 1,092
Fiscal deficitb 1,047 1,188 1,410 1,451 c 1,233 c
% of GDP 5.4 5.7 6.2 5.9 4.5Memorandum itemsRevenue deficitd 676 852 1,002 1,079 983Primary deficite 145 195 335 273 -816
a Net of states� share of income tax and union excise duties. b Total expenditure minus total receipts less borrowings and other liabilities. c Basedon provisional figures. d Revenue expenditure minus revenue receipts. e Fiscal deficit minus interest payments.
Source: Ministry of Finance, Budget at a Glance.
Gross domestic product(market prices)
1999/2000 2000/01 2001/02 2002/03 2003/04Total (US$ bn)At current prices 444.3 452.4 478.5 508.9 594.9
Total (Rs bn)At current prices 19,368.3 20,668.0 22,821.4 24,633.2 27,600.3At constant (1993) prices 12,662.8 13,162.0 13,840.1 14,406.3 15,646.2 % change, year on year 7.1 3.9 5.2 4.1 8.6Per head (Rs)At current prices 19,316 20,293 22,067 23,467 25,914At constant (1993) prices 12,629 12,923 13,383 13,724 14,690 % change, year on year 5.4 2.3 3.6 2.6 7.0
Source: Central Statistical Office.

52 India
Country Profile 2005 www.eiu.com © The Economist Intelligence Unit Limited 2005
Nominal gross domestic product by expenditure(Rs bn at current prices; % of total in brackets)
1999/2000 2000/01 2001/02 2002/03 2003/04Private consumption 12,715.6 13,593.6 14,940.5 15,851.3 17,658.5
(65.7) (65.8) (65.5) (64.3) (64.0)Government consumption 2,511.1 2,645.6 2,843.1 2,915.5 3,121.1
(13.0) (12.8) (12.5) (11.8) (11.3)
Gross fixed investment 4,219.0 4,597.9 5,004.1 5,479.5 6,273.1(21.8) (22.2) (21.9) (22.2) (22.7)
Stockbuilding 363.6 138.3 86.5 100.1 83.9(1.9) (0.7) (0.4) (0.4) (0.3)
Exports of goods & services 2,277.0 2,781.3 2,907.6 3,555.6 4,078.0(11.8) (13.5) (12.7) (14.4) (14.8)
Imports of goods & services 2,657.0 2,975.2 3,110.5 3,799.8 4,434.0(13.7) (14.4) (13.6) (15.4) (16.1)
GDP 19,368.3 20,668.0 22,821.4 24,633.2 27,600.3
Source: Central Statistical Office.
Real gross domestic product by expenditure(Rs bn at constant 1993 prices; % change year on year in brackets)
1999/2000 2000/01 2001/02 2002/03 2003/04Private consumption 7,976.5 8,186.4 8,667.4 8,914.2 9,648.7
(6.0) (2.6) (5.9) (2.8) (8.2)Government consumption 1,584.3 1,593.4 1,640.4 1,601.8 1,660.9
(13.2) (0.6) (2.9) (-2.4) (3.7)Gross fixed investment 3,027.9 3,144.0 3,286.6 3,540.9 3,883.0
(9.3) (3.8) (4.5) (7.7) (9.7)
Stockbuilding 255.7 95.3 58.7 72.6 54.3(2.3)a (-1.3)a (-0.3)a (0.1)a (-0.1)a
Exports of goods & services 1,785.8 2,112.1 2,230.6 2,718.9 2,985.0(18.0) (18.3) (5.6) (21.9) (9.8)
Imports of goods & services 1,929.8 1,996.9 2,064.4 2,277.1 2,543.5(7.0) (3.5) (3.4) (10.3) (11.7)
GDP 12,662.8 13,162.0 13,840.1 14,406.3 15,646.2(7.1) (3.9) (5.2) (4.1) (8.6)
a Change as a percentage of GDP in the previous year.
Source: Central Statistical Office.

India 53
© The Economist Intelligence Unit Limited 2005 www.eiu.com Country Profile 2005
Gross domestic product by sector, at constant prices(fiscal years Apr-Mar; Rs bn; constant 1993/94 prices)
2000/01 2001/02 2002/03 2003/04 2004/05Agriculture 2,867 3,047 2,834 3,106 3,142Industry Mining 279 286 312 332 347 Construction 627 652 699 748 787 Electricity, gas & water supply 296 307 317 328 346 Manufacturing 2,062 2,137 2,276 2,434 2,657Servicesa 5,862 6,250 6,697 7,357 8,014
GDP 11,986 12,679 13,184 14,305 15,294
a Including statistical discrepancy.
Sources: Central Statistical Office; Economist Intelligence Unit.
Gross domestic product by sector, at factor cost(fiscal years Apr-Mar; % share of total; % change year on year in brackets)
2000/01 2001/02 2002/03 2003/04 2004/05Agriculture 23.9 24.0 21.5 21.7 20.5
(-0.1) (2.8) (-7.0) (9.6) (1.2)Mining 2.3 2.3 2.4 2.3 2.3
(2.4) (2.5) (9.1) (6.4) (4.5)Construction 5.2 5.1 5.3 5.2 5.1
(6.9) (4.0) (7.2) (7.0) (5.2)Electricity, gas & water 2.5 2.4 2.4 2.3 2.3
(4.2) (3.7) (3.3) (3.5) (5.5)
Manufacturing 17.2 16.9 17.3 17.0 17.4(7.5) (3.6) (6.5) (6.9) (9.2)
Services 48.9 49.3 50.8 51.4 52.4(5.6) (6.6) (7.2) (9.9) (8.9)
Sources: Central Statistical Office; Economist Intelligence Unit.
Money supply(Rs bn unless otherwise indicated; end-period)
2000 2001 2002 2003 2004Money (M1) incl others 3,495.9 3,846.0 4,324.9 5,026.0 5,991.3 % change, year on year 10.6 10.0 12.5 16.2 19.2Quasi-money 8,197.5 9,522.0 11,283.7 12,617.0 14,480.9
Money (M2) 11,693.4 13,368.0 15,608.6 17,643.0 20,472.2 % change, year on year 15.2 14.3 16.8 13.0 16.0
Source: IMP, International Financial Statistics.

54 India
Country Profile 2005 www.eiu.com © The Economist Intelligence Unit Limited 2005
Interest rates(%; period averages unless otherwise indicated)
2000 2001 2002 2003 2004Lending interest rate (%) 12.3 12.1 11.9 11.5 10.9Deposit interest rate (%) 9.1 8.5 6.9 5.2 5.3
Money-market interest rate (%) 9.1 7.2 5.9a 4.1a 4.5a
a Economist Intelligence Unit estimate.
Sources: IMF, International Financial Statistics; Reserve Bank of India; Economist Intelligence Unit.
Prices and earnings(% change, year on year)
2000 2001 2002 2003 2004Consumer prices (av) 4.0 3.8 4.3 3.8 3.8Average nominal wages 6.0 6.0 6.5 7.0 7.5
Average real wages 1.9 2.1 2.1 3.1 3.6Unit labour costs 3.0 -2.5 1.9 5.5 5.9
Sources: IMF, International Financial Statistics.
Availability of selected consumption items(fiscal years Apr-Mar; per head)
1998/99 1999/2000 2000/01 2001/02 2002/03Foodgrains (kg) 175.0 167.0 152.0 180.6 n/aEdible oils (kg) 8.5 9.0 8.2 8.8 7.2
Sugar (kg)a 14.9 15.6 15.8 16.0 16.3Cloth (metres) 28.2 30.6 30.7 32.0 31.4 Cotton 13.1 14.2 14.2 14.8 14.4 Synthetics 15.1 16.4 16.5 17.2 17.0Tea (g) 684 642 631 650 596
Electricity (kwh) 66.7 71.2 75.2 76.8 79.0
a Crop years (November-October).
Source: Ministry of Finance, Economic Survey.

India 55
© The Economist Intelligence Unit Limited 2005 www.eiu.com Country Profile 2005
Agricultural productiona
(m tonnes unless otherwise indicated)
1999/2000 2000/01 2001/02 2002/03 2003/04Foodgrains & pulses Rice 89.7 85.0 93.3 72.7 87.0 Wheat 76.4 69.7 72.8 65.1 72.1 Coarse grains (millet,
sorghum & maize) 30.3 31.1 33.4 25.3 37.8 Pulses 13.4 11.1 13.4 11.1 15.2Total 209.8 196.8 211.9 174.2 212.0Oilseedsb
Groundnut 5.3 6.4 7.0 4.4 8.3Total (9 species) 20.7 18.4 20.7 15.1 25.1Beverages Teac 0.8 0.8 0.8 0.8 0.8 Coffeed 0.3 0.3 0.3 0.3 0.3Fibres Cotton (lint; m 170-kg
bales)d 11.5 9.5 10.0 8.7 13.8 Jute & mesta (m 180-kg
bales) 10.6 10.5 11.7 11.4 11.2Other products Sugarcane 299.3 296.0 298.4 281.6 236.2 Rubberd 0.6 0.6 0.6 0.6 0.7 Potatoes 24.7 22.5 23.9 23.2 n/a
a Crop years (July-June) unless otherwise indicated. b October-September. c Calendar years; bn kg.d Fiscal years (April-March).
Sources: Ministry of Agriculture, Statistics at a Glance; Ministry of Finance, Economic Survey.
Minerals production(fiscal years Apr-Mar; m tonnes)
1999/2000 2000/01 2001/02 2002/03 2003/04Coal & lignite 322.1 332.6 352.6 367.2 n/aCrude oilDomestic production 31.9 32.4 32.0 33.0 33.4Imports 57.8 74.1 78.7 82.0 90.4Refinery throughput 86.0 103.4 107.3 112.6 121.8
Petroleum productsa
Domestic production 79.4 95.6 100.0 104.1 113.5Imports (net) 15.8 0.9 -3.1 -3.6 -6.7
a Some disparity is likely owing to refinery consumption and stock changes.
Source: Ministry of Finance, Economic Survey.

56 India
Country Profile 2005 www.eiu.com © The Economist Intelligence Unit Limited 2005
Industrial production(fiscal years Apr-Mar)
1998/99 1999/2000 2000/01 2001/02 2002/03Finished steel (m tonnes) 24.7 28.5 30.3 31.1 34.5Aluminium (virgin metal; �000 tonnes) 546.5 497.9 620.4 552.1 467.0
Copper (blister; �000 tonnes) 37.7 n/a n/a n/a n/aMotor vehicles (�000 units)a 642.0 824.4 784.2 765.1 934.9
Motorcycles & mopeds (�000 units) 3,278 3,722 3,756 3,932 5,088Bicycles (�000 units) 10,614 13,733 14,974 11,899 11,595
Power-driven pumps (�000 units) 616 599 481 472 584
a All types; includes buses, trucks and tempos, and three- and four-wheelers.
Source: Ministry of Finance, Economic Survey.
Gross domestic savings(fiscal years Apr-Mar; % of total)
1999/2000 2000/01 2001/02 2002/03 2003/04Household sector 86.3 92.3 96.4 89.5 86.5Private corporate 18.0 17.6 15.2 14.7 14.7Public sector -4.3 -9.9 -11.6 -4.2 -1.2
Source: Ministry of Finance, Economic Survey.
Stockmarket indicators(Mumbai Stock Exchange; end-period)
2000 2001 2002 2003 2004BSE SENSEXa (1978/79=100) 3,972.12 3,262.33 3,377.28 5,838.96 6,602.69
Change in US-dollar value of stockmarket index (%) -31.4 -24.3 15.9 87.5 15.3No. of listed companies 5,937 5,795 5,650 5,644 4,730Market capitalisation (US$ bn) 148 110 131 279 388
a Leading index of the Mumbai Stock Exchange.
Sources: Standard & Poor�s, Emerging Stock Market Review; Bombay Stock Exchange.
Main composition of trade(US$ m; fob-cif)
1999 2000 2001 2002 2003Exports fobNon-metallic mineral manufactures 7,925 7,875 7,331 9,014 12,192Textile, yarn & fabrics 3,593 4,331 5,218 5,942 6,469Clothing 4,738 5,291 5,024 5,704 6,104Coffee, tea, cocoa & spices 1,055 1,447 1,283 1,447 1,567Total exports incl others 35,668 42,376 43,337 49,521 58,879Imports cifBasic manufactures 16,005 17,661 21,460 24,263 33,074Mineral fuels 14,265 16,147 14,048 17,685 20,621Machines & transport equipment 8,451 9,587 6,540 7,716 9,819Chemicals 5,310 6,055 4,470 4,686 6,245Total imports incl others 46,965 50,911 50,610 56,532 71,204
Sources: Reserve Bank of India; Asian Development Bank, Key Indicators of Developing Asian and Pacific Countries.

India 57
© The Economist Intelligence Unit Limited 2005 www.eiu.com Country Profile 2005
Main trading partners(% of total)
2000 2001 2002 2003 2004Exports fob to:US 21.4 21.6 22.9 19.2 19.8China 1.8 3.6 4.2 4.6 8.3UAE 5.8 3.9 3.7 7.9 8.0UK 5.3 5.7 5.2 4.9 5.1
Imports cif from:US 6.2 8.2 8.0 5.3 6.9China 2.8 4.1 5.2 5.2 6.0Belgium 6.0 5.9 7.5 5.4 6.0Singapore 2.9 6.0 5.2 2.6 4.7
Source: IMF, Direction of Trade Statistics.
Balance of payments, IMF series(US$ m)
1999 2000 2001 2002 2003Goods: exports fob 36,877 43,247 44,794 51,142 59,338Goods: imports fob -45,556 -53,887 -51,211 -54,701 -68,208
Trade balance -8,679 -10,640 -6,418 -3,560 -8,869Services: credit 14,509 16,684 17,336 19,478 23,397Services: debit -17,272 -19,187 -20,100 -21,041 -25,709
Income: credit 1,920.0 2,521.0 3,524.0 3,188.0 3,779.0Income: debit -5,629.0 -7,414.0 -7,667.0 -7,097.0 -8,230.0
Current transfers: credit 11,957.0 13,448.0 14,981.0 16,693.0 22,698.0Current transfers: debit -35.0 -113.0 -407.0 -698.0 -345.0
Current-account balance -3,227.0 -4,703.0 1,251.0 6,964.0 6,718.0Direct investment in India 2,168.0 3,584.0 5,476.0 5,640.0 4,633.0Direct investment abroad -79.0 -510.0 -1,398.0 -1,679.0 -1,325.0
Inward portfolio investment(incl bonds) 2,317.0 1,328.0 0.0 0.0 0.0
Outward portfolio investment 0.0 0.0 0.0 0.0 0.0Other investment assets -451.0 1,712.0 -2,834.0 3,699.0 -3,258.0
Other investment liabilities 5,623.0 2,619.0 2,949.0 2,893.0 7,001.0Financial balance 9,578.0 8,733.0 4,193.0 10,553.0 7,051.0Net errors & omissions 314.0 330.0 -715.0 -191.0 182.0Overall balance 6,664.0 6,094.0 8,324.0 18,451.0 26,007.0Financing (� indicates inflow)Movement of reserves -5,237.0 -5,084.0 -8,046.0 -22,178.0 -31,883.0Use of IMF credit & loans 0.0 0.0 0.0 0.0 0.0
Source: IMF, International Financial Statistics.

58 India
Country Profile 2005 www.eiu.com © The Economist Intelligence Unit Limited 2005
Balance of payments, national series(US$ m)
2001/02 2002/03 2003/04 2004/05Merchandise exports fob 44,703 53,774 64,723 80,831Merchandise imports cif -56,277 -64,464 -80,177 -118,961
Trade balance -11,574 -10,690 -15,454 -38,130Invisible inflows 36,737 41,925 52,982 77,500
Invisible outflows -21,763 -24,890 -26,967 -45,801Invisibles balance 14,974 17,035 26,015 31,699
Current�account balance 3,400 6,345 10,561 -6,431Foreign investment 6,789 8,151 5,639 11,944Net foreign aid 1,117 -3,128 -2,742 1,922
Commercial borrowing -1,585 -1,692 -1,526 5,947Short-term borrowing -793 970 1,420 3,792
Banking 2,864 10,425 6,231 4,002Rupee debt service -519 -474 -376 -417Other capital 781 578 2,759 4,985
Capital-account balance 8,551 10,840 20,542 32,175Net errors & omissions -194 -200 318 415
Overall balance 11,757 16,985 31,421 26,159Change in reserves (� indicates increase) -11,757 -16,985 -31,421 -26,159
Source: Reserve Bank of India.
External debt, World Bank series(US$ m unless otherwise indicated; debt stocks as at year-end)
1999 2000 2001 2002 2003Public medium- & long-term 86,410 83,156 83,101 88,165 92,822Private medium- & long-term 7,944 12,480 11,674 13,579 15,909
Total medium- & long-term debt 94,354 95,636 94,775 101,744 108,731 Official creditors 58,545 50,626 49,795 49,803 50,882 Bilateral 27,184 20,163 18,741 20,306 21,420 Multilateral 31,361 30,463 31,054 29,497 29,462 Private creditors 35,809 45,010 44,980 51,941 57,849Short-term debt 3,933 3,462 2,742 4,569 4,736 Interest arrears 0 0 0 0 0Use of IMF credit 26 0 0 0 0
Total external debt 98,313 99,098 97,517 106,313 113,467Principal repayments 6,399 6,712 5,477 9,493 14,314Interest payments 3,782 4,182 3,849 3,785 6,074 Short-term debt 209 185 112 146 140Total debt service 10,182 10,893 9,327 13,278 20,389
Ratios (%)Total external debt/GDP 22.1 21.9 20.4 20.9 19.1Debt-service ratio, paida 15.8 14.5 11.7 14.6 19.2
Note. Long-term debt is defined as having original maturity of more than one year.
a Debt service as a percentage of earnings from exports of goods and services.
Source: World Bank, Global Development Finance.

India 59
© The Economist Intelligence Unit Limited 2005 www.eiu.com Country Profile 2005
Foreign reserves(US$ m; end-period)
2000 2001 2002 2003 2004Total reserves incl gold 40,154.0 48,200.0 70,378.0 102,261.0 130,401.0Total international reserves
excl gold 37,902.0 45,871.0 67,666.0 98,938.0 126,593.0
Gold, national valuation 2,252.0 2,329.0 2,712.0 3,323.0 3,808.0
Source: IMF, International Financial Statistics.
Exchange rates(Rs per unit of currency unless otherwise indicated; annual averages)
2000 2001 2002 2003 2004US$ 44.9 47.2 36.3 46.6 45.3
£ 68.0 67.9 54.4 76.1 83.0� 41.5 42.3 34.3 52.7 56.4
Bt 1.12 1.06 0.85 1.12 1.13Rmb 5.43 5.70 4.39 5.63 5.47¥ 0.417 0.388 0.290 0.402 0.419
Source: IMF, International Financial Statistics.
Editors: Ravi Bhatia (editor); Gerard Walsh (consulting editor)Editorial closing date: July 29th 2005
All queries: Tel: (44.20) 7830 1007 E-mail: [email protected]