India Cookstoves
102
1 Global Alliance for Clean Cookstoves India Cookstoves and Fuels Market Assessment Dalberg Global Development Advisors February 2013
Transcript of India Cookstoves
1
Global Alliance for Clean Cookstoves
India Cookstoves and Fuels Market Assessment
Dalberg Global Development Advisors
February 2013
2
Introduction
The “India Cookstoves and Fuels Market Assessment” was conducted by Dalberg Global
Development Advisors on behalf of the Global Alliance for Clean Cookstoves (“the Alliance”).
It is one of a series of country assessments completed by the Alliance to:
Enhance sector market intelligence and knowledge;
Contribute to a process leading to the Alliance deciding which regions/countries it will prioritize;
and
Support the Alliance in developing its strategy and approach to country level interventions.
This document is meant to provide a snapshot of the cookstoves sector in India in terms of the
overall trends in supply and demand, and emerging opportunities and challenges. It can and should
be used in conjunction with a number of research papers, consumer surveys and other sources
(most published on the Alliance’s website) to enhance the sector’s understanding of the market.
In this study, a team of Dalberg consultants overseen by the Alliance staff led the data collection and
analysis in India over a period of 5 weeks conducting a combination of primary sources (through
expert interviews and the Alliance-sponsored stakeholder consultations) and secondary research as
well. The process was designed to build on and synthesize the research that has already been
conducted in the sector.
The GACC team directing the project was Amy Sticklor, Davis Broach and Radha Muthiah, The Dalberg team was directed by Gaurav Gupta, Michael Tsan, Shyam
Sundaram and Swetha Totapally. Madhu Yalamarthi, Amit Damani, Snigdha Kumar and Rasesh Mohan all contributed to this report. For any further questions on the
report, please contact Amy Sticklor (GACC) at [email protected] or Shyam Sundaram (Dalberg) at [email protected]
3
Executive summary
Health, social and environmental impact
Sector mapping
Project approach
Macro environment
Consumer assessment
Sector mapping summary
Appendix
Table of contents
Cookstove policy environment
Cookstove industry
Fuel usage and trends
4
Executive summary (1/2)
India has grown to be the third largest economy in the world (in PPP terms) and its population of 1.2 billion presents
an enormous market opportunity for emerging businesses.
However, growth has not been equal and large challenges remain: ~35% of its population lives on less than $1.25 a
day, health and educational outcomes remain on average low, physical infrastructure is weak, and access to energy is a
challenge for the majority of the population.
Solid fuels remain a critical part of the energy formula for many households. ~67% of households in the country
(equivalent of ~166 million households) remain wedded to solid fuels as their primary source of cooking fuel. While
conversion to modern fuels has accelerated in urban areas, populations in rural areas have been slow to move away
from solid fuels. Given that the majority of India’s population is likely to remain young and rural over the next 10 years,
solid fuels will continue to play an important role in the energy mix of households.
The use of solid fuels and inefficient cookstoves has had significant impacts on health outcomes and
livelihoods, particularly for women. ~400 million people in India (of which 90% are women) are exposed to the
negative health impacts associated with indoor air pollution from inefficient cookstoves, resulting in respiratory,
pulmonary and vision problems. It is estimated that household air pollution is the leading cause of DALYs in South Asia
leading to ~875,000 premature and avoidable deaths. In addition to the health impacts, inefficient cookstoves and
practices entails that women spend up to ~5-8 hours per day on cooking activities, with ~20% of that time devoted to the
collection of fuel.
Based on the overall population, fuel practices, and income segments, there is a very large market for
cookstoves including both easy and challenging to address segments. The overall market size in India is ~235
million households, more than the total market sizes of many other developing countries combined. The easiest
consumer segment to target would likely be the low and mid-high solid income solid fuel purchasers – a market of ~33
million (or 14% of the overall market). A larger and more challenging market would be rural solid fuel collectors who
could benefit most from cookstoves, and make up ~45% of the market – however, given that they don’t have a history of
paying for fuel, it would be harder to break into. However, a key challenge for all segments will be to ensure that the
cookstove is affordable enough for the end-consumer (either by bringing down the price point or by enhancing the
availability of consumer financing options)
5
Executive summary (2/2)
Despite the large market potential, there are a limited number of players in the market and few have reached
scale. There are a wide variety of cookstove technologies on the market today – ranging from basic improved
cookstoves to renewable energy solutions. While there is a thriving and growing set of private sector actors (and NGOs)
in the sector, the majority of them are small and have yet to scale up to meet the magnitude of the problem. Key
challenges include: lack of awareness of the problem among consumers, a dearth of sustainable financing sources,
variable government policies which can spoil the market by introducing subsidies, and challenges in identifying effective
partners to conduct rural distribution.
While the government has been slower to re-enter the cookstove policy sector, donors and multilateral agencies
are scaling up their efforts in this area. The government’s experience with the National Program on Improved
Cookstoves (NPIC) met with some successes at a state level (i.e., Gujarat) but faced challenges nationally. New
initiatives such as the National Biomass Cooking Initiative and National Clean Energy Fund have sought to incorporate
lessons learned from the prior policy initiatives and are focused on enhancing the role of the private sector, but have
been slow to start. However, cookstoves have become a popular focus area for donor agencies and multilateral
programs and new programs on supporting research, financing and implementation are beginning to emerge.
Overall, there is a high potential for cookstoves to become an attractive opportunity for the private sector and
an impactful mechanism by which to improve health outcomes and livelihood opportunities for millions of
households. However, in order to scale up both the supply and demand for cookstoves, support is required in four
areas: (i) facilitating greater partnerships between stakeholders and sharing of knowledge within the sector, (ii)
developing and promoting acceptable and minimum standards for stove performance, (iii) promoting awareness of
cookstoves and the positive benefits they hold, and (iv) providing and promoting a wider base and diversity of financing
options available to both consumers and suppliers.
6
Executive summary
Health, social and environmental impact
Sector mapping
Project approach
Macro environment
Consumer assessment
Sector mapping summary
Appendix
Table of contents
Cookstove policy environment
Cookstove industry
Fuel usage and trends
7
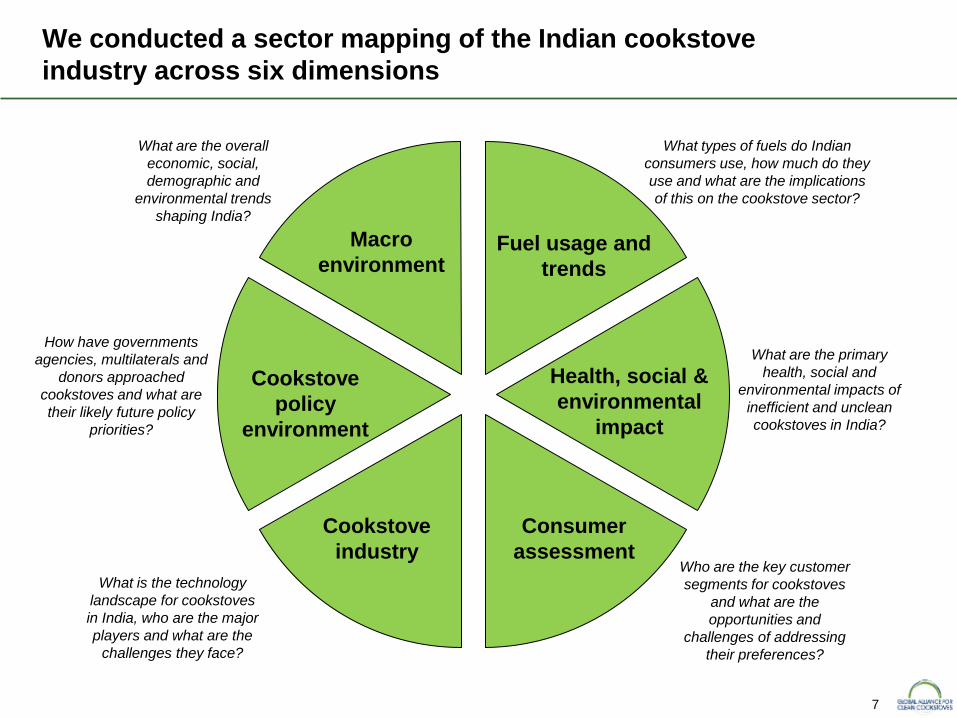
We conducted a sector mapping of the Indian cookstove
industry across six dimensions
Macro
environment Fuel usage and
trends
Health, social &
environmental
impact
Cookstove
industry
Consumer
assessment
Cookstove
policy
environment
What are the overall
economic, social,
demographic and
environmental trends
shaping India?
What types of fuels do Indian
consumers use, how much do they
use and what are the implications
of this on the cookstove sector?
What are the primary
health, social and
environmental impacts of
inefficient and unclean
cookstoves in India?
What is the technology
landscape for cookstoves
in India, who are the major
players and what are the
challenges they face?
Who are the key customer
segments for cookstoves
and what are the
opportunities and
challenges of addressing
their preferences?
How have governments
agencies, multilaterals and
donors approached
cookstoves and what are
their likely future policy
priorities?
8
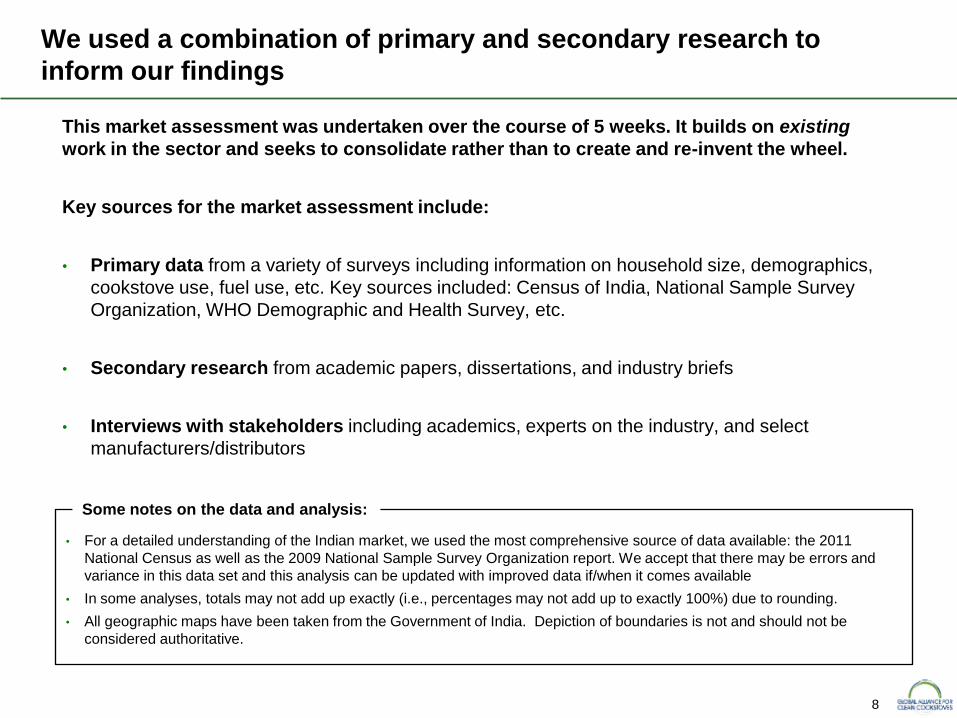
We used a combination of primary and secondary research to
inform our findings
This market assessment was undertaken over the course of 5 weeks. It builds on existing
work in the sector and seeks to consolidate rather than to create and re-invent the wheel.
Key sources for the market assessment include:
• Primary data from a variety of surveys including information on household size, demographics,
cookstove use, fuel use, etc. Key sources included: Census of India, National Sample Survey
Organization, WHO Demographic and Health Survey, etc.
• Secondary research from academic papers, dissertations, and industry briefs
• Interviews with stakeholders including academics, experts on the industry, and select
manufacturers/distributors
Some notes on the data and analysis:
• For a detailed understanding of the Indian market, we used the most comprehensive source of data available: the 2011
National Census as well as the 2009 National Sample Survey Organization report. We accept that there may be errors and
variance in this data set and this analysis can be updated with improved data if/when it comes available
• In some analyses, totals may not add up exactly (i.e., percentages may not add up to exactly 100%) due to rounding.
• All geographic maps have been taken from the Government of India. Depiction of boundaries is not and should not be
considered authoritative.
9
We validated and refined our findings through a series of
stakeholder consultations in Chennai and Delhi
Participants at GACC stakeholder consultations in India
SELCO
Foundation
Sneha Bio
Energy
Lata Medical
Research Foundation
Maulana Azad
Medical College
Parkirama Energy
Resources
Manufacturers and distributors:
Donor agencies, Non profit sector, advocacy organizations and research organizations:
Sunstone
Enterprises
Phoenix Udyog
Pvt. Ltd.
Mi India
Capital
Government:
10
Executive summary
Health, social and environmental impact
Sector mapping
Project approach
Cookstove industry
Sector mapping summary
Appendix
Table of contents
Cookstove policy environment
Consumer assessment
Fuel usage and trends
Macro environment
11
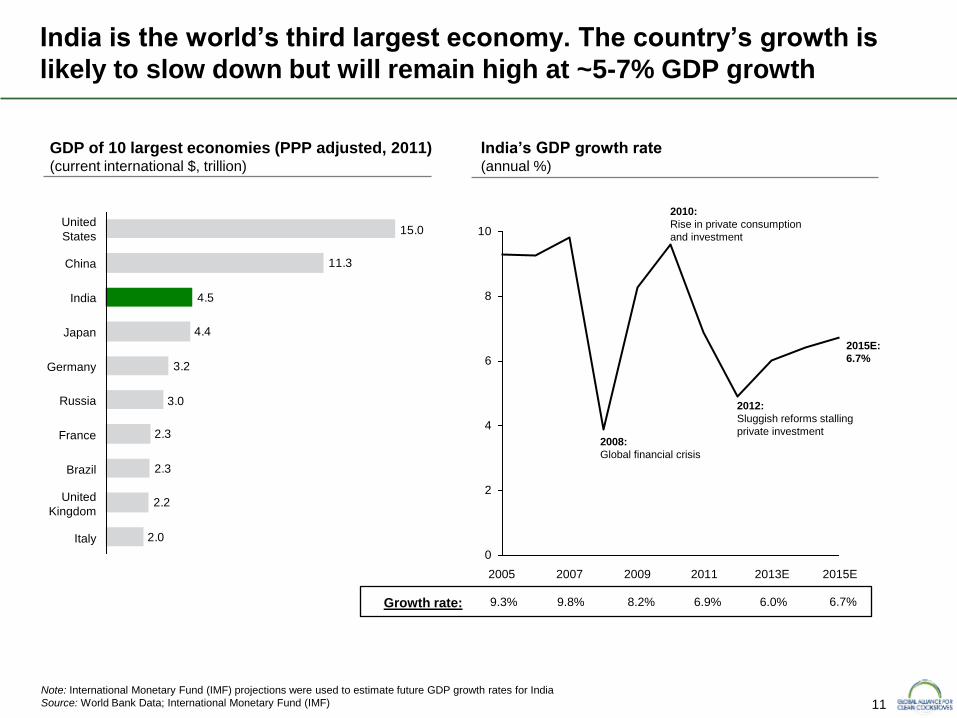
India is the world’s third largest economy. The country’s growth is
likely to slow down but will remain high at ~5-7% GDP growth
2.0
2.2
2.3
2.3
3.0
3.2
4.4
4.5
11.3
15.0
Japan
India
China
United
States
Italy
United
Kingdom
Brazil
France
Russia
Germany
GDP of 10 largest economies (PPP adjusted, 2011) (current international $, trillion)
Note: International Monetary Fund (IMF) projections were used to estimate future GDP growth rates for India
Source: World Bank Data; International Monetary Fund (IMF)
India’s GDP growth rate (annual %)
6.7%
0
2
4
6
8
10
2015E 2013E 2011 2009 2007 2005
9.3%
9.8%
8.2%
6.9%
6.0%
Growth rate:
2012:
Sluggish reforms stalling
private investment
2015E:
6.7%
2008:
Global financial crisis
2010:
Rise in private consumption
and investment
12
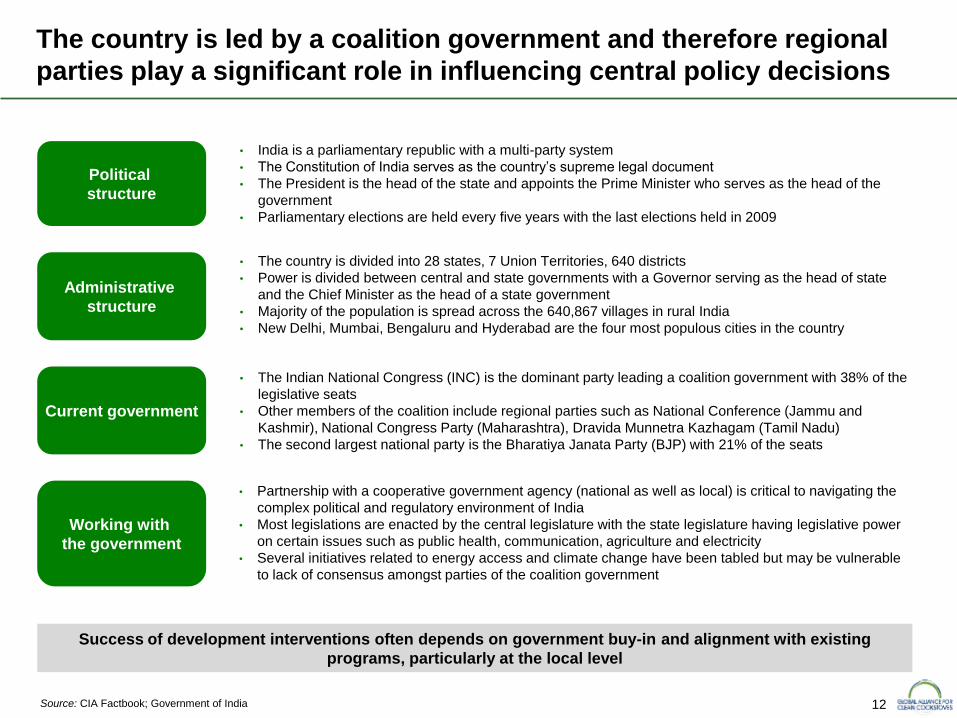
• India is a parliamentary republic with a multi-party system
• The Constitution of India serves as the country’s supreme legal document
• The President is the head of the state and appoints the Prime Minister who serves as the head of the
government
• Parliamentary elections are held every five years with the last elections held in 2009
• The country is divided into 28 states, 7 Union Territories, 640 districts
• Power is divided between central and state governments with a Governor serving as the head of state
and the Chief Minister as the head of a state government
• Majority of the population is spread across the 640,867 villages in rural India
• New Delhi, Mumbai, Bengaluru and Hyderabad are the four most populous cities in the country
• The Indian National Congress (INC) is the dominant party leading a coalition government with 38% of the
legislative seats
• Other members of the coalition include regional parties such as National Conference (Jammu and
Kashmir), National Congress Party (Maharashtra), Dravida Munnetra Kazhagam (Tamil Nadu)
• The second largest national party is the Bharatiya Janata Party (BJP) with 21% of the seats
• Partnership with a cooperative government agency (national as well as local) is critical to navigating the
complex political and regulatory environment of India
• Most legislations are enacted by the central legislature with the state legislature having legislative power
on certain issues such as public health, communication, agriculture and electricity
• Several initiatives related to energy access and climate change have been tabled but may be vulnerable
to lack of consensus amongst parties of the coalition government
Source: CIA Factbook; Government of India
The country is led by a coalition government and therefore regional
parties play a significant role in influencing central policy decisions
Success of development interventions often depends on government buy-in and alignment with existing
programs, particularly at the local level
Working with
the government
Current government
Administrative
structure
Political
structure
13
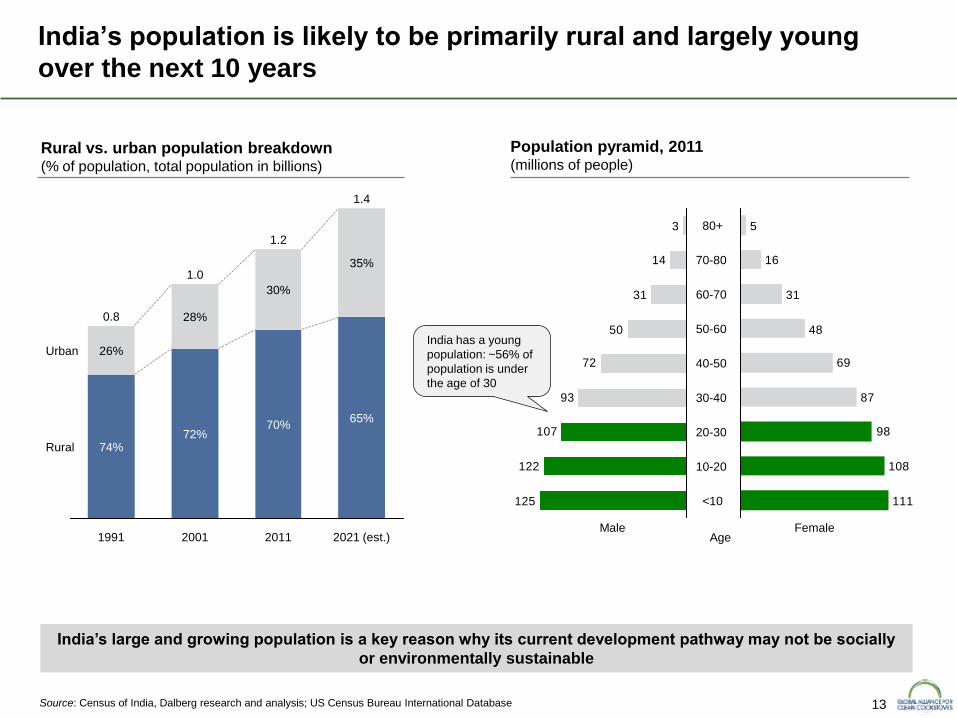
70%
30%
2001
1.0
72%
28%
1991
0.8
74%
26%
Rural
Urban
2021 (est.)
1.4
65%
35%
2011
1.2
Rural vs. urban population breakdown (% of population, total population in billions)
125
122
107
93
72
50
31
14
3 80+
70-80
60-70
50-60
40-50
30-40
20-30
<10
10-20
Male
111
108
98
87
69
48
31
16
5
Female Age
Source: Census of India, Dalberg research and analysis; US Census Bureau International Database
India’s population is likely to be primarily rural and largely young
over the next 10 years
Population pyramid, 2011 (millions of people)
India’s large and growing population is a key reason why its current development pathway may not be socially
or environmentally sustainable
India has a young
population: ~56% of
population is under
the age of 30
14
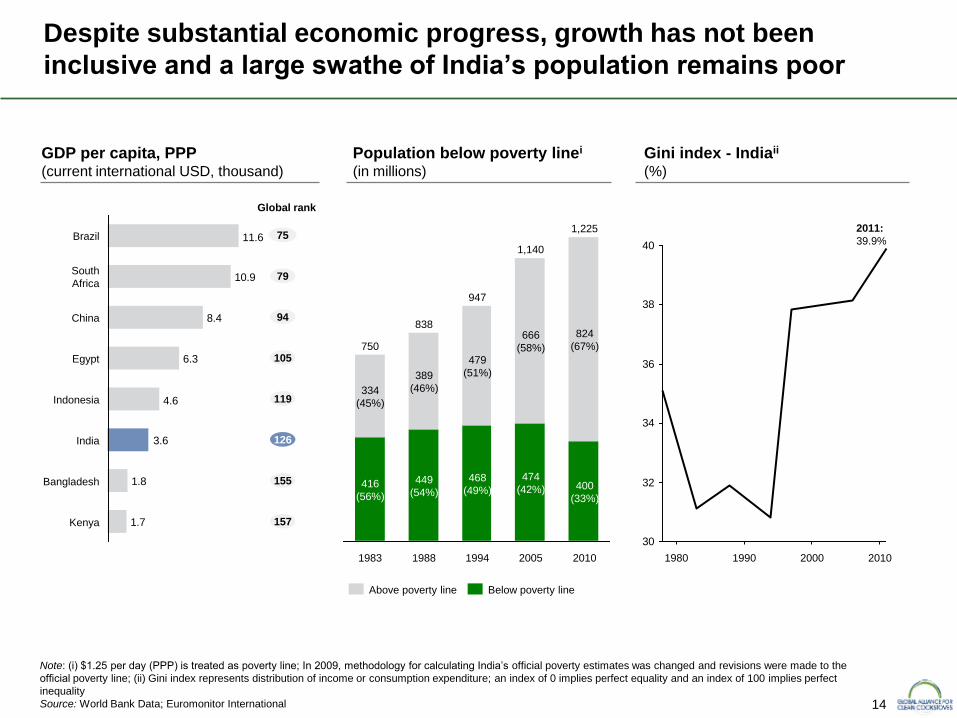
Despite substantial economic progress, growth has not been
inclusive and a large swathe of India’s population remains poor
1.7
1.8
3.6
4.6
6.3
8.4
10.9
11.6
China
South
Africa
Brazil
Kenya
Bangladesh
India
Indonesia
Egypt
GDP per capita, PPP (current international USD, thousand)
Note: (i) $1.25 per day (PPP) is treated as poverty line; In 2009, methodology for calculating India’s official poverty estimates was changed and revisions were made to the
official poverty line; (ii) Gini index represents distribution of income or consumption expenditure; an index of 0 implies perfect equality and an index of 100 implies perfect
inequality
Source: World Bank Data; Euromonitor International
30
32
34
36
38
40
2010 2000 1990 1980
Gini index - Indiaii (%)
1,140
824
(67%)
2005
468
(49%) 400
(33%)
2010
1,225
416
(56%)
479
(51%)
474
(42%)
666
(58%)
947
1994
838
449
(54%)
389
(46%)
1983
750
334
(45%)
1988
Population below poverty linei (in millions)
75
157
155
126
119
79
94
105
Below poverty line Above poverty line
Global rank
2011:
39.9%
15
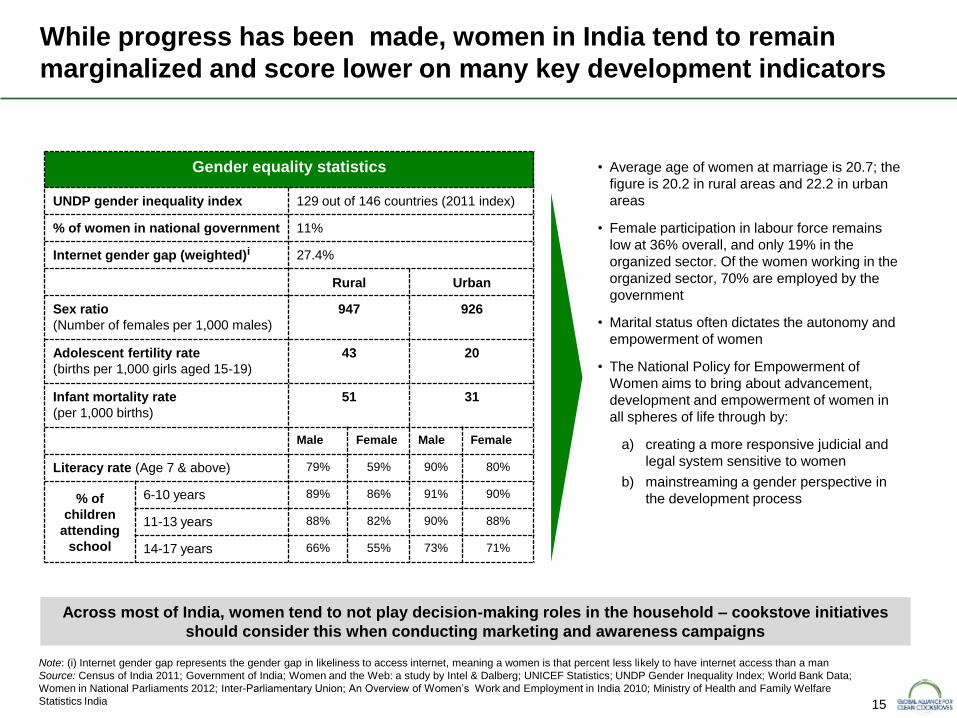
While progress has been made, women in India tend to remain
marginalized and score lower on many key development indicators
Gender equality statistics
UNDP gender inequality index 129 out of 146 countries (2011 index)
% of women in national government 11%
Internet gender gap (weighted)i 27.4%
Rural Urban
Sex ratio
(Number of females per 1,000 males)
947 926
Adolescent fertility rate
(births per 1,000 girls aged 15-19)
43 20
Infant mortality rate
(per 1,000 births)
51 31
Male Female Male Female
Literacy rate (Age 7 & above) 79% 59% 90% 80%
% of
children
attending
school
6-10 years 89% 86% 91% 90%
11-13 years 88% 82% 90% 88%
14-17 years 66% 55% 73% 71%
Across most of India, women tend to not play decision-making roles in the household – cookstove initiatives
should consider this when conducting marketing and awareness campaigns
Note: (i) Internet gender gap represents the gender gap in likeliness to access internet, meaning a women is that percent less likely to have internet access than a man
Source: Census of India 2011; Government of India; Women and the Web: a study by Intel & Dalberg; UNICEF Statistics; UNDP Gender Inequality Index; World Bank Data;
Women in National Parliaments 2012; Inter-Parliamentary Union; An Overview of Women’s Work and Employment in India 2010; Ministry of Health and Family Welfare
Statistics India
• Average age of women at marriage is 20.7; the
figure is 20.2 in rural areas and 22.2 in urban
areas
• Female participation in labour force remains
low at 36% overall, and only 19% in the
organized sector. Of the women working in the
organized sector, 70% are employed by the
government
• Marital status often dictates the autonomy and
empowerment of women
• The National Policy for Empowerment of
Women aims to bring about advancement,
development and empowerment of women in
all spheres of life through by:
a) creating a more responsive judicial and
legal system sensitive to women
b) mainstreaming a gender perspective in
the development process
16 Source: World Bank data; 12th Five year plan - Planning Commission of India
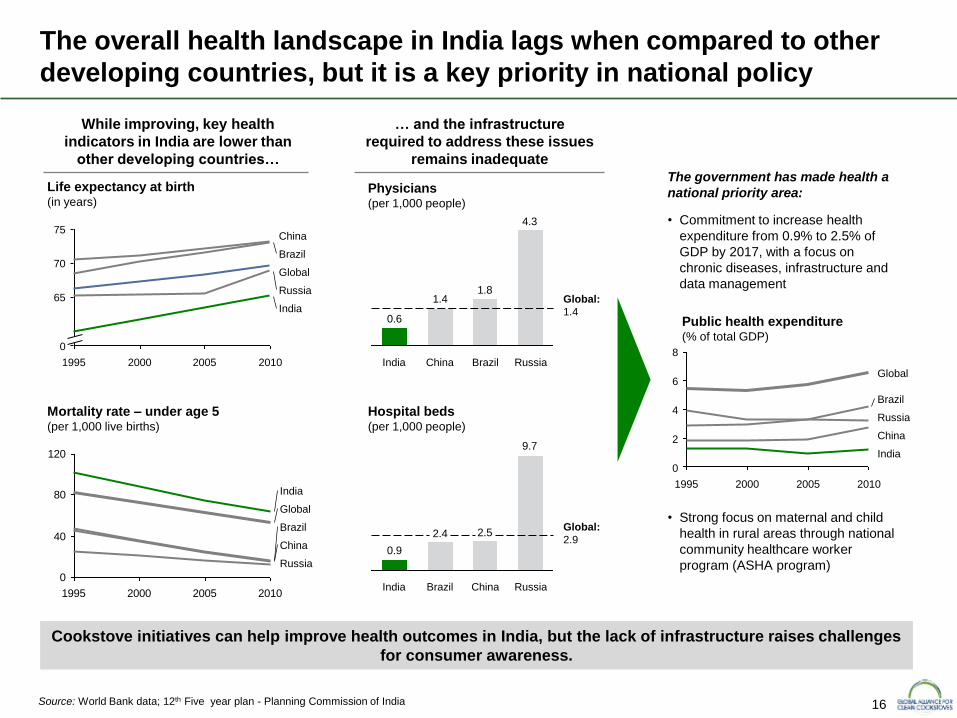
The overall health landscape in India lags when compared to other
developing countries, but it is a key priority in national policy
Cookstove initiatives can help improve health outcomes in India, but the lack of infrastructure raises challenges
for consumer awareness.
While improving, key health
indicators in India are lower than
other developing countries…
… and the infrastructure
required to address these issues
remains inadequate
The government has made health a
national priority area:
• Commitment to increase health
expenditure from 0.9% to 2.5% of
GDP by 2017, with a focus on
chronic diseases, infrastructure and
data management
75
70
65
0
2010 2005 2000 1995
Global
Russia
China
India
Brazil
Life expectancy at birth (in years)
0
40
80
120
1995 2000 2005 2010
Global
Russia
China
India
Brazil
Mortality rate – under age 5 (per 1,000 live births)
Physicians (per 1,000 people)
Hospital beds (per 1,000 people)
4.3
1.81.4
0.6
Russia Brazil China India
9.7
2.52.4
0.9
India Russia China Brazil
8
6
4
2
0
2010 2005 2000 1995
Global
Russia
China
India
Brazil
Public health expenditure (% of total GDP)
Global:
1.4
Global:
2.9
• Strong focus on maternal and child
health in rural areas through national
community healthcare worker
program (ASHA program)
17
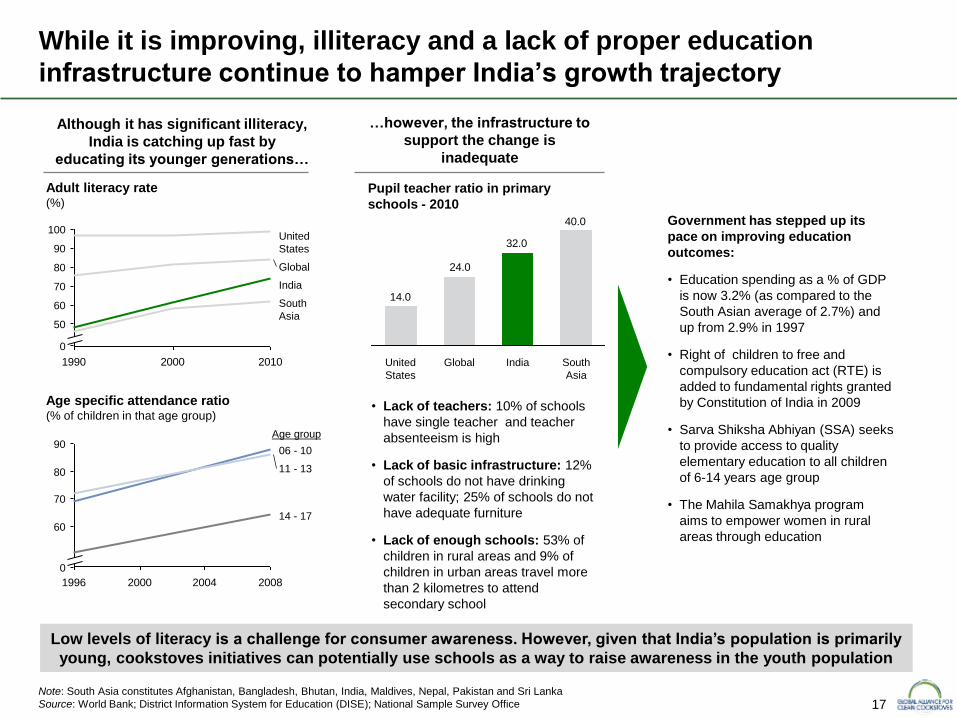
While it is improving, illiteracy and a lack of proper education
infrastructure continue to hamper India’s growth trajectory
Low levels of literacy is a challenge for consumer awareness. However, given that India’s population is primarily
young, cookstoves initiatives can potentially use schools as a way to raise awareness in the youth population
Although it has significant illiteracy,
India is catching up fast by
educating its younger generations…
…however, the infrastructure to
support the change is
inadequate
Government has stepped up its
pace on improving education
outcomes:
• Education spending as a % of GDP
is now 3.2% (as compared to the
South Asian average of 2.7%) and
up from 2.9% in 1997
• Right of children to free and
compulsory education act (RTE) is
added to fundamental rights granted
by Constitution of India in 2009
• Sarva Shiksha Abhiyan (SSA) seeks
to provide access to quality
elementary education to all children
of 6-14 years age group
• The Mahila Samakhya program
aims to empower women in rural
areas through education
1990 2000 2010
100
90
80
70
60
50
0
United
States
Global
South
Asia
India
Adult literacy rate (%)
1996 2000 2004 2008
90
80
70
60
0
14 - 17
11 - 13
06 - 10
Age specific attendance ratio (% of children in that age group)
Pupil teacher ratio in primary
schools - 2010
40.0
32.0
24.0
14.0
India Global South
Asia
United
States
• Lack of teachers: 10% of schools
have single teacher and teacher
absenteeism is high
• Lack of basic infrastructure: 12%
of schools do not have drinking
water facility; 25% of schools do not
have adequate furniture
• Lack of enough schools: 53% of
children in rural areas and 9% of
children in urban areas travel more
than 2 kilometres to attend
secondary school
Note: South Asia constitutes Afghanistan, Bangladesh, Bhutan, India, Maldives, Nepal, Pakistan and Sri Lanka
Source: World Bank; District Information System for Education (DISE); National Sample Survey Office
Age group
18
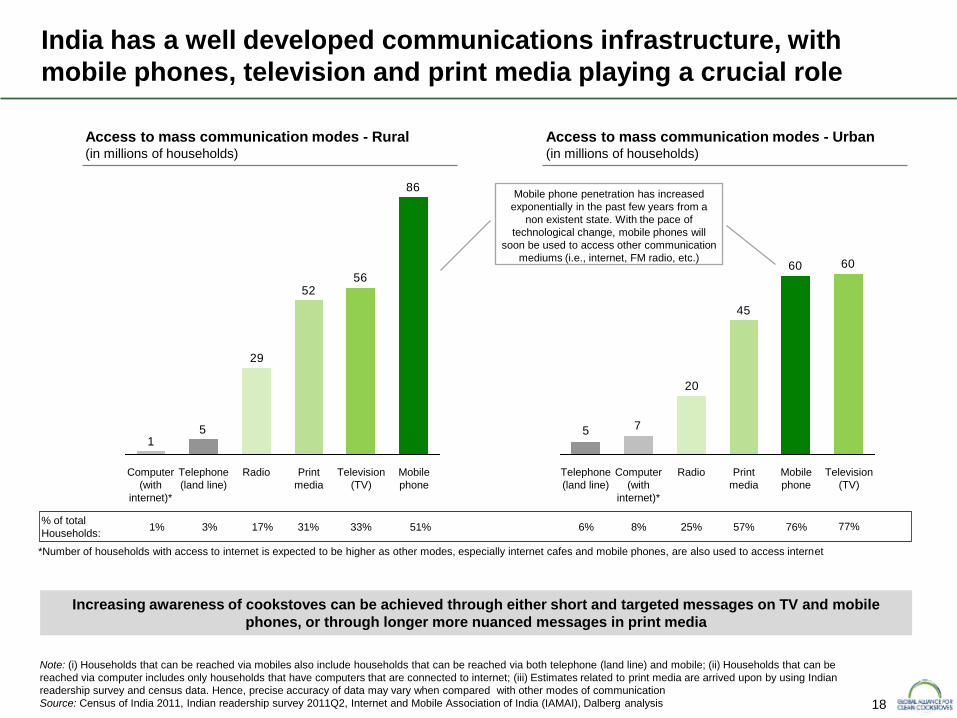
India has a well developed communications infrastructure, with
mobile phones, television and print media playing a crucial role
Note: (i) Households that can be reached via mobiles also include households that can be reached via both telephone (land line) and mobile; (ii) Households that can be
reached via computer includes only households that have computers that are connected to internet; (iii) Estimates related to print media are arrived upon by using Indian
readership survey and census data. Hence, precise accuracy of data may vary when compared with other modes of communication
Source: Census of India 2011, Indian readership survey 2011Q2, Internet and Mobile Association of India (IAMAI), Dalberg analysis
Increasing awareness of cookstoves can be achieved through either short and targeted messages on TV and mobile
phones, or through longer more nuanced messages in print media
Access to mass communication modes - Rural (in millions of households)
86
5652
29
51
Computer
(with
internet)*
Telephone
(land line)
Radio Print
media
Television
(TV)
Mobile
phone
1%
% of total
Households: 3% 17% 31%
Access to mass communication modes - Urban (in millions of households)
6060
45
20
75
Mobile
phone
Television
(TV)
Radio Print
media
Computer
(with
internet)*
Telephone
(land line)
33% 51% 6%
8% 25% 57% 76% 77%
Mobile phone penetration has increased
exponentially in the past few years from a
non existent state. With the pace of
technological change, mobile phones will
soon be used to access other communication
mediums (i.e., internet, FM radio, etc.)
*Number of households with access to internet is expected to be higher as other modes, especially internet cafes and mobile phones, are also used to access internet
19
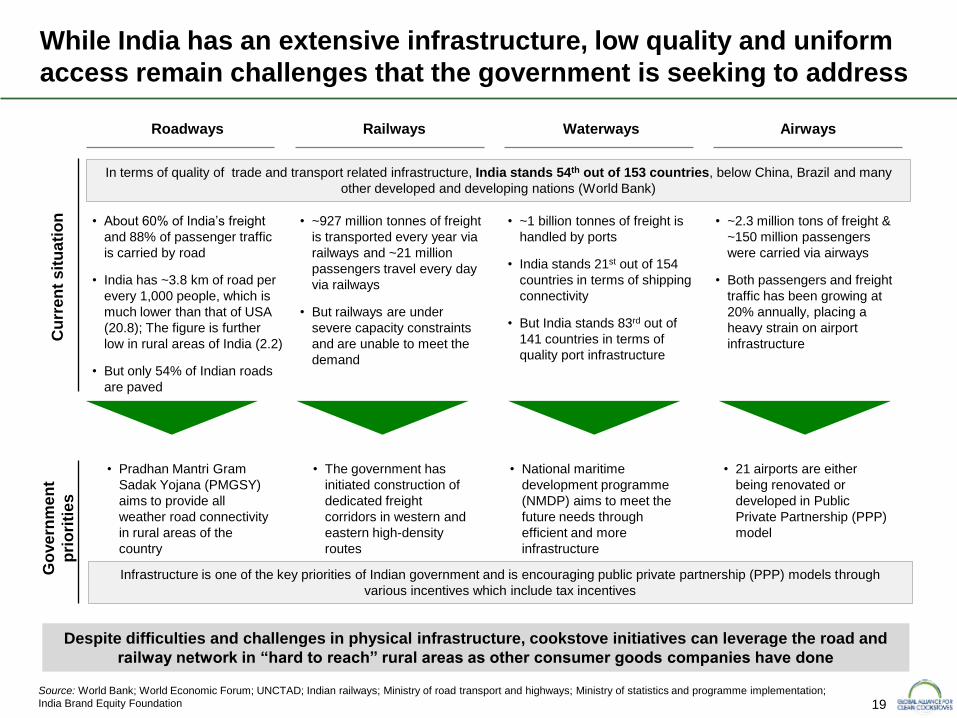
While India has an extensive infrastructure, low quality and uniform
access remain challenges that the government is seeking to address
Despite difficulties and challenges in physical infrastructure, cookstove initiatives can leverage the road and
railway network in “hard to reach” rural areas as other consumer goods companies have done
Roadways
• About 60% of India’s freight
and 88% of passenger traffic
is carried by road
• India has ~3.8 km of road per
every 1,000 people, which is
much lower than that of USA
(20.8); The figure is further
low in rural areas of India (2.2)
• But only 54% of Indian roads
are paved
Source: World Bank; World Economic Forum; UNCTAD; Indian railways; Ministry of road transport and highways; Ministry of statistics and programme implementation;
India Brand Equity Foundation
Railways Waterways Airways
• ~927 million tonnes of freight
is transported every year via
railways and ~21 million
passengers travel every day
via railways
• But railways are under
severe capacity constraints
and are unable to meet the
demand
• ~1 billion tonnes of freight is
handled by ports
• India stands 21st out of 154
countries in terms of shipping
connectivity
• But India stands 83rd out of
141 countries in terms of
quality port infrastructure
• ~2.3 million tons of freight &
~150 million passengers
were carried via airways
• Both passengers and freight
traffic has been growing at
20% annually, placing a
heavy strain on airport
infrastructure
In terms of quality of trade and transport related infrastructure, India stands 54th out of 153 countries, below China, Brazil and many
other developed and developing nations (World Bank)
Cu
rre
nt
sit
uati
on
G
ove
rnm
en
t
pri
ori
ties
• Pradhan Mantri Gram
Sadak Yojana (PMGSY)
aims to provide all
weather road connectivity
in rural areas of the
country
• The government has
initiated construction of
dedicated freight
corridors in western and
eastern high-density
routes
• National maritime
development programme
(NMDP) aims to meet the
future needs through
efficient and more
infrastructure
• 21 airports are either
being renovated or
developed in Public
Private Partnership (PPP)
model
Infrastructure is one of the key priorities of Indian government and is encouraging public private partnership (PPP) models through
various incentives which include tax incentives
20
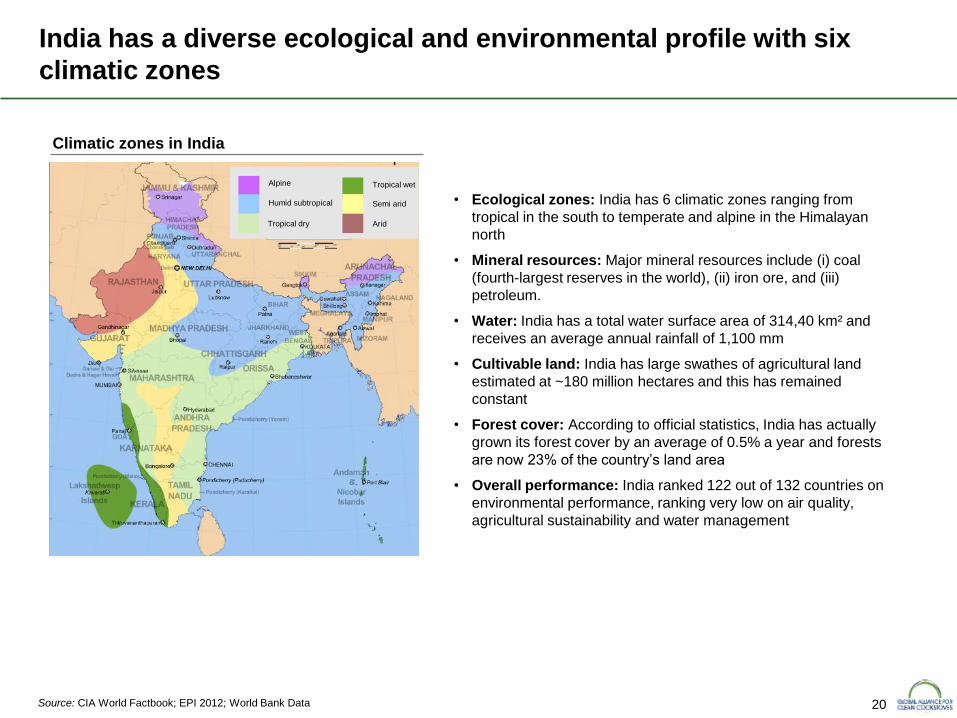
India has a diverse ecological and environmental profile with six
climatic zones
Source: CIA World Factbook; EPI 2012; World Bank Data
• Ecological zones: India has 6 climatic zones ranging from
tropical in the south to temperate and alpine in the Himalayan
north
• Mineral resources: Major mineral resources include (i) coal
(fourth-largest reserves in the world), (ii) iron ore, and (iii)
petroleum.
• Water: India has a total water surface area of 314,40 km² and
receives an average annual rainfall of 1,100 mm
• Cultivable land: India has large swathes of agricultural land
estimated at ~180 million hectares and this has remained
constant
• Forest cover: According to official statistics, India has actually
grown its forest cover by an average of 0.5% a year and forests
are now 23% of the country’s land area
• Overall performance: India ranked 122 out of 132 countries on
environmental performance, ranking very low on air quality,
agricultural sustainability and water management
Climatic zones in India
Alpine
Humid subtropical
Tropical dry
Tropical wet
Semi arid
Arid
21
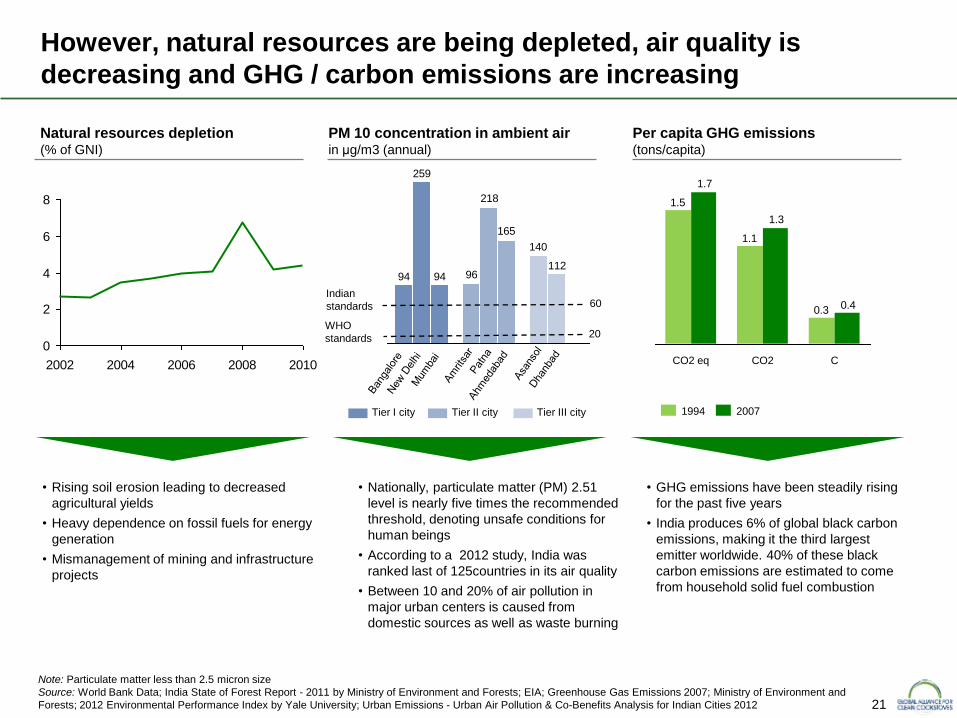
However, natural resources are being depleted, air quality is
decreasing and GHG / carbon emissions are increasing
Note: Particulate matter less than 2.5 micron size
Source: World Bank Data; India State of Forest Report - 2011 by Ministry of Environment and Forests; EIA; Greenhouse Gas Emissions 2007; Ministry of Environment and
Forests; 2012 Environmental Performance Index by Yale University; Urban Emissions - Urban Air Pollution & Co-Benefits Analysis for Indian Cities 2012
• Nationally, particulate matter (PM) 2.51
level is nearly five times the recommended
threshold, denoting unsafe conditions for
human beings
• According to a 2012 study, India was
ranked last of 125countries in its air quality
• Between 10 and 20% of air pollution in
major urban centers is caused from
domestic sources as well as waste burning
• Rising soil erosion leading to decreased
agricultural yields
• Heavy dependence on fossil fuels for energy
generation
• Mismanagement of mining and infrastructure
projects
• GHG emissions have been steadily rising
for the past five years
• India produces 6% of global black carbon
emissions, making it the third largest
emitter worldwide. 40% of these black
carbon emissions are estimated to come
from household solid fuel combustion
0
2
4
6
8
2002 2004 2006 2008 2010
Natural resources depletion (% of GNI)
Per capita GHG emissions (tons/capita)
140
9694112
218
259
165
94
Indian
standards
WHO
standards
PM 10 concentration in ambient air in μg/m3 (annual)
60
20
Tier I city Tier II city Tier III city
0.3
1.1
1.5
0.4
1.3
1.7
C CO2 eq CO2
1994 2007
22
more than 4%
2 – 4%
0 – 2%
more than 4%
2 – 4%
0 –2%
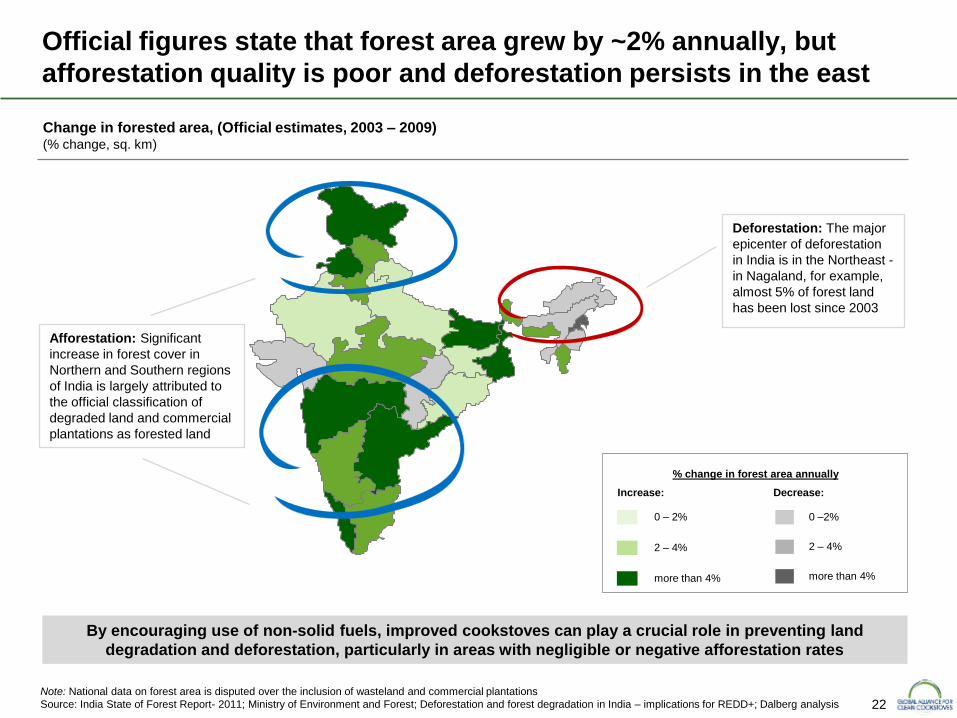
Official figures state that forest area grew by ~2% annually, but
afforestation quality is poor and deforestation persists in the east
Note: National data on forest area is disputed over the inclusion of wasteland and commercial plantations
Source: India State of Forest Report- 2011; Ministry of Environment and Forest; Deforestation and forest degradation in India – implications for REDD+; Dalberg analysis
By encouraging use of non-solid fuels, improved cookstoves can play a crucial role in preventing land
degradation and deforestation, particularly in areas with negligible or negative afforestation rates
Increase: Decrease:
Change in forested area, (Official estimates, 2003 – 2009) (% change, sq. km)
Deforestation: The major
epicenter of deforestation
in India is in the Northeast -
in Nagaland, for example,
almost 5% of forest land
has been lost since 2003
Afforestation: Significant
increase in forest cover in
Northern and Southern regions
of India is largely attributed to
the official classification of
degraded land and commercial
plantations as forested land
% change in forest area annually
23
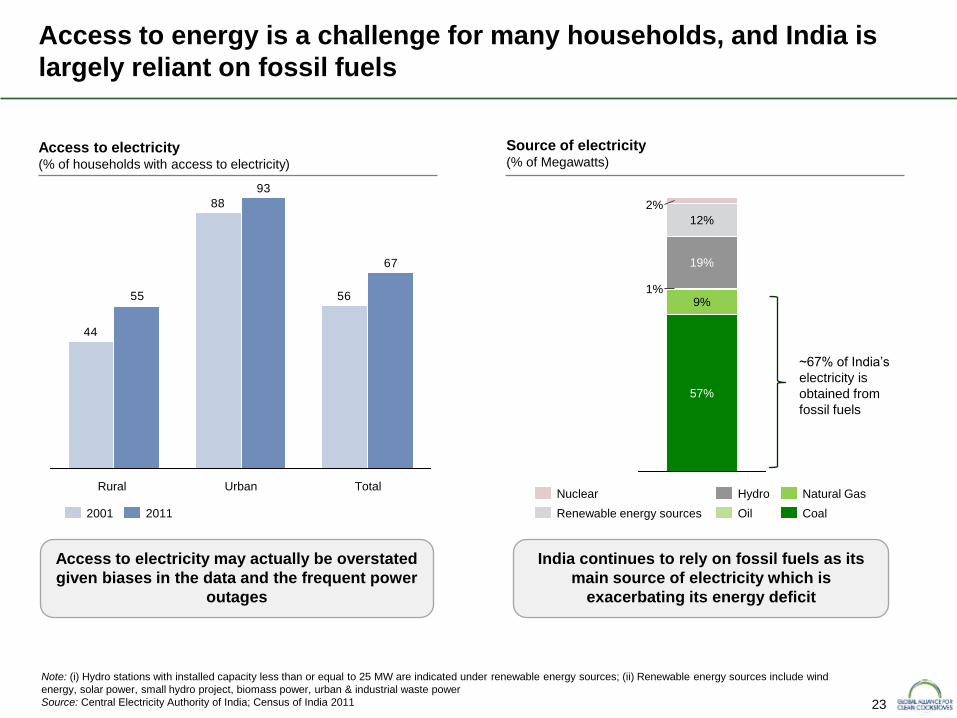
Access to electricity (% of households with access to electricity)
Access to energy is a challenge for many households, and India is
largely reliant on fossil fuels
Note: (i) Hydro stations with installed capacity less than or equal to 25 MW are indicated under renewable energy sources; (ii) Renewable energy sources include wind
energy, solar power, small hydro project, biomass power, urban & industrial waste power
Source: Central Electricity Authority of India; Census of India 2011
57%
9% 1%
19%
12%
2%
Source of electricity (% of Megawatts)
Coal
Natural Gas
Oil
Hydro
Renewable energy sources
Nuclear
56
88
44
67
93
55
Total Urban Rural
2011 2001
Access to electricity may actually be overstated
given biases in the data and the frequent power
outages
India continues to rely on fossil fuels as its
main source of electricity which is
exacerbating its energy deficit
~67% of India’s
electricity is
obtained from
fossil fuels
24
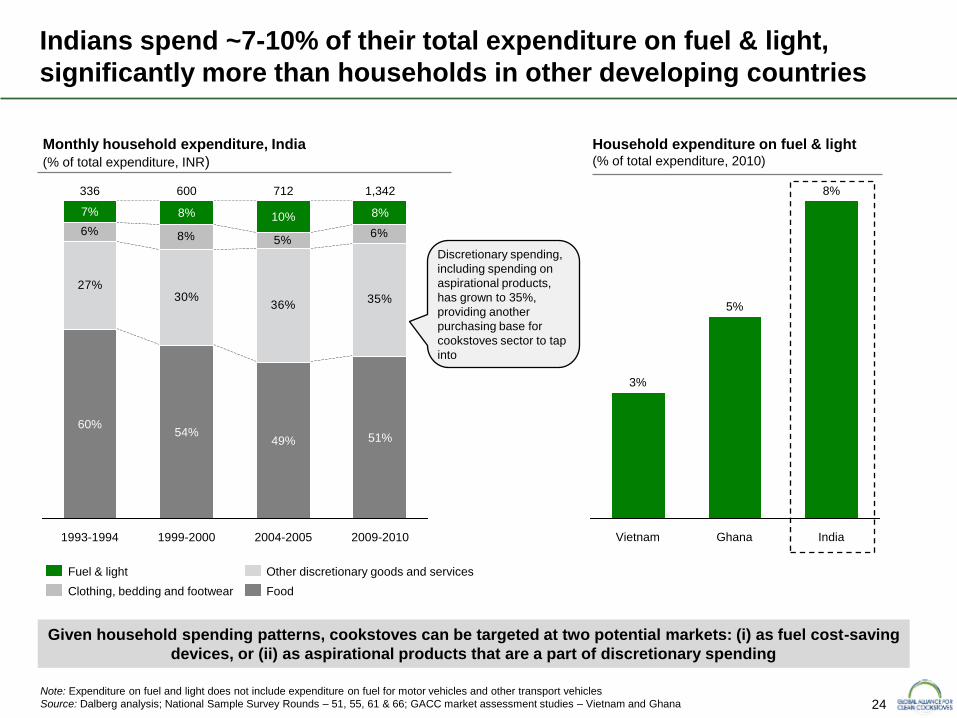
Indians spend ~7-10% of their total expenditure on fuel & light,
significantly more than households in other developing countries
Note: Expenditure on fuel and light does not include expenditure on fuel for motor vehicles and other transport vehicles
Source: Dalberg analysis; National Sample Survey Rounds – 51, 55, 61 & 66; GACC market assessment studies – Vietnam and Ghana
Given household spending patterns, cookstoves can be targeted at two potential markets: (i) as fuel cost-saving
devices, or (ii) as aspirational products that are a part of discretionary spending
27%30%
36%35%
6% 8% 5%6%
1,342 712 600 336
2009-2010
51%
8%
2004-2005
49%
10%
1999-2000
54%
8%
1993-1994
60%
7%
Monthly household expenditure, India
(% of total expenditure, INR)
Food
Other discretionary goods and services
Clothing, bedding and footwear
Fuel & light
Household expenditure on fuel & light (% of total expenditure, 2010)
Ghana
8%
Vietnam India
3%
5%
Discretionary spending,
including spending on
aspirational products,
has grown to 35%,
providing another
purchasing base for
cookstoves sector to tap
into
25
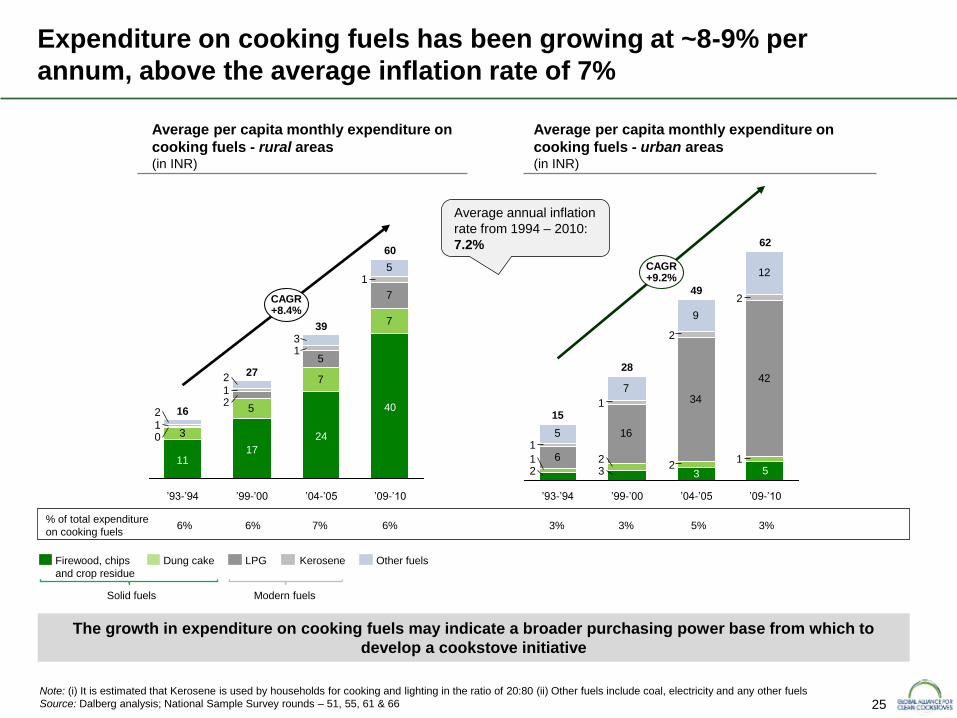
Expenditure on cooking fuels has been growing at ~8-9% per
annum, above the average inflation rate of 7%
Note: (i) It is estimated that Kerosene is used by households for cooking and lighting in the ratio of 20:80 (ii) Other fuels include coal, electricity and any other fuels
Source: Dalberg analysis; National Sample Survey rounds – 51, 55, 61 & 66
The growth in expenditure on cooking fuels may indicate a broader purchasing power base from which to
develop a cookstove initiative
Average per capita monthly expenditure on
cooking fuels - rural areas (in INR)
3
5
7
7
5
7
5
2
0
1
1
1
1
3
2
2
CAGR +8.4%
’09-’10
60
40
’04-’05
39
24
’99-’00
27
17
’93-’94
16
11 6
16
34
42
5
7
9
12
321
221
2
2
1
1
CAGR +9.2%
’09-’10
62
5
’04-’05 ’99-’00
28
49
3
’93-’94
15
Average per capita monthly expenditure on
cooking fuels - urban areas (in INR)
6%
% of total expenditure
on cooking fuels 6% 7% 6% 3%
3% 5% 3%
Other fuels Kerosene LPG Dung cake Firewood, chips
and crop residue
Solid fuels Modern fuels
Average annual inflation
rate from 1994 – 2010:
7.2%
26
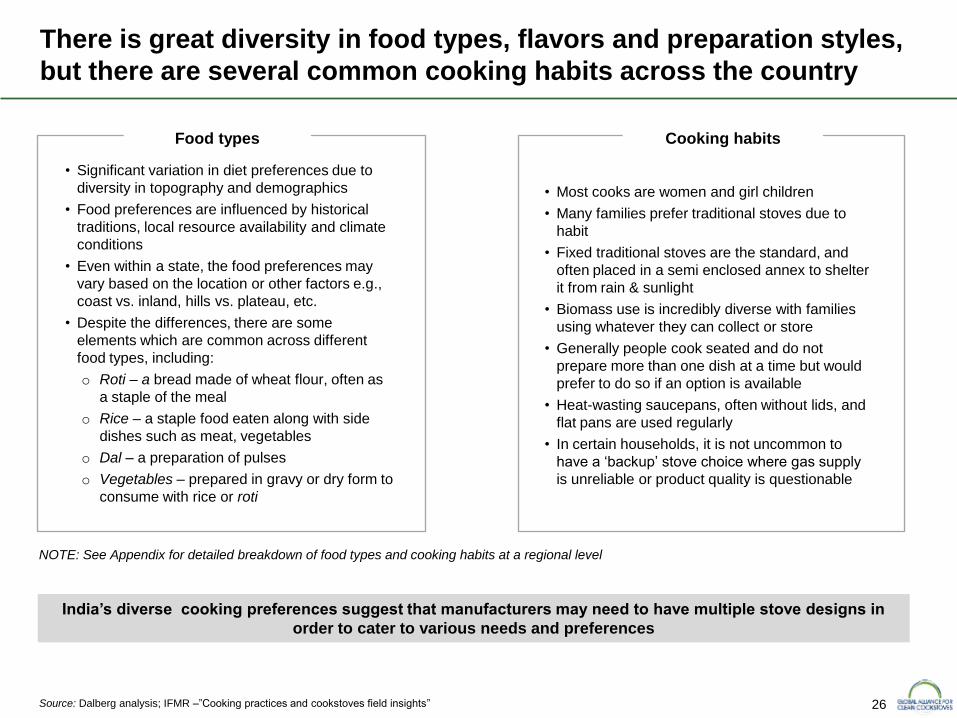
India’s diverse cooking preferences suggest that manufacturers may need to have multiple stove designs in
order to cater to various needs and preferences
• Significant variation in diet preferences due to
diversity in topography and demographics
• Food preferences are influenced by historical
traditions, local resource availability and climate
conditions
• Even within a state, the food preferences may
vary based on the location or other factors e.g.,
coast vs. inland, hills vs. plateau, etc.
• Despite the differences, there are some
elements which are common across different
food types, including:
o Roti – a bread made of wheat flour, often as
a staple of the meal
o Rice – a staple food eaten along with side
dishes such as meat, vegetables
o Dal – a preparation of pulses
o Vegetables – prepared in gravy or dry form to
consume with rice or roti
Food types
There is great diversity in food types, flavors and preparation styles,
but there are several common cooking habits across the country
Cooking habits
Source: Dalberg analysis; IFMR –”Cooking practices and cookstoves field insights”
NOTE: See Appendix for detailed breakdown of food types and cooking habits at a regional level
• Most cooks are women and girl children
• Many families prefer traditional stoves due to
habit
• Fixed traditional stoves are the standard, and
often placed in a semi enclosed annex to shelter
it from rain & sunlight
• Biomass use is incredibly diverse with families
using whatever they can collect or store
• Generally people cook seated and do not
prepare more than one dish at a time but would
prefer to do so if an option is available
• Heat-wasting saucepans, often without lids, and
flat pans are used regularly
• In certain households, it is not uncommon to
have a ‘backup’ stove choice where gas supply
is unreliable or product quality is questionable
27
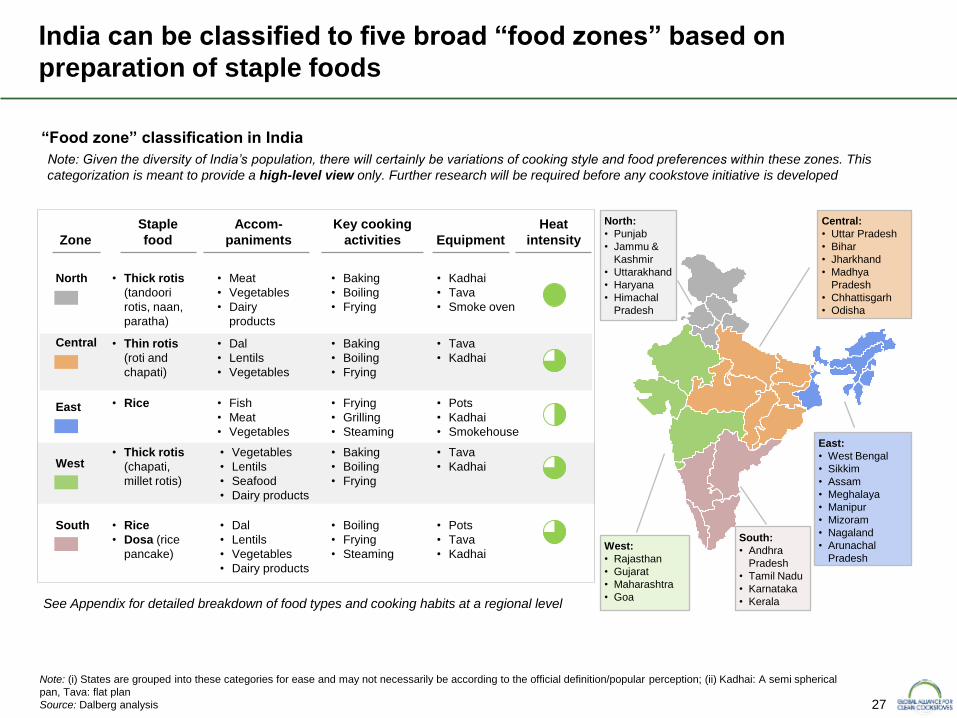
India can be classified to five broad “food zones” based on
preparation of staple foods
Note: (i) States are grouped into these categories for ease and may not necessarily be according to the official definition/popular perception; (ii) Kadhai: A semi spherical
pan, Tava: flat plan
Source: Dalberg analysis
See Appendix for detailed breakdown of food types and cooking habits at a regional level
Zone
Accom-
paniments
Staple
food Equipment
Key cooking
activities
Heat
intensity
North
Central
West
East
South
• Meat
• Vegetables
• Dairy
products
• Dal
• Lentils
• Vegetables
• Fish
• Meat
• Vegetables
• Vegetables
• Lentils
• Seafood
• Dairy products
• Dal
• Lentils
• Vegetables
• Dairy products
• Thick rotis
(tandoori
rotis, naan,
paratha)
• Thin rotis
(roti and
chapati)
• Rice
• Thick rotis
(chapati,
millet rotis)
• Rice
• Dosa (rice
pancake)
• Kadhai
• Tava
• Smoke oven
• Tava
• Kadhai
• Pots
• Kadhai
• Smokehouse
• Tava
• Kadhai
• Pots
• Tava
• Kadhai
• Baking
• Boiling
• Frying
• Baking
• Boiling
• Frying
• Frying
• Grilling
• Steaming
• Baking
• Boiling
• Frying
• Boiling
• Frying
• Steaming
“Food zone” classification in India
Note: Given the diversity of India’s population, there will certainly be variations of cooking style and food preferences within these zones. This
categorization is meant to provide a high-level view only. Further research will be required before any cookstove initiative is developed
East:
• West Bengal
• Sikkim
• Assam
• Meghalaya
• Manipur
• Mizoram
• Nagaland
• Arunachal
Pradesh
Central:
• Uttar Pradesh
• Bihar
• Jharkhand
• Madhya
Pradesh
• Chhattisgarh
• Odisha
North:
• Punjab
• Jammu &
Kashmir
• Uttarakhand
• Haryana
• Himachal
Pradesh
West:
• Rajasthan
• Gujarat
• Maharashtra
• Goa
South:
• Andhra
Pradesh
• Tamil Nadu
• Karnataka
• Kerala
28
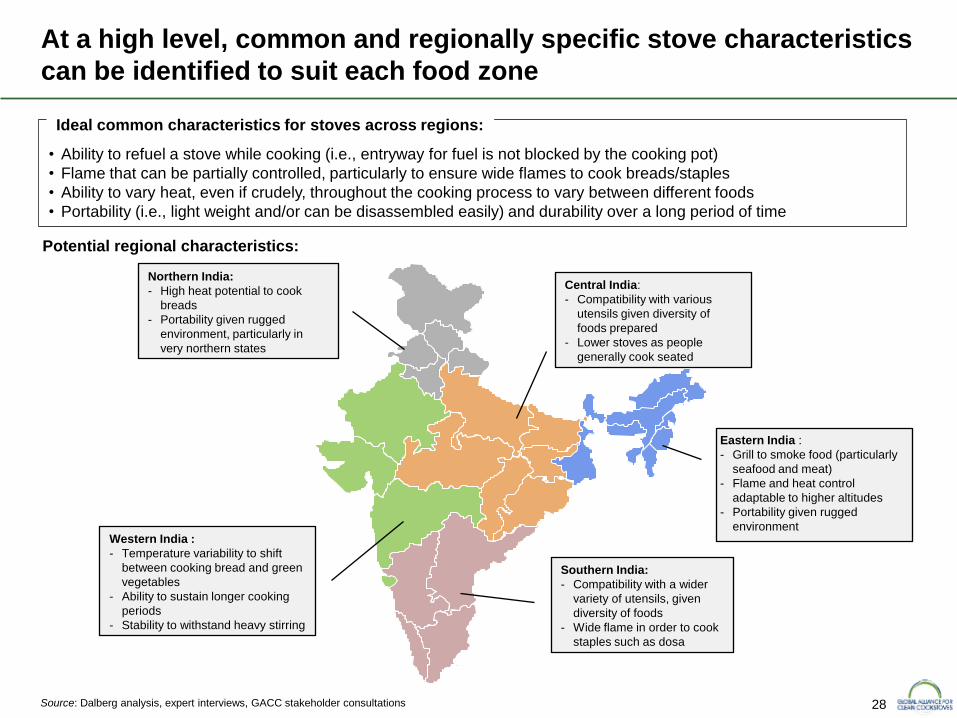
At a high level, common and regionally specific stove characteristics
can be identified to suit each food zone
Source: Dalberg analysis, expert interviews, GACC stakeholder consultations
Southern India:
- Compatibility with a wider
variety of utensils, given
diversity of foods
- Wide flame in order to cook
staples such as dosa
Western India :
- Temperature variability to shift
between cooking bread and green
vegetables
- Ability to sustain longer cooking
periods
- Stability to withstand heavy stirring
Northern India:
- High heat potential to cook
breads
- Portability given rugged
environment, particularly in
very northern states
Central India:
- Compatibility with various
utensils given diversity of
foods prepared
- Lower stoves as people
generally cook seated
Eastern India :
- Grill to smoke food (particularly
seafood and meat)
- Flame and heat control
adaptable to higher altitudes
- Portability given rugged
environment
• Ability to refuel a stove while cooking (i.e., entryway for fuel is not blocked by the cooking pot)
• Flame that can be partially controlled, particularly to ensure wide flames to cook breads/staples
• Ability to vary heat, even if crudely, throughout the cooking process to vary between different foods
• Portability (i.e., light weight and/or can be disassembled easily) and durability over a long period of time
Ideal common characteristics for stoves across regions:
Potential regional characteristics:
29
Executive summary
Health, social and environmental impact
Sector mapping
Project approach
Macro environment
Consumer assessment
Sector mapping summary
Appendix
Table of contents
Cookstove policy environment
Cookstove industry
Fuel usage and trends
30
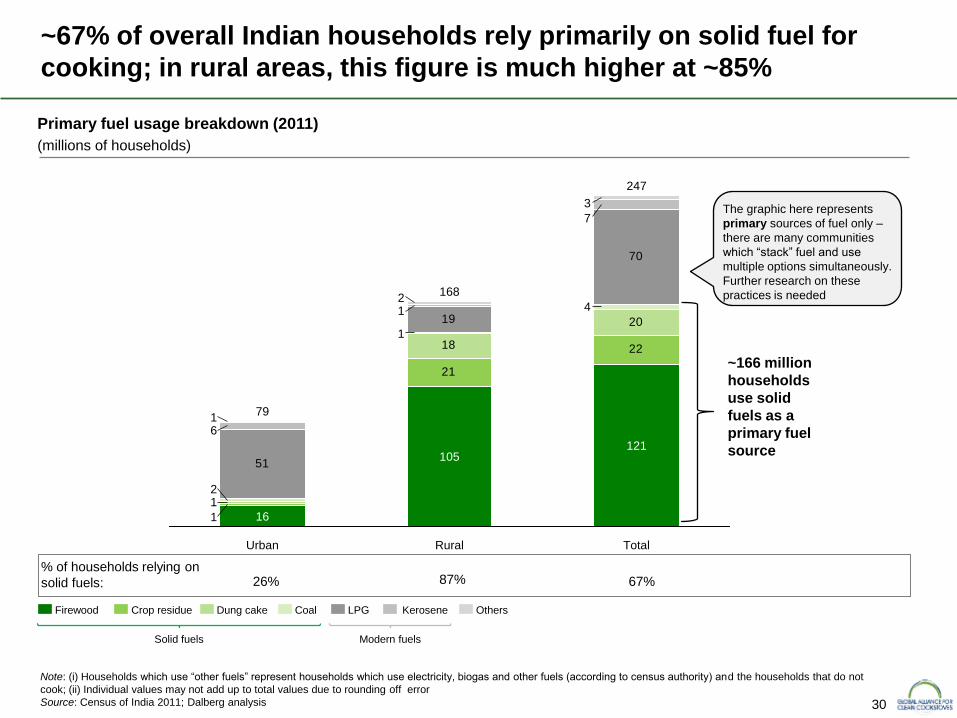
~67% of overall Indian households rely primarily on solid fuel for
cooking; in rural areas, this figure is much higher at ~85%
Note: (i) Households which use “other fuels” represent households which use electricity, biogas and other fuels (according to census authority) and the households that do not
cook; (ii) Individual values may not add up to total values due to rounding off error
Source: Census of India 2011; Dalberg analysis
Primary fuel usage breakdown (2011)
(millions of households)
% of households relying on
solid fuels:
21
2218
20
51
19
70
1
1
4
1
2
7
1
6
3
2
1
Rural
168
105
Total
247
121
Urban
79
16
26% 87% 67%
Others Kerosene LPG Dung cake Crop residue Firewood Coal
Solid fuels Modern fuels
~166 million
households
use solid
fuels as a
primary fuel
source
The graphic here represents
primary sources of fuel only –
there are many communities
which “stack” fuel and use
multiple options simultaneously.
Further research on these
practices is needed
31
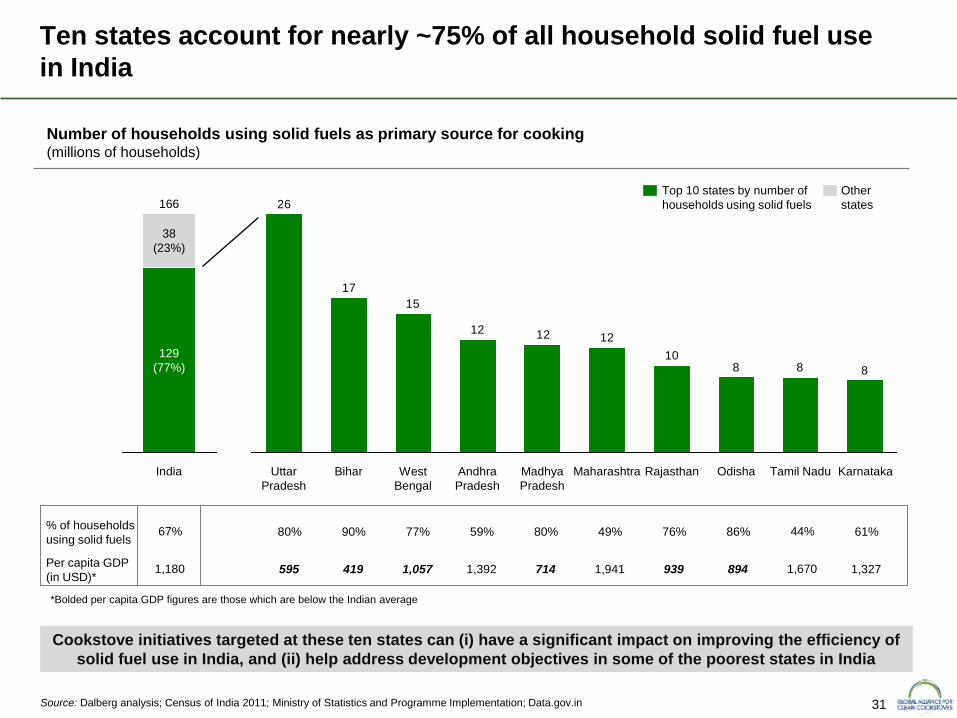
Ten states account for nearly ~75% of all household solid fuel use
in India
Source: Dalberg analysis; Census of India 2011; Ministry of Statistics and Programme Implementation; Data.gov.in
88810
121212
15
17
26
West
Bengal
Bihar Uttar
Pradesh
Karnataka Tamil Nadu Odisha Rajasthan Maharashtra Madhya
Pradesh
Andhra
Pradesh
Number of households using solid fuels as primary source for cooking (millions of households)
% of households
using solid fuels 90% 80% 77% 59% 80% 76% 49% 86% 44% 61%
Per capita GDP
(in USD)* 419 595 1,057 1,392 714 939 1,941 894 1,670 1,327
67%
1,180
Cookstove initiatives targeted at these ten states can (i) have a significant impact on improving the efficiency of
solid fuel use in India, and (ii) help address development objectives in some of the poorest states in India
Other
states
Top 10 states by number of
households using solid fuels
129
(77%)
166
India
38
(23%)
*Bolded per capita GDP figures are those which are below the Indian average
32
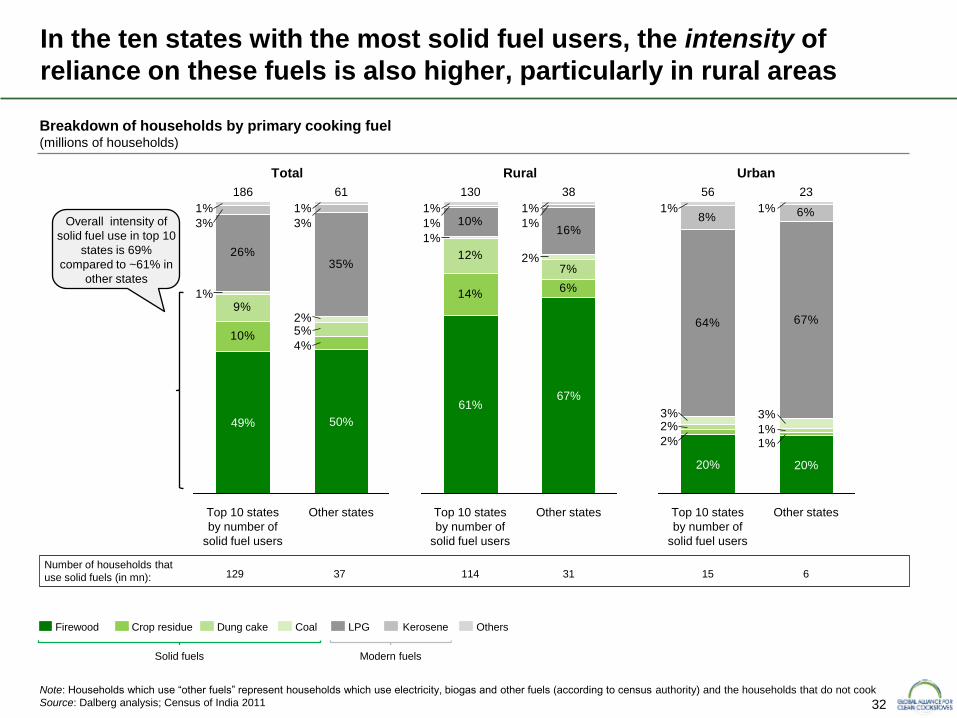
In the ten states with the most solid fuel users, the intensity of
reliance on these fuels is also higher, particularly in rural areas
Breakdown of households by primary cooking fuel (millions of households)
Note: Households which use “other fuels” represent households which use electricity, biogas and other fuels (according to census authority) and the households that do not cook
Source: Dalberg analysis; Census of India 2011
10%
9%
26%35%
4%
5%2%
1%
3%3%
1%1%
Other states
61
50%
Top 10 states
by number of
solid fuel users
186
49%
129 114 6 37 31 15
Others Kerosene LPG Dung cake Crop residue Firewood Coal
Total
6%14%
7%12% 2%
1%16%
10% 1%1%
1%1%
Other states
38
67%
Top 10 states
by number of
solid fuel users
130
61%
Rural
1%2%1%2%3%3%
67%64%
6%8%1%1%
20%
Top 10 states
by number of
solid fuel users
Other states
23 56
20%
Urban
Solid fuels Modern fuels
Number of households that
use solid fuels (in mn):
Overall intensity of
solid fuel use in top 10
states is 69%
compared to ~61% in
other states
33
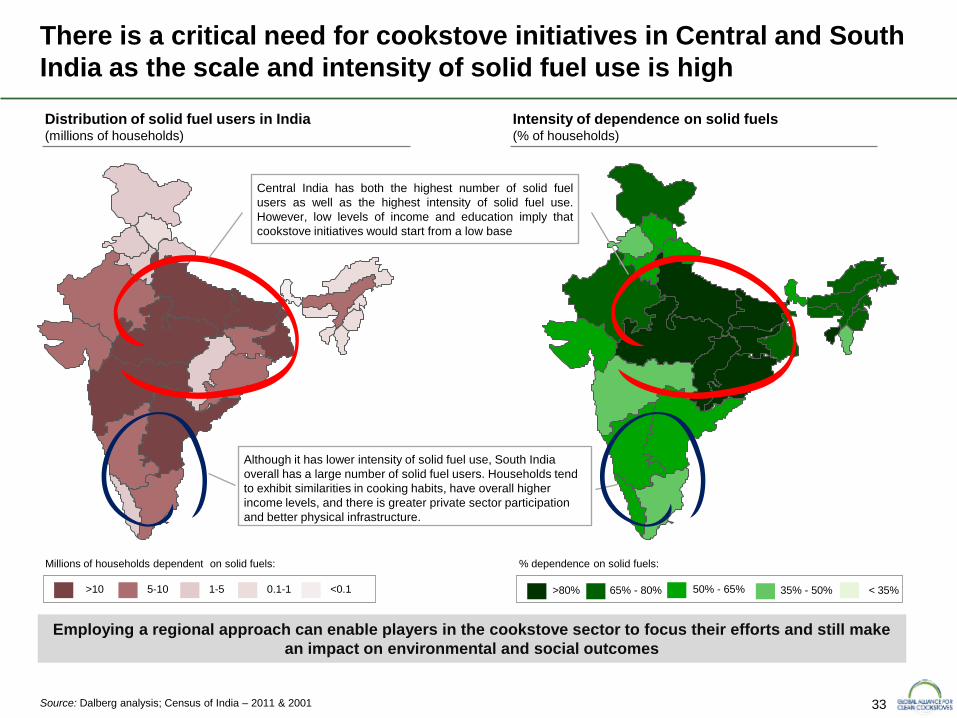
There is a critical need for cookstove initiatives in Central and South
India as the scale and intensity of solid fuel use is high
Source: Dalberg analysis; Census of India – 2011 & 2001
Employing a regional approach can enable players in the cookstove sector to focus their efforts and still make
an impact on environmental and social outcomes
Millions of households dependent on solid fuels:
>10 5-10 1-5 0.1-1 <0.1
% dependence on solid fuels:
>80% 65% - 80% 50% - 65% 35% - 50% < 35%
Distribution of solid fuel users in India (millions of households)
Intensity of dependence on solid fuels (% of households)
Central India has both the highest number of solid fuel
users as well as the highest intensity of solid fuel use.
However, low levels of income and education imply that
cookstove initiatives would start from a low base
Although it has lower intensity of solid fuel use, South India
overall has a large number of solid fuel users. Households tend
to exhibit similarities in cooking habits, have overall higher
income levels, and there is greater private sector participation
and better physical infrastructure.
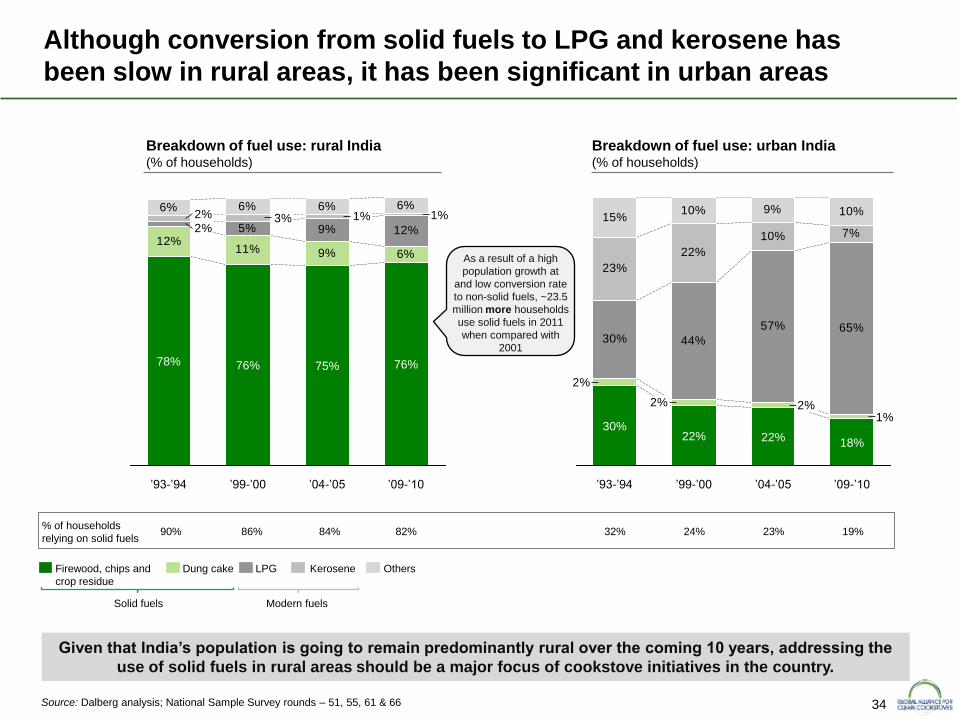
34 Source: Dalberg analysis; National Sample Survey rounds – 51, 55, 61 & 66
Given that India’s population is going to remain predominantly rural over the coming 10 years, addressing the
use of solid fuels in rural areas should be a major focus of cookstove initiatives in the country.
Although conversion from solid fuels to LPG and kerosene has
been slow in rural areas, it has been significant in urban areas
Breakdown of fuel use: rural India (% of households)
12%11% 9% 6%
9% 12%5%2%2% 1%1%3%
6%6%6%6%
’04-’05
75%
’99-’00
76%
’93-’94
78%
’09-’10
76%
30% 44%
57% 65%
23%
22%
10% 7%
15%10% 9% 10%
1%2%2%
2%
’09-’10
22%
’04-’05 ’99-’00
18%
30%
’93-’94
22%
Breakdown of fuel use: urban India (% of households)
% of households
relying on solid fuels 86% 90% 84% 82% 24% 32% 23% 19%
Others Kerosene LPG Dung cake Firewood, chips and
crop residue
As a result of a high
population growth at
and low conversion rate
to non-solid fuels, ~23.5
million more households
use solid fuels in 2011
when compared with
2001
Solid fuels Modern fuels
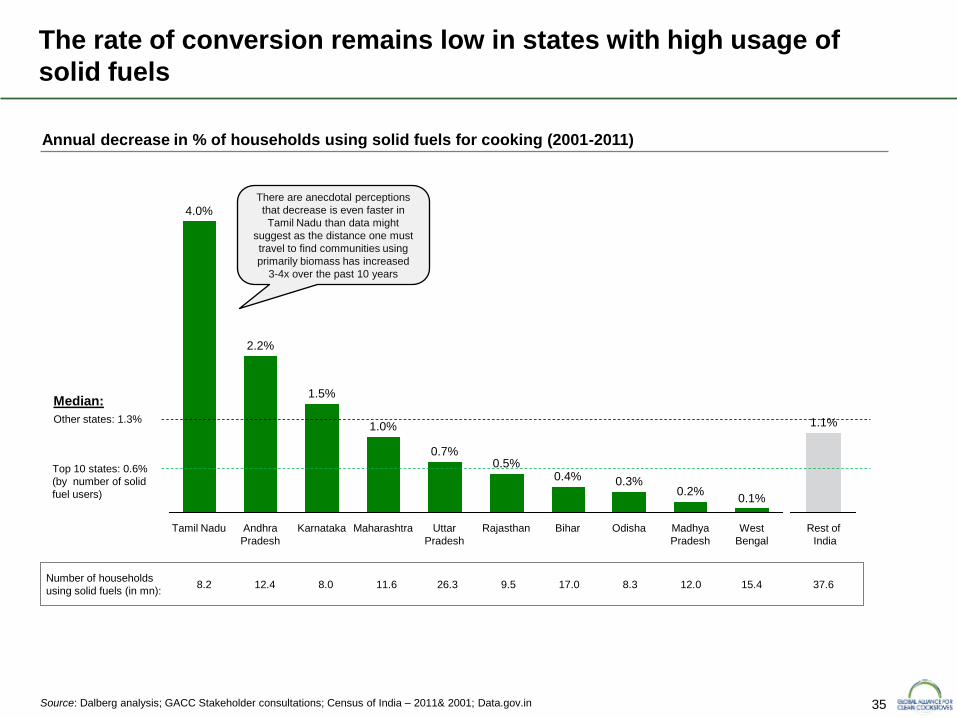
35
The rate of conversion remains low in states with high usage of
solid fuels
Source: Dalberg analysis; GACC Stakeholder consultations; Census of India – 2011& 2001; Data.gov.in
Bihar
0.1%
0.3%
West
Bengal
Odisha
0.2%
Madhya
Pradesh
0.4%
Rajasthan
0.5%
Uttar
Pradesh
0.7%
Maharashtra
1.0%
Karnataka
1.5%
Andhra
Pradesh
2.2%
Tamil Nadu
4.0%
Annual decrease in % of households using solid fuels for cooking (2001-2011)
Rest of
India
1.1%
There are anecdotal perceptions
that decrease is even faster in
Tamil Nadu than data might
suggest as the distance one must
travel to find communities using
primarily biomass has increased
3-4x over the past 10 years
Number of households
using solid fuels (in mn): 12.4 8.2 8.0 11.6 26.3 17.0 9.5 8.3 12.0 15.4
Other states: 1.3%
Top 10 states: 0.6%
Median:
(by number of solid
fuel users)
37.6
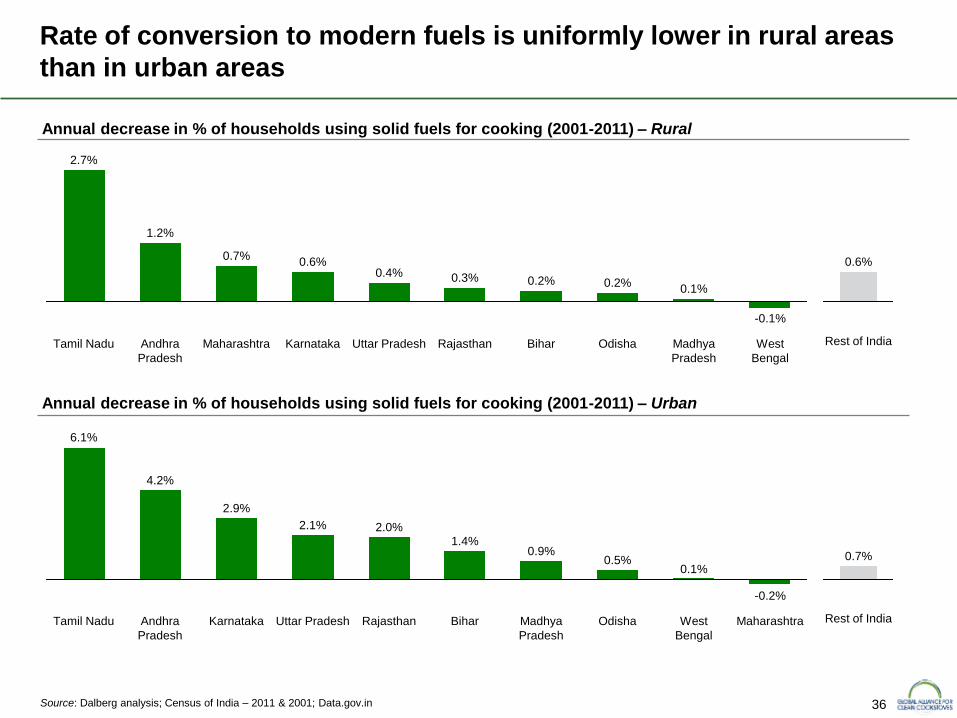
36
Rate of conversion to modern fuels is uniformly lower in rural areas
than in urban areas
Bihar
0.2%
Rajasthan
0.3%
Uttar Pradesh
0.4%
Karnataka
0.6%
Maharashtra
0.7%
Andhra
Pradesh
1.2%
Tamil Nadu
2.7%
West
Bengal
-0.1%
Madhya
Pradesh
0.1%
Odisha
0.2%
Annual decrease in % of households using solid fuels for cooking (2001-2011) – Rural
Source: Dalberg analysis; Census of India – 2011 & 2001; Data.gov.in
Rest of India
0.6%
Madhya
Pradesh
0.9%
Bihar
1.4%
Rajasthan
2.0%
Uttar Pradesh
2.1%
Karnataka
2.9%
Andhra
Pradesh
4.2%
Tamil Nadu
6.1%
Maharashtra
-0.2%
West
Bengal
0.1%
Odisha
0.5%
Annual decrease in % of households using solid fuels for cooking (2001-2011) – Urban
Rest of India
0.7%
37
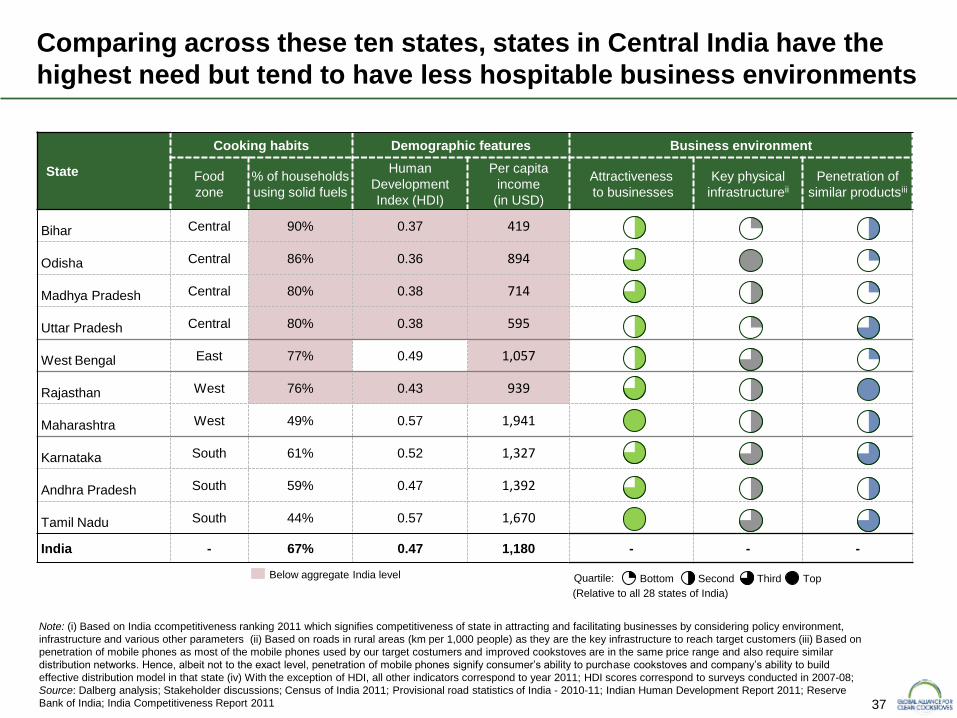
State
Cooking habits Demographic features Business environment
Food
zone
% of households
using solid fuels
Human
Development
Index (HDI)
Per capita
income
(in USD)
Attractiveness
to businesses
Key physical
infrastructureii
Penetration of
similar productsiii
Bihar Central 90% 0.37 419
Odisha Central 86% 0.36 894
Madhya Pradesh Central 80% 0.38 714
Uttar Pradesh Central 80% 0.38 595
West Bengal East 77% 0.49 1,057
Rajasthan West 76% 0.43 939
Maharashtra West 49% 0.57 1,941
Karnataka South 61% 0.52 1,327
Andhra Pradesh South 59% 0.47 1,392
Tamil Nadu South 44% 0.57 1,670
India - 67% 0.47 1,180 - - -
Note: (i) Based on India ccompetitiveness ranking 2011 which signifies competitiveness of state in attracting and facilitating businesses by considering policy environment,
infrastructure and various other parameters (ii) Based on roads in rural areas (km per 1,000 people) as they are the key infrastructure to reach target customers (iii) Based on
penetration of mobile phones as most of the mobile phones used by our target costumers and improved cookstoves are in the same price range and also require similar
distribution networks. Hence, albeit not to the exact level, penetration of mobile phones signify consumer’s ability to purchase cookstoves and company’s ability to build
effective distribution model in that state (iv) With the exception of HDI, all other indicators correspond to year 2011; HDI scores correspond to surveys conducted in 2007-08;
Source: Dalberg analysis; Stakeholder discussions; Census of India 2011; Provisional road statistics of India - 2010-11; Indian Human Development Report 2011; Reserve
Bank of India; India Competitiveness Report 2011
Below aggregate India level Quartile: Bottom Second
Comparing across these ten states, states in Central India have the
highest need but tend to have less hospitable business environments
Third Top
(Relative to all 28 states of India)
38
Executive summary
Health, social and environmental impact
Sector mapping
Project approach
Macro environment
Consumer assessment
Sector mapping summary
Appendix
Table of contents
Cookstove policy environment
Cookstove industry
Fuel usage and trends
39
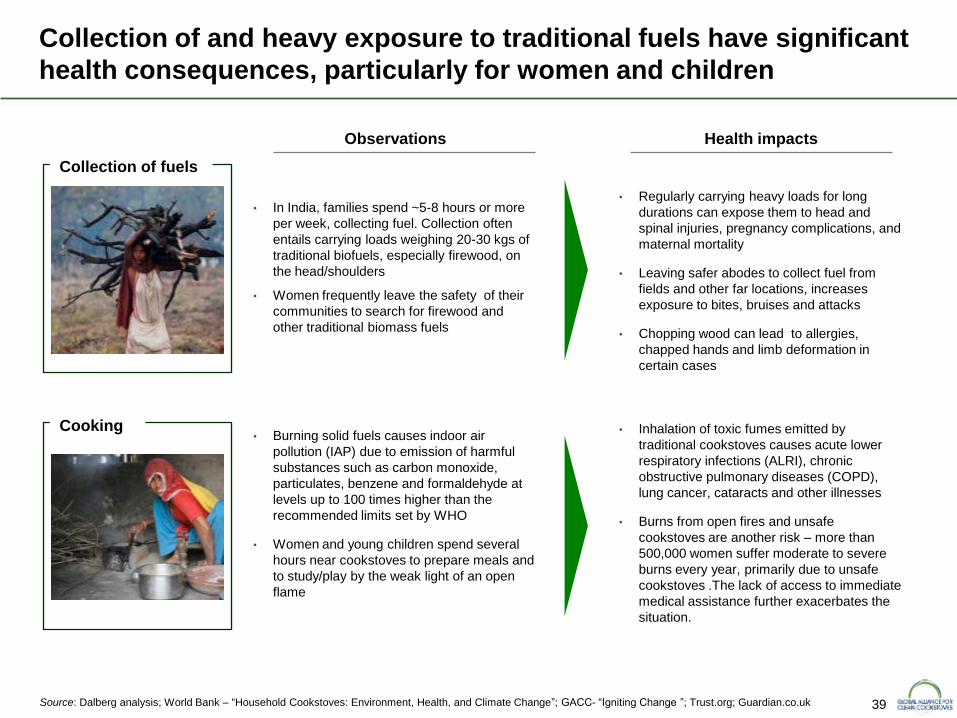
Collection of and heavy exposure to traditional fuels have significant
health consequences, particularly for women and children
fdsf
hj
• In India, families spend ~5-8 hours or more
per week, collecting fuel. Collection often
entails carrying loads weighing 20-30 kgs of
traditional biofuels, especially firewood, on
the head/shoulders
• Women frequently leave the safety of their
communities to search for firewood and
other traditional biomass fuels
Observations Health impacts
Collection of fuels
Cooking
• Regularly carrying heavy loads for long
durations can expose them to head and
spinal injuries, pregnancy complications, and
maternal mortality
• Leaving safer abodes to collect fuel from
fields and other far locations, increases
exposure to bites, bruises and attacks
• Chopping wood can lead to allergies,
chapped hands and limb deformation in
certain cases
• Burning solid fuels causes indoor air
pollution (IAP) due to emission of harmful
substances such as carbon monoxide,
particulates, benzene and formaldehyde at
levels up to 100 times higher than the
recommended limits set by WHO
• Women and young children spend several
hours near cookstoves to prepare meals and
to study/play by the weak light of an open
flame
• Inhalation of toxic fumes emitted by
traditional cookstoves causes acute lower
respiratory infections (ALRI), chronic
obstructive pulmonary diseases (COPD),
lung cancer, cataracts and other illnesses
• Burns from open fires and unsafe
cookstoves are another risk – more than
500,000 women suffer moderate to severe
burns every year, primarily due to unsafe
cookstoves .The lack of access to immediate
medical assistance further exacerbates the
situation.
Source: Dalberg analysis; World Bank – “Household Cookstoves: Environment, Health, and Climate Change”; GACC- “Igniting Change ”; Trust.org; Guardian.co.uk
40
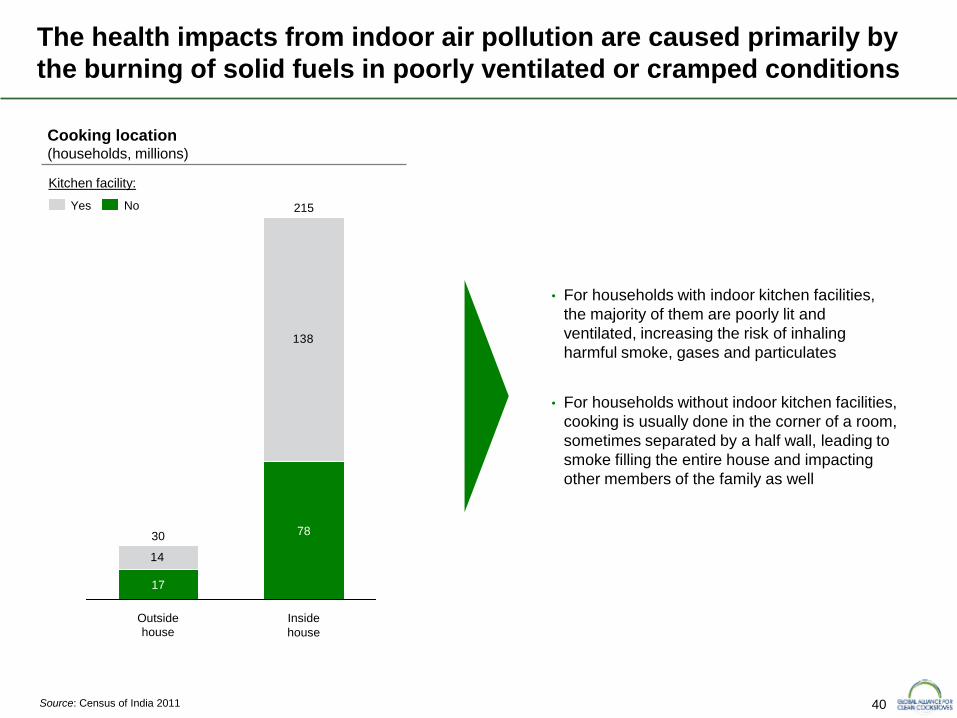
Source: Census of India 2011
The health impacts from indoor air pollution are caused primarily by
the burning of solid fuels in poorly ventilated or cramped conditions
14
138
Outside
house
78
215
Inside
house
30
17
Cooking location (households, millions)
• For households with indoor kitchen facilities,
the majority of them are poorly lit and
ventilated, increasing the risk of inhaling
harmful smoke, gases and particulates
• For households without indoor kitchen facilities,
cooking is usually done in the corner of a room,
sometimes separated by a half wall, leading to
smoke filling the entire house and impacting
other members of the family as well
Yes No
Kitchen facility:
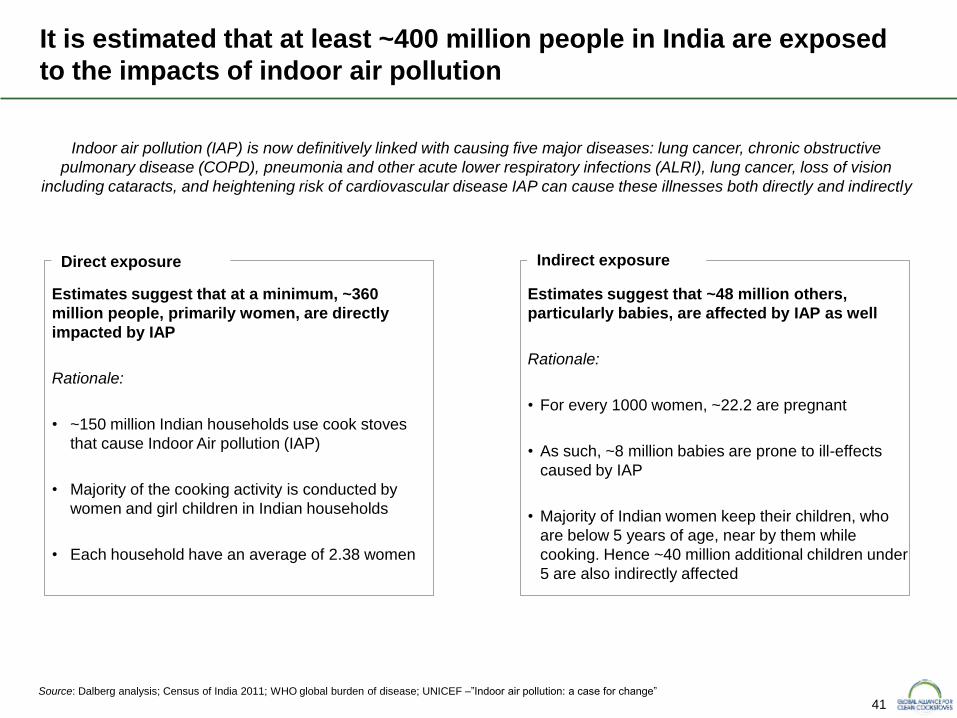
41
Estimates suggest that at a minimum, ~360
million people, primarily women, are directly
impacted by IAP
Rationale:
• ~150 million Indian households use cook stoves
that cause Indoor Air pollution (IAP)
• Majority of the cooking activity is conducted by
women and girl children in Indian households
• Each household have an average of 2.38 women
Estimates suggest that ~48 million others,
particularly babies, are affected by IAP as well
Rationale:
• For every 1000 women, ~22.2 are pregnant
• As such, ~8 million babies are prone to ill-effects
caused by IAP
• Majority of Indian women keep their children, who
are below 5 years of age, near by them while
cooking. Hence ~40 million additional children under
5 are also indirectly affected
Direct exposure Indirect exposure
Source: Dalberg analysis; Census of India 2011; WHO global burden of disease; UNICEF –”Indoor air pollution: a case for change”
It is estimated that at least ~400 million people in India are exposed
to the impacts of indoor air pollution
Indoor air pollution (IAP) is now definitively linked with causing five major diseases: lung cancer, chronic obstructive
pulmonary disease (COPD), pneumonia and other acute lower respiratory infections (ALRI), lung cancer, loss of vision
including cataracts, and heightening risk of cardiovascular disease IAP can cause these illnesses both directly and indirectly
42
Note: (i) The ratio of deaths caused due to IAP in India to the ones caused globally is assumed to be the same in 2007 & 2012 as there is no significant decrease in number
of people using solid fuels in India and globally (ii) Deaths to DALYs ratio was assumed to be the same in 2004 & 2012 as DALYs is a function of deaths and diseased days
which in turn are proportional to each other
Source: Global and Indian Burdens of Disease from Household Air Pollution - the GBD 2010 Study; HAP Expert Group and Indian Institute of Technology, 2013
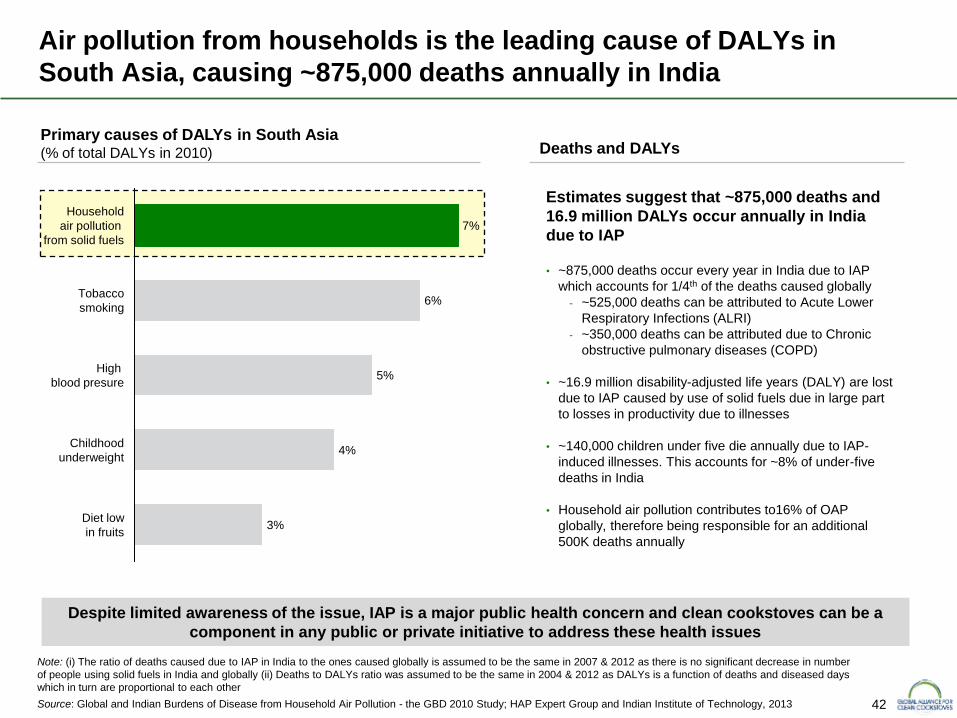
Air pollution from households is the leading cause of DALYs in
South Asia, causing ~875,000 deaths annually in India
Household
air pollution
from solid fuels
7%
High
blood presure
Diet low
in fruits
Childhood
underweight
Tobacco
smoking
4%
5%
6%
3%
Primary causes of DALYs in South Asia (% of total DALYs in 2010)
Estimates suggest that ~875,000 deaths and
16.9 million DALYs occur annually in India
due to IAP • ~875,000 deaths occur every year in India due to IAP
which accounts for 1/4th of the deaths caused globally
- ~525,000 deaths can be attributed to Acute Lower
Respiratory Infections (ALRI)
- ~350,000 deaths can be attributed due to Chronic
obstructive pulmonary diseases (COPD)
• ~16.9 million disability-adjusted life years (DALY) are lost
due to IAP caused by use of solid fuels due in large part
to losses in productivity due to illnesses
• ~140,000 children under five die annually due to IAP-
induced illnesses. This accounts for ~8% of under-five
deaths in India
• Household air pollution contributes to16% of OAP
globally, therefore being responsible for an additional
500K deaths annually
Deaths and DALYs
Despite limited awareness of the issue, IAP is a major public health concern and clean cookstoves can be a
component in any public or private initiative to address these health issues
43
Note: “Purchase” includes those households procuring those exclusively purchasing solid fuels as well mixing collection and purchase of solid fuels.
Source Dalberg consumer segmentation database; NSSO 2004/2006 and 2009/2010 database; Census 2011; Planning Commission of India;; IHDS; "Human Development
in India”; Elizabeth Cecelski - "The role of women in sustainable energy development”.
Collection vs. purchase of solid fuels Time spent on cooking activities
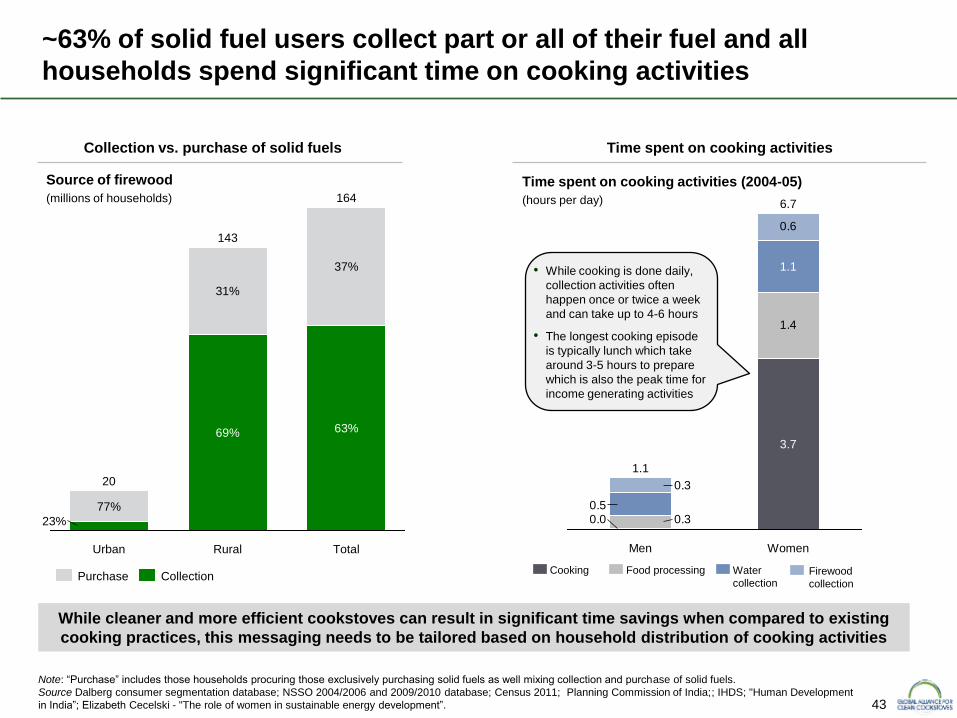
~63% of solid fuel users collect part or all of their fuel and all
households spend significant time on cooking activities
While cleaner and more efficient cookstoves can result in significant time savings when compared to existing
cooking practices, this messaging needs to be tailored based on household distribution of cooking activities
Total
20
77%
Rural
143
31%
23%
Urban
69% 63%
164
37%
Source of firewood
(millions of households)
Time spent on cooking activities (2004-05)
(hours per day)
1.4
0.6
0.0 0.30.5
0.3
Women
6.7
3.7
1.1
Men
1.1
Firewood
collection
Water
collection
Food processing Cooking
• While cooking is done daily,
collection activities often
happen once or twice a week
and can take up to 4-6 hours
• The longest cooking episode
is typically lunch which take
around 3-5 hours to prepare
which is also the peak time for
income generating activities
Purchase Collection
44
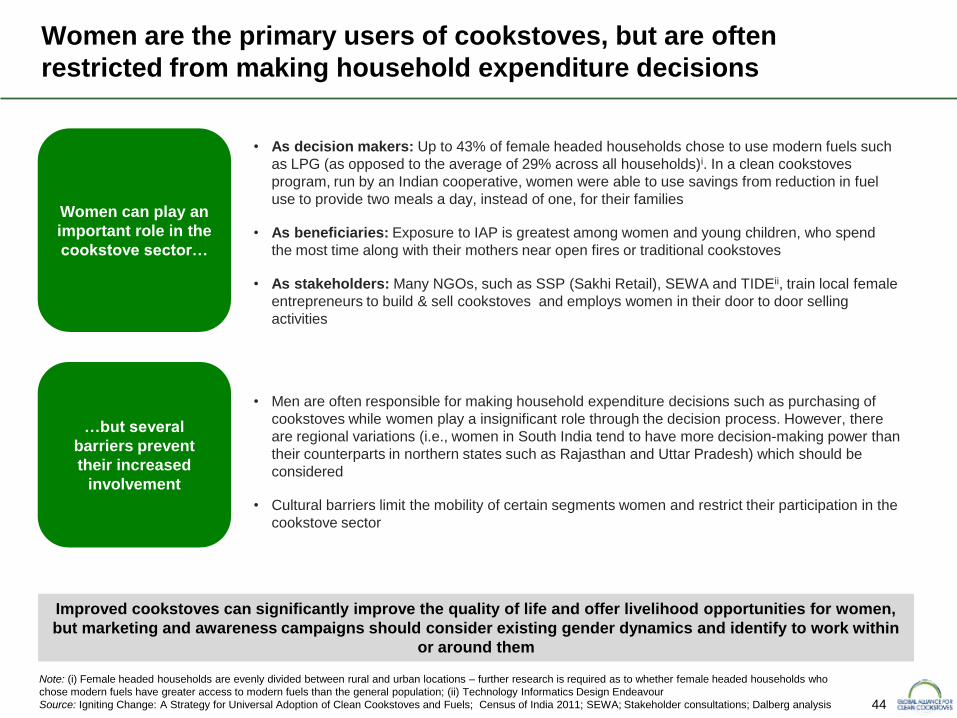
Women are the primary users of cookstoves, but are often
restricted from making household expenditure decisions
Improved cookstoves can significantly improve the quality of life and offer livelihood opportunities for women,
but marketing and awareness campaigns should consider existing gender dynamics and identify to work within
or around them
Note: (i) Female headed households are evenly divided between rural and urban locations – further research is required as to whether female headed households who
chose modern fuels have greater access to modern fuels than the general population; (ii) Technology Informatics Design Endeavour
Source: Igniting Change: A Strategy for Universal Adoption of Clean Cookstoves and Fuels; Census of India 2011; SEWA; Stakeholder consultations; Dalberg analysis
• As decision makers: Up to 43% of female headed households chose to use modern fuels such
as LPG (as opposed to the average of 29% across all households)i. In a clean cookstoves
program, run by an Indian cooperative, women were able to use savings from reduction in fuel
use to provide two meals a day, instead of one, for their families
• As beneficiaries: Exposure to IAP is greatest among women and young children, who spend
the most time along with their mothers near open fires or traditional cookstoves
• As stakeholders: Many NGOs, such as SSP (Sakhi Retail), SEWA and TIDEii, train local female
entrepreneurs to build & sell cookstoves and employs women in their door to door selling
activities
• Men are often responsible for making household expenditure decisions such as purchasing of
cookstoves while women play a insignificant role through the decision process. However, there
are regional variations (i.e., women in South India tend to have more decision-making power than
their counterparts in northern states such as Rajasthan and Uttar Pradesh) which should be
considered
• Cultural barriers limit the mobility of certain segments women and restrict their participation in the
cookstove sector
Women can play an
important role in the
cookstove sector…
…but several
barriers prevent
their increased
involvement
45
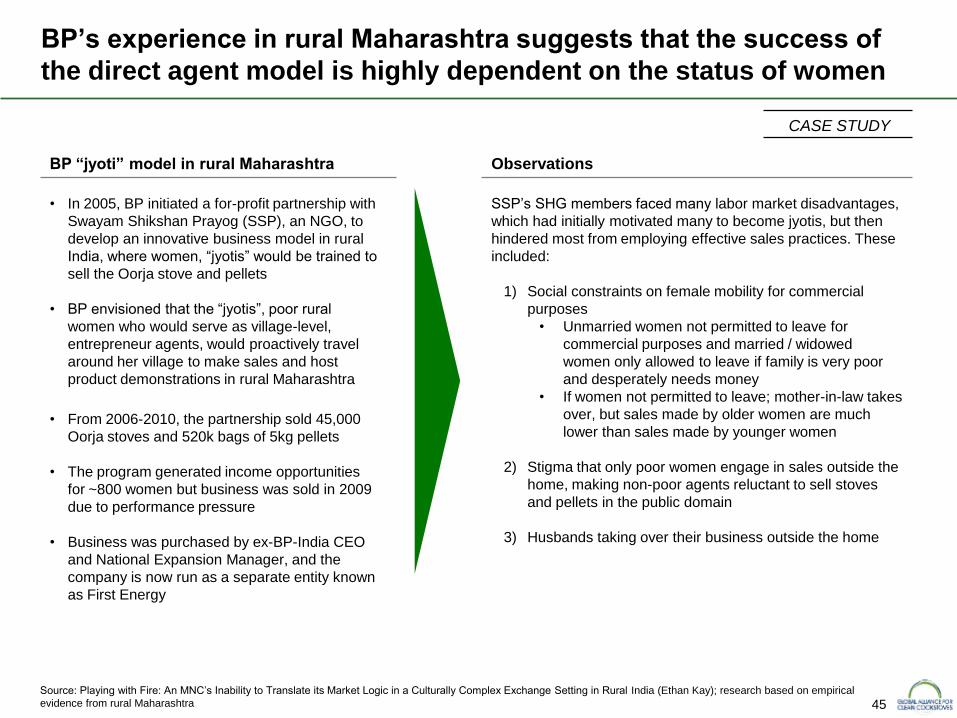
BP’s experience in rural Maharashtra suggests that the success of
the direct agent model is highly dependent on the status of women
CASE STUDY
Source: Playing with Fire: An MNC’s Inability to Translate its Market Logic in a Culturally Complex Exchange Setting in Rural India (Ethan Kay); research based on empirical
evidence from rural Maharashtra
Observations BP “jyoti” model in rural Maharashtra
• In 2005, BP initiated a for-profit partnership with
Swayam Shikshan Prayog (SSP), an NGO, to
develop an innovative business model in rural
India, where women, “jyotis” would be trained to
sell the Oorja stove and pellets
• BP envisioned that the “jyotis”, poor rural
women who would serve as village-level,
entrepreneur agents, would proactively travel
around her village to make sales and host
product demonstrations in rural Maharashtra
• From 2006-2010, the partnership sold 45,000
Oorja stoves and 520k bags of 5kg pellets
• The program generated income opportunities
for ~800 women but business was sold in 2009
due to performance pressure
• Business was purchased by ex-BP-India CEO
and National Expansion Manager, and the
company is now run as a separate entity known
as First Energy
SSP’s SHG members faced many labor market disadvantages,
which had initially motivated many to become jyotis, but then
hindered most from employing effective sales practices. These
included:
1) Social constraints on female mobility for commercial
purposes
• Unmarried women not permitted to leave for
commercial purposes and married / widowed
women only allowed to leave if family is very poor
and desperately needs money
• If women not permitted to leave; mother-in-law takes
over, but sales made by older women are much
lower than sales made by younger women
2) Stigma that only poor women engage in sales outside the
home, making non-poor agents reluctant to sell stoves
and pellets in the public domain
3) Husbands taking over their business outside the home
46
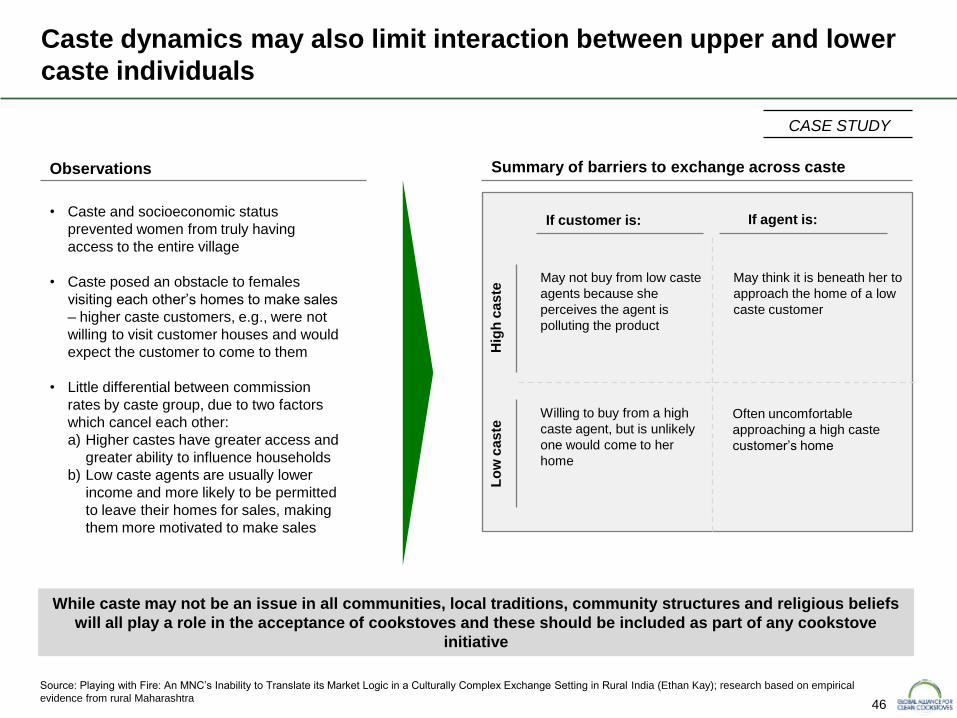
Caste dynamics may also limit interaction between upper and lower
caste individuals
Source: Playing with Fire: An MNC’s Inability to Translate its Market Logic in a Culturally Complex Exchange Setting in Rural India (Ethan Kay); research based on empirical
evidence from rural Maharashtra
CASE STUDY
If customer is: If agent is:
Hig
h c
as
te
Lo
w c
as
te
May not buy from low caste
agents because she
perceives the agent is
polluting the product
Willing to buy from a high
caste agent, but is unlikely
one would come to her
home
May think it is beneath her to
approach the home of a low
caste customer
Often uncomfortable
approaching a high caste
customer’s home
Summary of barriers to exchange across caste
• Caste and socioeconomic status
prevented women from truly having
access to the entire village
• Caste posed an obstacle to females
visiting each other’s homes to make sales
– higher caste customers, e.g., were not
willing to visit customer houses and would
expect the customer to come to them
• Little differential between commission
rates by caste group, due to two factors
which cancel each other:
a) Higher castes have greater access and
greater ability to influence households
b) Low caste agents are usually lower
income and more likely to be permitted
to leave their homes for sales, making
them more motivated to make sales
Observations
While caste may not be an issue in all communities, local traditions, community structures and religious beliefs
will all play a role in the acceptance of cookstoves and these should be included as part of any cookstove
initiative
47
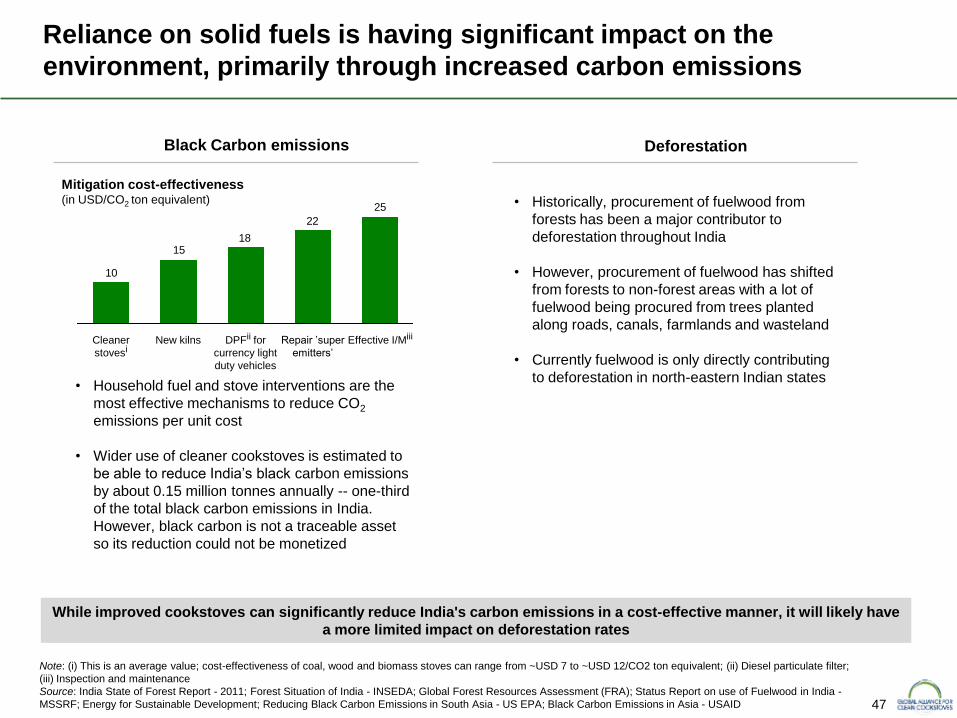
Reliance on solid fuels is having significant impact on the
environment, primarily through increased carbon emissions
Note: (i) This is an average value; cost-effectiveness of coal, wood and biomass stoves can range from ~USD 7 to ~USD 12/CO2 ton equivalent; (ii) Diesel particulate filter;
(iii) Inspection and maintenance
Source: India State of Forest Report - 2011; Forest Situation of India - INSEDA; Global Forest Resources Assessment (FRA); Status Report on use of Fuelwood in India -
MSSRF; Energy for Sustainable Development; Reducing Black Carbon Emissions in South Asia - US EPA; Black Carbon Emissions in Asia - USAID
• Household fuel and stove interventions are the
most effective mechanisms to reduce CO2
emissions per unit cost
• Wider use of cleaner cookstoves is estimated to
be able to reduce India’s black carbon emissions
by about 0.15 million tonnes annually -- one-third
of the total black carbon emissions in India.
However, black carbon is not a traceable asset
so its reduction could not be monetized
While improved cookstoves can significantly reduce India's carbon emissions in a cost-effective manner, it will likely have
a more limited impact on deforestation rates
• Historically, procurement of fuelwood from
forests has been a major contributor to
deforestation throughout India
• However, procurement of fuelwood has shifted
from forests to non-forest areas with a lot of
fuelwood being procured from trees planted
along roads, canals, farmlands and wasteland
• Currently fuelwood is only directly contributing
to deforestation in north-eastern Indian states
Mitigation cost-effectiveness (in USD/CO2 ton equivalent)
Black Carbon emissions Deforestation
25
22
1815
10
New kilns Cleaner
stovesi Effective I/Miii Repair ’super
emitters’
DPFii for
currency light
duty vehicles
48
Executive summary
Health, social and environmental impact
Sector mapping
Project approach
Macro environment
Consumer assessment
Sector mapping summary
Appendix
Table of contents
Cookstove policy environment
Cookstove industry
Fuel usage and trends
49
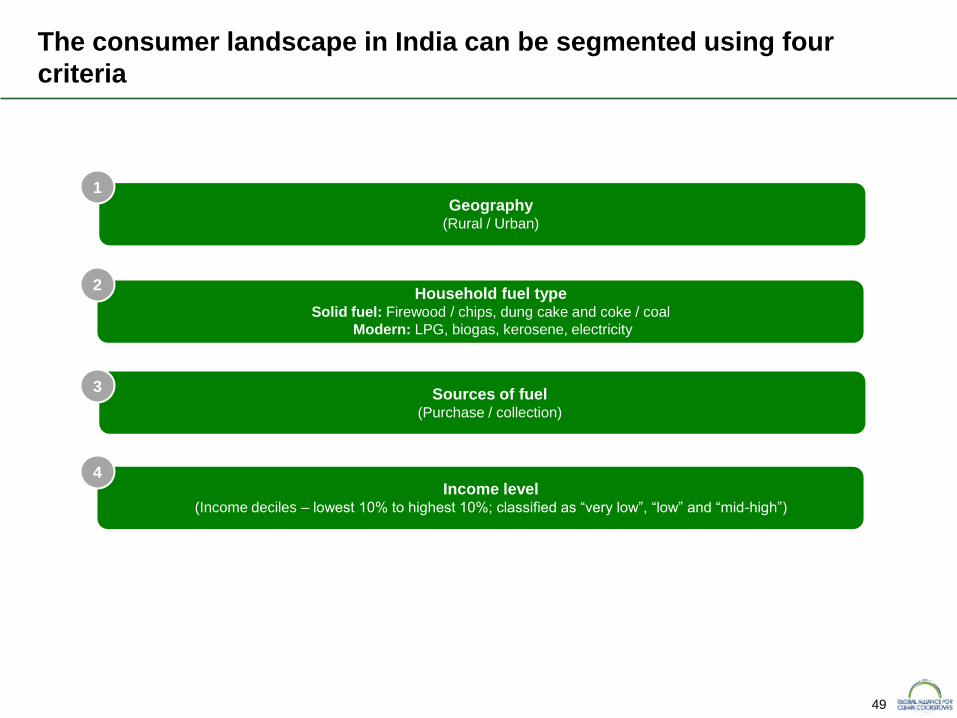
Sources of fuel (Purchase / collection)
Geography (Rural / Urban)
Household fuel type Solid fuel: Firewood / chips, dung cake and coke / coal
Modern: LPG, biogas, kerosene, electricity
Income level (Income deciles – lowest 10% to highest 10%; classified as “very low”, “low” and “mid-high”)
The consumer landscape in India can be segmented using four
criteria
1
2
3
4
50
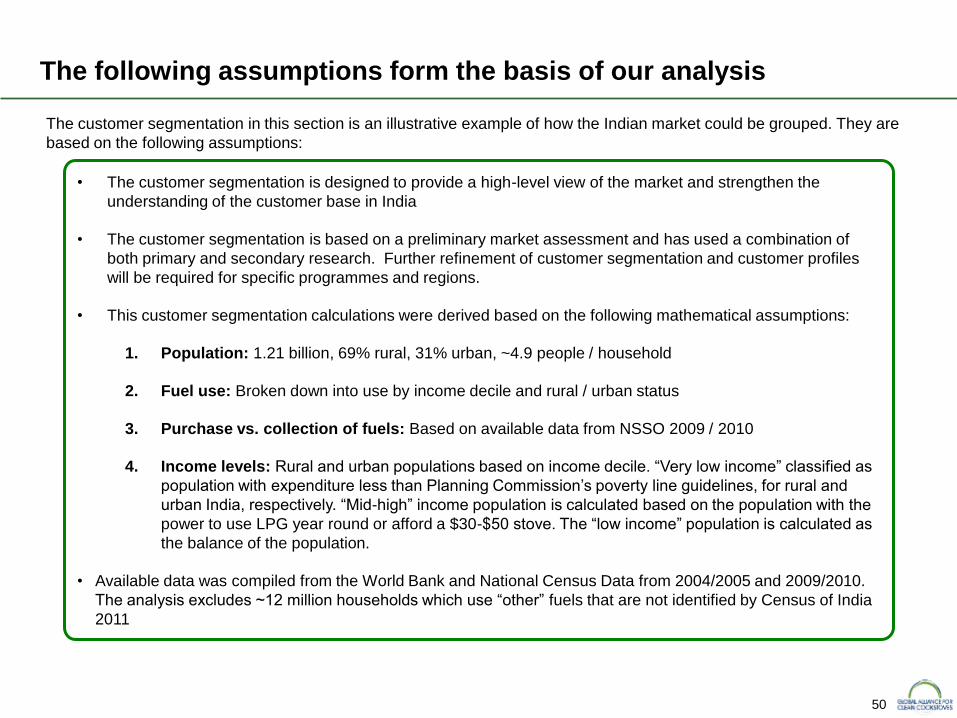
• The customer segmentation is designed to provide a high-level view of the market and strengthen the
understanding of the customer base in India
• The customer segmentation is based on a preliminary market assessment and has used a combination of
both primary and secondary research. Further refinement of customer segmentation and customer profiles
will be required for specific programmes and regions.
• This customer segmentation calculations were derived based on the following mathematical assumptions:
1. Population: 1.21 billion, 69% rural, 31% urban, ~4.9 people / household
2. Fuel use: Broken down into use by income decile and rural / urban status
3. Purchase vs. collection of fuels: Based on available data from NSSO 2009 / 2010
4. Income levels: Rural and urban populations based on income decile. “Very low income” classified as
population with expenditure less than Planning Commission’s poverty line guidelines, for rural and
urban India, respectively. “Mid-high” income population is calculated based on the population with the
power to use LPG year round or afford a $30-$50 stove. The “low income” population is calculated as
the balance of the population.
• Available data was compiled from the World Bank and National Census Data from 2004/2005 and 2009/2010.
The analysis excludes ~12 million households which use “other” fuels that are not identified by Census of India
2011
The customer segmentation in this section is an illustrative example of how the Indian market could be grouped. They are
based on the following assumptions:
The following assumptions form the basis of our analysis
51 Note: Excludes ~12 million households which use “other” fuels that are not identified by Census of India 2011
Source: Dalberg consumer segmentation database; NSSO 2004/2006 and 2009/2010 database; Census 2011; Planning Commission of India
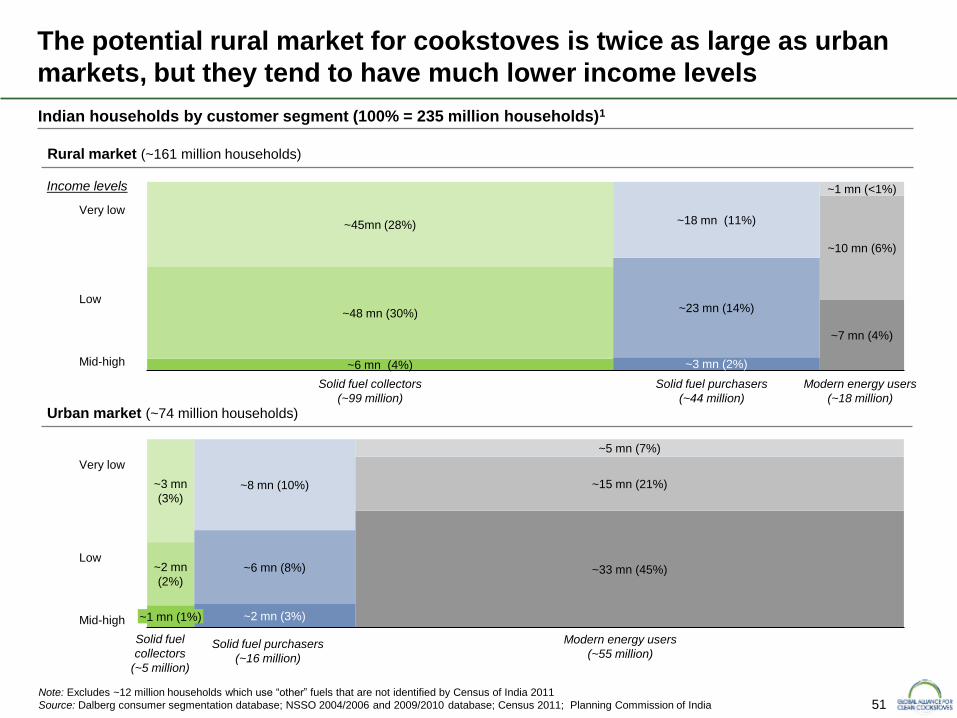
The potential rural market for cookstoves is twice as large as urban
markets, but they tend to have much lower income levels
~33 mn (45%)
~5 mn (7%)
~15 mn (21%) ~8 mn (10%) ~3 mn
(3%)
~2 mn
(2%)
~1 mn (1%) ~2 mn (3%)
~6 mn (8%)
Urban market (~74 million households)
Indian households by customer segment (100% = 235 million households)1
~3 mn (2%)
~23 mn (14%)
~18 mn (11%)
~6 mn (4%)
~48 mn (30%)
~45mn (28%)
~7 mn (4%)
~10 mn (6%)
~1 mn (<1%)
Very low
Mid-high
Rural market (~161 million households)
Solid fuel collectors
(~99 million)
Solid fuel purchasers
(~44 million)
Modern energy users
(~18 million)
Solid fuel
collectors
(~5 million)
Solid fuel purchasers
(~16 million)
Modern energy users
(~55 million)
Low
Very low
Mid-high
Low
Income levels
52
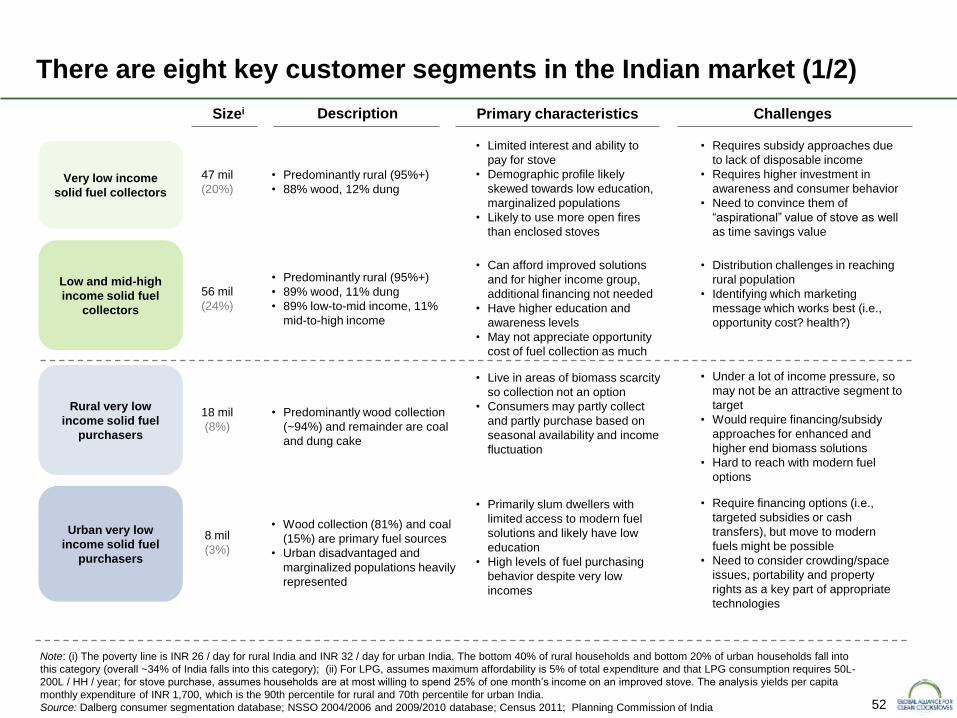
There are eight key customer segments in the Indian market (1/2)
Sizei Description Primary characteristics
47 mil
(20%)
56 mil
(24%)
18 mil
(8%)
• Predominantly rural (95%+)
• 88% wood, 12% dung
• Limited interest and ability to
pay for stove
• Demographic profile likely
skewed towards low education,
marginalized populations
• Likely to use more open fires
than enclosed stoves
Very low income
solid fuel collectors
Low and mid-high
income solid fuel
collectors
Rural very low
income solid fuel
purchasers
Note: (i) The poverty line is INR 26 / day for rural India and INR 32 / day for urban India. The bottom 40% of rural households and bottom 20% of urban households fall into
this category (overall ~34% of India falls into this category); (ii) For LPG, assumes maximum affordability is 5% of total expenditure and that LPG consumption requires 50L-
200L / HH / year; for stove purchase, assumes households are at most willing to spend 25% of one month’s income on an improved stove. The analys is yields per capita
monthly expenditure of INR 1,700, which is the 90th percentile for rural and 70th percentile for urban India.
Source: Dalberg consumer segmentation database; NSSO 2004/2006 and 2009/2010 database; Census 2011; Planning Commission of India
Urban very low
income solid fuel
purchasers
8 mil
(3%)
• Predominantly rural (95%+)
• 89% wood, 11% dung
• 89% low-to-mid income, 11%
mid-to-high income
• Predominantly wood collection
(~94%) and remainder are coal
and dung cake
• Wood collection (81%) and coal
(15%) are primary fuel sources
• Urban disadvantaged and
marginalized populations heavily
represented
Challenges
• Requires subsidy approaches due
to lack of disposable income
• Requires higher investment in
awareness and consumer behavior
• Need to convince them of
“aspirational” value of stove as well
as time savings value
• Can afford improved solutions
and for higher income group,
additional financing not needed
• Have higher education and
awareness levels
• May not appreciate opportunity
cost of fuel collection as much
• Distribution challenges in reaching
rural population
• Identifying which marketing
message which works best (i.e.,
opportunity cost? health?)
• Under a lot of income pressure, so
may not be an attractive segment to
target
• Would require financing/subsidy
approaches for enhanced and
higher end biomass solutions
• Hard to reach with modern fuel
options
• Live in areas of biomass scarcity
so collection not an option
• Consumers may partly collect
and partly purchase based on
seasonal availability and income
fluctuation
• Require financing options (i.e.,
targeted subsidies or cash
transfers), but move to modern
fuels might be possible
• Need to consider crowding/space
issues, portability and property
rights as a key part of appropriate
technologies
• Primarily slum dwellers with
limited access to modern fuel
solutions and likely have low
education
• High levels of fuel purchasing
behavior despite very low
incomes
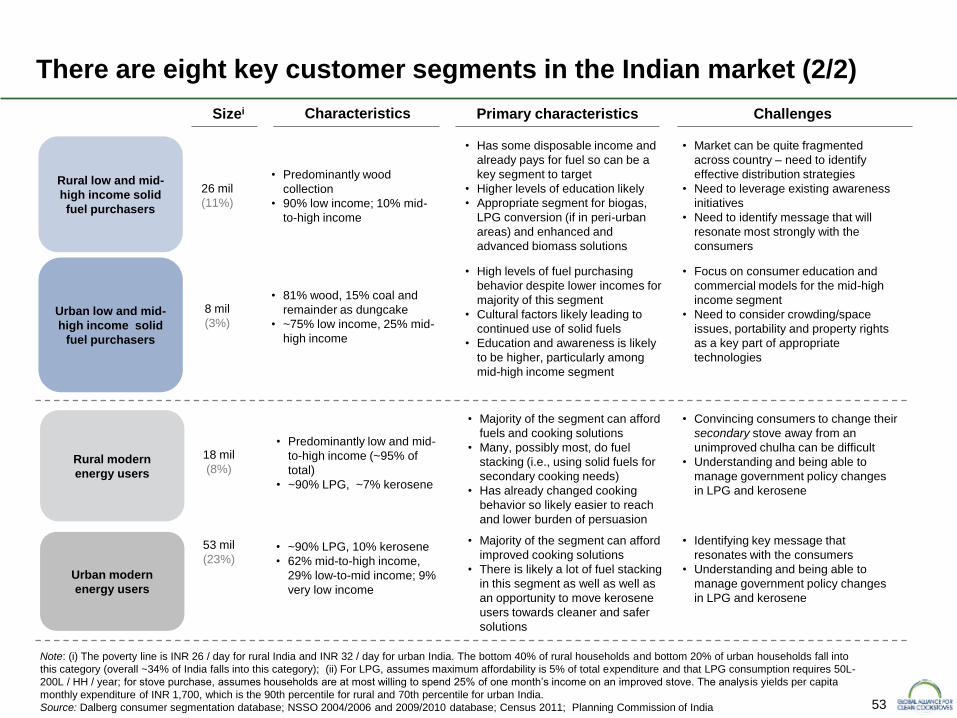
53
• 81% wood, 15% coal and
remainder as dungcake
• ~75% low income, 25% mid-
high income
There are eight key customer segments in the Indian market (2/2)
Sizei Characteristics
8 mil
(3%)
18 mil
(8%)
Urban low and mid-
high income solid
fuel purchasers
Urban modern
energy users
Rural modern
energy users
53 mil
(23%)
• Predominantly low and mid-
to-high income (~95% of
total)
• ~90% LPG, ~7% kerosene
• ~90% LPG, 10% kerosene
• 62% mid-to-high income,
29% low-to-mid income; 9%
very low income
Rural low and mid-
high income solid
fuel purchasers
26 mil
(11%)
• Predominantly wood
collection
• 90% low income; 10% mid-
to-high income
Primary characteristics
• Has some disposable income and
already pays for fuel so can be a
key segment to target
• Higher levels of education likely
• Appropriate segment for biogas,
LPG conversion (if in peri-urban
areas) and enhanced and
advanced biomass solutions
Challenges
• Market can be quite fragmented
across country – need to identify
effective distribution strategies
• Need to leverage existing awareness
initiatives
• Need to identify message that will
resonate most strongly with the
consumers
• High levels of fuel purchasing
behavior despite lower incomes for
majority of this segment
• Cultural factors likely leading to
continued use of solid fuels
• Education and awareness is likely
to be higher, particularly among
mid-high income segment
• Focus on consumer education and
commercial models for the mid-high
income segment
• Need to consider crowding/space
issues, portability and property rights
as a key part of appropriate
technologies
• Majority of the segment can afford
fuels and cooking solutions
• Many, possibly most, do fuel
stacking (i.e., using solid fuels for
secondary cooking needs)
• Has already changed cooking
behavior so likely easier to reach
and lower burden of persuasion
• Convincing consumers to change their
secondary stove away from an
unimproved chulha can be difficult
• Understanding and being able to
manage government policy changes
in LPG and kerosene
• Majority of the segment can afford
improved cooking solutions
• There is likely a lot of fuel stacking
in this segment as well as well as
an opportunity to move kerosene
users towards cleaner and safer
solutions
• Identifying key message that
resonates with the consumers
• Understanding and being able to
manage government policy changes
in LPG and kerosene
Note: (i) The poverty line is INR 26 / day for rural India and INR 32 / day for urban India. The bottom 40% of rural households and bottom 20% of urban households fall into
this category (overall ~34% of India falls into this category); (ii) For LPG, assumes maximum affordability is 5% of total expenditure and that LPG consumption requires 50L-
200L / HH / year; for stove purchase, assumes households are at most willing to spend 25% of one month’s income on an improved stove. The analys is yields per capita
monthly expenditure of INR 1,700, which is the 90th percentile for rural and 70th percentile for urban India.
Source: Dalberg consumer segmentation database; NSSO 2004/2006 and 2009/2010 database; Census 2011; Planning Commission of India
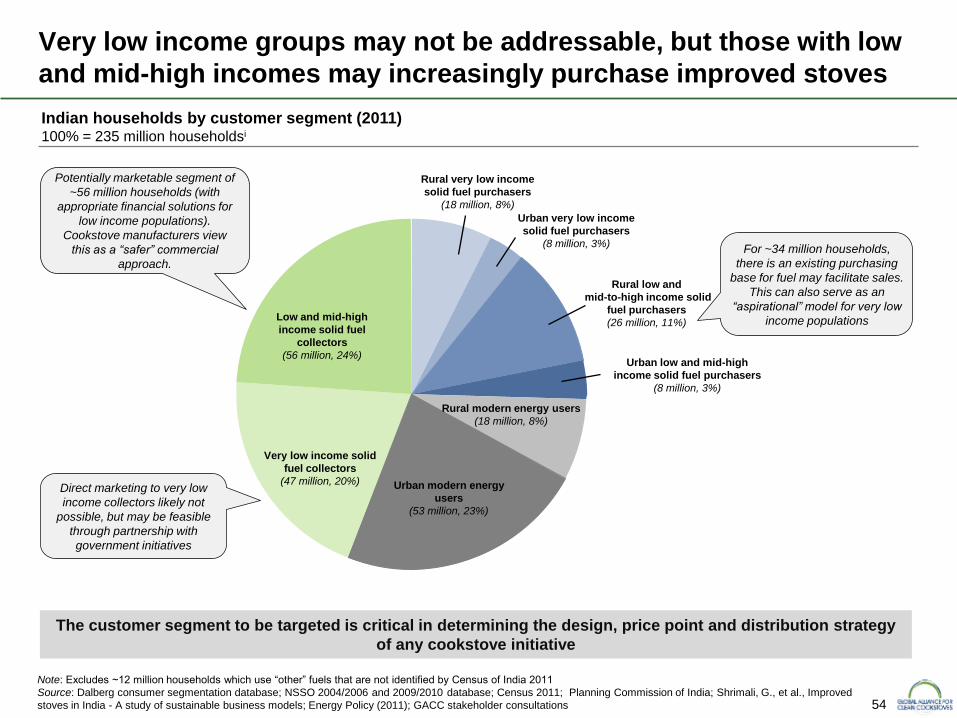
54
Very low income groups may not be addressable, but those with low
and mid-high incomes may increasingly purchase improved stoves
Indian households by customer segment (2011) 100% = 235 million householdsi
Potentially marketable segment of
~56 million households (with
appropriate financial solutions for
low income populations).
Cookstove manufacturers view
this as a “safer” commercial
approach.
The customer segment to be targeted is critical in determining the design, price point and distribution strategy
of any cookstove initiative
Low and mid-high
income solid fuel
collectors
(56 million, 24%)
Very low income solid
fuel collectors
(47 million, 20%)
Note: Excludes ~12 million households which use “other” fuels that are not identified by Census of India 2011
Source: Dalberg consumer segmentation database; NSSO 2004/2006 and 2009/2010 database; Census 2011; Planning Commission of India; Shrimali, G., et al., Improved
stoves in India - A study of sustainable business models; Energy Policy (2011); GACC stakeholder consultations
Urban very low income
solid fuel purchasers
(8 million, 3%)
Rural very low income
solid fuel purchasers
(18 million, 8%)
Rural low and
mid-to-high income solid
fuel purchasers
(26 million, 11%)
Rural modern energy users
(18 million, 8%)
Urban modern energy
users
(53 million, 23%)
Urban low and mid-high
income solid fuel purchasers
(8 million, 3%)
For ~34 million households,
there is an existing purchasing
base for fuel may facilitate sales.
This can also serve as an
“aspirational” model for very low
income populations
Direct marketing to very low
income collectors likely not
possible, but may be feasible
through partnership with
government initiatives
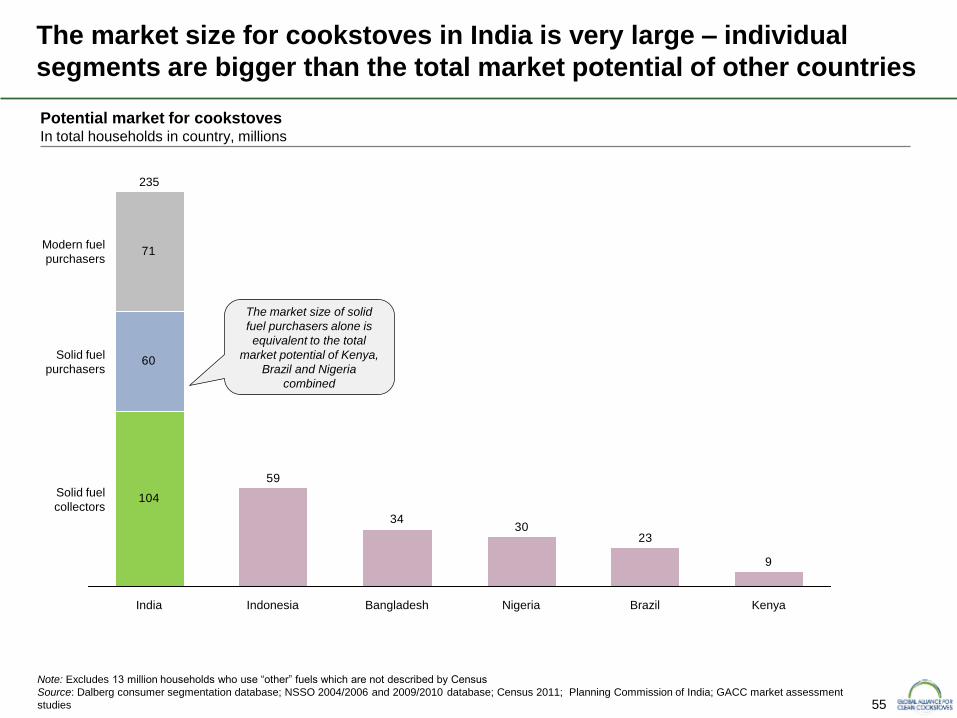
55
The market size for cookstoves in India is very large – individual
segments are bigger than the total market potential of other countries
Potential market for cookstoves In total households in country, millions
Note: Excludes 13 million households who use “other” fuels which are not described by Census
Source: Dalberg consumer segmentation database; NSSO 2004/2006 and 2009/2010 database; Census 2011; Planning Commission of India; GACC market assessment
studies
71
104
60
9
2330
34
59
Indonesia India Bangladesh Nigeria Brazil Kenya
Solid fuel
purchasers
Solid fuel
collectors
235
Modern fuel
purchasers
The market size of solid
fuel purchasers alone is
equivalent to the total
market potential of Kenya,
Brazil and Nigeria
combined
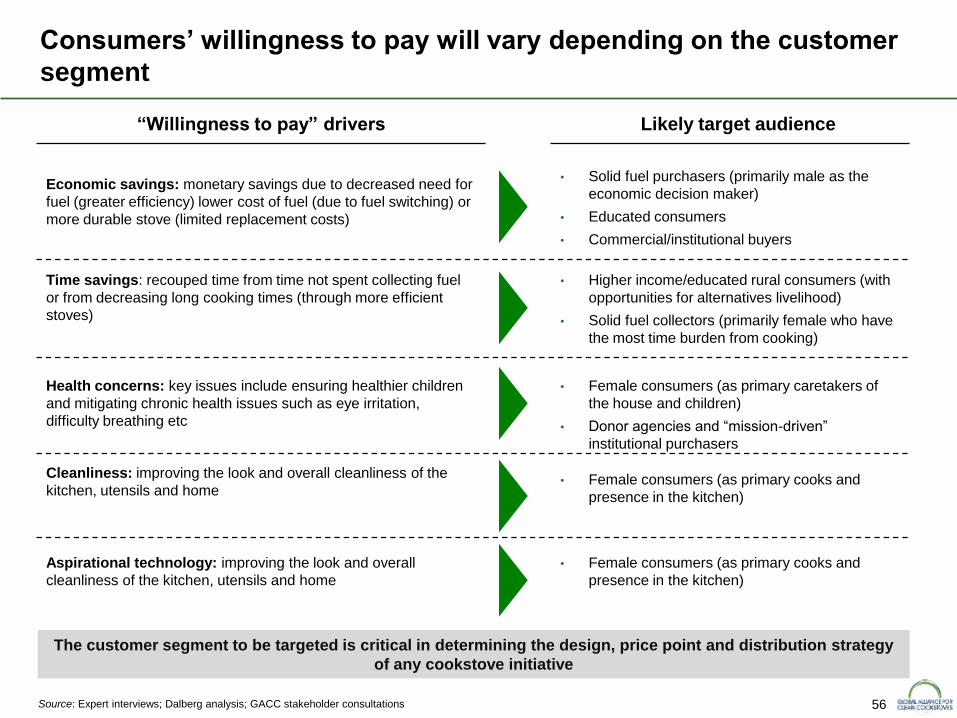
56 Source: Expert interviews; Dalberg analysis; GACC stakeholder consultations
Consumers’ willingness to pay will vary depending on the customer
segment
Economic savings: monetary savings due to decreased need for
fuel (greater efficiency) lower cost of fuel (due to fuel switching) or
more durable stove (limited replacement costs)
“Willingness to pay” drivers Likely target audience
• Solid fuel purchasers (primarily male as the
economic decision maker)
• Educated consumers
• Commercial/institutional buyers
Time savings: recouped time from time not spent collecting fuel
or from decreasing long cooking times (through more efficient
stoves)
• Higher income/educated rural consumers (with
opportunities for alternatives livelihood)
• Solid fuel collectors (primarily female who have
the most time burden from cooking)
Health concerns: key issues include ensuring healthier children
and mitigating chronic health issues such as eye irritation,
difficulty breathing etc
• Female consumers (as primary caretakers of
the house and children)
• Donor agencies and “mission-driven”
institutional purchasers
Cleanliness: improving the look and overall cleanliness of the
kitchen, utensils and home
• Female consumers (as primary cooks and
presence in the kitchen)
Aspirational technology: improving the look and overall
cleanliness of the kitchen, utensils and home
• Female consumers (as primary cooks and
presence in the kitchen)
The customer segment to be targeted is critical in determining the design, price point and distribution strategy
of any cookstove initiative
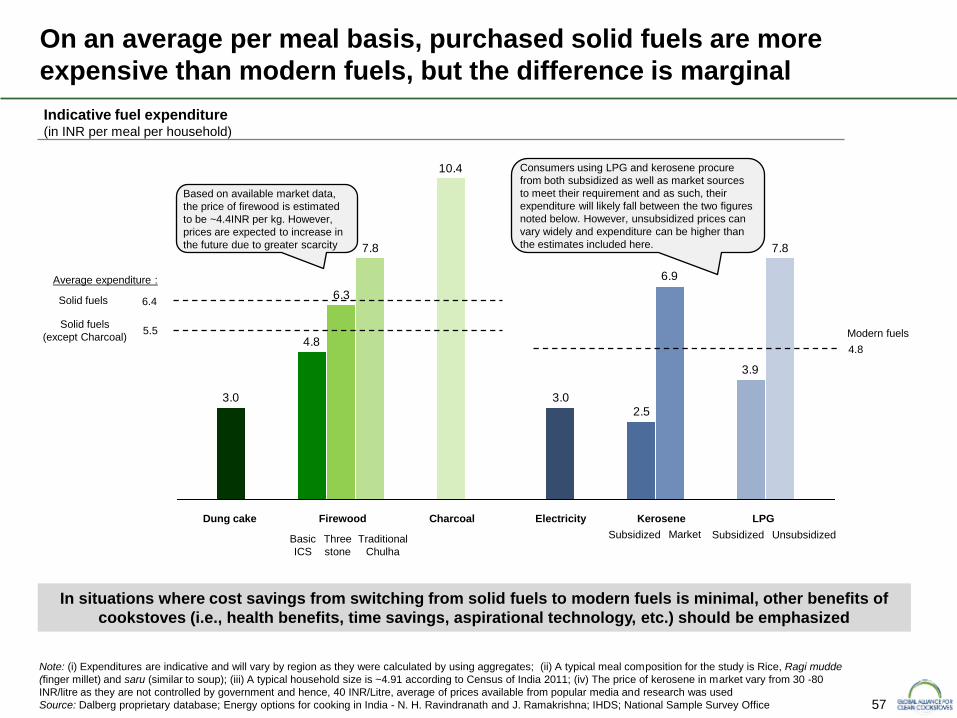
57
On an average per meal basis, purchased solid fuels are more
expensive than modern fuels, but the difference is marginal
Note: (i) Expenditures are indicative and will vary by region as they were calculated by using aggregates; (ii) A typical meal composition for the study is Rice, Ragi mudde
(finger millet) and saru (similar to soup); (iii) A typical household size is ~4.91 according to Census of India 2011; (iv) The price of kerosene in market vary from 30 -80
INR/litre as they are not controlled by government and hence, 40 INR/Litre, average of prices available from popular media and research was used
Source: Dalberg proprietary database; Energy options for cooking in India - N. H. Ravindranath and J. Ramakrishna; IHDS; National Sample Survey Office
In situations where cost savings from switching from solid fuels to modern fuels is minimal, other benefits of
cookstoves (i.e., health benefits, time savings, aspirational technology, etc.) should be emphasized
Indicative fuel expenditure (in INR per meal per household)
3.9
2.5
4.8
7.8
6.9
3.0
10.4
6.3
3.0
7.8
Basic
ICS
Three
stone
Traditional
Chulha
Dung cake Firewood Charcoal Electricity
Subsidized
Market
Subsidized
Unsubsidized
Consumers using LPG and kerosene procure
from both subsidized as well as market sources
to meet their requirement and as such, their
expenditure will likely fall between the two figures
noted below. However, unsubsidized prices can
vary widely and expenditure can be higher than
the estimates included here.
Kerosene LPG
Based on available market data,
the price of firewood is estimated
to be ~4.4INR per kg. However,
prices are expected to increase in
the future due to greater scarcity
Solid fuels
Average expenditure :
6.4
Solid fuels
(except Charcoal) 5.5 Modern fuels
4.8
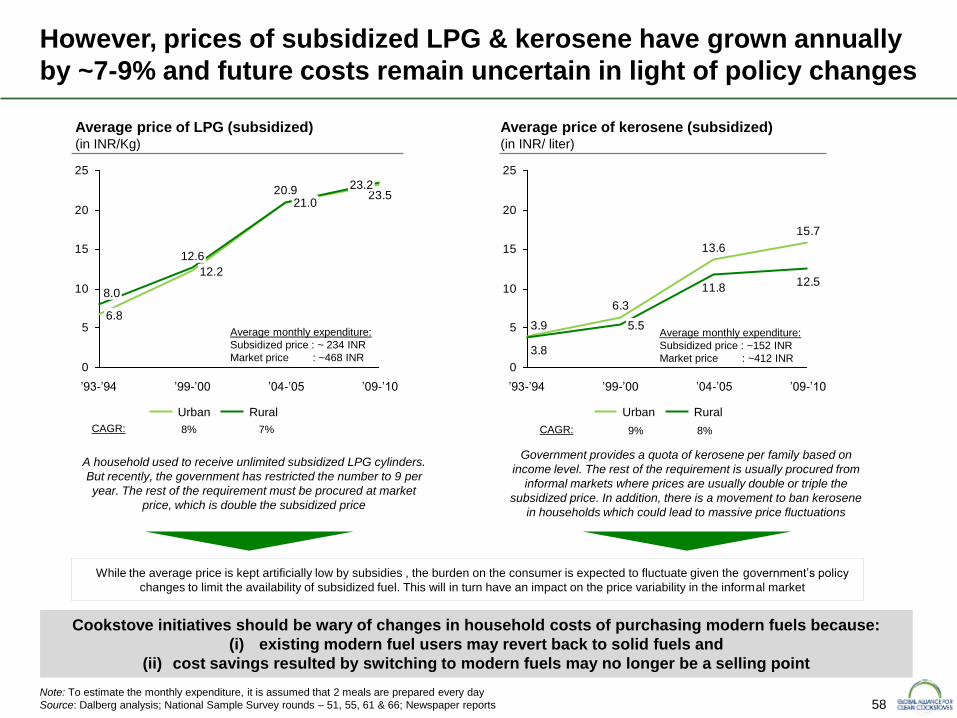
58
However, prices of subsidized LPG & kerosene have grown annually
by ~7-9% and future costs remain uncertain in light of policy changes
Note: To estimate the monthly expenditure, it is assumed that 2 meals are prepared every day
Source: Dalberg analysis; National Sample Survey rounds – 51, 55, 61 & 66; Newspaper reports
Cookstove initiatives should be wary of changes in household costs of purchasing modern fuels because:
(i) existing modern fuel users may revert back to solid fuels and
(ii) cost savings resulted by switching to modern fuels may no longer be a selling point
Average price of LPG (subsidized) (in INR/Kg)
20.9 23.5
0
5
10
15
20
25
’09-’10
23.2
’04-’05
21.0
’99-’00
12.6
12.2
’93-’94
8.0
6.8
Average price of kerosene (subsidized) (in INR/ liter)
15.7
13.6
6.3
3.9
12.511.8
3.8
0
5
10
15
20
25
’99-’00
5.5
’93-’94 ’09-’10 ’04-’05
A household used to receive unlimited subsidized LPG cylinders.
But recently, the government has restricted the number to 9 per
year. The rest of the requirement must be procured at market
price, which is double the subsidized price
While the average price is kept artificially low by subsidies , the burden on the consumer is expected to fluctuate given the government’s policy
changes to limit the availability of subsidized fuel. This will in turn have an impact on the price variability in the informal market
Government provides a quota of kerosene per family based on
income level. The rest of the requirement is usually procured from
informal markets where prices are usually double or triple the
subsidized price. In addition, there is a movement to ban kerosene
in households which could lead to massive price fluctuations
Rural Urban
8% CAGR: 7%
Rural Urban
9% CAGR: 8%
Average monthly expenditure:
Subsidized price : ~ 234 INR
Market price : ~468 INR
Average monthly expenditure:
Subsidized price : ~152 INR
Market price : ~412 INR
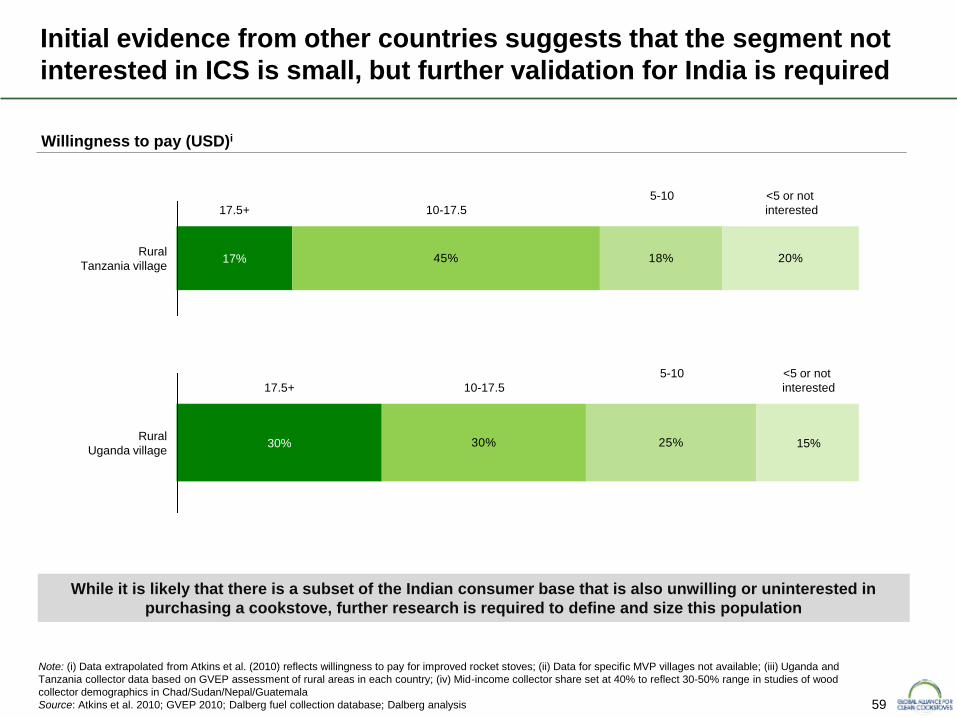
59
Initial evidence from other countries suggests that the segment not
interested in ICS is small, but further validation for India is required
Note: (i) Data extrapolated from Atkins et al. (2010) reflects willingness to pay for improved rocket stoves; (ii) Data for specific MVP villages not available; (iii) Uganda and
Tanzania collector data based on GVEP assessment of rural areas in each country; (iv) Mid-income collector share set at 40% to reflect 30-50% range in studies of wood
collector demographics in Chad/Sudan/Nepal/Guatemala
Source: Atkins et al. 2010; GVEP 2010; Dalberg fuel collection database; Dalberg analysis
45% 18% 20%
17.5+ 10-17.5
5-10
<5 or not
interested
Rural
Tanzania village 17%
30% 25%
17.5+ 10-17.5
5-10
<5 or not
interested
Rural
Uganda village 30% 15%
Willingness to pay (USD)i
While it is likely that there is a subset of the Indian consumer base that is also unwilling or uninterested in
purchasing a cookstove, further research is required to define and size this population
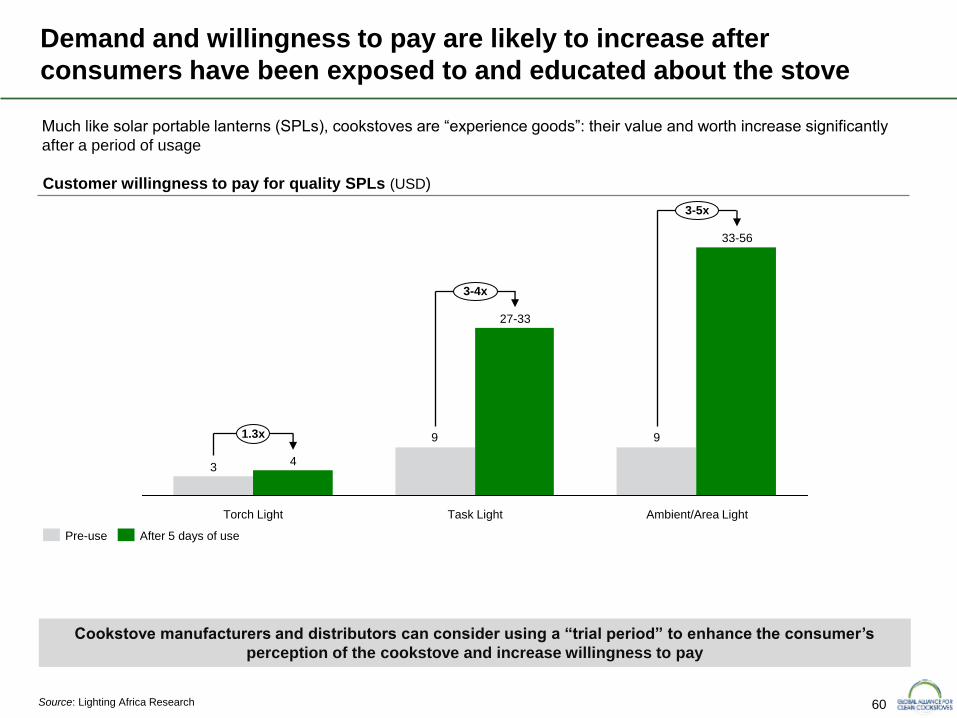
60
Demand and willingness to pay are likely to increase after
consumers have been exposed to and educated about the stove
Source: Lighting Africa Research
Customer willingness to pay for quality SPLs (USD)
99
34
27-33
33-56
3-5x
3-4x
Torch Light Task Light
1.3x
Ambient/Area Light
After 5 days of use Pre-use
Much like solar portable lanterns (SPLs), cookstoves are “experience goods”: their value and worth increase significantly
after a period of usage
Cookstove manufacturers and distributors can consider using a “trial period” to enhance the consumer’s
perception of the cookstove and increase willingness to pay
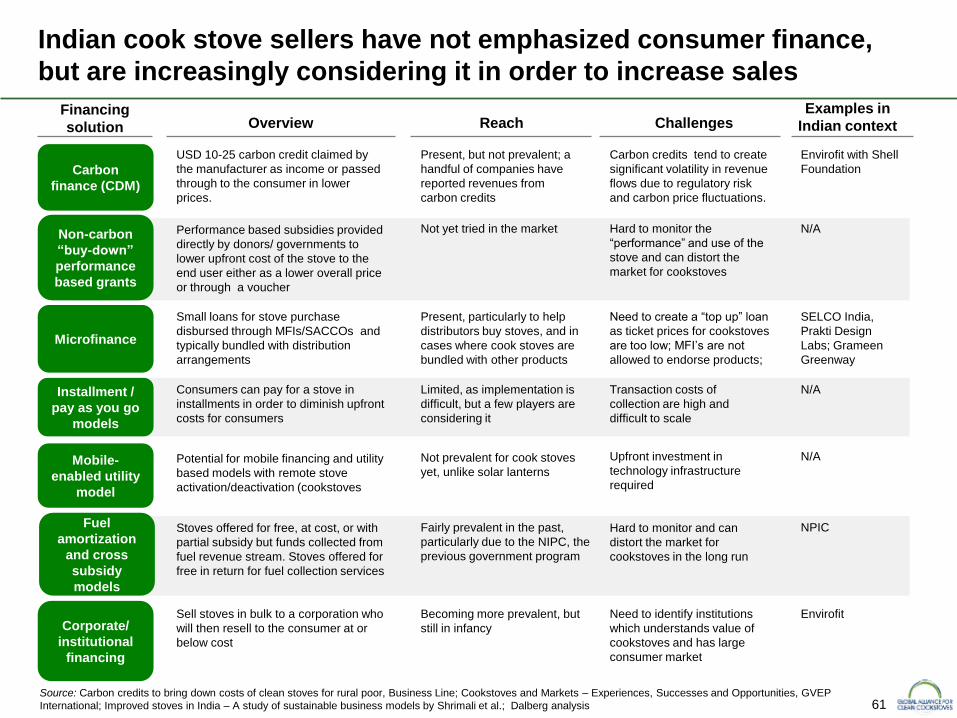
61
Indian cook stove sellers have not emphasized consumer finance,
but are increasingly considering it in order to increase sales
Source: Carbon credits to bring down costs of clean stoves for rural poor, Business Line; Cookstoves and Markets – Experiences, Successes and Opportunities, GVEP
International; Improved stoves in India – A study of sustainable business models by Shrimali et al.; Dalberg analysis
Carbon
finance (CDM)
Non-carbon
“buy-down”
performance
based grants
Microfinance
Installment /
pay as you go
models
Mobile-
enabled utility
model
USD 10-25 carbon credit claimed by
the manufacturer as income or passed
through to the consumer in lower
prices.
Performance based subsidies provided
directly by donors/ governments to
lower upfront cost of the stove to the
end user either as a lower overall price
or through a voucher
Consumers can pay for a stove in
installments in order to diminish upfront
costs for consumers
Potential for mobile financing and utility
based models with remote stove
activation/deactivation (cookstoves
Small loans for stove purchase
disbursed through MFIs/SACCOs and
typically bundled with distribution
arrangements
Fuel
amortization
and cross
subsidy
models
Stoves offered for free, at cost, or with
partial subsidy but funds collected from
fuel revenue stream. Stoves offered for
free in return for fuel collection services
Present, but not prevalent; a
handful of companies have
reported revenues from
carbon credits
Present, particularly to help
distributors buy stoves, and in
cases where cook stoves are
bundled with other products
SELCO India,
Prakti Design
Labs; Grameen
Greenway
Envirofit with Shell
Foundation
Not prevalent for cook stoves
yet, unlike solar lanterns
N/A
Fairly prevalent in the past,
particularly due to the NIPC, the
previous government program
NPIC
Limited, as implementation is
difficult, but a few players are
considering it
Not yet tried in the market N/A
N/A
Financing
solution Overview Reach Examples in
Indian context Challenges
Carbon credits tend to create
significant volatility in revenue
flows due to regulatory risk
and carbon price fluctuations.
Transaction costs of
collection are high and
difficult to scale
Hard to monitor the
“performance” and use of the
stove and can distort the
market for cookstoves
Need to create a “top up” loan
as ticket prices for cookstoves
are too low; MFI’s are not
allowed to endorse products;
Upfront investment in
technology infrastructure
required
Hard to monitor and can
distort the market for
cookstoves in the long run
Corporate/
institutional
financing
Sell stoves in bulk to a corporation who
will then resell to the consumer at or
below cost
Becoming more prevalent, but
still in infancy
Envirofit Need to identify institutions
which understands value of
cookstoves and has large
consumer market
62
Executive summary
Health, social and environmental impact
Sector mapping
Project approach
Macro environment
Consumer assessment
Sector mapping summary
Appendix
Table of contents
Cookstove policy environment
Cookstove industry
Fuel usage and trends
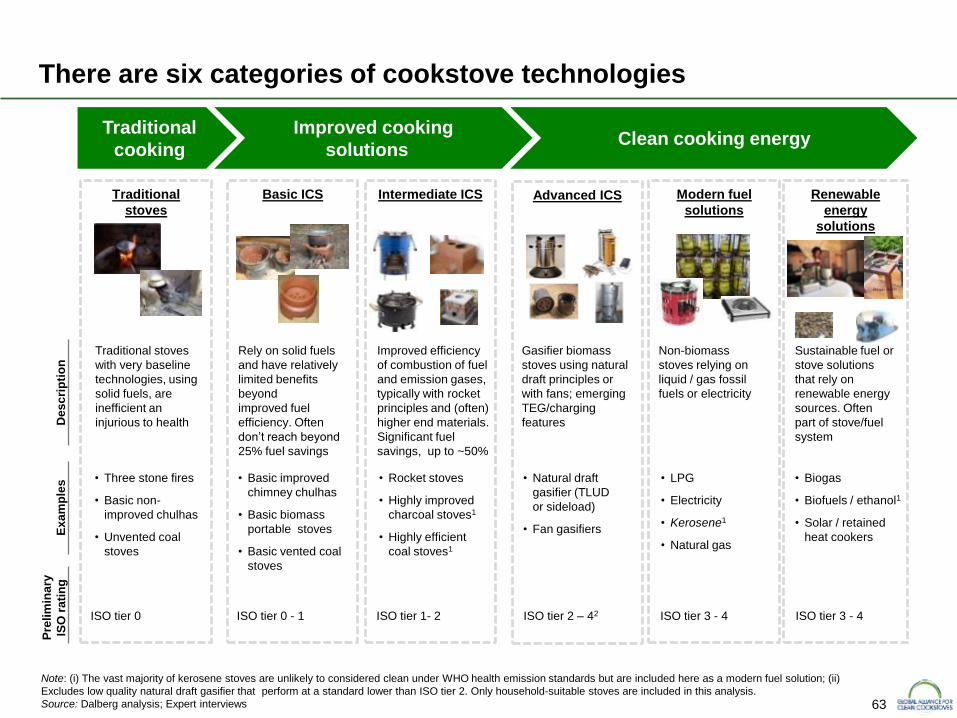
63
There are six categories of cookstove technologies
Traditional
cooking
Improved cooking
solutions Clean cooking energy
Ex
am
ple
s
Pre
lim
ina
ry
ISO
rati
ng
D
es
cri
pti
on
Basic ICS Intermediate ICS Traditional
stoves
Modern fuel
solutions
Rely on solid fuels
and have relatively
limited benefits
beyond
improved fuel
efficiency. Often
don’t reach beyond
25% fuel savings
Improved efficiency
of combustion of fuel
and emission gases,
typically with rocket
principles and (often)
higher end materials.
Significant fuel
savings, up to ~50%
• LPG
• Electricity
• Kerosene1
• Natural gas
Renewable
energy
solutions
• Biogas
• Biofuels / ethanol1
• Solar / retained
heat cookers
• Basic improved
chimney chulhas
• Basic biomass
portable stoves
• Basic vented coal
stoves
• Rocket stoves
• Highly improved
charcoal stoves1
• Highly efficient
coal stoves1
Non-biomass
stoves relying on
liquid / gas fossil
fuels or electricity
Sustainable fuel or
stove solutions
that rely on
renewable energy
sources. Often
part of stove/fuel
system
ISO tier 0 - 1 ISO tier 1- 2 ISO tier 3 - 4 ISO tier 3 - 4
Traditional stoves
with very baseline
technologies, using
solid fuels, are
inefficient an
injurious to health
• Three stone fires
• Basic non-
improved chulhas
• Unvented coal
stoves
ISO tier 0
Note: (i) The vast majority of kerosene stoves are unlikely to considered clean under WHO health emission standards but are included here as a modern fuel solution; (ii)
Excludes low quality natural draft gasifier that perform at a standard lower than ISO tier 2. Only household-suitable stoves are included in this analysis.
Source: Dalberg analysis; Expert interviews
Advanced ICS
• Natural draft
gasifier (TLUD
or sideload)
• Fan gasifiers
Gasifier biomass
stoves using natural
draft principles or
with fans; emerging
TEG/charging
features
ISO tier 2 – 42
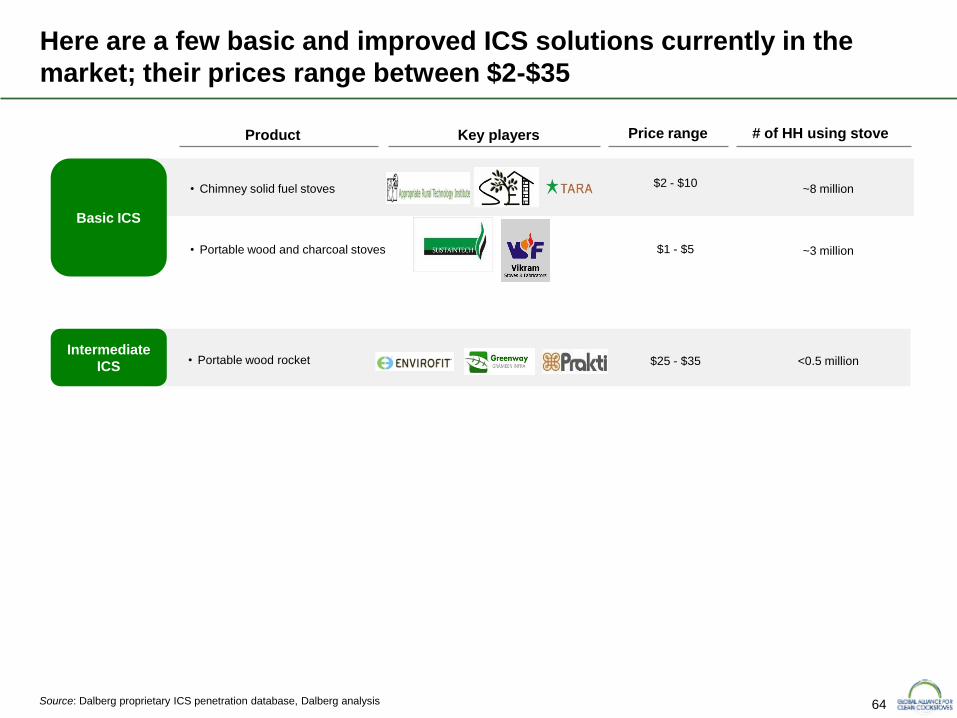
64
Product Key players # of HH using stove
Source: Dalberg proprietary ICS penetration database, Dalberg analysis
Here are a few basic and improved ICS solutions currently in the
market; their prices range between $2-$35
Basic ICS
Intermediate
ICS
• Chimney solid fuel stoves
• Portable wood rocket
• Portable wood and charcoal stoves
Price range
$2 - $10
$25 - $35 <0.5 million
$1 - $5
~8 million
~3 million
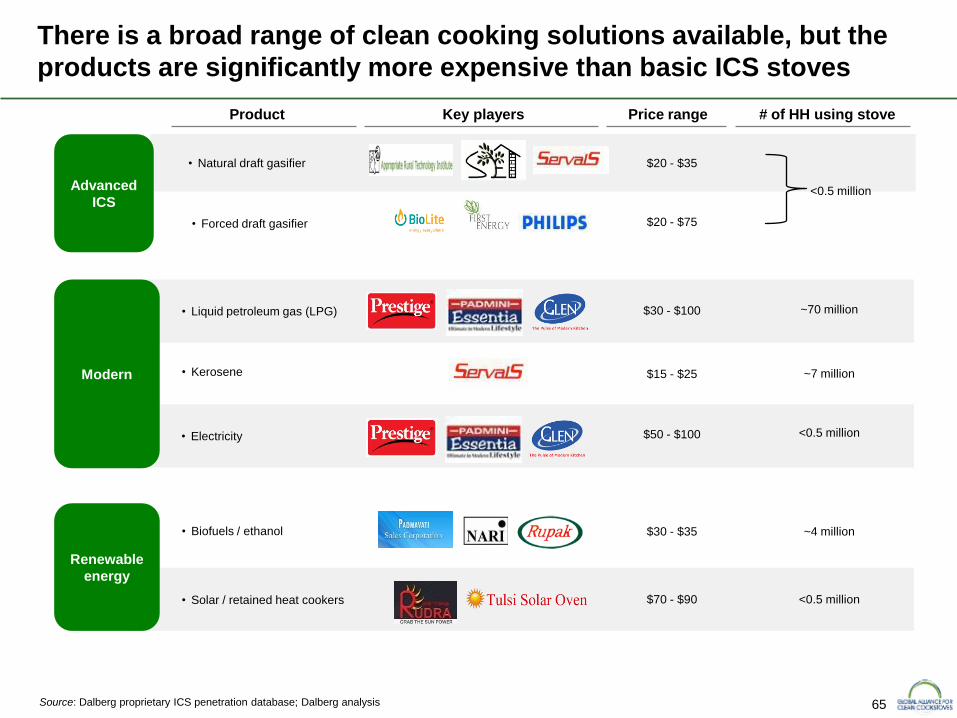
65 Source: Dalberg proprietary ICS penetration database; Dalberg analysis
There is a broad range of clean cooking solutions available, but the
products are significantly more expensive than basic ICS stoves
Modern
Renewable
energy
• Liquid petroleum gas (LPG)
• Kerosene
• Biofuels / ethanol
• Solar / retained heat cookers
• Electricity
Product Key players # of HH using stove Price range
$15 - $25
$30 - $35
$70 - $90
$30 - $100
$50 - $100
~70 million
~7 million
<0.5 million
~4 million
<0.5 million
• Natural draft gasifier
• Forced draft gasifier $20 - $75
$20 - $35
<0.5 million Advanced
ICS
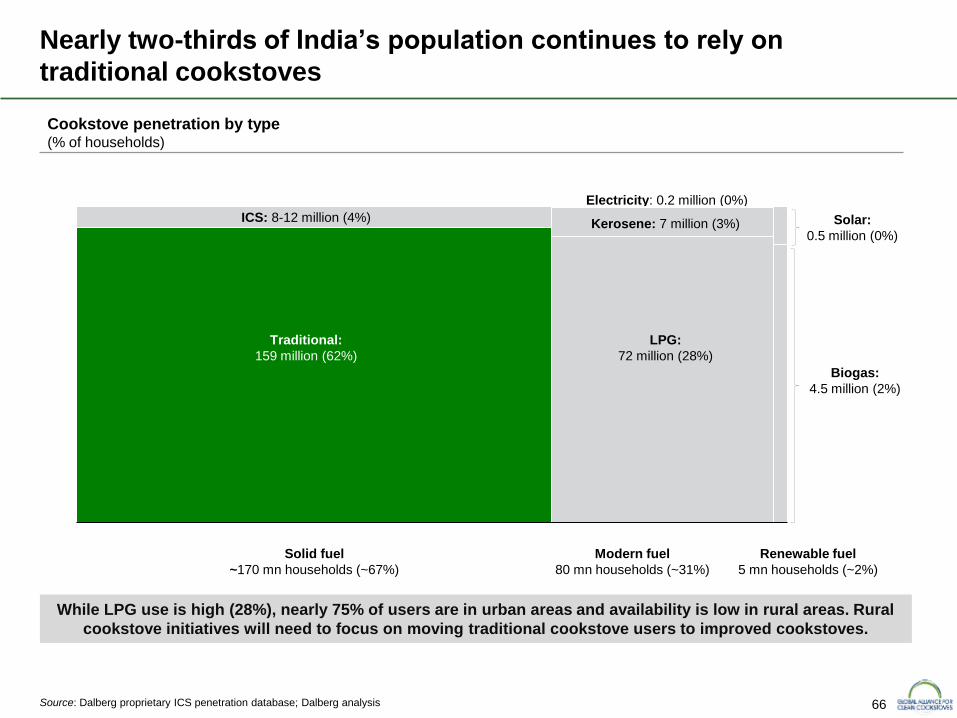
66
Electricity: 0.2 million (0%)
Nearly two-thirds of India’s population continues to rely on
traditional cookstoves
While LPG use is high (28%), nearly 75% of users are in urban areas and availability is low in rural areas. Rural
cookstove initiatives will need to focus on moving traditional cookstove users to improved cookstoves.
Source: Dalberg proprietary ICS penetration database; Dalberg analysis
Traditional:
159 million (62%)
Modern fuel
80 mn households (~31%)
Cookstove penetration by type (% of households)
Solid fuel
~170 mn households (~67%)
Renewable fuel
5 mn households (~2%)
ICS: 8-12 million (4%)
LPG:
72 million (28%)
Kerosene: 7 million (3%)
Biogas:
4.5 million (2%)
Solar:
0.5 million (0%)
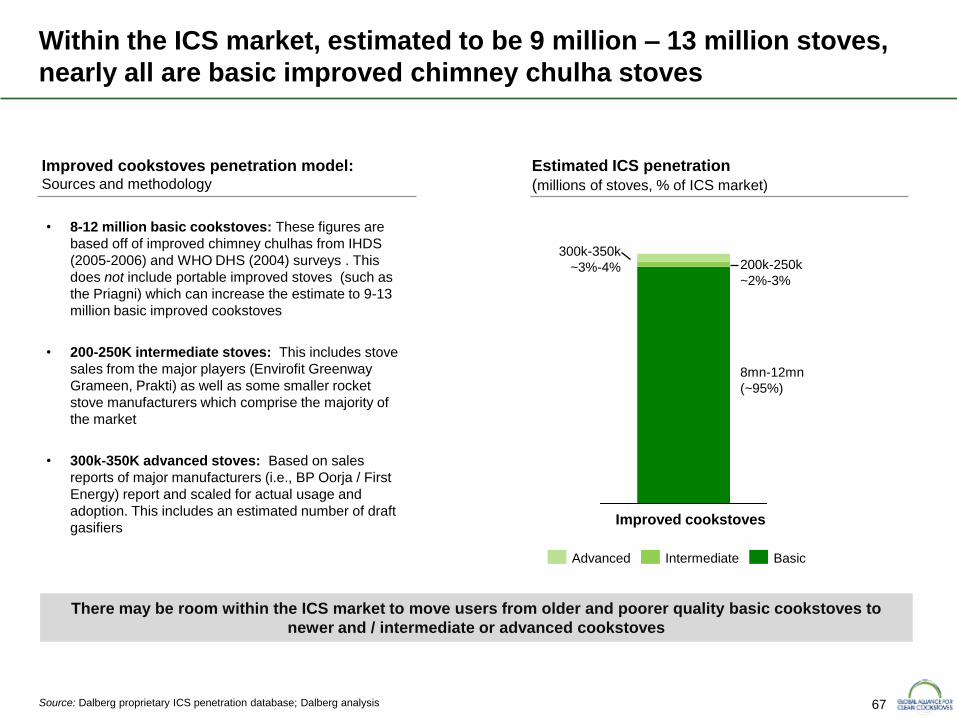
67
• 8-12 million basic cookstoves: These figures are
based off of improved chimney chulhas from IHDS
(2005-2006) and WHO DHS (2004) surveys . This
does not include portable improved stoves (such as
the Priagni) which can increase the estimate to 9-13
million basic improved cookstoves
• 200-250K intermediate stoves: This includes stove
sales from the major players (Envirofit Greenway
Grameen, Prakti) as well as some smaller rocket
stove manufacturers which comprise the majority of
the market
• 300k-350K advanced stoves: Based on sales
reports of major manufacturers (i.e., BP Oorja / First
Energy) report and scaled for actual usage and
adoption. This includes an estimated number of draft
gasifiers
Within the ICS market, estimated to be 9 million – 13 million stoves,
nearly all are basic improved chimney chulha stoves
Advanced Basic Intermediate
Estimated ICS penetration
(millions of stoves, % of ICS market)
There may be room within the ICS market to move users from older and poorer quality basic cookstoves to
newer and / intermediate or advanced cookstoves
Improved cookstoves
8mn-12mn
(~95%)
200k-250k
~2%-3%
300k-350k
~3%-4%
Improved cookstoves penetration model: Sources and methodology
Source: Dalberg proprietary ICS penetration database; Dalberg analysis
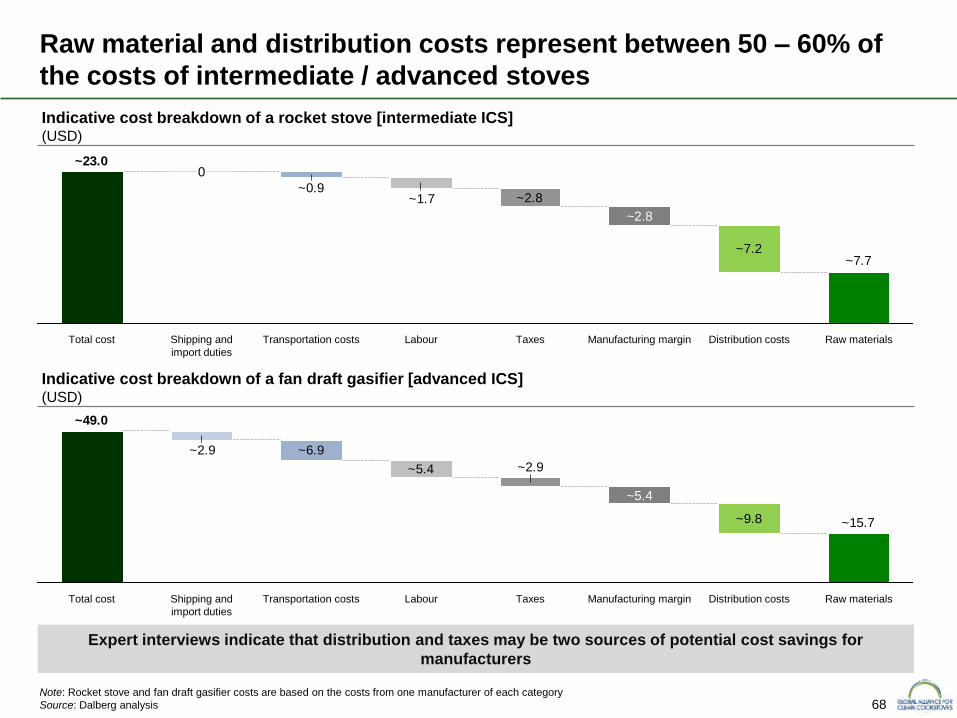
68
Raw material and distribution costs represent between 50 – 60% of
the costs of intermediate / advanced stoves
Note: Rocket stove and fan draft gasifier costs are based on the costs from one manufacturer of each category
Source: Dalberg analysis
Expert interviews indicate that distribution and taxes may be two sources of potential cost savings for
manufacturers
Indicative cost breakdown of a rocket stove [intermediate ICS] (USD)
~2.8
~7.2~7.7
~1.7~0.9
~23.0
Raw materials Distribution costs Manufacturing margin
~2.8
Taxes Labour Transportation costs Shipping and
import duties
0
Total cost
Indicative cost breakdown of a fan draft gasifier [advanced ICS] (USD)
~6.9
~5.4
~9.8 ~15.7
~2.9
~2.9
~49.0
Raw materials Distribution costs Manufacturing margin
~5.4
Taxes Labour Transportation costs Shipping and
import duties
Total cost
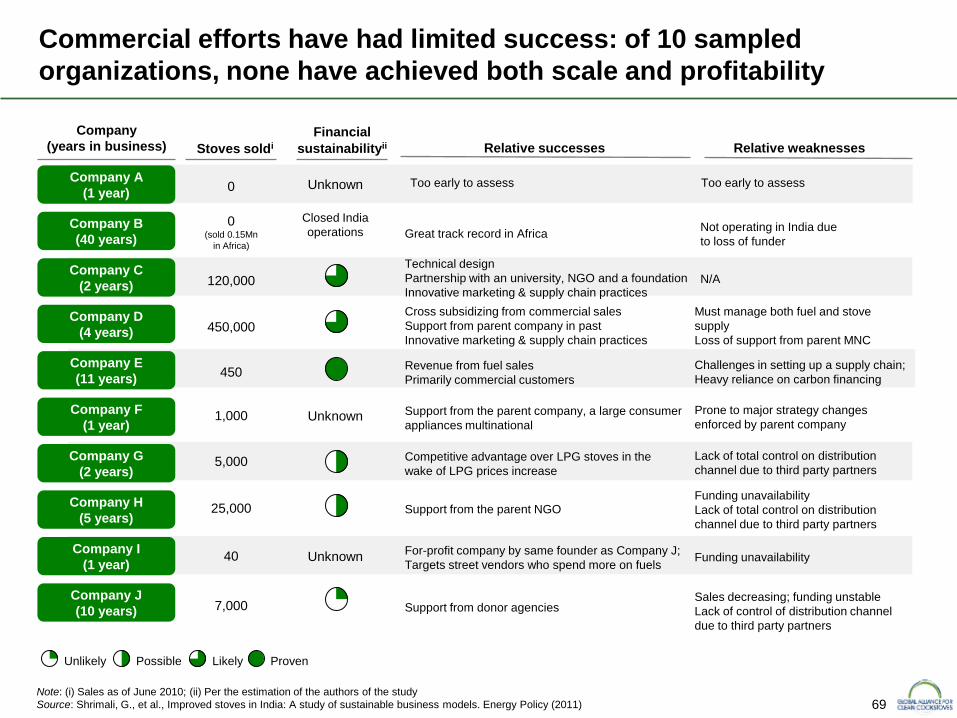
69
Great track record in Africa
Technical design
Partnership with an university, NGO and a foundation
Innovative marketing & supply chain practices
Cross subsidizing from commercial sales
Support from parent company in past
Innovative marketing & supply chain practices
Revenue from fuel sales
Primarily commercial customers
Support from the parent company, a large consumer
appliances multinational
Competitive advantage over LPG stoves in the
wake of LPG prices increase
Support from the parent NGO
For-profit company by same founder as Company J;
Targets street vendors who spend more on fuels
Support from donor agencies
Note: (i) Sales as of June 2010; (ii) Per the estimation of the authors of the study
Source: Shrimali, G., et al., Improved stoves in India: A study of sustainable business models. Energy Policy (2011)
Commercial efforts have had limited success: of 10 sampled
organizations, none have achieved both scale and profitability
Company A
(1 year)
Company B
(40 years)
Company C
(2 years)
Company D
(4 years)
Company E
(11 years)
Company F
(1 year)
Company G
(2 years)
Company H
(5 years)
Company I
(1 year)
Company J
(10 years)
Company
(years in business) Relative successes Relative weaknesses Stoves soldi
0
0 (sold 0.15Mn
in Africa)
120,000
450,000
450
1,000
5,000
25,000
40
7,000
Financial
sustainabilityii
Unknown
Closed India
operations
Unknown
Unknown
Unlikely Possible Likely Proven
Not operating in India due
to loss of funder
N/A
Must manage both fuel and stove
supply
Loss of support from parent MNC
Challenges in setting up a supply chain;
Heavy reliance on carbon financing
Prone to major strategy changes
enforced by parent company
Lack of total control on distribution
channel due to third party partners
Funding unavailability
Lack of total control on distribution
channel due to third party partners
Funding unavailability
Sales decreasing; funding unstable
Lack of control of distribution channel
due to third party partners
Too early to assess Too early to assess
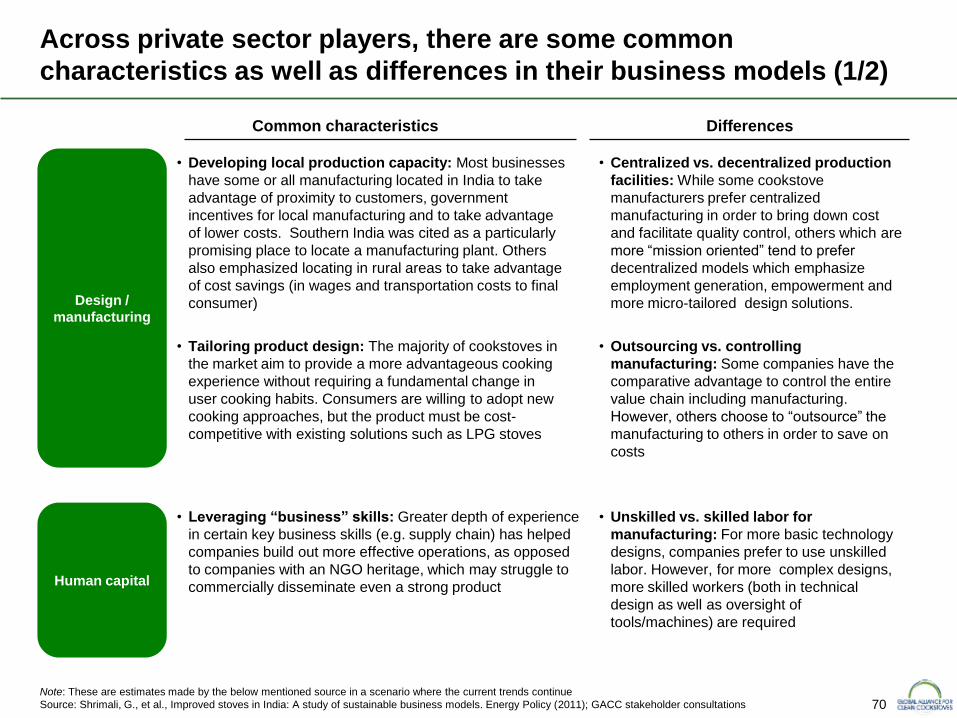
70
Across private sector players, there are some common
characteristics as well as differences in their business models (1/2)
Design /
manufacturing
• Developing local production capacity: Most businesses
have some or all manufacturing located in India to take
advantage of proximity to customers, government
incentives for local manufacturing and to take advantage
of lower costs. Southern India was cited as a particularly
promising place to locate a manufacturing plant. Others
also emphasized locating in rural areas to take advantage
of cost savings (in wages and transportation costs to final
consumer)
• Tailoring product design: The majority of cookstoves in
the market aim to provide a more advantageous cooking
experience without requiring a fundamental change in
user cooking habits. Consumers are willing to adopt new
cooking approaches, but the product must be cost-
competitive with existing solutions such as LPG stoves
Note: These are estimates made by the below mentioned source in a scenario where the current trends continue
Source: Shrimali, G., et al., Improved stoves in India: A study of sustainable business models. Energy Policy (2011); GACC stakeholder consultations
Human capital
• Leveraging “business” skills: Greater depth of experience
in certain key business skills (e.g. supply chain) has helped
companies build out more effective operations, as opposed
to companies with an NGO heritage, which may struggle to
commercially disseminate even a strong product
Common characteristics Differences
• Centralized vs. decentralized production
facilities: While some cookstove
manufacturers prefer centralized
manufacturing in order to bring down cost
and facilitate quality control, others which are
more “mission oriented” tend to prefer
decentralized models which emphasize
employment generation, empowerment and
more micro-tailored design solutions.
• Outsourcing vs. controlling
manufacturing: Some companies have the
comparative advantage to control the entire
value chain including manufacturing.
However, others choose to “outsource” the
manufacturing to others in order to save on
costs
• Unskilled vs. skilled labor for
manufacturing: For more basic technology
designs, companies prefer to use unskilled
labor. However, for more complex designs,
more skilled workers (both in technical
design as well as oversight of
tools/machines) are required
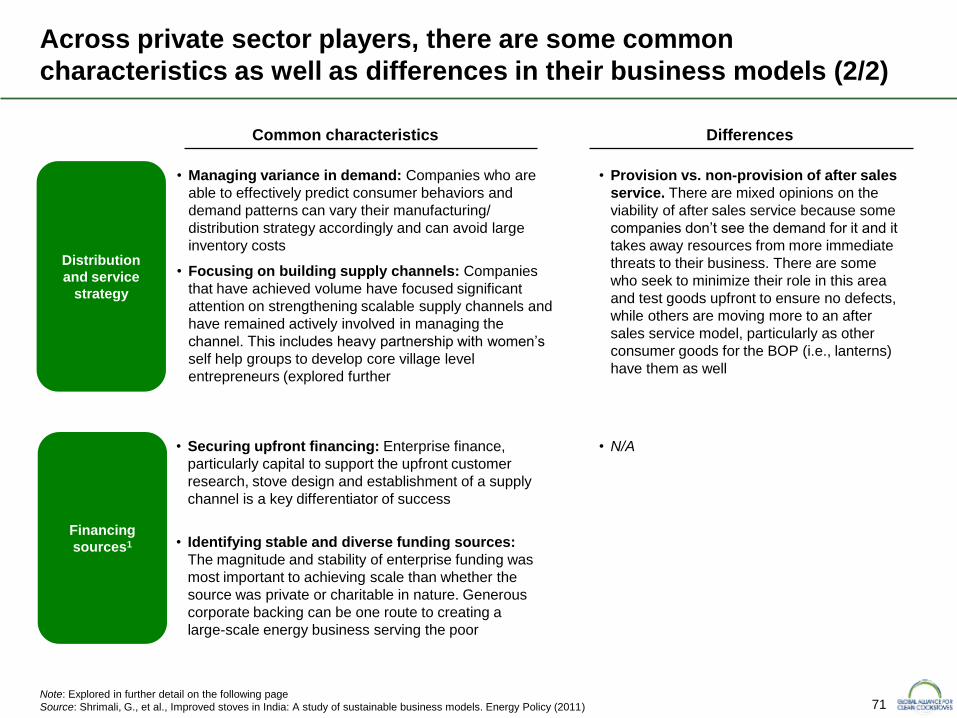
71
Across private sector players, there are some common
characteristics as well as differences in their business models (2/2)
Financing
sources1
• Securing upfront financing: Enterprise finance,
particularly capital to support the upfront customer
research, stove design and establishment of a supply
channel is a key differentiator of success
• Identifying stable and diverse funding sources:
The magnitude and stability of enterprise funding was
most important to achieving scale than whether the
source was private or charitable in nature. Generous
corporate backing can be one route to creating a
large-scale energy business serving the poor
Note: Explored in further detail on the following page
Source: Shrimali, G., et al., Improved stoves in India: A study of sustainable business models. Energy Policy (2011)
Distribution
and service
strategy
• Managing variance in demand: Companies who are
able to effectively predict consumer behaviors and
demand patterns can vary their manufacturing/
distribution strategy accordingly and can avoid large
inventory costs
• Focusing on building supply channels: Companies
that have achieved volume have focused significant
attention on strengthening scalable supply channels and
have remained actively involved in managing the
channel. This includes heavy partnership with women’s
self help groups to develop core village level
entrepreneurs (explored further
Common characteristics Differences
• N/A
• Provision vs. non-provision of after sales
service. There are mixed opinions on the
viability of after sales service because some
companies don’t see the demand for it and it
takes away resources from more immediate
threats to their business. There are some
who seek to minimize their role in this area
and test goods upfront to ensure no defects,
while others are moving more to an after
sales service model, particularly as other
consumer goods for the BOP (i.e., lanterns)
have them as well
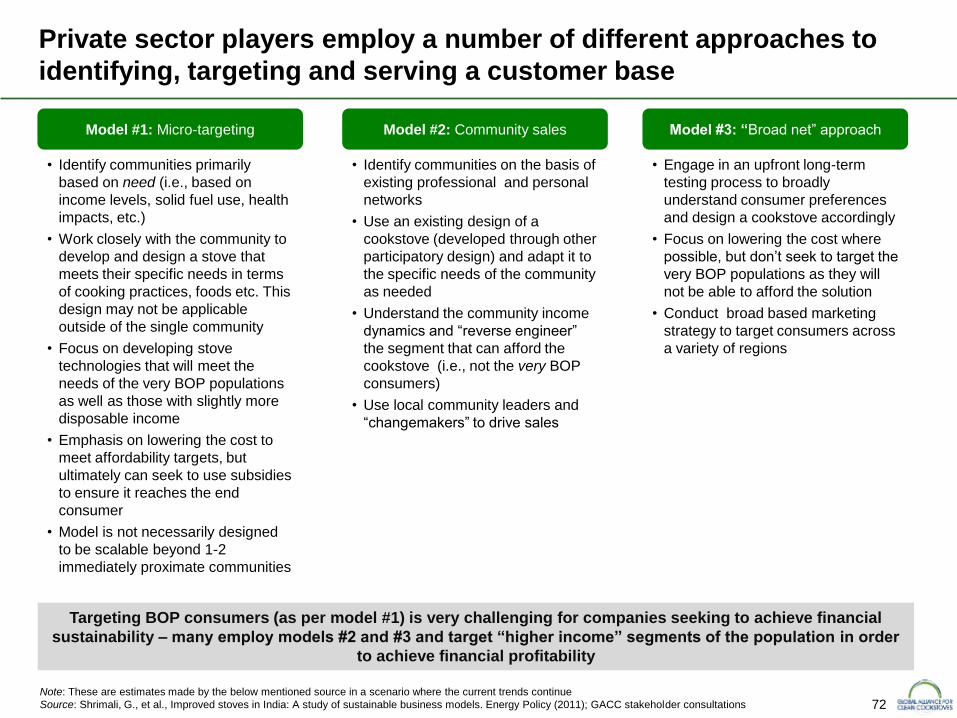
72
Private sector players employ a number of different approaches to
identifying, targeting and serving a customer base
Model #1: Micro-targeting
• Identify communities primarily
based on need (i.e., based on
income levels, solid fuel use, health
impacts, etc.)
• Work closely with the community to
develop and design a stove that
meets their specific needs in terms
of cooking practices, foods etc. This
design may not be applicable
outside of the single community
• Focus on developing stove
technologies that will meet the
needs of the very BOP populations
as well as those with slightly more
disposable income
• Emphasis on lowering the cost to
meet affordability targets, but
ultimately can seek to use subsidies
to ensure it reaches the end
consumer
• Model is not necessarily designed
to be scalable beyond 1-2
immediately proximate communities
Model #2: Community sales Model #3: “Broad net” approach
• Identify communities on the basis of
existing professional and personal
networks
• Use an existing design of a
cookstove (developed through other
participatory design) and adapt it to
the specific needs of the community
as needed
• Understand the community income
dynamics and “reverse engineer”
the segment that can afford the
cookstove (i.e., not the very BOP
consumers)
• Use local community leaders and
“changemakers” to drive sales
• Engage in an upfront long-term
testing process to broadly
understand consumer preferences
and design a cookstove accordingly
• Focus on lowering the cost where
possible, but don’t seek to target the
very BOP populations as they will
not be able to afford the solution
• Conduct broad based marketing
strategy to target consumers across
a variety of regions
Targeting BOP consumers (as per model #1) is very challenging for companies seeking to achieve financial
sustainability – many employ models #2 and #3 and target “higher income” segments of the population in order
to achieve financial profitability
Note: These are estimates made by the below mentioned source in a scenario where the current trends continue
Source: Shrimali, G., et al., Improved stoves in India: A study of sustainable business models. Energy Policy (2011); GACC stakeholder consultations
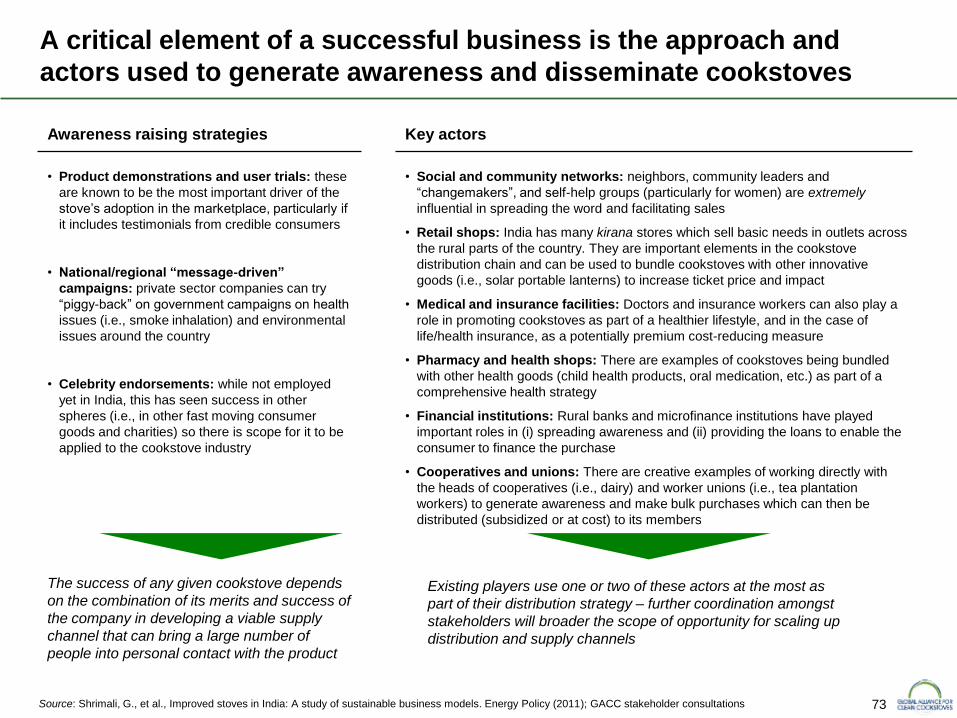
73
A critical element of a successful business is the approach and
actors used to generate awareness and disseminate cookstoves
• Product demonstrations and user trials: these
are known to be the most important driver of the
stove’s adoption in the marketplace, particularly if
it includes testimonials from credible consumers
• National/regional “message-driven”
campaigns: private sector companies can try
“piggy-back” on government campaigns on health
issues (i.e., smoke inhalation) and environmental
issues around the country
• Celebrity endorsements: while not employed
yet in India, this has seen success in other
spheres (i.e., in other fast moving consumer
goods and charities) so there is scope for it to be
applied to the cookstove industry
Source: Shrimali, G., et al., Improved stoves in India: A study of sustainable business models. Energy Policy (2011); GACC stakeholder consultations
• Social and community networks: neighbors, community leaders and
“changemakers”, and self-help groups (particularly for women) are extremely
influential in spreading the word and facilitating sales
• Retail shops: India has many kirana stores which sell basic needs in outlets across
the rural parts of the country. They are important elements in the cookstove
distribution chain and can be used to bundle cookstoves with other innovative
goods (i.e., solar portable lanterns) to increase ticket price and impact
• Medical and insurance facilities: Doctors and insurance workers can also play a
role in promoting cookstoves as part of a healthier lifestyle, and in the case of
life/health insurance, as a potentially premium cost-reducing measure
• Pharmacy and health shops: There are examples of cookstoves being bundled
with other health goods (child health products, oral medication, etc.) as part of a
comprehensive health strategy
• Financial institutions: Rural banks and microfinance institutions have played
important roles in (i) spreading awareness and (ii) providing the loans to enable the
consumer to finance the purchase
• Cooperatives and unions: There are creative examples of working directly with
the heads of cooperatives (i.e., dairy) and worker unions (i.e., tea plantation
workers) to generate awareness and make bulk purchases which can then be
distributed (subsidized or at cost) to its members
Awareness raising strategies Key actors
The success of any given cookstove depends
on the combination of its merits and success of
the company in developing a viable supply
channel that can bring a large number of
people into personal contact with the product
Existing players use one or two of these actors at the most as
part of their distribution strategy – further coordination amongst
stakeholders will broader the scope of opportunity for scaling up
distribution and supply channels
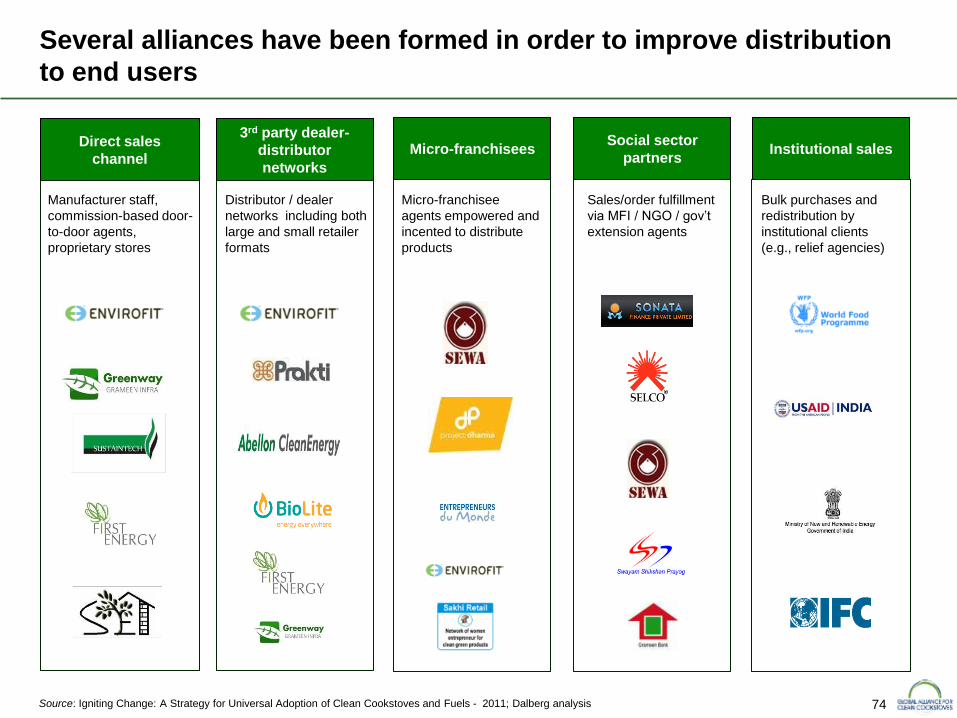
74
Several alliances have been formed in order to improve distribution
to end users
3rd party dealer-
distributor
networks
Social sector
partners Institutional sales Micro-franchisees
Direct sales
channel
Distributor / dealer
networks including both
large and small retailer
formats
Manufacturer staff,
commission-based door-
to-door agents,
proprietary stores
Bulk purchases and
redistribution by
institutional clients
(e.g., relief agencies)
Sales/order fulfillment
via MFI / NGO / gov’t
extension agents
Micro-franchisee
agents empowered and
incented to distribute
products
Source: Igniting Change: A Strategy for Universal Adoption of Clean Cookstoves and Fuels - 2011; Dalberg analysis
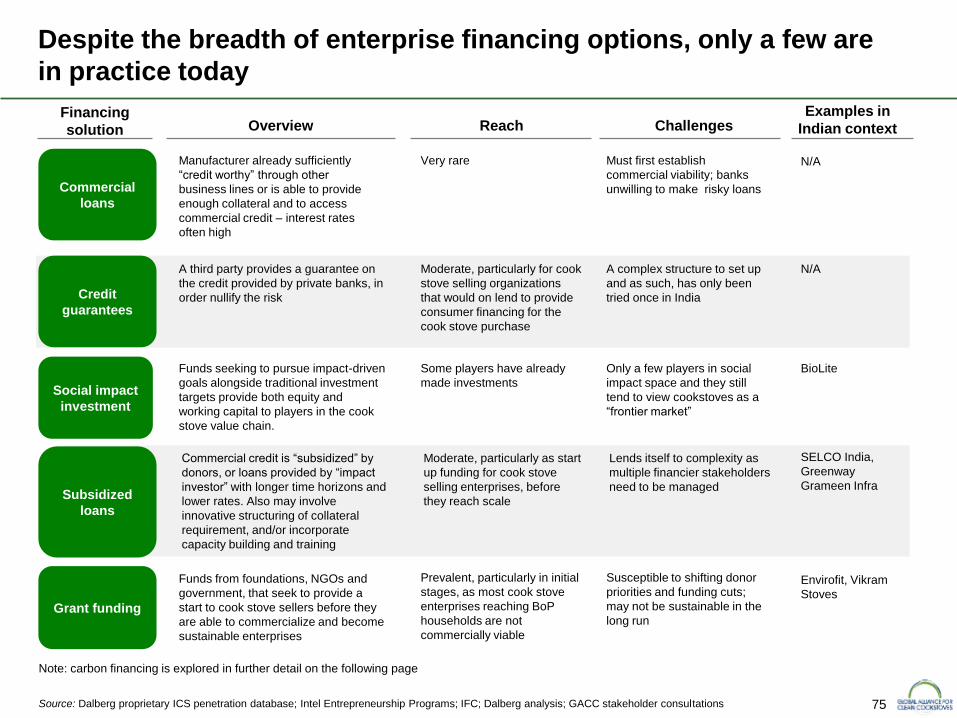
75
Despite the breadth of enterprise financing options, only a few are
in practice today
Financing
solution Overview Reach Examples in
Indian context
Source: Dalberg proprietary ICS penetration database; Intel Entrepreneurship Programs; IFC; Dalberg analysis; GACC stakeholder consultations
Social impact
investment
Funds seeking to pursue impact-driven
goals alongside traditional investment
targets provide both equity and
working capital to players in the cook
stove value chain.
Some players have already
made investments
BioLite
Commercial
loans
Subsidized
loans
Credit
guarantees
Manufacturer already sufficiently
“credit worthy” through other
business lines or is able to provide
enough collateral and to access
commercial credit – interest rates
often high
Commercial credit is “subsidized” by
donors, or loans provided by “impact
investor” with longer time horizons and
lower rates. Also may involve
innovative structuring of collateral
requirement, and/or incorporate
capacity building and training
Very rare
Moderate, particularly for cook
stove selling organizations
that would on lend to provide
consumer financing for the
cook stove purchase
Moderate, particularly as start
up funding for cook stove
selling enterprises, before
they reach scale
N/A
Grant funding
Prevalent, particularly in initial
stages, as most cook stove
enterprises reaching BoP
households are not
commercially viable
Funds from foundations, NGOs and
government, that seek to provide a
start to cook stove sellers before they
are able to commercialize and become
sustainable enterprises
Envirofit, Vikram
Stoves
N/A
SELCO India,
Greenway
Grameen Infra
A third party provides a guarantee on
the credit provided by private banks, in
order nullify the risk
Challenges
Only a few players in social
impact space and they still
tend to view cookstoves as a
“frontier market”
Must first establish
commercial viability; banks
unwilling to make risky loans
A complex structure to set up
and as such, has only been
tried once in India
Lends itself to complexity as
multiple financier stakeholders
need to be managed
Susceptible to shifting donor
priorities and funding cuts;
may not be sustainable in the
long run
Note: carbon financing is explored in further detail on the following page
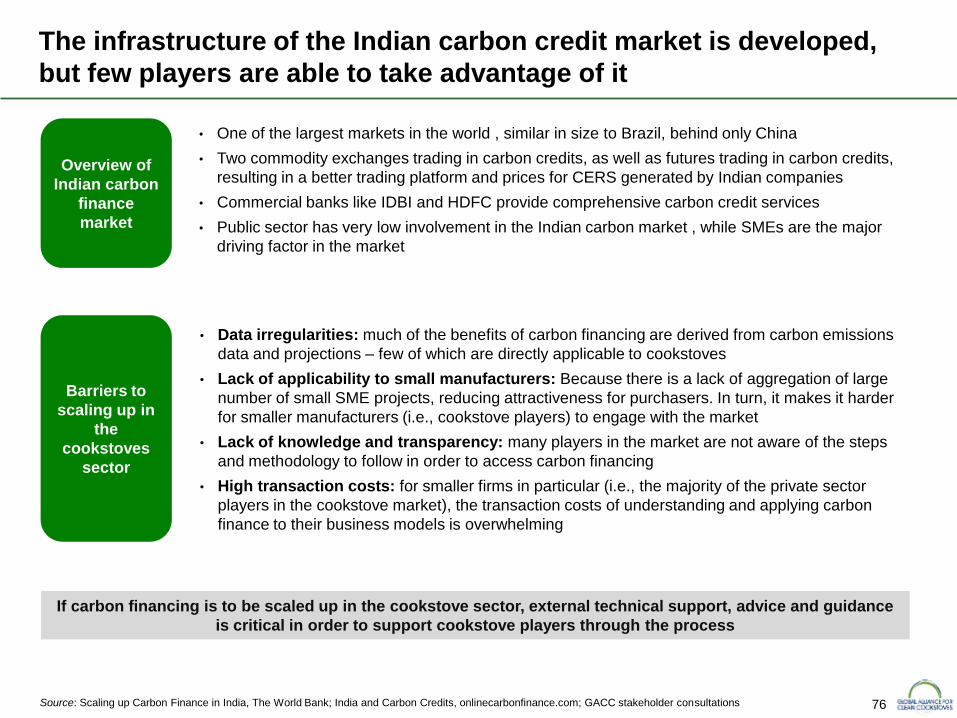
76 Source: Scaling up Carbon Finance in India, The World Bank; India and Carbon Credits, onlinecarbonfinance.com; GACC stakeholder consultations
The infrastructure of the Indian carbon credit market is developed,
but few players are able to take advantage of it
Overview of
Indian carbon
finance
market
• Data irregularities: much of the benefits of carbon financing are derived from carbon emissions
data and projections – few of which are directly applicable to cookstoves
• Lack of applicability to small manufacturers: Because there is a lack of aggregation of large
number of small SME projects, reducing attractiveness for purchasers. In turn, it makes it harder
for smaller manufacturers (i.e., cookstove players) to engage with the market
• Lack of knowledge and transparency: many players in the market are not aware of the steps
and methodology to follow in order to access carbon financing
• High transaction costs: for smaller firms in particular (i.e., the majority of the private sector
players in the cookstove market), the transaction costs of understanding and applying carbon
finance to their business models is overwhelming
Barriers to
scaling up in
the
cookstoves
sector
• One of the largest markets in the world , similar in size to Brazil, behind only China
• Two commodity exchanges trading in carbon credits, as well as futures trading in carbon credits,
resulting in a better trading platform and prices for CERS generated by Indian companies
• Commercial banks like IDBI and HDFC provide comprehensive carbon credit services
• Public sector has very low involvement in the Indian carbon market , while SMEs are the major
driving factor in the market
If carbon financing is to be scaled up in the cookstove sector, external technical support, advice and guidance
is critical in order to support cookstove players through the process
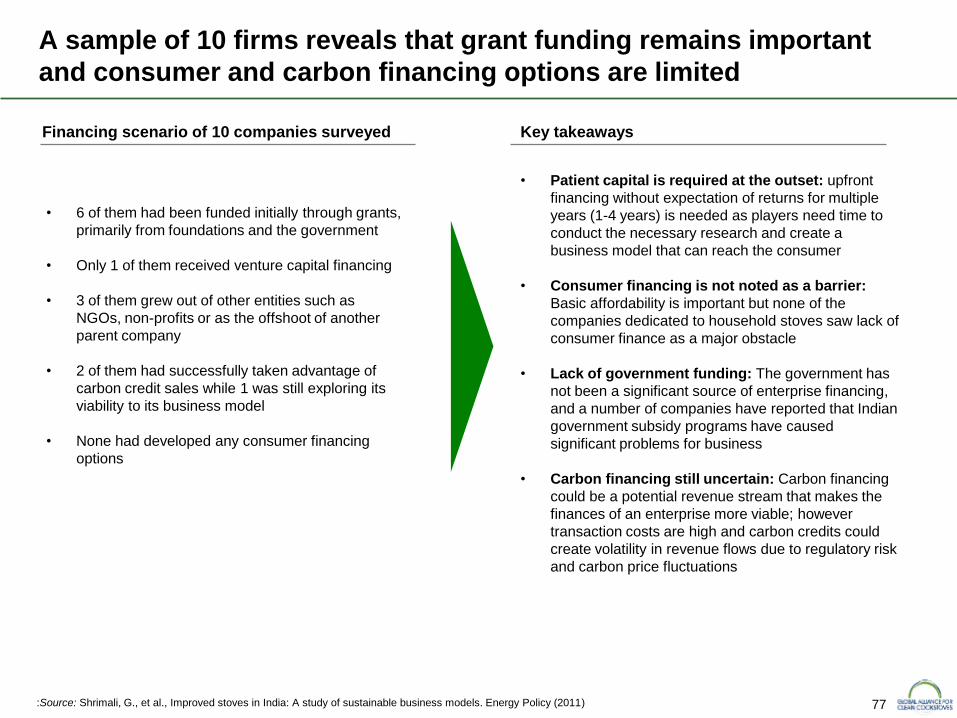
77
• 6 of them had been funded initially through grants,
primarily from foundations and the government
• Only 1 of them received venture capital financing
• 3 of them grew out of other entities such as
NGOs, non-profits or as the offshoot of another
parent company
• 2 of them had successfully taken advantage of
carbon credit sales while 1 was still exploring its
viability to its business model
• None had developed any consumer financing
options
:Source: Shrimali, G., et al., Improved stoves in India: A study of sustainable business models. Energy Policy (2011)
A sample of 10 firms reveals that grant funding remains important
and consumer and carbon financing options are limited
• Patient capital is required at the outset: upfront
financing without expectation of returns for multiple
years (1-4 years) is needed as players need time to
conduct the necessary research and create a
business model that can reach the consumer
• Consumer financing is not noted as a barrier:
Basic affordability is important but none of the
companies dedicated to household stoves saw lack of
consumer finance as a major obstacle
• Lack of government funding: The government has
not been a significant source of enterprise financing,
and a number of companies have reported that Indian
government subsidy programs have caused
significant problems for business
• Carbon financing still uncertain: Carbon financing
could be a potential revenue stream that makes the
finances of an enterprise more viable; however
transaction costs are high and carbon credits could
create volatility in revenue flows due to regulatory risk
and carbon price fluctuations
Financing scenario of 10 companies surveyed Key takeaways
78
Executive summary
Health, social and environmental impact
Sector mapping
Project approach
Macro environment
Consumer assessment
Sector mapping summary
Appendix
Table of contents
Cookstove policy environment
Cookstove industry
Fuel usage and trends
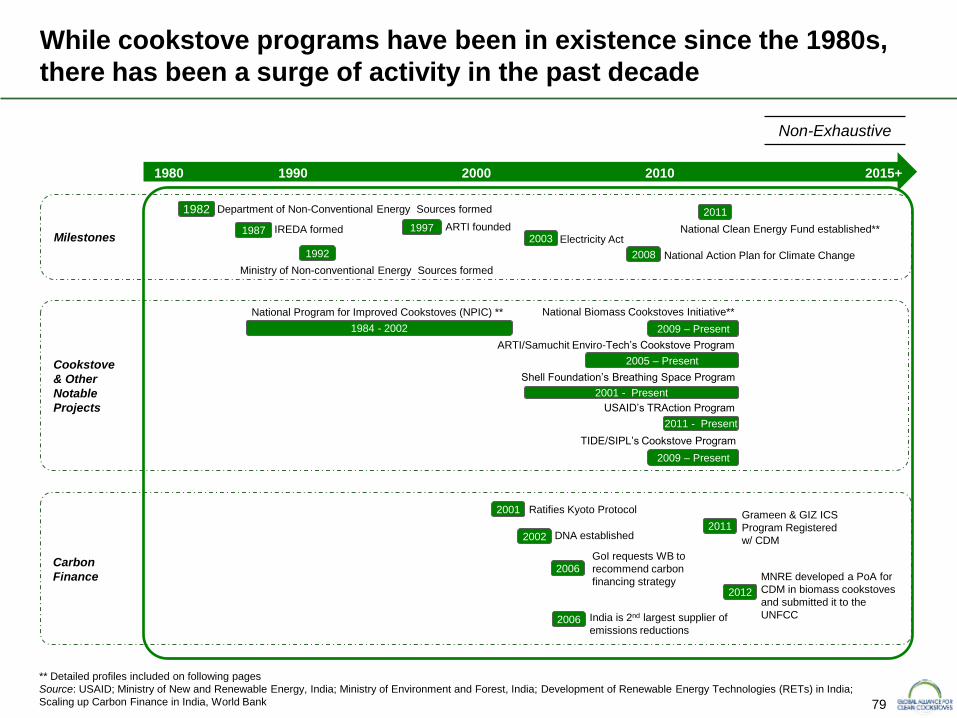
79
Milestones
Cookstove
& Other
Notable
Projects
Carbon
Finance
2003
1980 1990 2015+
1982
1997
2010 2000
Ratifies Kyoto Protocol
DNA established 2011
2009 – Present
2009 – Present
2005 – Present
1992
1984 - 2002
National Program for Improved Cookstoves (NPIC) ** National Biomass Cookstoves Initiative**
TIDE/SIPL’s Cookstove Program
Department of Non-Conventional Energy Sources formed
Ministry of Non-conventional Energy Sources formed
ARTI founded
USAID’s TRAction Program
2011
National Clean Energy Fund established** Electricity Act
2001 - Present
** Detailed profiles included on following pages
Source: USAID; Ministry of New and Renewable Energy, India; Ministry of Environment and Forest, India; Development of Renewable Energy Technologies (RETs) in India;
Scaling up Carbon Finance in India, World Bank
Non-Exhaustive
ARTI/Samuchit Enviro-Tech’s Cookstove Program
Shell Foundation’s Breathing Space Program
2011 - Present
GoI requests WB to
recommend carbon
financing strategy
Grameen & GIZ ICS
Program Registered
w/ CDM
2008 National Action Plan for Climate Change
1987 IREDA formed
While cookstove programs have been in existence since the 1980s,
there has been a surge of activity in the past decade
2012
MNRE developed a PoA for
CDM in biomass cookstoves
and submitted it to the
UNFCC India is 2nd largest supplier of
emissions reductions
2001
2002
2006
2006
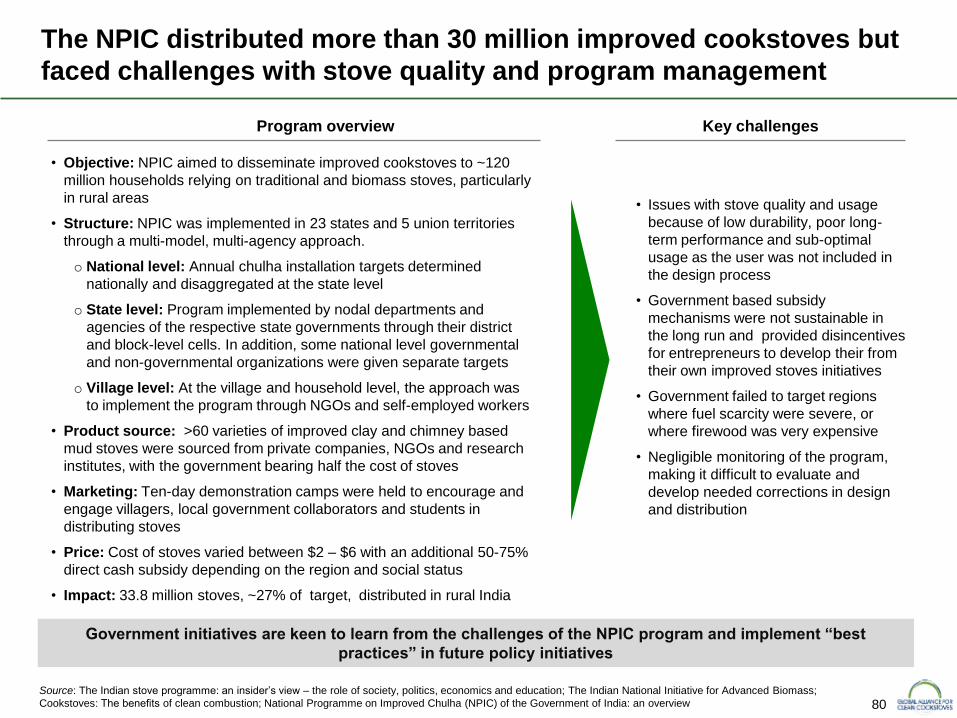
80
• Issues with stove quality and usage
because of low durability, poor long-
term performance and sub-optimal
usage as the user was not included in
the design process
• Government based subsidy
mechanisms were not sustainable in
the long run and provided disincentives
for entrepreneurs to develop their from
their own improved stoves initiatives
• Government failed to target regions
where fuel scarcity were severe, or
where firewood was very expensive
• Negligible monitoring of the program,
making it difficult to evaluate and
develop needed corrections in design
and distribution
The NPIC distributed more than 30 million improved cookstoves but
faced challenges with stove quality and program management
Program overview Key challenges
• Objective: NPIC aimed to disseminate improved cookstoves to ~120
million households relying on traditional and biomass stoves, particularly
in rural areas
• Structure: NPIC was implemented in 23 states and 5 union territories
through a multi-model, multi-agency approach.
o National level: Annual chulha installation targets determined
nationally and disaggregated at the state level
o State level: Program implemented by nodal departments and
agencies of the respective state governments through their district
and block-level cells. In addition, some national level governmental
and non-governmental organizations were given separate targets
o Village level: At the village and household level, the approach was
to implement the program through NGOs and self-employed workers
• Product source: >60 varieties of improved clay and chimney based
mud stoves were sourced from private companies, NGOs and research
institutes, with the government bearing half the cost of stoves
• Marketing: Ten-day demonstration camps were held to encourage and
engage villagers, local government collaborators and students in
distributing stoves
• Price: Cost of stoves varied between $2 – $6 with an additional 50-75%
direct cash subsidy depending on the region and social status
• Impact: 33.8 million stoves, ~27% of target, distributed in rural India
Source: The Indian stove programme: an insider’s view – the role of society, politics, economics and education; The Indian National Initiative for Advanced Biomass;
Cookstoves: The benefits of clean combustion; National Programme on Improved Chulha (NPIC) of the Government of India: an overview
Government initiatives are keen to learn from the challenges of the NPIC program and implement “best
practices” in future policy initiatives
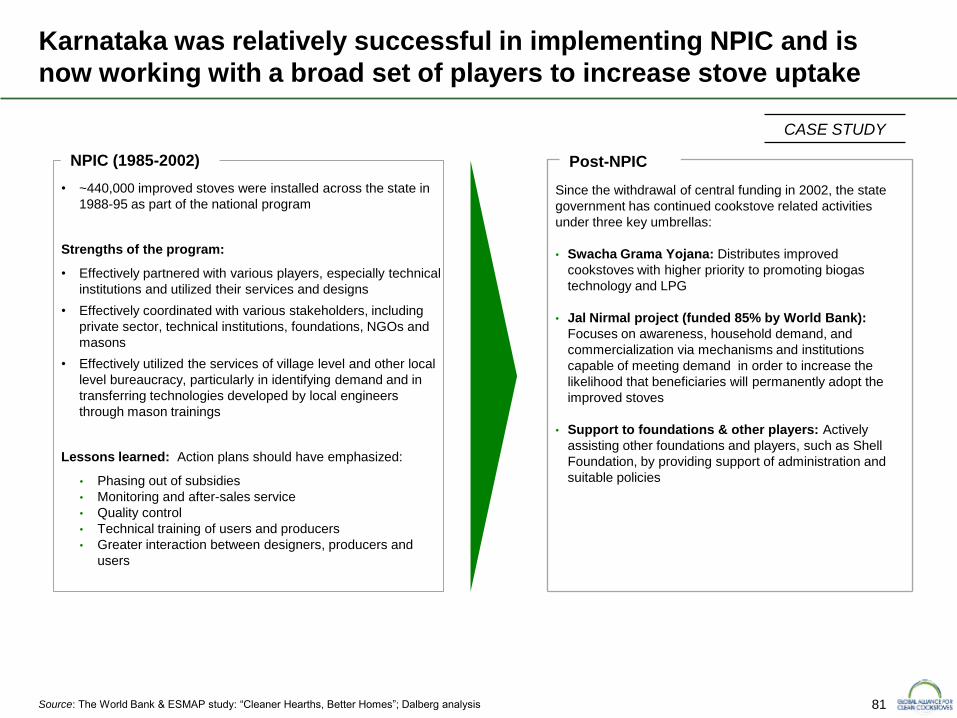
81
Since the withdrawal of central funding in 2002, the state
government has continued cookstove related activities
under three key umbrellas:
• Swacha Grama Yojana: Distributes improved
cookstoves with higher priority to promoting biogas
technology and LPG
• Jal Nirmal project (funded 85% by World Bank):
Focuses on awareness, household demand, and
commercialization via mechanisms and institutions
capable of meeting demand in order to increase the
likelihood that beneficiaries will permanently adopt the
improved stoves
• Support to foundations & other players: Actively
assisting other foundations and players, such as Shell
Foundation, by providing support of administration and
suitable policies
• ~440,000 improved stoves were installed across the state in
1988-95 as part of the national program
Strengths of the program:
• Effectively partnered with various players, especially technical
institutions and utilized their services and designs
• Effectively coordinated with various stakeholders, including
private sector, technical institutions, foundations, NGOs and
masons
• Effectively utilized the services of village level and other local
level bureaucracy, particularly in identifying demand and in
transferring technologies developed by local engineers
through mason trainings
Lessons learned: Action plans should have emphasized:
• Phasing out of subsidies
• Monitoring and after-sales service
• Quality control
• Technical training of users and producers
• Greater interaction between designers, producers and
users
NPIC (1985-2002)
Source: The World Bank & ESMAP study: “Cleaner Hearths, Better Homes”; Dalberg analysis
Karnataka was relatively successful in implementing NPIC and is
now working with a broad set of players to increase stove uptake
Post-NPIC
CASE STUDY
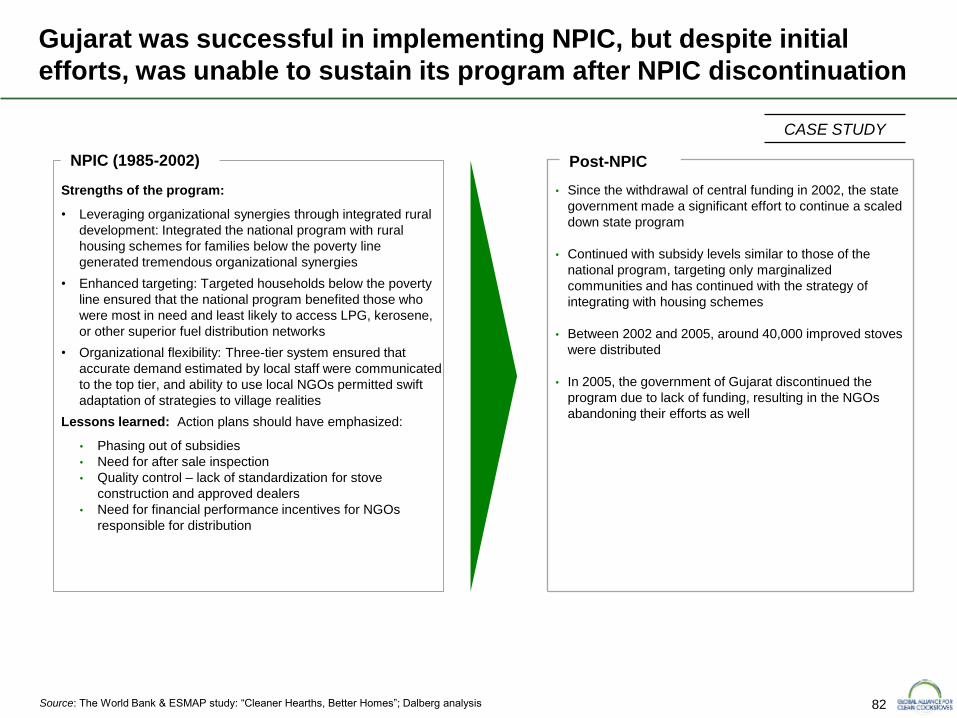
82
• Since the withdrawal of central funding in 2002, the state
government made a significant effort to continue a scaled
down state program
• Continued with subsidy levels similar to those of the
national program, targeting only marginalized
communities and has continued with the strategy of
integrating with housing schemes
• Between 2002 and 2005, around 40,000 improved stoves
were distributed
• In 2005, the government of Gujarat discontinued the
program due to lack of funding, resulting in the NGOs
abandoning their efforts as well
Strengths of the program:
• Leveraging organizational synergies through integrated rural
development: Integrated the national program with rural
housing schemes for families below the poverty line
generated tremendous organizational synergies
• Enhanced targeting: Targeted households below the poverty
line ensured that the national program benefited those who
were most in need and least likely to access LPG, kerosene,
or other superior fuel distribution networks
• Organizational flexibility: Three-tier system ensured that
accurate demand estimated by local staff were communicated
to the top tier, and ability to use local NGOs permitted swift
adaptation of strategies to village realities
Lessons learned: Action plans should have emphasized:
• Phasing out of subsidies
• Need for after sale inspection
• Quality control – lack of standardization for stove
construction and approved dealers
• Need for financial performance incentives for NGOs
responsible for distribution
Source: The World Bank & ESMAP study: “Cleaner Hearths, Better Homes”; Dalberg analysis
Gujarat was successful in implementing NPIC, but despite initial
efforts, was unable to sustain its program after NPIC discontinuation
CASE STUDY
NPIC (1985-2002) Post-NPIC
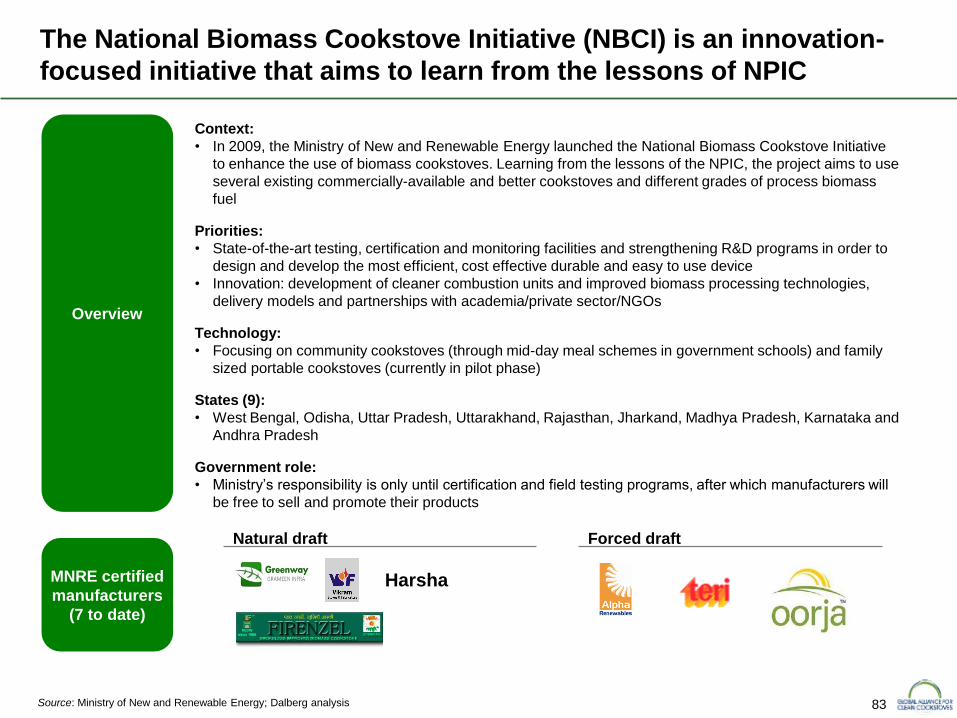
83 Source: Ministry of New and Renewable Energy; Dalberg analysis
The National Biomass Cookstove Initiative (NBCI) is an innovation-
focused initiative that aims to learn from the lessons of NPIC
Overview
Context:
• In 2009, the Ministry of New and Renewable Energy launched the National Biomass Cookstove Initiative
to enhance the use of biomass cookstoves. Learning from the lessons of the NPIC, the project aims to use
several existing commercially-available and better cookstoves and different grades of process biomass
fuel
Priorities:
• State-of-the-art testing, certification and monitoring facilities and strengthening R&D programs in order to
design and develop the most efficient, cost effective durable and easy to use device
• Innovation: development of cleaner combustion units and improved biomass processing technologies,
delivery models and partnerships with academia/private sector/NGOs
Technology:
• Focusing on community cookstoves (through mid-day meal schemes in government schools) and family
sized portable cookstoves (currently in pilot phase)
States (9):
• West Bengal, Odisha, Uttar Pradesh, Uttarakhand, Rajasthan, Jharkand, Madhya Pradesh, Karnataka and
Andhra Pradesh
Government role:
• Ministry’s responsibility is only until certification and field testing programs, after which manufacturers will
be free to sell and promote their products
MNRE certified
manufacturers
(7 to date)
Harsha
Natural draft Forced draft
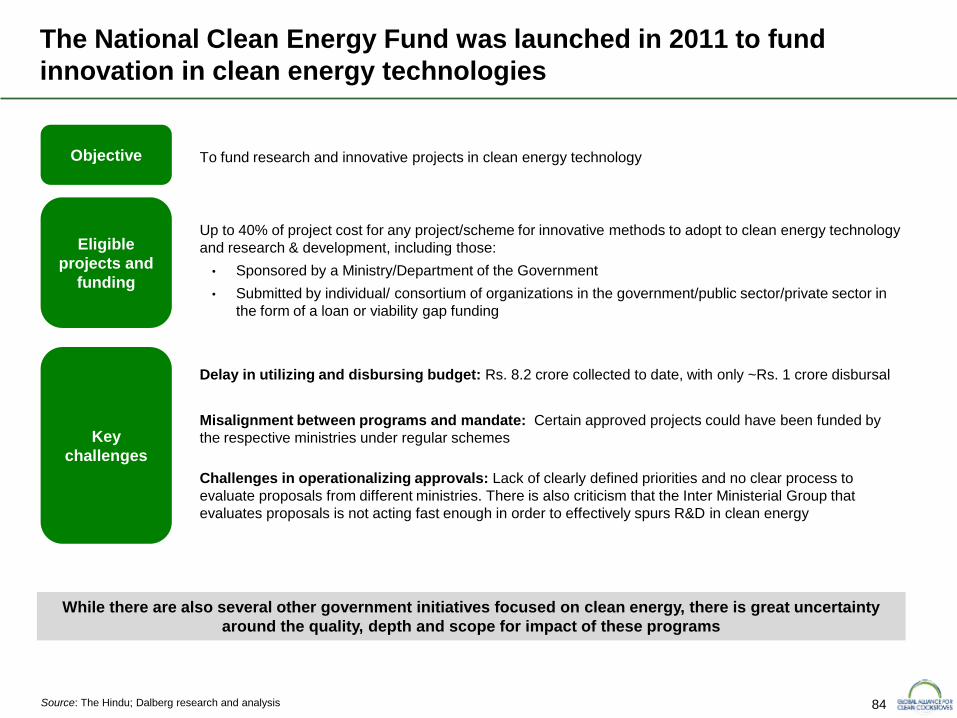
84
To fund research and innovative projects in clean energy technology
Source: The Hindu; Dalberg research and analysis
The National Clean Energy Fund was launched in 2011 to fund
innovation in clean energy technologies
Objective
Up to 40% of project cost for any project/scheme for innovative methods to adopt to clean energy technology
and research & development, including those:
• Sponsored by a Ministry/Department of the Government
• Submitted by individual/ consortium of organizations in the government/public sector/private sector in
the form of a loan or viability gap funding
Eligible
projects and
funding
Delay in utilizing and disbursing budget: Rs. 8.2 crore collected to date, with only ~Rs. 1 crore disbursal
Misalignment between programs and mandate: Certain approved projects could have been funded by
the respective ministries under regular schemes
Challenges in operationalizing approvals: Lack of clearly defined priorities and no clear process to
evaluate proposals from different ministries. There is also criticism that the Inter Ministerial Group that
evaluates proposals is not acting fast enough in order to effectively spurs R&D in clean energy
Key
challenges
While there are also several other government initiatives focused on clean energy, there is great uncertainty
around the quality, depth and scope for impact of these programs
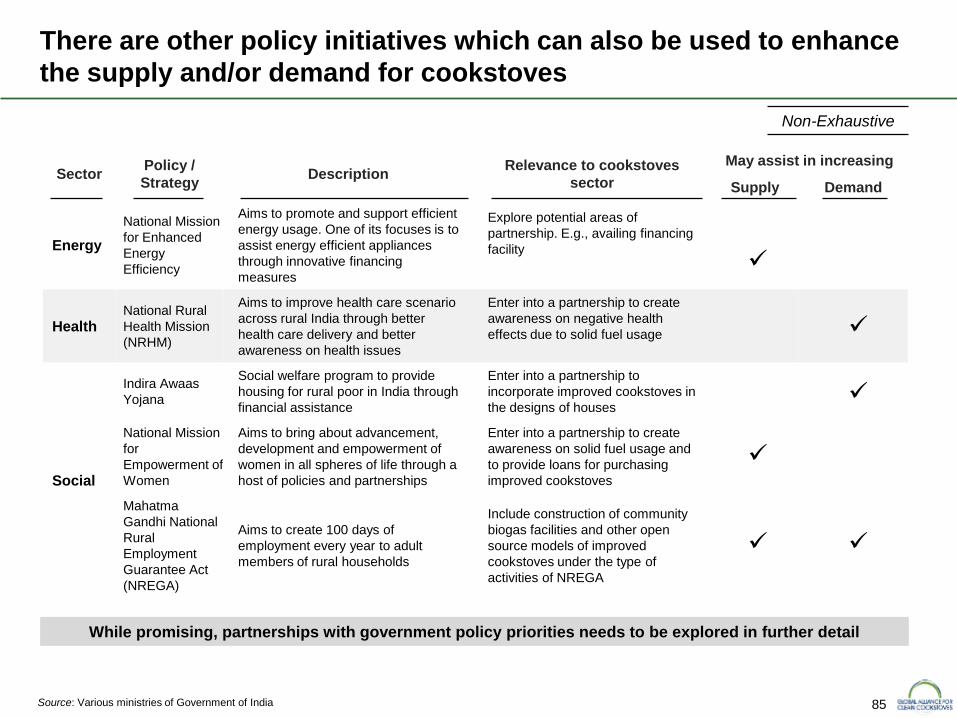
85
There are other policy initiatives which can also be used to enhance
the supply and/or demand for cookstoves
Sector Policy /
Strategy Description
Relevance to cookstoves
sector
May assist in increasing
Supply Demand
Energy
National Mission
for Enhanced
Energy
Efficiency
Aims to promote and support efficient
energy usage. One of its focuses is to
assist energy efficient appliances
through innovative financing
measures
Explore potential areas of
partnership. E.g., availing financing
facility
Health National Rural
Health Mission
(NRHM)
Aims to improve health care scenario
across rural India through better
health care delivery and better
awareness on health issues
Enter into a partnership to create
awareness on negative health
effects due to solid fuel usage
Social
Indira Awaas
Yojana
Social welfare program to provide
housing for rural poor in India through
financial assistance
Enter into a partnership to
incorporate improved cookstoves in
the designs of houses
National Mission
for
Empowerment of
Women
Aims to bring about advancement,
development and empowerment of
women in all spheres of life through a
host of policies and partnerships
Enter into a partnership to create
awareness on solid fuel usage and
to provide loans for purchasing
improved cookstoves
Mahatma
Gandhi National
Rural
Employment
Guarantee Act
(NREGA)
Aims to create 100 days of
employment every year to adult
members of rural households
Include construction of community
biogas facilities and other open
source models of improved
cookstoves under the type of
activities of NREGA
Source: Various ministries of Government of India
While promising, partnerships with government policy priorities needs to be explored in further detail
Non-Exhaustive
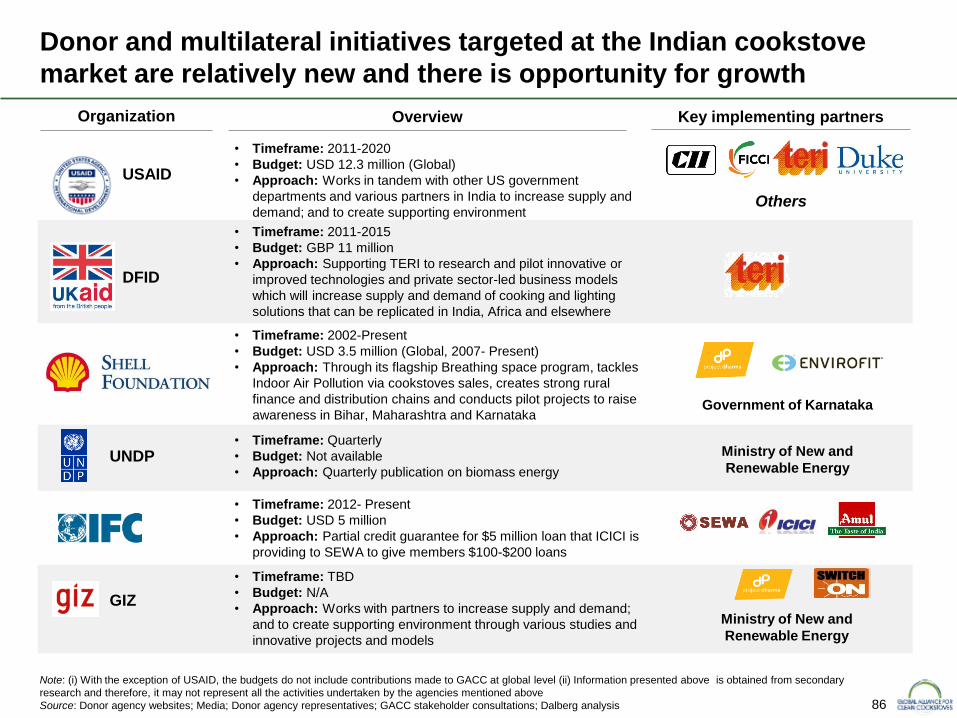
86
Donor and multilateral initiatives targeted at the Indian cookstove
market are relatively new and there is opportunity for growth
Organization Overview Key implementing partners
USAID
DFID
• Timeframe: 2011-2020
• Budget: USD 12.3 million (Global)
• Approach: Works in tandem with other US government
departments and various partners in India to increase supply and
demand; and to create supporting environment
• Timeframe: 2011-2015
• Budget: GBP 11 million
• Approach: Supporting TERI to research and pilot innovative or
improved technologies and private sector-led business models
which will increase supply and demand of cooking and lighting
solutions that can be replicated in India, Africa and elsewhere
• Timeframe: 2002-Present
• Budget: USD 3.5 million (Global, 2007- Present)
• Approach: Through its flagship Breathing space program, tackles
Indoor Air Pollution via cookstoves sales, creates strong rural
finance and distribution chains and conducts pilot projects to raise
awareness in Bihar, Maharashtra and Karnataka
UNDP • Timeframe: Quarterly
• Budget: Not available
• Approach: Quarterly publication on biomass energy
Ministry of New and
Renewable Energy
• Timeframe: 2012- Present
• Budget: USD 5 million
• Approach: Partial credit guarantee for $5 million loan that ICICI is
providing to SEWA to give members $100-$200 loans
GIZ
• Timeframe: TBD
• Budget: N/A
• Approach: Works with partners to increase supply and demand;
and to create supporting environment through various studies and
innovative projects and models
Note: (i) With the exception of USAID, the budgets do not include contributions made to GACC at global level (ii) Information presented above is obtained from secondary
research and therefore, it may not represent all the activities undertaken by the agencies mentioned above
Source: Donor agency websites; Media; Donor agency representatives; GACC stakeholder consultations; Dalberg analysis
Others
Government of Karnataka
Ministry of New and
Renewable Energy
87
Executive summary
Health, social and environmental impact
Sector mapping
Project approach
Macro environment
Consumer assessment
Sector mapping summary
Appendix
Table of contents
Cookstove policy environment
Cookstove industry
Fuel usage and trends
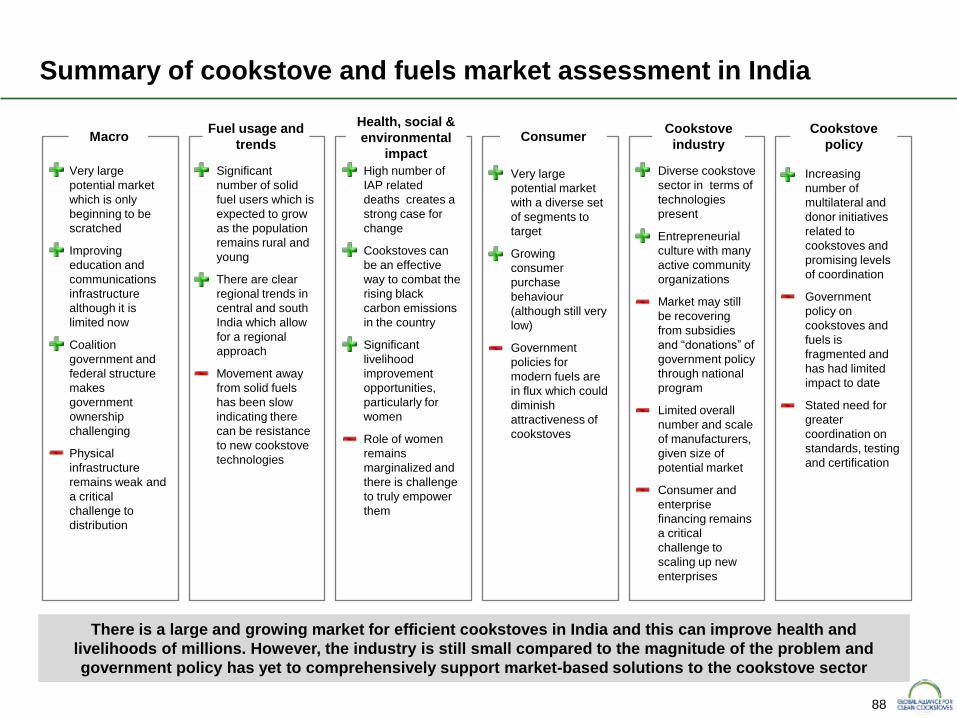
88
Significant
number of solid
fuel users which is
expected to grow
as the population
remains rural and
young
There are clear
regional trends in
central and south
India which allow
for a regional
approach
Movement away
from solid fuels
has been slow
indicating there
can be resistance
to new cookstove
technologies
Summary of cookstove and fuels market assessment in India
Very large
potential market
which is only
beginning to be
scratched
Improving
education and
communications
infrastructure
although it is
limited now
Coalition
government and
federal structure
makes
government
ownership
challenging
Physical
infrastructure
remains weak and
a critical
challenge to
distribution
Macro Fuel usage and
trends
High number of
IAP related
deaths creates a
strong case for
change
Cookstoves can
be an effective
way to combat the
rising black
carbon emissions
in the country
Significant
livelihood
improvement
opportunities,
particularly for
women
Role of women
remains
marginalized and
there is challenge
to truly empower
them
Health, social &
environmental
impact
Very large
potential market
with a diverse set
of segments to
target
Growing
consumer
purchase
behaviour
(although still very
low)
Government
policies for
modern fuels are
in flux which could
diminish
attractiveness of
cookstoves
Consumer
Diverse cookstove
sector in terms of
technologies
present
Entrepreneurial
culture with many
active community
organizations
Market may still
be recovering
from subsidies
and “donations” of
government policy
through national
program
Limited overall
number and scale
of manufacturers,
given size of
potential market
Consumer and
enterprise
financing remains
a critical
challenge to
scaling up new
enterprises
Cookstove
industry
Increasing
number of
multilateral and
donor initiatives
related to
cookstoves and
promising levels
of coordination
Government
policy on
cookstoves and
fuels is
fragmented and
has had limited
impact to date
Stated need for
greater
coordination on
standards, testing
and certification
Cookstove
policy
There is a large and growing market for efficient cookstoves in India and this can improve health and
livelihoods of millions. However, the industry is still small compared to the magnitude of the problem and
government policy has yet to comprehensively support market-based solutions to the cookstove sector
Macro
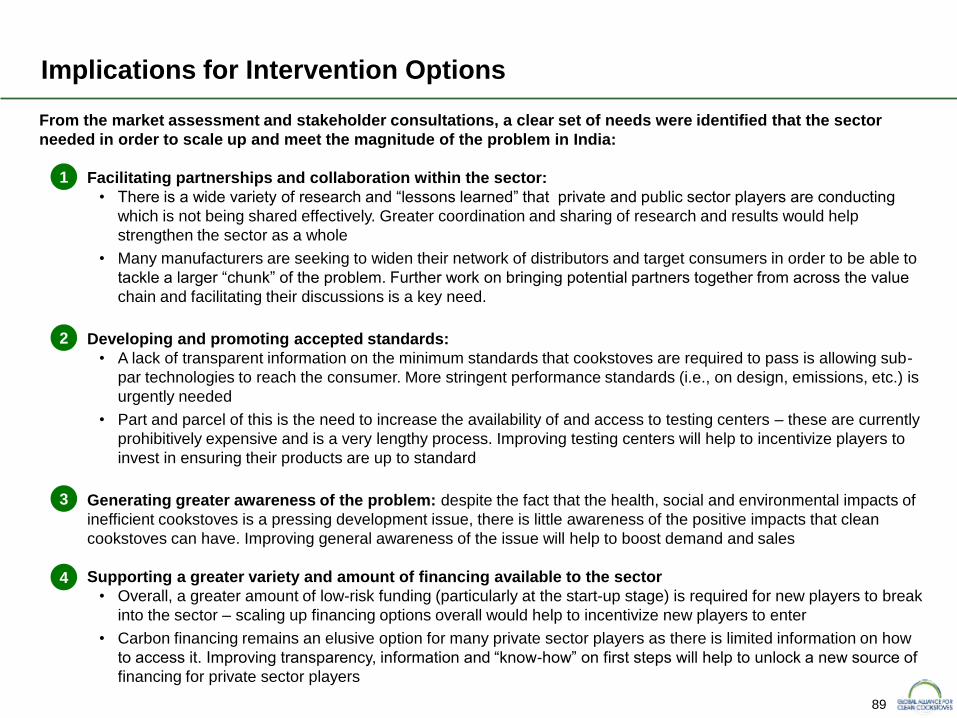
89
Implications for Intervention Options
From the market assessment and stakeholder consultations, a clear set of needs were identified that the sector
needed in order to scale up and meet the magnitude of the problem in India:
Facilitating partnerships and collaboration within the sector:
• There is a wide variety of research and “lessons learned” that private and public sector players are conducting
which is not being shared effectively. Greater coordination and sharing of research and results would help
strengthen the sector as a whole
• Many manufacturers are seeking to widen their network of distributors and target consumers in order to be able to
tackle a larger “chunk” of the problem. Further work on bringing potential partners together from across the value
chain and facilitating their discussions is a key need.
Developing and promoting accepted standards:
• A lack of transparent information on the minimum standards that cookstoves are required to pass is allowing sub-
par technologies to reach the consumer. More stringent performance standards (i.e., on design, emissions, etc.) is
urgently needed
• Part and parcel of this is the need to increase the availability of and access to testing centers – these are currently
prohibitively expensive and is a very lengthy process. Improving testing centers will help to incentivize players to
invest in ensuring their products are up to standard
Generating greater awareness of the problem: despite the fact that the health, social and environmental impacts of
inefficient cookstoves is a pressing development issue, there is little awareness of the positive impacts that clean
cookstoves can have. Improving general awareness of the issue will help to boost demand and sales
Supporting a greater variety and amount of financing available to the sector
• Overall, a greater amount of low-risk funding (particularly at the start-up stage) is required for new players to break
into the sector – scaling up financing options overall would help to incentivize new players to enter
• Carbon financing remains an elusive option for many private sector players as there is limited information on how
to access it. Improving transparency, information and “know-how” on first steps will help to unlock a new source of
financing for private sector players
1
2
3
4
90
Executive summary
Health, social and environmental impact
Sector mapping
Project approach
Macro environment
Consumer assessment
Sector mapping summary
Appendix
Table of contents
Cookstove policy environment
Cookstove industry
Fuel usage and trends
91
APPENDIX 1: Detailed regional breakdown of food types and
cooking habits
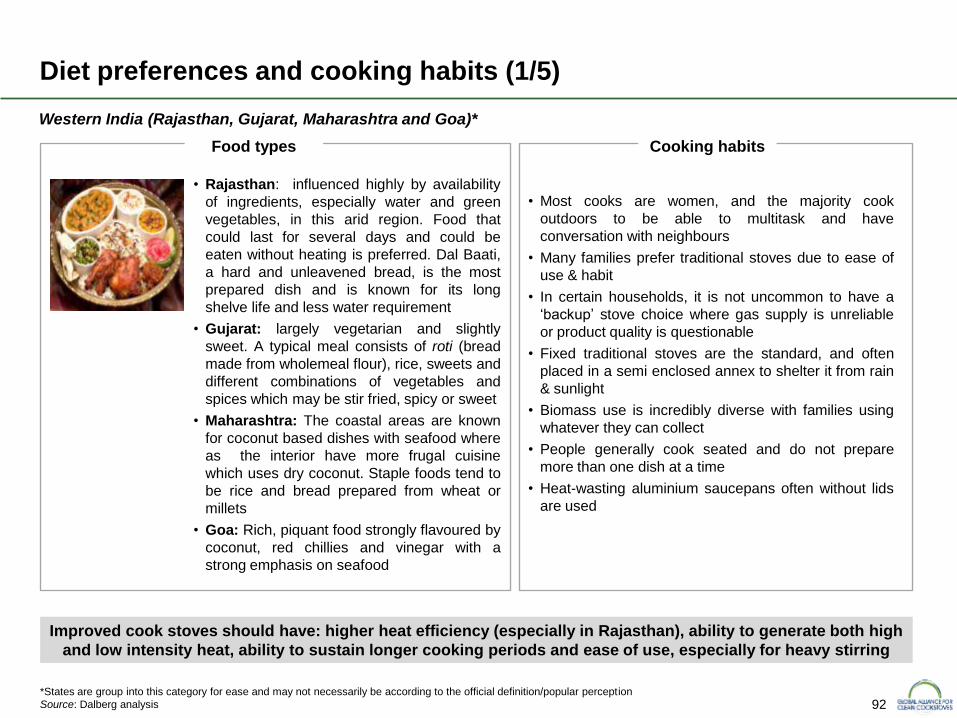
92
Improved cook stoves should have: higher heat efficiency (especially in Rajasthan), ability to generate both high
and low intensity heat, ability to sustain longer cooking periods and ease of use, especially for heavy stirring
• Rajasthan: influenced highly by availability
of ingredients, especially water and green
vegetables, in this arid region. Food that
could last for several days and could be
eaten without heating is preferred. Dal Baati,
a hard and unleavened bread, is the most
prepared dish and is known for its long
shelve life and less water requirement
• Gujarat: largely vegetarian and slightly
sweet. A typical meal consists of roti (bread
made from wholemeal flour), rice, sweets and
different combinations of vegetables and
spices which may be stir fried, spicy or sweet
• Maharashtra: The coastal areas are known
for coconut based dishes with seafood where
as the interior have more frugal cuisine
which uses dry coconut. Staple foods tend to
be rice and bread prepared from wheat or
millets
• Goa: Rich, piquant food strongly flavoured by
coconut, red chillies and vinegar with a
strong emphasis on seafood
Western India (Rajasthan, Gujarat, Maharashtra and Goa)*
• Most cooks are women, and the majority cook
outdoors to be able to multitask and have
conversation with neighbours
• Many families prefer traditional stoves due to ease of
use & habit
• In certain households, it is not uncommon to have a
‘backup’ stove choice where gas supply is unreliable
or product quality is questionable
• Fixed traditional stoves are the standard, and often
placed in a semi enclosed annex to shelter it from rain
& sunlight
• Biomass use is incredibly diverse with families using
whatever they can collect
• People generally cook seated and do not prepare
more than one dish at a time
• Heat-wasting aluminium saucepans often without lids
are used
Food types
Diet preferences and cooking habits (1/5)
Cooking habits
*States are group into this category for ease and may not necessarily be according to the official definition/popular perception
Source: Dalberg analysis
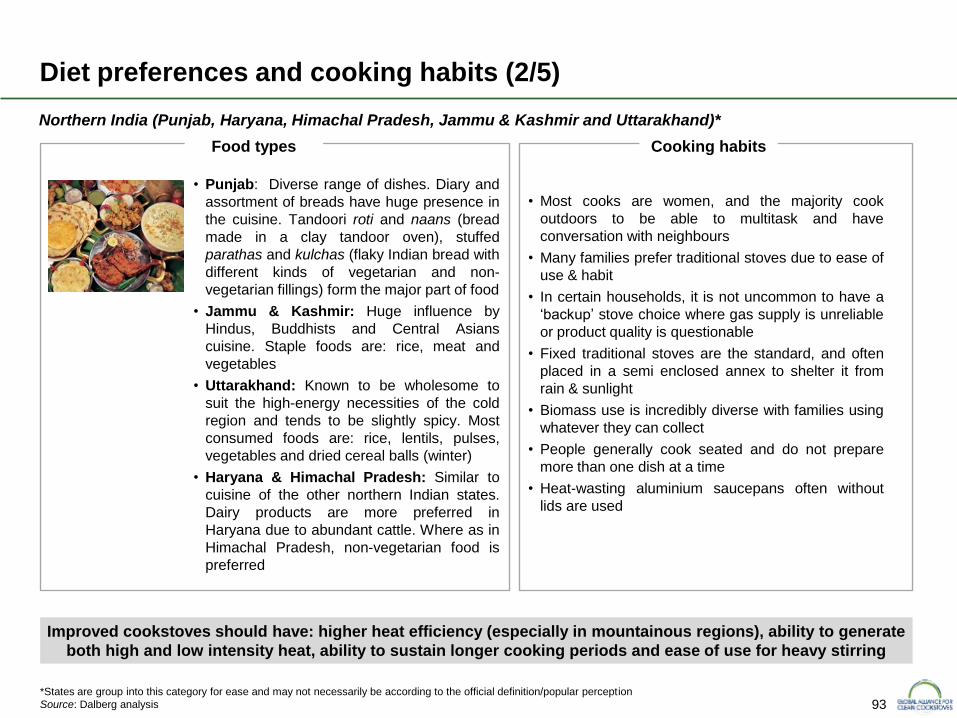
93
Improved cookstoves should have: higher heat efficiency (especially in mountainous regions), ability to generate
both high and low intensity heat, ability to sustain longer cooking periods and ease of use for heavy stirring
• Punjab: Diverse range of dishes. Diary and
assortment of breads have huge presence in
the cuisine. Tandoori roti and naans (bread
made in a clay tandoor oven), stuffed
parathas and kulchas (flaky Indian bread with
different kinds of vegetarian and non-
vegetarian fillings) form the major part of food
• Jammu & Kashmir: Huge influence by
Hindus, Buddhists and Central Asians
cuisine. Staple foods are: rice, meat and
vegetables
• Uttarakhand: Known to be wholesome to
suit the high-energy necessities of the cold
region and tends to be slightly spicy. Most
consumed foods are: rice, lentils, pulses,
vegetables and dried cereal balls (winter)
• Haryana & Himachal Pradesh: Similar to
cuisine of the other northern Indian states.
Dairy products are more preferred in
Haryana due to abundant cattle. Where as in
Himachal Pradesh, non-vegetarian food is
preferred
Northern India (Punjab, Haryana, Himachal Pradesh, Jammu & Kashmir and Uttarakhand)*
• Most cooks are women, and the majority cook
outdoors to be able to multitask and have
conversation with neighbours
• Many families prefer traditional stoves due to ease of
use & habit
• In certain households, it is not uncommon to have a
‘backup’ stove choice where gas supply is unreliable
or product quality is questionable
• Fixed traditional stoves are the standard, and often
placed in a semi enclosed annex to shelter it from
rain & sunlight
• Biomass use is incredibly diverse with families using
whatever they can collect
• People generally cook seated and do not prepare
more than one dish at a time
• Heat-wasting aluminium saucepans often without
lids are used
Food types
Diet preferences and cooking habits (2/5)
Cooking habits
*States are group into this category for ease and may not necessarily be according to the official definition/popular perception
Source: Dalberg analysis
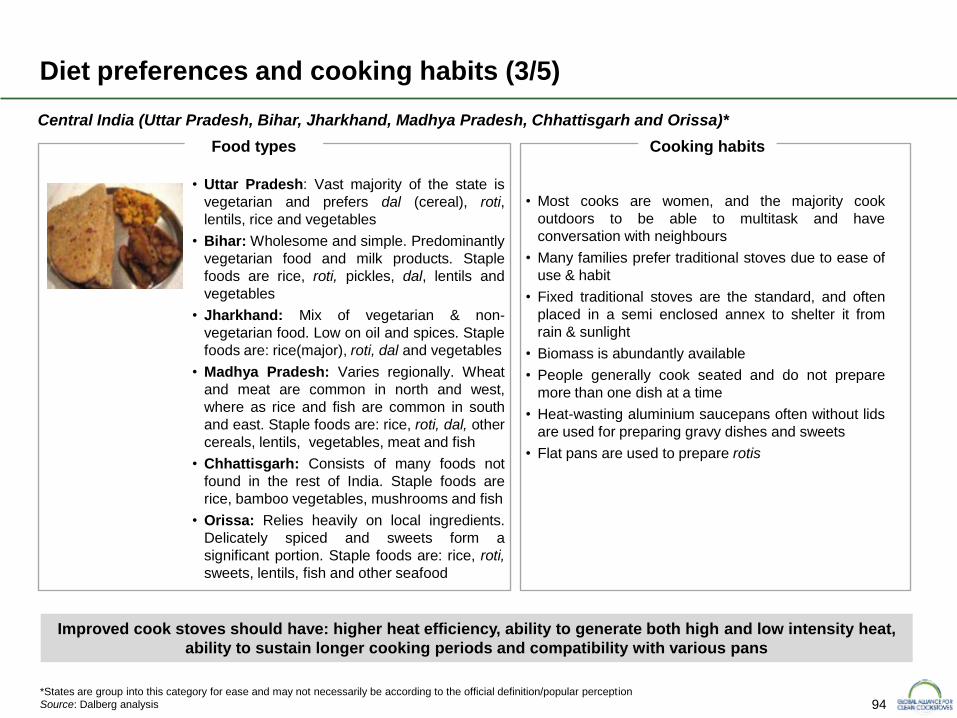
94
Improved cook stoves should have: higher heat efficiency, ability to generate both high and low intensity heat,
ability to sustain longer cooking periods and compatibility with various pans
• Uttar Pradesh: Vast majority of the state is
vegetarian and prefers dal (cereal), roti,
lentils, rice and vegetables
• Bihar: Wholesome and simple. Predominantly
vegetarian food and milk products. Staple
foods are rice, roti, pickles, dal, lentils and
vegetables
• Jharkhand: Mix of vegetarian & non-
vegetarian food. Low on oil and spices. Staple
foods are: rice(major), roti, dal and vegetables
• Madhya Pradesh: Varies regionally. Wheat
and meat are common in north and west,
where as rice and fish are common in south
and east. Staple foods are: rice, roti, dal, other
cereals, lentils, vegetables, meat and fish
• Chhattisgarh: Consists of many foods not
found in the rest of India. Staple foods are
rice, bamboo vegetables, mushrooms and fish
• Orissa: Relies heavily on local ingredients.
Delicately spiced and sweets form a
significant portion. Staple foods are: rice, roti,
sweets, lentils, fish and other seafood
Central India (Uttar Pradesh, Bihar, Jharkhand, Madhya Pradesh, Chhattisgarh and Orissa)*
• Most cooks are women, and the majority cook
outdoors to be able to multitask and have
conversation with neighbours
• Many families prefer traditional stoves due to ease of
use & habit
• Fixed traditional stoves are the standard, and often
placed in a semi enclosed annex to shelter it from
rain & sunlight
• Biomass is abundantly available
• People generally cook seated and do not prepare
more than one dish at a time
• Heat-wasting aluminium saucepans often without lids
are used for preparing gravy dishes and sweets
• Flat pans are used to prepare rotis
Food types
Diet preferences and cooking habits (3/5)
Cooking habits
*States are group into this category for ease and may not necessarily be according to the official definition/popular perception
Source: Dalberg analysis
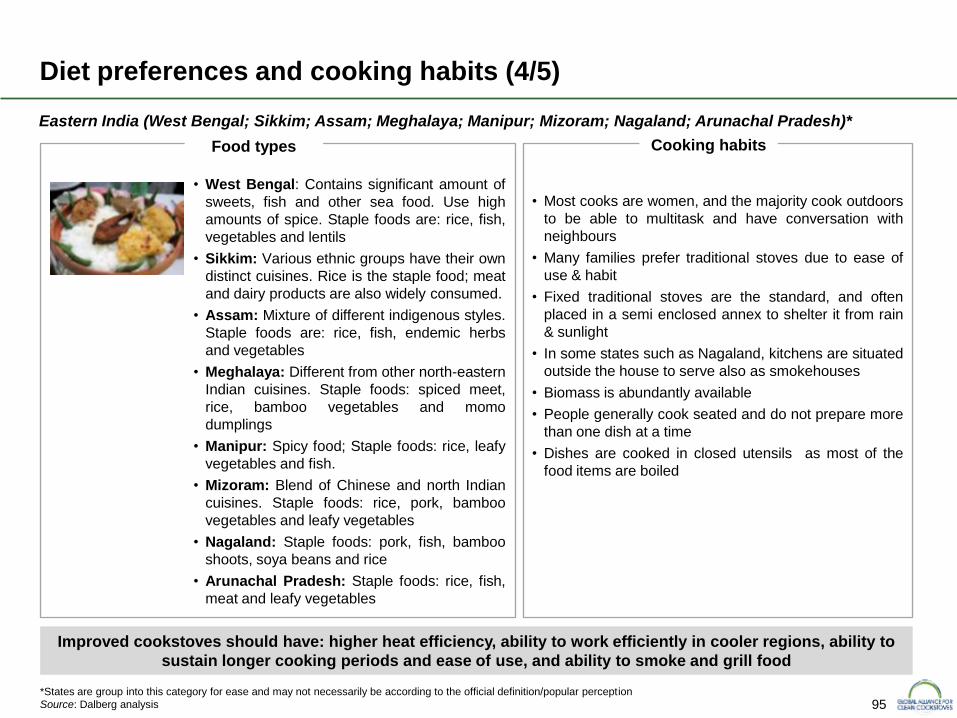
95
Improved cookstoves should have: higher heat efficiency, ability to work efficiently in cooler regions, ability to
sustain longer cooking periods and ease of use, and ability to smoke and grill food
• West Bengal: Contains significant amount of
sweets, fish and other sea food. Use high
amounts of spice. Staple foods are: rice, fish,
vegetables and lentils
• Sikkim: Various ethnic groups have their own
distinct cuisines. Rice is the staple food; meat
and dairy products are also widely consumed.
• Assam: Mixture of different indigenous styles.
Staple foods are: rice, fish, endemic herbs
and vegetables
• Meghalaya: Different from other north-eastern
Indian cuisines. Staple foods: spiced meet,
rice, bamboo vegetables and momo
dumplings
• Manipur: Spicy food; Staple foods: rice, leafy
vegetables and fish.
• Mizoram: Blend of Chinese and north Indian
cuisines. Staple foods: rice, pork, bamboo
vegetables and leafy vegetables
• Nagaland: Staple foods: pork, fish, bamboo
shoots, soya beans and rice
• Arunachal Pradesh: Staple foods: rice, fish,
meat and leafy vegetables
Eastern India (West Bengal; Sikkim; Assam; Meghalaya; Manipur; Mizoram; Nagaland; Arunachal Pradesh)*
• Most cooks are women, and the majority cook outdoors
to be able to multitask and have conversation with
neighbours
• Many families prefer traditional stoves due to ease of
use & habit
• Fixed traditional stoves are the standard, and often
placed in a semi enclosed annex to shelter it from rain
& sunlight
• In some states such as Nagaland, kitchens are situated
outside the house to serve also as smokehouses
• Biomass is abundantly available
• People generally cook seated and do not prepare more
than one dish at a time
• Dishes are cooked in closed utensils as most of the
food items are boiled
Food types
Diet preferences and cooking habits (4/5)
Cooking habits
*States are group into this category for ease and may not necessarily be according to the official definition/popular perception
Source: Dalberg analysis
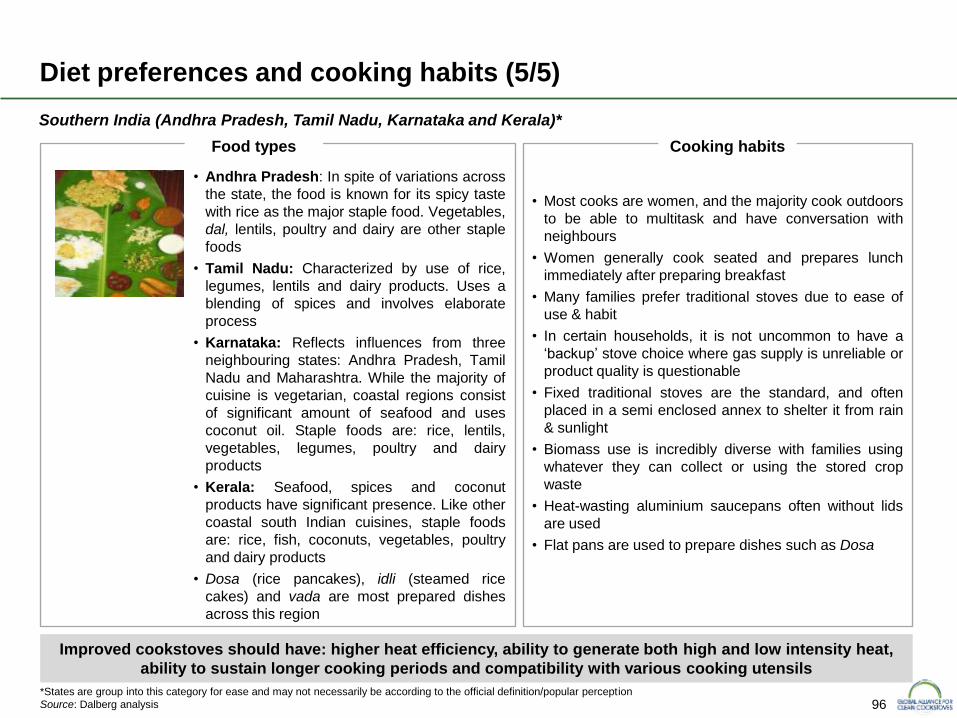
96
Improved cookstoves should have: higher heat efficiency, ability to generate both high and low intensity heat,
ability to sustain longer cooking periods and compatibility with various cooking utensils
• Andhra Pradesh: In spite of variations across
the state, the food is known for its spicy taste
with rice as the major staple food. Vegetables,
dal, lentils, poultry and dairy are other staple
foods
• Tamil Nadu: Characterized by use of rice,
legumes, lentils and dairy products. Uses a
blending of spices and involves elaborate
process
• Karnataka: Reflects influences from three
neighbouring states: Andhra Pradesh, Tamil
Nadu and Maharashtra. While the majority of
cuisine is vegetarian, coastal regions consist
of significant amount of seafood and uses
coconut oil. Staple foods are: rice, lentils,
vegetables, legumes, poultry and dairy
products
• Kerala: Seafood, spices and coconut
products have significant presence. Like other
coastal south Indian cuisines, staple foods
are: rice, fish, coconuts, vegetables, poultry
and dairy products
• Dosa (rice pancakes), idli (steamed rice
cakes) and vada are most prepared dishes
across this region
Southern India (Andhra Pradesh, Tamil Nadu, Karnataka and Kerala)*
• Most cooks are women, and the majority cook outdoors
to be able to multitask and have conversation with
neighbours
• Women generally cook seated and prepares lunch
immediately after preparing breakfast
• Many families prefer traditional stoves due to ease of
use & habit
• In certain households, it is not uncommon to have a
‘backup’ stove choice where gas supply is unreliable or
product quality is questionable
• Fixed traditional stoves are the standard, and often
placed in a semi enclosed annex to shelter it from rain
& sunlight
• Biomass use is incredibly diverse with families using
whatever they can collect or using the stored crop
waste
• Heat-wasting aluminium saucepans often without lids
are used
• Flat pans are used to prepare dishes such as Dosa
Food types
Diet preferences and cooking habits (5/5)
Cooking habits
*States are group into this category for ease and may not necessarily be according to the official definition/popular perception
Source: Dalberg analysis
97
APPENDIX 2: Detailed classification of cookstove types
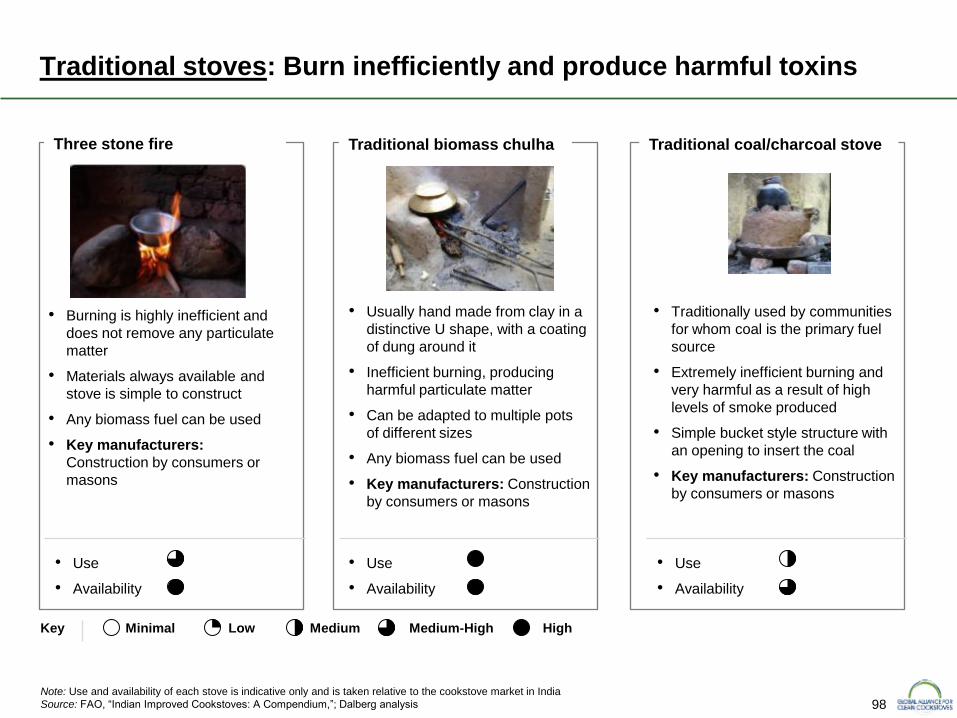
98
• Use
• Availability
Traditional stoves: Burn inefficiently and produce harmful toxins
• Usually hand made from clay in a
distinctive U shape, with a coating
of dung around it
• Inefficient burning, producing
harmful particulate matter
• Can be adapted to multiple pots
of different sizes
• Any biomass fuel can be used
• Key manufacturers: Construction
by consumers or masons
• Burning is highly inefficient and
does not remove any particulate
matter
• Materials always available and
stove is simple to construct
• Any biomass fuel can be used
• Key manufacturers:
Construction by consumers or
masons
Traditional coal/charcoal stove Three stone fire Traditional biomass chulha
• Use
• Availability
• Use
• Availability
Minimal Low Medium Medium-High High Key
• Traditionally used by communities
for whom coal is the primary fuel
source
• Extremely inefficient burning and
very harmful as a result of high
levels of smoke produced
• Simple bucket style structure with
an opening to insert the coal
• Key manufacturers: Construction
by consumers or masons
Note: Use and availability of each stove is indicative only and is taken relative to the cookstove market in India
Source: FAO, “Indian Improved Cookstoves: A Compendium,”; Dalberg analysis
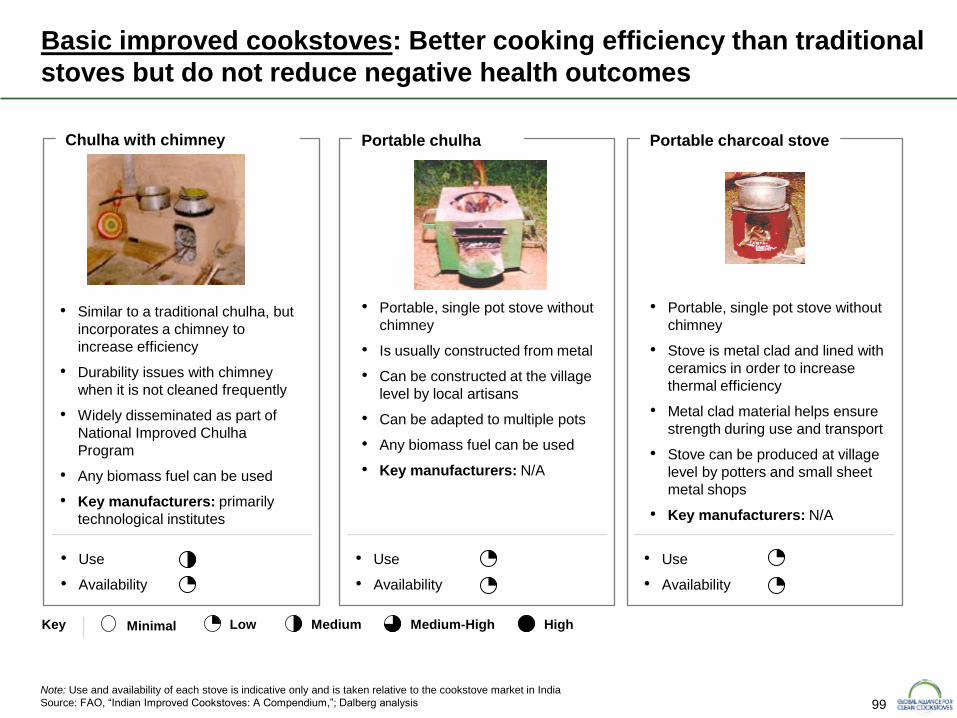
99
Medium-High
Basic improved cookstoves: Better cooking efficiency than traditional
stoves but do not reduce negative health outcomes
• Portable, single pot stove without
chimney
• Is usually constructed from metal
• Can be constructed at the village
level by local artisans
• Can be adapted to multiple pots
• Any biomass fuel can be used
• Key manufacturers: N/A
• Similar to a traditional chulha, but
incorporates a chimney to
increase efficiency
• Durability issues with chimney
when it is not cleaned frequently
• Widely disseminated as part of
National Improved Chulha
Program
• Any biomass fuel can be used
• Key manufacturers: primarily
technological institutes
Chulha with chimney Portable chulha
• Use
• Availability
• Use
• Availability
• Portable, single pot stove without
chimney
• Stove is metal clad and lined with
ceramics in order to increase
thermal efficiency
• Metal clad material helps ensure
strength during use and transport
• Stove can be produced at village
level by potters and small sheet
metal shops
• Key manufacturers: N/A
Portable charcoal stove
• Use
• Availability
Minimal Low Medium High Key
Note: Use and availability of each stove is indicative only and is taken relative to the cookstove market in India
Source: FAO, “Indian Improved Cookstoves: A Compendium,”; Dalberg analysis
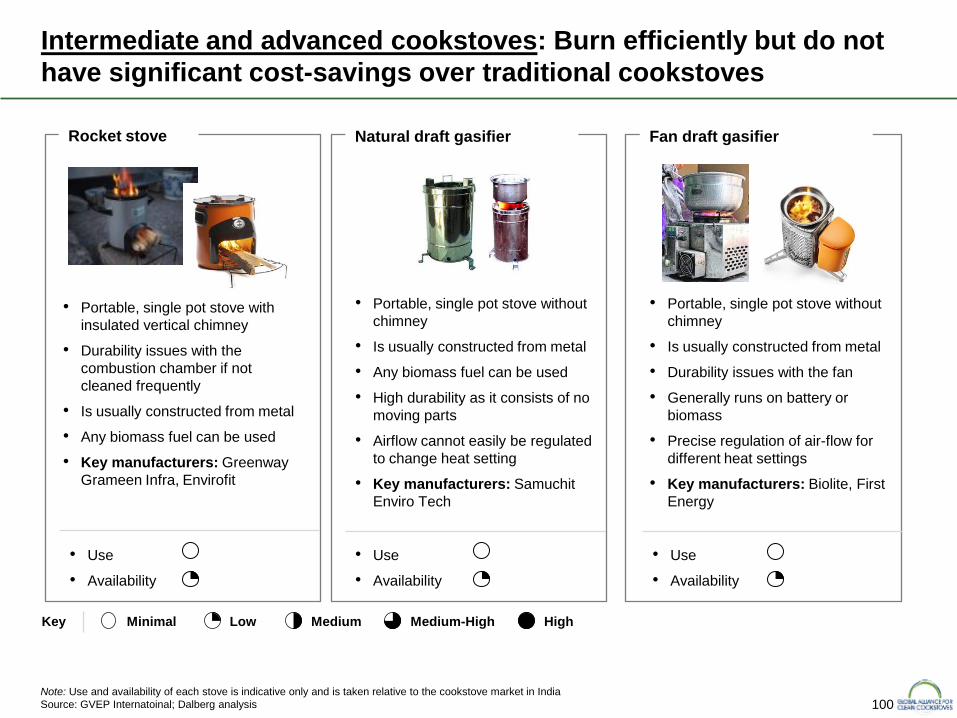
100
Intermediate and advanced cookstoves: Burn efficiently but do not
have significant cost-savings over traditional cookstoves
• Portable, single pot stove without
chimney
• Is usually constructed from metal
• Any biomass fuel can be used
• High durability as it consists of no
moving parts
• Airflow cannot easily be regulated
to change heat setting
• Key manufacturers: Samuchit
Enviro Tech
• Portable, single pot stove with
insulated vertical chimney
• Durability issues with the
combustion chamber if not
cleaned frequently
• Is usually constructed from metal
• Any biomass fuel can be used
• Key manufacturers: Greenway
Grameen Infra, Envirofit
Rocket stove Natural draft gasifier
• Use
• Availability
• Use
• Availability
Minimal Low Medium Medium-High High Key
Fan draft gasifier
• Portable, single pot stove without
chimney
• Is usually constructed from metal
• Durability issues with the fan
• Generally runs on battery or
biomass
• Precise regulation of air-flow for
different heat settings
• Key manufacturers: Biolite, First
Energy
• Use
• Availability
Note: Use and availability of each stove is indicative only and is taken relative to the cookstove market in India
Source: GVEP Internatoinal; Dalberg analysis
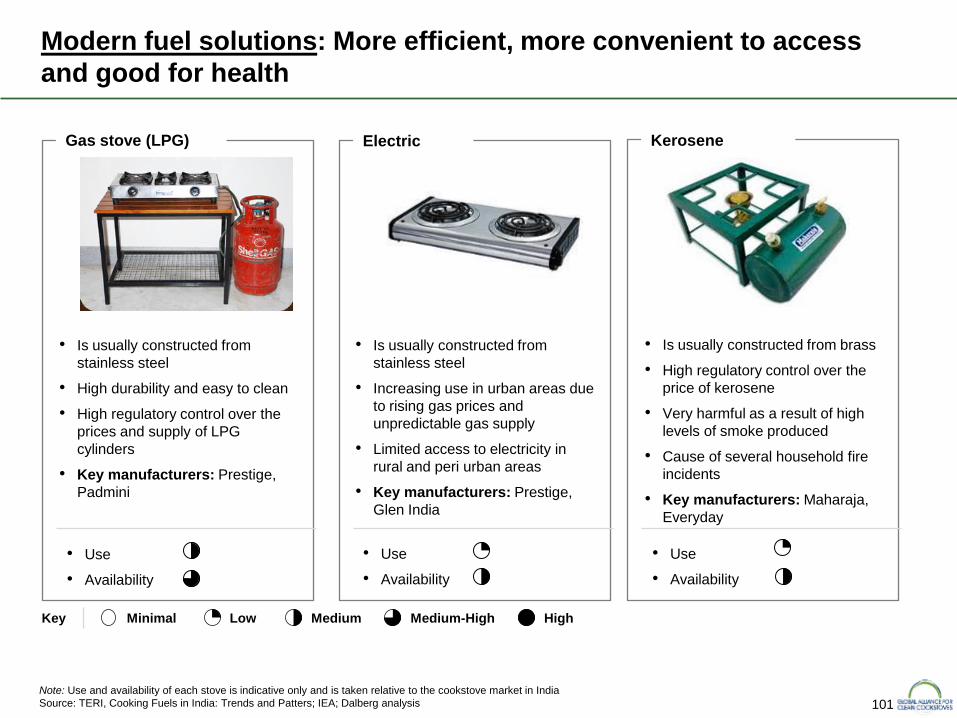
101
• Is usually constructed from
stainless steel
• Increasing use in urban areas due
to rising gas prices and
unpredictable gas supply
• Limited access to electricity in
rural and peri urban areas
• Key manufacturers: Prestige,
Glen India
• Is usually constructed from
stainless steel
• High durability and easy to clean
• High regulatory control over the
prices and supply of LPG
cylinders
• Key manufacturers: Prestige,
Padmini
• Is usually constructed from brass
• High regulatory control over the
price of kerosene
• Very harmful as a result of high
levels of smoke produced
• Cause of several household fire
incidents
• Key manufacturers: Maharaja,
Everyday
Kerosene Gas stove (LPG) Electric
Minimal Low Medium Medium-High High Key
• Use
• Availability
• Use
• Availability
• Use
• Availability
Modern fuel solutions: More efficient, more convenient to access
and good for health
Note: Use and availability of each stove is indicative only and is taken relative to the cookstove market in India
Source: TERI, Cooking Fuels in India: Trends and Patters; IEA; Dalberg analysis
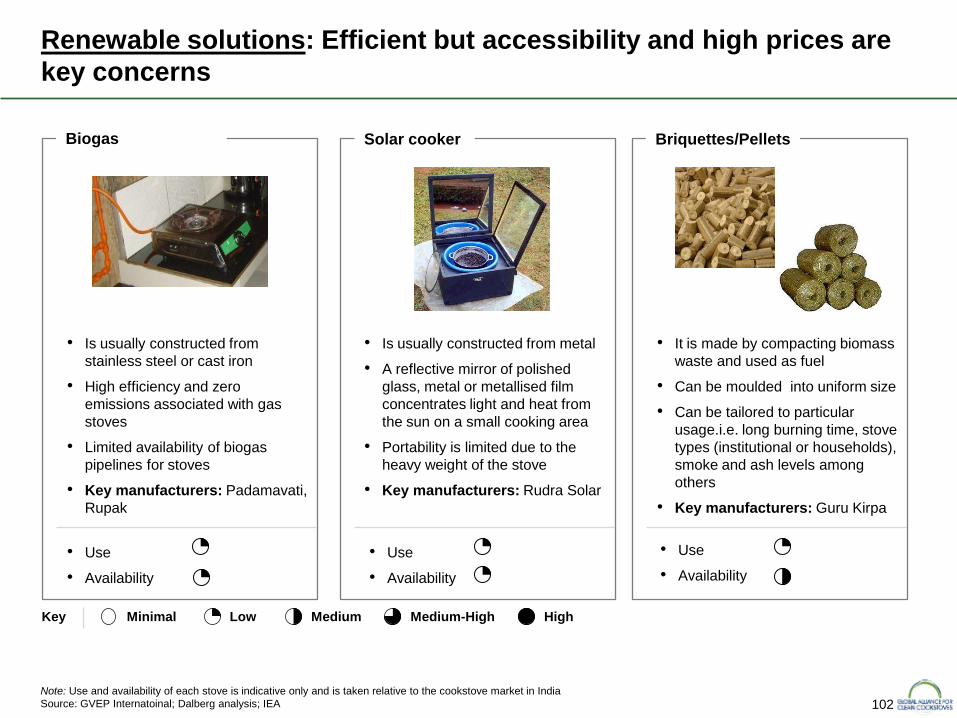
102
• Is usually constructed from metal
• A reflective mirror of polished
glass, metal or metallised film
concentrates light and heat from
the sun on a small cooking area
• Portability is limited due to the
heavy weight of the stove
• Key manufacturers: Rudra Solar
• Is usually constructed from
stainless steel or cast iron
• High efficiency and zero
emissions associated with gas
stoves
• Limited availability of biogas
pipelines for stoves
• Key manufacturers: Padamavati,
Rupak
• It is made by compacting biomass
waste and used as fuel
• Can be moulded into uniform size
• Can be tailored to particular
usage.i.e. long burning time, stove
types (institutional or households),
smoke and ash levels among
others
• Key manufacturers: Guru Kirpa
Briquettes/Pellets Biogas Solar cooker
Minimal Low Medium Medium-High High Key
• Use
• Availability
• Use
• Availability
• Use
• Availability
Renewable solutions: Efficient but accessibility and high prices are
key concerns
Note: Use and availability of each stove is indicative only and is taken relative to the cookstove market in India
Source: GVEP Internatoinal; Dalberg analysis; IEA