Economic Growth I: Capital Accumulation and Population Growth
This marketing communication has been prepared for India Capital Growth Fund Limited by Marten & Co (which is authorised and regulated by the Financial Conduct
Authority) and is non-independent research as defined under Article 36 of the Commission Delegated Regulation (EU) 2017/565 of 25 April 2016 supplementing the
Markets in Financial Instruments Directive (MIFID). It is intended for use by investment professionals as defined in article 19 (5) of the Financial Services Act 2000
(Financial Promotion) Order 2005. Marten & Co is not authorised to give advice to retail clients and, if you are not a professional investor, or in any other way are
prohibited or restricted from receiving this information you should disregard it. Charts and data are sourced from Morningstar unless otherwise stated. Please read the
important information at the back of this document.
India Capital Growth Investment companies | Annual overview | 15 December 2020
A win-win scenario
India, the world’s fifth-largest economy, has rebounded very strongly as
COVID-related restrictions have eased; a fact that Gaurav Narain, India
Capital Growth’s (IGC’s) investment adviser, believes has caught many
observers by surprise. The key indicators suggest further recovery from
here (India’s PMI was 56.3 for November) and Gaurav says that recent
results have generally surprised positively. As was discussed in our last
note, IGC’s manager, has enhanced its investment process and recent
performance shows a marked turnaround in its returns relative to its
competitors (IGC’s NAV was up 48.2% during the half year to 30
November 2020, versus an average of 25.3% for its peers – see
page 19). Gaurav has been rebalancing the portfolio towards long-
term growth stocks that are yet to fully recover. Investors have the
opportunity to benefit, both from this recovery and from a narrowing of
IGC’s discount, as this outperformance comes through. Should this not
materialise, there is a redemption opportunity at the end of 2021.
Mid- and small-cap listed investments in India
IGC’s investment objective is to provide long-term capital
appreciation by investing (directly or indirectly) in companies
based in India. The investment policy permits the company to
make investments in a range of Indian equity securities and
Indian equity-linked securities. The company's investments are
predominantly in listed mid- and-small-cap Indian companies.
Year ended
Share price total
return (%)
NAV total return
(%)
Portfolio total
return* (%)
S&P BSE Mid Cap
TR (%)
MSCI India total
return (%)
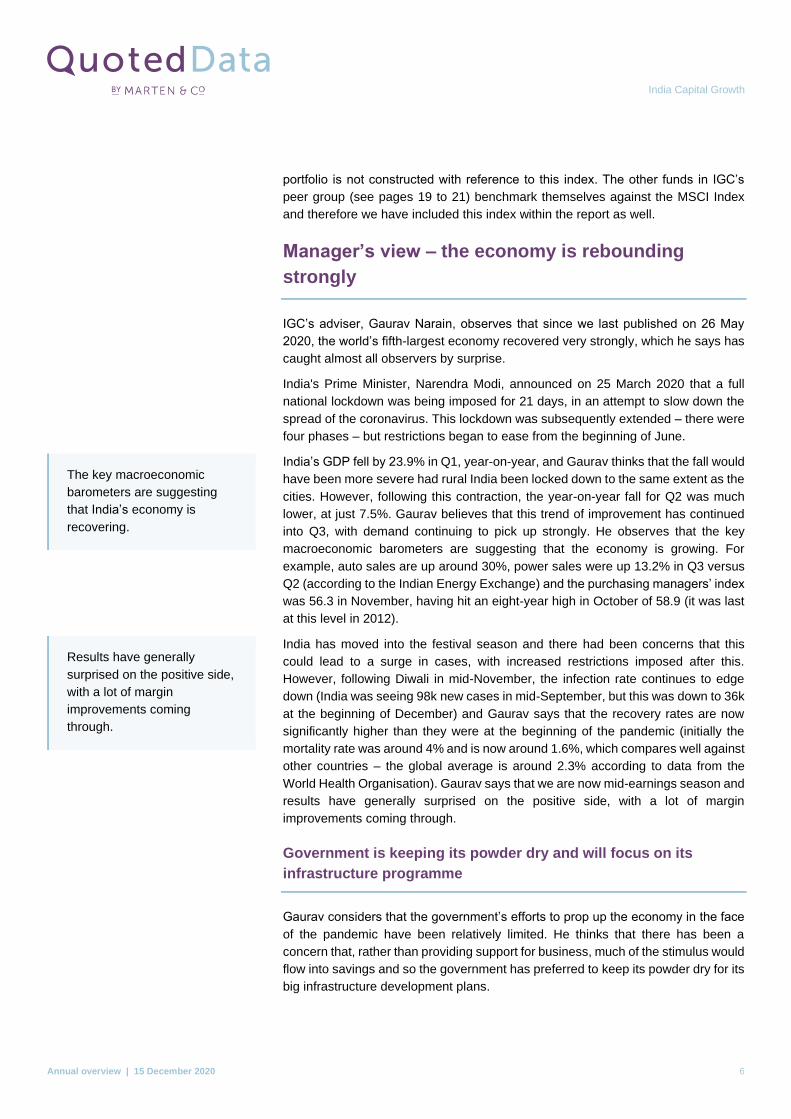
30/11/16 22.8 25.6 35.2 34.4 21.2
30/11/17 45.8 35.1 35.1 34.5 22.3
30/11/18 (17.1) (20.6) (20.6) (12.0) 3.2
30/11/19 (14.6) (7.0) (7.0) (2.9) 4.4
30/11/20 2.3 4.9 4.9 (24.1) (20.2)
Source: Bloomberg, Morningstar, Marten & Co. * Note rebased NAV returns
Sector Country specialist – Asia Pacific
Ticker IGC LN
Base currency GBP
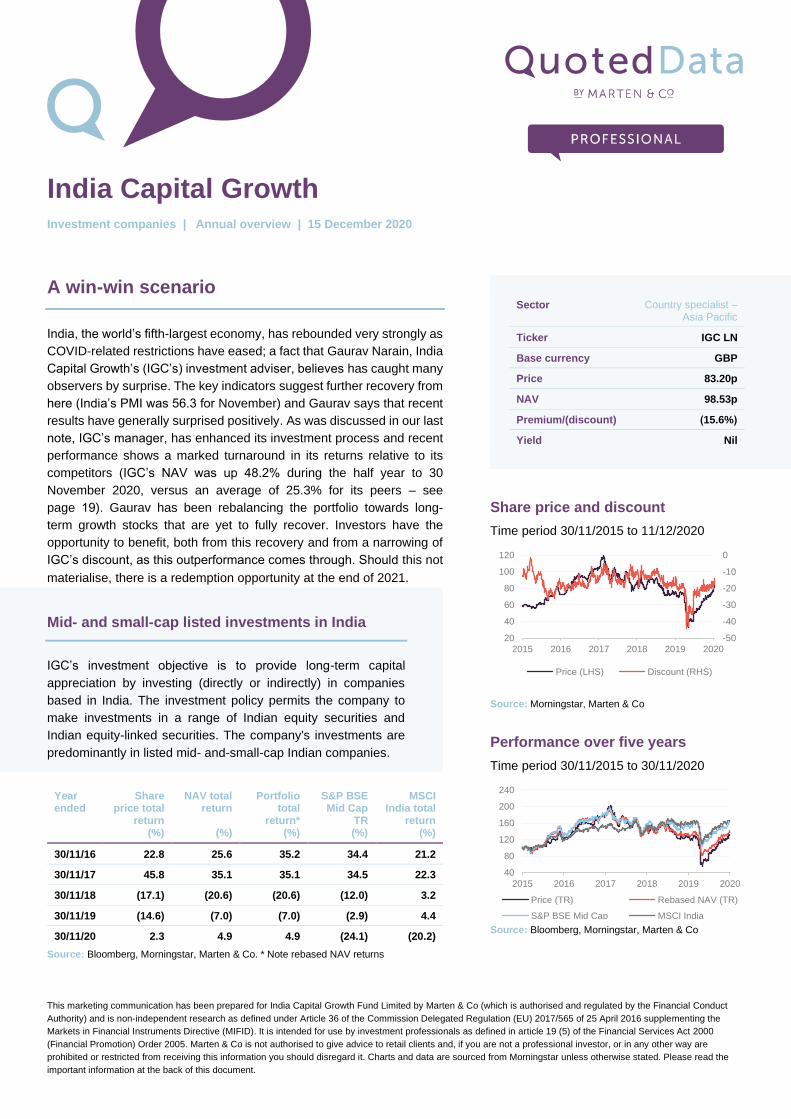
Price 83.20p
NAV 98.53p
Premium/(discount) (15.6%)
Yield Nil
Share price and discount
Time period 30/11/2015 to 11/12/2020
Source: Morningstar, Marten & Co
Performance over five years
Time period 30/11/2015 to 30/11/2020
Source: Bloomberg, Morningstar, Marten & Co
-50
-40
-30
-20
-10
0
20
40
60
80
100
120
2015 2016 2017 2018 2019 2020
Price (LHS) Discount (RHS)
40
80
120
160
200
240
2015 2016 2017 2018 2019 2020
Price (TR) Rebased NAV (TR)
S&P BSE Mid Cap MSCI India

Contents
Fund profile 5
Management arrangements 5
Alignment of interest 5
Taxation 5
Index comparators 5
Manager’s view – the economy is rebounding strongly 6
Government is keeping its powder dry and will focus on its infrastructure
programme 6
Moving to a digital economy 7
Bank’s performance exceeding expectations 7
Credit growth showing signs of recovery 8
Foreign exchange reserves at an all-time high and the Indian rupee has
been resilient 8
Reducing dependency on exports and boosting competitiveness 9
Investment process – The “House of Ocean Dial” 9
Recent innovations 9
Powered by AI 10
Feet on the ground 10
Portfolio construction – aiming for 30 holdings 10
Investment committee 11
Mitigating behavioural risk 11
Cognisant of the potential pitfalls of behavioural biases 11
Valuation risk 12
Asset allocation 12
IDFC First Bank – transitioning to a new age bank 13
Persistent Systems – exposed to growth in digital services and
positioned to benefit from corporate reorganisation 13
Domicile Guernsey
Inception date 22 December 2005
Manager / adviser David Cornell / Gaurav Narain
Market cap 93.6m
Shares outstanding 112.5m
Daily vol. (1-yr. avg.) 398.4k shares
Net cash 1.6%
Click here for our most recent update note
Click here for updated IGC factsheet
Click here for IGC’s peer group analysis
Click here for links to share trading platforms
Analysts
Matthew Read
James Carthew
Shonil Chande

Multi Commodity Exchange (3.5%) – a highly defensible position in a
long-term structural growth area 14
Welspun India (3.3%) – cotton issues well behind its textiles business,
pipes business bolstered by major new contract 14
Top 10 holdings 15
IndusInd Bank (4.1%) – banking sector offers one of the most
favourable risk-reward ratios in the Indian market 16
Bajaj Consumer Care – taking some profits following a strong
performance 16
Berger Paints India – exited following a stellar performance 17
Kajaria Ceramics – strong recovery in Q3 with asset utilisation greater than 90% 17
Performance 18
Peer group – marked improvement in IGC’s near term relative
performance 19
Discount 21
Fees and costs 22
Capital structure and life 23
IGC maintains an ungeared portfolio 23
Unlimited life with a full redemption opportunity every two years 23
Financial calendar 24
Investment advisory team 24
Gaurav Narain – co-head of equities 24
Tridib Pathak – co-head of equities 24
Shahil Shah – assistant fund manager 24
Saurabh Chugh – analyst 24
Ankush Kedia – analyst 24
Ashutosh Garud 25
Saurabh Rathore – analyst 25
Board 25
Elisabeth Scott (chairman) 26

Patrick Firth (chairman of the audit committee) 26
Peter Niven (director) 26
Previous publications 26

India Capital Growth
Annual overview | 15 December 2020 5
Fund profile
IGC is an investment company listed on the Main Market of the London Stock
Exchange. It invests in India, predominantly in listed mid- and small-cap Indian
companies. The fund is aiming to generate capital growth for shareholders. IGC has
not paid dividends in the past and the manager says it is unlikely to do so in the
near future.
Management arrangements
IGC has been managed since 2010 by David Cornell of Ocean Dial, a company
owned by Avendus Capital Private Limited, which in turn is backed by KKR. He has
been assisted in this since November 2011 by Gaurav Narain (Gaurav or the
adviser) of Ocean Dial Asset Management India Private Limited, which is based in
Mumbai. Gaurav has over 25 years of experience in Indian capital markets, having
started his career as vice president of research for SG Asia. The seven-strong
investment team is split between London and Mumbai. Each of the analysts is
assigned responsibility for a number of industry sectors. The manager is responsible
for monitoring portfolio risk and all dealing is done from London.
Ocean Dial manages two funds investing in India: IGC and an open-ended fund,
Gateway to India fund. Ocean Dial had AUM of US$170m as at the end of
November 2020.
Alignment of interest
Employees of Ocean Dial collectively hold 397,381 shares in IGC, while members
of IGC’s board collectively own 112,500 shares between them. Combined, Ocean
Dial employees and the three directors hold 0.5% of IGC’s issued share capital.
Taxation
IGC invests through both a Mauritian subsidiary (ICG Q Limited) and a Guernsey
fund (IGC F Limited) in a portfolio of Indian securities. Changes to the Indian tax
regime in 2018 mean that the portfolio is now liable to pay capital gains tax at 15%
on short-term gains and 10% on its long-term (over 12 months) gains. IGC will
accrue any potential CGT liability in its NAV. Given the manager’s and adviser’s
focus on holding companies for the long-term, it might be reasonable to expect that
the bias will be to the realisation of long-term gains. No CGT was accrued at
30 June 2020.
Index comparators
IGC’s main focus is on Indian mid- and small-cap companies, but the fund can and
does hold large-cap stocks as well. The board and the manager use the S&P BSE
Mid Cap Index (total return) for performance evaluation purposes, although the
Further information is
available at
www.indiacapitalgrowth.com
Long-standing, experienced
investment team of six split
between London and
Mumbai.
Local CGT accrued in NAV
India Capital Growth
Annual overview | 15 December 2020 6
portfolio is not constructed with reference to this index. The other funds in IGC’s
peer group (see pages 19 to 21) benchmark themselves against the MSCI Index
and therefore we have included this index within the report as well.
Manager’s view – the economy is rebounding
strongly
IGC’s adviser, Gaurav Narain, observes that since we last published on 26 May
2020, the world’s fifth-largest economy recovered very strongly, which he says has
caught almost all observers by surprise.
India's Prime Minister, Narendra Modi, announced on 25 March 2020 that a full
national lockdown was being imposed for 21 days, in an attempt to slow down the
spread of the coronavirus. This lockdown was subsequently extended – there were
four phases – but restrictions began to ease from the beginning of June.
India’s GDP fell by 23.9% in Q1, year-on-year, and Gaurav thinks that the fall would
have been more severe had rural India been locked down to the same extent as the
cities. However, following this contraction, the year-on-year fall for Q2 was much
lower, at just 7.5%. Gaurav believes that this trend of improvement has continued
into Q3, with demand continuing to pick up strongly. He observes that the key
macroeconomic barometers are suggesting that the economy is growing. For
example, auto sales are up around 30%, power sales were up 13.2% in Q3 versus
Q2 (according to the Indian Energy Exchange) and the purchasing managers’ index
was 56.3 in November, having hit an eight-year high in October of 58.9 (it was last
at this level in 2012).
India has moved into the festival season and there had been concerns that this
could lead to a surge in cases, with increased restrictions imposed after this.
However, following Diwali in mid-November, the infection rate continues to edge
down (India was seeing 98k new cases in mid-September, but this was down to 36k
at the beginning of December) and Gaurav says that the recovery rates are now
significantly higher than they were at the beginning of the pandemic (initially the
mortality rate was around 4% and is now around 1.6%, which compares well against
other countries – the global average is around 2.3% according to data from the
World Health Organisation). Gaurav says that we are now mid-earnings season and
results have generally surprised on the positive side, with a lot of margin
improvements coming through.
Government is keeping its powder dry and will focus on its
infrastructure programme
Gaurav considers that the government’s efforts to prop up the economy in the face
of the pandemic have been relatively limited. He thinks that there has been a
concern that, rather than providing support for business, much of the stimulus would
flow into savings and so the government has preferred to keep its powder dry for its
big infrastructure development plans.
The key macroeconomic
barometers are suggesting
that India’s economy is
recovering.
Results have generally
surprised on the positive side,
with a lot of margin
improvements coming
through.

India Capital Growth
Annual overview | 15 December 2020 7
On 5 November, Prime Minister Modi held a meeting with the top 20 global
investment funds to attract investment into the infrastructure space. India’s
government is offering tax-free status to the long-term infrastructure projects that
these funds invest in (no CGT, income tax or dividend related tax liabilities). Gaurav
says that the government has already identified the projects, and roads and airports
are seeing the biggest infrastructure development plans (some US$1 trillion over
the next five years).
For example, the government has plans for around US$15bn of infrastructure
projects around Mumbai. This includes a bullet train linking it to Ahmedabad, which
has just had its contract awarded to Larsen & Turbo; a new airport (Navi Mumbai
International) being built at Ulwe Kopar-Panvel in Maharashtra; two express ways
(one to Delhi and the other to the heart of the country); and seven Metro lines being
built simultaneously (with 300-400km of new track, with two lines expected to be
open by the end of the year). Similarly ambitious plans are being rolled out across
other states. With the planning consultations already completed, these projects now
require funding.
Moving to a digital economy
In lockstep with global trends, the onset of the pandemic saw a rapid acceleration
of India’s digital economy, as the country has had to adapt to the situation. India
now has 650m smart phone users and 99% of all digital transactions take place over
the phone, as most citizens have sidestepped the laptop/desktop journey. The
smartphone caters for every need, and since India has one of the lowest data costs
globally (13 US cents per GB per month), IGC’s adviser expects usage to continue
to grow off a low base.
Reflecting strong mobile penetration the government launched its United Payments
Interface (UPI) which acts as a gateway through which all digital transactions pass,
catching both Mastercard and Visa off guard and enabling enterprises and
individuals to transact with each other through a single portal. Currently UPI
processes $2bn transactions daily, but this is expected to grow significantly as
digital transactions increasingly gain market share.
As a reflection of the way that India is changing, there are now approximately 450m
bank accounts in India, which is more than one per family. It is through these bank
accounts that all subsidy payments are now delivered and internet banking is rapidly
replacing the need to form an orderly queue. The adviser expects that “soon there
will be a bank branch in everyone’s pocket”, which can only speed up financial
intermediation across the country. The exception to this is roll out of 5G, which is
still someway away, due to the high costs of bidding for additional spectrum.
Bank’s performance exceeding expectations
The central bank’s moratorium on interest payments ended in August, and whilst
there were concerns about increasing NPLs, the large banks have been reporting
collection rates that have been higher than expected (around 95% of the pre-COVID
level). Reflecting this better-than-expected progress, the large banks have already
started to reduce their COVID provisions.
India’s government is offering
tax-free status to investment
in long-term infrastructure
projects.
The government has plans for
around US$15bn of
infrastructure projects around
Mumbai, with similarly
ambitious plans being rolled
out across other states.
The onset of the pandemic
saw a rapid acceleration of
India’s digital economy.
The government’s United
Payments Interface (UPI) acts
as a gateway through which
all digital transactions pass.
India now has c. 450m bank
accounts (more than one per
family), through which all
subsidies are paid.

India Capital Growth
Annual overview | 15 December 2020 8
Credit growth showing signs of recovery
Credit growth has been modest. The Reserve Bank of India’s statement of the
sectoral deployment of bank credit for October shows non-food bank credit growth
of 5.6 year-on-year for October 2020 (October 2019: 8.3%), but Gaurav highlights
that the banks are sitting on a lot of cash and expects credit growth to recover as
economic activity picks up, people gain confidence and take advantage of current
low interest rates (the festival season has also traditionally brought about a rise in
the demand for credit). While personal loans for consumer durables and advances
against fixed deposits are down markedly over six months (by 26.0% and 22.7%
respectively), loans for housing, advances against share bonds, credit card debt,
vehicle loans, and other personal loans are all up (by 2.6%, 18.0%, 2.0%, 1.5% and
5.2% respectively).
Foreign exchange reserves at an all-time high and the Indian
rupee has been resilient
Gaurav says that, in addition to most-macroeconomic indicators being relatively
healthy, forex reserves are at an all-time high and the currency is healthy too. The
central bank has been busy buying US dollars and selling rupees, quite
aggressively, to bolster foreign exchange reserves (Gaurav says that the
improvement in Forex reserves is a massive change – data from Bloomberg at the
end of November suggested these are the fifth-highest globally - behind China,
Japan, Switzerland, and Russia).
Figure 1: Various currencies versus the US dollar, rebased to 100 over one-year
Source: Morningstar, Marten & Co
80
90
100
110
120
130
140
150
Dec/19 Jan/20 Feb/20 Mar/20 Apr/20 May/20 Jun/20 Jul/20 Aug/20 Sep/20 Oct/20 Nov/20
Indian Rupee Brazillian Real Indonesian Rupiah Euro Sterling

India Capital Growth
Annual overview | 15 December 2020 9
Against this backdrop, the INR has been remarkably stable this year, as illustrated
in Figure 1, which shows a number of currency, both developing market (the INR,
the Brazilian Real and the Indonesian Rupiah) and developed market (the Euro and
sterling) all against the US dollar (all rebased to 10 over one-year). Inspection of
Figure 1 shows that the INR has exhibited the least volatility out of all of the
currencies provided.
Reducing dependency on exports and boosting competitiveness
India is a net importer, but in the aftermath of the crisis, its imports are down around
20%, yet its exports are up around 5%, markedly improving its balance of payments
deficit. The Modi government has been working to reduce India’s dependency on
imports, particularly where the country has a large market (for example, consumer
electronics is approximately a US$40bn market).
Gaurav says that Modi’s “Made in India” programme has been a big success. It not
only provides incentives to purchase from domestic manufacturers, but is also
making it easier to set up production plants in the country (which benefit from India’s
relatively-low labour costs). Gaurav says that hundreds of plants have been set up
and he sees this as a long-term structural change. For example, Apple iPhone 12
components are being made in India.
Healthcare is another key area being targeted. The government is providing tax
benefits and support to help set up pharmaceutical plants. The government’s related
measures have also seen India move from around 132 in 2013 to 63 in 2020, in the
World Bank’s ease of doing business index, which has been a big focus of
government reform. Interestingly, it has gone from 182 to 27 for dealing with
construction permits, from 49 to 13 for protecting minority shareholders and from
116 to 52 for resolving insolvency.
Corporate tax rates have been cut in a bid to make India more competitive with other
Southeast Asian countries and to encourage manufacturing. For new manufacturer
units, the corporate tax rate is 15%, which the manager believes is the lowest in
Asia. Two pillars of this have been the government’s labour reforms and its reforms
of the agricultural sector. India has also been focusing on improving education. The
aim of the measures is to get India’s economy growing at a faster rate. Corporate
profits are also coming off a low base – corporate profits were 1.8% of GDP in 2019,
having previously troughed in 2001 at 1.9% and having previously peaked at 7.3%,
which suggests strong growth potential from here.
Investment process – The “House of Ocean Dial”
Recent innovations
In our May 2020 note, we explained how Ocean Dial IGC had both refined its
investment process and strengthened the advisory team. Tridib Pathak joined
Ocean Dial in October 2019 as co-head of equities, working alongside Gaurav
Narain, whom regular followers of IGC and readers of our research on the company
will be very familiar with.
Modi’s “Made in India”
programme has been a big
success.
Tax is being cut to make India
more competitive with other
Southeast Asian countries.
An investment team of eight,
with Gaurav Narain and Tridib
Pathak as co-heads of
equities.

India Capital Growth
Annual overview | 15 December 2020 10
The analyst team was also expanded earlier this year with the addition of Saurabh
Rathore and Ashutosh Garud, which took the number of team members to seven,
and Ocean Dial are looking to make an additional hire. The new hire will focus on
integrating ESG criteria into Ocean Dial's investment process. Biographies of
members of the investment advisory team are provided on pages 24 to 26.
Powered by AI
In addition to expanding the team, a series of innovations were introduced into the
investment process, including the use of artificial intelligence (AI) tools to the
screening and monitoring process. This is achieved through the use of a tool that
pulls information on an investee company from multiple sources of unstructured
data onto a single dashboard that is readily accessible for interrogation by the
investment team.
Feet on the ground
Gaurav and the rest of the India-based team at Ocean Dial are bottom-up investors,
operating in a market with historically strong and consistent earnings growth, where
periods of elevated volatility have provided regular mispriced entry points.
Ocean Dial seeks out companies whose management practices are culturally
aligned with theirs and whose business models are capable of creating long-term
shareholder value in a sustainable manner. A focused universe of companies from
which potential investments are scrutinised is referred to as the House of Ocean
Dial. More specifically, companies with the following attributes are eliminated:
• Market capitalisation of below US$100m.
• Environmental, Social, and Corporate Governance concerns.
• Business models which are:
– incomprehensible
– not scalable
– driven by global commodity prices
– conglomerated; or
– unable to create sustainable economic value.
• Business-to-Consumer companies where the consumers are predominantly
based outside of India.
• Insufficient knowledge to have an informed view on any of the above.
This has resulted in a current universe of approximately 140 companies in which
the managers can invest. Each analyst covers roughly 35 names and coverage
entails forensic accounting, detailed financial modelling, and one-to-one corporate
interaction twice annually.
Portfolio construction – aiming for 30 holdings
The House of Ocean Dial is a universe of companies on which the team can build
focus. The manager will allocate to approximately 30 holdings which are
An investment universe of
around 140 companies forms
the basis of a target portfolio
of 30 holdings.

India Capital Growth
Annual overview | 15 December 2020 11
independent both of the IGC’s benchmark and the market capitalisation of the
business.
The starting point is to examine the highest ranked companies in the universe in
terms of expected return, and from this the manager has discretion to dive deeper.
In addition to meeting regularly with senior management, the team meets with
suppliers, customers, and business competitors where relevant. The portfolio looks
to invest with a minimum position size of 2%. This could range to up to 8%
depending on the liquidity of the traded volume and the strength of conviction.
Investment committee
The House of Ocean Dial is a continuously evolving universe of investible
opportunities. An investment committee (IC) exists to ensure that existing names
continue to pass filters set, and to provide a forum for members of the investment
team to propose new names for inclusion into the universe.
The IC meets quarterly and acts as a gatekeeper for stocks under consideration,
with any changes needing to be approved by the Committee. The agenda also
includes the following issues.
Mitigating behavioural risk
The team is cognisant of the challenge of distinguishing, without the benefit of
hindsight, between temporary downward fluctuations caused by volatility, and a
genuine loss of capital. To diminish the probability of the latter, the research process
is structured to ensure that each investment thesis is constructed on a sound basis
while allowing the decision-making framework to react effectively should a change
in the thesis occur over the course of the holding period. All investments are
documented on initiation to enable the manager to assess the effectiveness of
decisions made without being clouded by viewing them through the lens of
hindsight.
Cognisant of the potential pitfalls of behavioural biases
Direct management interaction is limited, where appropriate, to twice a year, with
healthy scepticism accorded to guidance in order to ensure the team remains
detached in its assessment of a given company. Moreover, the IC provides an open
forum for discussion on price movements or changes in fundamentals to ensure a
continuous and systematic re-assessment of each investment thesis. The universe-
ranking tool provides a quantitative basis for guiding where the highest expected
return opportunities exist, while triggering a re-assessment of holdings that are
falling down the ranking.
Exploit the long-term Indian
growth story but stick to well-
run companies.
India Capital Growth
Annual overview | 15 December 2020 12
Valuation risk
A broad range of valuation techniques are used to compare the advisers’ analysis
of a company’s current worth against its own history and in relation to its peer group.
This is completed using Ocean Dial’s internal assessment of the company’s outlook
rather than relying on sell side research or management’s own estimates. Using
data analysis tools, each company model is incorporated into a “ranking tool” which
provides the investment team with multiple ways with which to measure the upside
to fair value for each portfolio candidate.
The ranking tool acts as a strong signal to the portfolio adviser as to where the most
profitable opportunities in the universe lie. Its strength is as a guide to enable better
resource allocation and decision making, not as a systematic final output of what
the portfolio should be. Deeper due diligence in the form of further management
interaction, background checks, and broader scrutiny of the competitive landscape
is conducted by the team depending on the portfolio adviser’s requirement to build
a fully informed thesis as to whether an investment decision should be
recommended.
Asset allocation
As was highlighted in our May 2020 note, Gaurav made a lot of adjustments to the
portfolio between January and May as the crisis was unfolding, and volatility was
particularly elevated. Since then, portfolio changes have been much more modest.
Gaurav is happy with the shape of the portfolio, but has advised some rebalancing
to take advantage of opportunities. For example, the manager has added to both
Emami and Jyothy Labs, as both suffered from their exposures to the consumer.
Initially Gaurav advised that IGC’s bank exposure be reduced, but he has reversed
this position recently as he thinks that the sector offers one of the most favourable
risk-reward ratios in the Indian equities space today.
To recap, City Union Bank, previously one of IGC’s largest holdings, was reduced,
while positions in DCB Bank, Indian Bank, Yes Bank and Jammu & Kashmir Bank
were sold in their entirety. Then, reflecting concerns about the impact on
international trade, the exposure to overseas businesses was also reduced. This
provided cash, which the manager was able to deploy following the market sell off.
New additions included: Gujarat Gas (this was profiled in more detail in our May
2020 note – see page 12 of that note); Aegis Logistics (logistics provider to the oil,
gas, and chemicals sectors); ICICI Lombard (general insurance) and CCL Products
(an instant coffee manufacturer).
Gaurav observes that the market has been highly focused on household, large cap
names. Consequently, it has been overlooking the small- and mid-caps which will
also benefit from increased economic activity as the economy recovers, and from
falling costs. Gaurav observes that there has been a lot of value compression,
creating a lot of opportunities in the space.
IDFC First Bank, Persistent Systems and Multi Commodity Exchange are new
names that have been added to the portfolio. These are discussed in more detail
Ocean Dial’s uses its own
assessment of a company’s
outlook rather than relying on
sell side research or
management’s own
estimates.
The banking sector offers one
of the most favourable risk-
reward ratios in the Indian
equities space today.
The market has been
overlooking the small- and
mid-caps which will also
benefit from increased
economic activity as the
economy recovers.
India Capital Growth
Annual overview | 15 December 2020 13
below. We have also provided an update on Welspun India, a long-term IGC holding
that has performed strongly this year.
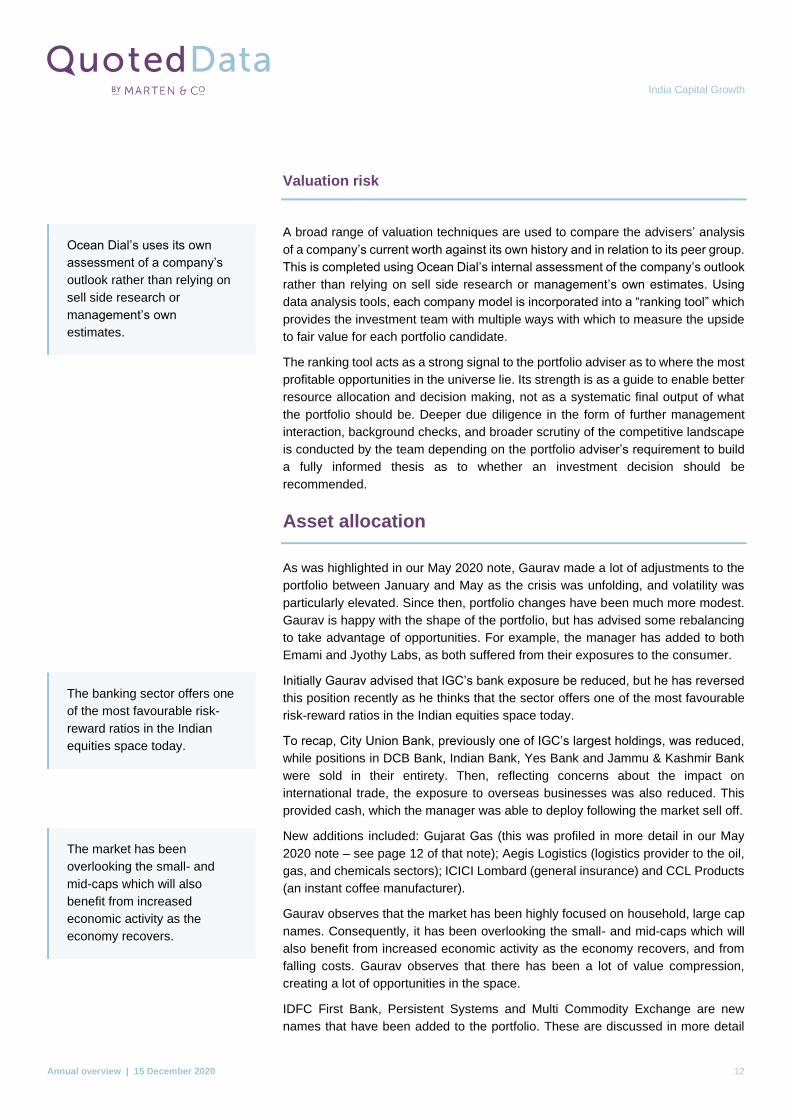
IDFC First Bank – transitioning to a new age bank
IDFC First Bank (www.idfcfirstbank.com) is one of the youngest private sector banks
in India. It was formed in 2018 with the merger of Capital First (a retail lending non-
banking finance company) and IDFC Bank (an infrastructure lender which received
its banking license in 2015). According to Gaurav, the merger kicked off a transition
process that has seen the combined company move towards becoming “a new age
retail bank”, driven by the management team that came in from Capital First.
Post-merger, the bank is in the midst of rolling out its five-year strategy of being a
technology and digitally focused retail bank (70% of book), with low cost CASA
deposits of 40% (CASA or current account savings account deposits are the
cheapest and major source of funds for banks), net interest margins (NIMs) of 5-
5.5%, and return on assets of 1.4-1.6%. Gaurav says that building a strong and
diversified retail liabilities profile will be key to achieving this, along with shedding
its wholesale book on the asset side. However, after up front stress in its legacy
corporate and infrastructure book, through aggressive provisioning, the bank is now
on a high growth trajectory.
Retail assets are already 63% of its loan book, NIMs have jumped from 2.9% to
4.6% and most importantly the CASA ratio has reached its target following a surge
in retail savings deposits aided by Covid. The bank is well capitalised with net NPAs
of 0.4% and a provision coverage ratio of 74%. Gaurav believes that the bank is
poised for a period of strong sustainable growth and, as the improving operating
metrics play out, a rerating.
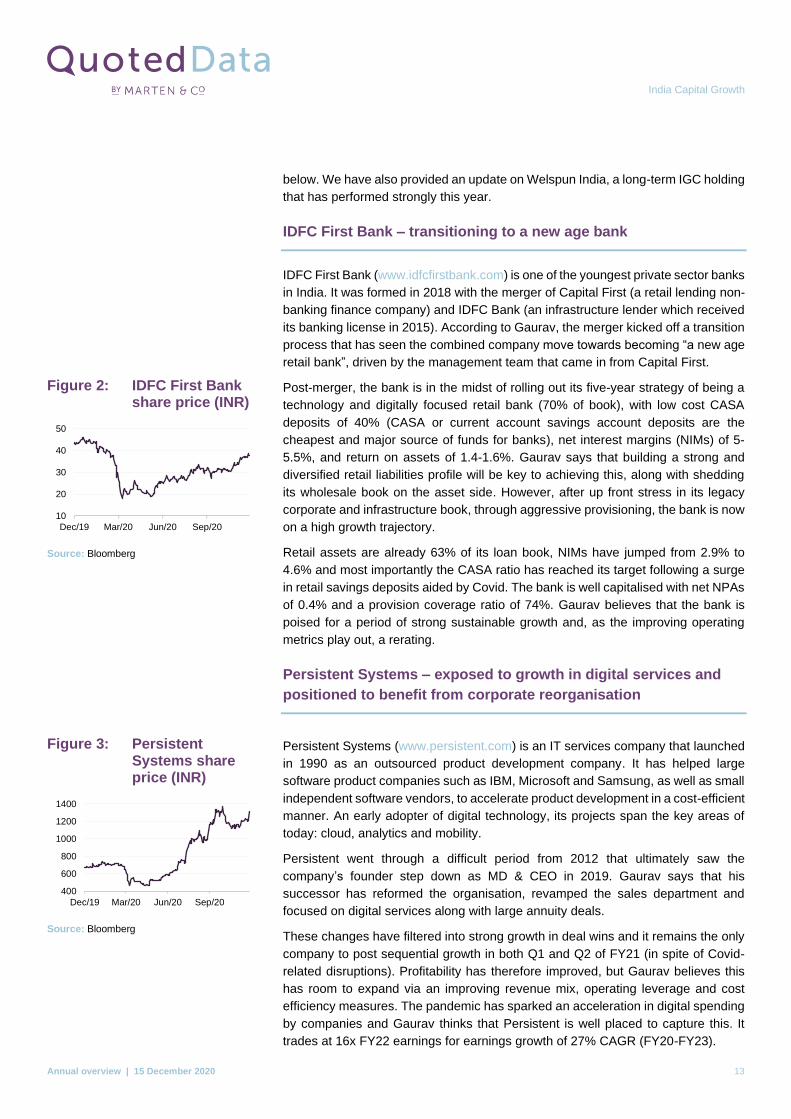
Persistent Systems – exposed to growth in digital services and
positioned to benefit from corporate reorganisation
Persistent Systems (www.persistent.com) is an IT services company that launched
in 1990 as an outsourced product development company. It has helped large
software product companies such as IBM, Microsoft and Samsung, as well as small
independent software vendors, to accelerate product development in a cost-efficient
manner. An early adopter of digital technology, its projects span the key areas of
today: cloud, analytics and mobility.
Persistent went through a difficult period from 2012 that ultimately saw the
company’s founder step down as MD & CEO in 2019. Gaurav says that his
successor has reformed the organisation, revamped the sales department and
focused on digital services along with large annuity deals.
These changes have filtered into strong growth in deal wins and it remains the only
company to post sequential growth in both Q1 and Q2 of FY21 (in spite of Covid-
related disruptions). Profitability has therefore improved, but Gaurav believes this
has room to expand via an improving revenue mix, operating leverage and cost
efficiency measures. The pandemic has sparked an acceleration in digital spending
by companies and Gaurav thinks that Persistent is well placed to capture this. It
trades at 16x FY22 earnings for earnings growth of 27% CAGR (FY20-FY23).
Figure 2: IDFC First Bank share price (INR)
Source: Bloomberg
Figure 3: Persistent Systems share price (INR)
Source: Bloomberg
10
20
30
40
50
Dec/19 Mar/20 Jun/20 Sep/20
400
600
800
1000
1200
1400
Dec/19 Mar/20 Jun/20 Sep/20

India Capital Growth
Annual overview | 15 December 2020 14
Multi Commodity Exchange (3.5%) – a highly defensible position
in a long-term structural growth area
Multi Commodity Exchange, or MCX (www.mcxindia.com) is the leading
commodity exchange in India. Established in November 2003, MCX operates
under the regulatory framework of Securities and Exchange Board of India (SEBI).
MCX is also India’s first listed exchange and has close to 100% of the global
commodities trade in India. Reflecting this, Gaurav says that MCX is very cash-
generative, which has allowed it to re-invest in its business so that it now offers a
state-of-the-art commodity derivatives exchange that is the go-to platform in India
for price discovery and risk management in commodities derivatives transactions.
As is illustrated in Figure 4, MCX suffered as markets collapsed in March, losing
around 40% of its value when compared to its peak immediately preceding COVID.
However, while there were some initial concerns that depressed economic activity
could lead to a decrease in commodities derivatives transaction volumes, such fears
appear to have been short-lived. Gaurav saw this as a strong buying opportunity for
what he thinks is a very well-managed company, with a highly defensible position in
a long-term structural growth area that also benefits from the government’s
infrastructure development plans. This appears to have been a good call for IGC,
as MCX was up 93.0% on 11 December 2020 from its trough valuation in March.
Welspun India (3.3%) – cotton issues well behind its textiles
business, pipes business bolstered by major new contract
Based in Mumbai, Welspun India (www.welspunindia.com) is one of the largest
home textile manufacturers in the world, and a company that has been a constituent
of IGC’s portfolio for around four and a half years. It exports to over 50 countries,
and its textiles business has a strong presence in the US (approximately 30%
market share). We last discussed Welspun in detail in our October 2016 note (see
page 6 of that note) where we explained that Gaurav’s initial purchase of the stock
had been unfortunately timed.
Having started to build the position in the stock in July 2016, Target, the second-
largest discount retailer in the US, severed ties with Welspun in August 2016,
accusing the company of labelling cheaper bedsheets as being made of Egyptian
cotton. This led to other retailers, such as Walmart and Ikea, suspending the sale
of Welspun’s Egyptian cotton items, although continuing to sell its other products,
as well as two class-action law suits in the US (a settlement was eventually agreed
in relation to these in July 2019).
Following the emergence of the scandal, Welspun sold off dramatically, but Gaurav
felt that the market had overreacted. He met management and concluded that this
was a short-term issue and that the management team were handling it well. This
led him to add to the position at depressed valuations, which initially proved to be a
good call for IGC as the stock recovered strongly over the following six months.
However, while from February 2017 to the peak of the COVID-19 market collapse,
Wellspun’s share price was broadly on a declining trend, the COVID-19 market
collapse appears to have been a turning point. The scandal is now well behind it; it
is a financially strong company that has seen an improvement in its competitive
Figure 4: Multi Commodity Exchange share price (INR)
Source: Bloomberg
Figure 5: Welspun India share price (INR)
Source: Bloomberg
800
1000
1200
1400
1600
1800
2000
Dec/19 Mar/20 Jun/20 Sep/20
0
20
40
60
80
Dec/19 Mar/20 Jun/20 Sep/20

India Capital Growth
Annual overview | 15 December 2020 15
environment as the pandemic has forced weaker players to exit the market. In
addition, in March 2020, it also won a major contract to supply offshore pipes for the
Barossa offshore development project from Allseas Marine Contractors Australia.
The project, which is owned by a joint venture made up of ConocoPhillips Australia,
SK E&S Australia and Santos Offshore, is a first for Welspun in the Australian
offshore industry. It is also a hallmark of quality for the company as the 270 km (87
KMT) pipes it is to supply are for a critical application in a quality-conscious area. It
also underlines Welspun’s strategic position in this area and the potential it has to
supply pipes for other challenging offshore projects globally.
Consequently, Welspun is now trading well above its pre-COVID levels, even after
the recent pause in November.
Top 10 holdings
Figure 6 shows IGC’s top 10 holdings as at 30 November 2020 and how these have
changed since 30 April 2020 (the most recently-available data when we last
published). New entrants to the top 10 are IndusInd Bank and Kajaria Ceramics.
Names that have moved out of the top 10 are Bajaj Consumer Care and, Berger
Paints India. We discuss some of the more interesting changes in the following
pages. Readers interested in other names in the top 10 should see our previous
notes, where many of these have been previously discussed (see page 26 of this
note).
Figure 6: Top 10 holdings as at 30 November 2020
Holding Sector Business Allocation 30 November
2020 (%)
Allocation 30 April 2020
(%)
Percentage point change
Emami Consumer staples Health and beauty products
5.8 3.5 2.3
Federal Bank Financials – Banks Private bank 5.4 5.4 (0.9)
Indusind Bank Financials – Banks Private bank 5.3 2.3 3.0
PI Industries Materials Agricultural chemicals 5.0 6.7 (1.1)
Divi's Laboratories Health Care Active pharmaceutical ingredients
4.0 6.2 (1.8)
Tech Mahindra IT IT, networking technology and BPO
4.0 3.6 0.5
City Union Bank Financials – Banks Full service bank 3.6 3.6 0.0
Gujarat Gas Utilities Natural gas 3.5 3.6 (0.2)
Kajaria Ceramics Industrials Tiles 3.3 3.4 (0.1)
Jyothi Laboratories Consumer staples FMCG 3.3 4.2 (0.6)
Total of top 10 43.2 44.4 (1.2)
Source: India Capital Growth Fund, Marten & Co, Marten & Co
India Capital Growth
Annual overview | 15 December 2020 16
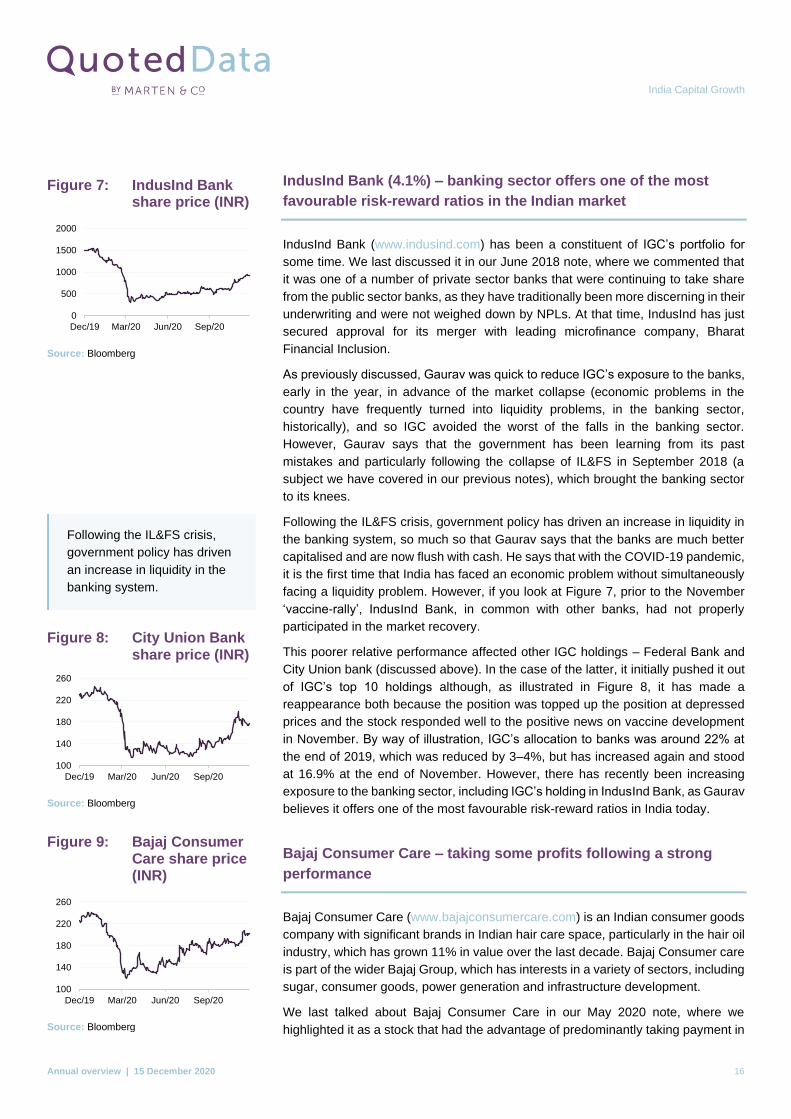
IndusInd Bank (4.1%) – banking sector offers one of the most
favourable risk-reward ratios in the Indian market
IndusInd Bank (www.indusind.com) has been a constituent of IGC’s portfolio for
some time. We last discussed it in our June 2018 note, where we commented that
it was one of a number of private sector banks that were continuing to take share
from the public sector banks, as they have traditionally been more discerning in their
underwriting and were not weighed down by NPLs. At that time, IndusInd has just
secured approval for its merger with leading microfinance company, Bharat
Financial Inclusion.
As previously discussed, Gaurav was quick to reduce IGC’s exposure to the banks,
early in the year, in advance of the market collapse (economic problems in the
country have frequently turned into liquidity problems, in the banking sector,
historically), and so IGC avoided the worst of the falls in the banking sector.
However, Gaurav says that the government has been learning from its past
mistakes and particularly following the collapse of IL&FS in September 2018 (a
subject we have covered in our previous notes), which brought the banking sector
to its knees.
Following the IL&FS crisis, government policy has driven an increase in liquidity in
the banking system, so much so that Gaurav says that the banks are much better
capitalised and are now flush with cash. He says that with the COVID-19 pandemic,
it is the first time that India has faced an economic problem without simultaneously
facing a liquidity problem. However, if you look at Figure 7, prior to the November
‘vaccine-rally’, IndusInd Bank, in common with other banks, had not properly
participated in the market recovery.
This poorer relative performance affected other IGC holdings – Federal Bank and
City Union bank (discussed above). In the case of the latter, it initially pushed it out
of IGC’s top 10 holdings although, as illustrated in Figure 8, it has made a
reappearance both because the position was topped up the position at depressed
prices and the stock responded well to the positive news on vaccine development
in November. By way of illustration, IGC’s allocation to banks was around 22% at
the end of 2019, which was reduced by 3–4%, but has increased again and stood
at 16.9% at the end of November. However, there has recently been increasing
exposure to the banking sector, including IGC’s holding in IndusInd Bank, as Gaurav
believes it offers one of the most favourable risk-reward ratios in India today.
Bajaj Consumer Care – taking some profits following a strong
performance
Bajaj Consumer Care (www.bajajconsumercare.com) is an Indian consumer goods
company with significant brands in Indian hair care space, particularly in the hair oil
industry, which has grown 11% in value over the last decade. Bajaj Consumer care
is part of the wider Bajaj Group, which has interests in a variety of sectors, including
sugar, consumer goods, power generation and infrastructure development.
We last talked about Bajaj Consumer Care in our May 2020 note, where we
highlighted it as a stock that had the advantage of predominantly taking payment in
Figure 7: IndusInd Bank share price (INR)
Source: Bloomberg
Following the IL&FS crisis,
government policy has driven
an increase in liquidity in the
banking system.
Figure 8: City Union Bank share price (INR)
Source: Bloomberg
Figure 9: Bajaj Consumer Care share price (INR)
Source: Bloomberg
0
500
1000
1500
2000
Dec/19 Mar/20 Jun/20 Sep/20
100
140
180
220
260
Dec/19 Mar/20 Jun/20 Sep/20
100
140
180
220
260
Dec/19 Mar/20 Jun/20 Sep/20

India Capital Growth
Annual overview | 15 December 2020 17
cash (this applies to a lot of fast-moving consumer goods companies in India), as
this gives them a cash cushion. The lack of receivables, while being able to pay
their creditors in 60 days or so, allows them to stretch out their cash conversion
cycle and makes them resilient during the downturn. Bajaj Consumer Care was
discussed as an example.
At that time, Gaurav highlighted that the company has gross margins of 67%, a
return on capital employed of 40% and cash in its books equivalent to 25% of its
then market capitalisation. Gaurav was expecting the shares to re-rate and, as
illustrated in Figure 9, this has come to pass. He has therefore been reducing IGC’s
exposure and taking profits on the position, which has moved it out of IGC’s top 10
holdings.
Berger Paints India – exited following a stellar performance
Berger Paints (www.bergerpaints.com) is a long-time holding in IGC’s portfolio and
one that we have discussed in our previous notes. The company has a strong and
defensible market position – the four main paint manufacturers in India form an
oligopoly (just a handful of competing companies) and have been disciplined in the
past for their pricing. We last discussed Berger Paints in detail in our October 2019
note, where we commented that all of the Indian market had been performing
relatively well during the then-prevailing period of market weakness, which had
helped to propel Berger Paints into IGC’s list of 10 largest holdings.
As illustrated in Figure 10, a similar phenomenon has been seen in current
challenging markets, with Berger Paints’s share priced having increased by 67.6%
from the market nadir as at 11 December 2020. This share price appreciation
reflects the fact that, in more economically-straitened times, people are less likely
to move properties and are more likely to re-invest in maintaining and improving
their existing assets, which – combined with its oligopoly pricing power – makes
Berger Paints’s cash flow and earnings resilient when times are difficult. Reflecting
this strong share price performance, Gaurav has been taking profits, reducing the
size of the position, and has now exited the position in its entirety.
Kajaria Ceramics – strong recovery in Q3 with asset utilisation greater than 90%
Kajaria Ceramics (www.kajariaceramics.com) describes itself as India’s number
one tile company. It is another long-time holding of IGC’s that we have discussed in
our previous notes. In our March 2016 initiation note, we explained how the
company transformed its business when it shifted its focus to higher added value
vitrified tiles, which allowed it to expand its margins from 11% to 17%. The company
also used to struggle with high working capital requirements and high capex
requirements, which held back free cash flow generation and led to a sub-optimal
ROCE. However, Kajaria was able to reduce its capex requirements by embarking
on a series of joint ventures with a number of independent small manufacturers in
Gujarat (its JV partners are responsible for the capex but Kajaria markets the
finished product) and credit terms were cut drastically (from 60 days down to 7/8
days), which greatly improved its cash flow.
Figure 10: Berger Paints India share price (INR)
Source: Bloomberg
Figure 11: Kajaria Ceramics share price (INR)
Source: Bloomberg
400
450
500
550
600
650
700
Dec/19 Mar/20 Jun/20 Sep/20
300
400
500
600
700
Dec/19 Mar/20 Jun/20 Sep/20
India Capital Growth
Annual overview | 15 December 2020 18
Initially, COVID had a significant impact on the company as it was forced to shutter
its operations in March which, when combined with supply chain restrictions and
partially shut dealer showrooms resulting, saw sales volume and revenue decline
by 61% and 60% respectively for the second quarter of 2020 compared to
corresponding quarter of the previous year. However, the third quarter saw a
marked turnaround in the company’s fortunes with its asset utilisation in excess of
90% and its sales volumes and revenue in line with the corresponding quarter the
previous year. The company said that subdued gas prices and a reduction in some
of overheads had led to an improvement in profit margins.
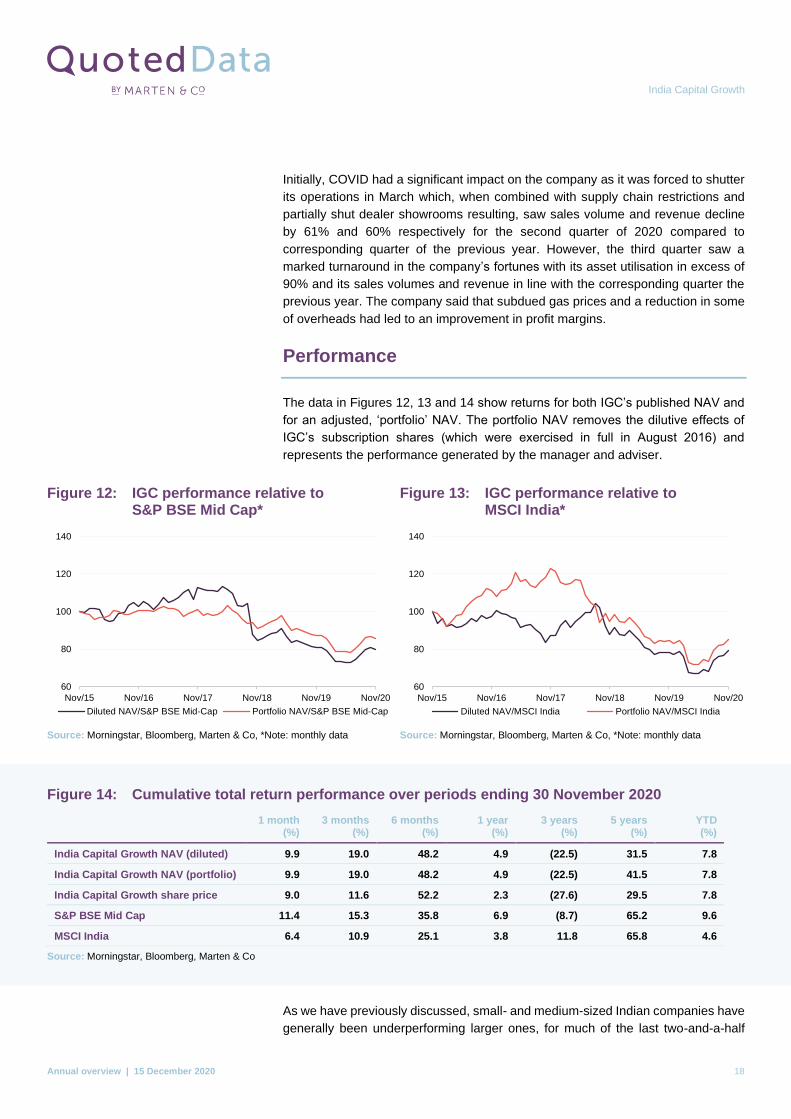
Performance
The data in Figures 12, 13 and 14 show returns for both IGC’s published NAV and
for an adjusted, ‘portfolio’ NAV. The portfolio NAV removes the dilutive effects of
IGC’s subscription shares (which were exercised in full in August 2016) and
represents the performance generated by the manager and adviser.
Figure 14: Cumulative total return performance over periods ending 30 November 2020
1 month (%)
3 months (%)
6 months (%)
1 year (%)
3 years (%)
5 years (%)
YTD (%)
India Capital Growth NAV (diluted) 9.9 19.0 48.2 4.9 (22.5) 31.5 7.8
India Capital Growth NAV (portfolio) 9.9 19.0 48.2 4.9 (22.5) 41.5 7.8
India Capital Growth share price 9.0 11.6 52.2 2.3 (27.6) 29.5 7.8
S&P BSE Mid Cap 11.4 15.3 35.8 6.9 (8.7) 65.2 9.6
MSCI India 6.4 10.9 25.1 3.8 11.8 65.8 4.6
Source: Morningstar, Bloomberg, Marten & Co
As we have previously discussed, small- and medium-sized Indian companies have
generally been underperforming larger ones, for much of the last two-and-a-half
Figure 12: IGC performance relative to S&P BSE Mid Cap*
Figure 13: IGC performance relative to MSCI India*
Source: Morningstar, Bloomberg, Marten & Co, *Note: monthly data Source: Morningstar, Bloomberg, Marten & Co, *Note: monthly data
60
80
100
120
140
Nov/15 Nov/16 Nov/17 Nov/18 Nov/19 Nov/20
Diluted NAV/S&P BSE Mid-Cap Portfolio NAV/S&P BSE Mid-Cap
60
80
100
120
140
Nov/15 Nov/16 Nov/17 Nov/18 Nov/19 Nov/20
Diluted NAV/MSCI India Portfolio NAV/MSCI India

India Capital Growth
Annual overview | 15 December 2020 19
years, and this has impacted on IGC’s performance relative to the MSCI India Index.
Stock selection decisions have also weighed on IGC’s performance relative to the
S&P BSE Mid Cap Index during the last couple of years. However, as we discussed
in our May 2020 note, the changes put in place to give more rigour to the investment
process were showing early signs of improving the stock selection performance,
and this has continued (the peer group analysis in the following section shows a
significant improvement in IGC’s performance relative to its peers). The
improvement is particularly evident in the three- and six-month periods. To recap,
the universe ranking tool, discussed in the investment process section, is seen as
adding more quantitative rigour to the investment process, as part of processes
installed to mitigate behavioural risk.
Peer group – marked improvement in IGC’s near
term relative performance
IGC is a member of the AIC’s Country Specialist: Asia Pacific-ex Japan sector,
which comprises 12 members with a variety of different focuses with the region. For
the purpose of this analysis, we are focusing on the four pure Indian equity funds,
which are listed in in Figures 15, 16 and 17.
Figure 15: Peer group cumulative NAV total return performance to 30 November 2020
1 month (%)
3 months (%)
6 months (%)
1 year (%)
3 years (%)
5 years (%)
YTD (%)
India Capital Growth NAV (diluted) 9.9 19.0 48.2 4.9 (22.5) 31.5 7.8
India Capital Growth NAV (portfolio) 9.9 19.0 48.2 4.9 (22.5) 41.5 7.8
Aberdeen New India 5.5 15.0 24.9 2.9 11.0 65.7 5.0
Ashoka India Equity 7.8 10.7 27.0 16.4 N/A N/A 17.8
JPMorgan Indian 6.0 13.9 24.0 (5.9) (8.7) 35.2 (4.9)
IGC (diluted) rank 1/4 1/4 1/4 2/4 3/3 3/3 2/4
Sector arithmetic avg. 7.3 14.7 31.0 4.6 (6.7) 44.1 6.4
Sector arithmetic avg. exc IGC 6.4 13.2 25.3 4.5 1.2 50.5 6.0
Source: Morningstar, Marten & Co
As illustrated in Figure 15, there has been a marked improvement in IGC’s
cumulative NAV total return performance relative to peers during the last six months
(IG ranks first over the one-, three- and six-month periods), which broadly coincides
with the changes to the investment process which the manager tells us is bearing
significant fruit, according to its own internal analysis. This strong performance is
starting to lift IGC’s performance over the medium-term horizons – it ranks second
YTD and over one-year. IGC ranks third over the three- and five-year periods but, if
the adviser’s changes continue to drive outperformance, IGC will move up the
rankings over these longer periods as well.
Up- to-date information on
IGC and its peers is available
on the QuotedData website.
The marked improvement in
IGC’s NAV performance
coincides with the changes to
the investment process.

India Capital Growth
Annual overview | 15 December 2020 20
Looking at Figure 16, a similar picture can be seen for IGC’s share price
performance (for example, it ranks first over six months, second over one-year and
year to date, and third over three and five-years). However, in the very short periods
of three and six months, IGC share price has not kept pace with the growth of its
NAV, allowing the discount to widen. Similarly, if IGC continues to outperform it
peers, this should lead to additional interest from investor both closing the discount
and pushing IGC’s share price performance up the peer group rankings for both the
short term and longer term periods. It is worth noting that, for a strategy such as
this, longer -term time frames are generally considered to be more relevant to
assessing performance, and we believe that the market is waiting to see if the recent
strong performance is maintained.
Figure 16: Peer group cumulative share price total return performance to 30 November 2020
1 month (%)
3 months (%)
6 months (%)
1 year (%)
3 years (%)
5 years (%)
YTD (%)
India Capital Growth 9.0 11.6 52.2 2.3 (27.6) 29.5 7.8
Aberdeen New India 3.9 14.4 27.1 2.0 8.2 54.9 2.5
Ashoka India Equity 19.1 15.8 35.4 15.3 N/A N/A 18.0
JPMorgan Indian 7.4 11.5 25.6 (12.8) (12.1) 29.4 (13.2)
IGC rank 2/4 3/4 1/4 2/4 3/3 3/3 2/4
Sector arithmetic avg. 9.9 13.3 35.1 1.7 (10.5) 37.9 3.8
Sector arithmetic avg. exc IGC 10.1 13.9 29.4 1.5 (2.0) 42.2 2.4
Source: Morningstar, Marten & Co
Figure 17: Peer group comparison – size, fees, discount, yield and gearing as at 9 December 2020
Market cap (£m)
St. dev. of NAV returns over 5 years
Ongoing charges
(%)
Perf. fee Premium/ (discount)
(%)
Dividend yield (%)
Gross gearing
Net gearing
India Capital Growth 91.0 1.30 1.85 No (17.5) Nil Nil (1.6)
Aberdeen New India 294.4 1.24 1.14 No (14.7) 0.04 7.3 9.3
Ashoka India Equity 91.3 1.34* 0.87 Yes 2.6 Nil nil 6.9
JPMorgan Indian 522.6 1.35 1.06 No (14.6) Nil 5.1 4.3
IGC rank 4 2 4 4 2 1 1
Sector arithmetic avg. 249.8 1.31 1.23 (11.1) 0.01 3.1 6.3
Sector arithmetic avg. exc IGC
302.8 1.3 1.0 (8.9) 0.0 4.1 6.8
Source: Morningstar, Marten & Co *Note: Ashoka India Equity standard deviation of returns is from launch on 6 July 2018.
As illustrated in Figure 17, IGC is the smallest of the four funds focused on India
and listed in London and this is a significant reason why it has the highest ongoing
charges ratio of this peer group. Ashoka India Equity’s ongoing charges ratio is
particularly low, because it does not charge a base management fee, but unlike the
If IGC continues to outperform
it peers, this should lead to
additional interest from
investor both closing the
discount and pushing IGC’s
share price performance up
the peer group rankings.

India Capital Growth
Annual overview | 15 December 2020 21
rest of the peers charges a performance fee of 30% of outperformance (capped),
measured over three years, to compensate. Consequently, in years where the
performance fee falls due, its ongoing charges ratio will increase accordingly,
pushing it up the rankings.
IGC is operating with a net cash position, unlike its peers. Volatility of NAV returns,
as measured by the standard deviation of daily NAV returns over five years, are
broadly comparable across the four peers, although IGC ranks sector with volatility
that is marginally below the sector average.
Discount
As illustrated in Figure 18, IGC’s discount widened sharply as markets collapsed in
March, in the face of an accelerating COVID-19 infection rate. However, as also
illustrated in Figure 18, this showed some clear reversion in April and then in May,
but this saw a dramatic narrowing on 26 May when IGC published a series of
proposals regarding its future. Readers interested in more details of the proposals
should see our previous note, also published on 26 May 2020, which covered the
proposals in more detail. However, to recap, a summary is provided as follows:
• The introduction of a redemption facility, giving shareholders the right to
request the redemption of part or all of their shareholding on 31 December
2021 and every second year thereafter at an exit discount equal to a
maximum of a 6% discount to NAV per redemption share;
• A change to the investment manager’s fee from 1.25% of total assets per
annum to the lower of 1.25% of average market capitalisation (calculated on a
daily basis) per annum or 1.25% of total assets per annum with effect from
1 July 2020 with a further review to the investment manager’s fee in 2022; and
• IGC may seek to satisfy redemption requests by matching such requests with
demand for new ordinary shares from incoming investors.
Following the announcement of these proposals, shareholders voted to approve
IGC’s continuation on 12 June. It now has until December 2021 to prove itself.
However, it is noteworthy that reflecting both better than expected economic data,
and welcome news on the development of a vaccine, IGC’s discount has continued
to narrow as markets have advanced. As at 11 December 2020, IGC was trading at
a discount of 15.6%, which is fractionally narrower than five-year average of
16.4%. During the last 12 months, it has traded within a range of 44.1% (at the
height of the market collapse) to 13.0%, with a one-year average of 22.9%.
The most likely catalysts for a further narrowing of IGC’s discount would be an
improvement in its relative performance and an improvement in sentiment towards
mid-cap Indian stocks. The adviser comments that the companies in the portfolio
are still, on average, very cheap and with signs that India is getting a better handle
on controlling the virus, this might suggest that the trust would respond well to any
improvement in India’s economy. For IGC’s shareholders, that might be
compounded by a narrowing of the discount. We think that, should portfolio
companies start to see a marked uplift in performance, this is likely to provide
momentum for the discount to narrow, as more focus turns towards attractive
valuations and India’s long-term opportunity to widen its manufacturing base.

India Capital Growth
Annual overview | 15 December 2020 22
Fees and costs
The investment manager is entitled to receive a management fee payable jointly by
IGC and ICG Q Limited (see page 5 for an explanation), equivalent to 1.25% per
annum (pre 1 July 2019 1.5%) of gross assets less current liabilities. Either side
must give 12 months’ notice to end the contract. There is no performance fee.
The administrator is Apex Fund Services (Guernsey) Limited. The custodian of
IGC’s assets is Mumbai-based, Kotak Mahindra Bank Limited. Cash is held in both
Mauritius and India.
The ongoing charges ratio for the year ended 31 December 2019 was 1.85%,
slightly lower than the equivalent figure for 2018 (1.91%). The decrease reflects the
reduction in management fee (noted above), which occurred halfway through the
year. All things being equal, the ongoing charges ratio would have been lower still
for 2019. However, IGC also saw a reduction in its asset base for 2019 versus 2018
(for example, total net assets at the end of 2019 were £99.6m, versus £114.4m at
the end of 2018), which will have served to elevate the ongoing charges ratio as
IGC’s fixed costs were spread over a smaller base.
Looking to the year ended 31 December 2020, IGC’s ongoing charges ratio should
benefit from having a full year of the management fee being charged at the new
lower rate.
Figure 18: IGC discount over five years
Source: Morningstar, Marten & Co
Base management fee of
1.25%, with no performance
fee.
Ongoing charges ratio is
benefitting from the cut in
IGC’s management fee.
-50
-45
-40
-35
-30
-25
-20
-15
-10
-5
0
Nov/15 May/16 Nov/16 May/17 Nov/17 May/18 Nov/18 May/19 Nov/19 May/20 Nov/20
Premium/(discount) Five-year average premium/(discount) Three-month moving average premium/(discount)
Brexit
COVID-19 market
collapse
IGC's discount is close to its
five-year average
IGC announces proposals
regarding its future

India Capital Growth
Annual overview | 15 December 2020 23
Capital structure and life
IGC has a simple capital structure with one class of ordinary shares in issue. Its
ordinary shares have a premium main market listing on the London Stock Exchange
and, as at 11 December 2020, there were 112,502,173 of these in issue with nil held
in treasury. IGC has the authority to buy back up to 14.99% of its issued share
capital, a power that it renews at each AGM. Figure 19 shows the major
shareholders in IGC at the 30 November 2020.
IGC maintains an ungeared portfolio
Although permitted to, the manager does not employ gearing in the management of
the fund. This reflects the relative volatility of the Indian stock market. The manager
will normally keep cash of 3–4% on hand to take advantage of attractive investment
opportunities as they arise.
Figure 19: Major shareholders as at 30 November 2020
Source: India Capital Growth Fund, Marten & Co
Unlimited life with a full redemption opportunity every two years
The introduction of a redemption facility gave shareholders the right to request the
redemption of part or all of their shareholding on 31 December 2021 and every
second year thereafter at an exit discount equal to a maximum of a 6% discount to
NAV per redemption share.
Lazard Asset Management 20.0%
Hargreaves Lansdown 9.0%
City of London 5.8%
Interactive Investor 5.3%
Premier Miton 4.2%
Charles Stanley 4.1%
Armstrong Investments 3.2%
Other 48.5%
A simple capital structure with
one class of ordinary share in
issue.
The manager does not use
gearing.

India Capital Growth
Annual overview | 15 December 2020 24
Financial calendar
IGC’s financial year end is 31 December. The annual results are usually released
in March (interims in September) and its AGMs are usually held in June of each
year. IGC does not pay a dividend.
Investment advisory team
Gaurav Narain – co-head of equities
Gaurav Narain joined Ocean Dial in November 2011 and has been involved with the
Indian markets for the past 25 years. He has held senior positions as both a Fund
Manager and an equities analyst for New Horizon Investments, ING Investment
Management India and SG (Asia) Securities India. Gaurav holds a Master’s degree
in Finance and Control and a Bachelor of Economics from Delhi University, and is
based in Mumbai.
Tridib Pathak – co-head of equities
Tridib Pathak has had a career in the Indian financial markets that spans over 30
years, with stints in project finance, credit analysis and latterly pan-Asia equity
research for UBS Securities. His buy-side career began in 1999, since which he has
been investing in Indian equities for both domestic and international investors at
firms including Lotus Asset Management and DBS Cholamandalam, where he
served as CIO. Tridib joined Ocean Dial in 2019 from the Enam Group, where he
was Senior Portfolio Manager for four years. He is a Chartered Accountant from the
Institute of Chartered Accountants of India.
Shahil Shah – assistant fund manager
Shahil Shah was part of the original investment team which was set up in 2005 and
specialises in Telecommunications, Consumer, Healthcare, and Media sectors. He
holds a Master’s degree in Commerce and Finance from Mumbai University and is
based in London. Shahil supports the Co-Heads of Equities in the day-to-day
maintenance of the funds.
Saurabh Chugh – analyst
Saurabh Chugh was the part of the original investment team and joined in 2006. He
specialises in Information Technology, Energy, Transport, Infrastructure and Soft
Commodities. He holds an MBA in Finance from Nirma Institute of Management,
Ahmedabad, and is based in Mumbai.
Ankush Kedia – analyst
Ankush Kedia joined Ocean Dial team in April 2018 and is based in Mumbai. He
has 12 years of investment experience in public markets and private equity. He

India Capital Growth
Annual overview | 15 December 2020 25
previously worked for Avezo Advisors (a division of Avendus Capital) as Principal
and Co-fund Manager focusing on private equity style investments in small- and
mid-cap listed companies in India. Prior to Avezo, Ankush worked with Mayfield
Fund and Axis Bank. Ankush holds an MBA in Finance and Economics from XLRI,
Jamshedpur and a BTech in Mechanical Engineering from IIT Roorkee.
Ashutosh Garud
Ashutosh Garud joined Ocean Dial in 2020 after working as Associate Portfolio
Manager in the Avendus Wealth Management Team. Prior to joining Avendus, he
worked with Reliance Wealth Management. Ashutosh holds an MBA in Finance
from Chetana Institute of Management Studies, a Bachelor of Commerce &
Economics from Mumbai University, and is a CFA charterholder.
Saurabh Rathore – analyst
Saurabh Rathore joined the Ocean Dial team in January 2020 and is based out of
Mumbai. He has three years of experience in financial services across global
markets, investment analysis and due diligence, business strategy and risk
management. Prior to Ocean Dial, Saurabh has been associated with Avendus,
Credit Suisse and J.P. Morgan. He holds a B.E(Hons) in Electrical and Electronics
Engineering from BITS-Pilani and an FRM Charter, and has cleared CFA Level-III
examination.
Board
The board consists of three non-executive directors, all of whom are independent
of the manager and who do not sit together on other boards. Any director who has
served for more than nine years stands for re-election annually, and one third of the
remaining directors retire by rotation at each AGM and seek re-election. The
maximum total payable to the directors is set in the articles of association as
£200,000. Patrick Firth joined is the newest member of IGC’s board. He was
appointed with effect from 25 September 2020, taking over the role of chairman of
the audit committee from John Whittle, who retired at IGC’s AGM that same day.
Figure 20: Board member – length of service and shareholdings
Director Position Date of appointment Length of service (years)
Annual fee (GBP)
Shareholding 1
Elisabeth Scott Chairman 18 December 2017 3.0 35,000 50,000
Patrick Firth Chairman of the audit committee 25 September 2011 0.2 28,500 25,000
Peter Niven Director 11 August 2011 9.3 25,000 37,500
Source: India Capital Growth Fund, Marten & Co 1) Note: shareholdings as per most recent company announcements as at 11 December 2020.

India Capital Growth
Annual overview | 15 December 2020 26
Elisabeth Scott (chairman)
Elisabeth Scott has 34 years’ experience in the asset management industry, having
started as a US equity fund manager in Edinburgh in 1985. She went to Hong Kong
in 1992, where she remained until 2008, most recently in the role of managing
director and country head of Schroder Investment Management (Hong Kong)
Limited and chairman of the Hong Kong Investment Funds Association.
Patrick Firth (chairman of the audit committee)
Patrick Firth is a chartered accountant. He qualified with KPMG and has worked in
the investment and funds industry in operations and management in Guernsey for
nearly 30 years. Patrick Firth is also a non-executive Director of ICG Longbow
Senior Secured UK Property Debt Investments Limited, Riverstone Energy Limited
and NextEnergy Solar Fund Limited and chairman of AIM-traded GLI Finance
Limited.
Peter Niven (director)
Peter Niven has over 40 years’ experience in the financial services industry, both in
the UK and offshore. He was a senior executive in the Lloyds TSB Group until his
retirement in 2004, and until July 2012 was the chief executive of Guernsey Finance
LBG, promoting the island as a financial services destination. He is a Fellow of the
Chartered Institute of Bankers and a chartered director.
Previous publications
Readers interested in further information about IGC may wish to read our previous
notes (details are provided in Figure 21 below). You can read the notes by clicking
on them in Figure 21 or by visiting our website.
Figure 21: QuotedData’s previously published notes on IGC
Title Note type
Compounding machine Initiation 23 March 2016
Indian powerhouse Update 8 July 2016
India at a significant discount Update 21 October 2016
Full steam ahead Annual overview 29 March 2017
Moving to the main board Update 30 January 2018
A return to earnings growth Annual overview 26 June 2018
Shakeout uncovers value Update 29 November 2018
Discounted value Annual overview 1 October 2019
Needs more time Update 26 May 2020
Source: Marten & Co

Accuracy of Content: Whilst Marten & Co uses reasonable efforts to obtain information from sources which we believe to be reliable and to ensure
that the information in this note is up to date and accurate, we make no representation or warranty that the information contained in this note is
accurate, reliable or complete. The information contained in this note is provided by Marten & Co for personal use and information purposes
generally. You are solely liable for any use you may make of this information. The information is inherently subject to change without notice and may
become outdated. You, therefore, should verify any information obtained from this note before you use it.
No Advice: Nothing contained in this note constitutes or should be construed to constitute investment, legal, tax or other advice.
No Representation or Warranty: No representation, warranty or guarantee of any kind, express or implied is given by Marten & Co in respect of
any information contained in this note.
Exclusion of Liability: To the fullest extent allowed by law, Marten & Co shall not be liable for any direct or indirect losses, damages, costs or
expenses incurred or suffered by you arising out or in connection with the access to, use of or reliance on any information contained in this note. In
no circumstance shall Marten & Co and its employees have any liability for consequential or special damages.
Governing Law and Jurisdiction: These terms and conditions and all matters connected with them, are governed by the laws of England and
Wales and shall be subject to the exclusive jurisdiction of the English courts. If you access this note from outside the UK, you are responsible for
ensuring compliance with any local laws relating to access.
No information contained in this note shall form the basis of, or be relied upon in connection with, any offer or commitment whatsoever in any
jurisdiction.
Investment Performance Information: Please remember that past performance is not necessarily a guide to the future and
that the value of shares and the income from them can go down as well as up. Exchange rates may also cause the value of
underlying overseas investments to go down as well as up. Marten & Co may write on companies that use gearing in a number
of forms that can increase volatility and, in some cases, to a complete loss of an investment.
IMPORTANT INFORMATION
This marketing communication has been
prepared for India Capital Growth Fund Limited
by Marten & Co (which is authorised and
regulated by the Financial Conduct Authority)
and is non-independent research as defined
under Article 36 of the Commission Delegated
Regulation (EU) 2017/565 of 25 April 2016
supplementing the Markets in Financial
Instruments Directive (MIFID). It is intended for
use by investment professionals as defined in
article 19 (5) of the Financial Services Act 2000
(Financial Promotion) Order 2005. Marten & Co
is not authorised to give advice to retail clients
and, if you are not a professional investor, or in
any other way are prohibited or restricted from
receiving this information, you should
disregard it. The note does not have regard to
the specific investment objectives, financial
situation and needs of any specific person
who may receive it.
The note has not been prepared in
accordance with legal requirements designed
to promote the independence of investment
research and as such is considered to be a
marketing communication. The analysts who
prepared this note are not constrained from
dealing ahead of it but, in practice, and in
accordance with our internal code of good
conduct, will refrain from doing so for the period
from which they first obtained the information
necessary to prepare the note until one month
after the note’s publication. Nevertheless, they
may have an interest in any of the securities
mentioned within this note.
This note has been compiled from publicly
available information. This note is not directed
at any person in any jurisdiction where (by
reason of that person’s nationality, residence or
otherwise) the publication or availability of this
note is prohibited.
QuotedData is a trading name of Marten & Co., which is authorised and
regulated by the Financial Conduct Authority.
123a Kings Road, London SW3 4PL
0203 691 9430
www.QuotedData.com
www.martenandco.com
Registered in England & Wales number 07981621,
2nd Floor Heathmans House,
19 Heathmans Road, London SW6 4TJ
Edward Marten ([email protected])
David McFadyen ([email protected])
Alistair Harkness ([email protected])
INVESTMENT COMPANY RESEARCH:
Matthew Read ([email protected])
James Carthew ([email protected])
Shonil Chande ([email protected])
Richard Williams ([email protected])