India-ASEAN FTA: Implication of Phased … FTA: Implication of Phased Liberalisation ... optical,...
28
1 India-ASEAN FTA: Implication of Phased Liberalisation -Biswajit Nag * and Chandrima Sikdar** Paper Prepared for 14 th Annual Conference on Global Economic Analysis to be held at Ca' Foscari University of Venice, San Giobbe Campus, Venice, Italy 16-18 June 2011 Abstract The India-ASEAN Free Trade Agreement came into effect on January 1, 2010 with respect to Malaysia, Singapore and Thailand. For the remaining ASEAN members it will come into force after they complete their internal requirements. With this background, the present study seeks to analyse the impact of this FTA on India and the selected ASEAN countries following the phased liberalization. It also aims to study the impact of the FTA on Rest of South Asia and other ASEAN members. Using the GTAP database the study conducts a number of simulations involving different scenarios of India’s trade liberalization with ASEAN region and assesses the impact of this liberalization both on the economies’ external sector and their domestic macroeconomic variables. The welfare implications of the FTA for the countries involved are also studied. The simulation results reveal that India’s gain is mainly from the allocative efficiency. However, ASEAN countries receive large terms of trade gain in Indian market. The products coming from these countries are likely to be available at a price substantially lower than the average import price at which these goods are available in India. Indian firms are also gradually substituting domestic input by foreign inputs and thereby increasing the allocative efficiency. There is a signal that this agreement will increase trade diversion and many countries including China will loose market share in India. The paper also analyses the impact on various sectors, changes in output, factor demand and factor prices. The paper argues that in the long run after full trade liberalization, India’s allocative efficiency will increase but terms of trade effect will continuously fall and remain negative. India will be able to arrest the fall in terms of trade once the gain in allocative efficiency is used to improve the productivity in the export oriented sectors and achieve economies of scale. With the assumption of economies scale in selected Indian industries, India’s welfare gain stops falling and moves upward. A simple mathematical model has been proposed to analyse this. * Associate Professor at Indian Institute of Foreign Trade, New Delhi, India ([email protected] ) ** Former Assistant Professor at Indian Institute of Foreign Trade, New Delhi, India ([email protected] ) Views expressed in the article are personal
Transcript of India-ASEAN FTA: Implication of Phased … FTA: Implication of Phased Liberalisation ... optical,...

1
India-ASEAN FTA: Implication of Phased Liberalisation
-Biswajit Nag * and Chandrima Sikdar**
Paper Prepared for 14th Annual Conference on Global Economic Analysis to be held at Ca' Foscari University of Venice, San Giobbe Campus, Venice, Italy
16-18 June 2011
Abstract
The India-ASEAN Free Trade Agreement came into effect on January 1, 2010 with respect to Malaysia, Singapore and Thailand. For the remaining ASEAN members it will come into force after they complete their internal requirements. With this background, the present study seeks to analyse the impact of this FTA on India and the selected ASEAN countries following the phased liberalization. It also aims to study the impact of the FTA on Rest of South Asia and other ASEAN members. Using the GTAP database the study conducts a number of simulations involving different scenarios of India’s trade liberalization with ASEAN region and assesses the impact of this liberalization both on the economies’ external sector and their domestic macroeconomic variables. The welfare implications of the FTA for the countries involved are also studied. The simulation results reveal that India’s gain is mainly from the allocative efficiency. However, ASEAN countries receive large terms of trade gain in Indian market. The products coming from these countries are likely to be available at a price substantially lower than the average import price at which these goods are available in India. Indian firms are also gradually substituting domestic input by foreign inputs and thereby increasing the allocative efficiency. There is a signal that this agreement will increase trade diversion and many countries including China will loose market share in India. The paper also analyses the impact on various sectors, changes in output, factor demand and factor prices. The paper argues that in the long run after full trade liberalization, India’s allocative efficiency will increase but terms of trade effect will continuously fall and remain negative. India will be able to arrest the fall in terms of trade once the gain in allocative efficiency is used to improve the productivity in the export oriented sectors and achieve economies of scale. With the assumption of economies scale in selected Indian industries, India’s welfare gain stops falling and moves upward. A simple mathematical model has been proposed to analyse this.
* Associate Professor at Indian Institute of Foreign Trade, New Delhi, India ([email protected]) ** Former Assistant Professor at Indian Institute of Foreign Trade, New Delhi, India ([email protected] ) Views expressed in the article are personal

2
I. India ASEAN FTA: A Snapshot
The India-ASEAN Free Trade Agreement (AIFTA) came into effect on January 1, 2010 with respect to Malaysia, Singapore and Thailand. For the remaining ASEAN members it will come into force after they complete their internal requirements. Of the ten countries India’s trade with ASEAN is mainly concentrated in Indonesia, Malaysia, Singapore and Thailand. Singapore happens to be the largest destination for Indian goods (38% of total exports to ASEAN in 2009 and also the largest source of imports for India except in 2009 in which imports from Indonesia surpassed Singapore (26% of India’s total imports from ASEAN in 2009 comes from Singapore and 31% comes from Indonesia) . As has been mutually agreed the tariff liberalization under the India-ASEAN FTA would gradually cover 75% of the two-way trade between India and the ASEAN member countries starting from January 2010. The FTA will lead to the elimination of tariff for about 4000 products including electronics, chemicals, machinery and textiles. Of these 4000 products, 3200 products would have duties reduced by end of the year 2013, while duties on remaining 800 products would be lowered to zero or near zero by end of 2016. Under the Trade in Goods Agreement, the Schedules of Tariff Commitments have been drawn by all the member countries indicating product-wise tariff concessions or no concessions. One important observation about the tariff cuts under this agreement is about the base rates, which are the applied rates (not the bound rates) as of 1 July 2007, except for products identified as Special Products. Implications of taking applied rates as base rates are quite far-reaching for product lines and countries where there is considerable difference between bound and applied rates. The schedule of tariff reduction commitments undertaken by the AIFTA members varies significantly among them. For example, India’s commitments to the Philippines are quite different from her commitments to the rest of the ASEAN countries. This is true for each ASEAN member also as each one of them has separate tariff reduction schedule vis-à-vis India. In spite of the variability among the tariff schedules they share certain common features as outlined in Article 4 and Annex 1 of the Agreement (goods section). The tariff lines are divided into four broad categories (see Table 1), viz., Normal Track, Sensitive Track, Special Products, Highly Sensitive Lists and Exclusion List according to the intensity of tariff reduction or elimination commitments1.
Normal Track products are divided into two sub-groups Normal Track 1 and 2. In Normal Track 1 for India, Brunei, Indonesia, Malaysia, Singapore, and Thailand the reduction process will commence on 1 January 2010 and complete elimination would be achieved by 31 December 2013. Philippines, Cambodia, Lao PDR, Myanmar, and Viet Nam are given a grace period up to 31 December 2018 for completely eliminating the tariffs. In Normal Track 2, complete elimination would be achieved before 31 December 2016 for Brunei, Indonesia, Malaysia, Singapore, Thailand and India. But, Cambodia, Lao PDR, Myanmar, and Viet Nam can wait till 31 December 2021 for achieving complete elimination.
1 K N Harilal (2010): “ASEAN-India Free Trade Area: Noises of Dissent From Deep South”, Occasional Paper 01, Kerala State Planning Board, Thiruvananthapuram

3
Table 1: Proportion of Tariff Lines under Different Categories by ASEAN Members and India
Country Categories EL NT-1 NT-2 SP ST HSL - A HSL - B HSL - C Total
India 10.7 63.9 10.3 0.3 14.8 Nil Nil Nil 100.0 Brunei 12.8 68.6 11.3 Nil 7.4 Nil Nil Nil 100.0 Cambodia 2.0 80.4 4.1 Nil 13.2 0.2 Nil Nil 100.0 Indonesia 7.6 41.8 4.7 Nil 39.5 Nil 0.1 6.3 100.0 Lao PDR 2.8 69.5 8.6 Nil 19.2 Nil Nil Nil 100.0 Malaysia 9.9 59.2 14.6 Nil 15.1 Nil 0.3 0.9 100.0 Myanmar 14.1 64.4 7.5 Nil 14.0 Nil Nil Nil 100.0 Philippines 13.0 58.9 17.0 Nil 6.8 Nil Nil 4.4 100.0 Vietnam 18.3 60.3 8.9 Nil 7.0 0.4 1.2 4.0 100.0 Thailand 12.2 67.0 8.9 Nil 11.7 0.2 Nil Nil 100.0
Note: EL refers to Exclusion List; NT-1 and 2 to Normal Track 1 and 2; SP to Special Products; ST for Sensitive Track and HSL – A, B and C to Highly Sensitive Lists A, B and C; Singapore is not included in the analysis for it follows near perfect free trade policies. Source: K N Harilal (2010): “ASEAN-India Free Trade Area: Noises of Dissent From Deep South”, pp. 7; Occasional Paper 01, Kerala State Planning Board, Thiruvananthapuram While India keeps around 10.7 per cent of her tariff lines in the exclusion list, Vietnam, keeps nearly 18.3 per cent of the tariff lines under this category. Considering all ASEAN members together, they have kept around 10 per cent of the tariff lines in the exclusion list. It follows from the above that nearly 90 per cent of the tariff lines are subject to reduction commitments. It is also important to note that there are no tariff reduction commitments under exclusion list vis-à-vis the base rates, i.e., applied rates as on 1 July 2007. But, these base rates, which are the upper limits to which tariffs can be raised in the AIFTA regime and they are much lower than their corresponding WTO bound rates in case of India. The proportion of tariff lines kept under the Highly Sensitive Lists (HSL) also varies significantly among members. India does not keep any tariff line under these lists. Indonesia has nearly 6.4 per cent of the tariff lines kept under the HSL. Malaysia (1.2 %), Philippines (4.4 %), Vietnam (5.6 %) and Cambodia (0.2 %) are the other members using the HSL facility. Instead, India has kept 14.8% tariff lines in the sensitive category which includes some spices, products of animal origin, chemical products including pharmaceutical products, specific plastic, polymer, rubber and leather products, some cotton woven etc. Apart from this, India’s list consists of special products which are not there in the list of other countries who are party to this agreement. This constitutes only around 0.3 per cent of India’s tariff lines. Special Product is an exclusive group designed for the five product groups viz., crude and refined palm oil, coffee, black tea and pepper. There is hardly any uniformity in the reduction commitments among these five product groups (see Table 2).
Table 2: Reduction Commitment by India of Special Products under India-ASEAN FTA
Tariff Line Base Rate - not later than 1st January 31.12.2019 2010 2013 2016 2019
Crude Palm Oil 80 76 64 52 40 37.5 Refined Palm Oil 90 86 74 62 50 45 Coffee 100 95 80 65 50 45 Black Tea 100 95 80 65 50 45 Pepper 70 68 62 56 51 50
Note: The original table gives rates for all the years between 2010 and 2019 Source: K N Harilal (2010): “ASEAN-India Free Trade Area: Noises of Dissent From Deep South”, pp. 9; Occasional Paper 01, Kerala State Planning Board, Thiruvananthapuram

4
II. India’s Trade with ASEAN ASEAN as a group is an important trade partner of India. Almost 10% of India’s exports go to ASEAN and India imports almost 9% of its total imports from these countries together. India’s exports increased by leaps and bounds in countries like Singapore, Malaysia, Indonesia, Thailand and Vietnam, etc. During 2008 and 2009, India’s imports from Indonesia, Singapore and Vietnam have also grown rapidly. Table 3 provides export import data with respect to bilateral trade between India and ASEAN members.
It is important to note that India’s exports to smaller ASEAN countries such as Cambodia, Lao PDR, and Myanmar have increased substantially in recent times. India’s import of petroleum from Brunei jumped substantially in recent times. It is now occupying more than 2% of India’s imports from ASEAN. Figure 1 provides a snapshot of the importance of individual ASEAN countries as India’s export destination and import source as a percentage to India’s total exports and import to/from ASEAN.
The main exports of India to the ASEAN region are meat, edible vegetables and fruits, cereals, cotton, tobacco, salt, sulphur, organic chemicals, pharmaceutical products, iron and steel, copper, electrical & electronic equipments, machineries etc. The main imports of India from the ASEAN region are items like mineral fuels, animal & vegetable fats, chemicals, pharmaceutical products, rubber products, wood products, electronic equipments, machineries, ships, boats & floating structures, optical, photopgraphic, musical instruments etc. However, for individual countries it is widely different. For example, in Cambodia, Lao PDR, Myanmar, India’s one of the major exportable is medicines and pharmaceutical products but in Singapore, Malaysia and Thailand machinery, accessories, precious stones, meat and animal products occupy primary position. Similarly, India imports mineral fuel from Brunei, Indonesia and Malaysia, and electronic products from Singapore, Thailand, wood products from Myanmar, etc. Table 4 provides a summary picture of major tradable products between India and ASEAN members.
Table 3: India’s exports to and imports from the ASEAN member countries (2005 – 2009) ASEAN members
Exports (US $ '000) Imports (US $ '000)
2005 2006 2007 2008 2009 2005 2006 2007 2008 2009 Brunei 4395 44462 8814 17155 25302 832 225719 234094 325861 489037
Cambodia 21350 48089 44826 53854 41564 425 1482 1245 4271 3745
Indonesia 1390066 1869806 1878196 2659314 3002991 3018949 3610443 4840346 6431337 7599638
Lao PDR 6540 2362 2939 4591 26919 72 376 80 525 194
Malaysia 1143775 1331365 1850254 3034408 3524714 2435996 4655925 5725558 7461390 4990269
Myanmar 117246 124088 162757 237333 208183 489162 702698 809067 906267 1181825
Philippines 482110 596836 571413 755025 697315 203196 208768 173536 227640 342967
Singapore 5427555 6127250 6390068 8853900 6827539 3159416 5184562 6901607 8304751 6141634
Thailand 1059267 1350985 1673337 2005280 1710808 1196597 1550809 2192368 2664791 2775885
Vietnam 633465 874098 1241477 1812607 1833500 127378 159826 153134 371605 442906
% share in India's total exports
10.25 10.21 9.48 10.69 10.13
% share in India's total imports
7.55 9.15 9.62 8.46 9.00
Source: WITS

5
Figure 1: Share (%) of Individual country in India’s Trade with ASEAN Share (%) of Individual country in India’s Exports
to ASEAN in 2009
Share (%) of Individual country in India’s Imports
ASEAN in 2009
Vietnam, 10.24
Thailand, 9.56
Singapore, 38.15
Philippines, 3.90
Myanmar, 1.16
Malaysia, 19.69
Lao PDR, 0.15
Indonesia, 16.78
Brunei, 0.14 Cambodia, 0.23
Thailand, 11.58
Singapore, 25.62
Myanmar, 4.93
Philippines, 1.43
Malaysia, 20.82
Lao PDR, 0.00
Indonesia, 31.71
Cambodia, 0.02
Brunei, 2.04Vietnam, 1.85
Note: Sum of share for ASEAN as a group is 100 Source: WITS
Table 4: Top exporting / importing items of India to / from different ASEAN countries Partner Name
Export Import
Brunei Articles of iron or steel, mechanical machineries, , Electrical machines equip parts, Meat and edible meat, Edible vegetables
Mineral fuels, oils, Natural/cultured pearls, prec stone, Ships, boats and floating structure, boilers, mechanical machineries, Optical, photo, cine, meas
Cambodia Pharmaceutical products, Cotton, Tobacco and manufactured tobacco, Man-made staple fibres, Raw hides and skins
Animal/veg fats & oils, Edible fruit and nuts, Miscellaneous chemical products, Art of apparel & clothing access, Pharmaceutical products
Indonesia Mineral fuels, oils, Electrical mchy equip, Organic chemicals, Ships, boats, Iron and steel.
Animal/veg fats & oils, Mineral fuels, oils, Ores, slag and ash, Rubber and articles thereof, Organic chemicals
Lao PDR Pharmaceutical products, Electrical mchy equip, Optical, photo, cine, meas, Aluminium and articles thereof, Articles of iron or steel,
Lac; gums, resins, Wood and articles of wood, Electrical mchy equip parts, herbal products, Natural/cultured pearls, prec stone
Malaysia Ships, boats and floating structure, Mineral fuels, oils, Organic chemicals, Electrical mchy equip parts, boilers, mechanical machineries
Mineral fuels, oils & product, Animal/veg fats & oils, boilers, mchy, Electrical mchy equip parts, Wood and articles of wood
Myanmar Pharmaceutical products, Iron and steel, Electrical mchy equip parts, Mineral fuels, oils & product, boilers, mechanical machineries
Edible vegetables and certain roots, Wood and articles of wood, Sugars and sugar confectionery, Products of animal origin, Coffee, tea and spices.
Philippines Meat and edible meat, Electrical mchy equip parts, Iron and steel, Vehicles, Pharmaceutical products
Electrical mchy equip parts, Mineral fuels, oils & product, Paper & paperboard, boilers, mechanical machineries, Vehicles
Singapore Mineral fuels, oils & product, Ships, boats and floating structure, Natural/cultured pearls, prec stone, Electrical mchy equip parts, boilers, mechanical machineries
Electrical mchy equip parts, Mineral fuels, oils & product, boilers, mechanical machineries, Organic chemicals, Ships, boats and floating structure
Thailand Natural/cultured pearls, prec stone, Electrical mchy equip parts, Residues & waste from the food, Organic chemicals, Iron and steel
boilers, mechanical machineries, Electrical mchy equip parts thereof, Plastics and articles thereof. Organic chemicals. Rubber and articles thereof.
Vietnam Residues & waste from the food, Meat and edible meat, Electrical mchy equip parts, Cereals, Iron and steel
Electrical mchy equip parts, Coffee, tea, matï and spices, Salt, mechanical machineries, Mineral fuels, oils & product
Source: Derived from WITS

6
III. Objectives and Motivation
So far among all FTAs in which India is involved, AIFTA constitutes the biggest trade volume. Hence, the macroeconomic impact of this agreement is expectedly large enough to influence many of the important issues such as welfare, production efficiency, employment situation, resource redistribution etc. along with important variables such as GDP, trade volume, prices, factor prices, etc. Against this backdrop the present study seeks to analyse the impact of this trade agreement and the consequent free entry of a large number of goods from the ASEAN countries to the Indian economy through an applied general equilibrium (AGE) model. This will help us to assess the possible direction in which the major macroeconomic variables will move through their constant interaction due to an open trade regime. The study uses the Global Trade Analysis Project (GTAP) to analyze the impact of the India-ASEAN FTA on India and the countries of the ASEAN region. Several simulations through GTAP data will be run to understand this impact calibrating various liberalisation scenarios. As it has been highlighted in Section I that AIFTA will progress gradually, we’ll also be able to understand the impact of this phased liberalisation through modifying simulation framework. The computable general equilibrium (CGE) model through GTAP helps us in this direction accommodating all the necessary changes. The on-going negotiations between India and the ASEAN representatives during the last few years have given rise to considerable interest among researchers across the world. The studies used various models to analyse the possible impact of this agreement. Pal and Dasgupta (2008, 2009), Harilal (2010) used tariff and trade data extensively through partial equilibrium framework. On the other hand, Sen et. al. (2004) and Karmakar (2005) used descriptive framework and Lee & Liew (2007) used time series analysis to study the possible impact. Veeramani (2010) used SMART and gravity model for the same. Few studies such as Kawai et al (2007), Sasatra and Prasopchoke (2007) used CGE framework also. Kawai et al (2007) highlights that the consolidation at the ASEAN+6 level would yield the largest gains to East Asia among plausible regional trade arrangements. The study by Sasatra and Prasopchoke (2007) also shows that ASEAN-5 would achieve greater benefits from the FTAs if they fully liberalized trade among themselves. Veermani (2010) argues that AIFTA will cause significant increase of imports of plantation commodities into India. The increase in imports will be mostly driven by trade creation rather than trade diversion. The proposed tariff reduction as per the India-ASEAN trade agreement may lead to significant tariff revenue loss to the Indian government. However, the gain in consumer surplus (due to the fall in domestic price and the consequent reduction in dead-weight loss) outweighs the loss in tariff revenue leading to net welfare gain. Ahmed (2010) investigates the sectoral dimensions of India –ASEAN Free Trade Agreement as a result of tariff liberalization. Using a GTAP and SMART model this study reveals that both India and ASEAN gain in terms of welfare while the terms of trade for India deteriorates. The study reveals that in case of India processed food products, grain crops, textile and wearing apparel, light manufacturing and heavy manufacturing are the sectors expected to be affected significantly. ASEAN’s exports of processed food items, agricultural products and fisheries are likely to increase which might result in adverse impact on employment and wages of Indian working class. This study also reveals that the present FTA will affect India’s trade balance adversely and cause revenue losses for India. To understand the impact on unskilled workers the study considered sticky wage and allowing factors of production to adjust accordingly.

7
It is important to note that none of these studies used the final tariff schedule as agreed by India and ASEAN members. Also, there is no study available for the overall impact analysis on India as well as the ASEAN countries considering the phased liberalisation schedule as agreed in the agreement. The present study seeks to fulfil this gap by using a general equilibrium methodology that will help to assess the possible impact of this trade agreement on the India economy and also on the ASEAN members. IV. Methodology A complete analysis of trade and trade related issues require an analytical framework which takes into account a holistic view of the economies across the world. This is so because there are not only inter linkages present between various sectors of an economy but sectors in an economy are also linked to rest of the world by the way of exports, imports of final products, intermediate goods, capital goods and so on. Thus, linkages are present at the national, regional as also at the global level both in product as well as in the input markets. The present study makes an attempt to integrate these linkages considering the Global Trade Analysis Project (GTAP) as the analytical tool. The global computable general equilibrium (CGE) modelling framework of the GTAP is one of the best possible ways to analyze ex ante the economic consequences and trade implications of multilateral and bilateral trade agreements. Using this GTAP modelling framework the study seeks to estimate the impact of the India-ASEAN trade liberalization on important macroeconomic variables such as output, profits, employment, wages, prices and welfare of the Indian economy as well as of the ASEAN member countries. Finally, by incorporating features of imperfect competition and scale economies for certain manufacturing sectors in India, the study investigates the welfare implications of this trade liberalization on the selected economies. The database used here is the version 7 of the GTAP database. The reference year for this database corresponds to the global economy in 2004. This database is compiled for bilateral exports and imports and tariffs inclusive of other flows for 113 regions across the world and for 57 tradable commodities of the World. The present paper does various simulations using this database and accordingly, the 113 regions of the GTAP model is aggregated into20 regions. Similarly, the 57 sectors of the GTAP model has been aggregated into 35 sectors for all the simulations conducted (see Appendix for details). The detailed schedule of tariff commitments of each of the member countries of the AIFTA is available. But the commitments are not corresponding to product categories. They are corresponding to specific tariff lines at six, eight or ten digit tariff classification of HS code. The tariff lines under same product category are often found to belong to different tracks. After having scrutinized the schedules for each country various categories of tariff commitments have been worked out for different commodities (as aggregated in GTAP) and then they have been converted into 35 sectors. A number of simulations have been run to assess the likely impact of the India-ASEAN FTA. They include situations such as full liberalization and partial liberalization with tariff elimination for products in normal track, tariff reductions for the sensitive track products taking into account the products in the exclusion list as well, etc. This has been experimented considering different regional groupings also. Finally, imperfect competition in product market and production function subject to increasing returns to scale for some production sectors(see Appendix for details) in India have been assumed.

8
V. Impact on Selected ASEAN Countries and Rest of ASEAN
In this section, several scenarios are presented. It has been highlighted earlier that currently only three ASEAN members and India have started the operation of the agreement and that too through liberalisation of normal track only. Based on this, full and partial liberalisation with respect to both select and all ASEAN members have been considered. As a special case, the possibilities of imperfect competition have also been considered to analyse the impact of the FTA. V.I Change in Major Macroeconomic Variables
Analysing Table 4 below, it is understood that full liberalisation provides highest increase in GDP among most of the ASEAN members. However, LDC members of ASEAN are not expected to receive much benefit in terms of GDP growth. In fact, some of them may experience a negative growth. Singapore’s GDP increase is quite consistent throughout. Under general equilibrium framework, the change in GDP is not only due to change in trade liberalisation but also because of all the related effects in the economy due to change in trade policy such as change in production pattern, resource distribution, factor demand, prices etc. Bigger ASEAN members have better economy wide effect and thus they are able to have higher GDP growth in response to the AIFTA. It is important to note that when more members join the agreement and there is deeper integration the GDP growth of Singapore, Malaysia, Thailand slows down a bit. In contrast to this, we have noticed that export growth of Singapore, Malaysia, is relatively less compared to other ASEAN members and it remains as negative when there is full liberalisation. Indonesia, Thailand and Philippines have positive export growth. Smaller countries such as Vietnam, Cambodia and Laos have also positive export growth when there is full liberalisation. This implies that though these smaller countries will be able to increase their export due to the FTA they are unable to convert this into positive GDP growth (except Vietnam). This may be due to the fact of high increase in imports, not much increase of aggregate demand and production in the country, etc. Table 5 describes the effect on exports following various scenarios.
Table 4: Percentage Change in Value of GDP Full Liberalisation
(All ASEAN Members and
India)
Full Liberalisation (India, Malaysia,
Singapore and Thailand)
Partial Liberalisation
(India, Malaysia, Singapore and
Thailand)
Partial Liberalisation (All ASEAN Members and
India)
Partial Liberalisation (All ASEAN Members
and India) and imperfect competition
in India Malaysia 0.54 1.16 0.37 0.36 0.35 Singapore 0.61 0.62 0.65 0.62 0.61 Thailand 0.31 0.35 0.27 0.23 0.23 Cambodia -0.14 -0.07 -0.04 -0.13 -0.12 Indonesia 1.08 -0.24 -0.01 0.30 0.29 Lao -0.05 -0.06 -0.06 -0.04 -0.04 Myanmar 3.18 -0.21 -0.1 0.32 0.37 Philippines -0.02 0.01 -0.01 -0.0001 -0.004 Vietnam 0.34 -0.03 -0.02 0.37 0.38 Rest ASEAN 0.45 0.02 .001 0.44 0.41
Note: Partial Liberalisation implies tariff elimination for products in normal track, tariff reductions for the sensitive track products.

9
Table 5: Percentage Change in Exports (volume)
Full Liberalisation (All ASEAN Members and
India)
Full Liberalisation
(India, Malaysia, Singapore and
Thailand)
Partial Liberalisation
(India, Malaysia, Singapore and
Thailand)
Partial Liberalisation (All ASEAN Members and
India)
Partial Liberalisation (All ASEAN
Members and India) and imperfect
competition in India Malaysia -0.09 -0.58 0.07 0.07 0.07 Singapore -0.01 -0.01 0.01 -0.01 -0.004 Thailand 0.06 -0.10 -0.05 -0.01 -0.02 Cambodia 0.27 0.01 0.02 0.27 0.26 Indonesia 0.22 -0.06 -0.04 -0.05 -0.04 Lao 0.11 0.05 0.06 0.09 0.09 Myanmar -0.34 0.06 0.06 -0.13 -0.16 Philippines 0.13 0.02 0.01 0.07 0.06 Vietnam 0.25 0.005 -0.0002 0.24 0.23 Rest ASEAN -0.09 0.01 0.01 -0.10 -0.09
Note: Partial Liberalisation implies tariff elimination for products in normal track, tariff reductions for the sensitive track products All ASEAN members will experience high import growth both in case of full or partial liberalisation. Import growth of Thailand is consistently high compared to other ASEAN members. However, under the full liberalisation’s Indonesia’s import growth will be maximum among ASEAN members. Relatively poorer ASEAN members will also experience the similar trend (Table 6).
Table 6: Percentage Change in Imports (volume)
Full Liberalisation (All ASEAN Members and
India)
Full Liberalisation
(India, Malaysia, Singapore and
Thailand)
Partial Liberalisation
(India, Malaysia, Singapore and
Thailand)
Partial Liberalisation (All ASEAN Members
and India)
Partial Liberalisation (All ASEAN
Members and India) and imperfect
competition in India Malaysia 0.35 0.30 0.34 0.32 0.32 Singapore 0.24 0.24 0.30 0.26 0.25 Thailand 0.58 0.60 0.51 0.48 0.48 Cambodia 0.32 -0.10 -0.05 0.34 0.36 Indonesia 0.88 -0.23 -0.08 0.21 0.22 Lao -0.09 -0.11 -0.09 -0.08 -0.08 Myanmar 0.73 -0.16 -0.11 0.27 0.30 Philippines 0.16 -0.01 -0.02 0.10 0.09 Vietnam 0.49 -0.06 -0.05 0.45 0.47 Rest ASEAN 0.13 -0.16 -0.09 0.14 0.14 Note: Partial Liberalisation implies tariff elimination for products in normal track, tariff reductions for the sensitive track Though the volume of export and import growth tells a story that exports will not rise much while import will grow faster, the change in terms of trade (ToT) will remain positive for most of the ASEAN members. This implies that ASEAN members will have dominating effect in deriving price benefits through this FTA. The terms of trade gain for the ASEAN countries is due to the rise in price of their export items relative to their imports out of the FTA. For the goods reaching India from the ASEAN countries the fall in prices in India are less than the shocks given in terms of tariff reduction in India. This is explained by the rise in the CIF prices of most of these goods coming from the ASEAN region. This rise in the prices is due to the rise in domestic demand for these goods which in turn increase due to rise in their intermediate demand in the export sectors of the countries of the region. This is important to note that ToT gain is substantial between partial and full liberalisation with all countries together for many members of the agreement. However, countries like Cambodia,
10
Laos, Philippines, price effect is low and that leads to negative change in ToT. The increasing gain of ToT for Indonesia is noteworthy. Perhaps, India’s demand for mineral fuels, rubber products from Indonesia remains inelastic and Indonesia gains out of this nature of demand.
Table7: Percentage change in Terms of Trade
Full Liberalisation (All ASEAN Members and
India)
Full Liberalisation (India, Malaysia,
Singapore and Thailand)
Partial Liberalisation
(India, Malaysia, Singapore and
Thailand)
Partial Liberalisation (All ASEAN Members
and India)
Partial Liberalisation (All ASEAN
Members and India) and imperfect
competition in India Malaysia 0.32 0.71 0.22 0.21 0.20 Singapore 0.21 0.21 0.24 0.22 0.22 Thailand 0.14 0.17 0.13 0.11 0.11 Cambodia -0.13 -0.08 -0.05 -0.10 -0.09 Indonesia 0.76 -0.19 -0.03 0.26 0.26 Lao -0.09 -0.09 -0.08 -0.08 -0.07 Myanmar 1.94 -0.22 -0.13 0.33 0.39 Philippines -0.02 -0.02 -0.02 -0.01 -0.01 Vietnam 0.23 -0.03 -0.02 0.23 0.24 Rest ASEAN 0.31 -0.11 -0.07 0.33 0.32
Note: Partial Liberalisation implies tariff elimination for products in normal track, tariff reductions for the sensitive track products
Better ToT effect is also going along with a positive employment effect in bigger members of ASEAN. Malaysia and Singapore get substantial rise in employment and the effect is more in case of full liberalisation when compared to partial liberalisation. However, employment effect is either small or negative for many other ASEAN members. This is important to note though countries have rising exports and ToT effect, this has not guaranteed higher employment. For example, in earlier analysis it was found that Vietnam is expected to have positive gain in terms of GDP, exports, ToT etc. but unemployment in post FTA situation deepens. This is due to the fall in domestic output in Vietnam post the FTA which increases unemployment in the country. The increase in employment depends on the nature of exportable products from these countries which experience a rise following the FTA. The issues will be dealt in the later part of the paper. It is also possible that Indian exports of labour intensive products will go up following the agreement which may squeeze some sectors in those countries reducing the employment.
Table 8: Percentage Change in Employment
Full Liberalisation (All ASEAN
Members and India)
Full Liberalisation
(India, Malaysia, Singapore and
Thailand)
Partial Liberalisation
(India, Malaysia, Singapore and
Thailand)
Partial Liberalisation (All ASEAN Members
and India)
Partial Liberalisation (All ASEAN
Members and India) and imperfect
competition in India Malaysia 52.70 92.15 42.13 40.25 41.1 Singapore 31.79 27.22 7.52 15.48 18.71 Thailand 4.82 10.03 2.41 4.14 4.68 Cambodia -4.29 8.54 3.60 -5.18 -5.37 Indonesia -21.53 9.64 1.77 -12.74 -11.51 Lao 18.7 9.14 9.47 18.17 17.57 Myanmar -172.68 12.02 7.28 -26.19 -28.74 Philippines 7.53 0.69 0.54 7.52 8.01 Vietnam -15.00 -0.12 1.09 -15.43 -15.36 Rest ASEAN 209.77 -0.69 2.07 -5.32 -4.55
Note: Partial Liberalisation implies tariff elimination for products in Normal track, tariff reductions for the sensitive track products.

11
The welfare effect is widely varying among members of ASEAN2. It is also dependant on the nature of liberalisation. At the initial stage with partial liberalisation among selected members of the agreement, the welfare for others is either negative or minimal. The welfare gain goes up when liberalisation process intensifies. Among larger ASEAN members Singapore and Malaysia derive maximum welfare gain (as % of GDP). The gain for Indonesia and Thailand are positive. Among the smaller countries Myanmar, Vietnam receives positive welfare gain after the full liberalisation. On the other hand gain for Philippines, Laos, Cambodia is negative. Their welfare gain registers higher negative figure as more country joins and liberalisation process intensifies. Welfare gain is decomposed into various components: allocative effieicy effect, terms of trade effect and investment –savings effect. In a comparative static applied general equilibrium model with population, endowment and technology being fixed, the only way to increase welfare is to reduce the excess burden arising from existing distortions. Any change in ‘allocative efficiency’ may be directly related to tax/tax changes interacting with equilibrium quantities changes. Thus, the components that result in changes in real income arising due to the policy simulation under study are – change in income due to change in endowments net of depreciation (this is normally zero in a comparative static situation), tax on output of any good, tax on use of any endowment in any industry, tax on use of intermediate input in any industry, tax on private household consumption and government consumption of any good, trade taxes (export and import) on any good, changes in regional ‘terms of trade’ (ToT) and changes in relative price of ‘savings and investment’ (Inv-Sav). (Huff & Hertel, 2000). Intuitively, it is welfare improving to increase the level of a relatively taxed activity since this involves the reallocation of a commodity or endowment from a low value use to a relatively high social marginal usage. The same is true for endowments and for goods traded. Any good that yields trade tax to the economy benefits the economy. The terms-of-trade for a region which is defined as the ratio of export price index of the region to its import price index contributes positively to the society if export prices post simulation rises more than import prices. Saving-investment term does not contribute to welfare changes but both investment and savings appear in welfare decomposition. This is because investment sales generate income but do not enter into regional utility while savings enter regional utility but does not generate current income. Analysing figures in Table 9 and 10 below, it can be said that Singapore maintains consistency during the phased liberalisation in terms of welfare gain and Malaysia’s gain drops when more country joins the full liberalisation phase. Malaysia’s ToT gain does not change much when liberalisation intensifies. In contrast to this, Indonesia improves its ToT effect during the process of liberalisation and so its overall welfare. Welfare gain for Philippines, Cambodia, Laos, are minimal/negative. Most of these countries have smaller effect of allocative efficiency and terms of trade.
2 In GTAP modeling framework, regional household behavior is governed by an aggregate utility function specified over per capita private household consumption, per capita government spending and per capita savings. The percentage change in this aggregate per capita utility for a region is the welfare change variable that is computed in a standard GTAP model during simulations. The model computes a money metric equivalent of this utility change and any change in population in the region. This convenient measure referred to as equivalent variation (EV) summarizes the regional welfare changes resulting from any policy shock and is given in dollar values (US $ million). The regional household’s EV is given by the difference between the expenditure required to obtain the post simulation level of utility at initial prices and that available initially.

12
Table 9: Change in Welfare Effect (US $ Million)
Full Liberalisation (All ASEAN
Members and India)
Full Liberalisation (India, Malaysia,
Singapore and Thailand)
Partial Liberalisation
(India, Malaysia, Singapore and
Thailand)
Partial Liberalisation (All ASEAN
Members and India)
Partial Liberalisation (All ASEAN
Members and India) and imperfect
competition in India
Total Welfare Effect
Welfare as % of GDP
Total Welfare Effect
Welfare as % of GDP
Total Welfare Effect
Welfare as % of GDP
Total Welfare Effect
Welfare as % of GDP
Total Welfare Effect
Welfare as % of GDP
Malaysia 407.51 0.35 886.83 0.76 292.65 0.25 278.84 0.24 273.91 0.24 Singapore 352.24 0.33 358.80 0.33 407.77 0.38 388.76 0.36 379.63 0.35 Thailand 176.55 0.11 203.71 0.13 156.04 0.10 130.41 0.08 130.42 0.08 Cambodia -5.26 -0.11 -3.25 -0.07 -2.04 -0.04 -4.2 -0.09 -3.91 -0.08 Indonesia 651.46 0.25 -152.55 -0.06 -23.3 -0.10 231.11 0.09 233.07 0.09 Lao -1.15 -0.05 -1.11 -0.05 -0.95 -0.04 -0.92 -0.04 -0.85 -0.03 Myanmar 57.78 0.72 -6.88 -0.09 -4.26 -0.06 10.37 0.13 12.11 0.16 Philippines -11.64 -0.014 -8.44 -0.01 -9.54 -0.01 -3.86 -0.005 -1.97 -0.002 Vietnam 64.81 0.15 -12.02 -0.03 -8.30 -0.02 71.95 0.17 77.11 0.18 Rest ASEAN
14.77 0.26 -2.52 -0.05 -1.88 -0.03 14.70 0.26 14.06 0.25
Note: Partial Liberalisation implies tariff elimination for products in normal track, tariff reductions for the sensitive track products
Table 10: Decomposition of Welfare effect (US $ Million)
Full Liberalisation (All ASEAN Members and India)
Full Liberalisation (India, Malaysia, Singapore and
Thailand)
Partial Liberalisation (All ASEAN Members and India)
Allocative Efficiency
Effect
ToT Effect
Inv-Sav Effect
Allocative Efficiency
Effect
ToT Effect
Inv-Sav Effect
Allocative Efficiency
Effect
ToT Effect
Inv-Sav Effect
Malaysia -40.99 517.10 -68.60 -58.73 1101.37 -155.81 -18 337.45 -40.6 Singapore 13.81 349.04 -10.60 10.62 359.07 -10.89 23.95 375.93 -11.12 Thailand 24.57 180.78 -28.79 29.26 207.45 -33.00 15.85 139.74 -25.18 Cambodia -1.18 -4.61 0.54 -0.70 -2.73 0.18 -0.98 -3.62 0.36 Indonesia 38.31 667.49 -54.34 -3.84 -163.60 14.89 21.58 226.2 -16.7 Lao -0.23 -0.85 -0.07 -0.15 -0.87 -0.09 -0.17 -0.72 -0.04 Myanmar -0.65 56.31 2.13 -0.17 -6.59 -0.12 0.33 9.5 0.55 Philippines -1.77 -11.29 1.42 1.14 -9.92 0.33 1.12 -5.93 0.94 Vietnam -12.02 73.16 3.68 -2.47 -9.55 -0.002 -6.03 74.3 3.67 Rest ASEAN
1.25 18.03 -4.50 -0.15 -1.01 -1.35 1.19 17.95 -4.44
Note: Partial Liberalisation implies tariff elimination for products in normal track, tariff reductions for the sensitive track products

13
Table 10: Decomposition of Welfare effect (US $ million) (contd)
Partial Liberalisation (India, Malaysia, Singapore and
Thailand)
Partial Liberalisation (All ASEAN Members and India) and
imperfect competition in India
Allocative Efficiency
Effect
ToT Effect
Inv-Sav Effect
Allocative Efficiency
Effect
ToT Effect
Inv-Sav Effect
Malaysia -19.49 354.16 -42.03 -17.26 332.28 -41.12 Singapore 22.71 396.47 -11.41 24.07 366.93 -11.37 Thailand 18.10 165.56 -27.61 14.71 141.39 -25.68 Cambodia -0.35 -1.68 -0.006 -0.99 -3.18 0.27 Indonesia -0.40 -23.62 0.71 21.83 228.37 -17.12 Lao -0.13 -0.76 -0.06 -0.17 -0.7 -0.01 Myanmar -0.08 -4.1 -0.08 0.30 11.20 0.61 Philippines 0.72 -10.44 0.19 1.002 -3.71 0.74 Vietnam -0.59 -7.73 0.02 -5.08 78.36 3.84 Rest ASEAN -0.07 -0.87 -0.95 1.15 17.34 -4.43
Note: Partial Liberalisation implies tariff elimination for products in Normal track, tariff reductions for the sensitive track products
V.II Change in Exports to Major ASEAN markets
In this section, we look into the effect of AIFTA on major Asian markets. How the export opportunities in these select market changes due to this agreement. India is not going to gain much from Singapore market. Its gain is much higher in Malaysia, Thailand and smaller ASEAN markets. Another important thing to observe is that India’s gain in exports rises as liberalisation process deepens and the gain is substantial when there is full liberalisation.
Table 11: Loss/Gain in Exports (%) in the Major SEAN markets by the different countries: Partial Liberalisation (India, Malaysia, Singapore and Thailand)
Note: Partial Liberalisation implies tariff elimination for products in Normal track, tariff reductions for the sensitive track products This is to note that China will expectedly loose ASEAN market a bit due to this trade agreement. However, its export to Singapore, Indonesia will grow. Perhaps, India will substitute China in these markets to some extent. Other South Asian countries will also loose ASEAN markets as India will be present in big way. The loss will be more when countries will liberalise fully. However, export market of Singapore will remain buoyant for South Asian nations. US will have a smaller share in the ASEAN market in the short run as a result
Exporting countries/Region
ASEAN Market Malaysia Singapore Thailand
India 20.66 1.74 46.88 USA 0.14 0.59 0.004 EU 0.29 0.51 0.23 Rest of West Asia 3.73 0.86 1.36 China -0.28 0.32 -0.19 Bangladesh -0.97 0.53 -1.23 Sri Lanka -0.25 0.53 -0.11 Pakistan -0.85 0.60 -1.38 Rest of South Asia 0.89 1.29 -2.23 Rest of the World 0.24 0.44 -0.03

14
of partial liberalisation in selected countries but it will recover as countries intensify the process. EU’s export growth in ASEAN market will remain positive during the phased liberalisation under AIFTA. Hence, it is clear that the major impact of this agreement will be on Asian countries rather than on other major exporters to ASEAN such as USA and EU. Perhaps, higher competency and different export product basket of these countries will help them to maintain their export gain from ASEAN market after this agreement. Table 11-13 provides the information in details. Major products in which countries will loose export market and India will gain are Apparel, crops and food products including marine products, vegetable oil & fat and manufactured goods, electrical equipments, fuel and petroleum products, etc.
Table 12: Loss/Gain in Exports (%) in ASEAN markets by the different countries (Partial Liberalisation in India and All ASEAN Members)
Note: Partial Liberalisation implies tariff elimination for products in Normal track, tariff reductions for the sensitive track products
Table 13: Loss/Gain in Exports (%) in ASEAN markets by the different countries (Full Liberalisation)
Exporting countries/Region
ASEAN Market Malaysia Singapore Thailand Cambodia Indonesia Lao Myanmar Philippines Vietnam Rest
ASEAN India 24.28 2.07 56.16 192.02 5.89 29.62 20.06 42.27 46.04 21.22 USA 0.18 0.61 0.05 -0.62 0.36 0.00 0.29 -0.16 0.27 0.62 EU 0.31 0.51 0.26 -1.02 0.43 0.35 0.19 -0.26 0.06 0.63 Rest of West Asia 3.79 0.74
1.59
-0.07
1.26
0.12
0.47
0.92
0.15
0.57
China -0.20 0.37 -0.12 -0.63 0.27 0.30 -0.08 -0.06 -0.32 0.41 Bangladesh -0.81 0.58 -0.93 -7.53 0.41 0.00 -0.53 0.00 -0.22 0.00 Sri Lanka 0.06 0.69 0.10 -1.59 0.56 0.00 0.00 0.20 -0.39 0.00 Pakistan -0.62 0.64 -1.17 -1.02 0.14 0.00 -3.13 0.04 -0.78 0.00 Rest of South Asia
1.18
1.68
-1.40
0.00
1.19
0.00
0.00
1.02
1.29
0.00
Rest of World 0.31 0.47 0.01 -0.96 0.42 0.26 -0.53 0.03 -0.30 0.50
Exporting countries/Region
ASEAN Market Malaysia Singapore Thailand Cambodia Indonesia Lao Myanmar Philippines Vietnam Rest
ASEAN
India 43.14 3.88 61.65 176.24 21.34 46.19 20.18 52.20 52.47 22.89 USA 0.09 0.73 0.11 -0.61 2.72 0.004 0.77 -0.31 0.18 0.70 EU 0.17 0.60 0.28 -1.23 0.69 0.34 0.52 -0.27 -0.01 0.75 Rest of West Asia
3.90 1.24 1.61 -0.09 1.25 0.15 0.99 0.96 -0.29 0.78
China -0.72 0.52 -0.14 -0.59 0.29 0.33 0.50 -0.11 -0.48 0.53 Bangladesh -1.81 0.68 -0.91 -8.11 0.13 0 -0.60 -0.08 -0.26 0.59 Sri Lanka 0.44 1.33 0.45 -1.76 1.60 0 0.81 0.65 -0.31 1.69 Pakistan -1.13 0.84 -1.37 -0.94 1.25 0.15 -2.05 -0.01 -1.03 0.19 Rest of South Asia
1.98 2.70 -0.78 0.37 2.27 0.58 2.44 1.53 1.77 1.83
Rest of World 0.10 0.66 -0.06 -1.01 0.49 0.22 -0.38 0.02 -0.48 0.59

15
VI. Implication on India
VI.I Macroeconomic and Trade impact In contrast to most ASEAN members, India’s GDP will go down due to this FTA. As liberalisation process expands and deepens the negative effect on India’s GDP intensifies. Though India’s both export and import growth speeds up between partial and full liberalisation, terms of trade keeps on worsening. So is the employment effect. This indicates clearly that on basic macroeconomic variables the impact of this FTA does not produce a positive impact. Table 14 provides a snapshot of this. It is important to note that with the assumption of increasing return to scale in selected Indian industries, the change of GDP turns positive. However, this is true only for partial liberalization. With full liberalisation and increasing returns in these select industries in India, the impact on GDP is negative as is observed in the other simulations assuming constant returns to scale in these industries.
Table 14: Macroeconomic and Trade Effect of AIFTA on India
Nature of Liberalisation % Change in GDP
% Change in Exports
% Change in Imports
% Change in ToT
% Change in Employment
Full Liberalisation (All ASEAN Members and India)
-1.07 5.39 4.70 -0.65 -58.62
Full Liberalisation (India, Malaysia, Singapore and Thailand)
-0.95 4.01 3.25 -0.54 -39.78
Partial Liberalisation (India, Malaysia, Singapore and Thailand)
-0.125 1.51 1.41 -0.13 3.24
Partial Liberalisation (All ASEAN Members and India)
-0.09 2.24 2.29 -0.15 0.31
Partial Liberalisation (All ASEAN Members and India) and imperfect competition in India
0.48 1.80 2.32 -0.03 -12.47
Note: Partial Liberalisation implies tariff elimination for products in Normal track, tariff reductions for the sensitive track products
In Table 15 welfare effect of AIFTA on India is described. It is observed that India’s welfare will increase when there is full liberalisation (after all countries join the process) compared to partial liberalisation. This is due to the fact that the allocative efficiency effect turns positive from negative. This clearly says that during the initial implementation process, India will not have much welfare gain and effect on GDP growth will remain negative. Though India’s export to ASEAN will increase, it will not be able to drive home the price advantage. In fact, India’s export price will remain less than its import price. This may be due to the fact that in relative terms, goods produced in ASEAN will have higher price because of rise in their intermediate demand in the export sectors. As a result of this, in value terms India will have larger trade deficit with ASEAN. In case of allocative efficiency (earned only under full liberalization), large gain is visible due to increased production and consumption in the economy following the FTA which will lead to rise in tax revenues, profits, etc. Interestingly, with the assumption of increasing return to scale in some selected industries in India, it derives positive and large welfare gain even at the time of partial liberalisation. This indicates the fact that India will be in a position to get positive GDP and welfare effect once FTA is followed by large investment in the export oriented industries. With the assumption of full liberalisation and increasing return to scale, India’s welfare further goes up to US$ 34813
3 Not in the table, separately calculated

16
million. High allocative efficiency gain and scale effect contributes to this gain. ToT effect still remains negative. This is due to the fact that products under negative list for India also experience tariff cuts under this situation. ToT effect with partial liberalisation and increasing return to scale is US$ -44.62 million. However, if we assume full liberalisation and increasing return to scale, ToT effect will be US$ -575 million4. As mentioned above, under the first situation India maintains the negative list but in case of later with full liberalisation there is no negative list and imports in India of those products from ASEAN increases significantly. However, allocative efficiency and scale effect neutralises the negative ToT effect to a large extent leading to positive welfare gain.
Table 15: Welfare Effect (US $ Million) of AIFTA on India
Allocative Efficiency Effect
Terms of Trade Effect
Investment -Savings Effect
Total Welfare Effect
Welfare as % of GDP
Full Liberalisation (All ASEAN Members and India)
1252.66 -695.62 -78.7 478.33 0.075
Full Liberalisation (India, Malaysia, Singapore and Thailand)
251.16 -581.93 -93.39 -424.16 -0.07
Partial Liberalisation (India, Malaysia, Singapore and Thailand)
-229.26 -139.45 -30.63 -399.34 -0.062
Partial Liberalisation (All ASEAN Members and India)
-124.3 -171.18 -12.1 -307.57 -0.048
Partial Liberalisation (All ASEAN Members and India) and imperfect competition in India
-21.44 -44.62 52.18 1279.72*
0.20
*Note: Under IRS simulation India’s largest gain is on account of scale economies = USD 1294.87 million, which is otherwise not present due to perfect competition assumption. Malaysia, Singapore and Thailand have consistent gain from Indian market as revealed in Table 16. Countries like Indonesia and Philippines will gain once they join by implementing the agreement. Gain of Vietnam is worth mentioning. Others have marginal gains. Table A1 in the appendix identifies the major products in which exports of ASEAN members will go up and come down in Indian market in post FTA period. This is important to note ASEAN will be exporting more of food products, transport equipment, machinery, metal etc. However, sectors such as petroleum products, minerals, apparels, electrical equipments will experience negative growth of import from ASEAN. Of this petroleum product is in India’s negative list and due to slow phasing out; it experiences declining import in India. . For the other products, the particular exporting countries from ASEAN offer them at prices which are relatively higher than the average import price in India and hence their imports in India show negative growth.
4 Not in the table, separately calculated

17
Table 16: Loss/Gain in exports (%) by ASEAN Players in Indian Market
Note: Full Liberalisation I: All ASEAN Members and India will liberalise fully, Full Liberalisation II: India, Malaysia, Singapore and Thailand will liberalise fully, Partial Liberalisation I: India, Malaysia, Singapore and Thailand will liberalise normal track and reduce duties from sensitive track, Partial Liberalisation II: All ASEAN Members and India will liberalise normal track and reduce duties from sensitive track
VI.II: India’s Import from ASEAN: Under Partial Liberalisation
Under the current stage of FTA implementation, India, Malaysia, Singapore and Thailand are reducing tariffs and after sometime other ASEAN members will also join the process. The list of negative items on which no concessions are going to be allowed by India to the ASEAN countries is quite long and comprises mainly of primary items like, Wheat, rice, cereals, vegetable, fruits, oilseeds, milk, dairy product, fish, sugar, vegetable oil & fat, beverages, tobacco, petroleum products and motor vehicles. The products on which India brings about large tariff shocks are – food products, crops, ferrous metals, chemicals (including rubber & plastic), meat & meat products, metals, Other manufacturing (consisting of metal products, manufactures, electricity, gas and water), machinery equipment, transport equipment, paper & paper products, wearing apparels, leather & leather products, wood & wood products, mineral products, forestry products, coal, minerals, animal products (including cattle, sheep, goat horses, wool, silk worm cocoons, other animal products), electrical equipment and oil & gas. All the other sectors/products included in the study are in the exclusion list of India and hence beyond any tariff shock. The simulation dealing with partial liberalisation with all members shows that import prices of the products in which concessions are offered come down as well to match the tariff shock. But this considerable fall in import prices for goods coming from the ASEAN region fails to push down the overall import price of these goods in India to the same extent. This is perhaps due to the fact ASEAN does not have dominating market share of these goods in Indian market (See Table A2, in the appendix). In reality, as the price of imported goods still remains high in India, ASEAN members will be in a position to keep their prices higher than the cost and derive gains in ToT. Table A2 provides product wise detailed information about the major sources of imports from ASEAN and the corresponding price cut. For most of these goods excepting crops, meat & meat products, coal, and oil and gas it is the substitution effect of a price change that dictates the bulk of this increase in the import demand by India. The table clearly points out that there is substantial increase in exports happening from the ASEAN region into India, while the exports from all the countries of the Rest of the World come down. This is a clear indication of the trade diversion that happens to India & the ASEAN region.
Malaysia Singapore Thailand Cambodia Indonesia Lao Myanmar Philippines Vietnam Rest
ASEAN
Full Liberalisation I 91.72
57.95
83.46
9.15
75.32
5.47
23.62
57.26
276.41
203.37
Full Liberalisation II
172.89
59.82
88.96
-2.85
-55.96
-2.34
-2.94
-4.78
-6.15
-6.12
Partial Liberalisation I
76.29
56.68
71.84
-2.40
-1.16
-0.78
-1.43
-3.49
-4.20
-6.11
Partial Liberalisation II
99.88 66.28 85.78 8.4 58.75 7.09 9.13 63.32 373.36 230.63
Partial Liberalisation II and imperfect competition in India
74.67 54.59 68.86 8.16 34.43 7.57 5.68 53.99 283.82 201.34
18
Table 17: Firm’s share in import demand of different commodities by in India
Source: based on simulation results related to partial liberalisation with all members
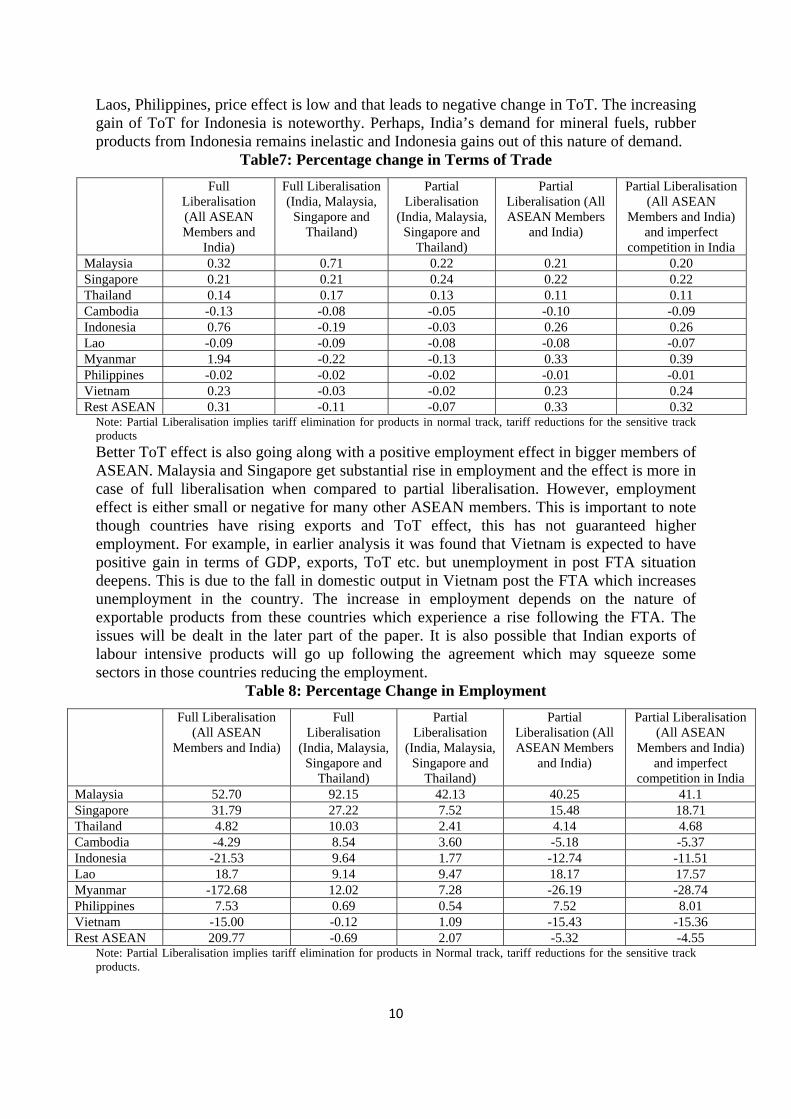
The simulation results reveal that this greater availability of goods at lower prices in India from the ASEAN region results in replacing substantial export sales of these commodities from Bangladesh, Sri Lanka, Pakistan & Other South Asian countries in the Indian market because goods coming from these countries are relatively expensive compared to the goods coming from the ASEAN countries. Also these imports are used by all agents of the economy. The private household contributes the largest share of the increased demand for products like food products (93%), meat & meat products (66%), forestry (96.8%), textile (64.5%), leather products (62.1%) and wearing apparels (97%). For all other products the firm’s share is more than that of the household. The firms’ share in increased import demand (demand for imported inputs) and the share of different sectors in this increase demand are reported in the Table 17. This indicates that firms are gradually substituting domestic input by foreign inputs and thereby increasing the allocative efficiency in the system. However, as a result of this, demand for domestic inputs in some sectors come down. These include ferrous metals, chemicals, transport equipment, paper, wood, forestry products, coal, minerals, and oil & gas, etc. Imports are replacing domestic production. For minerals fall in both domestic as well as export demand explains the fall in output. This is also interesting to observe that export demand of some of the products also go up which leads to increase in domestic production. For animal products and textiles increase in both domestic demand (54% for animal products & 5% for textiles) and export demand (46% for animal products & 95% for textiles) is responsible for increase in domestic production.
Sectors Domestic Firms’ share in increased import demand (%)
Sectors contributing to increase in demand for these imported inputs (%)
Crops nec 52.5 Textiles (75) Ferrous metal 100 Ferrous metal (40.9); Other manufacturing (31.9) Chemicals, rubber & plastic 87.9 Chemicals (44.3);Textile (11.6)
Metals 100 Other manufacturing (42); Metals (30)
Other manufacturing 79.4 Services (32.5); CGDS (29.2); Other
manufacturing (21.3) Machinery equipment 98.9 CGDS (67.1); Machinery equipment (14.5) Transport equipment 94.7 CGDS (75.7); Transport equipment (18.9) Paper & paper products 64.2 Services (32.1); Paper (29.4); Chemicals (15.3) Wood & wood products 99.8 Wood (24.3); Paper (23.8); Chemicals (23.6) Mineral products 79.5 Mineral products (32); Services (16.8);
Chemicals (12.3), Other manufacturing (12.2) Coal 98.1 Other manufacturing (74.4); Petroleum products
(10.9) Minerals 100 Mineral products (54); Metals (42) Animal products 76.7 Textiles (90.9) Electrical equipment 90.2 CGDS (85.7); Electrical equipments (10) Oil & gas 100 Petroleum products (100)

19
VI.III: India’s Export to ASEAN: Under Partial Liberalisation
All the sectors excepting Rice paddy experiences increase in export demand. Rice is in the exclusion list of Thailand, Malaysia, Indonesia, Myanmar & Philippines. It is in the sensitive list of Lao. The top ten export commodities from India to the ASEAN region are: wearing apparel (main destinations are Vietnam & Thailand), meat & meat products (main markets are Thailand & Vietnam), Other manufacturing ( main markets are Cambodia, Vietnam & Malaysia) Wood (main destinations are Cambodia, Malaysia & Thailand) textiles (main markets are Vietnam & Thailand), leather & leather products (main markets are Cambodia & Myanmar), food products ( main destinations are Thailand & Cambodia), dairy products (main markets are Cambodia & Myanmar), machinery equipment (main markets are Cambodia & Thailand) & wheat (main destinations are Thailand & Vietnam). Thus, with implementation of India’s FTA with ASEAN region, India’s exports receive substantial boost. Thailand continues to be one of the main destinations for these goods followed by Malaysia. With FTA involving the entire ASEAN region, Cambodia & Vietnam emerge as one of the main destinations for exports from India that are headed to the ASEAN region. In the event of full liberalization Indonesia also becomes an important export market for India.
Figure 2: % increase in India's exports to ASEAN countries post FTA
Source: based on simulation results related to partial liberalisation with all countries
VI.IV Effect on factor demand and factor prices in the Indian Economy
It would be interesting to find the impact on factor demand in the sectors which experience fall in domestic production in the face of increased imports. Post the FTA implementation domestic outputs fall in sectors of crops, ferrous metals, chemicals, transport equipment, paper, wood, forestry products, coal, minerals and oil & gas. For all these sectors, the demand for all the mobile factors, namely, capital, labour (both skilled & unskilled) fall. For the sluggish factors, land and natural resources demand falls for some of the sectors while for others it do not change much. Simultaneously, for all the sectors which register increase in output after the FTA implementation, the demand for all the primary factors increases. On the whole, the demand for land in India rises by 14.86%, demand for unskilled labour increases by 0.93%, demand for skilled labour falls by 0.62% and that of capital and natural resources increases by 0.53% and 0.12% respectively. This change in demand for endowment commodities in India is explained by change in demand for these primary inputs in the different sectors. This in turn is explained by the expansion effect and substitution effect of relative change in input prices in the different sectors. As stated earlier, India’s domestic output increases in sectors like food products, textiles, wearing apparels, leather, metals, animal products, minerals. Most of these sectors are likely to have higher demand for

20
unskilled labour rather than skilled labour. The latter is more likely to be required for sectors like machineries, electrical equipments etc. At the aggregate level total domestic output increases by 2.78% leading to increase in demand for primary factor composite (comprising all of land, labour, capital and natural resources). As a result price of both primary factor composite and relative price for endowments rises. Wages of unskilled and skilled labour increase by 11.9% and 13.63% respectively. Interest rate for borrowing capital also rises by 12.3%. On the other hand, the relative prices of the sluggish factor fall relative to the average price of primary factor composite. For mobile factors, unskilled labour and capital the expansion effect and the substitution effect work in opposite direction5 but the positive expansion effect dominates the negative substitution effect to result in an increased demand for the factor across the economy. For mobile factor, skilled labour, given that the relative price increase is substantial, its negative substitution effect is stronger than the positive expansion effect resulting in a fall in its demand across the entire economy. However, the fall is only 0.62%.
Table 18: Impact on Factor Demand and Factor Prices in India in Post FTA Period
Factors % change in demand for factors % change in factor prices Demand for sluggish factors Land Natural resources
14.86 0.12
-12.98 -8.94
Demand for mobile factors Unkilled labour Skilled labour Capital
0.93 -0.62 0.53
11.9
13.63 12.32
Source: based on simulation results related to partial liberalisation with all countries
VII. Implication on India following Imperfect Competition and Increasing Returns to Scale in Selected Industries India
The entire analyses of the implications of the FTA on India and ASEAN region takes the assumptions of perfect competition and constant returns to scale in the countries involved. However, given the developing status of the countries involved, assumption of perfect competition and CRS may not quite reflect the real picture. Because developing economies have many of their production sectors, particularly manufacturing which are characterized by the existence of relatively few firms with barriers to entry. Given that many of Indian manufacturing sectors are subject to imperfect competition and characterized by the existence of scale economies, the study now turns to examine its impact. One other intention of the exercise is that during the liberalisation process, many Indian firms gain higher market share and market power and we would like to test whether their involvement in trade is going to change the implication of this FTA. The list of identified sectors for IRS is given in the Appendix. This exercise takes the features of imperfect competition and IRS for the India economy only while the ASEAN region is allowed to have perfect competition and CRS production functions for its production sectors. South East Asian countries are already facing 5 Due to increase in total production in the country there is an expansion effect which operates positively on demand for the factors raising its average price. Due to this, sectors will try to substitute costly factors by cheaper factors. Substitution effect is defined by the relative price changes multiplied by the elasticity of substitution of the factors in the production sectors. Hence, the net effect on factor prices will depend on the opposite forces: expansion effect and substitution effect.

21
a liberalised environment and this leads to intense competition and thus we have assumed perfect competition for them. Also, the data required for imperfect competition for each of the ASEAN members are difficult to get and hence, the assumption for perfect competition6. It was earlier discussed that GDP growth and welfare implication dramatically changes with the assumption of imperfect competition and IRS and Indian economy gains substantially from the effect of ‘scale economies’. The gain goes up when liberalisation process moves from partial to full liberalisation. The output per firm of many of the oligopolistic sectors, like textiles, petroleum products, chemicals, mineral products, motor vehicle products, electric equipment and other manufacturing rise fetching large positive scale economies for the country. Many of these firms now source cheaper raw materials and inputs from the ASEAN region and produce efficiently. In fact, 46% of the increase in total import demand for all goods in India is due to increase in input demand by the domestic firms. 21.5% of this increase is accounted for by the Indian firms showing IRS. The ‘profit sharing effect’ also shows a positive figure implying that imperfectly competitive sectors are now expanding output with higher profitability. The largest increase in output occurs in chemicals, followed by petroleum products and motor vehicles. Excepting for motor vehicles, the increase in domestic output of these sectors is due to increase in export demand from ASEAN countries. Given number of firms are constant in the industry and the market size is increasing with additional market access to the ASEAN region, Indian producers gain more profit due to the increased volume of demand for exports. The biggest markets for Indian chemicals are in Thailand (19.4%), Lao (18.7%) and Philippines (12%). Cambodia (53.7%) and Malaysia (20.6%) constitute largest markets for petroleum products. Cambodia (42.7%) and Indonesia (56.2%) are the largest markets for motor vehicles and its accessories. Mineral products find their markets in Thailand (37.2%) and Malaysia (31.9%). Exports of electric equipment from India find the biggest markets in Cambodia (37.5%) and Thailand (12.3%). India’s negative ToT effect comes down significantly and also India is able to now drive home huge increase in output due to scale effect and is able to export the same to ASEAN. However, despite having overall positive welfare effect, the labour demand in India drops. The effect of the FTA on factor demand in the economy worsens with unemployment rising as labour demand drops (unskilled labour by 4.86% and skilled labour by 7.6%). But, demand for capital goes up by 5.97% implying that to derive ‘economies of scale’ firms invest more in capital goods and technology. Sectors in which output expands, employment of primary factors go up and in others it comes down. Employment falls in an aggregate sense. Cheaper imported inputs and higher investment help Indian companies to achieve efficiency through better usage of economies of scale and thereby increase profits. So, with the assumption of IRS, Indian economy goes through a major change as profits and
6 The firm level data for Indian corporate sector is available in Prowess database (of Centre for Monitoring Indian Economy (CMIE)) which have been used to calculate various cost related variables used in the model. We have used the sector wise average cost disadvantage ratio (CDR) calculated from the Prowess data to calibrate the fixed cost following Francois (1998). In this study, scale economies are modeled by linking percentage change in output to percentage change in input composite assuming homothetic technologies as described by Francois (1998) and Elbehri et al, (2004) in which CDR plays a crucial role. Further firm’s strategic behaviour in the form of Cournot mark-up has been used to understand sectoral behaviour which is expressed through elasticity of substitution between products from different sources, sales share originating
from a region sold in different market.

22
unemployment both increases. Productions become more capital intensive but allocative efficiency remains negative.
VIII. Towards Generalising India’s Welfare gain/loss from AIFTA
In this section, we’ll make an attempt to understand analytically India’s welfare gain and loss reviewing the components of total welfare effect as pursued under various simulations. GTAP divides the change in welfare into three effects: Allocative efficiency effect, ToT effect and Investment-Savings (IS) effect. As mentioned earlier the main variables in altering the overall welfare effect are allocative efficiency and ToT. Hence we write the change in welfare effect as a+t where a: allocative efficiency effect and t stands for ToT effect. Both a and t are also
function of market size (N) and state of liberalization (L). Market size can increase when new ASEAN members (other than Singapore, Malaysia, Thailand) open up as well as the market of older ones grow. We assume three states of liberalization (L: 0 or 1 or 2). 0 stands for partial liberalization in which normal track (NT) gets reduced and 1 stands for the state when NT gets eliminated. Liberalisation state 2 implies full liberalization in all countries. The basic functions of a and t can be written as
),( LNfa ……………………… (1)
f constant, when L=0, 0 Nf and 0Nf when L 0
0Nf and 12 LNLN ff
This implies that when there is partial liberalization if Rest of ASEAN opens up the effect on India’s allocative efficiency remains constant or does not change. However, if the status of liberalization changes, India opens up further, its allocative efficiency rises due to resource reallocation and more production revenue, efficient use of resources etc. The second derivative ensures that as liberalization deepens (L moves from 0 to 1 and then to 2) the rate of improvement in allocative efficiency increases.
),( LNgt ……………………….. (2)
,0Ng NN , ,0Ng NN and 0 NgN for L=0, where N is a threshold
level beyond which ToT effect starts rising 0,0 LgN and ,0Ng and 12 LNLN gg
This implies that given that there is partial liberalization (L=0), as Rest of ASEAN opens their market though initially, India’s ToT effect will worsen, eventually India gets market
access and its ToT starts improving (beyond N ). However, when the state of liberalization changes India needs to open up further by reducing the tariffs of the products in sensitive list and reducing the size of exclusion list. In that case India’s import increases significantly and ToT worsens. The second derivative ensures that the rate in which ToT effect worsens speeds up as more country joins and export to India. The overall welfare effect depends on the strength of these two opposing forces ( a and t). Figure 3 below summarises the behavior of these two equations. Panel A and B describe f &

23
g function under different state of L. Vertical sum of f and g provides the welfare effect which is described in Figure 4.
Figure 3
Allocative efficiency and ToT effect for India with respect to market size given the state of liberalization
Panel A Panel B
It is important to note that in reality the increase in market size and state of liberalization moves together and what we see is the combined effect. At the initial stage, if Rest of ASEAN starts opening up under partial liberalization scheme, India tends to gain marginally. However, India’s gains are short lived. As the liberalization deepens, India’s benefit from market access gets neutralized by negative terms of trade effect due to high influx of imports from ASEAN and their price effect. Relocation of resources, higher production revenue, etc help India to enjoy positive allocative efficiency effect but that is not sufficient to cover negative ToT effect. As a result overall welfare effect produces negative figure.
Figure 4
Welfare gain and loss for India under different state of liberalization
Panel A
Panel B
In the Panel A of Figure 4 separate welfare effects are drawn for different state of liberalization. The dotted line shows the combined effect which is properly drawn in the Panel B. During the full liberalization, as described in the simulation India’s welfare will
w
f
N
f, L=2
f, L=1
f, L=0
g
N
g, L=2
g, L=0
g, L=1
L=0
L=1
N
L=2
L=0 L=1
N
w
L=2
w1
w2

24
increase substantially. This is depicted under the curve w1. The underlying assumption for that NN gf especially at the L=2. A careful look into the Figure 3 will explain this. This
implies that India’s long run benefit is dependent on the increase in its allocative efficiency effect as compared to its loss in ToT as Rest of ASEAN joins and state of liberalization deepens. This is possible when allocative efficiency gain leads to better production and thereby some gain in the export market. With an assumption of increasing return to scale in India we find that overall welfare starts increasing keeping negative ToT effect under control. If it does not happen or in other words the condition reveres [ NN gf ] we get a curve like
w2. In this case, TOT effect supersedes allocative efficiency as liberalization deepens. Hence, in the conclusion we can argue that India’s benefit is lying in its attempts to link the allocative efficiency for further investment and production efficiency gain in export oriented sectors. Through this, it can increase its export in ASEAN and specifically in the Rest of ASEAN to control the further fall in ToT. The situation becomes further strengthened, if Indian economy brings up positive scale effect through investment and technology upgradation. With the assumption of IRS, we have noticed that negative effect of ToT slows down and other effects such as ‘scale effect’ and ‘profit sharing’ help Indian economy to get boost in production efficiency and increase overall welfare. This will ensure that welfare effect takes the path of w1.
IX. Conclusion
The study makes an attempt to analyse the impact of AIFTA from different angles conducting number of simulations on GTAP data. It covers issues like change in GDP, export, import, welfare and employment. Welfare effect has further been decomposed to understand the reason behind the change in welfare following the FTA. It also identifies sectors which experience change in production, export and import. Change in factor demand and factor prices have been analysed to comprehend how this agreement is going to have an impact on India. It has been noticed that relatively bigger ASEAN members will derive more benefits in terms of GDP and welfare growth. India will have higher benefits only when the agreement will fully get implemented. ASEAN members will gain from higher ToT effect while India’s gain mainly will be from the resource reallocation and change in domestic production activities reflected through allocative efficiency. India’s import demand of several intermediate goods will remain high and ASEAN will have advantage to supply these at a higher price yet lower than average prevailing import price in India. As a result, India will continuously be having negative ToT effect. However, situation will change significantly, if we assume IRS in some sectors in India. This will allow India to invest in capital goods and technology leading to high ‘scale effect’ and thereby to increase exports further to ASEAN. It has been observed in general, demand for capital and land in India will increase and overall employment will get depressed due to this FTA. Actually, demand for unskilled labour increases and that of skilled labour will come down though wages for both skilled and unskilled labour will rise. The trade diversion effect is visible following the simulation as several non-ASEAN countries including SAARC members will loose market both in ASEAN and India. India will have better market access in smaller ASEAN markets. Among the smaller ASEAN nations Vietnam will gain substantially from this FTA.
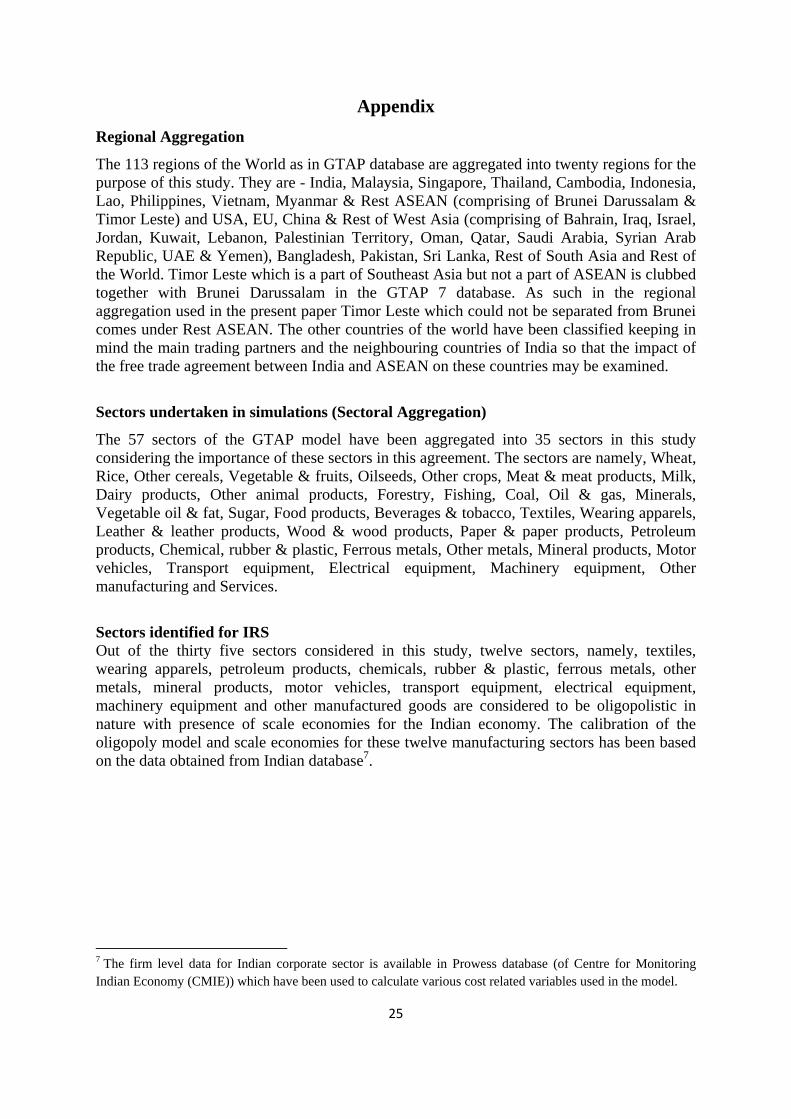
25
Appendix
Regional Aggregation
The 113 regions of the World as in GTAP database are aggregated into twenty regions for the purpose of this study. They are - India, Malaysia, Singapore, Thailand, Cambodia, Indonesia, Lao, Philippines, Vietnam, Myanmar & Rest ASEAN (comprising of Brunei Darussalam & Timor Leste) and USA, EU, China & Rest of West Asia (comprising of Bahrain, Iraq, Israel, Jordan, Kuwait, Lebanon, Palestinian Territory, Oman, Qatar, Saudi Arabia, Syrian Arab Republic, UAE & Yemen), Bangladesh, Pakistan, Sri Lanka, Rest of South Asia and Rest of the World. Timor Leste which is a part of Southeast Asia but not a part of ASEAN is clubbed together with Brunei Darussalam in the GTAP 7 database. As such in the regional aggregation used in the present paper Timor Leste which could not be separated from Brunei comes under Rest ASEAN. The other countries of the world have been classified keeping in mind the main trading partners and the neighbouring countries of India so that the impact of the free trade agreement between India and ASEAN on these countries may be examined.
Sectors undertaken in simulations (Sectoral Aggregation)
The 57 sectors of the GTAP model have been aggregated into 35 sectors in this study considering the importance of these sectors in this agreement. The sectors are namely, Wheat, Rice, Other cereals, Vegetable & fruits, Oilseeds, Other crops, Meat & meat products, Milk, Dairy products, Other animal products, Forestry, Fishing, Coal, Oil & gas, Minerals, Vegetable oil & fat, Sugar, Food products, Beverages & tobacco, Textiles, Wearing apparels, Leather & leather products, Wood & wood products, Paper & paper products, Petroleum products, Chemical, rubber & plastic, Ferrous metals, Other metals, Mineral products, Motor vehicles, Transport equipment, Electrical equipment, Machinery equipment, Other manufacturing and Services.
Sectors identified for IRS Out of the thirty five sectors considered in this study, twelve sectors, namely, textiles, wearing apparels, petroleum products, chemicals, rubber & plastic, ferrous metals, other metals, mineral products, motor vehicles, transport equipment, electrical equipment, machinery equipment and other manufactured goods are considered to be oligopolistic in nature with presence of scale economies for the Indian economy. The calibration of the oligopoly model and scale economies for these twelve manufacturing sectors has been based on the data obtained from Indian database7.
7 The firm level data for Indian corporate sector is available in Prowess database (of Centre for Monitoring Indian Economy (CMIE)) which have been used to calculate various cost related variables used in the model.
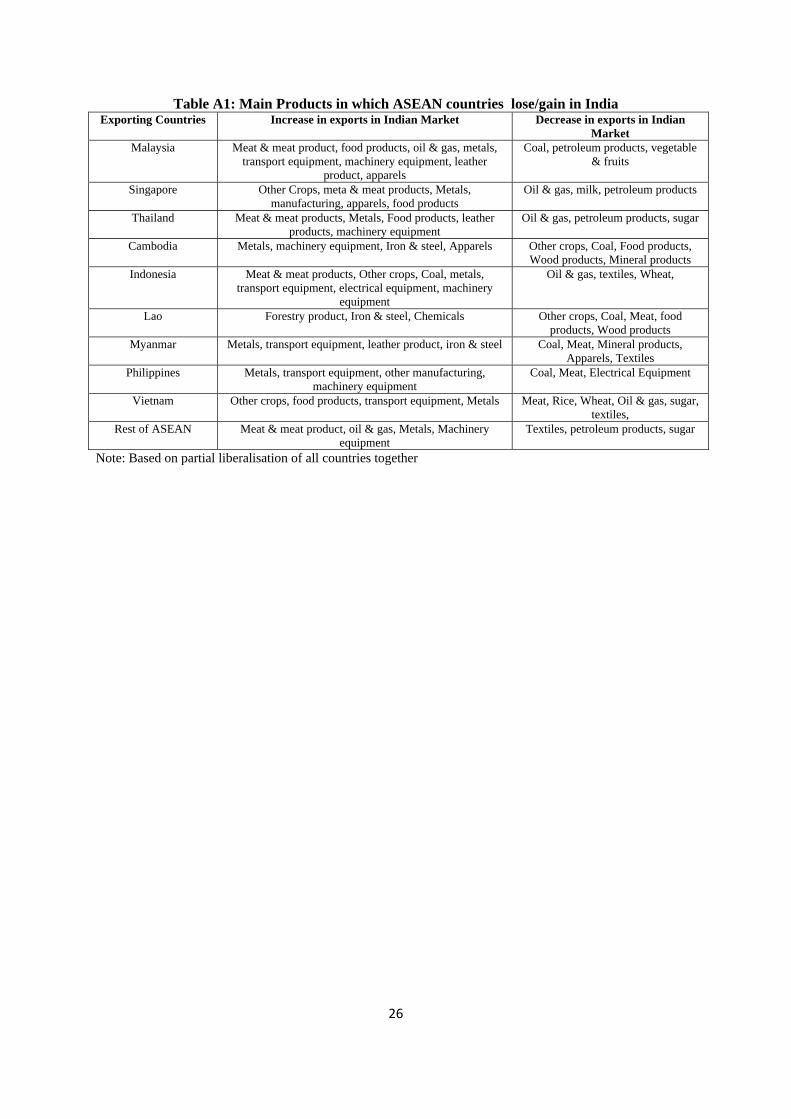
26
Table A1: Main Products in which ASEAN countries lose/gain in India Exporting Countries Increase in exports in Indian Market Decrease in exports in Indian
Market Malaysia Meat & meat product, food products, oil & gas, metals,
transport equipment, machinery equipment, leather product, apparels
Coal, petroleum products, vegetable & fruits
Singapore Other Crops, meta & meat products, Metals, manufacturing, apparels, food products
Oil & gas, milk, petroleum products
Thailand Meat & meat products, Metals, Food products, leather products, machinery equipment
Oil & gas, petroleum products, sugar
Cambodia Metals, machinery equipment, Iron & steel, Apparels Other crops, Coal, Food products, Wood products, Mineral products
Indonesia Meat & meat products, Other crops, Coal, metals, transport equipment, electrical equipment, machinery
equipment
Oil & gas, textiles, Wheat,
Lao Forestry product, Iron & steel, Chemicals Other crops, Coal, Meat, food products, Wood products
Myanmar Metals, transport equipment, leather product, iron & steel Coal, Meat, Mineral products, Apparels, Textiles
Philippines Metals, transport equipment, other manufacturing, machinery equipment
Coal, Meat, Electrical Equipment
Vietnam Other crops, food products, transport equipment, Metals Meat, Rice, Wheat, Oil & gas, sugar, textiles,
Rest of ASEAN Meat & meat product, oil & gas, Metals, Machinery equipment
Textiles, petroleum products, sugar
Note: Based on partial liberalisation of all countries together

27
Table A2: Market share of ASEAN in important imports of India and the relative fall in import prices offered by them
Sectors registering highest increases in imports in India
Market share of the ASEAN region in total composite* of the good imported by India (%)
Fall in prices of import composite available in India (%)
% change in export by ASEAN countries to India
% change in export by Rest of World to India
The % fall in price (relative to average price of import composite) offered by the main exporters from ASEAN
Meat and meat products
5 4.12 584.4 -17.3 Thailand (18.8)and Malaysia (23.5)
Other metals 2 0.35 207.2 -2.3 Singapore (12.5) and Malaysia (12.3)
Food products 20 9.74 236.2 -18.8 Thailand (17.1), Vietnam (31.4) and Malaysia (17.7)
Oil and gas 3 0.53 207.2 -6.5 Malaysia (7.3) and Rest ASEAN (8.1)
Machinery equipment
5 1.06 158.7 -6.2 Singapore (9.9), Thailand (11.4) and Malaysia (11.6)
Wearing apparels 8 1.79 158.6 -7.1 Thailand (11.1), Singapore (11.1), Philippines (-11.2) and Indonesia (-11.1)
Other manufacturing
5 0.88 154.3 -4.2 Singapore (11.9) and Thailand (10.8)
Chemicals, rubber & plastic
13 2.53 127.6 -11.2 Singapore (9.7), Malaysia (11.2), Indonesia (12.3) and Thailand (10.9)
Transport equipment
8 1.26 130.2 -6.8 Singapore (8.3) and Indonesia (11.2)
Ferrous metals 5 1.5 165.9 -5.4 Singapore (14.2), Thailand (14.8) and Malaysia (14.6)
Other crops 17 18.43 870.1 -48.5 Vietnam (22) and Indonesia (19.4)
Coal 12 6.69 341.0 -30.3 Indonesia (19.5) and Vietnam (6.0)
Leather & leather products
9 1.32 147.0 -5.7 Indonesia (8.6) and Thailand (11.2)
Source: based on partial liberalization of all countries Note: import composite refers to bundle comprising of all imports of the product into India from different countries of the world including ASEAN region
28
References
i. Ahmed, S. 2010 India –ASEAN Free Trade Agreement: A Sectoral Analysis, SSRN Working paper 1698849, accessed at http://ssrn.com/abstract=1698849 on November 2010
ii. Elbehri, A and T. Hertel, (2004), A Comparative Analysis of the EU-Morocco FTA vs. Multilateral Liberalization, GTAP Working Paper No. 30
iii. Francois, J. F. (1998): Scale economies and imperfect competition in the GTAP Model, GTAP Technical Paper No. 14
iv. Harilal, K.N. 2010 ASEAN-India Free Trade - Area Noises of Dissent from Deep South, State Planning Board Occasional Paper, Kerala State Planning Board, Thiruvananthapuram.
v. Huff, K.M. and Hertel, T.W. 2000 Decomposing Welfare Changes in the GTAP Model, GTAP Technical Paper No. 5
vi. Karmakar, S. 2005 India–ASEAN Cooperation in Services – An Overview, ICRIER, Working Paper No. 176, New Delhi.
vii. Kawai, Masahiro & Wignaraja, G 2007 ASEAN+3 or ASEAN+6: Which Way Forward?, ADB Institute Discussion Paper No. 77, September 2007.
viii. Lee, H. & Liew, V.K.S 2007 India-ASEAN -5 Economic Integration: Impact of Liberalization- The IUP Journal of Applied Economics, Volume VI, Issue 6, pp 7-20.
ix. Pal, P. & Dasgupta, M. 2009 The ASEAN-India Free Trade Agreement: An Assessment, EPW, Vol. XLIV No. 38, September 19, 2009
x. Pal, P. & Dasgupta, M. 2008 Does a Free Trade Agreement with ASEAN Make Sense?, EPW, November 15, 2008.
xi. Sasatra, S & Prasopchoke, M 2007, ‘Go with the Gang, ASEAN!’ ASEAN Economic Bulletin 24 no.3, ISEAS 339–35.
xii. Sen, R, Asher, M.G. & Rajan, R.S. 2004 ASEAN- India Economic Relation: Current Status and Future Prospects, ISEAS Working Paper, 2004
xiii. Veeramani, C & Saini, G.K. 2010 Impact of ASEAN-India FTA on India’s Plantation Commodities: A Simulation Analysis, IGIDR working paper 2010-004
*****