India and Fortification · Rice –1 country (Papua New Guinea) Wheat flour, maize flour, and rice...
32
India and Fortification Presented by Venkat Subramanian Food Fortification Initiative Technical Adviser International Association of Operative Millers 4 December 2018
Transcript of India and Fortification · Rice –1 country (Papua New Guinea) Wheat flour, maize flour, and rice...

India and FortificationPresented by Venkat SubramanianFood Fortification Initiative Technical Adviser
International Association of Operative Millers
4 December 2018

Vitamins and minerals are combined in a powdery premix to add to flour during the milling process.
What is fortification?• Fortification adds
vitamins and minerals during milling so that foods made with flour are more nutritious.
Photo from Mühlenchemie

Global problems from vitamin and mineral deficiencies
233,300 preventable birth defects of the brain
and spine each year
Anemia contributes to 20% of all maternal
deaths
17% lower productivity from iron deficiency
anemia
Arth et al. 2016, WHO, n.d., Horton 2003Photos: International Federation for Spina Bifida and Hydrocephalus and Flickr Creative Commons

86 countries require fortification of flour and/or rice
Wheat flour: 85Maize flour: 16Rice: 6
Wheat flour – 66 countriesWheat flour and rice – 3 countries(Nicaragua, Panama, Philippines)
Rice – 1 country(Papua New Guinea)
Wheat flour, maize flour, and rice – 2 countries(Costa Rica and the United States)
Wheat flour and maize flour –14 countries No grain fortification legislation
* Legislation has effect of mandating grain fortification with at least iron or folic acid.Legislation status from the Food Fortification Initiative (www.FFInetwork.org) October 2018

Each year of
flour
fortification is
associated
with a 2.4%
decrease in
anemia.
Barkley et al. 2015
2.4%•Year 1
2.4%•Year 2
2.4%
•Year 3, etc.

Globally, fortifying flour with folic acid prevented about 50,270 brain and spine birth defects in 2017
Kancharla et al. 2018iStockphoto
On average that is
138healthier babiesevery day

Only ~18% of NTDs are prevented by fortifying flour with folic acid
Kancherla et al. 2018
Fortification in India

2012: India opportunities by market channels, grain and population
Blue: High priority due to higher matrix scoresGreen: intermediate priority.

istockphoto
Ongoing Fortification Program in Haryana
Assessed the wheat supply chain in the state of Haryana, developed a comprehensive strategy and approach for fortification, currently supporting implementation

• About 2,400 babies with brain and spine birth defects annually• 41 per 10,000 live births1
• Enough folic acid consumption could lower this to 350 brain and spine birth defects annually or 6 per 10,0002
Current prevalence of preventable birth defects is incredibly high
1 Bhide, Birth Defects Research (Part A), 2013; Annual Report on Working of the Registration of Births and Deaths Act, 1969--Haryana, 20132 Crider, British Medical Journal, 2014; Annual Report on Working of the Registration of Births and Deaths Act, 1969--Haryana, 2013Photo by Ankur P on Flickr

Source: NFS3
Anemia prevalence is also high in Haryana

74% of pregnant women in Haryana have vitamin B12 deficiency• Leads to:
• Neurological deterioration
• Megaloblastic anemia
• Developmental delay in children
• Vitamin B12 is not easily found in vegetarian food sources
Sources: Cordero et al., Food and Nutrition Bulletin, 2008Pathak, Food and Nutrition Bulletin, 2007

95% of wheat flour is consumed as atta products such as chapati and roti
5% of wheat flour is consumed as maida or atta in snacks, breads, biscuits
Source: Household Income and Economic Survey 2012-13, Food processing interviews
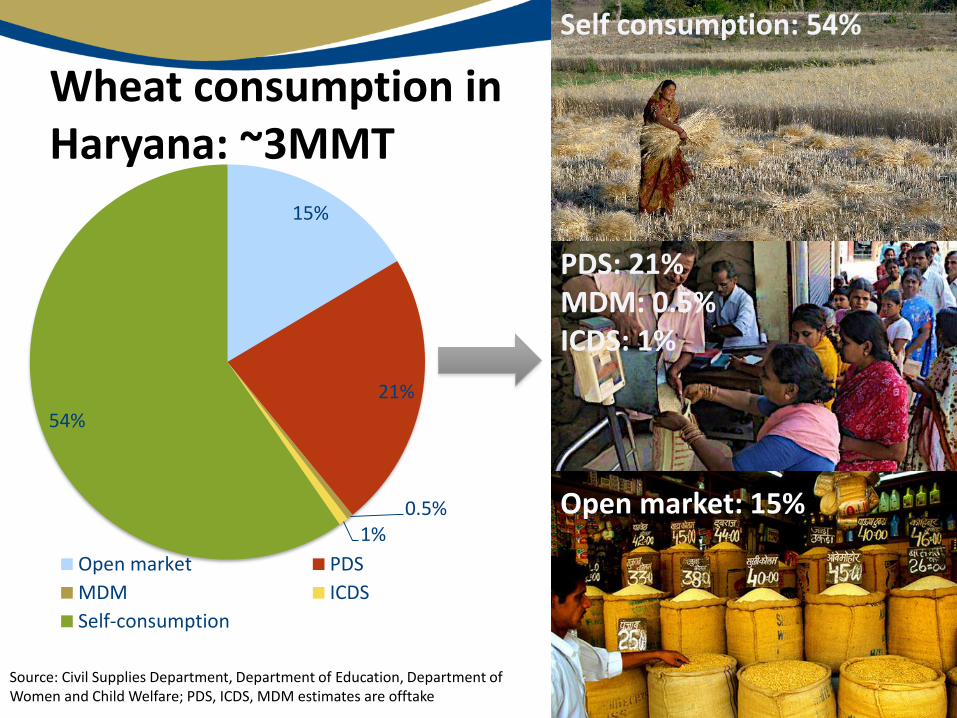
Wheat consumption in Haryana: ~3MMT
PDS: 21%MDM: 0.5%ICDS: 1%
Self consumption: 54%
Open market: 15%
Source: Civil Supplies Department, Department of Education, Department of Women and Child Welfare; PDS, ICDS, MDM estimates are offtake
15%
21%
0.5%1%
54%
Open market PDS
MDM ICDS
Self-consumption

Fortifying PDS wheat will achieve the greatest impact on public health.
Fortifiable wheat atta• PDS Beneficiaries make up 48% of
the Haryana population• ICDS and MDM can also be fortified
to reach young children and women but will have limited reach
• Maida and retail branded atta can also be fortified but market is small
Not fortifiable atta • Open market wheat (ground at local
chakkis or at home)• Self-consumption wheat
13.4
12.6
Non-PDS PDS beneficiaries
Million
Million
Source: Department of Civil Supplies and Services

Requirements to fortify atta• Quality chakki atta
– Past failures: using resultant atta, whole wheat flour (non-stone ground), high moisture content
• Private industry invests in capacity to meet those specifications– Laboratory capacity, food safety standards
• Enforcement of specifications– Regulatory monitoring
• Government sets specifications for atta– Ensures shelf life, consumer acceptability, public health
impact (i.e. bioavailable fortificants, appropriate levels)

Maida Chakki Atta
Whole wheat flour
Resultantatta
Ash (%) 0.4-0.6 1.2-1.6 1.2-2 <2.0
Protein (%) 9-14 9.5-11.5 14-18 --
Gluten (DB) -- >7 -- >6
Damaged starch AACC (%) 8 16-19 <8 <12
Moisture (%) <14.0 8.5-9.5 9-14 <14.0
Puffing (%) -- 100 -- --
Granulation +210 micron (%) 0 15-25 10-25 --
Fortified atta must have same qualities of chakki atta or consumers will reject the flour

Shelf life depends on milling practice
• Atta will store longer if mills use:• High quality cleaning systems to remove infested grains
• Controlled tempering (water addition) during grain preparation to prevent excessive moisture
• Equipment to kill insect eggs and prevent infestation
• High quality packaging to prevent excess moisture and air entry
0 1 2 3 4 5 6 7
Months shelf life
Commercial and village chakkis Roller flour mills Modern mills

Small Chakki Mill
Modern high-capacity mills
Options for Atta milling in Haryana
Commercial chakki mill
Roller flour mills with
chakki lines

Milling capacity to convert wheat to atta13,500 Small Chakkis (2 T/D)*
140 Commercial Chakkis (20 T/D)*
34 RFM with Chakki Lines (60 T/D)*
20 Modern Mills(130 T/D)
5 Modern Mills(520 T/D)
Require training, financial support for premix and blending machinery, and strong enforcement oversight
Require additional milling capacity, laboratory capacity, improved hygiene standards
Currently not in existence and requires state-of-the-art milling investment
Industrial options to mill targeted scheme wheat (PDS, MDM, ICDS) into atta:
• Upgrade commercial chakkis and roller flour mills to improve capacity and atta quality
• Invest in high capacity modern mills
*Currently existing milling infrastructure

Cost comparison of milling options
0.00
0.50
1.00
1.50
2.00
2.50
3.00
3.50
4.00
4.50
5.00
Small chakki Comm. Chakki Roller flourmill
Modern mill(130 TPD)
Modern mill(150 TPD)
Ru
pee
s p
er
kg
Utilities and packing costs (per kg)
Manpower costs (per/kg)
Cost of Investments (Total)/kg*
*Capital investments assume strict adherence to FSSAI standards
(520 TPD)
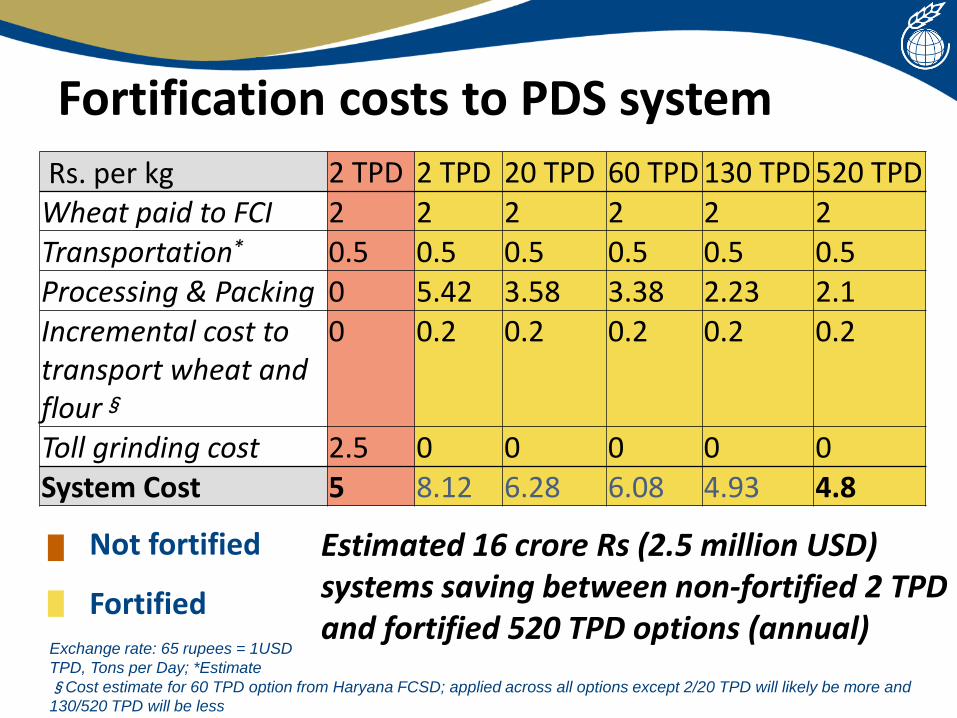
Fortification costs to PDS system
Rs. per kg 2 TPD 2 TPD 20 TPD 60 TPD 130 TPD 520 TPDWheat paid to FCI 2 2 2 2 2 2Transportation* 0.5 0.5 0.5 0.5 0.5 0.5Processing & Packing 0 5.42 3.58 3.38 2.23 2.1Incremental cost to transport wheat and flour§
0 0.2 0.2 0.2 0.2 0.2
Toll grinding cost 2.5 0 0 0 0 0System Cost 5 8.12 6.28 6.08 4.93 4.8
Not fortified
Fortified
Estimated 16 crore Rs (2.5 million USD) systems saving between non-fortified 2 TPD and fortified 520 TPD options (annual)
Exchange rate: 65 rupees = 1USD
TPD, Tons per Day; *Estimate
§Cost estimate for 60 TPD option from Haryana FCSD; applied across all options except 2/20 TPD will likely be more and
130/520 TPD will be less

Distribution of fortified atta started in March 2018
Distribution of 1000 MT/month
40 fair price shops (FPS)
Reaching 177,000 beneficiaries

Fortified atta in Haryana pilot project has high uptake
The pilot project to provide fortified wheat flour (atta) through public distribution system (PDS) is going well in two blocks of Ambala district.
96
80
0
10
20
30
40
50
60
70
80
90
100
Fortified Atta Wheat grain
Uptake percentage

Increased production capacity in Haryana
• Engaged continuously with ~32 chakki mill owners to increase production capacities.
• Some millers have already installed additional chakki lines; total production capacity in Haryana increased by 30-35%
• Scale-up to all of Haryana translates into 50,000 MT reaching around 12 million beneficiaries

istockphoto
On Going Supply Chain Assessment in Maharashtra

In Maharashtra, wheat dominates cereal consumption
6.04 MT
Despite low production, wheat has the highest average per capitaconsumption at 160 g/day followed by rice at about 100 g/day,with a late increase.
(Source: Deshmukh et.al.2018 ).

Consumption and imports are region specific
Wheat
Industrial zone (Wheat)
Northern Zone (Wheat) North Eastern (Wheat & Rice)
Jowar (a large self consumption crop with minimal industrial processing)
Paddy imports feeds the rice mills
Across Approx 1300 KM (800 miles)
Logistical complexity and consumption diversity leads toregion specific supply chains
Source: Based on Inputs from FCI / Traders / per capital consumption, FFI analysis

Questions

Getting approval for using 2016 FSSAI standards for wheat flour fortification
• 2018 FSSAI fortification standards are significantly lower
than World Health Organization recommendations.
• Non-recommended iron compounds have been
mentioned in wheat fortification standards.
• Haryana sent an official request to FSSAI to continue
with 2016 wheat flour fortification standards
FSSAI: Food Safety and Standards Authority of India
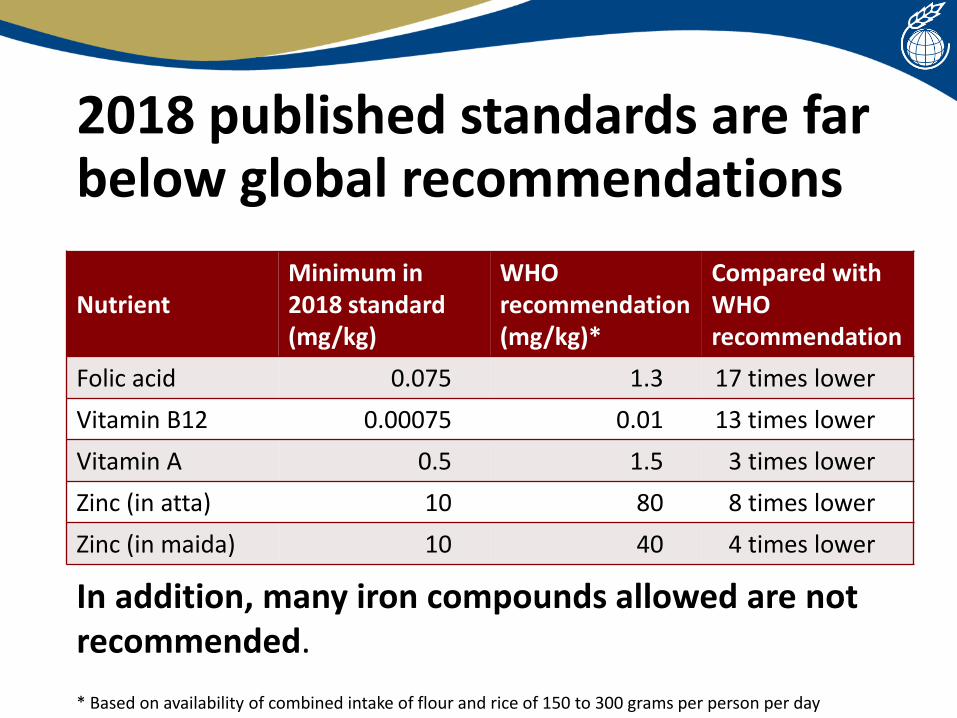
2018 published standards are far below global recommendations
NutrientMinimum in 2018 standard (mg/kg)
WHO recommendation (mg/kg)*
Compared with WHO recommendation
Folic acid 0.075 1.3 17 times lower
Vitamin B12 0.00075 0.01 13 times lower
Vitamin A 0.5 1.5 3 times lower
Zinc (in atta) 10 80 8 times lower
Zinc (in maida) 10 40 4 times lower
In addition, many iron compounds allowed are not recommended.
* Based on availability of combined intake of flour and rice of 150 to 300 grams per person per day