Index Methodology Template - MSCI
20
NOVEMBER 2013 DATA METHODOLOGY MSCI ECONOMIC EXPOSURE DATA METHODOLOGY November 2013
Transcript of Index Methodology Template - MSCI
NOVEMBER 2013
DATA METHODOLOGY
MSCI ECONOMIC EXPOSURE DATA METHODOLOGY
November 2013
MSCI.COM | PAGE 2 OF 20 © 2017 MSCI Inc. All rights reserved. Please refer to the disclaimer at the end of this document.
MSCI ECONOMIC EXPOSURE DATA METHODOLOGY | NOVEMBER 2013
Outline of the Methodology Book…………………………………………………….3
Section 1: Introduction………................................................................ 4
Section 2: Estimating Economic Exposure of Companies ....................6
2.1 Applicable Universe.....................................................................……….………7
2.2 Obtaining the geographic segment information of the Company………....... 7
2.3 Disaggregating the geographic segments into the constituent countries…10
2.4 Processing the individual geographic segments……………………….................11
2.5 Aggregating the country exposures to calculate region exposures ............12
2.6 Computing Estimation scores .....................................................................13
Section 3: Maintaining the Security Data Modules .......................... 14
3.1 Monthly review ......................................................................................... 14
3.2 Handling Corporate Events........................................................................ 14
3.3 GDP updates .............................................................................................. 16
3.4 Corrections Policy .......................................................................................16
Appendix I: List of Regions for which Economic Exposures are
computed in the Security Data Modules ...........................................17
Appendix II: Exceptions where the ‘Derived from Geographic
segment’ field is blanked ...................................................................18
CONTENTS
MSCI.COM | PAGE 3 OF 20 © 2017 MSCI Inc. All rights reserved. Please refer to the disclaimer at the end of this document.
MSCI ECONOMIC EXPOSURE DATA METHODOLOGY | NOVEMBER 2013
OUTLINE OF THE METHODOLOGY BOOK
This methodology book details the methodology to create and maintain the MSCI Economic
Exposure Security Data Modules and the MSCI Small Cap Economic Exposure Security Data
Modules (herein ‘Security Data Modules’).
Section 1 provides a brief introduction to the Security Data Modules.
Section 2 provides details of the methodology used to compute the economic exposure of
companies to different regions and countries. This includes the methodology for computing
other metrics / fields such as estimation scores derived from reported geographic segment
level revenue data and computation of the economic exposure of select MSCI Indices to
specific countries.
Section 3 describes the procedures to maintain economic exposure data on an ongoing basis
to reflect timely updates and changes arising from corporate events, company level revenue
updates, updates to GDP data and any corrections to economic exposure data.
Section 4 has appendices that provide details of the list of countries and regions for which
economic exposures are computed.
This methodology book was last updated in November 2013.
MSCI.COM | PAGE 4 OF 20 © 2017 MSCI Inc. All rights reserved. Please refer to the disclaimer at the end of this document.
MSCI ECONOMIC EXPOSURE DATA METHODOLOGY | NOVEMBER 2013
SECTION 1: INTRODUCTION
With continued trends in globalization, many companies increasingly operate across several
countries and regions. Consequently, their revenues may be exposed to economic activity in
many regions other than their home country. Significant disparities in the reporting of
segment level financial data across companies and practical issues of availability of reliable
data have prompted MSCI to develop a simple and transparent methodology to estimate the
economic exposure of companies in a consistent manner using the geographic distribution
of a firm’s revenues and the nominal GDP of the countries where revenues are generated.
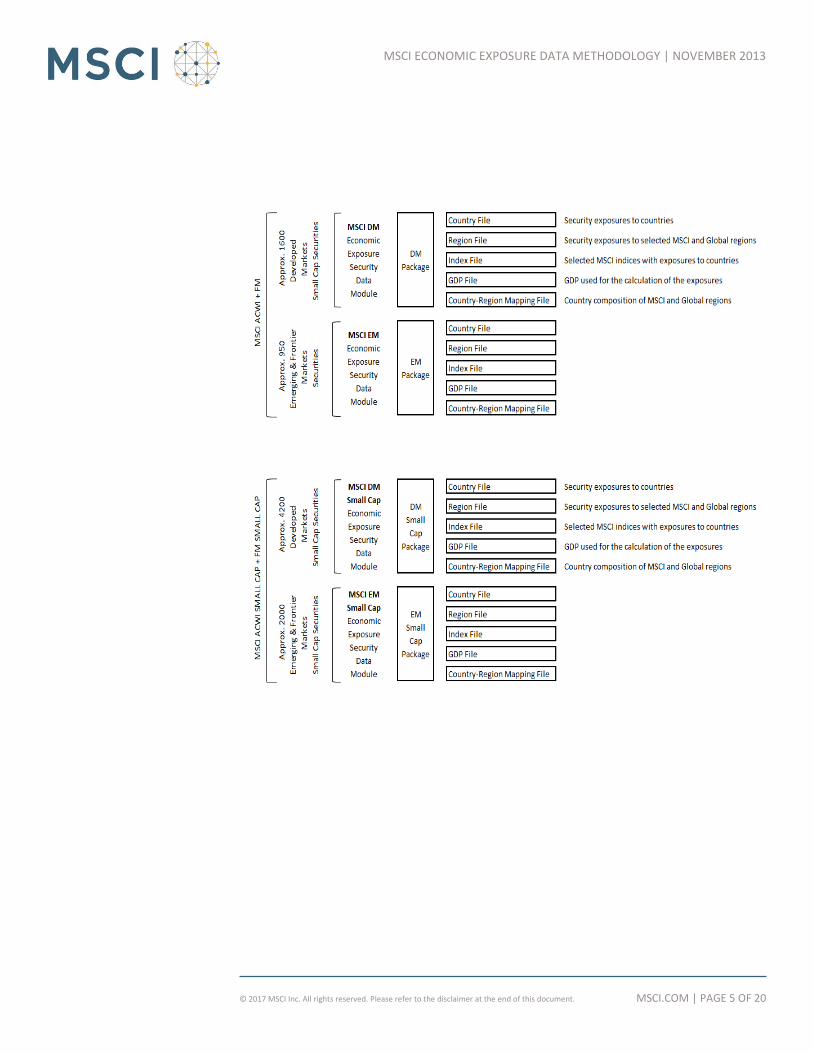
The Security Data Modules cover developed, emerging and frontier markets. These modules
provide geographic revenue breakdowns by country and by region for each large, mid and
small cap stock included in the MSCI ACWI + Frontier Markets (ACWI FM) IMI Index1, and are
designed to enhance and support portfolio management, portfolio construction and risk
management investment decisions and processes.
The modules represent innovative tools for clients to:
Compare portfolio economic exposures with a benchmark
Tilt a portfolio’s economic exposure towards a target country or region
Calculate and report portfolio economic exposures to specific regions or countries
The Security Data Modules apply a consistent and transparent methodology to calculate the
economic exposure of a broad and investable universe of securities, using each company’s
reported revenues by geographic segment and the nominal GDP of the constituent countries
in each regional segment. The Security Data Modules provide five files in a pipe-delimited
format and XML format.
1 MSCI ACWI + Frontier Markets (ACWI FM) Investable Market Index (IMI), a global equity index consisting of large, mid
and small cap stocks from developed, emerging and frontier market countries.
MSCI.COM | PAGE 5 OF 20 © 2017 MSCI Inc. All rights reserved. Please refer to the disclaimer at the end of this document.
MSCI ECONOMIC EXPOSURE DATA METHODOLOGY | NOVEMBER 2013

MSCI.COM | PAGE 6 OF 20 © 2017 MSCI Inc. All rights reserved. Please refer to the disclaimer at the end of this document.
MSCI ECONOMIC EXPOSURE DATA METHODOLOGY | NOVEMBER 2013
SECTION 2: ESTIMATING ECONOMIC EXPOSURE OF COMPANIES
The economic exposure of a company to a target region or country is the proportion of its
revenues coming from that region. As a general principle, MSCI estimates economic
exposure from the geographic segment distribution of revenues by final markets/destination
as reported by a company and the GDP weight of the countries and regions within a specific
geographic segment.
Example:
In the case of determining EM exposure, all countries and regions (including frontier
markets) except developed markets are included for the calculation of the EM exposure of a
company. The EM exposure of a security is derived as the weighted average of the
percentage segment revenue and the GDP weight of the emerging market countries within
each of the geographic segments (16.3% in this example)
Exhibit 1: Example Calculation of EM Exposure for ABC Ltd.
The generic calculation of the economic exposures of companies in the Security Data Module involves the following steps:
Select the applicable universe of companies
Obtain the geographic segment revenue information for each company
Disaggregate the reported geographic segments into the constituent countries
Process the geographic segments starting from the smallest (individual countries / smaller regions) to largest (larger regions, ‘Rest of the World’) based on the number of countries in a geographic segment
Aggregate the country level exposure to arrive at the regional exposures using the region to country mapping definitions
Compute estimation scores for the different economic exposures of a company Each of these steps is explained in more detail below.
MSCI.COM | PAGE 7 OF 20 © 2017 MSCI Inc. All rights reserved. Please refer to the disclaimer at the end of this document.
MSCI ECONOMIC EXPOSURE DATA METHODOLOGY | NOVEMBER 2013
2.1 APPLICABLE UNIVERSE
The applicable universe comprises all the companies that are constituents of the MSCI ACWI
+ Frontier Markets (ACWI FM) IMI Index. This universe covers nearly 8700 large, mid and
small cap companies from developed, emerging and frontier markets that reflect the
international opportunity set of global equities.
2.2 OBTAINING THE GEOGRAPHIC SEGMENT INFORMATION OF THE COMPANY
To obtain the geographic segment information of the company
Identify the reported geographic segment information of the company
Standardize the reported geographic segment information
Identifying the geographic segment information of the companies
Source of information The geographic segment information of the company may be sourced from vendor databases and the latest annual reports of the company. If the information is not available from either of these two sources, other public information provided by the company such as financial reports, investor presentations, company websites and other related reports may be used to arrive at the geographic segment information. Revenues by final markets/destination As a general principle, when a company reports revenue distributions by subsidiary locations and by final markets/destination, the revenue distribution by final markets/destination is used. For re-insurance firms, the geographic segment data may be reported by subsidiary locations or by ceding company locations. The subsidiary location is the location of the reinsurance company subsidiary that is generating the revenue, while the ceding company is the insurance company that passes a part or all of its risks from its insurance portfolio to the reinsurance firm. The geographic segment distribution of revenues by ceding company locations is used wherever possible for estimating economic exposure. In the case of companies that report revenues only by source of production or operations (e.g., mining locations or assets) and there is no reported information on revenues by end markets or customer segments, the geographic segment revenues reported by source of production or operations may be used to estimate the company’s economic exposure. In cases where companies report geographic segment revenues by production source and based on sales from end markets (by volume), the distribution of sales by volume is used to

MSCI.COM | PAGE 8 OF 20 © 2017 MSCI Inc. All rights reserved. Please refer to the disclaimer at the end of this document.
MSCI ECONOMIC EXPOSURE DATA METHODOLOGY | NOVEMBER 2013
estimate economic exposure. If the revenue type of a company cannot be ascertained with reasonable accuracy, it is set as destination by default in the Security Data Modules. Geographic segment revenues reported as either “Predominantly” or “more than x%”
If the geographic segments are reported as “predominantly/substantially from Japan”, all of the firm’s revenues are assigned to Japan.
If the geographic segments are reported as “more than x% coming from Japan” then
If x >= 90%, all of the firm’s revenues are assigned to Japan
If x<90%, Japan is assigned x% of the firm’s revenues and Rest of the World is assigned (100-x)%
Revenues for Banks and Insurance companies The revenues for Financial companies are determined as the sum of Net Interest Income (NII) + Commissions and Fees + Realized Gains on Sales of Investments – Impairment Losses Recognized for Earnings + Insurance Premiums + Other Revenues.
Insurance companies’ total income is defined as the sum of net premiums + fees + investment income + commissions + other income.
If such data is not available, then the geographic segment revenue distribution as reported by the company is considered for estimating economic exposure. Companies with non-geographic segments The sum of the geographic segment revenues of the company may differ from the total revenues of the company. For example, according to the International Financial Reporting Standards (IFRS), the companies that follow the IFRS must report the segment information covering at least 75% of the company revenues2. Also, the presence of non-geographic segments such as eliminations, corporate center activities and inter-segment sales may result in the total segment revenues being more or less than the total revenues of the company. For the purpose of computing economic exposure, only the geographic segments of the company are considered for calculation, and any non-geographic segments are ignored. The sum of the company level exposures to all the countries (including ‘other countries’) would always add up to 100%, even if the sum of revenues coming from the geographic segments of the company is different from the total revenues of the company.
2 International Financial Reporting Standard 8 relating to Operating segments
MSCI.COM | PAGE 9 OF 20 © 2017 MSCI Inc. All rights reserved. Please refer to the disclaimer at the end of this document.
MSCI ECONOMIC EXPOSURE DATA METHODOLOGY | NOVEMBER 2013
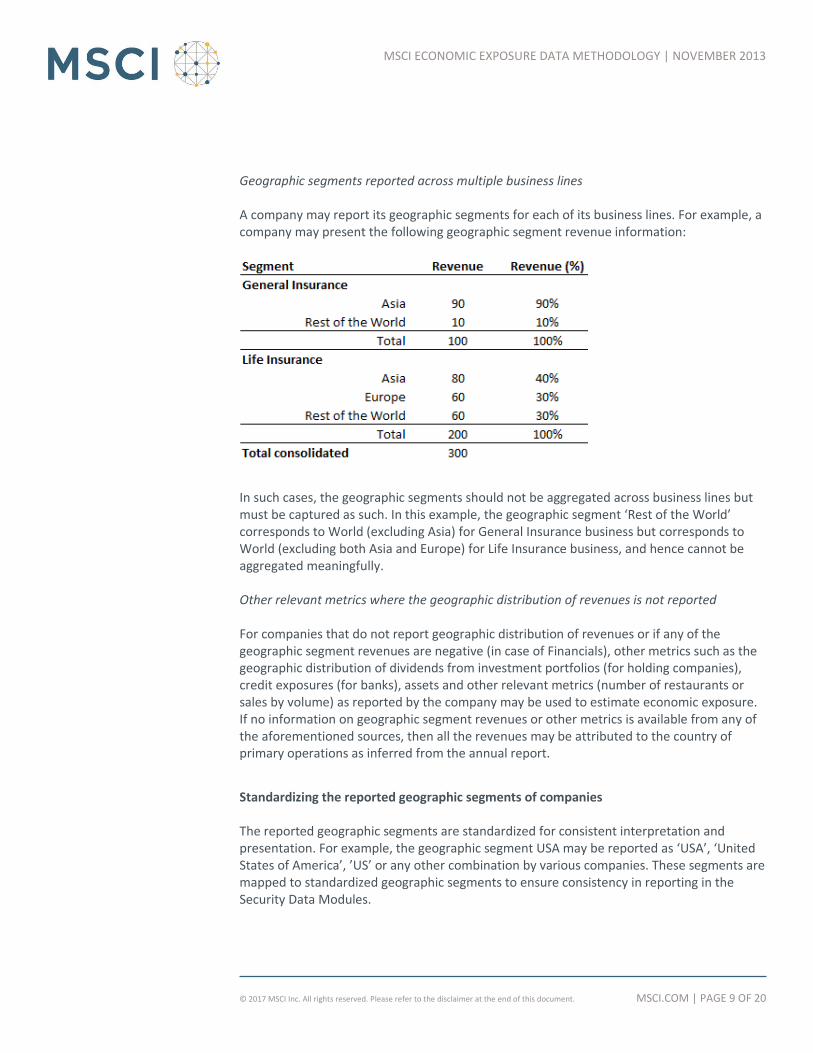
Geographic segments reported across multiple business lines A company may report its geographic segments for each of its business lines. For example, a company may present the following geographic segment revenue information:
In such cases, the geographic segments should not be aggregated across business lines but must be captured as such. In this example, the geographic segment ‘Rest of the World’ corresponds to World (excluding Asia) for General Insurance business but corresponds to World (excluding both Asia and Europe) for Life Insurance business, and hence cannot be aggregated meaningfully. Other relevant metrics where the geographic distribution of revenues is not reported For companies that do not report geographic distribution of revenues or if any of the geographic segment revenues are negative (in case of Financials), other metrics such as the geographic distribution of dividends from investment portfolios (for holding companies), credit exposures (for banks), assets and other relevant metrics (number of restaurants or sales by volume) as reported by the company may be used to estimate economic exposure. If no information on geographic segment revenues or other metrics is available from any of the aforementioned sources, then all the revenues may be attributed to the country of primary operations as inferred from the annual report.
Standardizing the reported geographic segments of companies The reported geographic segments are standardized for consistent interpretation and presentation. For example, the geographic segment USA may be reported as ‘USA’, ‘United States of America’, ’US’ or any other combination by various companies. These segments are mapped to standardized geographic segments to ensure consistency in reporting in the Security Data Modules.
MSCI.COM | PAGE 10 OF 20 © 2017 MSCI Inc. All rights reserved. Please refer to the disclaimer at the end of this document.
MSCI ECONOMIC EXPOSURE DATA METHODOLOGY | NOVEMBER 2013
2.3 DISAGGREGATING THE GEOGRAPHIC SEGMENTS INTO THE CONSTITUENT
COUNTRIES
The next step is to decompose the standardized geographic segments into the constituent countries. While this process is straightforward when the geographic segments are individual countries or a set of countries, the geographic segments may also fall into various categories outlined below.
Global regions: The regions such as Asia, Europe, Americas etc. are defined systematically and consistently applied. The list of 244 countries in the world, and the region to country mapping for the global regions is defined by MSCI based on official sources such as the United Nations, IMF and the World Bank3. The region to country mapping for the different global regions is made available as part of the Security Data Modules.
Geographic segments such as ‘Mature markets’, ’Growth markets’, ‘Emerging Markets’: These geographic segments are mapped to the emerging or developed markets as defined by MSCI for the purpose of computing economic exposure. The developed markets include the countries in the MSCI World Index and a few other developed market countries such as Liechtenstein, Luxembourg and Monaco not covered by the MSCI country classification. In turn, the emerging markets countries are defined as all countries and regions in the world (including frontier markets) excluding developed markets.
Ambiguous geographic segments such as ‘Asia and others’: For these segments, the company’s reported financials are reviewed for any additional information. In the absence of more granular country level information, the geographic segment is mapped to the granular country / region. For example, the geographic segment ‘Asia and others’ would be mapped to Asia absent any additional relevant information.
Geographic segments such as ‘Home’, ‘Domestic’ and ‘Foreign’: In instances where the geographic segment is defined as ‘Home’ or ‘Domestic’, it is mapped to the company’s country corresponding to the MSCI country classification of securities. The geographic segment ‘Foreign’ is mapped to ‘Rest of the World’.
Therefore, the domestic exposure of any company in the MSCI ACWI + Frontier Markets (ACWI FM) IMI Index is equal to the country exposure corresponding to the company’s MSCI country classification4. The international exposure is equal to one minus its domestic exposure.
3 Refer to the IMF WEO database, UN Standard Country and Area Code classifications, World Bank for more details
4 Refer to Appendix III: Country Classification of Securities of the MSCI Global Investable Market Indices Methodology for more details
MSCI.COM | PAGE 11 OF 20 © 2017 MSCI Inc. All rights reserved. Please refer to the disclaimer at the end of this document.
MSCI ECONOMIC EXPOSURE DATA METHODOLOGY | NOVEMBER 2013
2.4 PROCESSING THE INDIVIDUAL GEOGRAPHIC SEGMENTS
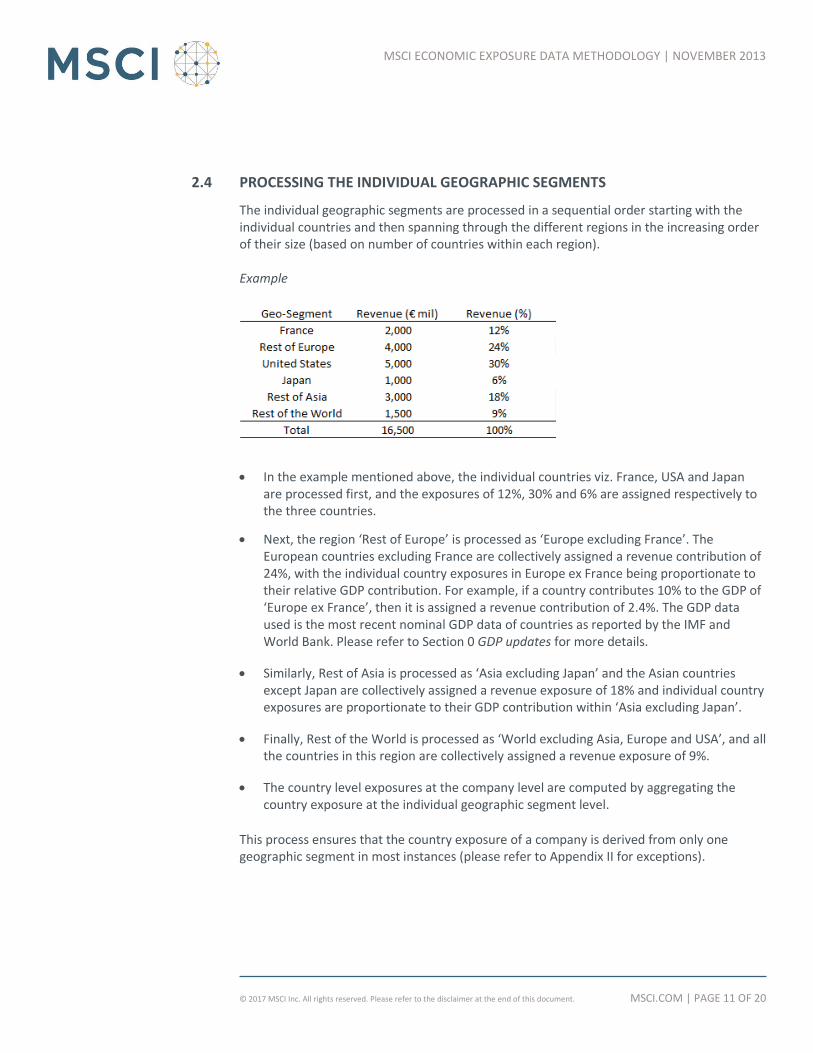
The individual geographic segments are processed in a sequential order starting with the individual countries and then spanning through the different regions in the increasing order of their size (based on number of countries within each region). Example
In the example mentioned above, the individual countries viz. France, USA and Japan
are processed first, and the exposures of 12%, 30% and 6% are assigned respectively to the three countries.
Next, the region ‘Rest of Europe’ is processed as ‘Europe excluding France’. The European countries excluding France are collectively assigned a revenue contribution of 24%, with the individual country exposures in Europe ex France being proportionate to their relative GDP contribution. For example, if a country contributes 10% to the GDP of ‘Europe ex France’, then it is assigned a revenue contribution of 2.4%. The GDP data used is the most recent nominal GDP data of countries as reported by the IMF and World Bank. Please refer to Section 0 GDP updates for more details.
Similarly, Rest of Asia is processed as ‘Asia excluding Japan’ and the Asian countries except Japan are collectively assigned a revenue exposure of 18% and individual country exposures are proportionate to their GDP contribution within ‘Asia excluding Japan’.
Finally, Rest of the World is processed as ‘World excluding Asia, Europe and USA’, and all the countries in this region are collectively assigned a revenue exposure of 9%.
The country level exposures at the company level are computed by aggregating the country exposure at the individual geographic segment level.
This process ensures that the country exposure of a company is derived from only one geographic segment in most instances (please refer to Appendix II for exceptions).
MSCI.COM | PAGE 12 OF 20 © 2017 MSCI Inc. All rights reserved. Please refer to the disclaimer at the end of this document.
MSCI ECONOMIC EXPOSURE DATA METHODOLOGY | NOVEMBER 2013
Therefore, it is possible to attribute the country exposure of the company to the standardized geographic segment from which it is derived. This information is provided as a part of the Security Data Modules under the field ‘Derived from geographic segment’. In case of companies reporting the geographic segments under multiple business lines, the process is repeated for each of the business lines, and the country exposures of the individual business lines are aggregated at the company level using the business segment revenue weights. The economic exposures are computed for all the countries that are part of the MSCI ACWI Index, MSCI Frontier Markets and MSCI stand-alone country indices. For the countries not covered by the MSCI country classification, the country exposures are aggregated and reflected under the category ‘other countries’.
2.5 AGGREGATING THE COUNTRY EXPOSURES TO CALCULATE REGION EXPOSURES
The final step is to compute the regional exposures of a company from its country exposures. The regional exposures for the MSCI regions are computed using the MSCI region country definitions5. The regional exposures for the global regions are computed using the definitions described in Section 2.3. In addition to company level revenue based exposures, index level exposures are also provided for select MSCI Indices. The index level revenue exposure for an MSCI Index is computed by first aggregating the country exposure revenues (in USD) for the companies in the index, and deriving the proportion of revenue attributable to the individual countries. During aggregation, any duplication that may arise from multiple securities of a company of the MSCI Index (e.g., Atlas Copco A and Atlas Copco B, dual listed entities such as Unilever NV and Unilever Plc) is addressed. The conversion of the reported country revenues in local currency for the individual companies to USD is done using the exchange rates at the end of the month. The list of regions for which country level exposures are computed is provided in Appendix I.
5 Please refer to the MSCI Region Country Membership for the latest definitions
MSCI.COM | PAGE 13 OF 20 © 2017 MSCI Inc. All rights reserved. Please refer to the disclaimer at the end of this document.
MSCI ECONOMIC EXPOSURE DATA METHODOLOGY | NOVEMBER 2013
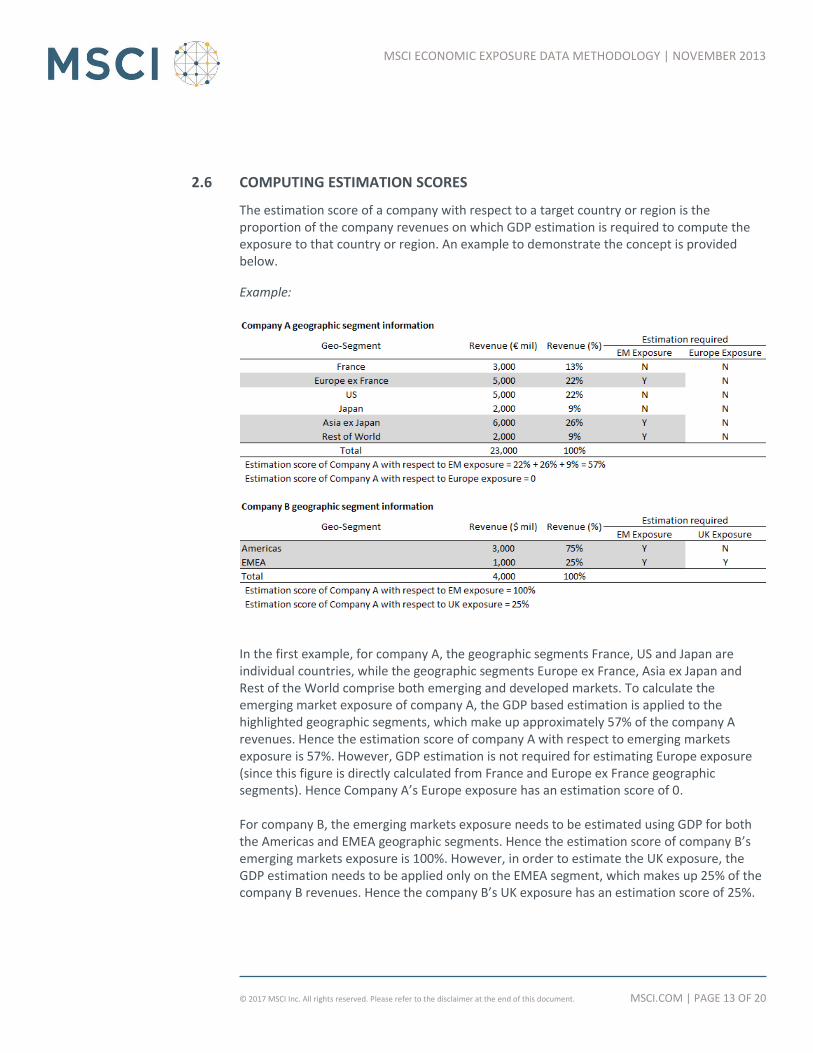
2.6 COMPUTING ESTIMATION SCORES
The estimation score of a company with respect to a target country or region is the proportion of the company revenues on which GDP estimation is required to compute the exposure to that country or region. An example to demonstrate the concept is provided below.
Example:
In the first example, for company A, the geographic segments France, US and Japan are individual countries, while the geographic segments Europe ex France, Asia ex Japan and Rest of the World comprise both emerging and developed markets. To calculate the emerging market exposure of company A, the GDP based estimation is applied to the highlighted geographic segments, which make up approximately 57% of the company A revenues. Hence the estimation score of company A with respect to emerging markets exposure is 57%. However, GDP estimation is not required for estimating Europe exposure (since this figure is directly calculated from France and Europe ex France geographic segments). Hence Company A’s Europe exposure has an estimation score of 0. For company B, the emerging markets exposure needs to be estimated using GDP for both the Americas and EMEA geographic segments. Hence the estimation score of company B’s emerging markets exposure is 100%. However, in order to estimate the UK exposure, the GDP estimation needs to be applied only on the EMEA segment, which makes up 25% of the company B revenues. Hence the company B’s UK exposure has an estimation score of 25%.
MSCI.COM | PAGE 14 OF 20 © 2017 MSCI Inc. All rights reserved. Please refer to the disclaimer at the end of this document.
MSCI ECONOMIC EXPOSURE DATA METHODOLOGY | NOVEMBER 2013
The estimation score is computed in a similar way for all companies and with respect to the target countries and regions. It should be noted that the estimation scores of a company to complimentary regions (like developed markets and emerging markets, Japan and World ex Japan, domestic and foreign) of the World are always equal. The estimation score is not reported for the countries grouped under ‘other countries’ category.
SECTION 3: MAINTAINING THE SECURITY DATA MODULES
MSCI Security Data Modules are maintained and updated on a monthly basis to reflect any changes arising from updates to company financials, corporate events and the GDP data. In particular, the maintenance involves:
Monthly updates to the Security Data Modules in order to reflect the company level updates and corporate events
Treatment of corporate events
GDP updates
Corrections
3.1 MONTHLY REVIEW
The companies are reviewed every month for changes arising from updates to their
published financial information and corporate events.
3.2 HANDLING CORPORATE EVENTS
Ongoing corporate events such as mergers, acquisitions, spin‐offs and bankruptcies are
reflected in the Security Data Modules at the end of the month. The details of the various
corporate events and their impact on economic exposures are detailed below.
IPOs and other early inclusions
In the case of newly listed companies, the geographic segment information found in the
company prospectus or regulatory filings are used for computing the economic exposures.
For other early inclusions to the universe, the information from the sources as detailed in
section 0 Source of information may be used for computing exposures.
Bankruptcy and early deletions from the Universe
If the company is deleted from the applicable universe during a month, it would be deleted
from the Security Data Modules as well.
MSCI.COM | PAGE 15 OF 20 © 2017 MSCI Inc. All rights reserved. Please refer to the disclaimer at the end of this document.
MSCI ECONOMIC EXPOSURE DATA METHODOLOGY | NOVEMBER 2013
Mergers and Acquisitions
In the case of a merger or an acquisition between two companies that are part of the
applicable universe, the geographic segment information of the combined entity may be
significantly different from the individual entities. The event is reviewed on a case by case
basis using sources such as the interim filings in order to ascertain the impact of the event
on the geographic segment revenues of the combined entity. If such information cannot be
ascertained with reasonable accuracy, the combined entity is treated as one company with
two business lines, with the business lines being the individual companies prior to the
merger / acquisition, and the exposures are computed as described in sections 0
(Geographic segments reported across multiple business lines) and Section 0 (Aggregating
the country exposures to calculate region exposures) for treatment of companies with
multiple business lines.
In the case of a merger or an acquisition between a constituent of the applicable universe
and a company not a constituent of the applicable universe, the existing exposure of the
constituent company would be retained until the combined entity’s published financial
information is made publicly available.
The exposures are tagged with relevant event flags in the Security Data Modules to reflect
the pre-event or the post-event status of the exposures.
Spin offs
If a company is added to the applicable universe as a result of a spin off, the event is
reviewed using sources such as the interim filings in order to ascertain the impact of the
event on the geographic segment revenues of the spun off entity and the parent company.
In the event such information cannot be ascertained with reasonable accuracy, the
exposures of the parent company are applied to the spun off company until such time as
updated information is available to recalculate exposures of the spun off company.
Conversion, Country reclassification and Stock exchange reclassification
The security conversion, country reclassification and stock exchange reclassification do not
result in any change in the country and regional exposures of the company. However, the
country reclassification of the security by MSCI would result in a change in the domestic
exposure and international exposure, as the domestic exposure would now refer to the
country exposure of the reclassified country.
Assigning Event flags in the Security Data Modules
The companies which have undergone event related changes in the exposures would be
assigned an event flag to reflect the pre-event or post event status of exposures. An event
flag of 1 indicates that the exposures are pre-event, which means the company’s geographic
MSCI.COM | PAGE 16 OF 20 © 2017 MSCI Inc. All rights reserved. Please refer to the disclaimer at the end of this document.
MSCI ECONOMIC EXPOSURE DATA METHODOLOGY | NOVEMBER 2013
segment information before the event occurred was used for estimating the exposures. An
event flag of 2 indicates the exposures are post-event, which means the geographic
information is based on prospectus, regulatory filings or other public information that were
made available by the company post the corporate event. An event flag of 3 refers to the
exposures of a recently listed company (IPO).
3.3 GDP UPDATES
The nominal GDP (in USD) data of countries obtained from IMF and World Bank is reviewed
twice a year, (usually at the end of April and October), coinciding with the release of IMF
World Economic Outlook report and is generally used to update the Security Data Modules
in April and October. Since all the countries of the world may not report their GDP at the
same time, a lagged GDP estimate up to 3 years is considered acceptable for computing the
GDP weights and economic exposures for a given month.
The exposures of a company are calculated using the latest available geographic segment
information and the latest GDP weights. Therefore, the exposures of companies may be
updated following updates to the GDP weights.
3.4 CORRECTIONS POLICY
Any corrections applied by MSCI to the existing geographic segments of a company would
result in a recalculation of the economic exposures for the company. Following a correction,
the company’s revised economic exposures to major regions such as Americas, Asia, Africa,
Europe, Oceania, emerging markets and domestic markets are compared with their original
values. If the absolute change in exposures is greater than 5% and the percentage change in
exposures is greater than 10% with respect to any of the aforementioned regions, an
announcement is made by MSCI with the revised country and region exposures for the
company, along with the revised index level revenue exposures.

MSCI.COM | PAGE 17 OF 20 © 2017 MSCI Inc. All rights reserved. Please refer to the disclaimer at the end of this document.
MSCI ECONOMIC EXPOSURE DATA METHODOLOGY | NOVEMBER 2013
APPENDIX I: LIST OF REGIONS FOR WHICH ECONOMIC EXPOSURES
ARE COMPUTED IN THE SECURITY DATA MODULES
MSCI.COM | PAGE 18 OF 20 © 2017 MSCI Inc. All rights reserved. Please refer to the disclaimer at the end of this document.
MSCI ECONOMIC EXPOSURE DATA METHODOLOGY | NOVEMBER 2013
APPENDIX II: EXCEPTIONS WHERE THE ‘DERIVED FROM
GEOGRAPHIC SEGMENT’ FIELD IS BLANKED
The Derived from geographic segment field is populated for all rows in the country file of the
Security Data Modules except in cases where:
Companies report their geographic segments within business lines
Companies are ‘Holding companies’, where the exposures may be derived from the
exposures of the subsidiaries
Country exposures for countries grouped under ‘other countries’ or ‘international
exposure’ category
NOVEMBER 2013
DATA METHODOLOGY
AMERICAS
Americas 1 888 588 4567 *
Atlanta + 1 404 551 3212
Boston + 1 617 532 0920
Chicago + 1 312 675 0545
Monterrey + 52 81 1253 4020
New York + 1 212 804 3901
San Francisco + 1 415 836 8800
Sao Paulo + 55 11 3706 1360
Toronto + 1 416 628 1007
EUROPE, MIDDLE EAST & AFRICA
Cape Town + 27 21 673 0100
Frankfurt + 49 69 133 859 00
Geneva + 41 22 817 9777
London + 44 20 7618 2222
Milan + 39 02 5849 0415
Paris 0800 91 59 17 *
ASIA PACIFIC
China North 10800 852 1032 *
China South 10800 152 1032 *
Hong Kong + 852 2844 9333
Mumbai + 91 22 6784 9160
Seoul 00798 8521 3392 *
Singapore 800 852 3749 *
Sydney + 61 2 9033 9333
Taipei 008 0112 7513 *
Thailand 0018 0015 6207 7181 *
Tokyo + 81 3 5290 1555
ABOUT MSCI
For more than 40 years, MSCI’s research-
based indexes and analytics have helped
the world’s leading investors build and
manage better portfolios. Clients rely on
our offerings for deeper insights into the
drivers of performance and risk in their
portfolios, broad asset class coverage and
innovative research.
Our line of products and services includes
indexes, analytical models, data, real estate
benchmarks and ESG research.
MSCI serves 97 of the top 100 largest
money managers, according to the most
recent P&I ranking.
For more information, visit us at
www.msci.com.
* = toll free
CONTACT US
MSCI ECONOMIC EXPOSURE DATA METHODOLOGY | NOVEMBER 2013
MSCI.COM | PAGE 20 OF 20 © 2017 MSCI Inc. All rights reserved.
This document and all of the information contained in it, including without limitation all text, data, graphs, charts (collectively, the “Information”) is the property of MSCI Inc. or its subsidiaries (collectively, “MSCI”), or MSCI’s licensors, direct or indirect suppliers or any third party involved in making or compiling any Information (collectively, with MSCI, the “Information Providers”) and is provided for informational purposes only. The Information may not be modified, reverse-engineered, reproduced or redisseminated in whole or in part without prior written permission from MSCI.
The Information may not be used to create derivative works or to verify or correct other data or information. For example (but without limitation), the Information may not be used to create indexes, databases, risk models, analytics, software, or in connection with the issuing, offering, sponsoring, managing or marketing of any securities, portfolios, financial products or other investment vehicles utilizing or based on, linked to, tracking or otherwise derived from the Information or any other MSCI data, information, products or services.
The user of the Information assumes the entire risk of any use it may make or permit to be made of the Information. NONE OF THE INFORMATION PROVIDERS MAKES ANY EXPRESS OR IMPLIED WARRANTIES OR REPRESENTATIONS WITH RESPECT TO THE INFORMATION (OR THE RESULTS TO BE OBTAINED BY THE USE THEREOF), AND TO THE MAXIMUM EXTENT PERMITTED BY APPLICABLE LAW, EACH INFORMATION PROVIDER EXPRESSLY DISCLAIMS ALL IMPLIED WARRANTIES (INCLUDING, WITHOUT LIMITATION, ANY IMPLIED WARRANTIES OF ORIGINALITY, ACCURACY, TIMELINESS, NON-INFRINGEMENT, COMPLETENESS, MERCHANTABILITY AND FITNESS FOR A PARTICULAR PURPOSE) WITH RESPECT TO ANY OF THE INFORMATION.
Without limiting any of the foregoing and to the maximum extent permitted by applicable law, in no event shall any Information Provider have any liability regarding any of the Information for any direct, indirect, special, punitive, consequential (including lost profits) or any other damages even if notified of the possibility of such damages. The foregoing shall not exclude or limit any liability that may not by applicable law be excluded or limited, including without limitation (as applicable), any liability for death or personal injury to the extent that such injury results from the negligence or willful default of itself, its servants, agents or sub-contractors.
Information containing any historical information, data or analysis should not be taken as an indication or guarantee of any future performance, analysis, forecast or prediction. Past performance does not guarantee future results.
The Information should not be relied on and is not a substitute for the skill, judgment and experience of the user, its management, employees, advisors and/or clients when making investment and other business decisions. All Information is impersonal and not tailored to the needs of any person, entity or group of persons.
None of the Information constitutes an offer to sell (or a solicitation of an offer to buy), any security, financial product or other investment vehicle or any trading strategy.
It is not possible to invest directly in an index. Exposure to an asset class or trading strategy or other category represented by an index is only available through third party investable instruments (if any) based on that index. MSCI does not issue, sponsor, endorse, market, offer, review or otherwise express any opinion regarding any fund, ETF, derivative or other security, investment, financial product or trading strategy that is based on, linked to or seeks to provide an investment return related to the performance of any MSCI index (collectively, “Index Linked Investments”). MSCI makes no assurance that any Index Linked Investments will accurately track index performance or provide positive investment returns. MSCI Inc. is not an investment adviser or fiduciary and MSCI makes no representation regarding the advisability of investing in any Index Linked Investments.
Index returns do not represent the results of actual trading of investible assets/securities. MSCI maintains and calculates indexes, but does not manage actual assets. Index returns do not reflect payment of any sales charges or fees an investor may pay to purchase the securities underlying the index or Index Linked Investments. The imposition of these fees and charges would cause the performance of an Index Linked Investment to be different than the MSCI index performance.
The Information may contain back tested data. Back-tested performance is not actual performance, but is hypothetical. There are frequently material differences between back tested performance results and actual results subsequently achieved by any investment strategy.
Constituents of MSCI equity indexes are listed companies, which are included in or excluded from the indexes according to the application of the relevant index methodologies. Accordingly, constituents in MSCI equity indexes may include MSCI Inc., clients of MSCI or suppliers to MSCI. Inclusion of a security within an MSCI index is not a recommendation by MSCI to buy, sell, or hold such security, nor is it considered to be investment advice.
Data and information produced by various affiliates of MSCI Inc., including MSCI ESG Research LLC and Barra LLC, may be used in calculating certain MSCI indexes. More information can be found in the relevant index methodologies on www.msci.com.
MSCI receives compensation in connection with licensing its indexes to third parties. MSCI Inc.’s revenue includes fees based on assets in Index Linked Investments. Information can be found in MSCI Inc.’s company filings on the Investor Relations section of www.msci.com.
MSCI ESG Research LLC is a Registered Investment Adviser under the Investment Advisers Act of 1940 and a subsidiary of MSCI Inc. Except with respect to any applicable products or services from MSCI ESG Research, neither MSCI nor any of its products or services recommends, endorses, approves or otherwise expresses any opinion regarding any issuer, securities, financial products or instruments or trading strategies and MSCI’s products or services are not intended to constitute investment advice or a recommendation to make (or refrain from making) any kind of investment decision and may not be relied on as such. Issuers mentioned or included in any MSCI ESG Research materials may include MSCI Inc., clients of MSCI or suppliers to MSCI, and may also purchase research or other products or services from MSCI ESG Research. MSCI ESG Research materials, including materials utilized in any MSCI ESG Indexes or other products, have not been submitted to, nor received approval from, the United States Securities and Exchange Commission or any other regulatory body.
Any use of or access to products, services or information of MSCI requires a license from MSCI. MSCI, Barra, RiskMetrics, IPD, FEA, InvestorForce, and other MSCI brands and product names are the trademarks, service marks, or registered trademarks of MSCI or its subsidiaries in the United States and other jurisdictions. The Global Industry Classification Standard (GICS) was developed by and is the exclusive property of MSCI and Standard & Poor’s. “Global Industry Classification Standard (GICS)” is a service mark of MSCI and Standard & Poor’s.
NOTICE AND DISCLAIMER