Index Accountability 2014
20
Index Accountability 2014 Created by Accountability and Compliance staff of Region 17 Education Service Center
-
Upload
ann-hopkins -
Category
Documents
-
view
33 -
download
1
description
Index Accountability 2014. Created by Accountability and Compliance staff of Region 17 Education Service Center. Student Achievement Index I. Performance Index Framework. Accountability System. Student Progress Index 2. Postsecondary Readiness Index 4. To receive a - PowerPoint PPT Presentation
Transcript of Index Accountability 2014

Index Accountability 2014
Created by Accountability and Compliance staff of Region 17 Education Service Center

Performance Index Framework
2
To receive a Met Standard rating, all campuses and districts must meet the performance targets for all four indexes for which they have performance data in 2014.
Student Achievement
Index I
Student ProgressIndex 2
Closing Performance
GapsIndex 3
Postsecondary Readiness
Index 4
Accountability System

Benefits of an Index System
• Eliminates the “death by single cell” of all previous systems in Texas.
• Allows areas of strength to offset areas of that perhaps need improvement.
• Gives districts and campuses a comprehensive data system to improve instruction.

Drivers• All Accountability Systems have drivers that come
from legislation. (HB3 from the 82nd legislative session and HB5 from the 83rd legislative session.)– College Readiness is primary driver of this system.– Student growth is being used for first time in this
system– Level III (top end) performance of students who are
economically disadvantaged or have historically underperformed. This is also know as “Closing the Achievement Gap” in this system.

Index Targets for 2014
Index 1 Index 2 Index 3 Index 4
All 4
componentsSTAARonly
District 55 16 28 57 13
Campus:
Elementary
55
33 28 N/A 12
Middle School 28 27 N/A 13
High School/K-12 N/A 31 57 21
Districts and campuses must meet ALL index targets on which they are evaluated to receive a “Met Standard” rating.


Index 1: Student Achievement2014 Target: 55
7
Index 1: Student Achievement provides an overview of student performance based on satisfactory student achievement across all subjects for all students on BOTH general and alternative assessments.
• This index is purely pass or fail based on the passing standard (Phase-In 1 for 2014).• It takes all STAAR assessments and calculates by content area.• Here is an example.

Index Targets for 2014
State Index I Target
District and Campus Score
District 55
Campus:
Elementary
55Middle School
High School/K-12
Districts and campuses must meet ALL index targets on which they are evaluated to receive a “Met Standard” rating.

9
Index 2: Student Progress2014 Target: District Target is 16
Index 2: Student Progress focuses on actual student growth independent of overall achievement levels for each race/ethnicity student group, students served by special education, and English language learners.
• This index measures student progress over time in Reading and Math. • Points are given if students meets the STAAR Progress Measure based on how
much better they got from previous school year STAAR assessment. • One additional point is given if they exceed the growth expectation.• High Schools do not have this Index this school year.

Index Targets for 2014
State Targets for Index 2 District and Campus Index 2 Results
District 16
Campus:
Elementary 33
Middle School 28
High School/K-12 N/A N/A
Districts and campuses must meet ALL index targets on which they are evaluated to receive a “Met Standard” rating.

11
Index 3: Closing Performance Gaps2014 Target: District Target is 28
Index 3: Closing Performance Gaps emphasizes advanced academic achievement of the economically disadvantaged student group and the lowest performing race/ethnicity student groups at each campus and district. • This index measures each subject area’ economically disadvantaged students
and two lowest performing race/ethnicity groups from previous school year. • One point is given for each student who passes and an extra point is given for
each student who meets the Level III (the very top) passing standard.
Repeat for Math, Writing, Science and Social Studies

Index Targets for 2014
State Index 3 Targets
District and Campus Index 3 Results
District 28
Campus:
Elementary 33
Middle School 28
High School/K-12 31
Districts and campuses must meet ALL index targets on which they are evaluated to receive a “Met Standard” rating.

13
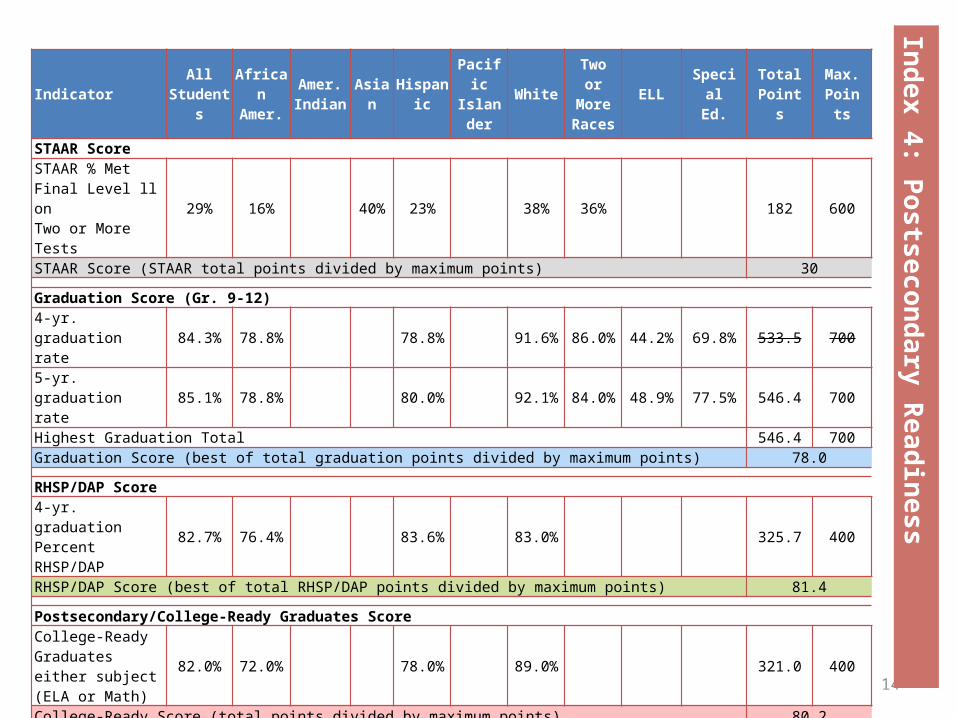
Index 4: Postsecondary ReadinessDistrict Target: 57Index 4: Postsecondary Readiness emphasizes the importance of earning a high school diploma that provides students with the foundation necessary for success in college, the workforce, job training programs, or the military; and the role of elementary and middle schools in preparing students for high school.
• Index 4 uses four different indicators that are 25% of the total score each. 1) STAAR Final Level II, 2) Graduation Score/Rate,3) Graduation Plan, and 4) College-Ready Graduates are not available for high schools or districts,
evaluate only the STAAR Final Level II performance at the following Index 4 targets:• High Schools/K-12: 21• Districts: 13
• Index 4 for Elementary and Middle School Campuses only use the STAAR Percent Met Final Level ll on two or more tests for (eight student groups) only.
14
Ind
ex 4
: Posts
econ
dary
Read
iness
Indicator All Students
African Amer.
Amer. Indian Asian Hispanic Pacific
Islander WhiteTwo or MoreRaces
ELL Special Ed.
Total Points
Max.Points
STAAR ScoreSTAAR % MetFinal Level ll onTwo or More Tests
29% 16% 40% 23% 38% 36% 182 600
STAAR Score (STAAR total points divided by maximum points) 30
Graduation Score (Gr. 9-12)4-yr. graduation rate 84.3% 78.8% 78.8% 91.6% 86.0% 44.2% 69.8% 533.5 700
5-yr. graduation rate 85.1% 78.8% 80.0% 92.1% 84.0% 48.9% 77.5% 546.4 700
Highest Graduation Total 546.4 700Graduation Score (best of total graduation points divided by maximum points) 78.0
RHSP/DAP Score4-yr. graduationPercent RHSP/DAP 82.7% 76.4% 83.6% 83.0% 325.7 400
RHSP/DAP Score (best of total RHSP/DAP points divided by maximum points) 81.4
Postsecondary/College-Ready Graduates ScoreCollege-Ready Graduates either subject (ELA or Math)
82.0% 72.0% 78.0% 89.0% 321.0 400
College-Ready Score (total points divided by maximum points) 80.2
Overall Index ScoreSTAAR Score 30.0
Multiplyby
Weight
Graduation Score 78.0RHSP/DAP Score 81.4College-Ready Score 80.2Index Score (sum of weighted index scores)

Index Targets for 2014Index 4 State Targets Index 4 District and Campus
Targets
All 4 components
STAARonly
All 4 components
STAARonly
District 57 N/A N/A
Campus:
Elementary N/A 12 N/A
Middle School N/A 13 N/A
High School/K-12 57 21
Districts and campuses must meet ALL index targets on which they are evaluated to receive a “Met Standard” rating.

2014 Distinction Designations
Per Texas Education Code (TEC) §39.201, alternative education campuses (AECs) evaluated under AEA provisions are not eligible for distinction designations.
Comparison Groups are determined by common campus demographics.

2014 Distinction Designations
• Student Progress (based on Index 2)• Closing Performance Gaps (based on Index 3)• Academic Achievement in:– Reading/English Language Arts– Mathematics– Science– Social Studies
• Postsecondary Readiness for campuses and districts

2014 Distinction DesignationsDistricts and Campuses Postsecondary Readiness:• House Bill 5 (83rd Texas Legislature, 2013) expanded distinction designations to both
districts and campuses for outstanding performance in attainment of postsecondary readiness.
• Index 4 STAAR Component: Percent of Students at Final Level II Performance Standard• Four-Year Graduation Rate (Class of 2013 longitudinal cohort) Recommended High
School Program or • Distinguished Achievement Program (RHSP/DAP) Rates (Class of 2013 longitudinal
cohort)• College-Ready Graduates (school year 2012-13 graduates meeting the Texas Success
Initiative (TSI) college readiness standards in both reading/ELA and mathematics based on TAKS, SAT, or ACT)
• Advanced/Dual Enrollment Course Completion Rate (school year 2012-13)• SAT/ACT Performance (At/Above Criterion, 2012-13)• SAT/ACT Participation (2012-13)• AP/IB Examination Performance: Any Subject (school year 2012-13percent of
examinees meeting the criterion score)


20
Dis
tinctio
n D
esig
natio
ns
Ind
ex 2
& In
dex 3


![Index [assets.cambridge.org]assets.cambridge.org/97805215/59577/index/9780521559577... · 2012-10-02 · Index Abramovitz, M. 193 accountability of service providers 148, 149 Activities](https://static.fdocuments.in/doc/165x107/5e42b6c64dcccd2b1455925c/index-2012-10-02-index-abramovitz-m-193-accountability-of-service-providers.jpg)


![Index [assets.cambridge.org]assets.cambridge.org/97805218/57567/index/9780521857567_index.pdforigin of, 126 as reform framework, 126 research evaluation of, 131, 132 accountability](https://static.fdocuments.in/doc/165x107/5fb5061c6ebb547236470d97/index-origin-of-126-as-reform-framework-126-research-evaluation-of-131-132.jpg)