Independent Variety Trials 2013 - AHDB Potatoes · other than by reproduction in an unmodified form...
50
The Potato Council is a division of the Agriculture and Horticulture Development Board. © Agriculture and Horticulture Development Board 2014 Research Project Report Independent Variety Trials 2013 Ref: R447 Reporting Period: April 2013-March 2014 Report Authors: H Campbell, J Kerr, J Pickup (SASA), D Kiezebrink, S Wale (SRUC), A Roberts, M Kirkwood, I Nevison (BioSS), A Lees (JHI) Report No. 2014/6
Transcript of Independent Variety Trials 2013 - AHDB Potatoes · other than by reproduction in an unmodified form...

The Potato Council is a division of the Agriculture and Horticulture Development Board.
© Agriculture and Horticulture Development Board 2014
Research Project Report
Independent Variety Trials 2013
Ref: R447
Reporting Period: April 2013-March 2014
Report Authors: H Campbell, J Kerr, J Pickup (SASA), D Kiezebrink, S Wale (SRUC),
A Roberts, M Kirkwood, I Nevison (BioSS), A Lees (JHI)
Report No. 2014/6

© Agriculture and Horticulture Development Board 2014
2
Additional copies of this report and a list of other publications can be obtained from: Publications Potato Council Agriculture & Horticulture Development Board Stoneleigh Park Kenilworth Warwickshire CV8 2TL
Tel: 02476 692051 Fax: 02476 478902 E-mail: [email protected]
Our reports, and lists of publications, are also available at www.potato.org.uk
While the Agriculture and Horticulture Development Board, operating through its Potato Council division, seeks to ensure that the information contained within this document is accurate at the time of printing, no warranty is given in respect thereof and, to the maximum extent permitted by law the Agriculture and Horticulture Development Board accepts no liability for loss, damage or injury howsoever caused (including that caused by negligence) or suffered directly or indirectly in relation to information and opinions contained in or omitted from this document. Copyright, Agriculture and Horticulture Development Board 2014. No part of this publication may be reproduced in any material form (including by photocopy or storage in any medium by electronic means) or any copy or adaptation stored, published or distributed (by physical, electronic or other means) without the prior permission in writing of the Agriculture and Horticulture Development Board, other than by reproduction in an unmodified form for the sole purpose of use as an information resource when the Agriculture and Horticulture Development Board is clearly acknowledged as the source, or in accordance with the provisions of the Copyright, Designs and Patents Act 1988. All rights reserved.
is a registered trademark of the Agriculture and Horticulture Development Board.
is a registered trademark of the Agriculture and Horticulture Development Board, for use by its Potato Council division. All other trademarks, logos and brand names contained in this publication are the trademarks of their respective holders. No rights are granted without the prior written permission of the relevant owners.

© Agriculture and Horticulture Development Board 2014
3
CONTENTS
1. SUMMARY ............................................................................................ 4
2. INTRODUCTION ................................................................................... 11
3. MATERIALS AND METHODS .................................................................. 11
4. RESULTS ........................................................................................... 17
5. DISCUSSION ....................................................................................... 33
6. REFERENCES ..................................................................................... 37
7. APPENDICES ...................................................................................... 38
7.1. Statistical analysis of 2013 Rhizoctonia data and combined 2012/13 data ...... 38 7.2. Statistical Analysis of 2013 Dickeya experiment .............................................. 48

© Agriculture and Horticulture Development Board 2014
4
1. SUMMARY
In order to comply with both national and European Community legislation for the marketing of seed potatoes, all potato varieties must be placed on the official National List (NL) of a Member State. When this is achieved, a variety is automatically entered onto the Common Catalogue which is, in effect, an EC National List. Part of the NL testing involves assessing a new variety for Value for Cultivation and Use (VCU). In the UK, this testing is largely concentrated on assessing varietal performance for susceptibility to diseases, pests and some tuber quality characteristics considered to be of most importance in UK potato production. After a review of the Independent Variety Trials (IVT) programme, industry, through the Potato Council (PCL), concluded that additional tests for some other diseases were also desirable in order to provide growers with the fullest information on the performance of new varieties before large scale production occurred. In addition, industry also concluded that potato varieties on the Common Catalogue which were being developed for GB production should also be tested to provide independent data on these varieties for GB growers. It was also decided that IVT tests would be conducted over 2 years and not 3 years as previously, and that industry alone would be responsible for conducting field growing trials to assess varietal performance with respect to yield and usage quality. The integration of the IVT test programme with that of the UK National List VCU test programme was achieved in 2005 by the consortium of Scottish Agricultural Science Agency (now Science and Advice for Scottish Agriculture, SASA), SAC Commercial Ltd (SAC) (now Scotland’s Rural College (SRUC), Biomathematics & Statistics Scotland (BioSS) and Scottish Crop Research Institute (SCRI) (now James Hutton Institute (JHI)) which was awarded a 3-year contract to conduct the IVT programme. The tests conducted for IVT purposes were to determine varietal susceptibility to foliage late blight in the field, black dot, black scurf, silver scurf and skin spot. This contract was extended for a further 3 years starting 2008 and again for a further 3 years starting in 2011. An additional test to determine susceptibility to potato mop top virus (spraing) was included in the programme from 2011. As part of the programme, SASA have evaluated Common Catalogue varieties entered for IVT for all NL characters, except potato viruses (Yo, YN, A and leafroll) and the laboratory test for foliar late blight In 2012, the black scurf test was discontinued due to a high level of variability in the test data, resulting in inconsistent resistance ratings for this pathogen. In 2012, an evaluation of a possible Rhizoctonia stem canker test was carried out. Further development of this test was continued in 2013. Work Undertaken and Findings In 2013, tests were conducted on 8 varieties undergoing their 2nd year of UK NL testing, 7 varieties which had completed UK NL tests and 13 Common Catalogue varieties (Table 2). SASA conducted a test to determine susceptibility to foliage late blight at a site near Ayr which is operated in conjunction with JHI. Pot tests for silver scurf and skin spot were conducted by SASA. A pot test for black dot and a field trial for potato mop top virus (spraing) were conducted by SRUC. A trial to assess varietal resistance to Rhizoctonia stem canker was carried out by SRUC. The Common Catalogue varieties were also tested by SASA for susceptibility to tuber late blight, common scab, powdery scab, blackleg (Pectobacterium atrosepticum), dry rot (Fusarium sulphureum and F. solani var. coeruleum), potato cyst nematodes

© Agriculture and Horticulture Development Board 2014
5
(pathotypes of Globodera rostochiensis and G. pallida), external damage (splitting) and internal damage (bruising). All tests were completed satisfactorily, except common scab, where results for 2013 were not published due to a lack of discrimination between varieties.
The NL test for common scab consists of a pot test at SASA and a field trial at the National Institute for Agricultural Botany (NIAB), which is the other UK NL test centre. The pot test for common scab has generally produced good symptoms over the years and reference varieties have performed consistently. Common Catalogue varieties are only tested at SASA. There are usually more common scab symptoms observed in the pot trial than the field trial. In 2013 the reference variety Maris Piper performed as expected, but all other reference varieties had lower levels of common scab recorded than in 2012. The candidate varieties in the second year of testing also had less common scab recorded than in 2012. The reference variety Desiree which usually has clearly defined common scab lesions had low levels of common scab and a high proportion of elephant hide symptoms which is caused by Rhizoctonia solani. Testing of Desiree tubers confirmed the presence of R. solani and competition from this may have affected the common scab levels. Each year a common scab isolate screening test is conducted using the susceptible reference variety Maris Piper in a polytunnel alongside the NL trial. Two isolates were used in the 2013 NL trial, and one of these isolates produced a lower number of symptoms than expected in the isolate screening trial in 2013. The low level of common scab symptoms in the 2013 NL test is possibly due to the isolates used in the trial. Susceptibility/resistance was rated on a 1-9 scale. Tables 1a and 1b summarise the results for varieties being tested in 2013. Table 1a presents the final ratings for varieties completing the test programme. For varieties in the 1st year of the IVT programme, Table 1b presents provisional ratings shown in italic font for one year’s test results and final ratings from NL tests in bold.
© Agriculture and Horticulture Development Board 2014
6
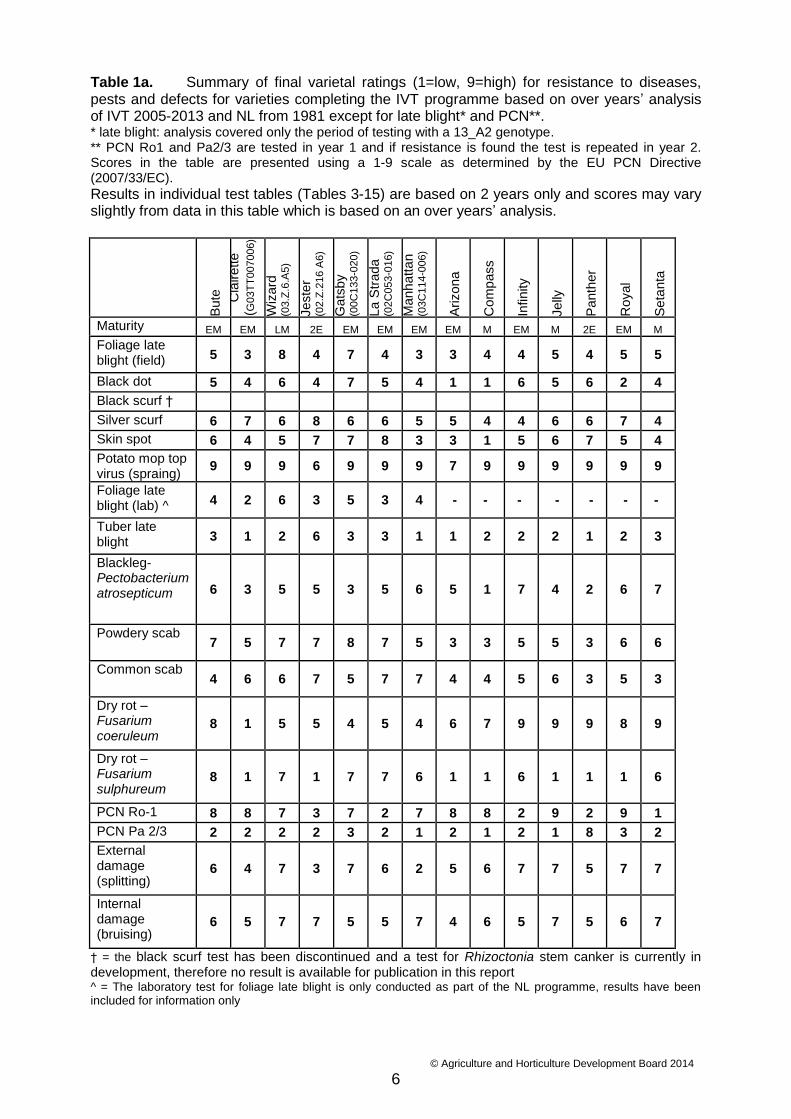
Table 1a. Summary of final varietal ratings (1=low, 9=high) for resistance to diseases, pests and defects for varieties completing the IVT programme based on over years’ analysis of IVT 2005-2013 and NL from 1981 except for late blight* and PCN**. * late blight: analysis covered only the period of testing with a 13_A2 genotype. ** PCN Ro1 and Pa2/3 are tested in year 1 and if resistance is found the test is repeated in year 2. Scores in the table are presented using a 1-9 scale as determined by the EU PCN Directive (2007/33/EC).
Results in individual test tables (Tables 3-15) are based on 2 years only and scores may vary slightly from data in this table which is based on an over years’ analysis.
Bute
Cla
irette
(G03T
T0
07006)
Wiz
ard
(0
3.Z
.6.A
5)
Jeste
r (0
2.Z
.216 A
6)
Gats
by
(00C
133-0
20)
La S
trada
(0
2C
053-0
16)
Manh
atta
n
(03C
114-0
06)
Arizon
a
Com
pass
Infinity
Jelly
Panth
er
Royal
Seta
nta
Maturity EM EM LM 2E EM EM EM EM M EM M 2E EM M
Foliage late blight (field) 5 3 8 4 7 4 3 3 4 4 5 4 5 5
Black dot 5 4 6 4 7 5 4 1 1 6 5 6 2 4
Black scurf †
Silver scurf 6 7 6 8 6 6 5 5 4 4 6 6 7 4
Skin spot 6 4 5 7 7 8 3 3 1 5 6 7 5 4
Potato mop top virus (spraing)
9 9 9 6 9 9 9 7 9 9 9 9 9 9
Foliage late blight (lab) ^ 4 2 6 3 5 3 4 - - - - - - -
Tuber late blight 3 1 2 6 3 3 1 1 2 2 2 1 2 3
Blackleg- Pectobacterium atrosepticum 6 3 5 5 3 5 6 5 1 7 4 2 6 7
Powdery scab 7 5 7 7 8 7 5 3 3 5 5 3 6 6
Common scab 4 6 6 7 5 7 7 4 4 5 6 3 5 3
Dry rot – Fusarium coeruleum
8 1 5 5 4 5 4 6 7 9 9 9 8 9
Dry rot – Fusarium sulphureum
8 1 7 1 7 7 6 1 1 6 1 1 1 6
PCN Ro-1 8 8 7 3 7 2 7 8 8 2 9 2 9 1
PCN Pa 2/3 2 2 2 2 3 2 1 2 1 2 1 8 3 2
External damage (splitting)
6 4 7 3 7 6 2 5 6 7 7 5 7 7
Internal damage (bruising)
6 5 7 7 5 5 7 4 6 5 7 5 6 7
† = the black scurf test has been discontinued and a test for Rhizoctonia stem canker is currently in development, therefore no result is available for publication in this report ^ = The laboratory test for foliage late blight is only conducted as part of the NL programme, results have been included for information only
© Agriculture and Horticulture Development Board 2014
7
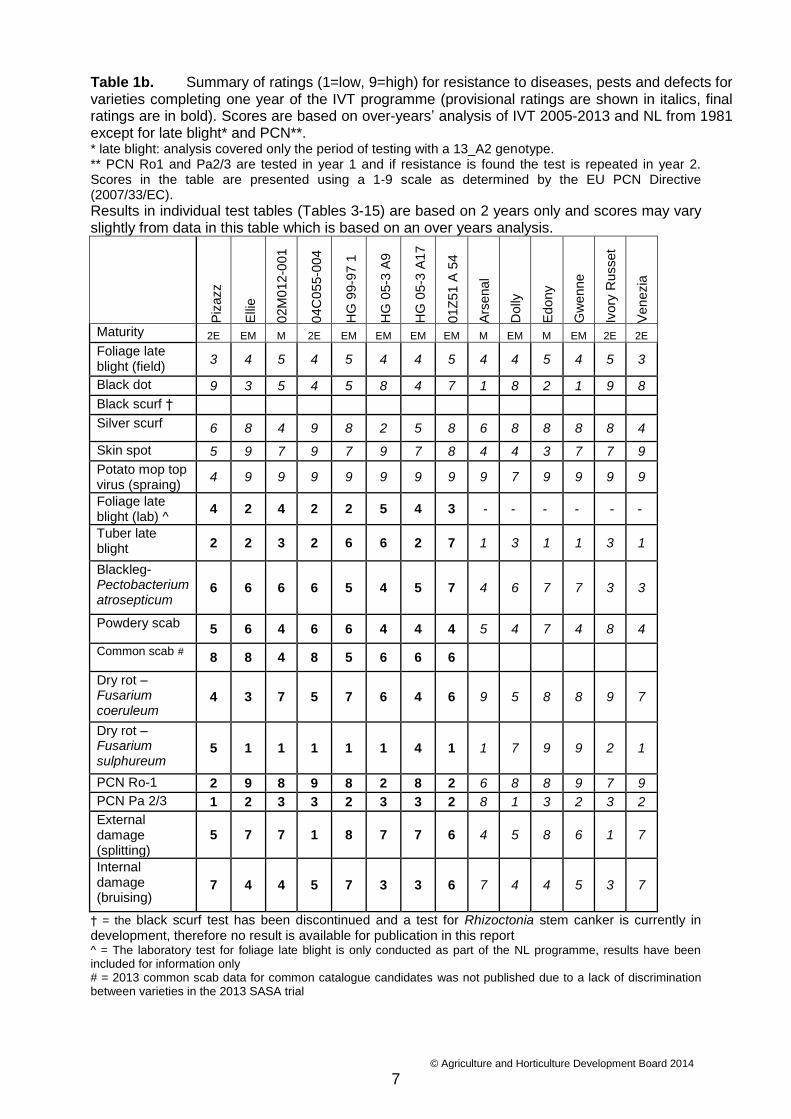
Table 1b. Summary of ratings (1=low, 9=high) for resistance to diseases, pests and defects for varieties completing one year of the IVT programme (provisional ratings are shown in italics, final ratings are in bold). Scores are based on over-years’ analysis of IVT 2005-2013 and NL from 1981 except for late blight* and PCN**. * late blight: analysis covered only the period of testing with a 13_A2 genotype. ** PCN Ro1 and Pa2/3 are tested in year 1 and if resistance is found the test is repeated in year 2. Scores in the table are presented using a 1-9 scale as determined by the EU PCN Directive (2007/33/EC).
Results in individual test tables (Tables 3-15) are based on 2 years only and scores may vary slightly from data in this table which is based on an over years analysis.
Piz
azz
Elli
e
02M
012-0
01
04C
055-0
04
HG
99-9
7 1
HG
05-3
A9
HG
05-3
A17
01Z
51 A
54
Ars
ena
l
Dolly
Edo
ny
Gw
enne
Ivory
Russet
Ven
ezia
Maturity 2E EM M 2E EM EM EM EM M EM M EM 2E 2E
Foliage late blight (field)
3 4 5 4 5 4 4 5 4 4 5 4 5 3
Black dot 9 3 5 4 5 8 4 7 1 8 2 1 9 8
Black scurf †
Silver scurf 6 8 4 9 8 2 5 8 6 8 8 8 8 4
Skin spot 5 9 7 9 7 9 7 8 4 4 3 7 7 9
Potato mop top virus (spraing)
4 9 9 9 9 9 9 9 9 7 9 9 9 9
Foliage late blight (lab) ^
4 2 4 2 2 5 4 3 - - - - - -
Tuber late blight 2 2 3 2 6 6 2 7 1 3 1 1 3 1
Blackleg- Pectobacterium atrosepticum
6 6 6 6 5 4 5 7 4 6 7 7 3 3
Powdery scab 5 6 4 6 6 4 4 4 5 4 7 4 8 4
Common scab # 8 8 4 8 5 6 6 6
Dry rot – Fusarium coeruleum
4 3 7 5 7 6 4 6 9 5 8 8 9 7
Dry rot – Fusarium sulphureum
5 1 1 1 1 1 4 1 1 7 9 9 2 1
PCN Ro-1 2 9 8 9 8 2 8 2 6 8 8 9 7 9
PCN Pa 2/3 1 2 3 3 2 3 3 2 8 1 3 2 3 2
External damage (splitting)
5 7 7 1 8 7 7 6 4 5 8 6 1 7
Internal damage (bruising)
7 4 4 5 7 3 3 6 7 4 4 5 3 7
† = the black scurf test has been discontinued and a test for Rhizoctonia stem canker is currently in development, therefore no result is available for publication in this report ^ = The laboratory test for foliage late blight is only conducted as part of the NL programme, results have been included for information only # = 2013 common scab data for common catalogue candidates was not published due to a lack of discrimination between varieties in the 2013 SASA trial

© Agriculture and Horticulture Development Board 2014
8
Conclusions In summary, the main findings (Resistant = 7 or more; Susceptible = 3 or less*) for the test varieties, with final ratings in bold were as follows: *For PCN Ro1 (Resistant = 8 or more; Susceptible = 3 or less) For PCN Pa 2/3 and 1 (Resistant = 8 or more; Susceptible = 2 or less) Bute Resistant to: potato mop top virus (spraing), powdery scab, dry rot – F. coeruleum and F. sulphureum and PCN Ro1 Susceptible to: tuber late blight and PCN Pa 2/3 and 1 Clairette (G03TT007006) Resistant to: silver scurf, potato mop top virus (spraing) and PCN Ro1 Susceptible to: foliage late blight, tuber late blight, blackleg, dry rot – F. coeruleum and F. sulphureum and PCN Pa 2/3 and 1 Wizard (03.Z.6.A5) Resistant to: foliage late blight, potato mop top virus (spraing), powdery scab, dry rot – F. sulphureum, and external and internal damage Susceptible to: tuber late blight and PCN Pa 2/3 and 1 Jester (02.Z.216 A6) Resistant to: silver scurf, skin spot, powdery scab, common scab and internal damage Susceptible to: dry rot – F. sulphureum, PCN Ro1 and PCN Pa 2/3 and 1, and external damage Gatsby (00C133-020) Resistant to: foliage late blight, black dot, skin spot, potato mop top virus (spraing), powdery scab, dry rot – F. sulphureum, and external damage Susceptible to: tuber late blight and blackleg La Strada (02C053-016) Resistant to: skin spot, potato mop top virus (spraing), powdery scab, common scab and dry rot – F. sulphureum Susceptible to: tuber late blight, PCN Ro1 and PCN Pa 2/3 and 1 Manhattan (03C114-006) Resistant to: potato mop top virus (spraing), common scab, and internal damage Susceptible to: foliage late blight, skin spot, tuber late blight, PCN Pa 2/3 and 1 and external damage Arizona Resistant to: potato mop top virus (spraing) and PCN Ro1 Susceptible to: foliage late blight, black dot, skin spot, tuber late blight, powdery scab, dry rot – F. sulphureum and PCN Pa 2/3 and 1 Compass Resistant to: potato mop top virus (spraing), dry rot – F. coeruleum and PCN Ro1 Susceptible to: black dot, skin spot, tuber late blight, blackleg, powdery scab, dry rot – F. sulphureum and PCN Pa 2/3 and 1

© Agriculture and Horticulture Development Board 2014
9
Infinity Resistant to: potato mop top virus (spraing), blackleg, dry rot – F. coeruleum and external damage Susceptible to: tuber late blight, PCN Ro1 and PCN Pa 2/3 and 1 Jelly Resistant to: potato mop top virus (spraing), dry rot – F. coeruleum, PCN Ro1 and external and internal damage Susceptible to: tuber late blight, dry rot – F. sulphureum and PCN Pa 2/3 and 1 Panther Resistant to: skin spot, potato mop top virus (spraing), dry rot – F. coeruleum and PCN Pa 2/3 and 1 Susceptible to: tuber late blight, blackleg, powdery scab, common scab, dry rot – F. sulphureum and PCN Ro1 Royal Resistant to: silver scurf, potato mop top virus (spraing), dry rot – F. coeruleum, PCN Ro1 and external damage Susceptible to: black dot, tuber late blight and dry rot – F. sulphureum Setanta Resistant to: potato mop top virus (spraing), blackleg, dry rot – F. coeruleum and external and internal damage Susceptible to: tuber late blight, common scab, PCN Ro1 and PCN Pa 2/3 and 1 Pizazz Resistant to: black dot, common scab, and internal damage Susceptible to: foliage late blight, tuber late blight, PCN Ro1 and PCN Pa 2/3 and 1 Ellie Resistant to: silver scurf, skin spot, potato mop top virus (spraing), common scab, PCN Ro1 and external damage Susceptible to: black dot, tuber late blight, dry rot – F. coeruleum and F. sulphureum and PCN Pa 2/3 and 1 02M012-001 Resistant to: skin spot, potato mop top virus (spraing), dry rot – F. coeruleum, PCN Ro1 and external damage Susceptible to: tuber late blight and dry rot – F. sulphureum 04C055-004 Resistant to: silver scurf, skin spot, potato mop top virus (spraing), common scab and PCN Ro1 Susceptible to: tuber late blight, dry rot – F. sulphureum and external damage HG 99-97 1 Resistant to: silver scurf, skin spot, potato mop top virus (spraing), dry rot – F. coeruleum, PCN Ro1 and external and internal damage Susceptible to: dry rot – F. sulphureum and PCN Pa 2/3 and 1

© Agriculture and Horticulture Development Board 2014
10
HG 05-3 A9 Resistant to: black dot, skin spot, potato mop top virus (spraing) and external damage Susceptible to: silver scurf, dry rot – F. sulphureum, PCN Ro1 and internal damage HG 05-3 A17 Resistant to: skin spot, potato mop top virus (spraing), PCN Ro1 and external damage Susceptible to: tuber late blight and internal damage 01Z51 A 54 Resistant to: black dot, silver scurf, skin spot, potato mop top virus (spraing), tuber late blight, and blackleg Susceptible to: dry rot – F. sulphureum, PCN Ro1 and PCN Pa 2/3 and 1 Arsenal Resistant to: potato mop top virus (spraing), dry rot – F. coeruleum, PCN Pa 2/3 and 1 and internal damage Susceptible to: black dot, tuber late blight and dry rot – F. sulphureum Dolly Resistant to: black dot, silver scurf, potato mop top virus (spraing) and dry rot – F. sulphureum and PCN Ro1 Susceptible to: tuber late blight and PCN Pa 2/3 and 1 Edony Resistant to: silver scurf, potato mop top virus (spraing), blackleg, powdery scab, dry rot – F. coeruleum and F. sulphureum, PCN Ro1 and external damage Susceptible to: black dot, skin spot and tuber late blight Gwenne Resistant to: silver scurf, skin spot, potato mop top virus (spraing), blackleg, dry rot – F. coeruleum and F. sulphureum and PCN Ro1 Susceptible to: black dot, tuber late blight and PCN Pa 2/3 and 1 Ivory Russet Resistant to: black dot, silver scurf, skin spot, potato mop top virus (spraing), powdery scab and dry rot – F. coeruleum Susceptible to: tuber late blight, blackleg, dry rot – F. sulphureum, and external and internal damage Venezia Resistant to: black dot, skin spot, potato mop top virus (spraing), dry rot – F. coeruleum, PCN Ro1, and external and internal damage Susceptible to: foliage late blight, tuber late blight, blackleg, dry rot – F. sulphureum and PCN Pa 2/3 and 1

© Agriculture and Horticulture Development Board 2014
11
2. INTRODUCTION
A review of the UK National List programme was concluded in 2004 and the various varietal characteristics were prioritised according to national importance and to industry. In consultation with industry stakeholders, it was also agreed that closer co-operation with IVT funded by PCL would be advantageous in minimising duplication of testing and in ensuring that the decision making process for the official listing of new varieties could utilise all available, good quality independent data such as that generated in IVT tests. For National List purposes, the diseases and pests prioritised as being of national importance were foliage late blight, tuber late blight, blackleg (Pectobacterium atrosepticum syn. Erwinia carotovora var. atroseptica) and potato cyst nematode (Globodera rostochiensis pathotype Ro1). The characters agreed as being of less significance nationally but important to industry were powdery scab, common scab, dry rot - Fusarium solani var. coeruleum, dry rot - F. sulphureum, potato virus Yo*, potato leafroll virus*, potato cyst nematode (Globodera pallida pathotypes Pa2/3 and Pa1), external damage (splitting) and internal damage (bruising). In addition, unreplicated assessments of tuber yield, and external and internal tuber defects were to be made in order to comply with the requirements of the EU Directive 72/180/EEC and 02/8/EC. The consultation also agreed that varieties entered for IVT testing could be incorporated into NL tests. * It was agreed to extend the NL programme from 2009 onwards to test for two additional potato viruses, these were virus A and virus YN. In 2005, a 3-year contract to conduct a revised IVT programme was awarded to a consortium of SASA, SRUC, BioSS and JHI. The tests to be conducted for IVT purposes were foliage late blight in the field (SASA), black scurf (SRUC), black dot (SRUC), silver scurf (SASA) and skin spot (SASA). From 2011, an additional test was included in the programme: this was potato mop top virus (spraing) (SRUC). SASA have tested Common Catalogue varieties entered for IVT for all NL characters, except potato viruses (Yo, YN, A and leafroll) and the laboratory test for foliar late blight. Tests were to be conducted over 2 years instead of 3 years. In 2012, the black scurf test was discontinued due to a high level of variability in the test data, resulting in inconsistent resistance ratings for this pathogen. In 2012 an evaluation of a possible Rhizoctonia stem canker test was carried out, testing was continued in 2013. This report summarises all the testing conducted over the 2012-2013 season.
3. MATERIALS AND METHODS
3.1 Standard Varieties
The standard varieties used in 2012 were reviewed and retained in 2013. The varieties used in each test are listed below with, in brackets, their foliage maturity and the susceptibility rating as published in NIAB Pocket Guide to Varieties of Potatoes, 2006: Foliage late blight: Home Guard [1E, 2], Bintje [M, 2], Russet Burbank [M, 3],
Valor [M, 6], Cara [M, 6], Sarpo Mira [M, 7]

© Agriculture and Horticulture Development Board 2014
12
Black dot: Lady Christl [1E, 2], Pentland Squire [M,3], Fianna [M,5], Cara [M,6], Saxon [2E,7]
Silver scurf: Lady Christl [1E, 2], Pentland Squire [M, 3], Romano [2E,
4], Fianna [M, 5], Saxon [2E, 5], Cara [M, 7] Skin spot: Pentland Squire [M, 2], King Edward [M, 3], Sante [M, 3],
Saxon [2E, 6], Romano [2E, 7], Fianna [M, 8] Potato mop top: Cara [M, 3], Nicola [M, 4], Valor [M, 6], Saturna [M, 7], virus (spraing) Maris Piper [M, 5]
Rhizoctonia: Sante [M], Duke of York [1E], Saxon [2E], King Edward [M], Cara [M], Lady Christl [1E]
As this was an evaluation of a potentially new assay no ratings are available but the varieties used previously as standards for the black scurf test were retained with the exception of Blue Danube.
3.2 Varieties in Trial In line with the policy established by PCL, for the varieties submitted for UK National List Trials, only those varieties entering the 2nd year of testing or those that had completed NL testing were considered for entry to the IVT programme. In addition, 6 new Common Catalogue varieties were identified for inclusion in the test programme. The varieties tested are listed in Table 2. As a plant health precaution to prevent the introduction of non-indigenous bacterial pathogens, all seed potatoes from non-Scottish sources were tested for brown rot (Ralstonia solanacearum), ring rot (Clavibacter michiganensis subsp. sepodonicus) and Dickeya spp. bacteria.

© Agriculture and Horticulture Development Board 2014
13
Table 2. Varieties in IVT in 2013
UK National List
stage of test in 2013
AFP Variety Breeder/Agent Maturity NL IVT
4/782 Bute Zella Doig E. Maincrop completed 2
4/783 G03TT007006 (Clairette) Germicopa SAS/Branston E. Maincrop completed 2
4/784 Wizard (03.Z.6.A5) JHI/MRS Ltd (Geenvale)
L. Maincrop completed 2
4/785 Jester (02.Z.216 A6) JHI/MRS Ltd (Geenvale) 2nd Early completed 2
4/786 Gatsby (00C133-020)
Cygnet PB Ltd E.
Maincrop completed 2
4/787 La Strada (02C053-016)
Cygnet PB Ltd E.
Maincrop completed 2
4/788 Manhattan (03C114-006) Cygnet PB Ltd
E. Maincrop completed 2
4/789 Pizzaz (14RE09)
Caithness Varieties Ltd 2E 2 1
4/791 Ellie (G04TT107001) Germicopa SAS/ Branston EM 2 1
4/793 02M012-001 Cygnet PB Ltd M 2 1
4/795 04C055-004 Cygnet PB Ltd 2E 2 1
4/796 HG 99-97 1 Higgins Agriculture EM 2 1
4/797 HG 05-3 A9 Higgins Agriculture EM 2 1
4/798 HG 05-3 A17 Higgins Agriculture EM 2 1
4/800 01Z51 A 54
JHI/McCain Food (GB) Ltd M 2 1
Common Catalogue
stage of test in 2013
AFP Variety Breeder/Agent Maturity NL IVT
Arizona Agrico 2E/M 2 2
Compass HZPC M 2 2
Infinity IPM Ltd EM 2 2
Jelly Europlant/Karmark (Greenvale) M 2 2
Panther HZPC 2E 2 2
Royal McCain EM 2 2
Setanta IPM Ltd M 2 2
Arsenal Agrico M 1 1
Dolly Germicopa UK EM 1 1
Edony Germicopa UK M 1 1
Gwenne Germicopa UK EM 1 1
Ivory Russet HZPC EM 1 1
Venezia Europlant/Karmack (Greenvale) 2E 1 1
© Agriculture and Horticulture Development Board 2014
14
IVT Test Methods
The test methods used were those agreed and set out in the standard protocols prepared for the 2013 programme. Details are provided below: Foliage late blight in the field, 2013 The test tubers were planted in plots of 2 tubers at Dalrymple, Ayr. The 1st early and 2nd early/maincrop experiments were planted on 4 June. The layout was a randomised block design with 4 replications, each of 2 tubers. Plants of King Edward, in small pots, infected by a complex isolate (1.2.3.4.5.6.7.10.11) of P. infestans were laid out along the adjacent rows of King Edward on 25 July. On 1, 5, 7, 9, 13, 16, 19, and 23 August, the % foliage affected by late blight was assessed using the diagrammatic key of Cruickshank et al. (1982). The % Area Under the Disease Progress Curve (AUDPC) was calculated according to the formulae of Fry (1978), after applying the angular transformation to the percentage values on each date. Skin spot, 2013 Test tubers were dipped for 0.5 min in a suspension of spores and mycelia (Carnegie & Cameron, 1983) and planted in pots containing a 1:1 mix of Bulrush compost and John Innes No 2 compost on 17 May. Pots were placed outdoors in peat beds and watered by drip irrigation into each pot. The layout was randomised block with 6 replications. The haulm was killed by applying diquat dibromide on 31 August at half the manufacturer’s recommended rate. The tubers were harvested into separate plastic boxes on 24 October 2013 and then stored at 5-8oC until the last week in March 2014. The % surface area affected by skin spot was recorded in 5 categories and a surface infection index calculated (Boyd, 1957). Silver scurf, 2013 Petri dishes containing 2% malt extract agar were inoculated using two isolates of silver scurf which were grown for a minimum of 14 days, then macerated in sterile distilled water. The suspension was added to Bulrush compost at a rate of 1L of suspension per 42L of soil and mixed in a small cement mixer. The test tubers were planted in pots containing the infested soil and placed in a polytunnel on 29 May and watered by drip irrigation into each pot. The layout was a randomised block design with 6 replications. Haulms were allowed to senesce naturally. Tubers were harvested on 25 October 2013 into separate plastic boxes and washed so visible symptoms could be observed, the tubers were then stored at 12-15oC and high humidity until silver scurf lesions had developed sufficiently on the susceptible standard varieties. In mid-February 2014, the % surface area affected by silver scurf on each tuber was assessed using 6 categories. A mean silver scurf index was calculated for each plot by multiplying the number of tubers in each category by the mid-point value and dividing the sum of these values by the total number of tubers assessed. Black dot, 2013 Three isolates of Colletotrichum coccodes were cultured in Petri dishes on PDA agar. When the colonies had reached the edge of the dishes, the cultures were macerated using a liquidiser. The suspension was added to Bulrush compost at the rate of 1 Petri dish of C. coccodes per 8 kg compost in a cement mixer and mixed for 10 minutes. Test tubers were planted on 7 May in 25 cm diameter pots filled with amended compost which were set in individual watering saucers and then placed in a polytunnel in a randomised block design with 6 replications. Pots were watered every 2 days so
© Agriculture and Horticulture Development Board 2014
15
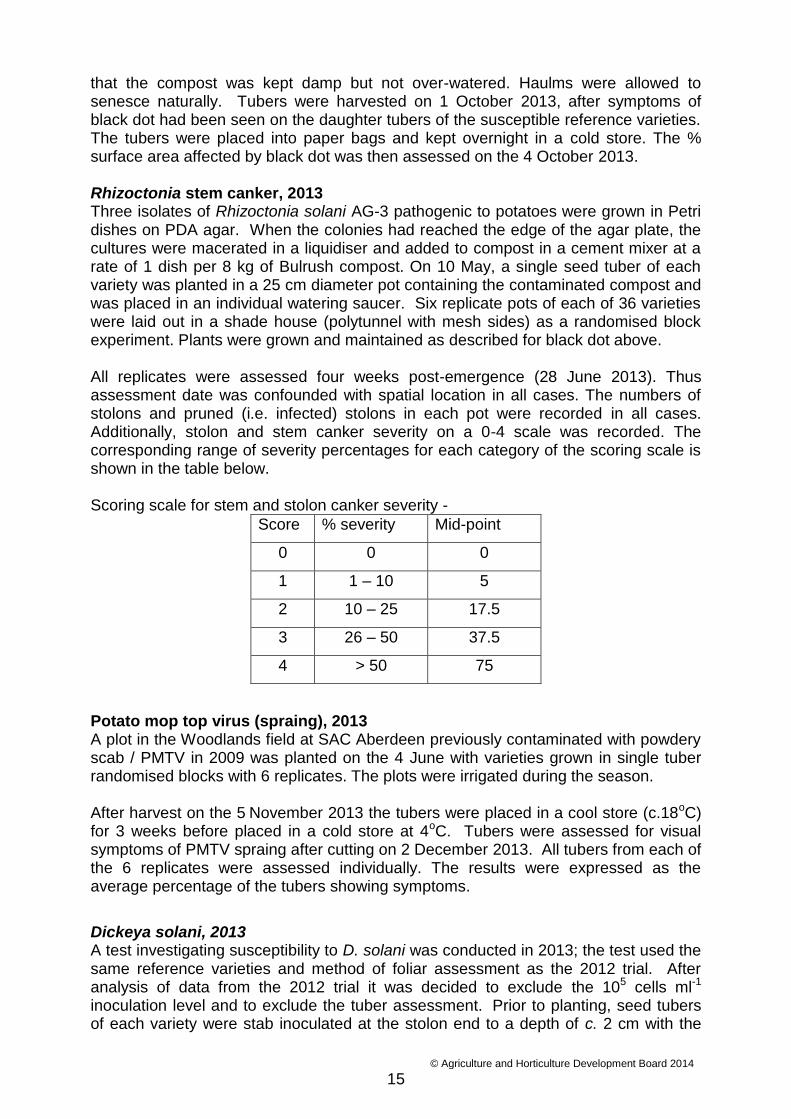
that the compost was kept damp but not over-watered. Haulms were allowed to senesce naturally. Tubers were harvested on 1 October 2013, after symptoms of black dot had been seen on the daughter tubers of the susceptible reference varieties. The tubers were placed into paper bags and kept overnight in a cold store. The % surface area affected by black dot was then assessed on the 4 October 2013. Rhizoctonia stem canker, 2013 Three isolates of Rhizoctonia solani AG-3 pathogenic to potatoes were grown in Petri dishes on PDA agar. When the colonies had reached the edge of the agar plate, the cultures were macerated in a liquidiser and added to compost in a cement mixer at a rate of 1 dish per 8 kg of Bulrush compost. On 10 May, a single seed tuber of each variety was planted in a 25 cm diameter pot containing the contaminated compost and was placed in an individual watering saucer. Six replicate pots of each of 36 varieties were laid out in a shade house (polytunnel with mesh sides) as a randomised block experiment. Plants were grown and maintained as described for black dot above. All replicates were assessed four weeks post-emergence (28 June 2013). Thus assessment date was confounded with spatial location in all cases. The numbers of stolons and pruned (i.e. infected) stolons in each pot were recorded in all cases. Additionally, stolon and stem canker severity on a 0-4 scale was recorded. The corresponding range of severity percentages for each category of the scoring scale is shown in the table below. Scoring scale for stem and stolon canker severity -
Score % severity Mid-point
0 0 0
1 1 – 10 5
2 10 – 25 17.5
3 26 – 50 37.5
4 > 50 75
Potato mop top virus (spraing), 2013 A plot in the Woodlands field at SAC Aberdeen previously contaminated with powdery scab / PMTV in 2009 was planted on the 4 June with varieties grown in single tuber randomised blocks with 6 replicates. The plots were irrigated during the season. After harvest on the 5 November 2013 the tubers were placed in a cool store (c.18oC) for 3 weeks before placed in a cold store at 4oC. Tubers were assessed for visual symptoms of PMTV spraing after cutting on 2 December 2013. All tubers from each of the 6 replicates were assessed individually. The results were expressed as the average percentage of the tubers showing symptoms.
Dickeya solani, 2013 A test investigating susceptibility to D. solani was conducted in 2013; the test used the same reference varieties and method of foliar assessment as the 2012 trial. After analysis of data from the 2012 trial it was decided to exclude the 105 cells ml-1
inoculation level and to exclude the tuber assessment. Prior to planting, seed tubers of each variety were stab inoculated at the stolon end to a depth of c. 2 cm with the

© Agriculture and Horticulture Development Board 2014
16
eye of a darning needle containing c. 0.01-0.02 ml of a bacterial suspension of a mixture of isolates at 103 cells ml-1 or 107 cells ml-1. Tubers were planted on 23 May in 7.5L pots containing Bullrush compost in a polytunnel. Each plot consisted of 4 pots c. 5cm apart and laid out in a randomised block design with 3 replications. This gave a total trial size of 264 pots. Plants were watered by drip irrigation to maintain constantly wet conditions; the plants were allowed to senesce naturally. The polytunnel was kept warm in June and July to encourage disease development. The plants were examined weekly from 3 July for symptoms of blackleg and affected plants recorded using a 1-5 scale (see below). The last assessment was conducted on 8 August 2013. Foliar assessment scale -
1 Healthy 2 necrotic/chorotic 3 basal stem rot 4 blackleg/on its way out 5 dead
Top wilts were noted during assessments, but not used in the statistical analysis. NL Tests These were conducted on Common Catalogue varieties in accordance with the document “United Kingdom National List Trials: Trials Procedures for the Official Examination of value for Cultivation and Use (VCU) – Potato 2013”. The methods are summarised below: Tuber late blight: the rose-end of field-grown tubers is sprayed with the 13_A2 isolate of P. infestans. The number of tubers affected by late blight is counted after 10-14 days incubation. Common Scab: test tubers are planted in pots in artificially infested compost kept dry during tuber initiation. Severity of common scab is assessed on daughter tubers. Powdery scab: test tubers are planted in compost infected with scab peelings and kept wet during tuber initiation. Severity of powdery scab is assessed on daughter tubers. Blackleg: test tubers are inoculated at the heel end with Pectobacterium atrosepticum and planted in an irrigated field trial. Incidence of blackleg is assessed 3 times during the growing season. Dry rot (separate test for Fusarium solani var. coeruleum and F.sulphureum): test tubers are wounded and inoculated with a suspension of spores and incubated at 12-15oC. The degree of internal rotting is assessed. Potato Cyst Nematode (Globodera spp.): tubers are planted in pots in compost infected with a standard concentration of PCN eggs. Cyst multiplication on roots is assessed. Damage, external (splitting) and internal (bruising): a standard force is applied to the heel end of field grown tubers. Tubers for the splitting test are stored at 4-6oC and

© Agriculture and Horticulture Development Board 2014
17
the incidence of splitting at the point of impact is recorded. Tubers for the bruising test are stored at 9-11oC and the depth of damage at point of impact measured. Statistical analysis Most of the data was recorded as percentages and was angularly transformed before conducting an individual trial analysis of variance. For PCN and skin spot log transformations were used. Over-year trial means were calculated using REML from transformed trial means; for IVT the test years from 2005 (the year when the consortium took over the trialling) were used, giving nine years for this report, and for NL tests, all years from 1981 were used where data was available. Late blight data is from 2008 when testing with the new isolate was introduced. This data was used to calculate the provisional and final ratings presented in Tables 1a and 1b. However, in the individual test reports, ratings presented are based on the analysis for 2 years only and have been presented to one decimal point to provide greater clarity. All ratings of 1-9 were derived by linear transformation (or according to a multiplication index for PCN) using varieties with known consistent susceptible and resistant reactions as fixed reference points. Rhizoctonia stem canker and Dickeya solani development tests Development trials were conducted for Rhizoctonia stem canker and Dickeya solani in 2013. A report on the statistical analysis of the data for each test is included in the appendices of this report.
4. RESULTS
Ring rot, brown rot and Dickeya bacteria were not found in any of the seed potatoes tested for the pathogens. Rhizoctonia stem canker 2012 saw the first year of this test as a possible replacement for the black scurf test, the test was conducted again in 2013. A report produced by BioSS summarising the statistical analysis of the data is included in the Appendix (7.1) of this report. Dickeya solani A trial was conducted in 2013 with an aim of developing a test for D. solani for inclusion in the future IVT programme. A report produced by BioSS summarising the statistical analysis of the data is included in the Appendix (7.2) of this report. IVT Tests For each IVT test reported below there are two sections:
Summary of 2012/2013 Trials- this refers to varieties completing two years of
trials and it provides an overview of the two years of the test and highlights the
performance of particular varieties. The 1-9 ratings listed for the varieties in the
relevant test table are presented in bold and are the final scores for the
varieties after completing the two years of trials.
2013 Trial- this refers to varieties completing one year of trials (2013) and it
provides a summary of the performance of varieties completing their first year
of IVT testing. The 1-9 ratings in the relevant test table are presented in italic
font as these are provisional scores based on one year of trials.

© Agriculture and Horticulture Development Board 2014
18
Foliage late blight (field) Summary of 2012/2013 Trials (Table 3) Late blight was slow to develop at the site in 2013, with a small number of lesions observed on 1 and 5 August, further assessments were made at 2, 3 or 4 day intervals. Late blight on susceptible varieties progressed well from 9 August and the foliage of all but the more resistant varieties was dead by 23 August. Foliage of the differentials R1, R2, R3, R4, R5, R6, R7, R10 and R11 was killed by late blight. No growing lesions developed on plants of R8 or R9 differentials. This confirmed the results of detached leaflet tests that the virulence of the P. infestans isolate was 1.2.3.4.5.6.7.10.11. Overall there were similar levels of blight recorded in both years although it should be noted that the resistant reference variety Sarpo Mira and the resistant candidate Wizard both had more blight recorded in 2013 than in 2012. These were still the most resistant in trial with a score of 8.0. Gatsby was the only other candidate with resistance scoring 7.0. The most susceptible varieties were Manhattan, Clairette and Arizona scoring 2.9, 3.1 and 3.3, respectively. 2013 Trial (Table 3) No candidates demonstrated resistance, the least susceptible candidates were HG 99-97 1 (5.6) and 01Z51 A 54 (5.5). The most susceptible candidates were Pizazz and Venezia scoring 2.5 and 3.0, respectively.

© Agriculture and Horticulture Development Board 2014
19
Table 3. Mean % (angular transformation) Area under Disease Progress in foliage late blight field test in 2012 and 2013 (2nd early/maincrop varieties)
Test Year Variety 2012 2013 1-9 rating BINTJE CARA RUSSET BURBANK SARPO MIRA VALOR BUTE CLAIRETTE WIZARD JESTER GATSBY LA STRADA MANHATTAN ARIZONA COMPASS INFINITY JELLY PANTHER ROYAL SETANTA PIZAZZ ELLIE 02M012-001 04C055-004 HG 99-97 1 HG 05-3 A9 HG 05-3 A17 01Z51 A 54 ARSENAL DOLLY EDONY GWENNE IVORY RUSSET VENEZIA
44.8 23.6 45.7 10.6 22.3 35.2 43.4 8.5 37.7 18.9 40.3 49.2 41.7 41.1 39.0 32.2 43.9 33.6 30.5
44.3 31.5 40.0 18.9 26.9 32.9 44.8 21.5 42.4 23.1 40.9 40.9 43.6 41.4 38.6 32.1 39.1 35.2 32.0 47.1 41.4 34.8 38.5 31.3 37.7 37.2 31.6 39.8 40.8 35.9 38.6 33.5 44.2
3.0 5.8 3.3 8.0 6.3 4.8 3.1 8.0 3.7 7.0 3.7 2.9 3.3 3.5 4.0 5.1 3.5 4.7 5.2 2.5 3.6 4.9 4.1 5.6 4.3 4.4 5.5 3.9 3.7 4.6 4.1 5.1 3.0
LSD (P0.05) 5.6 6.5 1.6
© Agriculture and Horticulture Development Board 2014
20
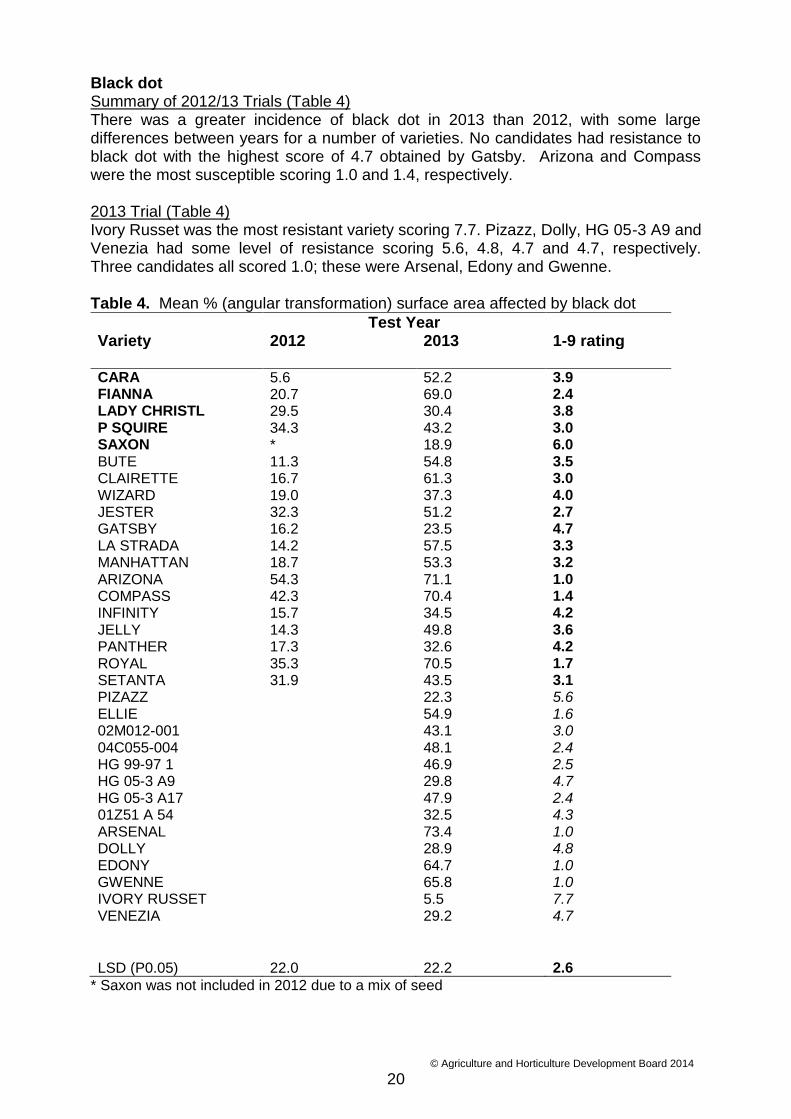
Black dot Summary of 2012/13 Trials (Table 4) There was a greater incidence of black dot in 2013 than 2012, with some large differences between years for a number of varieties. No candidates had resistance to black dot with the highest score of 4.7 obtained by Gatsby. Arizona and Compass were the most susceptible scoring 1.0 and 1.4, respectively. 2013 Trial (Table 4) Ivory Russet was the most resistant variety scoring 7.7. Pizazz, Dolly, HG 05-3 A9 and Venezia had some level of resistance scoring 5.6, 4.8, 4.7 and 4.7, respectively. Three candidates all scored 1.0; these were Arsenal, Edony and Gwenne. Table 4. Mean % (angular transformation) surface area affected by black dot
Test Year Variety 2012 2013 1-9 rating CARA FIANNA LADY CHRISTL P SQUIRE SAXON BUTE CLAIRETTE WIZARD JESTER GATSBY LA STRADA MANHATTAN ARIZONA COMPASS INFINITY JELLY PANTHER ROYAL SETANTA PIZAZZ ELLIE 02M012-001 04C055-004 HG 99-97 1 HG 05-3 A9 HG 05-3 A17 01Z51 A 54 ARSENAL DOLLY EDONY GWENNE IVORY RUSSET VENEZIA
5.6 20.7 29.5 34.3 * 11.3 16.7 19.0 32.3 16.2 14.2 18.7 54.3 42.3 15.7 14.3 17.3 35.3 31.9
52.2 69.0 30.4 43.2 18.9 54.8 61.3 37.3 51.2 23.5 57.5 53.3 71.1 70.4 34.5 49.8 32.6 70.5 43.5 22.3 54.9 43.1 48.1 46.9 29.8 47.9 32.5 73.4 28.9 64.7 65.8 5.5 29.2
3.9 2.4 3.8 3.0 6.0 3.5 3.0 4.0 2.7 4.7 3.3 3.2 1.0 1.4 4.2 3.6 4.2 1.7 3.1 5.6 1.6 3.0 2.4 2.5 4.7 2.4 4.3 1.0 4.8 1.0 1.0 7.7 4.7
LSD (P0.05) 22.0 22.2 2.6
* Saxon was not included in 2012 due to a mix of seed
© Agriculture and Horticulture Development Board 2014
21
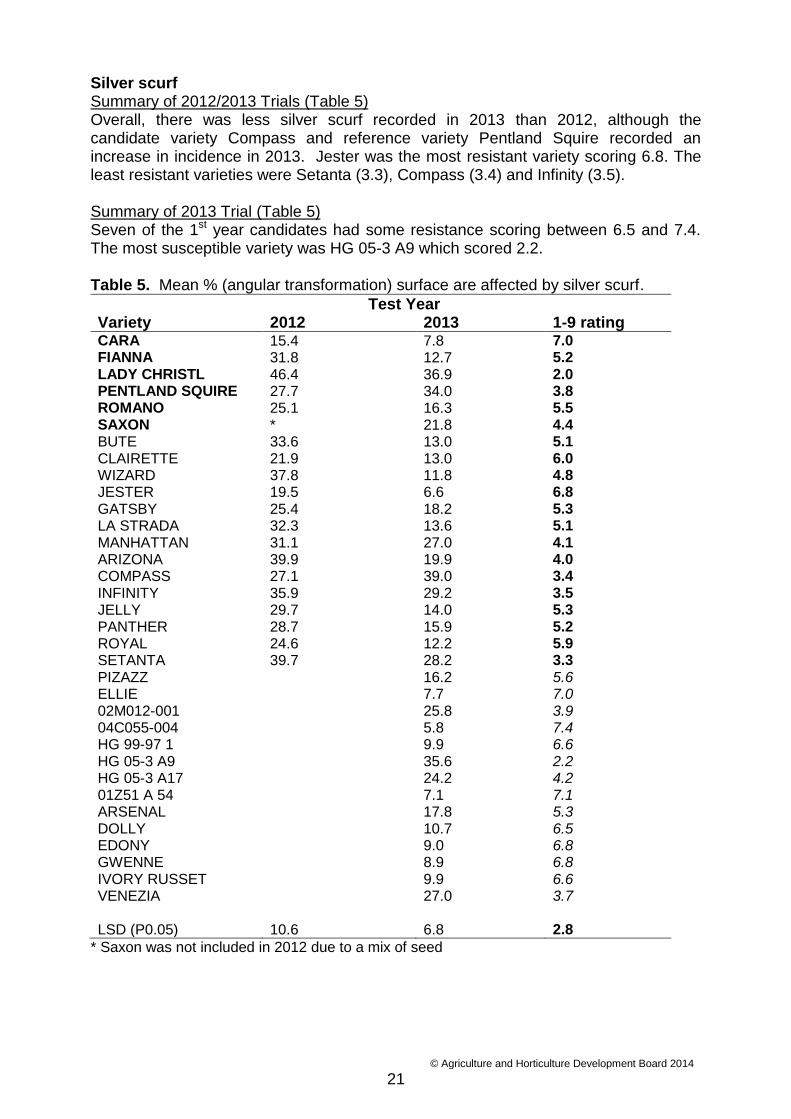
Silver scurf Summary of 2012/2013 Trials (Table 5) Overall, there was less silver scurf recorded in 2013 than 2012, although the candidate variety Compass and reference variety Pentland Squire recorded an increase in incidence in 2013. Jester was the most resistant variety scoring 6.8. The least resistant varieties were Setanta (3.3), Compass (3.4) and Infinity (3.5). Summary of 2013 Trial (Table 5) Seven of the 1st year candidates had some resistance scoring between 6.5 and 7.4. The most susceptible variety was HG 05-3 A9 which scored 2.2. Table 5. Mean % (angular transformation) surface are affected by silver scurf.
Test Year Variety 2012 2013 1-9 rating CARA FIANNA LADY CHRISTL PENTLAND SQUIRE ROMANO SAXON BUTE CLAIRETTE WIZARD JESTER GATSBY LA STRADA MANHATTAN ARIZONA COMPASS INFINITY JELLY PANTHER ROYAL SETANTA PIZAZZ ELLIE 02M012-001 04C055-004 HG 99-97 1 HG 05-3 A9 HG 05-3 A17 01Z51 A 54 ARSENAL DOLLY EDONY GWENNE IVORY RUSSET VENEZIA
15.4 31.8 46.4 27.7 25.1 * 33.6 21.9 37.8 19.5 25.4 32.3 31.1 39.9 27.1 35.9 29.7 28.7 24.6 39.7
7.8 12.7 36.9 34.0 16.3 21.8 13.0 13.0 11.8 6.6 18.2 13.6 27.0 19.9 39.0 29.2 14.0 15.9 12.2 28.2 16.2 7.7 25.8 5.8 9.9 35.6 24.2 7.1 17.8 10.7 9.0 8.9 9.9 27.0
7.0 5.2 2.0 3.8 5.5 4.4 5.1 6.0 4.8 6.8 5.3 5.1 4.1 4.0 3.4 3.5 5.3 5.2 5.9 3.3 5.6 7.0 3.9 7.4 6.6 2.2 4.2 7.1 5.3 6.5 6.8 6.8 6.6 3.7
LSD (P0.05) 10.6 6.8 2.8
* Saxon was not included in 2012 due to a mix of seed

© Agriculture and Horticulture Development Board 2014
22
Skin spot Summary of 2012/2013 Trials (Table 6) The severity of skin spot symptoms was greater in 2013 than 2012. La Strada (7.0), Jester (6.6) and Gatsby (6.5) were the most resistant candidate varieties. Compass was the most susceptible candidate scoring 1.3. 2013 Trial (Table 6) Of the 1st year candidate varieties, the majority had some resistance with Ellie (8.3), 04C055-004 (8.2), Venezia (8.1), HG 05-3 A9 (8.0) and 01Z51 A 54 (7.2) all scoring higher than the most resistant reference variety Romano (7.0). Edony, Dolly and Arsenal were the most susceptible scoring 3.0, 3.3 and 3.6, respectively. Table 6. Mean % (log transformation [log (skin spot% + 0.1) where log is log to base 10]) surface area affected by skin spot.
Test Year Variety 2012 2013 1-9 rating FIANNA KING EDWARD PENTLAND SQUIRE ROMANO SANTE SAXON BUTE CLAIRETTE WIZARD JESTER GATSBY LA STRADA MANHATTAN ARIZONA COMPASS INFINITY JELLY PANTHER ROYAL SETANTA PIZAZZ ELLIE 02M012-001 04C055-004 HG 99-97 1 HG 05-3 A9 HG 05-3 A17 01Z51 A 54 ARSENAL DOLLY EDONY GWENNE IVORY RUSSET VENEZIA
-0.8 0.1 0.4 -0.9 0.8 * -0.8 0.0 -0.6 -0.7 -0.6 -1.0 0.2 -0.3 0.6 -0.2 -0.7 -0.6 -0.7 -0.4
-0.4 0.9 0.8 -0.6 0.8 0.0 0.1 -0.0 0.4 -0.6 -0.6 -0.5 0.5 1.1 1.0 0.1 0.1 -0.4 0.2 0.6 0.1 -1.0 -0.4 -0.9 -0.3 -0.9 -0.3 -0.7 0.4 0.5 0.6 -0.4 -0.4 -0.9
6.5 2.5 2.0 7.0 1.3 5.0 5.5 4.2 4.6 6.6 6.5 7.0 3.0 2.8 1.3 4.5 5.3 6.0 5.1 3.8 4.7 8.3 6.2 8.2 6.1 8.0 6.1 7.2 3.6 3.3 3.0 6.4 6.4 8.1
LSD (P0.05) 0.6 0.4 2.7
* Saxon was not included in 2012 due to a mix of seed
© Agriculture and Horticulture Development Board 2014
23
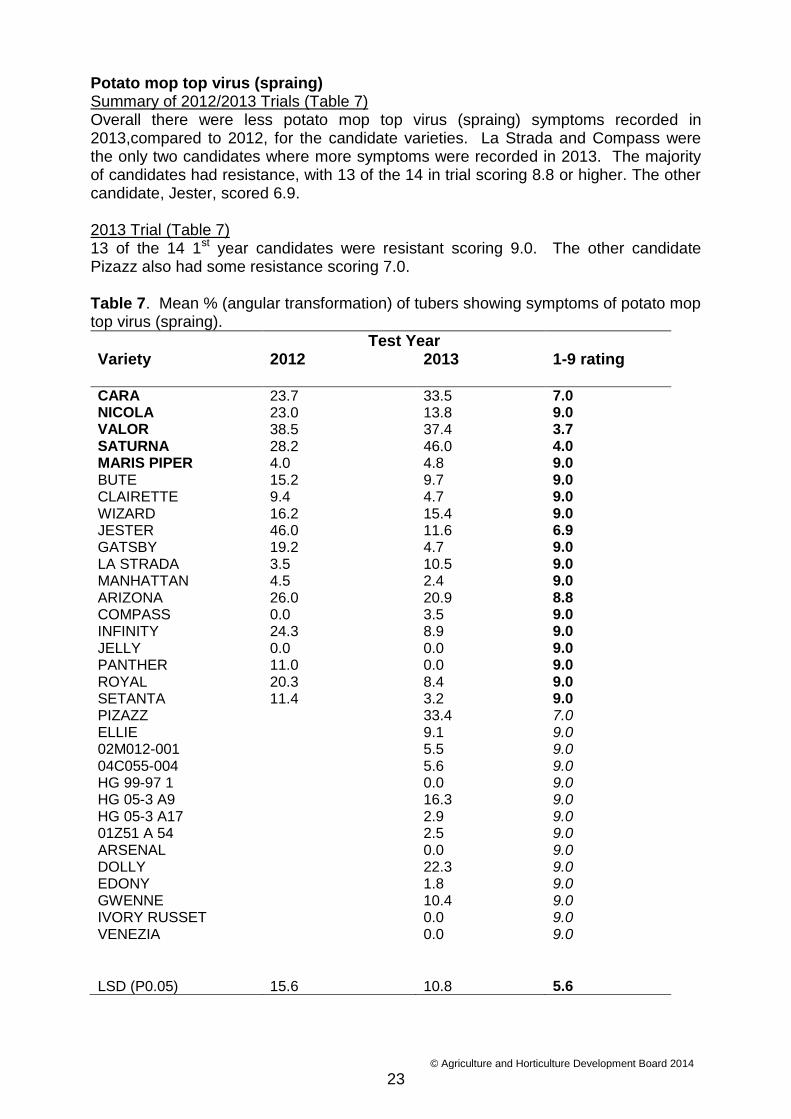
Potato mop top virus (spraing) Summary of 2012/2013 Trials (Table 7) Overall there were less potato mop top virus (spraing) symptoms recorded in 2013,compared to 2012, for the candidate varieties. La Strada and Compass were the only two candidates where more symptoms were recorded in 2013. The majority of candidates had resistance, with 13 of the 14 in trial scoring 8.8 or higher. The other candidate, Jester, scored 6.9. 2013 Trial (Table 7) 13 of the 14 1st year candidates were resistant scoring 9.0. The other candidate Pizazz also had some resistance scoring 7.0. Table 7. Mean % (angular transformation) of tubers showing symptoms of potato mop top virus (spraing).
Test Year Variety 2012 2013 1-9 rating CARA NICOLA VALOR SATURNA MARIS PIPER BUTE CLAIRETTE WIZARD JESTER GATSBY LA STRADA MANHATTAN ARIZONA COMPASS INFINITY JELLY PANTHER ROYAL SETANTA PIZAZZ ELLIE 02M012-001 04C055-004 HG 99-97 1 HG 05-3 A9 HG 05-3 A17 01Z51 A 54 ARSENAL DOLLY EDONY GWENNE IVORY RUSSET VENEZIA
23.7 23.0 38.5 28.2 4.0 15.2 9.4 16.2 46.0 19.2 3.5 4.5 26.0 0.0 24.3 0.0 11.0 20.3 11.4
33.5 13.8 37.4 46.0 4.8 9.7 4.7 15.4 11.6 4.7 10.5 2.4 20.9 3.5 8.9 0.0 0.0 8.4 3.2 33.4 9.1 5.5 5.6 0.0 16.3 2.9 2.5 0.0 22.3 1.8 10.4 0.0 0.0
7.0 9.0 3.7 4.0 9.0 9.0 9.0 9.0 6.9 9.0 9.0 9.0 8.8 9.0 9.0 9.0 9.0 9.0 9.0 7.0 9.0 9.0 9.0 9.0 9.0 9.0 9.0 9.0 9.0 9.0 9.0 9.0 9.0
LSD (P0.05) 15.6 10.8 5.6

© Agriculture and Horticulture Development Board 2014
24
National List (NL) Tests For each NL test (on Common Catalogue varieties) there is a summary of varieties completing two years of trials (2012 and 2013) and those completing one year of trials (2013). The first part of the summary provides an overview of the two years of the test and highlights the performance of particular varieties. The second paragraph highlights the performance of varieties completing the first year of testing. The 1-9 ratings for varieties completing two years of testing are presented in bold in the relevant test tables. The 1-9 ratings for varieties completing the first year of testing are presented in italic font in the relevant test table as these are provisional scores. Tuber late blight (Table 8) Overall there was a similar incidence of disease in both years, with the exception of Sarpo Mira where more disease was recorded in 2013. Of the candidate varieties entered for testing, most were relatively susceptible with scores between 1.6 and 2.1. Setanta was the least susceptible variety scoring 4.1. Of the 1st year candidates none demonstrated resistance. Dolly and Ivory Russet were the least susceptible scoring 3.9 and 3.7, respectively. Table 8. Mean % (angular transformation) tubers affected by late blight (2nd early/maincrop varieties)
Test Year Variety 2012 2013 1-9 rating BINTJE CARA SARPO MIRA VALOR ARIZONA COMPASS INFINITY JELLY PANTHER ROYAL SETANTA ARSENAL DOLLY EDONY GWENNE IVORY RUSSET VENEZIA
84.9 62.3 59.9 44.1 90.0 86.9 86.9 90.0 90.0 86.8 78.4 - - - - - -
90.0 67.6 78.1 43.3 90.0 90.0 87.0 86.8 90.0 90.0 72.8 90.0 79.2 90.0 90.0 80.4 90.0
2.0 6.0 5.3 9.0 1.6 1.8 2.1 1.8 1.6 1.8 4.1 2.0 3.9 2.0 2.0 3.7 2.0
LSD (P0.05) 14.7 10.4 2.4

© Agriculture and Horticulture Development Board 2014
25
Blackleg (Pectobacterium atrosepticum) (Table 9) Overall, there were fewer blackleg symptoms observed in 2013 than 2012. The incidence of blackleg was variable for some varieties between the two years of testing. For example, Arizona, Infinity, Panther and Setanta had fewer blackleg symptoms recorded in 2013 than in 2012, whereas Compass and Jelly had less blackleg recorded in 2012. Setanta, Infinity and Royal were the most resistant varieties in the two years of trials scoring 7.5, 7.3 and 7.1, respectively. Compass and Panther were the most susceptible scoring 1.1 and 1.4, respectively. Of the 1st year varieties, Edony and Gwenne had resistance scoring 8.5 and 7.7, respectively. Venezia (2.1) and Ivory Russet (2.8) were the most susceptible. Table 9. Mean % (angular transformation) plants affected by blackleg (Pectobacterium atrosepticum)
Test Year Variety 2012 2013 1-9 rating
AILSA CONCURRENT CULTRA ESTIMA MORENE ARIZONA COMPASS INFINITY JELLY PANTHER ROYAL SETANTA ARSENAL DOLLY EDONY GWENNE IVORY RUSSET VENEZIA
15.0 64.9 32.3 53.3 54.9 38.1 65.0 27.9 46.0 75.0 27.7 25.1 - - - - - -
20.2 42.1 21.6 47.9 50.0 30.5 73.3 21.6 54.3 57.9 25.0 21.6 41.9 25.7 14.8 19.4 49.1 53.3
8.0 3.0 6.6 3.2 3.1 6.0 1.1 7.3 3.7 1.4 7.1 7.5 4.0 6.7 8.5 7.7 2.8 2.1
LSD (P0.05) 13.1 14.5 2.9/3.9

© Agriculture and Horticulture Development Board 2014
26
Common scab (Table 10) There was a lack of discrimination between varieties in the 2013 test and therefore the data has not been published. Reference varieties are tested at 2 sites each year as part of the NL programme. SASA conducts a pot test in the NL programme, NIAB (the other UK NL test centre) conduct a field trial. Common Catalogue varieties are only tested at SASA. The 1-9 score for the reference varieties is from 2012 (SASA and NIAB) and 2013 data (NIAB only). The 1-9 score for the candidate varieties are based on the 2012 SASA trial. Jelly and Royal had moderate resistance scoring 6.3 and 5.5, respectively. Setanta was the most susceptible candidate scoring 3.0. Table 10. Mean % (angular transformation) surface area affected by common scab
Test Year Variety 2012 2012 2013 * 2013 1-9 rating ^ (SASA) (NIAB) (SASA) (NIAB) DESIREE ESTIMA HOME GUARD MARIS BARD MARIS PEER MARIS PIPER PENTLAND CROWN ARIZONA COMPASS INFINITY JELLY PANTHER ROYAL SETANTA ARSENAL DOLLY EDONY GWENNE IVORY RUSSET VENEZIA
54.4 13.9 39.1 13.3 43.7 17.1 52.8 12.1 56.5 14.9 54.5 23.7 28.7 10.6 45.9 44.5 41.5 35.6 47.0 39.1 50.2 - - - - - -
20.4 24.3 24.0 21.8 24.2 44.9 16.6
4.6 5.5 4.9 4.7 4.1 2.0 7.0 4.0 4.3 5.0 6.3 3.7 5.5 3.0 - - - - - -
LSD (P0.05) 11.0 5.0
*2013 data from SASA not published due to a lack of discrimination between varieties. ^NL trial is conducted at 2 sites (SASA and NIAB); 1-9 rating for reference varieties uses data from 2 sites in 2012 and 1 site in 2013. 1-9 rating for candidate varieties uses data from SASA in 2012 only.

© Agriculture and Horticulture Development Board 2014
27
Powdery scab (Table 11) The incidence of powdery scab was variable for some varieties between the two years of testing. For example, Compass and Panther had less powdery scab recorded in 2013 than in 2012, whereas Infinity, Jelly and Royal had less in 2012. Setanta was the most resistant scoring 6.6. Panther, Arizona and Compass were the least resistant scoring 3.6, 3.7 and 3.7, respectively. Estima continued to be clearly more susceptible than any of the other reference varieties. Of the 1st year candidate varieties Ivory Russet and Edony were the most resistant scoring 7.9 and 7, respectively. The remaining varieties had some level of moderate resistance scoring between 4.8 and 5.5. Table 11. Mean % (angular transformation) surface area affected by powdery scab
Test Year Variety 2012 2013 1-9 rating ACCENT CARA ESTIMA PENTLAND CROWN SANTE ARIZONA COMPASS INFINITY JELLY PANTHER ROYAL SETANTA ARSENAL DOLLY EDONY GWENNE IVORY RUSSET VENEZIA
21.4 20.3 47.3 16.9 8.8 40.4 51.5 20.9 24.6 49.2 17.4 20.3 - - - - - -
22.6 12.7 46.9 10.4 7.9 42.3 32.1 34.4 30.7 35.4 25.2 17.5 27.6 31.4 15.3 33.0 8.4 32.0
6.2 6.9 3.0 7.3 8.0 3.7 3.7 5.5 5.5 3.6 6.3 6.6 5.5 5.0 7.1 4.8 7.9 4.9
LSD (P0.05) 8.1 7.3 1.6

© Agriculture and Horticulture Development Board 2014
28
Dry rot (Fusarium spp.) F. solani var. coeruleum (Table 12) Generally there was more disease recorded on the reference varieties in 2013 than 2012, but the opposite for the candidates with more disease overall in 2012. Setanta, Panther and Infinity were relatively consistent in both years demonstrating resistance scores of 8.2, 8.1 and 8.1, respectively. Ivory Russet and Arsenal were the most resistant of the 1st year candidates scoring 8.3 and 8.0, respectively. The least resistant variety was Dolly scoring 5.4. Table 12. Mean % (angular transformation) internal area affected by Fusarium solani var coeruleum
Test Year Variety 2012 2013 1-9 rating NADINE CATRIONA ESTIMA PENTLAND SQUIRE SANTE ARIZONA COMPASS INFINITY JELLY PANTHER ROYAL SETANTA ARSENAL DOLLY EDONY GWENNE IVORY RUSSET VENEZIA
20.8 64.0 27.7 29.4 4.1 31.5 21.8 4.5 12.8 5.1 27.3 4.1 - - - - - -
36.4 66.0 46.6 55.1 8.3 21.6 18.0 6.9 8.9 4.5 10.0 4.5 8.7 35.7 17.8 17.1 5.5 24.9
5.6 1.8 4.7 4.2 8.0 5.9 6.6 8.1 7.5 8.1 6.7 8.2 8.0 5.4 7.1 7.2 8.3 6.4
LSD (P0.05) 9.7 10.8 1.7

© Agriculture and Horticulture Development Board 2014
29
F. sulphureum (Table 13) Overall, there were similar levels of disease recorded in both years for the candidates with the exception of Setanta where less disease was recorded in 2013. None of the varieties demonstrated resistance, the least susceptible varieties were Infinity and Setanta scoring 4.5 and 4.3, respectively. Of the 1st year varieties, Edony and Gwenne were the most resistant both scoring 7.0. Dolly had moderate resistance scoring 5.8. The remaining candidates were susceptible scoring 1.0 and 2.3. Table 13. Mean % (angular transformation) internal area affected by Fusarium sulphureum
Test Year Variety 2012 2013 1-9 rating SANTE ATLANTIC MARIS PIPER NADINE SAXON ARIZONA COMPASS INFINITY JELLY PANTHER ROYAL SETANTA ARSENAL DOLLY EDONY GWENNE IVORY RUSSET VENEZIA
12.0 43.1 25.7 27.8 27.7 57.7 60.4 26.4 67.7 66.5 55.1 37.9 - - - - - -
6.0 34.9 37.3 42.9 32.2 57.7 63.5 23.2 64.2 61.4 62.7 13.8 64.2 20.0 12.4 12.4 41.7 61.2
8.0 1.3 3.0 2.1 3.3 1.0 1.0 4.5 1.0 1.0 1.0 4.3 1.0 5.8 7.0 7.0 2.3 1.0
LSD (P0.05) 11.2 8.6 3.4
© Agriculture and Horticulture Development Board 2014
30
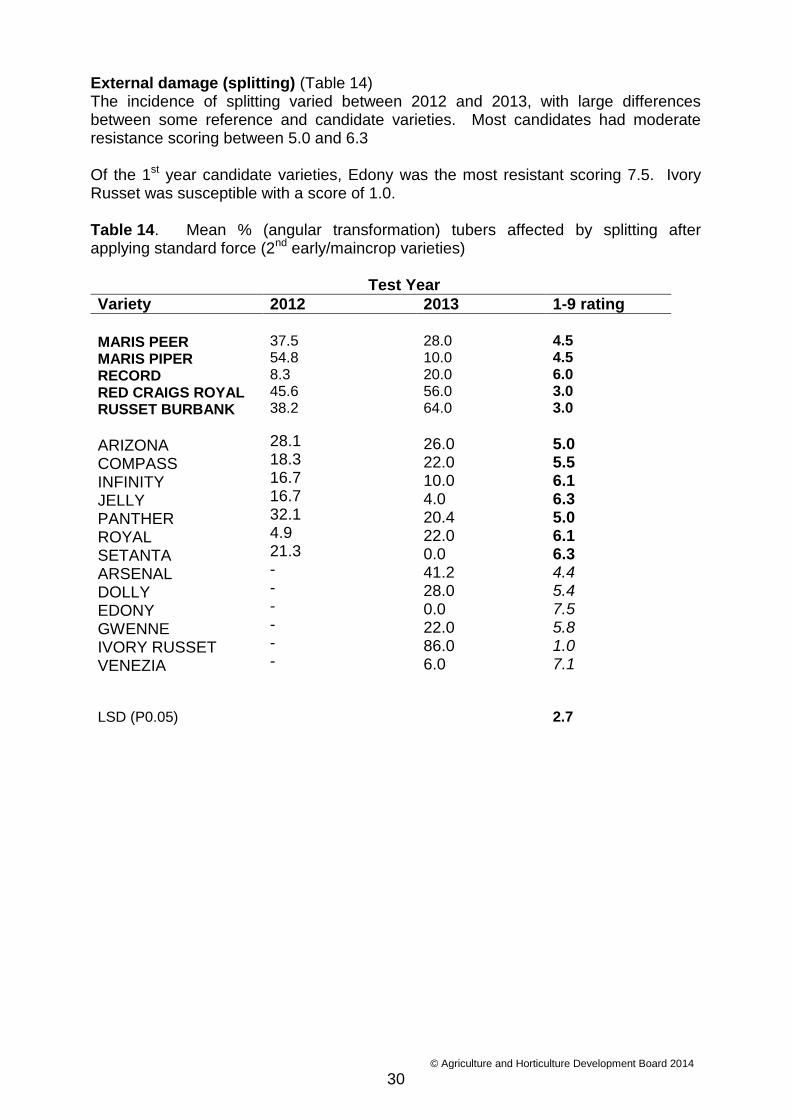
External damage (splitting) (Table 14) The incidence of splitting varied between 2012 and 2013, with large differences between some reference and candidate varieties. Most candidates had moderate resistance scoring between 5.0 and 6.3 Of the 1st year candidate varieties, Edony was the most resistant scoring 7.5. Ivory Russet was susceptible with a score of 1.0. Table 14. Mean % (angular transformation) tubers affected by splitting after applying standard force (2nd early/maincrop varieties) Test Year
Variety 2012 2013 1-9 rating
MARIS PEER MARIS PIPER RECORD RED CRAIGS ROYAL RUSSET BURBANK
ARIZONA COMPASS INFINITY JELLY PANTHER ROYAL SETANTA ARSENAL DOLLY EDONY GWENNE IVORY RUSSET VENEZIA
37.5 54.8 8.3 45.6 38.2
28.1 18.3 16.7 16.7 32.1 4.9 21.3 - - - - - -
28.0 10.0 20.0 56.0 64.0
26.0 22.0 10.0 4.0 20.4 22.0 0.0 41.2 28.0 0.0 22.0 86.0 6.0
4.5 4.5 6.0 3.0 3.0
5.0 5.5 6.1 6.3 5.0 6.1 6.3 4.4 5.4 7.5 5.8 1.0 7.1
LSD (P0.05) 2.7

© Agriculture and Horticulture Development Board 2014
31
Internal damage (bruising) (Table 15) Jelly was not included in the 2012 test due to a shortage of tubers from the trial plot; it had the least amount of bruising recorded in 2013 and was the most resistant variety scoring 7.0, Setanta also demonstrated a level of resistance scoring 6.9. Arizona was the least resistant scoring 4.1. Of the 1st year candidates, Venezia was the most resistant scoring 6.9 and Ivory Russet the most susceptible scoring 2.7. Table 15. Mean depth (mm) of bruise at point of impact of standard force (2nd early/maincrop varieties)
Test Year Variety 2012 2013 1-9 rating MARIS PEER MARIS PIPER RECORD RED CRAIGS ROYAL RUSSET BURBANK ARIZONA COMPASS INFINITY JELLY PANTHER ROYAL SETANTA ARSENAL DOLLY EDONY GWENNE IVORY RUSSET VENEZIA
4.4 2.8 5.3 6.1 4.7 4.1 2.8 3.5 * 3.4 2.9 1.0 - - - - - -
4.3 2.9 3.1 5.1 5.2 5.6 3.9 3.9 2.0 4.1 3.3 2.7 2.6 5.1 5.0 3.9 6.8 1.8
4.5 6.0 4.7 3.4 4.0 4.1 5.5 5.2 7.0 5.1 5.8 6.9 6.2 4.1 4.2 5.1 2.7 6.9
LSD (P0.05) 2.6
* Jelly was not included in the trial due to insufficient tubers
© Agriculture and Horticulture Development Board 2014
32
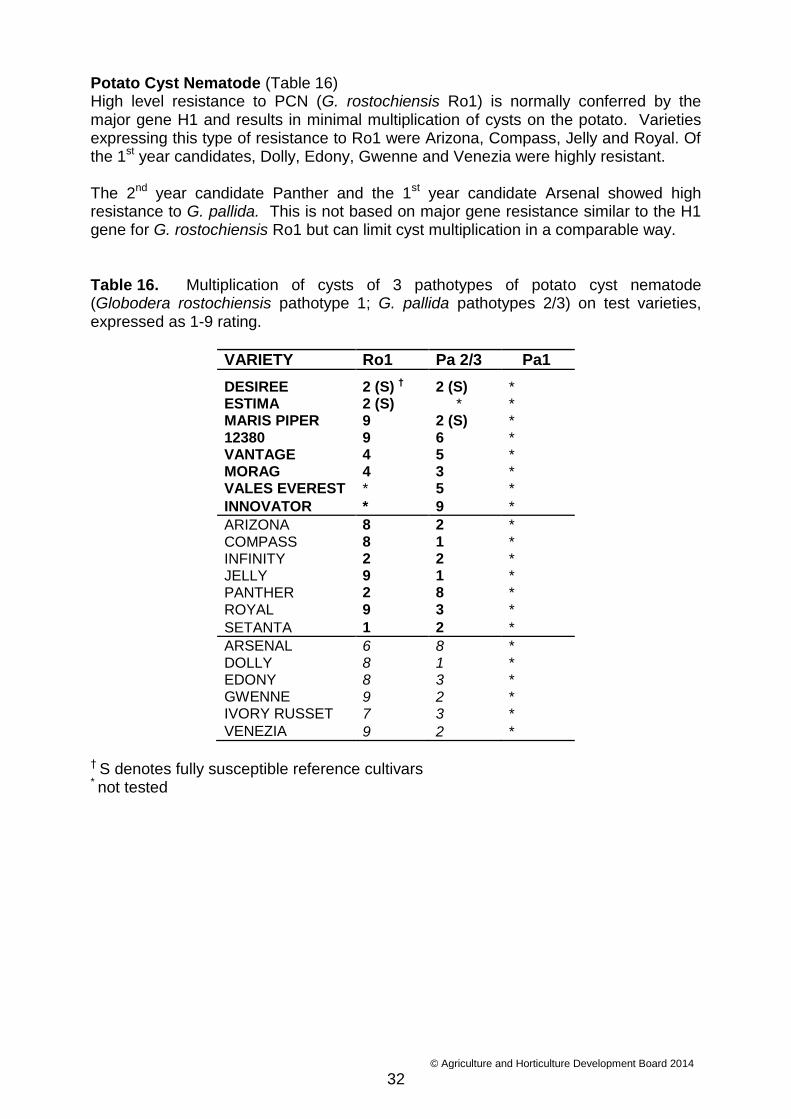
Potato Cyst Nematode (Table 16) High level resistance to PCN (G. rostochiensis Ro1) is normally conferred by the major gene H1 and results in minimal multiplication of cysts on the potato. Varieties expressing this type of resistance to Ro1 were Arizona, Compass, Jelly and Royal. Of the 1st year candidates, Dolly, Edony, Gwenne and Venezia were highly resistant. The 2nd year candidate Panther and the 1st year candidate Arsenal showed high resistance to G. pallida. This is not based on major gene resistance similar to the H1 gene for G. rostochiensis Ro1 but can limit cyst multiplication in a comparable way. Table 16. Multiplication of cysts of 3 pathotypes of potato cyst nematode (Globodera rostochiensis pathotype 1; G. pallida pathotypes 2/3) on test varieties, expressed as 1-9 rating.
VARIETY Ro1 Pa 2/3 Pa1
DESIREE 2 (S) † 2 (S) * ESTIMA 2 (S) * * MARIS PIPER 9 2 (S) * 12380 9 6 * VANTAGE 4 5 * MORAG 4 3 * VALES EVEREST * 5 *
INNOVATOR * 9 *
ARIZONA 8 2 * COMPASS 8 1 * INFINITY 2 2 * JELLY 9 1 * PANTHER 2 8 * ROYAL 9 3 *
SETANTA 1 2 *
ARSENAL 6 8 * DOLLY 8 1 * EDONY 8 3 * GWENNE 9 2 * IVORY RUSSET 7 3 *
VENEZIA 9 2 *
† S denotes fully susceptible reference cultivars * not tested
© Agriculture and Horticulture Development Board 2014
33
5. DISCUSSION
The full range of disease tests was completed on time with reasonable disease development in most tests. After discussion between BioSS and SASA it was decided to exclude the 2013 common scab data from the SASA trial. This resulted in the Common Catalogue varieties completing tests (Arizona, Compass, Infinity, Jelly, Panther, Royal and Setanta) having only 1 year of data. No result is available for the 1st year Common Catalogue varieties Arsenal, Dolly, Edony, Gwenne, Ivory Russet and Venezia. In some tests e.g. black dot and skin spot, disease severity was greater in 2013 than in 2012, whereas the incidence of silver scurf and blackleg was generally less in 2013 than 2012. As in previous years, some differences in the relative reactions of varieties were found between test years. For example, Jester and Arizona were more susceptible to black dot in 2012 than 2013; and Compass and Royal were more susceptible to silver scurf in 2013 than 2012. Such yearly variation appears to be an inherent part of this type of testing and may be a consequence of differing disease pressures and environmental conditions in the test year. Conditions in a polytunnel will, for example, be affected by outside temperature, amount of sunshine and humidity and this could impact on disease pressure. The amount of disease pressure to which a variety is exposed can affect its reaction as reported by Hilton et al. (2000) for silver scurf. The potential for variability in a variety’s reaction needs to be recognised when considering ratings, particularly those based on one test in one year. At the start of 2012 it was decided to discontinue the Rhizoctonia black scurf test as the results were inconsistent from year to year. It was agreed that an assay to assess possible resistance/ tolerance for stem canker and related symptoms i.e. pruned stolons as caused by R. solani would be investigated. In 2012, the investigation consisted of a screen of all 36 varieties and a test with a known susceptible variety (Harmony) to determine the ideal time point expressed as weeks after planting for assessment of stem canker. From this work, assessment at 4 weeks after emergence gave the best discrimination. In the 2013 trial, 36 varieties were screened and assessments were conducted 4 weeks after emergence. There was strong statistical evidence in 2013 of differences in stem canker severity between varieties and some statistical evidence for differences in stolon canker severity between varieties. There was limited statistical evidence of a difference in the proportions of pruned stolons between varieties. From the over-years’ analysis of the 2012 and 2013 data there was no statistical evidence of differences between varieties in stem canker or stolon canker severity. There was also no statistical evidence between varieties in the percentages of infected stolons. A third year of testing will be conducted in 2014 using the same method as 2013; results will then be compared over the trial years. A development test for susceptibility to Dickeya solani was conducted in 2012 as noted in the R447 IVT report 2012. 11 varieties (Bintje, Cara, Charlotte, Desiree, Estima, Maris Piper, Mondial, Mozart, Nicola, Saturna and Spunta) were included in the test and tubers inoculated with three concentration levels; plant and tuber assessments were then conducted. Following the analysis of data from the 2012 trial it was decided not to include the 105 concentration in the 2013 trial as it did not discriminate between varieties as well as the other two concentrations (103 and 107). The tuber assessment was also discontinued as it did not show differences between varieties and inoculum levels unlike the plant assessment. The 11 varieties used in the 2012 trial were again used in 2013 and inoculated prior to planting with c. 0.01-0.02 ml of a bacterial suspension of a mixture of isolates at 103 cells ml-1 or 107 cells ml-1. The method of assessment of the trial plants was the same in both 2012 and 2013. Six
© Agriculture and Horticulture Development Board 2014
34
assessments were conducted weekly from 3 July to 8 August 2013. Overall there were fewer symptomatic plants observed in 2013 and less discrimination between varieties. In 2012 there were differences between concentration levels, with more disease symptoms observed at the higher concentration (107). This was seen again in 2013 but to a lesser extent and there was no discrimination between the varieties for either concentration. Further work would have to be conducted to develop a test for inclusion in the future IVT programme. 2011 saw the introduction of a test for potato mop top virus (spraing). In this test the number of tubers with spraing symptoms is recorded. As noted in the R447 IVT report 2012, the majority of varieties tested in the first 2 years had resistance. This was observed again in 2013. Of the varieties in the 1st and 2nd year of testing only 2 candidates did not have a resistance score of 7, 8 or 9. In the National List (NL) and IVT testing programmes, the resistance of a candidate variety to a range of diseases is evaluated in a series of standardised tests which each include a set of standard reference varieties whose reactions are known. For each disease, the resistance rating of a candidate variety is determined by comparing the amount of disease developing on the candidate variety with that on the standard varieties over at least two years of testing. The process of calculating variety scores is subject to regular review. As part of a review of NL decision making, statistical advice was that over-year means should be calculated from data for as many years as possible rather than two test years. This proposal has been adopted for NL analysis using data since 1981 and has been applied to IVT data for the last nine years. This has meant that small changes in some of the historic ratings ascribed to a variety have occurred, sometimes exacerbated by the process of rounding up or down to a whole number. For example, a variety scoring 3.7 for a character is recorded as 4, the same as a variety scoring 4.4. Small shifts in the calculations may move these values up or down. Users of this data should bear in mind that the final rating of a variety should be treated as a broad guide as to how a variety might perform in practice rather being an absolute value. Disease resistance ratings are recorded on a 1 to 9 scale where 1 is highly susceptible and 9 very resistant. Thus the higher the value, the more resistant a variety is to a disease. Typically, varieties with a score of 1, 2 or 3 would be considered highly susceptible, those with a score 4 or 5 considered susceptible, those with a score 6 or 7 moderately resistant and those with scores 8 or 9 highly resistant. A high resistance score should not be taken as indicating that a disease will be absent but that there is less risk of the disease developing on these varieties. With most other diseases and faults, all varieties can be affected to a greater or lesser extent. In consequence, the need for other control measures such as fungicide application should be evaluated, based on other factors such as the level of inoculum likely to be present and whether environmental conditions favour the pathogen. The British Potato Variety Database was launched on the web in July 2007 and formally presented to industry at the Potatoes in Practice event in August, 2007. This is now the mechanism for publication of both NL and IVT data and brings this data together with breeder’s information formerly presented in publications such as “Scotland - The Natural Home of Potatoes”. This database allows SASA to publish variety information immediately from various trials as soon as it is finalised. To date, the database has been accessed 214,595 times up to July 2014. 147 countries have used the site with the most frequent visitors from GB, accessing the site 195,301
© Agriculture and Horticulture Development Board 2014
35
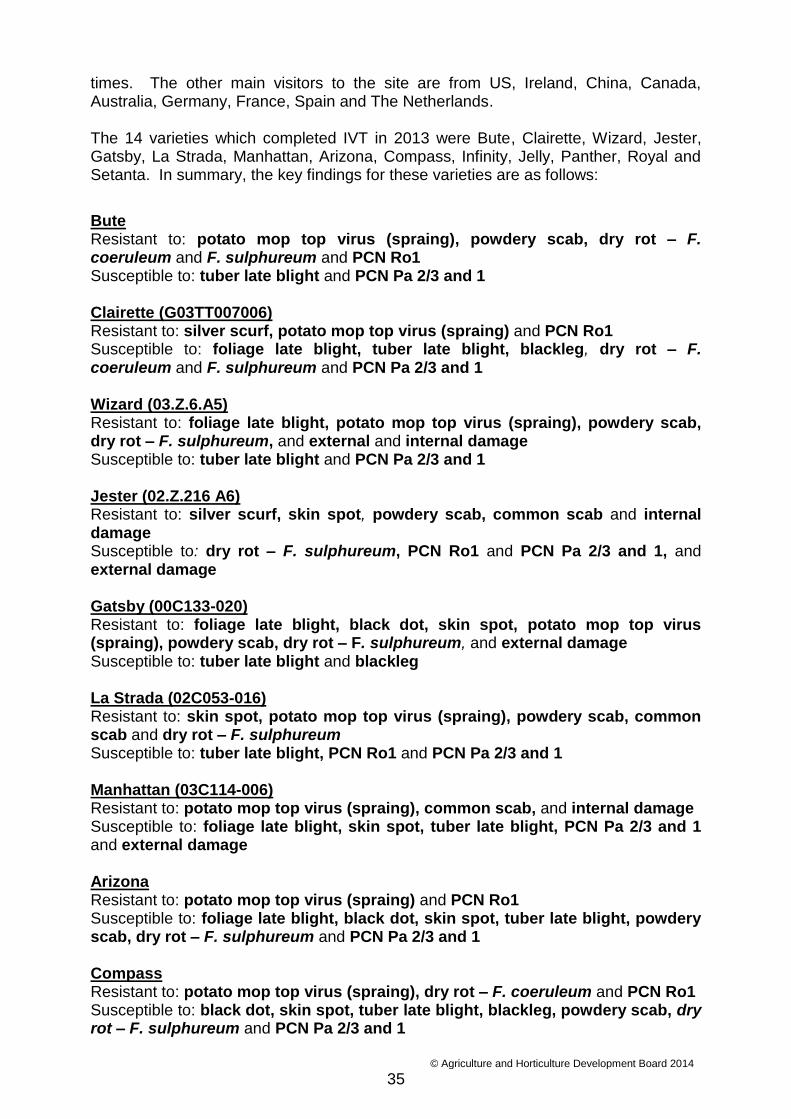
times. The other main visitors to the site are from US, Ireland, China, Canada, Australia, Germany, France, Spain and The Netherlands. The 14 varieties which completed IVT in 2013 were Bute, Clairette, Wizard, Jester, Gatsby, La Strada, Manhattan, Arizona, Compass, Infinity, Jelly, Panther, Royal and Setanta. In summary, the key findings for these varieties are as follows:
Bute Resistant to: potato mop top virus (spraing), powdery scab, dry rot – F. coeruleum and F. sulphureum and PCN Ro1 Susceptible to: tuber late blight and PCN Pa 2/3 and 1 Clairette (G03TT007006) Resistant to: silver scurf, potato mop top virus (spraing) and PCN Ro1 Susceptible to: foliage late blight, tuber late blight, blackleg, dry rot – F. coeruleum and F. sulphureum and PCN Pa 2/3 and 1 Wizard (03.Z.6.A5) Resistant to: foliage late blight, potato mop top virus (spraing), powdery scab, dry rot – F. sulphureum, and external and internal damage Susceptible to: tuber late blight and PCN Pa 2/3 and 1 Jester (02.Z.216 A6) Resistant to: silver scurf, skin spot, powdery scab, common scab and internal damage Susceptible to: dry rot – F. sulphureum, PCN Ro1 and PCN Pa 2/3 and 1, and external damage Gatsby (00C133-020) Resistant to: foliage late blight, black dot, skin spot, potato mop top virus (spraing), powdery scab, dry rot – F. sulphureum, and external damage Susceptible to: tuber late blight and blackleg La Strada (02C053-016) Resistant to: skin spot, potato mop top virus (spraing), powdery scab, common scab and dry rot – F. sulphureum Susceptible to: tuber late blight, PCN Ro1 and PCN Pa 2/3 and 1 Manhattan (03C114-006) Resistant to: potato mop top virus (spraing), common scab, and internal damage Susceptible to: foliage late blight, skin spot, tuber late blight, PCN Pa 2/3 and 1 and external damage Arizona Resistant to: potato mop top virus (spraing) and PCN Ro1 Susceptible to: foliage late blight, black dot, skin spot, tuber late blight, powdery scab, dry rot – F. sulphureum and PCN Pa 2/3 and 1 Compass Resistant to: potato mop top virus (spraing), dry rot – F. coeruleum and PCN Ro1 Susceptible to: black dot, skin spot, tuber late blight, blackleg, powdery scab, dry rot – F. sulphureum and PCN Pa 2/3 and 1
© Agriculture and Horticulture Development Board 2014
36
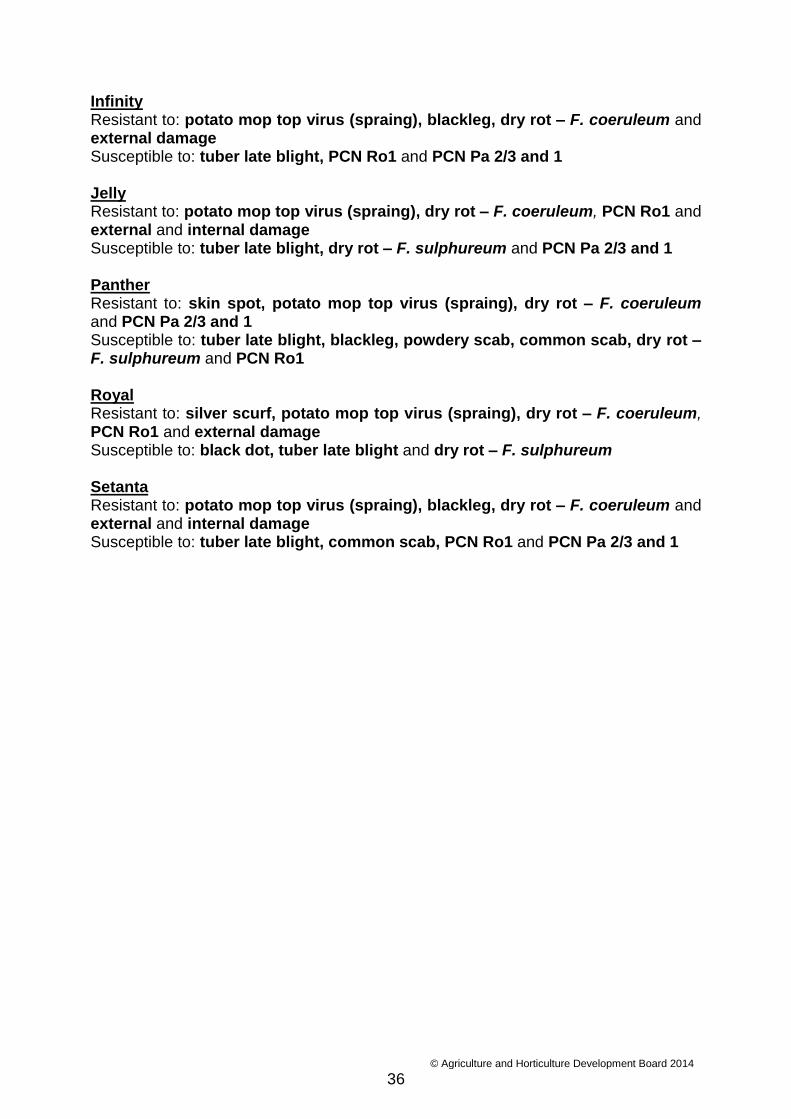
Infinity Resistant to: potato mop top virus (spraing), blackleg, dry rot – F. coeruleum and external damage Susceptible to: tuber late blight, PCN Ro1 and PCN Pa 2/3 and 1 Jelly Resistant to: potato mop top virus (spraing), dry rot – F. coeruleum, PCN Ro1 and external and internal damage Susceptible to: tuber late blight, dry rot – F. sulphureum and PCN Pa 2/3 and 1 Panther Resistant to: skin spot, potato mop top virus (spraing), dry rot – F. coeruleum and PCN Pa 2/3 and 1 Susceptible to: tuber late blight, blackleg, powdery scab, common scab, dry rot – F. sulphureum and PCN Ro1 Royal Resistant to: silver scurf, potato mop top virus (spraing), dry rot – F. coeruleum, PCN Ro1 and external damage Susceptible to: black dot, tuber late blight and dry rot – F. sulphureum Setanta Resistant to: potato mop top virus (spraing), blackleg, dry rot – F. coeruleum and external and internal damage Susceptible to: tuber late blight, common scab, PCN Ro1 and PCN Pa 2/3 and 1

© Agriculture and Horticulture Development Board 2014
37
6. REFERENCES
Boyd AEW (1957). Field experiments on potato skin spot disease caused by Oospora pustulans. Annals of Applied Biology 45, 284-292.
Carnegie SF, Cameron AM (1983). Testing potato cultivars for susceptibility to skin spot (Polyscytalum pustulans). Potato Research 26, 69-72.
Cruickshank G, Stewart HE, Wastie RL (1982). An illustrated assessment key for foliage blight of potatoes. Potato Research 25, 213-214.
Hilton AJ, Stewart HE, Linton SL, Nicolson MJ, Less AK (2000). Testing the resistance to silver scurf in commercial potato cultivars under controlled environmental conditions. Potato Research 43, 263-272.
Fry WE. (1978). Quantification of general resistance of potato cultivars and fungicide effects for integrated control of potato late blight. Phytopathology 68, 1650-1655.
R447 IVT report 2012. Potato Council website: http://www.potato.org.uk/publications/r447-independent-variety-trials-2011-2014 United Kingdom National List Trials: Trials Procedures for the Official Examination of Value for Cultivation and Use (VCU) – Potato 2013
© Agriculture and Horticulture Development Board 2014
38
7. APPENDICES
7.1. Statistical analysis of 2013 Rhizoctonia data and combined 2012/13 data
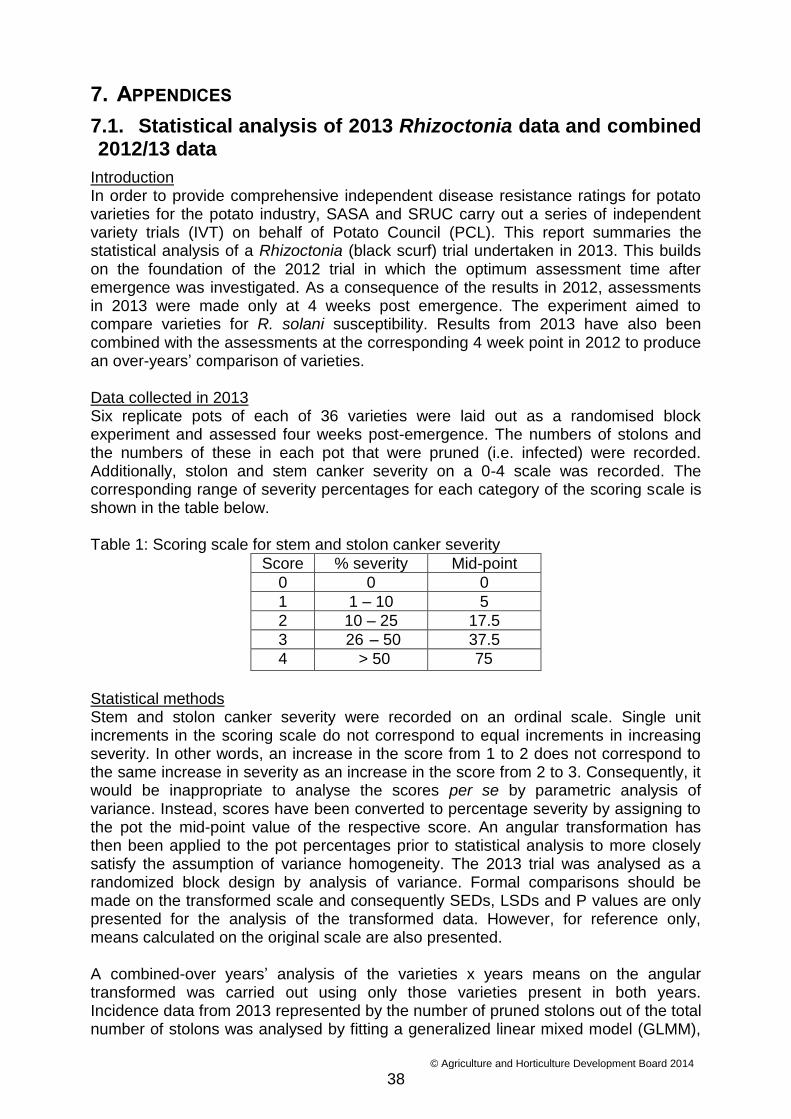
Introduction In order to provide comprehensive independent disease resistance ratings for potato varieties for the potato industry, SASA and SRUC carry out a series of independent variety trials (IVT) on behalf of Potato Council (PCL). This report summaries the statistical analysis of a Rhizoctonia (black scurf) trial undertaken in 2013. This builds on the foundation of the 2012 trial in which the optimum assessment time after emergence was investigated. As a consequence of the results in 2012, assessments in 2013 were made only at 4 weeks post emergence. The experiment aimed to compare varieties for R. solani susceptibility. Results from 2013 have also been combined with the assessments at the corresponding 4 week point in 2012 to produce an over-years’ comparison of varieties. Data collected in 2013 Six replicate pots of each of 36 varieties were laid out as a randomised block experiment and assessed four weeks post-emergence. The numbers of stolons and the numbers of these in each pot that were pruned (i.e. infected) were recorded. Additionally, stolon and stem canker severity on a 0-4 scale was recorded. The corresponding range of severity percentages for each category of the scoring scale is shown in the table below. Table 1: Scoring scale for stem and stolon canker severity
Score % severity Mid-point
0 0 0
1 1 – 10 5
2 10 – 25 17.5
3 26 – 50 37.5
4 > 50 75
Statistical methods Stem and stolon canker severity were recorded on an ordinal scale. Single unit increments in the scoring scale do not correspond to equal increments in increasing severity. In other words, an increase in the score from 1 to 2 does not correspond to the same increase in severity as an increase in the score from 2 to 3. Consequently, it would be inappropriate to analyse the scores per se by parametric analysis of variance. Instead, scores have been converted to percentage severity by assigning to the pot the mid-point value of the respective score. An angular transformation has then been applied to the pot percentages prior to statistical analysis to more closely satisfy the assumption of variance homogeneity. The 2013 trial was analysed as a randomized block design by analysis of variance. Formal comparisons should be made on the transformed scale and consequently SEDs, LSDs and P values are only presented for the analysis of the transformed data. However, for reference only, means calculated on the original scale are also presented. A combined-over years’ analysis of the varieties x years means on the angular transformed was carried out using only those varieties present in both years. Incidence data from 2013 represented by the number of pruned stolons out of the total number of stolons was analysed by fitting a generalized linear mixed model (GLMM),

© Agriculture and Horticulture Development Board 2014
39
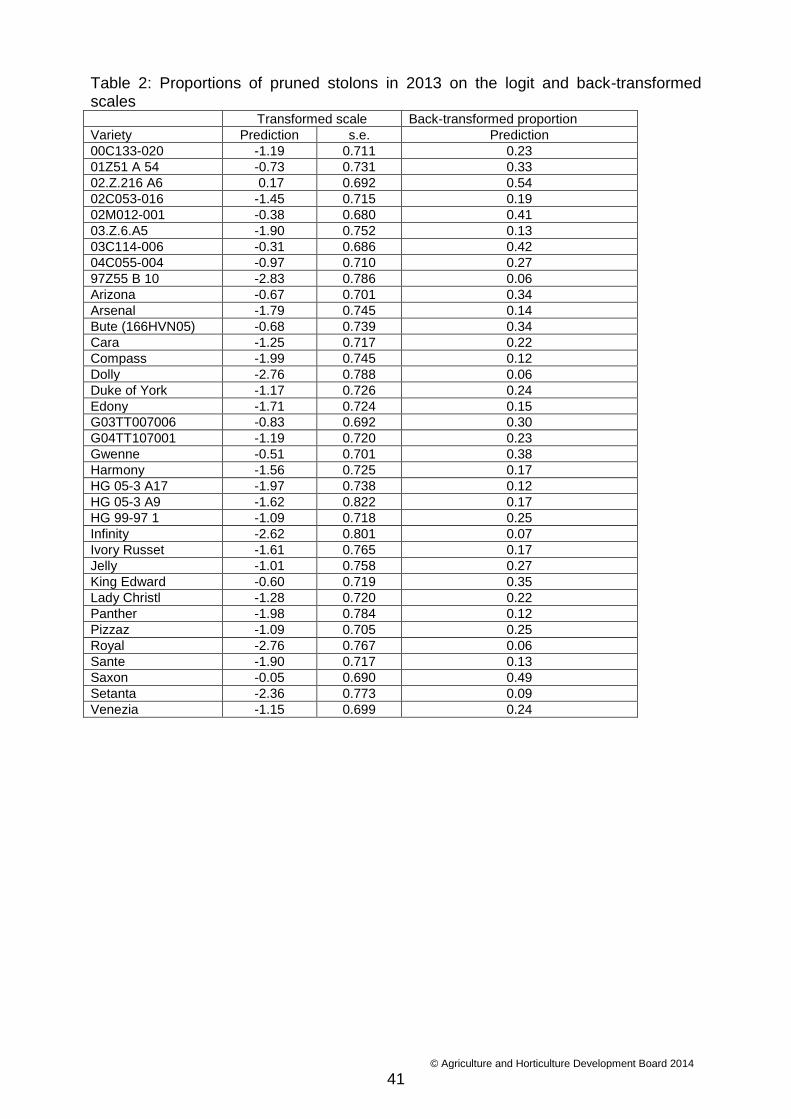
both with a binomial error structure and the logit link function. This approach reflects the binomial nature of the response variable and also takes into account that there are more stolons in some pots than others, which impacts on precision. For the over-years’ analysis of the percentage of infected stolons, numbers of infected stolons and total numbers of stolons were cross-tabulated by variety and year. From this a varieties x years table of percentages of infected stolons was derived. This table was angular-transformed and varieties compared by analysis of variance. The approach of calculating percentages at the variety X year level initially instead of at the individual pot level was simply because of the variation in the total number of stolons in each pot, which was very low indeed in some cases. Results Stem and stolon canker percentage severity data from 2013 are shown in Table 1. There was very strong statistical evidence (P=0.002) of differences in stem canker severity between varieties and also some statistical evidence (P=0.017) for differences in stolon canker severity between varieties (see Table 1). The statistical analysis identified particularly high percentage stolon severity in King Edward in the first replicate relative to the remaining replicates. There was hardly any statistical evidence (P=0.105) of a difference in the proportions of pruned stolons between varieties in 2013 (see Table 2). The range of standard errors of difference for comparisons between varieties on the logit transformed scale was (0.841 – 1.043).

© Agriculture and Horticulture Development Board 2014
40
Table 1: Stem and stolon canker in 2013 on the original untransformed and angular transformed scales.
Stem severity % Stolon severity %
Variety Untransf Ang transf Untransf Ang transf
00C133-020 27.5 26.5 9.2 16.9
01Z51 A 54 32.5 32.6 17.1 21.0
02.Z.216 A6 33.7 32.8 18.8 24.9
02C053-016 26.7 24.3 13.7 18.8
02M012-001 17.1 21.0 11.2 18.8
03.Z.6.A5 20.0 25.1 6.2 12.7
03C114-006 32.5 32.6 18.7 24.9
04C055-004 55.8 48.2 13.7 18.8
97Z55 B 10 1.7 4.3 2.5 6.5
Arizona 25.8 24.7 17.9 23.2
Arsenal 29.6 28.4 5.4 10.6
Bute (166HVN05) 37.1 34.5 9.6 14.9
Cara 25.8 22.2 11.2 18.8
Compass 15.4 14.1 3.3 8.6
Dolly 10.0 12.6 2.5 6.5
Duke of York 20.0 22.6 6.2 12.7
Edony 19.6 21.0 7.1 14.9
G03TT007006 35.8 34.7 15.8 21.2
G04TT107001 51.7 44.3 18.3 20.8
Gwenne 24.2 26.9 11.7 16.9
Harmony 25.8 22.2 10.8 14.7
HG 05-3 A17 20.4 20.6 4.2 10.8
HG 05-3 A9 2.5 6.5 5.4 10.6
HG 99-97 1 22.5 22.6 10.8 14.7
Infinity 1.7 4.3 1.7 4.3
Ivory Russet 7.9 10.6 10.0 12.6
Jelly 26.7 24.3 10.8 14.7
King Edward 41.2 36.3 19.2 20.4
Lady Christl 46.7 40.4 13.7 18.8
Panther 20.4 20.6 5.4 10.6
Pizzaz 9.2 10.4 8.7 12.8
Royal 13.3 12.2 5.4 10.6
Sante 21.7 20.4 7.5 12.6
Saxon 53.7 46.3 18.7 24.9
Setanta 3.3 8.6 3.3 8.6
Venezia 37.5 32.6 13.7 18.8
SED 11.43 6.02
LSD (5%) 22.56 11.88
P value 0.002 0.017
© Agriculture and Horticulture Development Board 2014
41
Table 2: Proportions of pruned stolons in 2013 on the logit and back-transformed scales Transformed scale Back-transformed proportion
Variety Prediction s.e. Prediction
00C133-020 -1.19 0.711 0.23
01Z51 A 54 -0.73 0.731 0.33
02.Z.216 A6 0.17 0.692 0.54
02C053-016 -1.45 0.715 0.19
02M012-001 -0.38 0.680 0.41
03.Z.6.A5 -1.90 0.752 0.13
03C114-006 -0.31 0.686 0.42
04C055-004 -0.97 0.710 0.27
97Z55 B 10 -2.83 0.786 0.06
Arizona -0.67 0.701 0.34
Arsenal -1.79 0.745 0.14
Bute (166HVN05) -0.68 0.739 0.34
Cara -1.25 0.717 0.22
Compass -1.99 0.745 0.12
Dolly -2.76 0.788 0.06
Duke of York -1.17 0.726 0.24
Edony -1.71 0.724 0.15
G03TT007006 -0.83 0.692 0.30
G04TT107001 -1.19 0.720 0.23
Gwenne -0.51 0.701 0.38
Harmony -1.56 0.725 0.17
HG 05-3 A17 -1.97 0.738 0.12
HG 05-3 A9 -1.62 0.822 0.17
HG 99-97 1 -1.09 0.718 0.25
Infinity -2.62 0.801 0.07
Ivory Russet -1.61 0.765 0.17
Jelly -1.01 0.758 0.27
King Edward -0.60 0.719 0.35
Lady Christl -1.28 0.720 0.22
Panther -1.98 0.784 0.12
Pizzaz -1.09 0.705 0.25
Royal -2.76 0.767 0.06
Sante -1.90 0.717 0.13
Saxon -0.05 0.690 0.49
Setanta -2.36 0.773 0.09
Venezia -1.15 0.699 0.24

© Agriculture and Horticulture Development Board 2014
42
Table 3 summaries the results from the combined analysis of data from 2012 and 2013 for stem canker and stolon canker severity. For both stem and stolon there was no statistical evidence of differences between varieties in severity. While there were large differences in the means (particularly for stem canker) the associated least significant differences (5% level) were large, leading to low statistical power. Table 3: Over-years analysis of angular transformed stem and stolon canker severities
Variety Ang stem% Ang Stolon %
00C133-020 25.4 10.6
02.Z.216 A6 27.0 18.9
02C053-016 22.6 13.7
03.Z.6.A5 16.9 8.5
03C114-006 24.7 18.9
Arizona 24.5 11.6
Bute (166HVN05) 25.7 13.7
Cara 23.2 15.7
Compass 23.4 10.6
Duke of York 25.6 12.6
G03TT007006 39.5 16.9
Harmony 13.2 9.5
Infinity 6.3 4.3
Jelly 28.4 13.8
King Edward 36.4 20.6
Lady Christl 40.6 19.8
Panther 18.7 11.6
Royal 22.4 11.8
Sante 24.3 10.6
Saxon 29.4 18.7
Setanta 12.6 6.5
SED 9.33 4.85
LSD (5%) 19.45 10.12
P value 0.155 0.118
Percentage canker severity variety means computed on the original scale are presented for 2013 against 2012 in separate figures below for stem canker and stolon canker respectively. No clear consistent relationships between the two years’ results were evident.
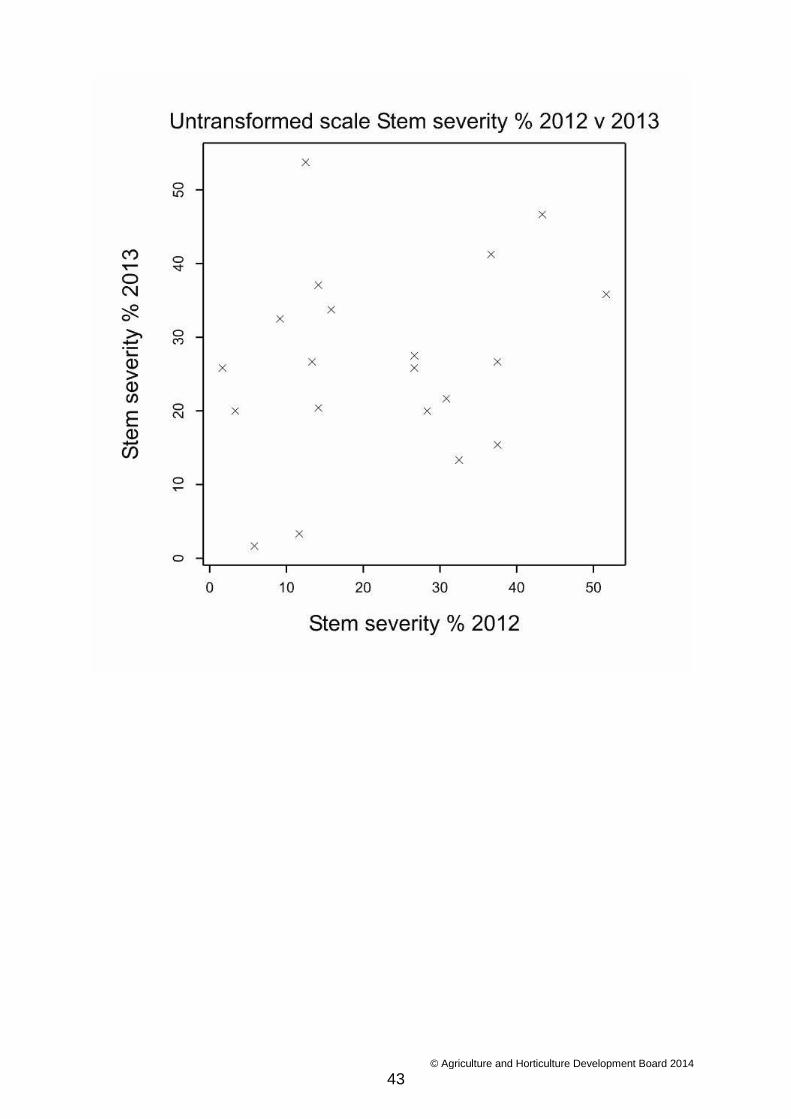
© Agriculture and Horticulture Development Board 2014
43

© Agriculture and Horticulture Development Board 2014
44
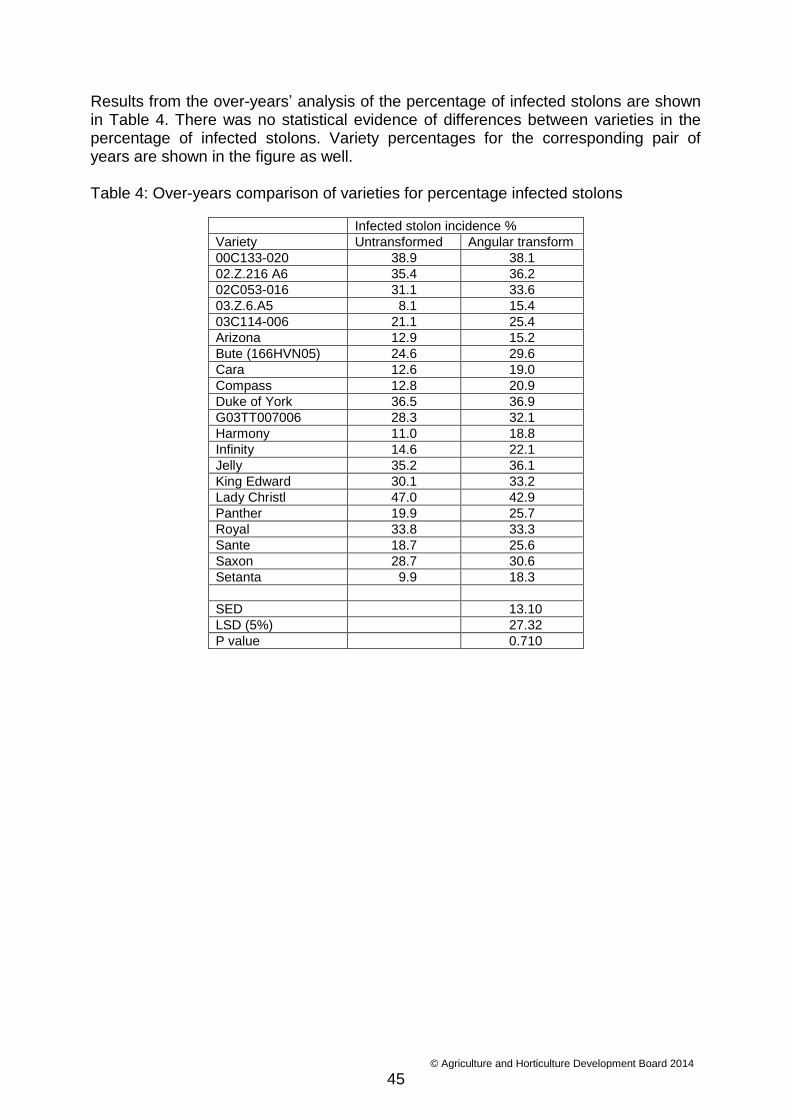
© Agriculture and Horticulture Development Board 2014
45
Results from the over-years’ analysis of the percentage of infected stolons are shown in Table 4. There was no statistical evidence of differences between varieties in the percentage of infected stolons. Variety percentages for the corresponding pair of years are shown in the figure as well.
Table 4: Over-years comparison of varieties for percentage infected stolons
Infected stolon incidence %
Variety Untransformed Angular transform
00C133-020 38.9 38.1
02.Z.216 A6 35.4 36.2
02C053-016 31.1 33.6
03.Z.6.A5 8.1 15.4
03C114-006 21.1 25.4
Arizona 12.9 15.2
Bute (166HVN05) 24.6 29.6
Cara 12.6 19.0
Compass 12.8 20.9
Duke of York 36.5 36.9
G03TT007006 28.3 32.1
Harmony 11.0 18.8
Infinity 14.6 22.1
Jelly 35.2 36.1
King Edward 30.1 33.2
Lady Christl 47.0 42.9
Panther 19.9 25.7
Royal 33.8 33.3
Sante 18.7 25.6
Saxon 28.7 30.6
Setanta 9.9 18.3
SED 13.10
LSD (5%) 27.32
P value 0.710

© Agriculture and Horticulture Development Board 2014
46
The total numbers of stolons shown in Table 5 is inevitably lower in 2012 than 2013 as only three of the six replicates were assessed at week 4 in 2012 but all six replicates were assessed at this point in 2013. However, some of the total numbers in 2012 are not particularly large and the variation in numbers of stolons between pots was considerable, with very low numbers of stolons in some pots over the two years. A threshold for the minimum number of stolons required for pot inclusion perhaps should be considered.
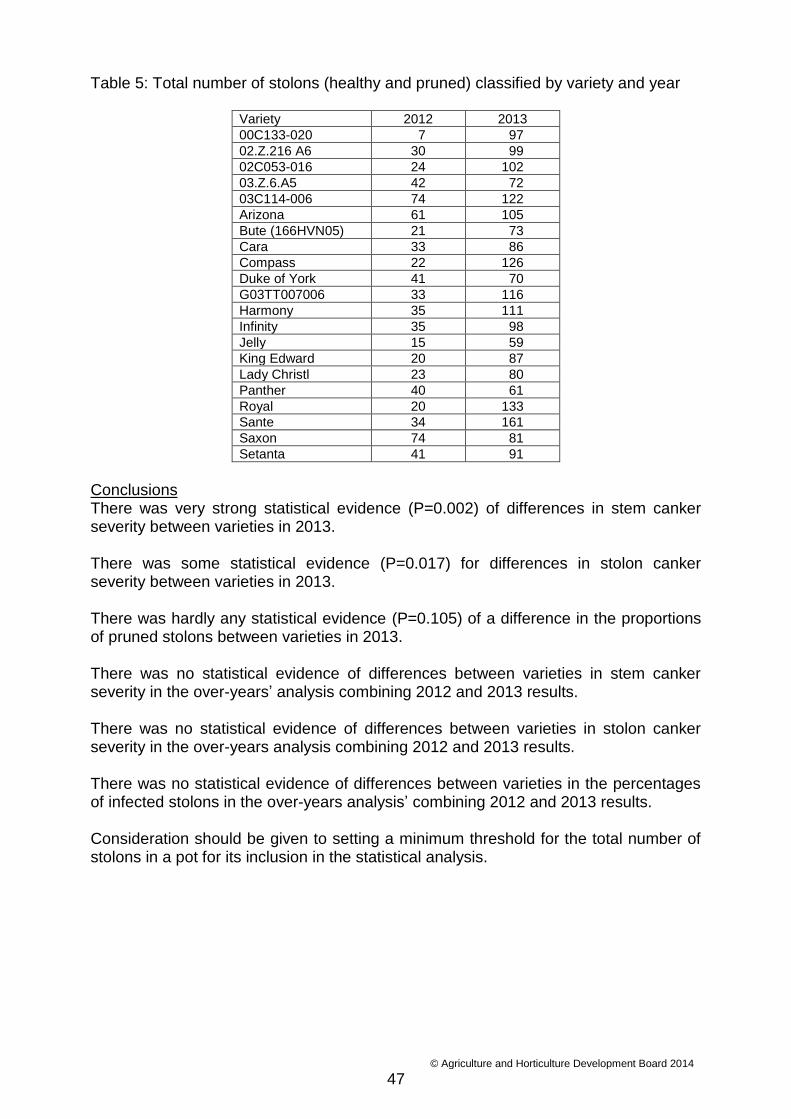
© Agriculture and Horticulture Development Board 2014
47
Table 5: Total number of stolons (healthy and pruned) classified by variety and year
Variety 2012 2013
00C133-020 7 97
02.Z.216 A6 30 99
02C053-016 24 102
03.Z.6.A5 42 72
03C114-006 74 122
Arizona 61 105
Bute (166HVN05) 21 73
Cara 33 86
Compass 22 126
Duke of York 41 70
G03TT007006 33 116
Harmony 35 111
Infinity 35 98
Jelly 15 59
King Edward 20 87
Lady Christl 23 80
Panther 40 61
Royal 20 133
Sante 34 161
Saxon 74 81
Setanta 41 91
Conclusions There was very strong statistical evidence (P=0.002) of differences in stem canker severity between varieties in 2013. There was some statistical evidence (P=0.017) for differences in stolon canker severity between varieties in 2013. There was hardly any statistical evidence (P=0.105) of a difference in the proportions of pruned stolons between varieties in 2013. There was no statistical evidence of differences between varieties in stem canker severity in the over-years’ analysis combining 2012 and 2013 results. There was no statistical evidence of differences between varieties in stolon canker severity in the over-years analysis combining 2012 and 2013 results. There was no statistical evidence of differences between varieties in the percentages of infected stolons in the over-years analysis’ combining 2012 and 2013 results. Consideration should be given to setting a minimum threshold for the total number of stolons in a pot for its inclusion in the statistical analysis.

© Agriculture and Horticulture Development Board 2014
48
7.2. Statistical Analysis of 2013 Dickeya experiment
Experimental Design and Data
Randomised complete block design with three replicates.
Four pots per replicate.
Each pot was scored on an integer scale from 1 to 5 so that: 1 Healthy
2 necrotic/chlorotic
3 basal stem rot
4 on its way out/blackleg
5 Dead
Six weekly assessments between 3 July and 8 August.
The treatments were set as a factorial, with 11 varieties x 2 levels of inoculum.
Follows a similar experiment in 2012 – that had three inoculum levels.
Statistical method Plant assessments The response data was ordinal. It was noted that scores of 3 on the 1 to 5 scale were very scarce. Missing pots were treated as 5 (dead) since this seemed to be related to the concentration of inoculum (0% missing pots for 103, 3.8% for 107).
There are specific methods for this type of data. However these would be complex, especially given that the scores were at the pot within plot level and that the methods are typically dependent on strongish assumptions. Instead I (Adrian Roberts, BioSS) decided to take a pragmatic approach by taking the mean scores for each plot and then applying analysis of variance to these, perhaps with an appropriate transformation. In fact I found that the residuals were reasonably behaved for the assessments between 17 July and 1 August. At other times, the residuals were clearly affected by the constrained scale.
Results Plant assessments The analysis of variance results are summarised in Table 1, showing the variance ratios and p-values for the treatments.
Table 1: Analysis of variance results for plant scores
3 July 10 July 17 July 24 July 1 August 8 August
Effect VR p-val VR p- val VR p- val VR p- val VR p- val VR p- val
Variety 1.65 0.125 1.45 0.194 2.6 0.015 2.78 0.010 2.5 0.018 2.68 0.012
Inoculum 2.78 0.103 2.55 0.118 4.51 0.040 4.41 0.042 11.53 0.002 11.58 0.001
Interaction 0.49 0.886 0.46 0.903 0.57 0.831 0.54 0.851 1.15 0.353 0.94 0.509
This shows smaller differences between the concentrations of inoculum over the experiment than in 2012 but increasing over time (Figure 1) (Note that the middle concentration was not included this time). Levels of disease did not quite reach the levels seen in 2012. In later evaluations there was also some evidence that the varieties differed in their performance. There was no evidence for an interaction between variety and inoculum level. In Figure 2, the mean scores are showed for the last assessment date.
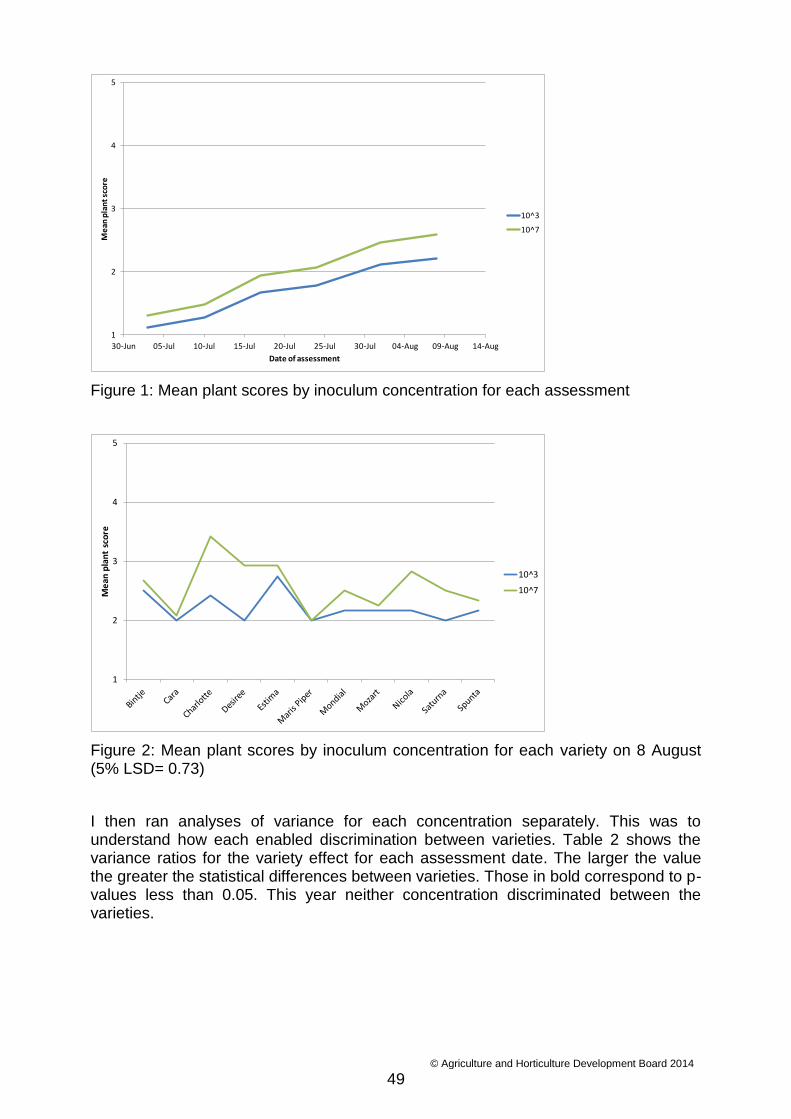
© Agriculture and Horticulture Development Board 2014
49
Figure 1: Mean plant scores by inoculum concentration for each assessment
Figure 2: Mean plant scores by inoculum concentration for each variety on 8 August (5% LSD= 0.73)
I then ran analyses of variance for each concentration separately. This was to understand how each enabled discrimination between varieties. Table 2 shows the variance ratios for the variety effect for each assessment date. The larger the value the greater the statistical differences between varieties. Those in bold correspond to p-values less than 0.05. This year neither concentration discriminated between the varieties.
1
2
3
4
5
30-Jun 05-Jul 10-Jul 15-Jul 20-Jul 25-Jul 30-Jul 04-Aug 09-Aug 14-Aug
Me
an p
lan
t sc
ore
Date of assessment
10^3
10^7
1
2
3
4
5
Me
an p
lan
t sc
ore
10^3
10^7
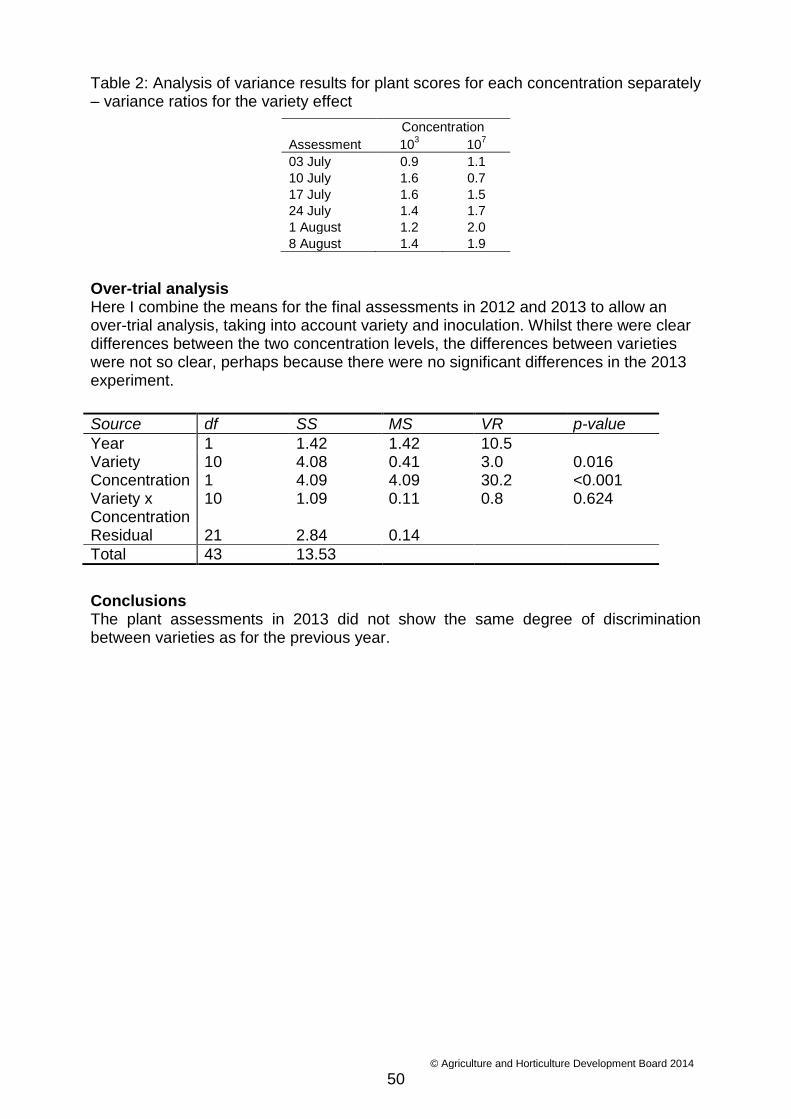
© Agriculture and Horticulture Development Board 2014
50
Table 2: Analysis of variance results for plant scores for each concentration separately – variance ratios for the variety effect
Concentration
Assessment 103 10
7
03 July 0.9 1.1
10 July 1.6 0.7
17 July 1.6 1.5
24 July 1.4 1.7
1 August 1.2 2.0
8 August 1.4 1.9
Over-trial analysis Here I combine the means for the final assessments in 2012 and 2013 to allow an over-trial analysis, taking into account variety and inoculation. Whilst there were clear differences between the two concentration levels, the differences between varieties were not so clear, perhaps because there were no significant differences in the 2013 experiment.
Source df SS MS VR p-value
Year 1 1.42 1.42 10.5 Variety 10 4.08 0.41 3.0 0.016 Concentration 1 4.09 4.09 30.2 <0.001 Variety x Concentration
10 1.09 0.11 0.8 0.624
Residual 21 2.84 0.14
Total 43 13.53
Conclusions The plant assessments in 2013 did not show the same degree of discrimination between varieties as for the previous year.