Independent Transport Safety Regulator ISBN: 978 0 … · Collecting and analysing SPAD summary...
55
-
Upload
nguyendien -
Category
Documents
-
view
215 -
download
0
Transcript of Independent Transport Safety Regulator ISBN: 978 0 … · Collecting and analysing SPAD summary...

CONTACT DETAILS
Independent Transport Safety Regulator
Level 22, 201 Elizabeth Street, Sydney NSW 2000
ISBN: 978 0 9807285 6 9
June 2011
Phone: 02 8263 7100
Fax: 02 8263 7200
Email: [email protected]
Web: www.transportregulator.nsw.gov.au
© Independent Transport Safety Regulator 2011
This material may be reproduced in whole or in part, provided
the meaning is unchanged and the source is acknowledged.
DISCLAIMER
The Independent Transport Safety Regulator (ITSR) has made
all reasonable efforts to ensure that the contents of this
document are factual and free of error, omission or inaccurate
information. ITSR shall not be liable for any damage or loss that
may occur in relation to any person taking or not taking action
on the basis of this document.

Contents
1 Introduction 1
1.1 The importance of signals passed at danger (SPAD) management 1
1.1.1 Aims of this information paper 1
1.2 Preliminary explanation of concepts 2
1.2.1 What is a SPAD? 2
1.2.2 Types of SPADs 4
1.2.3 Why do SPADs occur? 5
1.2.4 Errors and violations - unsafe acts 6
1.2.5 Work environment/operational factors - unsafe conditions 7
1.2.6 Individual/personal factors 7
1.2.7 Organisational factors 8
1.2.8 Continuous improvement cycle 9
2 Data collection and investigation processes 10
2.1 Investigating crew/train performance SPADs 12
2.1.1 Investigation – rolling stock operator 13
2.1.2 Investigation – rail infrastructure manager 14
2.1.3 Investigating fatigue factors 14
2.2 SPAD categorisation 18
2.2.1 Categorisation of crew/train performance SPADs 18
2.2.2 The UK SPAD severity index 19
2.2.3 UK SPAD risk categorisation 20
2.2.4 Hybrid SPAD severity/risk ranking categorisation scheme 21
2.2.5 SPAD precursor classification 22
2.2.6 Conclusions on SPAD categorisation 23
3 Data analysis 24
3.1 SPAD severity 24
3.2 Multi-SPAD signals 25
3.2.1 Multi-SPAD signals on the NSW network 26
3.2.2 Multi-SPAD drivers (drivers with more than one SPAD incident) 31
3.2.3 Freight versus passenger train driver SPADs 32
3.3 Analysis of work scheduling and time of day factors 33
3.3.1 Work schedules and risk of SPADs 34
3.3.2 Analysis of human factors data 40
3.3.3 Age factors 41
3.3.4 Driver experience 42
3.3.5 Human error 42

4 Mitigation of identified SPAD problems 44
4.1 Mitigation measures linked to investigation tools 44
4.2 Areas of operational management to target 46
4.2.1 Behaviour and performance management of safety critical staff 46
4.2.2 Managing the working environment 48
4.2.3 Route design and management 48
4.3 Implementing and evaluating strategies 50
4.4 Getting the message out on SPAD management 50
Appendices
A Initial SPAD data collection tool for rail infrastructure managers – tool A
B SPAD data collection tool for rolling stock operators – tool B
C Mitigation measures for tool B – rolling stock operators
D SPAD data collection tool for rail infrastructure managers – tool C
E Mitigation measures for tool C – rail infrastructure managers
F UK SPAD risk ranking tool

PAGE 1
1 Introduction
1.1 The importance of signals passed at danger (SPAD) management
Train drivers pass many tens of thousands of signals every year uneventfully. In a very small
percentage of cases, a signal passed at danger (SPAD) event may occur. In many of these instances,
there are other protections for the train. Only a small percentage of SPADs result in a serious accident
such as a collision or derailment.
Investigation of SPADs and analysis of SPAD data can be a powerful way of diagnosing weaknesses
in the safety system that, if left untreated or not managed, could lead to serious accidents. Because of
this, SPADs can be categorised as precursor events as they may indicate undetected or unassessed
safety risk and more serious incidents to come.
The reasons why SPADs occur are complex. Few occur because of a single error or deliberate action
by the driver. Most SPADs occur as the result of a combination of operational factors, environmental
conditions and factors associated with human performance. This involves multiple aspects of rail
operations such as infrastructure, train performance, crew performance and signaller performance.
Therefore, initiatives to reduce SPADs need to be wide ranging, taking into account many parts of a
railway organisation and, often, action by more than one railway operator.
Effective investigation and management systems for SPADs that involve all relevant systems and
parties should help improve an organisation’s safety management system (SMS) as well as enhance
reliability, safety and efficiency of the overall rail network.
Collecting and analysing SPAD summary statistics over time is important for tracking trends in safety
performance where there is sufficient data for the analysis to be meaningful. Additionally, high-quality
investigations can yield important insights that are not necessarily revealed by the data analysis
approach.
Thus, the adoption of two complementary and equally important approaches - investigation and
data analysis - is critical for establishing truly effective SPAD management.
1.1.1 Aims of this information paper
The approach to SPAD data collection, investigation and management differs greatly for rail transport
operators (RTOs) across Australia and even within NSW. In recognising that a degree of consistency
and improved data collection would be desirable, this information has been prepared to outline better
practices used by some NSW RTOs and the UK overland rail network.
PAGE 2
ITSR has previously published an information paper on SPAD management in 2009. Management of
signals passed at danger contains additional data on SPAD performance in NSW and enhanced
materials on investigation of organisational fatigue factors and their relevance to SPADs.
The concept of an information paper was generated from an international review of railway safety
practices, including SPAD management, which was commissioned by the Independent Transport
Safety Regulator (ITSR) in 20081. This review identified successful initiatives in SPAD management in
the UK whereby railway organisations work together in SPAD reduction and mitigation groups2. The
collaborative approach was said to lead to much greater understanding of the human factor causes of
SPADs, particularly interaction between driver error and poor infrastructure. The resultant actions
taken by the groups were considered to be the key to improving SPAD performance.
The approaches discussed and checklists presented in this paper represent ideas for potential
adoption or customisation to local conditions and needs. Some aspects may be valuable for some
organisations, while others will have limited applicability. While greater consistency in investigation
and collection of data is important, the SPAD management process needs to be tailored to reflect the
insights yielded from data as well as the equipment, operating environment and culture of each railway
organisation.
ITSR acknowledges the work undertaken by the United Kingdom Rail Safety and Standards Board
(UKRSSB) that is cited extensively in this paper.
A range of examples of practical tools appear in the appendices. These include generic checklists
developed in conjunction with rail organisations in the UK and Australia.
This paper has also drawn from information on SPADs from the UK website OPSWEB
(http://www.opsweb.co.uk). OPSWEB contains content submitted by a wide range of rail industry
organisations including railway operators, safety organisations and regulatory bodies. The website
content is reviewed by an editorial group comprised of operational experts.
RTOs need to understand that this is intended to be an informative document and must be used in the
context of the specific SPAD risks of each RTO’s operating environment.
1.2 Preliminary explanation of concepts
1.2.1 What is a SPAD?
The definition of a SPAD under the current Guideline for the reporting of notifiable occurrences:
Occurrence notification standard one (ON-S1) is where a train passes without authority a signal
displaying a stop indication or stop aspect.
1 Lloyds Register, International review of railway safety practices, Independent Transport Safety Regulator, 2008
2 Further information can be found at http://www.opsweb.co.uk

PAGE 3
In order to understand how SPADs occur, it is necessary to look at the operational environment of
trains driving to wayside signalling systems. An illustration of the spacing of signals and how they
accommodate the different braking performance of various trains for NSW is shown in Figure 1.1
Figure 1.1 - Signal spacing and train braking performance
In Figure 1.1, the green over green aspect provides the driver of the train on the left the authority to
proceed into the next block. The two sets of double red signals are protecting the train on the right with
an overlap until it passes the clearance point. The green over yellow signal is the medium aspect
indicating more restrictive signals ahead and green over red is the caution aspect indicating a stop
signal ahead.
The signals are spaced so that all types of trains can be safely brought to a stop once a medium
aspect (green over yellow) is sighted. A heavily-loaded freight train (the green curve) may need over a
kilometre to stop, so its driver needs to start braking at the point of reaching a medium signal (green
over yellow aspect) so it can safely stop at the stop signal (red over red). A lighter train, such as a
commuter train (the blue curve), can delay braking until it is closer to a caution aspect (green over
red). This relationship between signal spacing and the braking performance of the train means drivers
require comprehensive, lengthy training to build up their knowledge of the gradients, likely adhesion
levels between train and track, and braking characteristics of the trains they operate.
Misjudgement or misunderstanding of these factors can lead to the driver braking too late and
subsequently overshooting the stop (red over red) signal. Likewise, if the driver fails to observe the
information provided by signals or fails to observe the information correctly they may also pass the
stop (red over red) signal. Since this signal is at stop because the train in front has yet to pass the
overlap clearance point, the signal has been passed at danger.

PAGE 4
1.2.2 Types of SPADs
There are a variety of different types of SPADs due to the variety of circumstances that can lead to
SPADs. Understanding SPADs by general types is an important starting point for SPAD management.
It is common practice to categorise and separate SPADs at a high level according to the nature of how
the SPAD occurred, such as:
crew/train performance SPAD
returned in face of driver (RIFOD) SPAD
runaway SPAD.
Crew/train performance SPAD
The most frequent type of SPAD is where driver error occurs in reading the information displayed by
signals or misjudging when to brake. Factors such as infrastructure design, and operational and
environmental conditions often contribute to these errors. This type of SPAD can also involve train
braking equipment not performing when required or as well as expected. For the purpose of this
information paper, such SPADs are referred to as crew/train performance SPADs (termed Category A
SPADs in the UK). Within this category of SPAD are further subcategories such as starting against
signal SPADs (SASSPADs).
Crew/train performance SPADs have a greater potential to lead to a high consequence derailment or
collision than RIFOD SPADs (defined below). SPAD management strategies discussed in the
following sections focus on crew/train performance SPADs in order to address the area of
highest risk.
Returned in face of driver SPAD
Another type of SPAD with a completely different range of causes is referred to in this information
paper as a RIFOD SPAD. In this case, the train approaches a signal with a clear authority to proceed
but the signal returns to stop at distance where the train could not possibly stop. In many cases,
although the train passes a red signal, it does not pass it at danger, as the route for the train was
already set and the path ahead of it was clear of conflicting movements.
There are, however, cases where the track has become suddenly obstructed or broken and the signal
is passed at danger. RIFODs may occur for a number of reasons including:
track circuit failures
loss of points detection

PAGE 5
signal electricians conducting maintenance in relay huts disturbing signal components such as
circuit cards, fuses, relays, etc., which causes them to fail safe (that is, return to red)
electricians switching power off at substations to allow maintenance works or power
supply failures
signaller error (incorrectly reset signal previously not at stop)
signaller returns signal to stop as a safety measure, to prevent trains entering a particular
area of track where there may be an emergency situation ahead.
Although the safety risk from RIFODs is typically low, they still cause train drivers much concern. As
emergency braking is required, drivers will not be sure as to why the signal has returned to stop and
whether or not there may be an emergency situation ahead, such as a broken rail. These types of
incidents still require investigation to find the underlying causes and determine what can be done to
reduce RIFODs. Corrective action may include improved maintenance procedures in signal relay huts
and electrical substations.
Runaway SPAD
There is potential for an un-crewed train or uncoupled rolling stock to run away and pass a signal at
danger. In this paper, this type of SPAD is differentiated from other SPADs because quite different
errors and circumstances are involved. Where a crew/train performance type SPAD may be brought
under control by signallers radioing the train crew, the runaway SPAD is harder to control and
mitigate.
The following sections are devoted to management of crew/train performance SPADs as these
present a higher risk to railway operations.
1.2.3 Why do SPADs occur?
SPADs can rarely be attributed to a single cause and are better understood by looking at the full range
of possible contributing factors. In general, a SPAD can occur because someone (a driver, signaller or
controller) made an error or violation, or because of a technical deficiency associated with rolling stock
or infrastructure. These are sometimes referred to as immediate causes because they are the trigger
for the SPAD.
In many cases, the immediate causes provide a description of what happened but do not provide an
explanation for why the SPAD occurred. To do this, it is necessary to look at a broad range of
contributing factors which often increase the risk of human errors.

PAGE 6
1.2.4 Errors and violations – unsafe acts
Errors and violations are unsafe acts by train crew that may lead directly or indirectly to a
SPAD including:
beginning to brake a train too close to a signal
incorrect braking technique
failing to react to cautionary aspects
failing to communicate correctly
using a train radio or mobile phone when running up to a signal at danger
acting on an expectation that the signal will clear
distraction from external or internal factors
misreading the signal aspect
referencing the wrong signal
accepting a right of way from a guard without looking at the signal
reading through to a subsequent signal.
Some current procedures used by RTOs to investigate SPADs stop at this point. This has an outcome
of focusing corrective action - such as counselling, disciplinary procedures, deduction of points, re-
training - predominantly on the driver. While these processes may be important components of a
SPAD management process, many of the underlying factors that contributed to the SPAD may remain
undetected and therefore unchanged.
In order to manage SPADs effectively, it is essential to also identify and address those factors that
impair human performance and make driver error more likely. It is also necessary to understand
organisational factors that contribute to violations such as a poor safety culture, poorly designed
procedures and inadequate monitoring or supervision.
Some of the reasons that workers violate include:
rules lacking in appropriateness
relevance and practicality
operational pressure and prevailing culture

PAGE 7
unusual circumstances
routine shortcuts
ineffective supervision.
Commonly cited factors3 which impair human performance and have been found to contribute to
SPADs are listed in the following sections.
1.2.5 Work environment/operational factors – unsafe conditions
An unsafe condition occurs where a particular factor associated with the operating environment has a
negative impact on human performance and therefore may be a major contributor to a SPAD incident.
Examples of unsafe conditions include:
signal/sign attributes such as size, contrast, shape, border, back plate, signal lens dirty, near
signals dimmer then far signals
signal location such as behind a bend, directly after tunnel, over crest of hill
equipment interface and workplace layout such as cab design, layout and design of controls
and displays
infrastructure features and track layout such as bridge/building obstruction, complex junction,
complex or cluttered background, curve, overhead line equipment obstruction, parallel lines,
significant change in gradient, stanchion or station furniture obstruction, trees and foliage
obstruction, tunnels
ambient environment such as temperature, noise, vibration, ventilation
time of day/month of year
weather conditions such as wind, fog, sun glare, rain, sleet and snow.
1.2.6 Individual/personal factors
Individual/personal factors refer to a physical or cognitive condition of a person which increases the
likelihood of error. Those factors include:
alcohol/drugs
fatigue/alertness
health-related condition
physical limitations
3 Adapted from those factors listed by UK OPSWEB http://www.opsweb.co.uk/TOOLS/common-factors/PAGES/intro_faq.html
PAGE 8
motivation/attitude
preoccupation
stress/anxiety
experience and route knowledge
expectations and habituation.
1.2.7 Organisational factors
Organisational factors are a range of conditions associated with business and operational systems that
may impact on working conditions and workforce performance. They often occur further back in time
from the actual SPAD event, and are usually only identified in systemic investigations. Examples include:
safety/risk management (how SPAD risk is controlled and integrated within the overall SMS)
monitoring and review processes
ongoing competence assurance
task demands/workload (underload or overload)
adequacy of rules, procedures and standards
design (driver’s cab, new equipment, infrastructure, train control systems, etc.)
workforce management (shiftwork system, teamwork, supervision, staff support etc.)
training and selection
communication/dissemination
safety culture
maintenance and asset management
executive safety leadership.
Many of the contributing factors presented above and their relationship to SPAD performance are
discussed further at http://www.opsweb.co.uk under SPAD management tools - Common factors in
SPADs. (http://www.opsweb.co.uk/tools/common-factors/PAGES/QA.aspx).

PAGE 9
Contemporary models of accident and incident analysis allow categorisation of contributing factors
within a systemic framework. The Australian Rail Safety Regulators’ Panel developed a simple
framework to provide guidance to investigators on how to code systemic factors contributing to rail
safety occurrences.
Information on the Contributing Factors Framework and a copy of the manual can be downloaded
from http://www.transportregulator.nsw.gov.au.
1.2.8 Continuous improvement cycle
SPAD management follows the concept of continuous improvement common to many management
systems such as the ISO 9000 standards series for quality management.
This improvement cycle applied to SPAD management in its basic form is presented as Figure 1.2.
The improvement cycle closely adheres to the ‘measure in order to manage’ concept that emphasises
the importance of ongoing data collection and analysis.
Figure 1.2 - SPAD management continuous improvement cycle
This information paper discusses in detail what is occurring at each of these stages of the cycle in the
following sections. Data analysis is integral to this approach and strategies are formed on the basis of
what the data is revealing.

PAGE 10
2 Data collection and investigation processes
This section discusses what processes
can be used to collect and categorise
SPAD data.
Effective SPAD management is data
driven, as data is used to guide
decisions, monitor performance and
reduce uncertainty4.
All SPADs require an initial information gathering process to determine the basic facts of what
happened and allow a coarse sorting of the type of SPAD that has occurred. This initial sorting of
SPAD type allows different investigative processes to be undertaken relevant to the type of SPAD.
This is illustrated in Figure 2.1.
Figure 2.1 - SPAD types and associated investigative processes
4 OPSWEB, Good practice guide, UK

PAGE 11
The type of general information that needs to be captured on the day of the event includes, but is not
limited to, the following:
Details of the SPAD incident
date of incident
time of incident
location of SPAD
line
identity of signal passed
type of signalling/safeworking system
train run number
distance passed
injuries
damage
initial delay/cumulative delay.
Details of the rolling stock involved in the SPAD incident
operator
train type (passenger/freight EMU, DMU, locomotive hauled)
load and length of train
number of locomotives
whether a trip valve is fitted to the train
whether a form of automatic train protection is fitted
results of brake tests.
Basic driver details
driver name
employer name
depot at which the driver is based
alcohol/drug test results.

PAGE 12
A sample tool that captures more detailed information about the circumstances of the SPAD, and
helps to determine the type of SPAD, is presented in Appendix A.
2.1 Investigating crew/train performance SPADs
Crew/train performance SPADs can rarely be attributed to one single cause. They are usually the
result of a combination of human, technical, organisational and environmental factors, such as errors
by the driver, factors associated with infrastructure design, poor performance of train systems as well
as weather or unclear procedures.
Sound SPAD investigation provides information about errors, contributing factors and surrounding
conditions as well as possible recovery strategies. A study that reviewed the quality of SPAD
investigations across the UK was undertaken by the UKRSSB predecessor, Railway Safety5. This
study included a review of all SPAD investigation reports and resulted in the development of good
practice guidance for SPAD investigations. The main findings of the review were that:
SPAD investigations have played a valuable role in reducing the occurrence of SPADs
despite examples of good practice, there is a wide variation in the quality, and hence the
value, of individual investigations
there is evidence to suggest that more serious SPADs should be investigated independently
competence levels should be established for investigating teams and panels, especially in their
understanding of human factors
a shortage of signal-sighting experts is preventing full investigation of some SPADs
the benefits of the SPAD risk-ranking methodology should be reinforced.
To gain information (data) on these contributing factors, further investigation is required on both the
train-operating organisation side and the infrastructure management side. This is shown as Figure 2.2.
5 Railway Safety, SPAD investigations special topic report, 2002, UK

PAGE 13
Figure 2.2 - Investigation processes for crew/train performance SPADs
2.1.1 Investigation – rolling stock operator
Once general data on the SPAD has been collected on the day of the event, further investigation into
driver-related, operational and organisational factors that may have contributed to the SPAD is
performed to gain data and understanding.
Appendix B contains a sample checklist that captures detailed information on:
driver factors associated with the driver’s history
driver factors associated with the driver’s physical and mental state
operational factors that may have affected driver performance such as:
unusual or unfamiliar circumstances
in-cab distractions
external distractions
driver’s view of signal obscured
effects on the driver’s perception of the signal
early assumptions made about the signal aspect
changes affecting driver braking behaviour or judgement
attending to the wrong visual cues as evidence that they could proceed.
PAGE 14
Correct use of the checklist requires an approach to the investigation by the rolling stock operator that
is based on the principles of just culture through interviews, corroboration of evidence, site
inspections, inspection of training records, and driver records. In this regard, it is important for the
driver to be aware that the investigation is looking broadly at potential impacts on performance.
2.1.2 Investigation – rail infrastructure manager
Once general data on the SPAD has been collected on the day of the event, further investigation into
infrastructure factors that may have contributed to the SPAD is performed by the rail infrastructure
manager to obtain further data and insights.
Appendix D contains a sample checklist for investigating infrastructure factors that captures detailed
information on:
factors associated with the design of the route
factors associated with the approach to the signal passed
factors associated with the signal itself
verifying information provided by the rolling stock operator.
As the focus of the investigation is the infrastructure, a key step is a site inspection of the signal
sighting and surrounding environment to detect factors impacting on human performance. Another
important step is checking the signal’s performance over time to determine if it is a multi-SPAD signal.
In the UK, Network Rail publishes information on multi-SPADed signals and multi-SPAD strategy on a
dedicated multi-SPAD website6 which provides information about the signal, why it has been passed at
danger, risk aspects, actions taken, further actions planned, etc. Information on multi-SPAD signals in
NSW is presented in section 3.2 of this paper. It is important to share the results of this part of the
investigation with the driver involved in the SPAD so that they are aware of any infrastructure factors
that may have contributed to the SPAD, as well as seeing that a wider process is happening to
investigate all potential contributing factors.
2.1.3 Investigating fatigue factors
At present, some rail operators note a biomathematical model output score in conjunction with SPAD
investigations and may overlook fatigue as an organisational factor if the work schedule score is within
company guidelines. However a biomathematical model output score that is based on average data is
not a valid indicator of fatigue in an individual, or that the work schedule allowed sufficient opportunity
for sleep. If investigators utilise a fatigue model, they should obtain confirmation that the particular
model output has been validated for investigation purposes, and understand what cautions apply in
interpreting results.
6 http://www.multispad.co.uk

PAGE 15
Investigating fatigue factors requires thorough examination of individual circumstances. This requires
a just culture approach and cooperation from the driver and any other worker whose actions may have
contributed to the incident or recovery. This should include detailed consideration of factors associated
with roster patterns, commute times, sleep patterns, sleep deficits, health and lifestyle issues. It should
also include factors during the shift that might influence alertness, including food and fluid intake, cab
environment, time since a break and workload. Where errors are made by signallers/network
controllers, examination of fatigue factors should extend to these roles.
Investigators should be aware of rostering dimensions that are thought to be associated with SPADs.
These are outlined in section 3.2.1 and include night hours, length of time on task (greater than 4.5
hours), consecutive shifts (greater than 6 hours), and single rest days. Although it is impossible to
avoid night work, schedules should endeavour to reduce the number of consecutive night shifts so far
as is reasonably practicable and ensure adequate recovery following it.
If workers report poor quality or quantity of sleep, it is important to investigate whether their sleeping
environment is optimum and that they have received training or information on fatigue management
and good sleep hygiene (habits). In addition, investigators should ascertain if there are procedures in
place to risk-manage fatigued drivers and encourage drivers to self-declare if they have not received
enough sleep.
NTSB fatigue investigation methodology
The United States National Transportation Safety Board (NTSB) has developed a methodology for
investigating fatigue in transportation accidents. The steps involved in the process are equally relevant
to analysis of close calls such as SPADs. A useful part of their methodology is that they propose use
of initial screening questions that can be used to determine if further analysis is needed.
The initial NTSB screening questions are as follows:
If any of the following is true, proceed with the detailed methodology:
does the operator’s 72-hour history suggest little sleep, or less sleep than usual?
did the accident occur during times of reduced alertness (such as 0300 to 0500)?
had the operator been awake for a long time at the time of the accident?
does the evidence suggest that the accident was a result of inaction or inattention on the part
of the operator?
The detailed NTSB methodology involves determining:
(a) If the operator was susceptible to fatigue, for example:
reduced sleep length

PAGE 16
fragmented/disturbed sleep
circadian factors
sleep disorders, health or drug issues
long time awake.
(b) If the operator’s performance contributed to the accident and their behaviour was consistent
with fatigue effects, for example:
attentional lapses or inappropriate attention strategy
slower reaction time
errors
impaired decision making
signs of fatigue/sleepiness.
A complete version of the NTSB fatigue investigation tool appears at
http://www.ntsb.gov/info/fatigue_checklist_V%202_0.pdf.
While the NTSB investigation tool provides a methodology for examining individual factors associated
with fatigue, it does not address investigation of failures in organisational SMS defences in relation to
fatigue.
Organisational model of fatigue
Reason7 developed a model to describe how an accident trajectory could pass through holes in layers
of organisational defences and safeguards. The model is commonly referred to as the Swiss cheese
model.
7 Reason, J, Managing the risk of organisational accidents, 1997, Ashgate Publishing Limited

PAGE 17
ITSR adapted the principles of the Reason model to demonstrate the organisational layers of defence for fatigue-related incidents. The ITSR model draws upon
earlier work of Dawson and McCulloch8. If initial screening questions such as those used by the NTSB suggest that fatigue may have played a role, the ITSR model
can be used to assist investigators to systematically identify failures in organisational defences to fatigue. The model appears in Figure 2.3.
8 Dawson, D & McCulloch, K, ‘Managing fatigue: It’s about sleep’, Sleep Medicine Reviews 9, 2005, pp 365-380
Figure 2.3 - Organisational model of fatigue

Page 18
2.2 SPAD categorisation
SPADs have a wide range of consequences, from the extreme of collisions and derailments, to
damage to infrastructure from events such as running through points. Others have relatively minor
consequences, such as overshooting a signal by a few metres, that may cause delays and lost
productivity.
There is a need to be able to distinguish the more severe SPADs from the less severe, in order to
better appreciate the underlying risks of SPADs (that is, higher rates of more serious SPADs are likely
to mean higher underlying risks).
2.2.1 Categorisation of crew/train performance SPADs
Due to the greater potential for accidents such as collisions and derailments, subcategories have been
developed for crew/train performance SPADs.
Australian classification systems
Australian rail regulators have produced ON-S1 and a guideline for classification of occurrences,
Guideline for the top event classification of notifiable ocurrences: Occurrence classification guideline
(OC-G1). ON-S1 clearly identifies a SPAD as a notifiable occurrence. Under ON-S1 and OC-G1
SPAD incidents are reported and categorised into five sub-classifications:
driver misjudged
completely missed while running
signal restored as train approached
starting against signal
other.
Crew/train performance SPADs are categorised by OC-G1 under the categories driver misjudged,
completely missed while running, and starting against signal. RIFOD-type SPADs are coded as signal
restored as train approached.
Coding to these categories is normally done on the basis of the overrun distance and the occurrence
description, but there are problems with this approach. Overrun distance does not account for the
influence of protective systems such as train stops, automatic train protection (ATP) and catch points.
For example, with train stops and ATP, a completely missed SPAD may occur with a relatively short
overrun leading to incorrect categorisation as driver misjudged.
Page 19
Another issue is that the current classification system does not cater for a common SPAD cause type
that occurs when a driver reads the wrong signal. It is unclear if this should be classified as completely
missed or another subcategory.
Due to the problems with the OC-G1 categories, a review commissioned by Transport Safety Victoria
(TSV) of national SPAD data classification9 recommended use of a severity-based approach such as
used in the UK. The TSV report noted that an earlier ATSB-commissioned report that reviewed
Australian rail-related data previously made the same recommendation. The authors of the TSV report
considered that a severity-based approach would increase capacity to develop more reliable
benchmarks within jurisdictions.
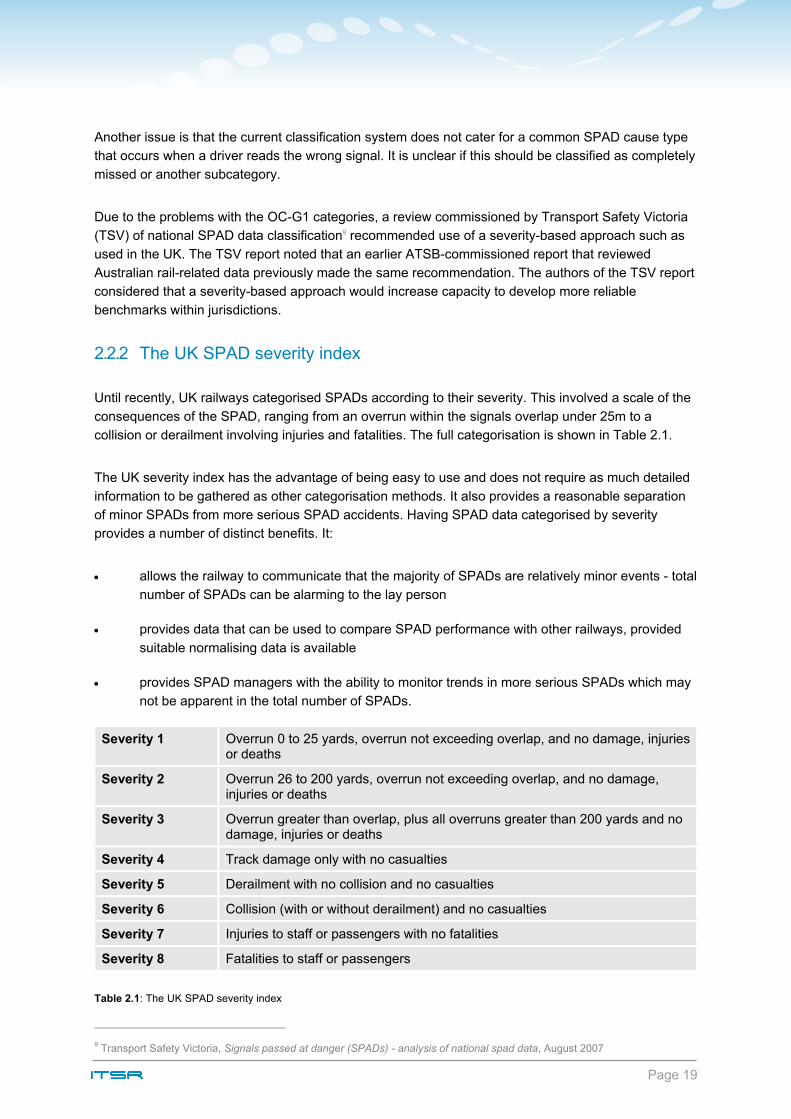
2.2.2 The UK SPAD severity index
Until recently, UK railways categorised SPADs according to their severity. This involved a scale of the
consequences of the SPAD, ranging from an overrun within the signals overlap under 25m to a
collision or derailment involving injuries and fatalities. The full categorisation is shown in Table 2.1.
The UK severity index has the advantage of being easy to use and does not require as much detailed
information to be gathered as other categorisation methods. It also provides a reasonable separation
of minor SPADs from more serious SPAD accidents. Having SPAD data categorised by severity
provides a number of distinct benefits. It:
allows the railway to communicate that the majority of SPADs are relatively minor events - total
number of SPADs can be alarming to the lay person
provides data that can be used to compare SPAD performance with other railways, provided
suitable normalising data is available
provides SPAD managers with the ability to monitor trends in more serious SPADs which may
not be apparent in the total number of SPADs.
Severity 1 Overrun 0 to 25 yards, overrun not exceeding overlap, and no damage, injuries or deaths
Severity 2 Overrun 26 to 200 yards, overrun not exceeding overlap, and no damage, injuries or deaths
Severity 3 Overrun greater than overlap, plus all overruns greater than 200 yards and no damage, injuries or deaths
Severity 4 Track damage only with no casualties
Severity 5 Derailment with no collision and no casualties
Severity 6 Collision (with or without derailment) and no casualties
Severity 7 Injuries to staff or passengers with no fatalities
Severity 8 Fatalities to staff or passengers
Table 2.1: The UK SPAD severity index
9 Transport Safety Victoria, Signals passed at danger (SPADs) - analysis of national spad data, August 2007

Page 20
However, there are weaknesses of the severity index in some instances. For example, some severity
3 SPADs, where a train has passed a yard signal with no overlap, are perhaps not as equally serious
as when a train has gone completely beyond the signal overlap on the main line. Such inconsistencies
could be dealt with by altering definitions of the categories.
Another disadvantage of the UK severity categorisation is that it does not sufficiently differentiate
between some types of SPADs. For example, a SPAD exceeding an overlap when the train ahead is
in close proximity, versus the same SPAD where the train ahead is a long distance ahead. These
would be categorised at the same severity. However, the UK SPAD risk categorisation (see section
2.2.3) would give the case of the train ahead in close proximity a higher risk, and so make a better
distinction between the seriousness of SPADs.
To provide an example of what proportions of SPADs fall into the severity categories, a report by the
UK Health and Safety Executive10 provides seven years of SPADs reported according to severity.
These data are summarised with Figure 2.4, which shows very few occurrences of severity 5 and
above.
Figure 2.4 - Average occurrence of SPAD severity categories in the UK, 1996-2003
2.2.3 UK SPAD risk categorisation
The approach in the UK has since moved on from use of the severity index. Rather than categorising
SPADs according to degree of severity, a more sophisticated approach is to categorise according to
the risk of a more serious accident. The SPAD risk ranking tool (SRRT) approach involves rating a
SPAD on a number of criteria related to the likelihood of an accident and its potential consequences. It
thereby provides a better measure of the potential risk of each SPAD. The risk ranking result is made
up of three elements:
Part 1 - an initial collision potential assessment
Part 2 - an accident vulnerability ranking
Part 3 - the risk ranking score.
10 Health and Safety Executive (2002), SPAD (signals passed at danger) report for June 2002, 31 July 2002

Page 21
SPAD risk categorisation requires a lot of detailed information to be gathered about the SPAD. There
were some discussions as to whether the risk ranking tool is too complex or cumbersome. However,
between the first and second editions of this information paper, ITSR received feedback from an
Australian rail operator that has used the SPAD risk ranking tool since 2009. This rail operator
indicated that the tool only takes about 10 minutes to categorise each SPAD, so long as all the data
has been collected by the investigators. Their experience is reported below:
Feedback from an Australian rail operator about the SPAD risk ranking tool
I just recently came across the attached paper produced by ITSR. [Our company] has adopted and
are using the SPAD risk ranking tool. We have adapted it to suit our rolling stock, etc. based on
subject matter expert input, and have used it for all SPADs that have occurred since 2006. We
introduced the tool in early to mid 2009, but went through some of our old SPAD reports as well.
The [ITSR SPAD information paper] says that the SPAD risk ranking tool process may be too
cumbersome - it actually only takes about 10 minutes to do for each SPAD assuming a decent
investigation has been done (with all the relevant info collected). We have now included the risk
ranking as a mandatory aspect of SPAD investigation so it is done in conjunction and has made
investigators think a bit more too, so a double benefit!
Appendix F contains more details on using the SRRT.
2.2.4 Hybrid SPAD severity/risk ranking categorisation scheme
With the problems of both the severity index and the SRRT in mind an example of a classification
system that is used by a large Australian integrated rail operator is presented with Table 2.2. This
table borrows from both the UK severity index and the UK SRRT to form a practical solution to the
problem, while avoiding the weaknesses of both schemes.
Classification Description Example/details
A Collision or derailment affecting a
passenger running line
Collision between two trains, with
infrastructure or road motor vehicle
B
Rail traffic has entered a potential
conflict zone
Collision or derailment on freight-only
running line
Rail traffic has progressed to a point
where a conflict could occur
Collision between two trains, with
infrastructure or road motor vehicle
derailment at catch points.
C
Rail traffic has passed the signal by
more than 100 metre, but remains
within the signal overlap
System controls worked to maintain
safety but were tested by the incident -
for example, train is stopped by an
infrastructure control (train-stop)
D
Rail traffic has passed the signal by
less than 100 metres
System controls worked to maintain
safety. Train was under driver control
and being braked at the time

Page 22
E
Within shunting yard, maintenance
centre or possession and not affecting
a passenger running line
If not wholly within the yard, depot or
possession then A to D above
F
Signal returned in face of driver Caused by deliberate or unintentional
human error, or equipment failure
Route previously clear so probability of
collision or derailment negligible
Table 2.2: Hybrid SPAD severity/risk ranking categorisation scheme11
2.2.5 SPAD precursor classification
It is useful to develop classification schemes for immediate causes and contributing factors of SPADs
to provide insight into the most common precursor events and preconditions, and to provide a means
to link SPAD occurrence rates to underlying risks of collisions and derailments.
It should be noted that SPADs are not exclusively a train driver issue. There are many operational
personnel (for example, train dispatch staff, signallers, network controllers, managers, instructors,
infrastructure maintainers) whose actions or inactions can lead to a SPAD occurring. In most cases, a
single condition will not cause a SPAD. It is the compounding of several conditions that leads to the
SPAD incident.
An example of a driver error classification scheme is provided in Table 2.3. In order to be able to
categorise SPADs to such a precursor listing as presented in this table, more information than that
collected in the initial report of the occurrence is required. Further investigations into contributing
factors help to identify the precursor events or preconditions related to human error. Tool B (Appendix
B) and tool C (Appendix D) will support the collection of this data.
Group Description
1 Ambiguous or incomplete information given
Correct information given but misunderstood
Information not given
Wrong information given
2 Anticipation of signal clearance
Failure to check signal aspect
Failure to locate signal
Failure to react to caution signal
Ignorance of rules/instructions
Not monitoring for a signal
Violation of rules/instructions
11 Source: Human Engineering Australia developed for an Australian rail operator

Page 23
3 Misread previous signal
Viewed correct signal but misread aspect
Viewed wrong signal
4 Misjudged environmental conditions
Misjudged train behaviour
Table 2.3: Immediate cause classification list for crew/train performance SPADs12
As can be seen in the table above, all these immediate causes relate to human error.
2.2.6 Conclusions on SPAD categorisation
The following conclusions are drawn about the various SPAD categorisations described in this
information paper:
There are some problems associated with data reliability with use of the coding system of the
OC-G1. The primary issue is that categorisation is usually undertaken prior to completion of
the investigation process. For example initially it may not be possible to determine if a category
is driver misjudged or completely missed due to the influence of train protection systems or the
nature of errors. The other problem is that the categorisation system is not comprehensive and
some events may not be captured adequately by any category.
The UK SPAD severity index provides a reasonable categorisation for SPADs but the
definition of category 3 SPADs allows a wide variation of severity within the category,
suggesting sub-categorisation is needed. Another negative is that there is a precedent for the
scheme being abandoned in favour of the SPAD risk ranking method.
The UK SPAD risk ranking method addresses some of the problems with the severity index,
but is complex and resource intensive to use, as it requires a great deal of situational data
around the SPAD to be gathered.
A hybrid/severity risk ranking method combining the UK SPAD severity index and the UK
SPAD risk ranking method used by a large Australian integrated railway is a practical way to
represent SPAD statistics by drawing from the strengths of both methods while avoiding their
weaknesses.
The UK SPAD precursor classification provides a useful way of categorising types of human
errors and can be used in conjunction with hybrid severity/risk ranking categorisation. Such a
classification is supported by the investigation tools provided in appendices A, B and D.
Statistics based on schemes such as the hybrid severity/risk ranking categorisation and the UK SPAD
precursor classification will provide useful data on overall SPAD performance, as well as human error
problem areas. Looking at methods of analysis of such statistics leads to the next stage of the overall
continuous improvement cycle.
12 Rail Safety and Standards Board (2006), Category A SPAD Report Q2 2006 (1 April to 30 June), 2006, p 33
http://www.rssb.co.uk/pdf/reports/Category%20A%20SPAD%20Report%20Quarter%202%202006.pdf

Page 24
3 Data analysis
Once data has been collected, various forms of analysis can be performed. This provides insight into
problems related to the causes of SPADs and guides strategy development.
In this way, raw data that often has little
meaning is analysed to generate useful
information for guiding SPAD reduction
strategies.
Common types of SPAD data analysis
are presented here for information.
Data for NSW is presented where available. NSW data is based on occurrence notification records
submitted to ITSR by NSW RTOs as required under rail safety legislation.
3.1 SPAD severity
Figure 3.1: Severity of SPADs NSW rail network in the two years to December 2010
Between January 2009 and December 2010, there were 991 SPADs on the NSW rail network. Figure
3.1 shows that a majority of these SPADs were low severity, with only about 1.6% (16 SPAD events)
resulting in a serious incident such as collision or derailment. The principle category is signal returned in
face of driver. These SPADs are also known as technical SPADs and do not pose a collision risk as the
route ahead of the signal will be cleared for the train. They may pose a relatively lower risk of passenger
falls or load shift if rapid deceleration occurs due to emergency braking. The second largest category,
signal passed by less than 100 metres, is also low severity because the train remains within the signal
overlap.

Page 25
3.2 Multi-SPAD signals
As has been discussed in previous sections of this paper, unfavourable infrastructure characteristics can
have a significant impact on human performance. Where multiple SPAD events have occurred at one
signal, the likelihood of such factors being present is high.
Determining multi-SPAD signals is useful as an indicator that a signal may need adjustment or
enhancement. This relatively simple form of analysis leads to effective improvements in SPAD rates if
the required infrastructure upgrades are made. The number of SPADs each signal has experienced in its
current operating arrangement (since upgrade) is determined. Signals with the most SPADs are then
assessed for possible upgrades and improvements.
In setting priorities for upgrades, a higher degree of importance may be given to the more serious
SPADs that have occurred for a particular signal than the number of less serious SPADs. This provides
a way of identifying those signals where intervention is almost certainly required. Such signals are
sometimes referred to as bad actors.
Identifying multi-SPAD signals can be based on a statistical calculation that establishes how many SPAD
events need occur at a particular signal beyond the point where the repeat events are likely to be due to
chance13. The analysis will identify signals with a SPAD rate higher than the general signal population.
Depending on data available, analysis may also take account of uncertainty in estimating the expected
rate as well as differences in exposure, for example signals on lines with a greater frequency of trains
would tend to generate more SPAD events than signals on quieter lines.
The UKRSSB determined that four or more SPADs recorded at a signal cannot be attributed to chance14.
This threshold is, however, dependent on the number of years of operation in the period of analysis and
may not be relevant for clusters of signals in high traffic areas that may be passed more frequently.
Once a signal has been identified as a multi-SPAD signal, it can be put into a prioritised signal upgrade
program. To view an example of a program for multi-spaded signals, go to http://www.multispad.co.uk.
An example of the types of signal features that have been analysed for multi-SPAD signals in the UK is
presented as Table 3.1.
13 RailCorp identify multi-SPAD signals on the basis of two SPADs in five years but apply further criteria such as degree of
protection
14 Robinson B, Special topic report focusing action on preventing SPAD incidents, UKRSSB

Page 26
Signal feature Line feature Signal location Infrastructure/ environment feature
Safety device
Parallel signals Curved approach
Signal orientation
Background type TPWS fitted?
Temporary signal Severity of curve
Side of track (L/R)
Signal obscuration AWS fitted?
Type of signal (running/shunting)
Left/right curve Signal position (ground/gantry)
Signs before signal
Signal type (traditional or LED)
Track slope (up/down/flat)
Starting at station
Read-through
Signal type (stop signal or stop board)
Actual line speed
OLE clutter
Signal height Line speed below or above 100mph
Close to level crossing
Number of signal heads/aspects
Type of line
Added furniture (theatre box)
Signal control type
Flashing aspects
Table 3.1: Features of multi-SPAD signals15
In order to identify the most effective mitigation strategy for a specific signal, a tool such as the one
presented in tool C (Appendix D) can be used to support a detailed assessment of infrastructure related
to human factors issues.
3.2.1 Multi-SPAD signals on the NSW network
The NSW rail network consists of the Metropolitan Rail Area network (MRA), the Defined Interstate Rail
Network (DIRN), the Hunter Valley network and the Country Regional Network (CRN).
An analysis of multi-SPAD signals was conducted for the MRA and the remainder of the NSW network
separately. The review threshold adopted for the MRA was two or more SPADs in two years. A threshold
of two or more SPADs in three years was adopted for the remainder of the network to compensate for far
less operational density.
15 Human Engineering (2004), Human factors support to SPAD management in the Southern and Scotland zones - summary
report, UKRSSB, Bristol UK
Page 27
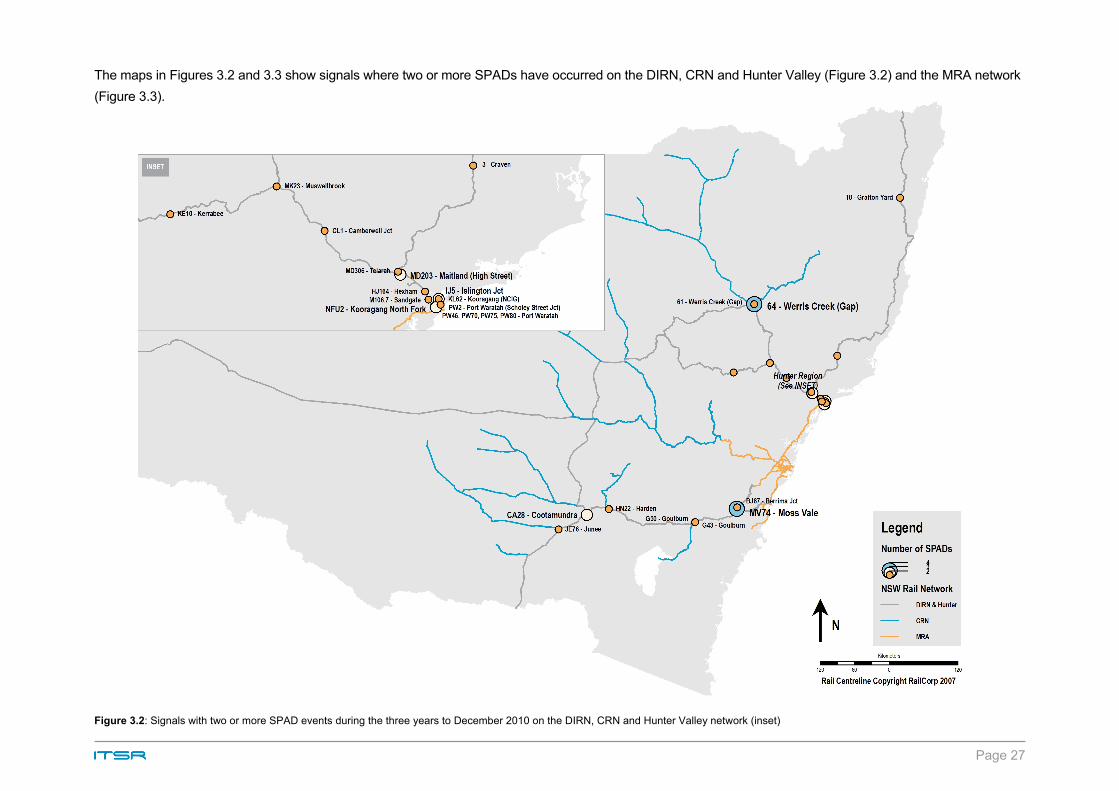
The maps in Figures 3.2 and 3.3 show signals where two or more SPADs have occurred on the DIRN, CRN and Hunter Valley (Figure 3.2) and the MRA network
(Figure 3.3).
Figure 3.2: Signals with two or more SPAD events during the three years to December 2010 on the DIRN, CRN and Hunter Valley network (inset)
Page 28
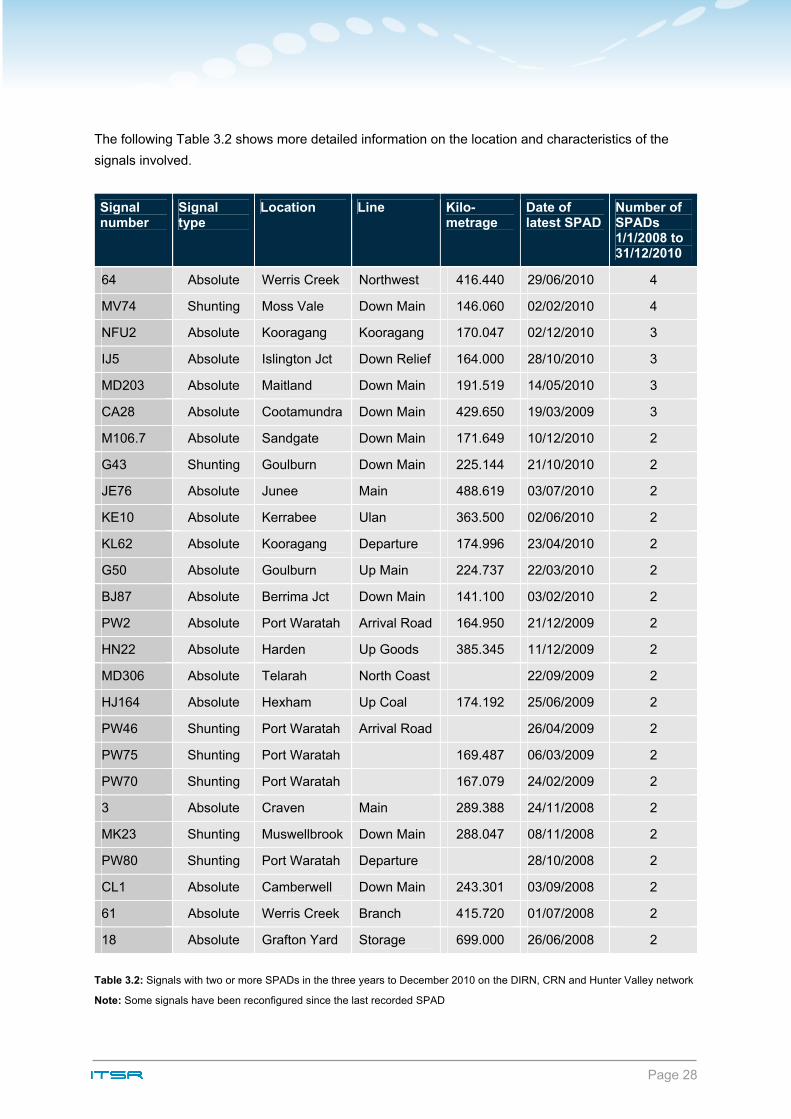
The following Table 3.2 shows more detailed information on the location and characteristics of the
signals involved.
Signal number
Signal type
Location Line Kilo-metrage
Date of latest SPAD
Number of SPADs 1/1/2008 to 31/12/2010
64 Absolute Werris Creek Northwest 416.440 29/06/2010 4
MV74 Shunting Moss Vale Down Main 146.060 02/02/2010 4
NFU2 Absolute Kooragang Kooragang 170.047 02/12/2010 3
IJ5 Absolute Islington Jct Down Relief 164.000 28/10/2010 3
MD203 Absolute Maitland Down Main 191.519 14/05/2010 3
CA28 Absolute Cootamundra Down Main 429.650 19/03/2009 3
M106.7 Absolute Sandgate Down Main 171.649 10/12/2010 2
G43 Shunting Goulburn Down Main 225.144 21/10/2010 2
JE76 Absolute Junee Main 488.619 03/07/2010 2
KE10 Absolute Kerrabee Ulan 363.500 02/06/2010 2
KL62 Absolute Kooragang Departure 174.996 23/04/2010 2
G50 Absolute Goulburn Up Main 224.737 22/03/2010 2
BJ87 Absolute Berrima Jct Down Main 141.100 03/02/2010 2
PW2 Absolute Port Waratah Arrival Road 164.950 21/12/2009 2
HN22 Absolute Harden Up Goods 385.345 11/12/2009 2
MD306 Absolute Telarah North Coast 22/09/2009 2
HJ164 Absolute Hexham Up Coal 174.192 25/06/2009 2
PW46 Shunting Port Waratah Arrival Road 26/04/2009 2
PW75 Shunting Port Waratah 169.487 06/03/2009 2
PW70 Shunting Port Waratah 167.079 24/02/2009 2
3 Absolute Craven Main 289.388 24/11/2008 2
MK23 Shunting Muswellbrook Down Main 288.047 08/11/2008 2
PW80 Shunting Port Waratah Departure 28/10/2008 2
CL1 Absolute Camberwell Down Main 243.301 03/09/2008 2
61 Absolute Werris Creek Branch 415.720 01/07/2008 2
18 Absolute Grafton Yard Storage 699.000 26/06/2008 2
Table 3.2: Signals with two or more SPADs in the three years to December 2010 on the DIRN, CRN and Hunter Valley network
Note: Some signals have been reconfigured since the last recorded SPAD

Page 29
Figure 3.3: Signals with two or more SPADs in the two years to December 2010 on the MRA network including South Coast (inset)
Page 30
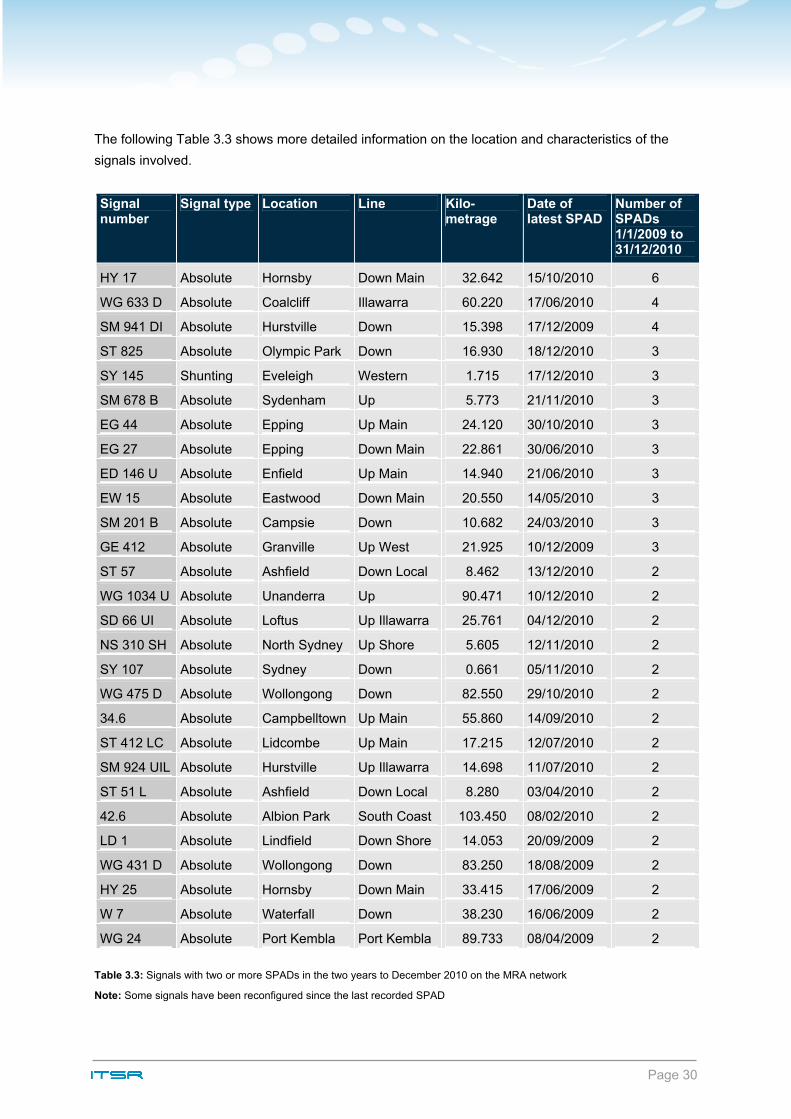
The following Table 3.3 shows more detailed information on the location and characteristics of the
signals involved.
Signal number
Signal type Location Line Kilo-metrage
Date of latest SPAD
Number of SPADs 1/1/2009 to 31/12/2010
HY 17 Absolute Hornsby Down Main 32.642 15/10/2010 6
WG 633 D Absolute Coalcliff Illawarra 60.220 17/06/2010 4
SM 941 DI Absolute Hurstville Down 15.398 17/12/2009 4
ST 825 Absolute Olympic Park Down 16.930 18/12/2010 3
SY 145 Shunting Eveleigh Western 1.715 17/12/2010 3
SM 678 B Absolute Sydenham Up 5.773 21/11/2010 3
EG 44 Absolute Epping Up Main 24.120 30/10/2010 3
EG 27 Absolute Epping Down Main 22.861 30/06/2010 3
ED 146 U Absolute Enfield Up Main 14.940 21/06/2010 3
EW 15 Absolute Eastwood Down Main 20.550 14/05/2010 3
SM 201 B Absolute Campsie Down 10.682 24/03/2010 3
GE 412 Absolute Granville Up West 21.925 10/12/2009 3
ST 57 Absolute Ashfield Down Local 8.462 13/12/2010 2
WG 1034 U Absolute Unanderra Up 90.471 10/12/2010 2
SD 66 UI Absolute Loftus Up Illawarra 25.761 04/12/2010 2
NS 310 SH Absolute North Sydney Up Shore 5.605 12/11/2010 2
SY 107 Absolute Sydney Down 0.661 05/11/2010 2
WG 475 D Absolute Wollongong Down 82.550 29/10/2010 2
34.6 Absolute Campbelltown Up Main 55.860 14/09/2010 2
ST 412 LC Absolute Lidcombe Up Main 17.215 12/07/2010 2
SM 924 UIL Absolute Hurstville Up Illawarra 14.698 11/07/2010 2
ST 51 L Absolute Ashfield Down Local 8.280 03/04/2010 2
42.6 Absolute Albion Park South Coast 103.450 08/02/2010 2
LD 1 Absolute Lindfield Down Shore 14.053 20/09/2009 2
WG 431 D Absolute Wollongong Down 83.250 18/08/2009 2
HY 25 Absolute Hornsby Down Main 33.415 17/06/2009 2
W 7 Absolute Waterfall Down 38.230 16/06/2009 2
WG 24 Absolute Port Kembla Port Kembla 89.733 08/04/2009 2
Table 3.3: Signals with two or more SPADs in the two years to December 2010 on the MRA network
Note: Some signals have been reconfigured since the last recorded SPAD

Page 31
RailCorp has these signals under active management. Mitigating actions taken include review of
signal sighting and placement, signal redesign and replacement, installation of LED lights, signal
repositioning and removal of obstructions such as vegetation.
RailCorp has a range of programs in place to improve driver performance such as route knowledge
risk assessments, multi-SPAD alert boards, professional driving technique training, DVD education
programs and SPAD notices and briefings. RailCorp utilises a range of communication and
stakeholder consultation strategies to enhance understanding of SPAD risks.
3.2.2 Multi-SPAD drivers (drivers with more than one SPAD incident)
In a similar way that multi-SPAD signals provide an indication of an underlying problem, so can drivers
with multi-SPAD histories. In NSW, there are around 200 non-RIFOD SPADs per year for a population
of around 200016 drivers which means that, if all drivers are performing consistently, they can expect to
SPAD once every 10 years. Driver performance, however, varies and so some drivers may never
have passed a signal at danger in their driving career while others may have had a number of events.
There is a similar question to multi-SPAD signals with multi-SPAD drivers by asking how many
SPADs a driver has to experience for it not to be random experience. This is less amenable to
statistical analysis of the type applied to multi-SPAD signals. As a general principle, the UKRSSB
study suggests that where a driver accrues two or more SPADs, increased management attention is
warranted. However, this may depend on the driving territory as some drivers will pass more signals
than others due to differences in signal density and proportion of time driving in dark territory. It is
important that actions concerning the driver consider the driver’s overall performance record.
The advice given by OPSWEB on this topic is:
It is however important to bear in mind that SPADs are just one of the many
types of safety related incidents that a driver may be involved in. As such, any
review of driver performance needs to conducted in the context of overall driver
performance over time, without unnecessary focus on a singular event which
may just be a one off e.g. an initial SPAD by a driver without a history of other
safety related incidents could be considered as a one off or statistical aberration
and not warrant any further attention. However, the same driver with an initial
SPAD who has also been involved in a number of other safety related incidents
may warrant a more detailed investigation.
This type of analysis is most effective if managed using a just culture approach.
16 Hansard and Papers Legislative Assembly 1 December 2005 Minister Watkins indicates RailCorp has 1351 train drivers who
account for approximately 68% of train kilometres in NSW. This scales up to an estimate of 2000 drivers for the state

Page 32
Examples of multi-SPAD driver data that has been collected by the UKRSSB is presented as Tables
3.4 and 3.517. The data shows relatively few drivers with more than one SPAD in the last five years
(there are approximately 14,700 drivers in the UK) and the rate is falling, probably due to the overall
improved SPAD performance in the UK.
2004 2005 2006 2007
Driver with more than one SPAD in last five years 41 38 44 12
Drivers with more than one SPAD as a percentage of all SPADs
11% 11% 13% 9%
Drivers with more than one SPAD (in current five years) at multi-SPADed signals
10 7 13 3
Drivers with more than one SPAD (in current five years) at multi-SPADed signals as a percentage of all SPADs
3% 2% 4% 2%
Table 3.4: UK multi-SPAD driver data
2004 2005 2006 2007
Driver with more than one SPAD in whole career 86 89 91 26
Driver with more than one SPAD in last 10 years 69 66 81 20
Driver with more than one SPAD in last 5 years 41 38 44 12
Table 3.4: UK multi-SPAD driver data
3.2.3 Freight versus passenger train driver SPADs
Currently the SPAD rate for freight trains in NSW is around 30% higher that of passenger trains.
Figure 3.4 shows the rate of non-technical SPAD events (i.e. RIFODs excluded) per million kilometres
for passenger and freight trains. The SPAD rate for freight trains was about 50% greater than
passenger trains over the earlier part of the period. However, the difference in SPAD rates between
freight and passenger trains has decreased over time. In 2010, the rate for freight trains was about
30% higher than passenger trains (3.2 and 2.5 SPAD events per million train kilometres, respectively).
Freight trains travel in areas with fewer signals. This means that, if the rate was calculated per signal
passed, the performance gap between freight and passenger trains would be even greater.
Some potential contributing factors to a higher rate of freight train SPAD events include increased
mass and velocity of freight trains and differing mental workload conditions associated with the freight
and passenger train driving task.
An assumption of the analysis is that passenger and freight trains have an equal probability of
encountering a signal at stop. This information, not currently extracted from train control systems for
all parts of the network, would provide more effective means of normalisation, enabling actual
difference in SPAD rate to be determined.
17 UKRSSB, SPAD performance report Q2 2007, UK

Page 33
Figure 3.4: Non-technical SPAD rate (count per million kilometres) by train type on the NSW network for the three years to
December 2010
3.3 Analysis of work scheduling and time of day factors
Research has linked accident risk, including industrial and motor vehicle accidents, to dimensions of
work schedules such as time of day and number of consecutive shifts worked. The UKRSSB
completed a series of research projects that looked at working patterns of train drivers and dimensions
of work schedules associated with SPADs18,19. Dimensions analysed with respect to their relationship
to accident risk are as follows:
time of day
time on task (i.e. continuous duty without a break)
time on duty
consecutive shifts
number of rest days.
The UKRSSB undertook research using aggregated industry data to ascertain if these trends are
found to be associated with SPADs in the UK. In addition to a description of the SPAD incident, the
data set contained, for each individual involved, details of the timing of the duty period of the SPAD,
the timing of breaks, and the shift pattern of the previous 12 days.
18 UKRSSB, T059 Human factors study of fatigue and shiftwork Appendix 1 - Working patterns of train drivers: Implications for
fatigue and safety, 2006
19 UKRSSB, T699 Fatigue and shiftwork for freight locomotive drivers and contract trackworkers: implications for fatigue and safety, 2010

Page 34
Measurements of a factor such as time of day or consecutive shifts will depend on how often the
activity is occurring (termed here as exposure). Statistics gathered need to be normalised to account
for differing levels of exposure.
The UKRSSB emphasises the importance of controlling for exposure to risk in this sort of data
analysis approach that looks at accident risk associated with dimensions of work schedules. In
addition, for analysis of trends relating to accident risk to be meaningful, there needs to be:
sufficient data for statistical analysis
consideration of other known risks that may mask trends
data that describes the shift system operating so that risks associated with exposure (for
example, the number of drivers that are driving trains at the time) can be estimated.
Without this adjustment process, trends such as time of day will most likely reflect peak times for train
traffic, rather than the risk of an individual driver being involved in a SPAD at a particular time of day.
The first step that the UKRSSB used to estimate likely exposure was to obtain the probability that a
driver would be on duty at any particular time of day. This estimate was derived from the distribution of
duty hours of the SPAD drivers during the 12 days prior to the SPAD. The UKRSSB also adjusted for
rest periods (breaks), since these corresponded to times when the driver would not be at risk. This
was possible because information on rest breaks was collected for the duty periods in which the SPAD
occurred. The final factor corrected for was duty frequency, on the basis that the amount of traffic is
directly proportional to the number of drivers on duty.
3.3.1 Work schedules and risk of SPADs
Collecting and analysing data on work history prior to SPADs and other human factors incidents may
help determine aspects of work schedule design that are associated with increased risk. The results
can help to optimise schedules to reduce risk of SPADs. Careful analysis of work history data is
needed to control for exposure.
The results of the UKRSSB analysis of SPAD risk controlling for exposure is presented in Figures 3.5,
3.6 and 3.7. These graphs, based on UK SPAD data for passenger trains, suggest a high number of
consecutive shifts, long time on task, and driving between midnight and 4am, are associated with
elevated SPAD risk. Note that the data in all graphs reflects relative risk as it has been normalised
with respect to an average risk of one.

Page 35
Figure 3.5: Relative SPAD risk - time of day20
The shape of the graph in Figure 3.5 is influenced by the methods used to control for exposure to risk
and associated assumptions. The UKRSSB notes that the absolute risk of a SPAD is highest during
the day because more trains are in service during the day. Alternative graphs that depict time of day
factors and further details of how the UKRSSB controlled for exposure to risk can be found in the
UKRSSB report: T059 Human factors study of fatigue and shift work Appendix 1: Working patterns of
train drivers - Implications for fatigue and safety. http://www.rssb.co.uk/research/allsearch.asp.
Figure 3.6: Relative SPAD risk - time on task21
20 UKRSSB, T059 Human factors study of fatigue and shiftwork Appendix 1 - Working patterns of train drivers: Implications for
fatigue and safety, 2006, UK
21 lbid
Page 36
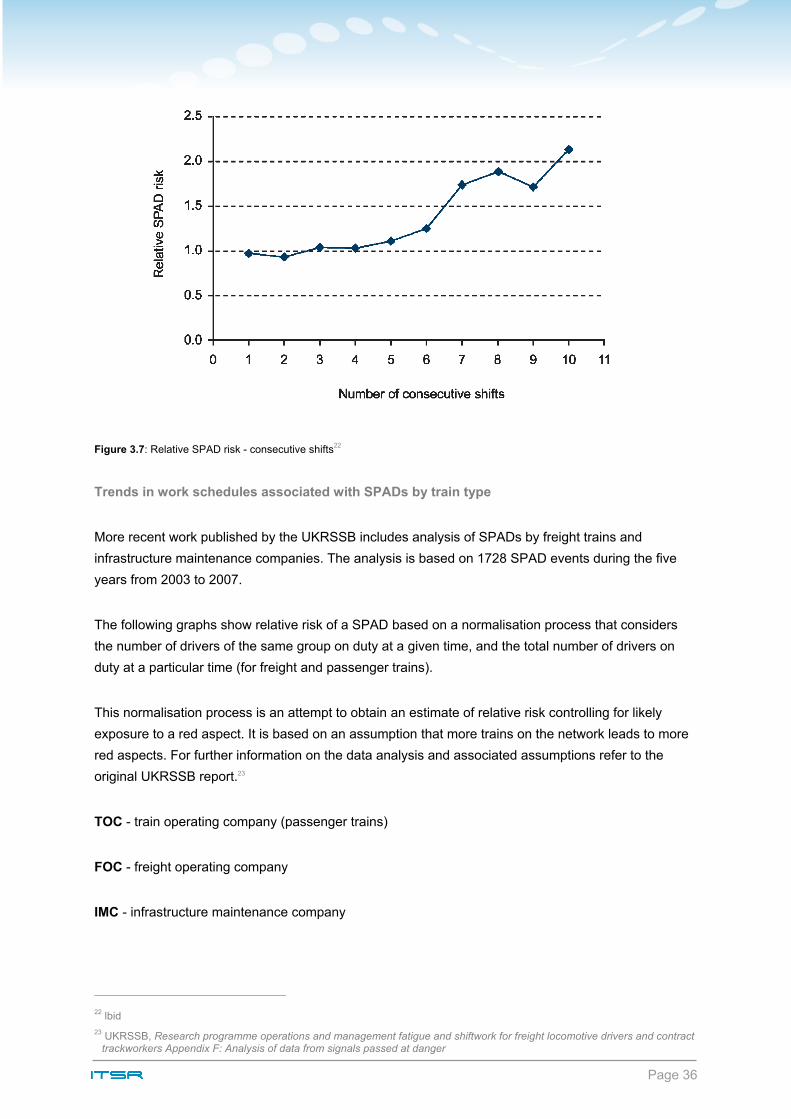
Figure 3.7: Relative SPAD risk - consecutive shifts22
Trends in work schedules associated with SPADs by train type
More recent work published by the UKRSSB includes analysis of SPADs by freight trains and
infrastructure maintenance companies. The analysis is based on 1728 SPAD events during the five
years from 2003 to 2007.
The following graphs show relative risk of a SPAD based on a normalisation process that considers
the number of drivers of the same group on duty at a given time, and the total number of drivers on
duty at a particular time (for freight and passenger trains).
This normalisation process is an attempt to obtain an estimate of relative risk controlling for likely
exposure to a red aspect. It is based on an assumption that more trains on the network leads to more
red aspects. For further information on the data analysis and associated assumptions refer to the
original UKRSSB report.23
TOC - train operating company (passenger trains)
FOC - freight operating company
IMC - infrastructure maintenance company
22 lbid
23 UKRSSB, Research programme operations and management fatigue and shiftwork for freight locomotive drivers and contract trackworkers Appendix F: Analysis of data from signals passed at danger

Page 37
Figure 3.8 Relative SPAD risk by time of day24
Figure 3.8 shows that estimated relative risk of SPAD is much higher during night hours midnight
to 05:59.
Figure 3.9 Relative SPAD risk by time on duty25
Figure 3.9 shows differing trends in estimated relative risk of SPAD associated with time on duty. For
freight trains, the risk was highest from three to six hours into the shift. For passenger and
maintenance trains, the relative risk was highest after nine hours or more.
24 lbid
25 lbid

Page 38
Figure 3.10: Relative SPAD risk by time on task
Figure 3.10 shows relative risk of SPAD by time on task (continuous time worked without a rest
break). The data is based on information on rest breaks in the duty period on the day of the SPAD.
Time on task is defined as the time from the start of a duty period to until the time of the SPAD or, if
the SPAD occurred after a rest period, time on task was the time from the end of the rest period to the
time of the SPAD.
There was a clear increase in relative risk of SPAD for passenger drivers at six or more hours without a
break. For freight trains, there was evidence of increased relative risk after seven or more hours without
a break. There was not sufficient data for meaningful analysis of this dimension for infrastructure
maintenance trains. However, the UKRSSB indicate that only one break per shift was recorded in the
database and suggest a possibility that the increase in risk has been masked by unrecorded breaks.
Figure 3.11: Relative SPAD risk by consecutive duties

Page 39
Figure 3.11 shows that relative risk of a SPAD appeared to remain relatively steady over the first six
consecutive duties after which it increased in all groups. The increase was greatest for freight and
infrastructure maintenance where it was approximately double the average level.
SPADs and the distribution of rest days
Another study by the UKRSSB and reported on OPSWEB26 found an increased risk of SPADs when
drivers have only a single day's break, a decrease in SPAD risk for breaks between three and seven
days, and an increase in risk following a break of seven days or more.
Work schedule design to reduce accident risk
The UKRSSB research concluded that shift designs should take into account scheduling dimensions
that have the potential to reduce accident risk. They encourage the UK rail industry to improve the
current approach to roster generation in relation to freight and infrastructure train operatons and
identify a number of specific areas where new guidelines related to work and rest need to be
considered in the risk context of each rail operation27.
These include:
Duration of the shift: Limiting shift duration to 12 hours, with further restrictions on duties involving
nights and early starts that impinge on normal hours of sleep.
Consecutive duties: Limiting consecutive duties to around six and a lower limit where duties impinge
significantly on the normal sleep hours such as consecutive night and early shifts.
Weekly hours: Consideration of a duty hour limit based on a seven-day rolling period and is limited to
about 55 hours before a rest day is scheduled.
Days off: Providing for a full night’s sleep in the schedule particularly following night shifts where a
single rest day may not be sufficient.
Rest periods: Minimum rest period of 12 hours between consecutive shifts advisable.
Travel time: Consideration of alternative arrangements such as transport or accommodation if
workers are doing long shifts in association with commuting over one and a half hours. Guidance for
workers on the risks of long periods spent driving, particularly when driving home after the night shift.
26 http://www.opsweb.co.uk/tools/common-factors/PAGES/QA.aspx?id=32 (Refer to tab entitled shift patterns)
27 UKRSSB, Research programme operations and management fatigue and shiftwork for freight locomotive drivers and contract trackworkers Appendix F: Analysis of data from signals passed at danger

Page 40
Other areas that need to be addressed that are not directly covered by the guidelines outlined
above include:
Rostering practices: Improvements to roster design to reduce day-to-day variation in timing and
duration of shifts, and include greater contingency within the roster. Staff involved in planning and
managing rosters being trained in good roster design and factors that impair sleep and alertness.
Consideration of individual worker shift preferences where practical.
Breaks within the shift: Greater consideration to timing of breaks within shifts. Breaks scheduled at a
suitable time with respect to the task activities, ideally towards middle of shift. Break of at least 15
minutes recommended after four hours of work, particularly for freight drivers.
Napping policy: For freight drivers, it would be beneficial to implement a napping policy to allow rest
to be taken in the cab assuming that controls are in place to assure safety.
‘How to manage shiftwork problems - a research perspective’ is a table of principles for the design of
shift work developed by the UKRSSB, based on their incident data analysis and research on good
practice. It can be found in Understanding human factors: A guide for the railway industry at
http://www.rssb.co.uk/SiteCollectionDocuments/pdf/understanding_human_factors_a_guide_for_the_r
ailway_industry.pdf.
3.3.2 Analysis of human factors data
As previously discussed, information regarding the driver and other relevant operational and
organisational factors can be collected using the suggested checklists (tools A, B and C, appendices
A, B and D). Compilation of this data will provide some insight into human factors and organisational
factors contributing to SPADs.
Some types of data analysis that can be performed are:
different age groups and experience (for example, UK SPAD data by driver age - Figure 3.4 )
SPADs where drivers reported unusual or unfamiliar circumstances (potentially also related to
driver experience)
SPADs following extended time off (for example, prolonged sickness or leave)
time into the shift that the SPAD occurred and shift time remaining
SPADs with internal or external distractions as a contributing factor
SPADs for different types of signals or specific routes.

Page 41
3.3.3 Age factors
Figure 3.12 presents UKRSSB data normalised by ITSR to represent SPAD incidence (rate per 1000
drivers) by driver age over four consecutive years. In this example, it can be seen that each of the age
groups is performing at a similar rate when normalised as SPADs per 1000 drivers in the each group.
The drop in rate for 2007 is due to the reduction in total number of SPADs, probably due to the
influence of the implementation of the train warning protection system.
Figure 3.12: UK SPADs per 1000 drivers by age, 2004 to 2007

Page 42
3.3.4 Driver experience
UKRSSB also provides data on SPADs by driver experience. This has been normalised by ITSR as a
rate per 1000 drivers and presented in Figure 3.13. It clearly shows poor SPAD performance in
experience bands one to five years especially for drivers with one to two years experience.
Figure 3.13: UK SPADs per 1000 drivers by years of experience, 2004 to 2007
3.3.5 Human error
Data on precursor categories can be analysed to determine the greatest contributors to SPADs and
the relationship with other factors, such as multi-spad signals. The UK UKRSSB provides an example
with Table 3.10 that lists the human error precursor categories. The categories in the table match the
immediate cause classification presented earlier as Table 2.3. The second and third columns show
each category of error precursor as a percentage of all SPADs, and as a percentage of SPADs that
occurred at multi-SPAD signals.

Page 43
Precursor % all SPADs % SPADs at multi-SPAD (4 or more SPAD)
signals
Misjudge train behaviour 9% 21%
Failure to react to a caution signal 26% 19%
Failure to check signal aspect 19% 15%
Misjudge environmental conditions 8% 10%
Viewed wrong signal 6% 9%
Failure to locate signal 9% 7%
Anticipation of signal clearance 6% 6%
Violation of rules/instructions 6% 4%
Viewed correct signal misread aspect 3% 3%
Misread previous signal 1% 3%
Ignorance of rules/instructions 1% 1%
Wrong/ambiguous/incomplete information 4% 1%
Correct information, but misunderstood 1% 1%
Table 3.10: Precursor contribution to SPADs and influence of multi-SPAD signals
The data in Table 3.10 suggest that SPADs at multi-SPAD signals are more likely to involve the
category misjudge train behaviour than SPADs at all signals. Otherwise, the proportions in each of the
other error precursor categories appear to be similar for SPADs at multi-SPAD signals and SPADs at
all signals. However, it is important to note that investigators need high-level competencies in the
human factors aspects of investigations to be able to differentiate between precursors. In many cases,
the driver is not aware of the factors that influenced his or her performance and it takes a skilled
human factors investigator to ensure that precursors are as accurate as possible.
In presentations regarding SPAD strategy, the UKRSSB has identified the following priority issues and
factors that have been identified through UK data. As such, they may provide worthy starting points for
consideration in Australian SPAD investigations and data analysis:
perturbed operation
unusual moves
mobile telephones
diabetes

Page 44
prescription as well as prohibited drugs
starting against signal SPADs
starting from yellow
3-4 aspect transitions
train stop reliance/cues
poor communication
signals to right.
The data from the UK presented above shows how a deeper understanding of contributing factors to
SPADs can be gained. For example, Figure 3.12 suggests driver age does not appear to be a
significant factor, whereas Figure 3.13 suggests driver experience to be a contributing factor. Such
information is invaluable in developing strategies for SPAD reduction, as it provides direction in which
areas to target. However, railways differ considerably in terms of signalling, associated infrastructure
and rolling stock, so it is best to look at what local data is revealing and form associated strategies.
4 Mitigation of identified SPAD problems
Through data collection, investigation
and analysis, contributing problems to
SPADs can be identified, allowing
strategies to address such problems to
be developed. This section provides
examples of a number of strategies and
programs that can be used to address
particular problems that contribute to
SPADs. They are not necessarily the
best way for every organisation to deal with the problems, but are put forward as ideas on what may
be done in the area.
4.1 Mitigation measures linked to investigation tools
Appendices D and E contain example mitigating measures that link to each item of the investigation
checklist tools at appendices B and C. These generic mitigating measures were developed in
conjunction with Human Engineering based on work for rail industry clients in the UK and Australia.
The relationship between the checklist tools and mitigating measure tools is shown in Figure 4.1.

Page 45
Figure 4.1: Link between investigation tools and possible mitigations
An example of the suggested mitigation measures that are linked to the rolling stock operator human
factors investigation tool is presented as Figure 4.2.
Figure 4.2: Example mitigation measures for rolling stock operations

Page 46
4.2 Areas of operational management to target
SPAD management spans a number of areas of the management of a railway operation. According to
the UK-based OPSWEB SPAD risk management guide key areas to target when developing SPAD
mitigation strategies are:
behaviour and performance management of safety critical staff
managing the working environment on the train operations side
route design
infrastructure management.
4.2.1 Behaviour and performance management of safety critical staff
Initiatives that help shape behaviour and support performance of staff involved with train driving,
signalling and train control are key to reducing SPADs. Staff involved in these areas can be
considered to be safety critical due to the risks associated with SPADs. In the context of SPADs,
safety critical staff include:
train drivers/guards/second persons
track machine drivers
signallers/train controllers
shunters
platform staff
worksite protection officers
signal technicians.
Managing behaviour and performance of staff covers a number of areas of a safety management
system. The OPSWEB SPAD risk management guide highlights the following areas of focus:
Recruitment and selection - How well does the process check the applicant’s physical ability
to perform roles such as driving? Are mental abilities and aptitudes required for the role
defined? How well does the process check for these requirements?
Training and competence - How effective is training in areas such as driving and signalling?
Is it followed by an assessment of competence to ensure individuals are competent and that
this competence is maintained? Are SPAD awareness and the steps that can be taken to
prevent SPADs occurring, a constant feature?

Page 47
Health and fitness - Are health and fitness issues affecting the performance and behaviour of
staff such as drivers and signallers? Areas for possible improvement include diet, coping with
stress, personal life/work balance, and exercise.
Fatigue - Research by the UKRSSB indicates a link between aspects of work schedules and
SPAD performance (see earlier section 3.3 - Analysis of work scheduling and time of day
factors). Improvements in fatigue management should therefore improve SPAD performance.
Safety critical communication - How well do drivers, signallers, track workers and other
frontline staff talk to each other using the correct protocols? How does this affect the risk of
misunderstandings and subsequently SPADs?
Briefing - How well are staff briefed in areas such as:
causes of SPADs (both in general terms and directly after an incident)?
high risk locations?
changes to infrastructure and the operating environment?
Rail resource management and simulation
A promising area to improve safety critical workers performance and behaviour is rail resource
management and use of simulation.
Rail resource management is a type of applied human factors training (crew resource management)
that has been responsible for reducing errors and their consequences in industries such as aviation.
Investigations of accidents and serious incidents in the transport industry have shown that many
safety occurrences could have been prevented by people making better use of their available
resources, such as team members, equipment, information and procedures. Effective resource
management not only helps to reduce human error but enables operators to detect and deal with
those errors that have occurred so that they can be contained and their consequences mitigated. As
such, it is well suited to SPAD management practices.
Simulation involves artificially creating the train driving environment. As well as allowing new drivers to
train in a safe environment, it allows the training of unusual events and conditions and system
malfunctions in a safe environment. Simulation can become an important part to driver training and
assessment.
The techniques of rail resource management and simulation are particularly effective if used in
combination, such as joint signaller and driver training. This enables signallers and drivers to
experience each others’ tasks and understand how to assist each other in detecting potential threats
and errors. Rail resource management can also improve the training of guards/second persons and
drivers by facilitating a team-based approach to error minimisation (that is, one part of the team
watches and supports the other part of the team).

Page 48
ITSR has published guidance and training materials on rail resource management. Further information
can be found at www.transportregulator.nsw.gov.au
4.2.2 Managing the working environment
There are a number of work environment factors that can influence the performance and behaviour of
safety critical personnel, in turn affecting the risk of a SPAD.
Driving performance can be impaired by factors such as extremes in temperature, poor ventilation
noise, vibration, poor equipment design or layout. Performance can also be impaired by distractions
such as people on and around the train, platforms and rail corridor, radio messages, mobile phones,
PDAs, and other personal electronic devices.
Following the multiple casualty event due to a SPAD at Chatsworth, California, in 2008, the US
Federal Railroad Administration made a ruling to restrict the use of personal electronic or electrical
devices, and the California Public Utilities Commission unanimously passed an emergency order to
temporarily ban the use of cellular communication devices by train crew members. Following this, the
US Congress passed the Rail Safety Improvement Act of 2008, which requires the Secretary of
Transportation within a year to complete a study on the safety impact of the use of personal electronic
devices, including cell phones, video games, and other distracting devices, by safety-related railroad
employees. Railways such as the Massachusetts Bay Transportation Authority in the US have banned
such devices from the cab altogether. Clearly, managing distractions is important in relation to SPADs.
4.2.3 Route design and management
There are a number of factors that affect how difficult a route is to drive, which in turn influence SPAD
risk. These include:
signal sighting
route design/layout
timetabling
adhesion /weather conditions.
Problems with signal sighting will be revealed by performing signal sighting checks after SPADs using
tools such as the investigation tool for infrastructure managers presented as tool C (Appendix D) and
signal sighting standards. Such checks can also be done proactively, without having a SPAD, if a
particular type of signal is found to be problematic. The infrastructure managers tool C contains links
to possible mitigations relevant to the particular infrastructure factor in question. These mitigations are
compiled as Appendix E. Examples of signal sighting mitigations are:

Page 49
removing excess lineside information
removing obstructions
increasing signal brightness by using LEDs
installing back plates on signals to screen out visually complex information behind it.
Problems with route design/layout can be revealed by using signal sighting standards, as well as the
checklist items in tool C and associated links to the possible mitigating measures in Appendix E.
Another factor to consider with route design/layout is assessment of the likely path or trajectory of a
train following a SPAD, including where catchpoints (derailers) may be directing a train. Designs need
to ensure that catchpoints are not directing trains into stanchions, lineside structures or off
embankments.
The timetable can have an influence on the pressure and workload of safety critical personnel,
including drivers, signallers and platform staff. Humans are more likely to make errors when under
conditions of high workload, thereby increasing SPAD risk. Processes can be followed to identify and
mitigate timetable related SPAD hazards.
Planning for adverse conditions
Extreme weather (intense rail, fog, etc.), dust, insect swarms and leaf fall can make driving difficult
and have an influence on train performance. In addition, planning is required to maintain the visibility
of signals within stopping distances. Procedures should map out how operations are to be performed
safely in such conditions.

Page 50
4.3 Implementing and evaluating strategies
Once potential mitigation measures have been identified and strategic priority target areas have been
determined, the next step is to implement strategies and evaluate the impact.
Combining some of the details of each of the steps of the continuous improvement cycle is presented
as Figure 4.3 that summarises the overall SPAD management cycle.
Figure 4.3: SPAD management continuous improvement cycle.
4.4 Getting the message out on SPAD management
Good SPAD management practice
depends on action by people across
different operational areas and divisions
and often more than one organisation.
Because of this, mechanisms for
information sharing and dialogue are
critical. Forums and newsletters are
common ways to disseminate good
practice and collaboration between
organisations, however web-portals with on-line content are increasingly used to bring ideas and
people together. A number of useful tools and references on SPAD management are available on line.
Some examples from the UK are:

Page 51
OPSWEB internet portal - http://www.opsweb.co.uk
This UK initiative started as SPADWEB. Due to the success of the initiative, it expanded and re-
branded as OPSWEB in recognition that SPAD risk is interconnected with other operational risks
intrinsic to the rail network.
OPSWEB aims to communicate operational risk issues and provide a platform for sharing of good
practice. Content includes material from a wide range of organisations from operators to regulatory
bodies. Although the site has a UK focus, 50 of the 300 organisations (as at April 2008) are
represented by users from outside the UK.
OPSWEB provides an opportunity for users to contribute examples of good practice that relate to risks
in train operations. Content is vetted via an editorial review panel.
The site provides an important avenue for dissemination of aggregated data and reports. For example,
the UKRSSB provide a weekly report on multi-spad signals, and SPAD incident reports each month,
quarter and year.
Network Rail multiple SPAD signals – http://www.multispad.co.uk
This website contains maps of the UK rail network with information on multi-SPAD signals in various
sections of the network. The Network Rail SPAD policy and strategy also appear on the site.
User information is provided on the benefits of incorporating multi-SPAD information into driver
training programs and local SPAD management initiatives, including incorporation into route
knowledge, training and safety briefings for divers/trainers, and incorporation into risk assessments.
Halcrow Rail operational safety and SPAD project
Various risk and human factors consultants contribute to development of practical tools on SPAD
management. Halcrow UK host a website devoted to their work in this area.
For a number of years, 38 UK railways have jointly funded the Operational Safety Risk and SPAD
Project on an annual contract basis. Halcrow UK is currently fulfilling this role. As part of their work,
Halcrow host a website (http://www.halcrowspad.com) and produce a SPAD newsletter, RedAlert, as
well as hosting an annual Operational safety risk and SPAD conference.
Adhesion Working Group (AWG) - http://www.awg-rail.co.uk
AWG is a non-profit making, cross-industry focus group with the sole objective of researching and
developing initiatives to combat the effects of low wheel/rail adhesion.
As well as developing new concepts, the group stimulates the sharing of information through regular
conferences, events, informational videos and a twice-yearly newsletter.