Independent Evaluation of Light-Vehicle Safety ... · Light-Vehicle Safety Applications ......
129
DOT HS 812 222 December 2015 Independent Evaluation of Light-Vehicle Safety Applications Based on Vehicle-to-Vehicle Communications Used in the 2012–2013 Safety Pilot Model Deployment
Transcript of Independent Evaluation of Light-Vehicle Safety ... · Light-Vehicle Safety Applications ......

DOT HS 812 222 December 2015
Independent Evaluation of Light-Vehicle Safety Applications Based on Vehicle-to-Vehicle Communications Used in the 2012–2013 Safety Pilot Model Deployment
Disclaimer
This publication is distributed by the U.S. Department of Transportation, National Highway Traffic Safety Administration, in the interest of information exchange. The opinions, findings, and conclusions expressed in this publication are those of the authors and not necessarily those of the Department of Transportation or the National Highway Traffic Safety Administration. The United States Government assumes no liability for its contents or use thereof. If trade or manufacturers’ names or products are mentioned, it is because they are considered essential to the object of the publication and should not be construed as an endorsement. The United States Government does not endorse products or manufacturers.
Suggested APA Format Citation: Nodine, E., Stevens, S., Lam, A., Jackson, C., & Najm, W. G. (2015, December). Independent
evaluation of light-vehicle safety applications based on vehicle-to-vehicle communications used in the 2012-2013 Safety Pilot Model Deployment. (Report No. DOT HS 812 222). Washington, DC: National Highway Traffic Safety Administration.
i
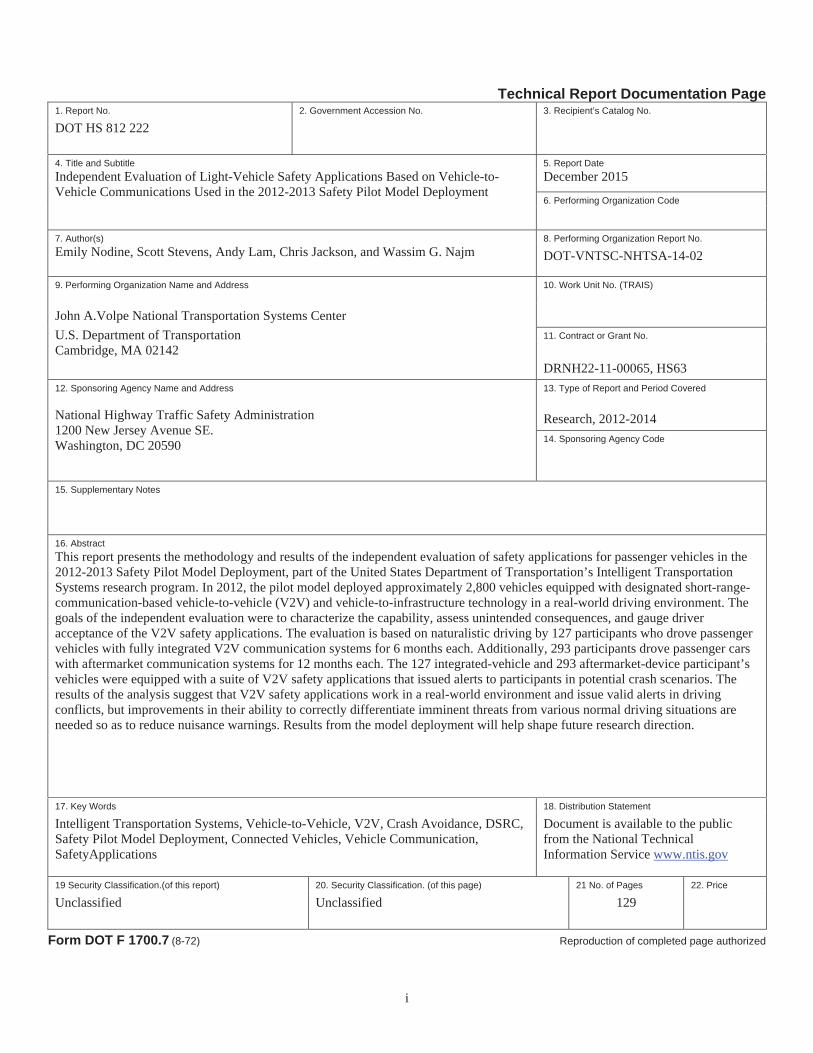
Technical Report Documentation Page
1. Report No.
DOT HS 812 222 2. Government Accession No.
3. Recipient’s Catalog No.
4. Title and Subtitle Independent Evaluation of Light-Vehicle Safety Applications Based on Vehicle-to-Vehicle Communications Used in the 2012-2013 Safety Pilot Model Deployment
5. Report Date December 2015
6. Performing Organization Code
7. Author(s) Emily Nodine, Scott Stevens, Andy Lam, Chris Jackson, and Wassim G. Najm
8. Performing Organization Report No.
DOT-VNTSC-NHTSA-14-02
9. Performing Organization Name and Address
John A.Volpe National Transportation Systems Center U.S. Department of Transportation Cambridge, MA 02142
10. Work
Unit No. (TRAIS)
11. Contract or Grant No.
DRNH22-11-00065, HS63 12. Sponsoring Agency Name and Address National Highway Traffic Safety Administration 1200 New Jersey Avenue SE. Washington, DC 20590
13. Type of Report and Period Covered
Research, 2012-2014 14. Sponsoring Agency Code
15. Supplementary Notes
16. Abstract This report presents the methodology and results of the independent evaluation of safety applications for passenger vehicles in the 2012-2013 Safety Pilot Model Deployment, part of the United States Department of Transportation’s Intelligent Transportation Systems research program. In 2012, the pilot model deployed approximately 2,800 vehicles equipped with designated short-range-communication-based vehicle-to-vehicle (V2V) and vehicle-to-infrastructure technology in a real-world driving environment. The goals of the independent evaluation were to characterize the capability, assess unintended consequences, and gauge driver acceptance of the V2V safety applications. The evaluation is based on naturalistic driving by 127 participants who drove passenger vehicles with fully integrated V2V communication systems for 6 months each. Additionally, 293 participants drove passenger cars with aftermarket communication systems for 12 months each. The 127 integrated-vehicle and 293 aftermarket-device participant’s vehicles were equipped with a suite of V2V safety applications that issued alerts to participants in potential crash scenarios. The results of the analysis suggest that V2V safety applications work in a real-world environment and issue valid alerts in driving conflicts, but improvements in their ability to correctly differentiate imminent threats from various normal driving situations are needed so as to reduce nuisance warnings. Results from the model deployment will help shape future research direction.
17. Key Words
Intelligent Transportation Systems, Vehicle-to-Vehicle, V2V, Safety Pilot Model Deployment, Connected Vehicles, Vehicle SafetyApplications
Crash Avoidance, DSRC, Communication,
18. Distribution Statement
Document is available to the public from the National Technical Information Service www.ntis.gov
19 Security Classification.(of
Unclassified this report) 20. Security Classification. (of this page)
Unclassified 21 No. of Pages
129 22. Price
Form DOT F 1700.7 (8-72) Reproduction of completed page authorized
Independent Evaluation of Light-Vehicle V2V Safety Applications
ii
ForewordThe United States Department of Transportation’s Volpe National Transportation Systems Center (Volpe) conducted an independent evaluation of crash warning applications based on vehicle-to-vehicle (V2V) communications for the National Highway Traffic Safety Administration, using data collected from the Safety Pilot Model Deployment field test. As a federal organization, Volpe is considered to beindependent since it is not involved in developing the technology and does not financially benefit from commercialization of future products based on the technology.
The goals of the independent evaluation were in keeping with the goals of the safety pilot itself, namely: to:
characterize the capability of the V2V safety applications in real world driving environments,assess unintended consequences including potential for distraction,gauge driver acceptance of the V2V technology, and
to provide input into a larger research effort to assess the safety benefits of V2V technology.
Specifically, the safety pilot provided data such as driver response time and braking effort in reaction to warnings; timing of the warnings themselves across the applications and vehicles included in this field study, and information about changes in drivers’ overall (normal) driving behavior which may impact safety. Such data was combined with similar data from other studies to help assess safety benefits.
The independent evaluation of the safety pilot is just one of the research tasks under a broad intra-agency agreement (IAA) between Volpe and NHTSA to assess the safety benefits of V2V crash avoidance systems. The IAA also includes tasks to develop, program, and document a safety impact methodology (SIM) tool; identify performance measures and determine preliminary performance requirements; devise characterization test procedures and run tests to quantify the performance of prototype systems; and run effectiveness analyses with the SIM tool using the results from the Safety Pilot Model Deployment and additional data sources to estimate the potential safety benefits for V2V safety applications.
In addition to this independent evaluation report, there are companion reports on characterization test procedures and performance measures for safety applications, the development and explanation of theSIM tool, and a comprehensive assessment of the safety benefit estimates for V2V crash avoidance applications.
Independent Evaluation of Light-Vehicle V2V Safety Applications
iii
Table of ContentsForeword...................................................................................................................................................... ii List of Acronyms ......................................................................................................................................viii Executive Summary ................................................................................................................................... ix 1 Introduction ........................................................................................................................................ 1
1.1 Safety Applications ....................................................................................................................... 1 1.2 Model Deployment ....................................................................................................................... 3
1.2.1 Determination of Fleet Needs ............................................................................................... 3 1.2.2 Experimental Design............................................................................................................. 3 1.2.3 Recruitment Strategy............................................................................................................. 4 1.2.4 Integrated Vehicle Safety Application Software Modifications ........................................... 5
1.3 Light Vehicle Participant Demographics ...................................................................................... 5 1.3.1 Integrated Vehicles ............................................................................................................... 5 1.3.2 Aftermarket Safety Devices .................................................................................................. 7
1.4 Summary of Exposure to Application Alerts ................................................................................ 7 1.4.1 Average Number of Alerts per Participant............................................................................ 8 1.4.2 Total Number of Alerts per Participant................................................................................. 9 1.4.3 Alert Rates ............................................................................................................................ 9
1.5 Independent Evaluation Goals .................................................................................................... 10 1.6 Data Sources ............................................................................................................................... 10
1.6.1 Objective Data..................................................................................................................... 11 1.6.2 Subjective Data ................................................................................................................... 12 1.6.3 Mapping Data Sources to Goals.......................................................................................... 13
2 System Capability............................................................................................................................. 14 2.1 Technical Approach .................................................................................................................... 14
2.1.1 Application Performance .................................................................................................... 14 2.2 System Capability Results .......................................................................................................... 16
2.2.1 FCW.................................................................................................................................... 16 2.2.2 IMA..................................................................................................................................... 25 2.2.3 BSW/LCW.......................................................................................................................... 32
3 Unintended Consequences............................................................................................................... 34 4 Driver Acceptance ............................................................................................................................ 36
4.1 Introduction................................................................................................................................. 36 4.1.1 What is Driver Acceptance? ............................................................................................... 36 4.1.2 Analysis Objectives............................................................................................................. 36 4.1.3 Factors Potentially Complicating Interpretation of Results ................................................ 37
4.2 Driver Acceptance Methods........................................................................................................ 38 4.2.1 Likert Scale Responses ....................................................................................................... 38 4.2.2 Open-Ended Responses....................................................................................................... 38 4.2.3 False Alerts ......................................................................................................................... 38 4.2.4 Phase 1 Versus Phase 2....................................................................................................... 38 4.2.5 Statistical Approach ............................................................................................................ 39
Independent Evaluation of Light-Vehicle V2V Safety Applications
iv
4.3 Integrated Vehicle Results .......................................................................................................... 39 4.3.1 General Impressions............................................................................................................ 40 4.3.2 Usability .............................................................................................................................. 41 4.3.3 Perceived Safety Benefits ................................................................................................... 45 4.3.4 Understandability ................................................................................................................ 48 4.3.5 Desirability.......................................................................................................................... 50 4.3.6 Security and Privacy ........................................................................................................... 52 4.3.7 Gender Effects..................................................................................................................... 53 4.3.8 Age Effects.......................................................................................................................... 53 4.3.9 Effect of False Alerts .......................................................................................................... 53
4.4 Discussion of Integrated Vehicle Driver Acceptance Results .................................................... 55 4.4.1 Overview............................................................................................................................. 55 4.4.2 Results by Topic.................................................................................................................. 55 4.4.3 Limitations .......................................................................................................................... 56
4.5 ASD Results................................................................................................................................ 57 4.5.1 General Impressions............................................................................................................ 58 4.5.2 Usability .............................................................................................................................. 59 4.5.3 Perceived Safety Benefit ..................................................................................................... 61 4.5.4 Understandability ................................................................................................................ 62 4.5.5 Desirability.......................................................................................................................... 63 4.5.6 Security and Privacy ........................................................................................................... 65
4.6 Discussion of ASD Driver Acceptance Results .......................................................................... 65 5 Conclusions ....................................................................................................................................... 67
5.1 System Capability ....................................................................................................................... 67 5.1.1 FCW.................................................................................................................................... 67 5.1.2 IMA..................................................................................................................................... 68 5.1.3 BSW/LCW.......................................................................................................................... 68
5.2 Unintended Consequences .......................................................................................................... 68 5.3 Driver Acceptance....................................................................................................................... 68
5.3.1 Integrated Vehicles ............................................................................................................. 69 5.3.2 Aftermarket Devices ........................................................................................................... 69
6 References ......................................................................................................................................... 71 Appendix A: Excerpts from the CAMP V2V-MD Final Report (Working Paper) ............................ 72 Appendix B: Post-Drive Questionnaire................................................................................................... 78 Appendix C: Video Analysis Coding Scheme....................................................................................... 103 Appendix D: Missed Alert Analysis Detail ........................................................................................... 105 Appendix E: Supplementary FCW Performance Analyses ................................................................ 108 Appendix F: ASD Driver Acceptance Details....................................................................................... 110

Independent Evaluation of Light-Vehicle V2V Safety Applications
v
FiguresFigure 1. Number of Integrated Light Vehicle Participants by Age and Gender.......................................... 5 Figure 2. Average Integrated Light Vehicle Participant Age by Age........................................................... 6 Figure 3. Average Driving Miles of Integrated Light Vehicle Participants by Demographics and Model Deployment Phase .............................................................................................. 6 Figure 4. Number of Aftermarket Safety Device Participants by Age and Gender...................................... 7 Figure 5. Integrated Vehicle Safety Alerts for All Participants by Application ........................................... 8 Figure 6. Average Number of Integrated Light Vehicle Safety Alerts per Participant................................. 8 Figure 7. Total Number of Crash-Imminent Safety Application Alerts by Participant and Model Deployment Phase ........................................................................................................................................ 9 Figure 8. Distribution of Integrated Light-Vehicle Participants by the Number of Crash-Imminent Alerts per 1,000 Miles Driven in Each Model Deployment Phase ............................................................. 10 Figure 9. Integrated Vehicle Video Data .................................................................................................... 12 Figure 10. Likert Scale Question Format Used on Driver Acceptance Questionnaire ............................... 12 Figure 11. Video Analysis Tool.................................................................................................................. 15 Figure 12. FCW Target Location................................................................................................................ 17 Figure 13. Detailed Breakdown of Phase 2 False FCW Alerts................................................................... 18 Figure 14. Percentage of FCW Alerts Issued for In-Path Targets by OEM and Phase............................... 19 Figure 15. In-Path Percentage of FCW Alerts Issued Without Brake Engaged at Alert Onset .................. 20 Figure 16. FCW Target Position by Target Vehicle Motion ...................................................................... 21 Figure 17. Percentage of FCW Alerts Issued for In-Path Targets by OEM and Target Vehicle Motion ... 21 Figure 18. Detailed Breakdown of ASD FCW Performance by Manufacturer .......................................... 22 Figure 19. FCW Alert In-Path Percentage for ASDs and Integrated Vehicles (Alerts With No Brake Applied at Alert Onset Only)................................................................................. 23 Figure 20. Percentage of In-Path FCW Alerts with Brake or Steering Response Within 5 Seconds of Alert Onset ................................................................................................................ 24 Figure 21. Breakdown of Integrated Vehicle FCW Alert Performance by Target Vehicle Device Type .. 25 Figure 22. Breakdown of IMA Warning Location by Model Deployment Phase ...................................... 26 Figure 23. Calculated Time-to-Intersection Versus Range for Hazard IMA Alerts ................................... 29 Figure 24. IMA Alert Location by OEM and Model Deployment Phase ................................................... 30 Figure 25. Target Time-to-Intersection Versus Range for Phase 1 IMA Stopped Events and Potential Missed IMA Stopped Events ....................................................................................................... 31 Figure 26. Target Time-to-Intersection Versus Range for Phase 2 IMA Stopped Events and Potential Missed IMA Stopped Events ....................................................................................................... 31 Figure 27. BSW/LCW Target Position ....................................................................................................... 32 Figure 28. BSW/LCW Target Position by OEM ........................................................................................ 33 Figure 29. Sample Driver Vehicle Interfaces From Model Deployment Integrated Vehicles.................... 37 Figure 30. Ratings of Warning Effectiveness ............................................................................................. 42 Figure 31. Ratings of Trust in Warnings..................................................................................................... 43 Figure 32. Ratings of Perceived Frequency of Incorrect Alerts.................................................................. 43 Figure 33. Ratings of Estimated Frequency of Incorrect Alerts ................................................................. 44 Figure 34. Ratings of Perceived Increase in Driving Safety....................................................................... 45
Independent Evaluation of Light-Vehicle V2V Safety Applications
vi
Figure 35. Ratings of Agreement with Warnings Being Distracting .......................................................... 45 Figure 36. Ratings of System Distraction Compared to Operating a Car Radio ........................................ 46 Figure 37. Ratings of System Overreliance ................................................................................................ 46 Figure 38. Ratings of System Understandability ........................................................................................ 49 Figure 39. Ratings of the Difficulty of Distinguishing the Different Alert Types...................................... 50 Figure 40. Ratings of Desirability of the System........................................................................................ 50 Figure 41. Ratings of Satisfaction With the System ................................................................................... 51 Figure 42. Ratings of How Much Participants Would be Willing to Pay for the V2V Technology........... 51 Figure 43. Willingness to Have System if It Required Periodic Visits for Updates ................................... 52 Figure 44. Ratings of Tolerance of Sharing Personal Data With Other Parties.......................................... 52 Figure 45. Willingness to Have System if it Required Periodic Visits for Updates—Shown by Age........ 53 Figure 46. Rated Frequency of FCW Alerts Received Correlated With Actual Number ........................... 54 Figure 47. Rated Frequency of IMA Alerts Received Correlated With Actual Number............................ 54 Figure 48. Ratings of the ASD Warning Effectiveness .............................................................................. 59 Figure 49. Perceived Frequency of False ASD Alerts for Each Safety Application................................... 60 Figure 50. Breakdown of Perceived Frequency of False ASD Alerts by Manufacturer............................. 60 Figure 51. Ratings of the ASD Increasing Driving Safety.......................................................................... 61 Figure 52. Ratings of Agreement with ASD Warnings Being Distracting ................................................. 61 Figure 53. Ratings of the ASD Distraction Compared to a Car Radio ....................................................... 61 Figure 54. Ratings of the ASD Causing Participants to Pay Less Attention .............................................. 62 Figure 55. Participant Understanding of ASD Warnings............................................................................ 63 Figure 56. Participant Ability to Discriminate Between ASD Alerts ......................................................... 63 Figure 57. Participant Interest in Having an ASD in Their Own Vehicle .................................................. 64 Figure 58. How Much Participants Would Pay for an ASD....................................................................... 64 Figure 59. Participant Willingness to Visit Dealers for System Updates ................................................... 65 Figure 60. Security and Privacy Responses ................................................................................................ 65 Figure 61. FCW Target Position by Road Curvature and Overall ............................................................ 108 Figure 62. Target Location for FCW Alerts by Target Range.................................................................. 109
Independent Evaluation of Light-Vehicle V2V Safety Applications
vii
TablesTable 1. V2V Safety Applications by Light Vehicle Type and Manufacturer ............................................. 2 Table 2. Model Deployment Objective Data Sources................................................................................. 11 Table 3. Breakdown of Evaluation Data Sources and Goals ...................................................................... 13 Table 4. Alert Classification by Target Location........................................................................................ 14 Table 5. Primary Performance Classification Variables by Safety Application ......................................... 15 Table 6. Breakdown of ASD FCW Analysis by Manufacturer .................................................................. 22 Table 7. IMA False Alert Scenarios............................................................................................................ 26 Table 8. False FCW Alerts with Observed Unintended Consequences...................................................... 34 Table 9. False IMA Alerts with Observed Unintended Consequences....................................................... 35 Table 10. What Participants Liked the Most About the Connected Vehicle System.................................. 40 Table 11. What Participants Liked the Least About the Connected Vehicle System ................................. 41 Table 12. Participants Responses to the Overall Effectiveness of the Connected Vehicle System ............ 42 Table 13. Participants Responses in Determining Why They Had Been Alerted....................................... 44 Table 14. Participants Responses to Connected Vehicle System Warning Distraction.............................. 45 Table 15. Participants Responses to Connected Vehicle System Overreliance.......................................... 47 Table 16. Reported Changes in Driving Behavior ...................................................................................... 48 Table 17. Participants Responses to “Other” Changes in Driving Behavior .............................................. 48 Table 18. Participants Responses to Identifying Confusing Warnings....................................................... 49 Table 19. What Participants Liked Most About the ASD........................................................................... 58 Table 20. What Participants Liked Least About the ASD .......................................................................... 58 Table 21. Reported Changes in Driving Behavior With ASD.................................................................... 62 Table 22. What Participants Liked Most About the EEBL System.......................................................... 110 Table 23. What Participants Liked Least About the EEBL System ......................................................... 110 Table 24. What Participants Liked Most About the FCW System ........................................................... 111 Table 25. What Participants Liked Least About the FCW System........................................................... 111 Table 26. Participant Responses on Warning Effectiveness ..................................................................... 112 Table 27. Participant Responses on Alerts Being Distracting .................................................................. 112 Table 28. Participant Responses on Changes in Their Driving Behavior................................................. 113 Table 29. Participant Responses on Understanding Alerts ....................................................................... 114

Independent Evaluation of Light-Vehicle V2V Safety Applications
viii
List of AcronymsANOVA analysis of varianceASD aftermarket safety deviceBSW blind spot warningCAMP Crash Avoidance Metrics PartnershipCAN controller area networkDAS data acquisition systemDNPW do not pass warning DSRC dedicated short range communication DVI driver-vehicle interface EEBL emergency electronic brake lightFCW forward collision warning HV host vehicleIAA intra-agency agreementIMA intersection movement assist IQR interquartile rangeIVBSS Integrated Vehicle-Based Safety SystemLCW lane change warning LTA left turn assist MD model deployment NHTSA National Highway Traffic Safety AdministrationOEM original equipment manufacturerRV remote vehicleSD standard deviationSIM safety impact methodologyTTI target Time-to-intersectionU.S. DOT United States Department of TransportationUMTRI University of Michigan Transportation Research Institute V2I vehicle-to-infrastructureV2V vehicle-to-vehicle VAD vehicle awareness device
Independent Evaluation of Light-Vehicle V2V Safety Applications
ix
Executive Summary
This report presents the methods and results of the independent evaluation of the light-vehicle vehicle-to-vehicle safety applications tested in the 2012-2013 Safety Pilot Model Deployment. The safety pilot program was part of the United States Department of Transportation’s Intelligent Transportation Systems research program, and focuses on the development and evaluation of crash avoidance systems. The crash avoidance systems were based on V2V and vehicle-to-infrastructure technologies that communicate through dedicated short range communication. The vision of the Safety Pilot Program was to test V2Vcommunication-based safety applications in real-world driving scenarios to assess drivers’ responses to warnings (e.g., time to react, braking effort, steering inputs), evaluate the timing and appropriateness of the warnings themselves, examine any overall changes in driver behavior during the test, and to verifythat the technology does not cause negative unintended consequences.
The U.S. DOT’s Volpe National Transportation Systems Center conducted the independent evaluation for the safety pilot. As a Federal organization, Volpe is considered to be independent since it is not involved in developing the technology and does not financially benefit from commercialization of future products based on the technology.
Volpe sought to address the following evaluation goals:
Characterize system performance and capability of V2V-based safety applications (i.e., determine the accuracy of the warnings issued by the safety application)Determine if there are unintended consequences from driving with V2V safety applications (i.e., determine if there are any situations where the safety applications led to distractions, inappropriate driver responses to warnings, or changed the “normal” behavior of the driver in a manner that leads to increase risk. Evaluate driver acceptance of the V2V-based safety applications (i.e., gauge driver perception and approval of the safety applications)
Methodology
This evaluation is based on data collected during the Safety Pilot Model Deployment a one-year naturalistic field test of 2,800 vehicles equipped with DSRC devices and V2V and V2I safety applications conducted in a real-world environment on public roadways in Ann Arbor, MI. The University of Michigan Transportation Research Institute was the test conductor.
During the Safety Pilot Model Deployment, 127 participants drove passenger vehicles equipped with fully integrated DSRC V2V systems for about 6 months each. Of the 127 participants, 64 were female and 63 were male. There were 43 younger participants (20 to 30 years old) and the remaining participants were split equally between the middle-aged (40 to 50) and older (60 to 70) age groups (42 participants each). In addition, 293 participants drove their own personal vehicles equipped with prototype aftermarket DSRC safety devices for the duration of the Safety Pilot Model Deployment. ASDs are portable devices that a driver could install in their own vehicle (similar to a portable navigation unit).
Due to the availability of data (based on the exposure observed in the model deployment), the evaluation focuses on three safety applications for passenger vehicles:
Forward-collision warning (FCW): warns drivers of stopped, slowing, or slower vehicles ahead.Intersection movement assist (IMA): warns drivers of oncoming cross traffic at an intersection. Blind-spot and lane-change warning (BSW/LCW): alerts drivers to the presence of vehicles approaching or in their blind spot.
Independent Evaluation of Light-Vehicle V2V Safety Applications
x
System Capability
The evaluation looked at the ability of these three safety applications to appropriately issue warnings in the Safety Pilot Model Deployment environment. That is, to issues warnings in situations in which a crash is likely to occur if the driver of the subject vehicle does not take some type of evasive action—and to issue the warning with sufficient lead time to allow the driver to react. The Independent Evaluator used video analysis to categorize crash-imminent alerts based on the relative location of the vehicle thattriggered the alert, classified alerts as potentially valid or invalid (i.e., false alerts), and searched for false-negative (missed) alerts to identify scenarios where basic alert conditions were satisfied but an alert was not issued.
Key findings are listed below.
FCW Findings
About one third of all integrated vehicle FCW alerts were issued for in-path targets—and therefor can be classified as valid alerts. The remaining two thirds of alerts were issued for targets that were not in-path, and therefore not a threat (false alerts).There were no observed differences in the in-path percentage of integrated-vehicle FCW alerts when broken down by the device type of the target vehicle (integrated vehicle, vehicle equipped with an aftermarket device, or vehicles equipped with a VAD). Different device types in the model deployment had various antenna configurations and software, but these differences did not appear to have a noticeable impact on FCW accuracy overall.There were similar performances observed between ASD and integrated-vehicle FCW alerts, suggesting that aftermarket DSRC devices could be a viable option for DSRC deployment.The in-path alert percentage of integrated-vehicle FCW alerts issued for stopped targets (10%) was much lower than for moving targets (40%). This is likely due to the fact that alerts issued for stopped targets were issued from further away (the safety application could not determine the lane position of targets as accurately from further away).There were no observed instances of missed FCW alerts (false negatives) in the Safety Pilot Model Deployment.
IMA Findings
During the first 6 months of the model deployment (Phase 1), the IMA application had a high rate of false alerts triggered by vehicles on highway ramps and overpasses. Software modifications made to the IMA after the first half of the model deployment resulted in a dramatic decrease in false IMA alerts and improved driver acceptance of the IMA application. Only six percent of the IMA alerts issued after the software modifications were false alerts, whereas 61 percent of the IMA alerts issued prior to the software modifications were false alerts.Twenty-two percent of IMA alerts issued after the software modifications were for intersection scenarios that the driver would not perceive as a threat scenario (e.g., the target vehicle was approaching from the right and the host vehicle driver was initiating a right turn, meaning the paths of the host and remote vehicles would not intersect). These alerts represent opportunities for improved accuracy in future implementations of the IMA application.Eleven potential missed (false negative) IMA stopped events (the host vehicle is proceeding into an intersection from a stop) were identified in the model deployment dataset.There were no observed instances of missed (false negative) IMA moving events (the host vehicle is approaching an intersection at speed) in the Safety Pilot Model Deployment.
Independent Evaluation of Light-Vehicle V2V Safety Applications
xi
BSW/LCW Findings
Fifty-four percent of BSW/LCW alerts were issued for target vehicles in the lane adjacent to the host vehicle, but in about half of these events the host vehicle had just passed the target vehicle and was moving away (i.e., the distance between vehicles is getting larger and therefore the remote vehicle is unlikely to be considered a threat). For further refinement in future implementations of V2V-based BSW/LCW applications, these alerts could be suppressed.Thirty-eight percent of BSW/LCW warnings were false alerts where the host and target vehicles were traveling in the same lane. Sixty-three percent of these scenarios occurred when the host vehicle activated their turn signal in preparation for turning at an upcoming intersection. These alerts represent an opportunity for improved accuracy in future implementations of the BSW/LCW application.There was one observed missed (false negative) BSW/LCW alert in the model deployment.
Unintended Consequences
Volpe did not observe any instances where the V2V safety applications had a negative impact on driver safety based on the observation of drivers’ reactions to a total of 2,384 crash-imminent alerts issued by the V2V safety applications.
Driver Acceptance
Volpe looked at driver acceptance of the technology including whether or not participants perceived asafety benefit from using the technology based on questionnaire data collected from each participant after they completed 6 months of driving in the Safety Pilot Model Deployment.
Key findings are as follows:
False alerts were often listed as one of the major problems with the system. However, there was not a significant correlation between the proportion of alerts a driver received that were false (measured objectively) and whether or not a driver said they would like to have the technology in their personal vehicle.IMA ratings improved significantly after the implementation of software changes that reduced the rate of false alerts.More than half of the participants rated each individual safety feature as desirable (after the IMA software changes) but gave a more neutral rating of the overall system.Eighteen percent of participants found the warnings to be distracting.Most participants were very concerned about data privacy. More than half of the participants said they were unwilling to use V2V technology if it involved sharing information about their location and travel patterns with businesses, the government, and third-party organizations. When an example wasgiven of how another party might use their information to their advantage—namely to “determine criminal behavior such as hacking”—opinions were more mixed. This result was the same for ASD users as it was for drivers who drove fully-integrated V2V systems.

Independent Evaluation of Light-Vehicle V2V Safety Applications
xii
Conclusions
Overall, the Safety Pilot Model Deployment demonstrated that vehicle-to-vehicle technology can be deployed in a real-world driving environment. The experimental design was successful in creating naturalistic interactions between the DSRC-equipped vehicles. As a result, the safety applications issuedwarnings in the safety-critical driving scenarios that they were designed to address.
The model deployment was also crucial in revealing areas for improving performance of the emergingDSRC technology and the prototype safety applications, which could not have been identified in controlled testing environments. Some of these improvements were corrected during the model deployment, while others require further research.
Independent Evaluation of Light-Vehicle V2V Safety Applications
1
1 IntroductionThis report presents the analytical approach and results of the independent evaluation of the light-vehicle safety application in the 2012-2013 Safety Pilot Model Deployment. The safety pilot program was part of the Intelligent Transportation Systems research program and focuses on the development and evaluation of crash warning and avoidance systems. These crash avoidance systems were based on V2V and V2I technologies that communicate through dedicated short range communication at 5.9 GHz. The U.S. DOT goal for this program was to accelerate the introduction and commercialization of the DSRC-based crash avoidance systems. The program is intended to establish vehicle communications for the surface transportation system that will support applications to enhance safety and mobility. The vision of the Safety Pilot Program was to test V2V communication-based safety applications in real-world driving scenarios to assess drivers’ responses to warnings (e.g., time to react, braking effort, steering inputs),evaluate the timing and appropriateness of the warnings themselves, examine any overall changes in driver behavior during the test, and to verify that the technology does not cause negative unintended consequences.
Volpe conducted the independent evaluation for the safety pilot. As a Federal organization, Volpe isconsidered to be independent since it is not involved in developing the technology, and does not financially benefit from commercialization of future products based on the technology. The evaluation of the safety pilot is based on the data collected during the Safety Pilot Model Deployment—a naturalistic real-world V2V and V2I field test of 2,800 V2V-equipped light vehicles, heavy trucks, and transitbuses—conducted in Ann Arbor. UMTRI is the test conductor for the model deployment.
This report evaluates V2V safety applications on light vehicles (passenger vehicles, vans and minivans, sport utility vehicles, and light trucks with a gross vehicle weight rating of less than 10,000 pounds) with the following two types of DSRC devices installed:
Integrated vehicles built by the Crash Avoidance Metrics Partnership,1 andAftermarket safety devices manufactured by two automotive suppliers (Cohda-Delphi and Denso).
Volpe also evaluated heavy-truck and transit-bus safety applications in the Safety Pilot Model Deployment, and will present these results in separate reports. Moreover, the safety benefits of light-vehicle, V2V-based crash warning applications were estimated in a separate based on computer simulations of data collected from the Safety Pilot Model Deployment, driving simulator experiments, and other human factors experiments report [1].
1.1 Safety ApplicationsCAMP and aftermarket device manufacturers developed the light-vehicle V2V-based safety applications in the Safety Pilot Model Deployment, which include:
Forward-collision warning (FCW): warns drivers of stopped, slowing, or slower vehicles ahead.Emergency electronic brake light (EEBL): warns drivers of heavy braking ahead in the traffic queue.Intersection movement assist (IMA): warns drivers of vehicles approaching from a lateral direction at an intersection.Left turn assist (LTA): warns drivers to the presence of oncoming, opposite-direction traffic when attempting a left turn.
1 A consortium of automotive manufacturers whose goal is to advance automotive crash avoidance technology through collaborative research. The CAMP members who participated in the safety pilot included Ford, GM, Honda, Mercedes, Toyota, Hyundai-Kia, Nissan, and VW-Audi.
Independent Evaluation of Light-Vehicle V2V Safety Applications
2
Blind-spot and lane-change warning (BSW/LCW): alerts drivers to the presence of vehicles approaching or in their blind spot in the adjacent lane.
Do-not-pass warning (DNPW): warns drivers of an oncoming, opposite-direction vehicle when attempting to pass a slower vehicle on an undivided two-lane roadway.
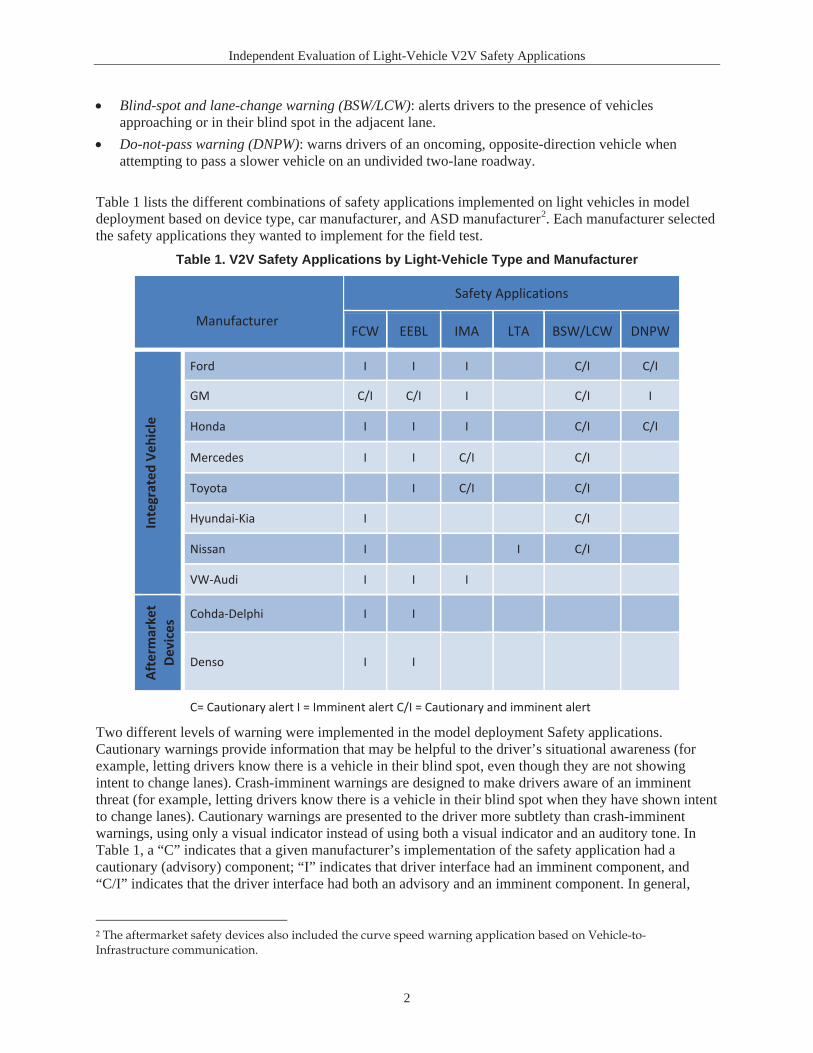
Table 1 lists the different combinations of safety applications implemented on light vehicles in model deployment based on device type, car manufacturer, and ASD manufacturer2. Each manufacturer selected the safety applications they wanted to implement for the field test.
Table 1. V2V Safety Applications by Light-Vehicle Type and Manufacturer
Safety Applications
Manufacturer FCW EEBL IMA LTA BSW/LCW DNPW
Ford I I I C/I C/I
GM C/I C/I I C/I I
hicl
e Honda I I I C/I C/I
e V Mercedes I I C/I C/I
d Toyota I C/I C/I
Inte
grat
e
Hyundai-Kia I C/I
Nissan I I C/I
VW-Audi I I I
aret
De
vice
s Cohda-Delphi I I
rk
Denso I I
Afte
m
C= Cautionary alert I = Imminent alert C/I = Cautionary and imminent alert
Two different levels of warning were implemented in the model deployment Safety applications. Cautionary warnings provide information that may be helpful to the driver’s situational awareness (for example, letting drivers know there is a vehicle in their blind spot, even though they are not showing intent to change lanes). Crash-imminent warnings are designed to make drivers aware of an imminent threat (for example, letting drivers know there is a vehicle in their blind spot when they have shown intent to change lanes). Cautionary warnings are presented to the driver more subtlety than crash-imminent warnings, using only a visual indicator instead of using both a visual indicator and an auditory tone. In Table 1, a “C” indicates that a given manufacturer’s implementation of the safety application had a cautionary (advisory) component; “I” indicates that driver interface had an imminent component, and “C/I” indicates that the driver interface had both an advisory and an imminent component. In general,
2 The aftermarket safety devices also included the curve speed warning application based on Vehicle-to-Infrastructure communication.

Independent Evaluation of Light-Vehicle V2V Safety Applications
3
when both warning types are implemented, the cautionary warning would be issued first, and if the scenario is escalated to a higher threat, it would be followed by the imminent warning.
This evaluation focuses on the crash-imminent component of the safety applications since crash-imminent alerts have a direct safety impact in potential crash scenarios, while cautionary warnings provide situational awareness.
The results of some analyses in this evaluation are broken down by device manufacturer to better understand the range of performances across different implementations of the safety applications. Since it is not the intent of this evaluation to rank manufacturers against each other, results are not identified by manufacturer name and instead are identified generically as “Manufacturer 1,” “Manufacturer 2,” etc.
Due to the availability of data, this evaluation focuses on FCW, IMA, and BSW/LCW safety applications. LTA, and DNPW were installed in relatively few vehicles (see Table 1), and the driving scenarios that trigger EEBL warnings are rare in urban driving environments like the model deployment test area. As a result, there was not enough data generated to conduct statistical analyses on these safety applications.
1.2 Model DeploymentThis evaluation is based on data collected during the Safety Pilot Model Deployment, which deployed about 2,800 vehicles equipped with DSRC devices with V2V and V2I safety applications on public roadways in Ann Arbor, MI. The goal of the model deployment was to collect performance data on DSRC technology and on DSRC-based safety applications operating in real-world conditions. The one-year model deployment launched on August 21, 2012 and collected data from a variety of different types of vehicles (passenger cars, heavy trucks, and transit buses) and DSRC devices.
1.2.1 Determination of Fleet NeedsVolpe performed a preliminary study in 2010 to determine the needs for the Safety Pilot Model Deployment in terms of (1) the number of test subjects driving the host vehicles; (2) the number of host light vehicles equipped with integrated V2V safety applications; and (3) the number of remote vehicles equipped with DSRC devices capable of transmitting the Basic safety message. These estimates were based on data and results from the IVBSS field operational test, a prior naturalistic field test of the FCW safety application [2]. Volpe estimated the required number of test subjects, host vehicles, and DSRC-equipped remote vehicles from the rate of subject exposure to FCW alerts.
Volpe recommended that the Safety Pilot V2V Model Deployment design include the following minimum requirements to observe sufficient exposure to alerts for system capability evaluation, and to enable the analysis of unintended consequences and driver acceptance evaluation:
A total of 108 test subjects evenly split into 6 groups (2 gender × 3 age) of 18 subjects each. A 20-week exposure per participant, split into 2-week baseline and 18-week treatment periods.A total of 55 integrated light vehicles with 2 test participants per vehicle (54 per design plus 1 spare vehicle).Between 2,500 and 3,000 additional DSRC-equipped vehicles.Careful selection of the test area and targeted selection of test participants based on travel patterns to maximize V2V interactions.
1.2.2 Experimental DesignParticipants in the model deployment who operated light vehicles were residents of Ann Arbor, Michigan. Some participants were provided with an integrated light vehicle, while others had an aftermarket DSRC
Independent Evaluation of Light-Vehicle V2V Safety Applications
4
device installed in their personal vehicle. A total of 127 participants drove integrated vehicles for 6 months: 64 participants drove during the first 6 months of the year in the Safety Pilot Model Deployment (referred to as Phase 1) and 63 participants drove during the second 6 months of the year (Phase 2).3
Integrated vehicle participants were balanced for age and gender, the 20–30, 40–50, and 60–70 year old age groups, respectively.
Participants who had ASDs installed in their vehicle (293 participants) drove the equipped light vehicles during the entire 12 months of the Safety Pilot Model Deployment.4 The ASD safety applications were enabled throughout their participation.
All participants were instructed to use the V2V-equipped vehicle during their participation as they would typically use their personal vehicle.
In addition to the integrated and ASD-equipped light vehicles, the Safety Pilot Model Deployment also deployed a total of approximately 2,390 vehicle awareness devices5 in about 2,220 passenger vehicles, 75 buses, and 100 medium/heavy trucks. VADs transmit the Basic safety message so that they can be detected by other V2V-equipped vehicles, but they do not receive messages or provide safety application alerts to the drivers. VADs are “visible” by other device types, but are significantly less expensive and easier to install than integrated devices or ASDs, allowing more DSRC devices to be deployed. Additionally, three transit buses and 19 heavy trucks were also retrofitted with DSRC devices and V2V and V2I safety applications.
1.2.3 Recruitment StrategyUMTRI the model deployment test conductor recruited the study participants. The recruitment strategy was designed to maximize equipped vehicle traffic around the model deployment area. The goal was to create same-direction and cross traffic V2V interactions (scenarios where two V2V-equipped vehicles are in close proximity). UMTRI targeted participants who lived and worked in the Ann Arbor area for the study and recruited primarily through the Ann Arbor public school system (via memos sent to all parents) and the University of Michigan Hospital (via e-mails sent to those whose home address was within the model deployment area). Memos and emails included an application website where potential participants could enter demographic and driving habit information. Participants were paid $200 each.
Participants recruited through the school system were given the option to donate their payment to the Ann Arbor public school system as a fundraiser (many participants selected this option, but the safety pilot program did not track donations).
In Phase 1, UMTRI selected participants who drove integrated light vehicles, based on their self-reported frequency of driving on certain road segments in the model deployment geographic area (this information was collected as part of the application process). The next round of integrated vehicle participants (Phase 2 participants) were selected from the existing pool of 2,800 participants, based on their observed driving patterns and frequency of driving on certain road segments during Phase 1 of the model deployment.
To support UMTRI’s recruitment strategy, Volpe developed a regional traffic microsimulation model to estimate the number and spatial/temporal locations of V2V interactions under various deployment/recruitment strategies [3] using the following methodology:
3 One of the 64 vehicles was damaged during Phase 1, so only 63 vehicles were launched for Phase 2. 4 Of the 293 aftermarket safety device vehicles, 93 were equipped with data acquisition systems to collect detailed objective data on device performance. All objective results related to ASD alerts reflect the performance of these 93 devices. 5 The total number of VADs was not static over the course of the model deployment because VAD vehicles occasionally left the study for updates/repair and then redeployed.
Independent Evaluation of Light-Vehicle V2V Safety Applications
5
1. Convert the existing regional network planning model for the Ann Arbor area to a sub-regional microsimulation model.
2. Develop a method to identify the numbers, origins, and destinations of trips using equipped vehicles.
3. Write post-processing code to track all equipped vehicles from the second-by-second microsimulation vehicle snapshot data and to identify interactions between equipped vehicles. Interaction information was then integrated with available IVBSS data to estimate the potential number of conflicts among equipped vehicles.
Volpe used the model to assess various recruitment strategies that would support the experimental design that identified the level of V2V interactions needed in the model deployment area.
1.2.4 Integrated Vehicle Safety Application Software ModificationsCAMP implemented software changes to reduce the frequency of false positive alerts to the FCW and IMA safety applications between Phase 1 and Phase 2 of the model deployment. These changes are described in the CAMP report Vehicle-to-Vehicle Safety System Light Vehicle Builds and Model Deployment Support (V2V-MD).6 Since different software was implemented in each test phase, Volpe’s evaluation includes separate results for each phase.
1.3 Light Vehicle Participant DemographicsThis subsection provides an overview of the demographics for the light vehicle participants in the model deployment.
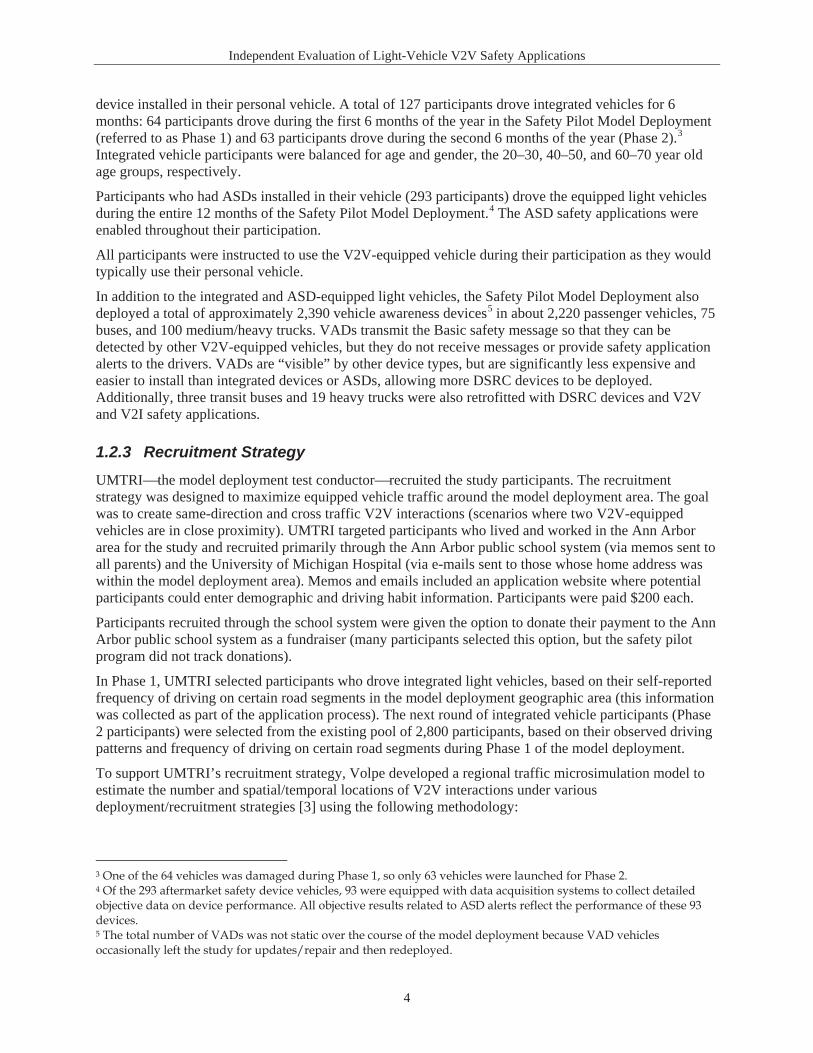
1.3.1 Integrated VehiclesFigure 1 shows the demographic distribution of the integrated vehicle participants in Phase 1 and Phase 2.Of the 127 participants, 64 were female and 63 were male. There were 43 younger participants (20 to 30years old), and the remaining participants were split equally between the middle-aged (40 50) and older (60 to 70) age groups (42 participants each).
Figure 1. Number of Integrated Light Vehicle Participants by Age and Gender
6 Vehicle-to-Vehicle Safety System Light Vehicle Builds and Model Deployment Support (V2V-MD, Final Report, Volume 1 – Model Deployment, August 1, 2011 – July 31, 2014. (Working Paper). Refer to Appendix A.
Independent Evaluation of Light-Vehicle V2V Safety Applications
6
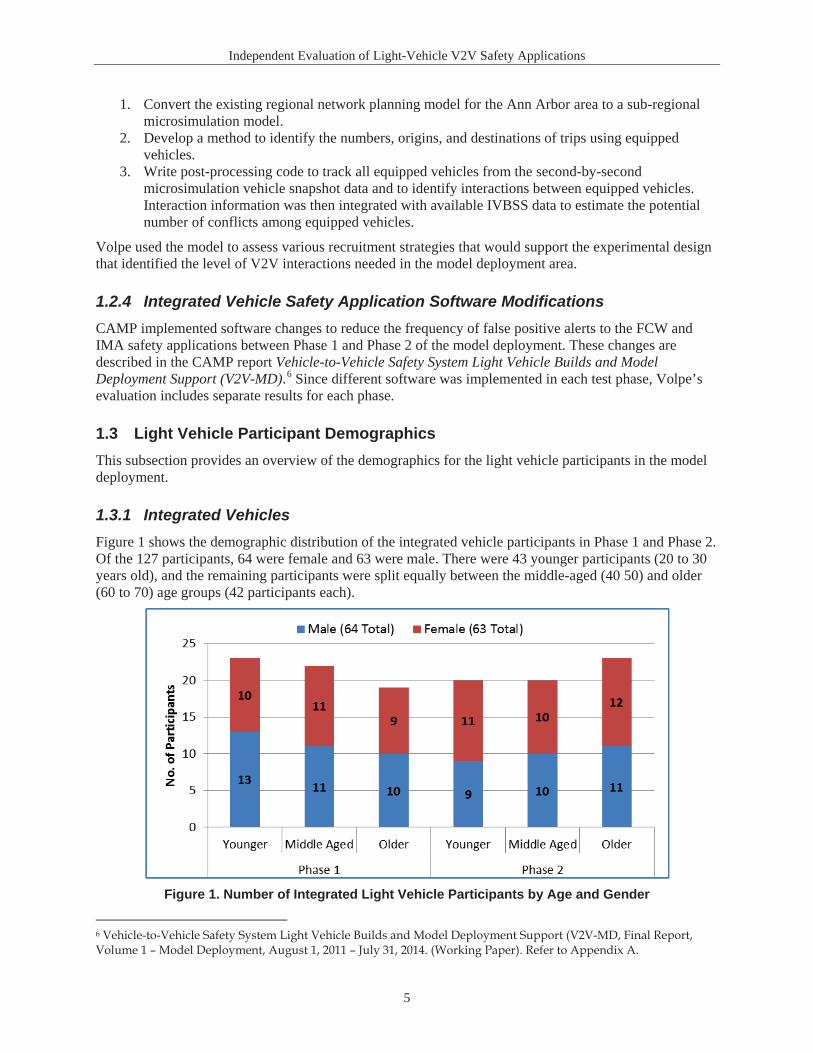
Figure 2 shows the average age of integrated light vehicle participant by age group (error bars represent the standard deviation between participants in each group). On average, younger participants were 27 years old, middle-aged participants were 45 years old, and older participants were 64 years old.
Figure 2. Average Integrated Light Vehicle Participant Age by Age
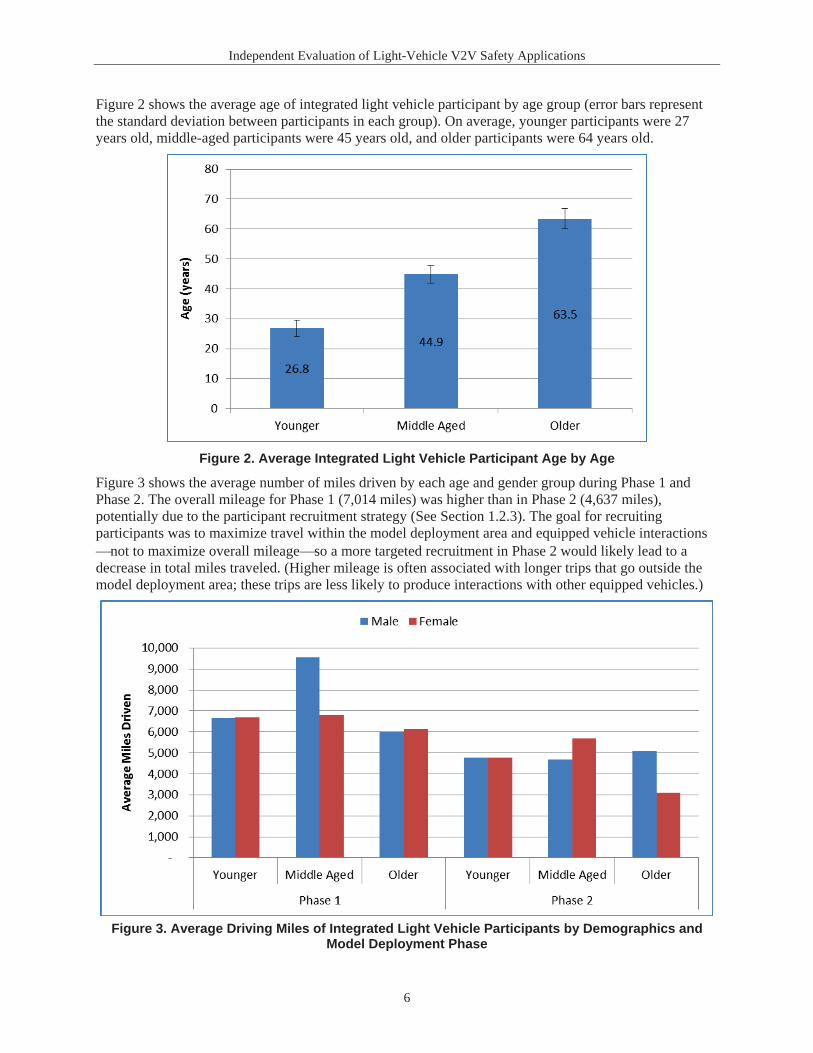
Figure 3 shows the average number of miles driven by each age and gender group during Phase 1 and Phase 2. The overall mileage for Phase 1 (7,014 miles) was higher than in Phase 2 (4,637 miles), potentially due to the participant recruitment strategy (See Section 1.2.3). The goal for recruiting participants was to maximize travel within the model deployment area and equipped vehicle interactions
not to maximize overall mileage so a more targeted recruitment in Phase 2 would likely lead to a decrease in total miles traveled. (Higher mileage is often associated with longer trips that go outside the model deployment area; these trips are less likely to produce interactions with other equipped vehicles.)
Figure 3. Average Driving Miles of Integrated Light Vehicle Participants by Demographics and Model Deployment Phase
Independent Evaluation of Light-Vehicle V2V Safety Applications
7
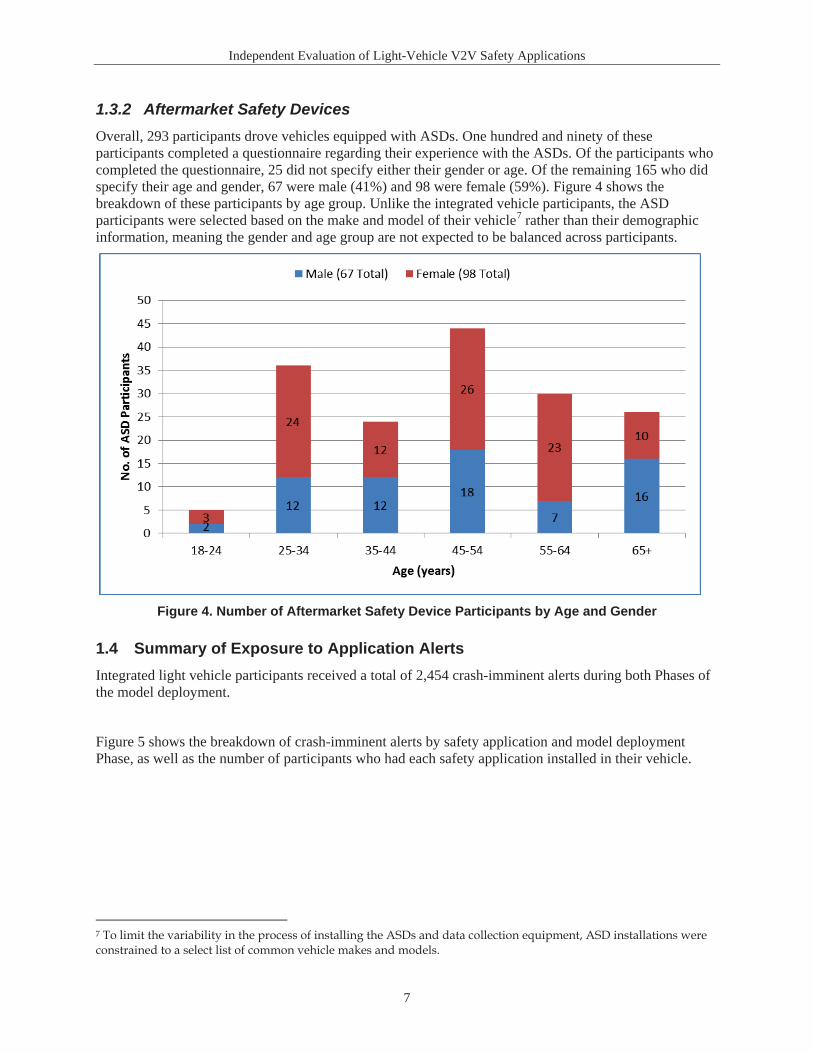
1.3.2 Aftermarket Safety DevicesOverall, 293 participants drove vehicles equipped with ASDs. One hundred and ninety of these participants completed a questionnaire regarding their experience with the ASDs. Of the participants who completed the questionnaire, 25 did not specify either their gender or age. Of the remaining 165 who did specify their age and gender, 67 were male (41%) and 98 were female (59%). Figure 4 shows the breakdown of these participants by age group. Unlike the integrated vehicle participants, the ASDparticipants were selected based on the make and model of their vehicle7 rather than their demographic information, meaning the gender and age group are not expected to be balanced across participants.
Figure 4. Number of Aftermarket Safety Device Participants by Age and Gender
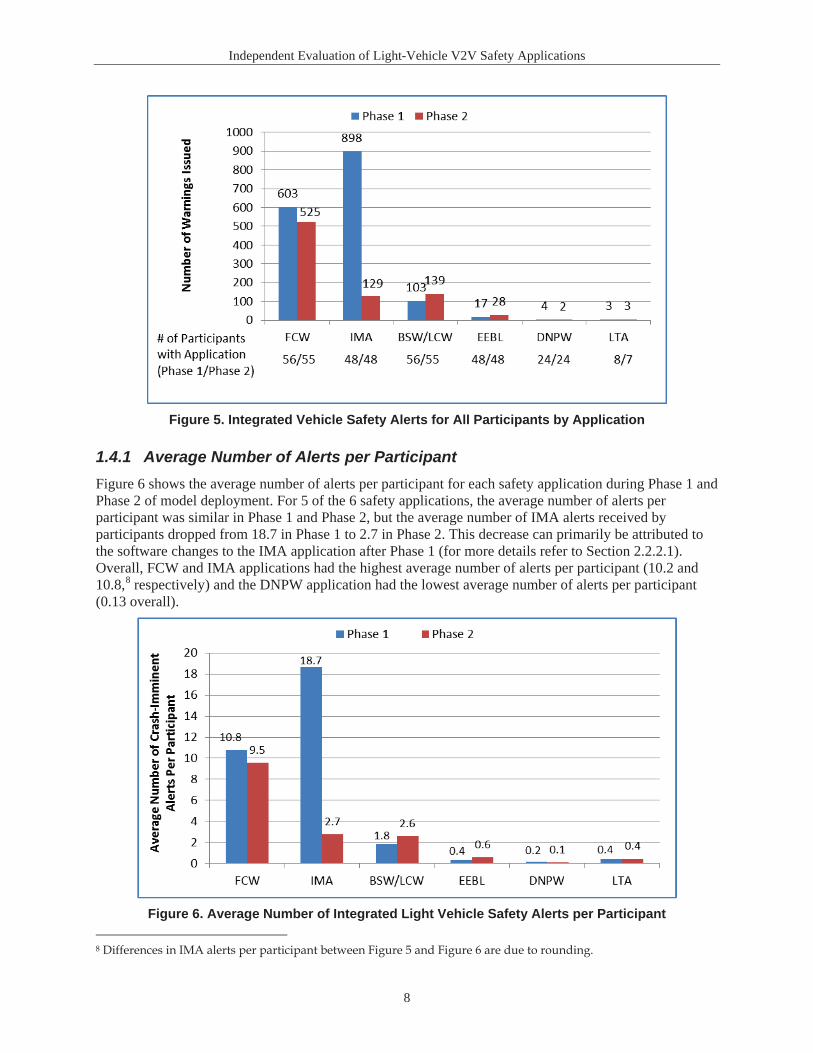
1.4 Summary of Exposure to Application AlertsIntegrated light vehicle participants received a total of 2,454 crash-imminent alerts during both Phases of the model deployment.
Figure 5 shows the breakdown of crash-imminent alerts by safety application and model deployment Phase, as well as the number of participants who had each safety application installed in their vehicle.
7 To limit the variability in the process of installing the ASDs and data collection equipment, ASD installations were constrained to a select list of common vehicle makes and models.
Independent Evaluation of Light-Vehicle V2V Safety Applications
8
Figure 5. Integrated Vehicle Safety Alerts for All Participants by Application
1.4.1 Average Number of Alerts per ParticipantFigure 6 shows the average number of alerts per participant for each safety application during Phase 1 and Phase 2 of model deployment. For 5 of the 6 safety applications, the average number of alerts per participant was similar in Phase 1 and Phase 2, but the average number of IMA alerts received by participants dropped from 18.7 in Phase 1 to 2.7 in Phase 2. This decrease can primarily be attributed to the software changes to the IMA application after Phase 1 (for more details refer to Section 2.2.2.1).Overall, FCW and IMA applications had the highest average number of alerts per participant (10.2 and 10.8,8 respectively) and the DNPW application had the lowest average number of alerts per participant (0.13 overall).
Figure 6. Average Number of Integrated Light Vehicle Safety Alerts per Participant
8 Differences in IMA alerts per participant between Figure 5 and Figure 6 are due to rounding.
Independent Evaluation of Light-Vehicle V2V Safety Applications
9
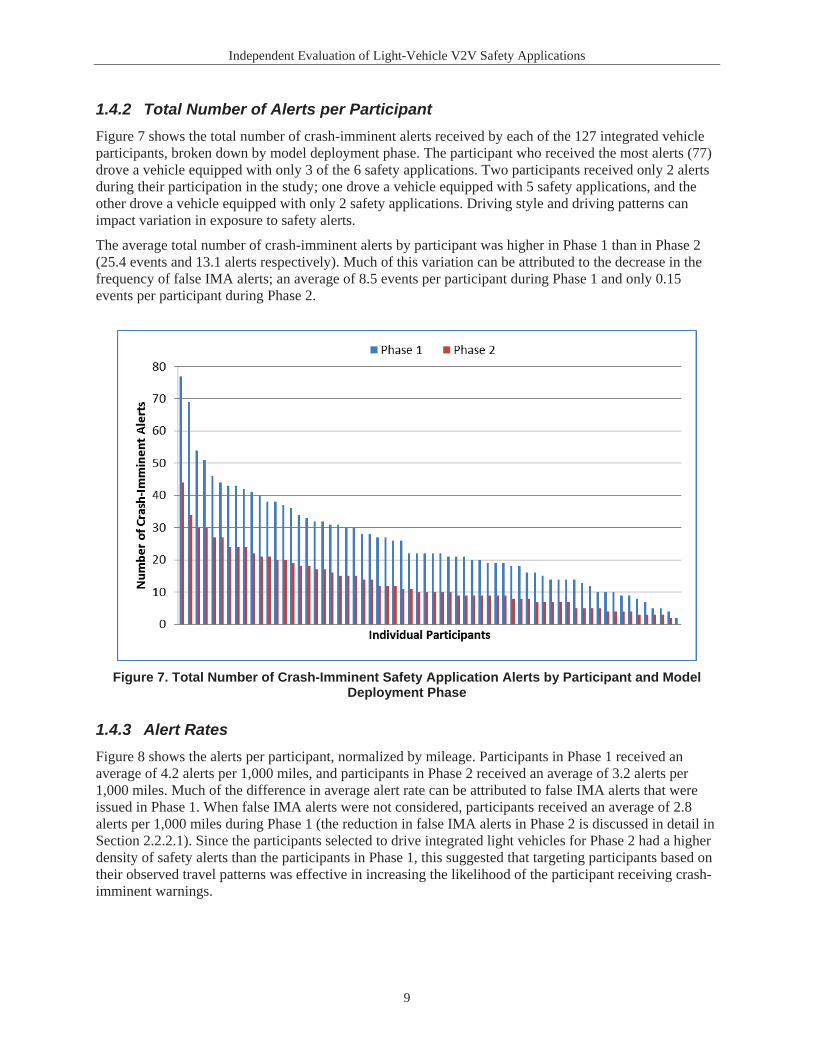
1.4.2 Total Number of Alerts per ParticipantFigure 7 shows the total number of crash-imminent alerts received by each of the 127 integrated vehicle participants, broken down by model deployment phase. The participant who received the most alerts (77) drove a vehicle equipped with only 3 of the 6 safety applications. Two participants received only 2 alerts during their participation in the study; one drove a vehicle equipped with 5 safety applications, and the other drove a vehicle equipped with only 2 safety applications. Driving style and driving patterns can impact variation in exposure to safety alerts.
The average total number of crash-imminent alerts by participant was higher in Phase 1 than in Phase 2 (25.4 events and 13.1 alerts respectively). Much of this variation can be attributed to the decrease in the frequency of false IMA alerts; an average of 8.5 events per participant during Phase 1 and only 0.15 events per participant during Phase 2.
Figure 7. Total Number of Crash-Imminent Safety Application Alerts by Participant and Model Deployment Phase
1.4.3 Alert RatesFigure 8 shows the alerts per participant, normalized by mileage. Participants in Phase 1 received an average of 4.2 alerts per 1,000 miles, and participants in Phase 2 received an average of 3.2 alerts per 1,000 miles. Much of the difference in average alert rate can be attributed to false IMA alerts that were issued in Phase 1. When false IMA alerts were not considered, participants received an average of 2.8 alerts per 1,000 miles during Phase 1 (the reduction in false IMA alerts in Phase 2 is discussed in detail in Section 2.2.2.1). Since the participants selected to drive integrated light vehicles for Phase 2 had a higher density of safety alerts than the participants in Phase 1, this suggested that targeting participants based on their observed travel patterns was effective in increasing the likelihood of the participant receiving crash-imminent warnings.

Independent Evaluation of Light-Vehicle V2V Safety Applications
10
Figure 8. Distribution of Integrated Light-Vehicle Participants by the Number of Crash-Imminent Alerts per 1,000 Miles Driven in Each Model Deployment Phase
1.5 Independent Evaluation GoalsThe goals of the independent evaluation of the V2V safety applications installed in light vehicles in theSafety Pilot Model Deployment are to:
1. Characterize system performance and capability of the safety applications. This goal addresses the ability of the safety applications to appropriately issue warnings in the model deployment environment.
2. Determine if there are unintended consequences from driving with V2V safety applications. The second goal determines if there are any observed instances of negative behavior adaptations associated with the safety applications.
3. Determine driver acceptance of the safety applications. The third goal evaluates usability of the technology and driver acceptance. The evaluation covers whether or not participants perceive a safety benefit from using the technology, such as using the technology or understanding the technology; and identify any concerns that participants might have about security and privacy if this technology were to be deployed.
The evaluation addresses all three goals for the integrated vehicles. For aftermarket devices, the goal is to assess the feasibility of using these devices as a way to accelerate deployment of V2V technology into the vehicle fleet. Thus, the evaluation of aftermarket safety devices addresses system capability and driver acceptance.
1.6 Data SourcesVolpe used data from the model deployment to evaluate the light-vehicle safety applications in the Safety pilot. There are two primary types of data; objective and subjective.
Both objective and subjective data were collected for all participants who drove integrated light vehicles.Prior to their participation, drivers were told what data would be collected and how it would be used.Drivers who agreed to participate consented to the collection of their driving data during the field test.
Independent Evaluation of Light-Vehicle V2V Safety Applications
11
Of the 293 participants who drove Aftermarket Safety Devices, 93 drove vehicles that collected objective data. Even though all of the 293 participants received surveys, there was subjective data for only 193 because 100 participants did not respond to the questionnaire.
1.6.1 Objective DataThe objective data consists of numerical and video data. Objective data were collected by a data acquisition system connected to the vehicle’s controller area network bus, DSRC device, and other external sensors. Data were collected continuously when the ignition of the equipped vehicle is turned on.
The numerical data were collected and stored at a rate of 10 Hz, and consist of the following categories.
In-vehicle data: data collected from the vehicle’s CAN about vehicle inputs (e.g., steering/throttle/controls) and vehicle dynamics (e.g., speed/acceleration)V2V data: information about other equipped vehicles within DSRC range (e.g., speed/heading/location)External sensors: location of surrounding objects and the host vehicle’s position within the lane (e.g., lane tracking/forward radar)Application data: information about when and why types of alerts are being issued to the participants
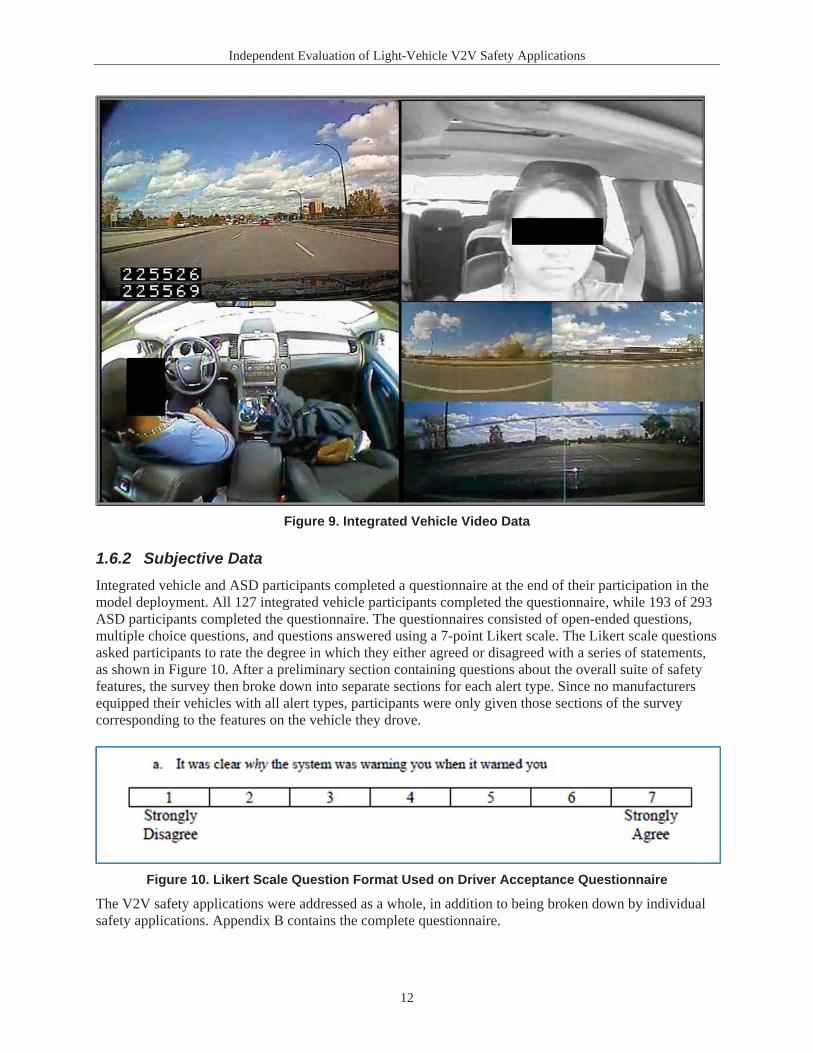
Either 6 (integrated vehicles) or 4 (ASD vehicles) video views are captured and synchronized with the numerical data. The video data allowed Volpe to view almost 360 degrees of the vehicle surroundings. Figure 9 shows the video views for the integrated vehicle data. These include (clockwise from top left):
Forward Driver’s face,Left and right sides,Rear, andCabin (driver activities and instrument panel).
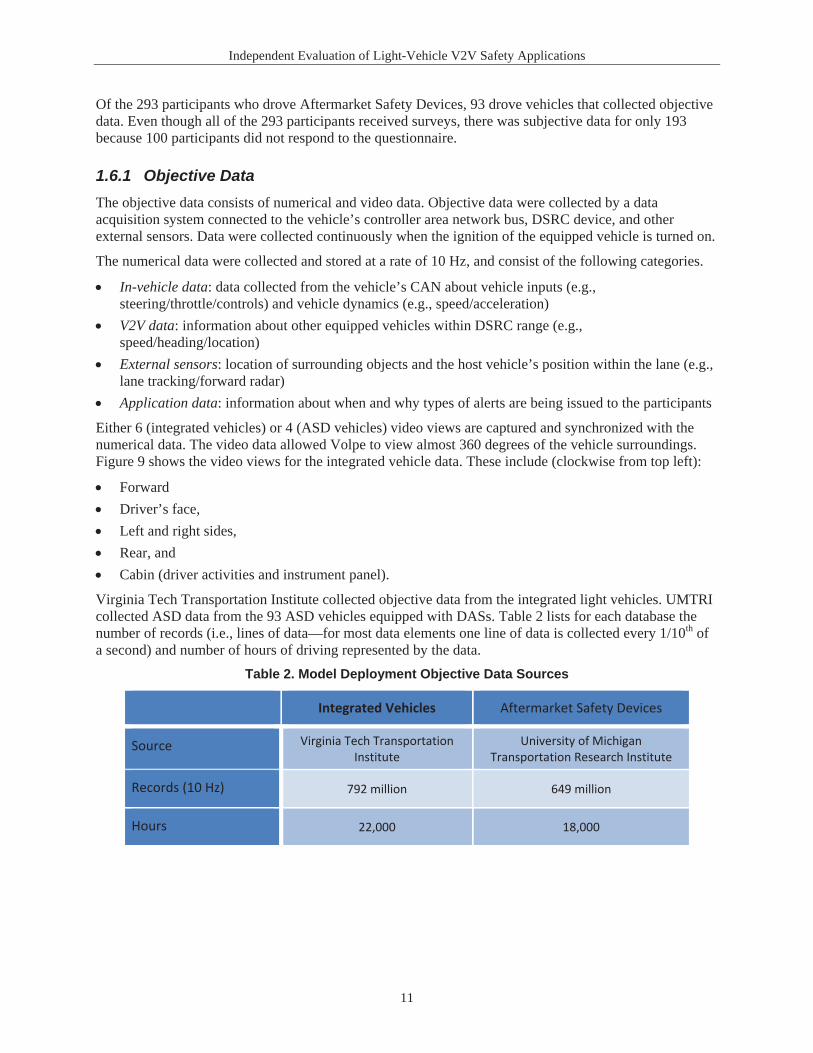
Virginia Tech Transportation Institute collected objective data from the integrated light vehicles. UMTRIcollected ASD data from the 93 ASD vehicles equipped with DASs. Table 2 lists for each database the number of records (i.e., lines of data—for most data elements one line of data is collected every 1/10th of a second) and number of hours of driving represented by the data.
Table 2. Model Deployment Objective Data Sources
Integrated Vehicles Aftermarket Safety Devices
Source Virginia Tech Transportation Institute
University of Michigan Transportation Research Institute
Records (10 Hz) 792 million 649 million
Hours 22,000 18,000
Independent Evaluation of Light-Vehicle V2V Safety Applications
12
Figure 9. Integrated Vehicle Video Data
1.6.2 Subjective DataIntegrated vehicle and ASD participants completed a questionnaire at the end of their participation in the model deployment. All 127 integrated vehicle participants completed the questionnaire, while 193 of 293 ASD participants completed the questionnaire. The questionnaires consisted of open-ended questions, multiple choice questions, and questions answered using a 7-point Likert scale. The Likert scale questions asked participants to rate the degree in which they either agreed or disagreed with a series of statements, as shown in Figure 10. After a preliminary section containing questions about the overall suite of safety features, the survey then broke down into separate sections for each alert type. Since no manufacturers equipped their vehicles with all alert types, participants were only given those sections of the survey corresponding to the features on the vehicle they drove.
Figure 10. Likert Scale Question Format Used on Driver Acceptance Questionnaire
The V2V safety applications were addressed as a whole, in addition to being broken down by individual safety applications. Appendix B contains the complete questionnaire.

Independent Evaluation of Light-Vehicle V2V Safety Applications
13
1.6.3 Mapping Data Sources to GoalsTable 3 lists the data sources used to address each of the three evaluation goals summarized in Section1.5.
The system capability and safety impact analyses only used objective data, while the driver acceptance used a combination of objective and subjective data. Volpe addressed safety impact using only data from integrated vehicles, since these vehicles included a variety of safety applications and had an integrated driver vehicle interface that was similar to how the safety applications would be implemented in production. System capability and driver acceptance were addressed with both integrated vehicle and ASD data.
Table 3. Breakdown of Evaluation Data Sources and Goals
Evaluation Goals
Integrated Vehicles Aftermarket Safety Devices
Objective Subjective Objective Subjective
System Capability X X
Unintended Consequences
X
Driver Acceptance X X
X

Independent Evaluation of Light-Vehicle V2V Safety Applications
14
2 System CapabilityThe system capability analysis characterizes the ability of the V2V applications to perform as expected in the model deployment environment. While the analysis focuses on performance of the safety applications,the results inherently reflect the model deployment environment as a whole, which includes the security implemented to provide trusted and secure V2V communications and the variety of different prototype devices and antenna configurations. The performance of the integrated safety applications is impacted both by the safety application software and the quality of the data sent and received from other V2V-equipped vehicles.
The ASD analysis determines the feasibility of deploying aftermarket V2V devices into the US vehicle fleet as a way to increase the rate at which V2V is launched into the field. This feasibility is assessed by comparing the performance of the FCW application between aftermarket safety devices and integrated vehicles.
The system capability analysis conducted by Volpe addresses the observed performance of the safety applications during the Safety pilot Model Deployment and is based on visual inspection of video data, backed by relevant numerical data. It does not attempt to explain the root cause of the observed performance.
2.1 Technical ApproachThis subsection describes the technical approach used to characterize the capability of the V2V safety applications in the model deployment.
2.1.1 Application Performance The purpose of this analysis is to understand how the safety applications performed in the model deployment environment. Crash-imminent alerts were categorized based on the target location and driving scenario when application alerts were issued. Alerts were classified as potentially valid or invalid based on the type of driving scenario each individual application was designed to address. In addition to examining alerts, Volpe looked at missed alerts (false negatives); scenarios where a valid warning trigger was present and basic alert conditions were satisfied, but an alert was not issued.
Table 4 lists alert classification based on target location.Table 4. Alert Classification by Target Location
Target Location
In-Position Out-Of-Position No Target
Alert Valid Alert False Alert False Alert
No Alert Missed Alert9 Valid Rejection Valid Rejection
2.1.1.1 Alert ClassificationsVolpe classified alerts using their own video analysis tool. This tool synchronizes and displays video from 10 seconds before and 5 seconds after each application alert, in addition to the corresponding numerical data from the database and the physical location of the host and remote vehicles (on a map). It
9 This classification also includes other criteria for alert type (See Appendix D).
Independent Evaluation of Light-Vehicle V2V Safety Applications
15
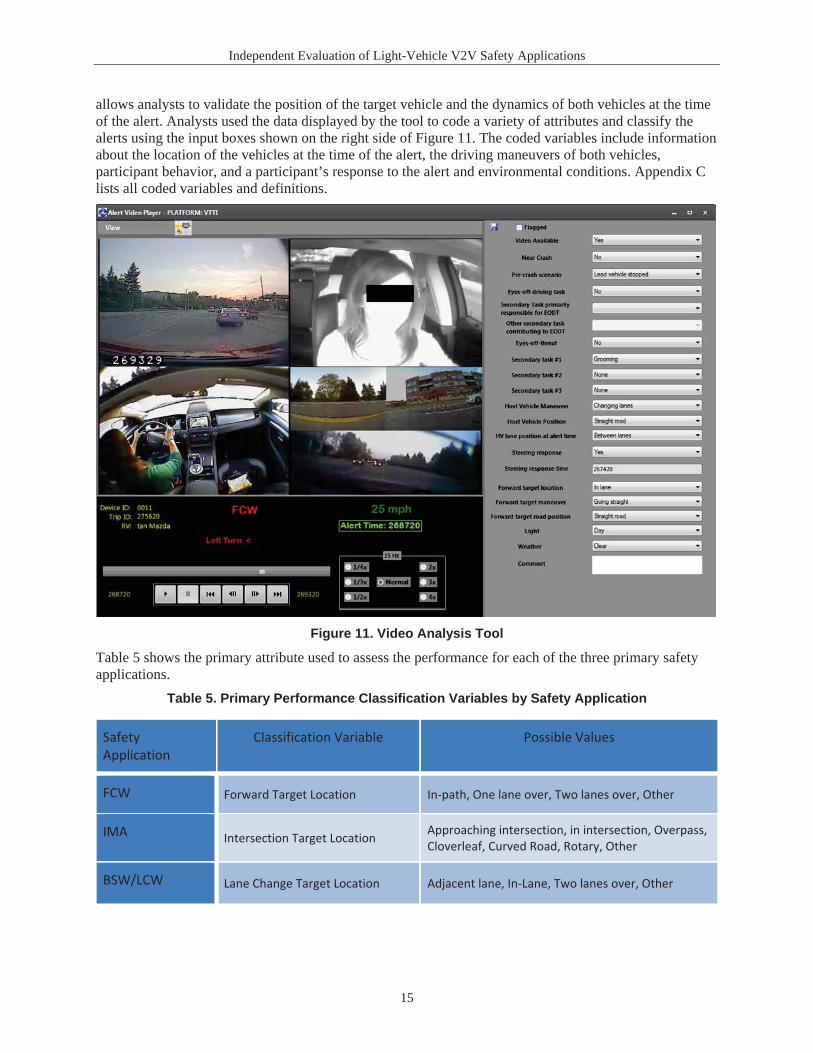
allows analysts to validate the position of the target vehicle and the dynamics of both vehicles at the time of the alert. Analysts used the data displayed by the tool to code a variety of attributes and classify the alerts using the input boxes shown on the right side of Figure 11. The coded variables include information about the location of the vehicles at the time of the alert, the driving maneuvers of both vehicles,participant behavior, and a participant’s response to the alert and environmental conditions. Appendix Clists all coded variables and definitions.
Figure 11. Video Analysis Tool
Table 5 shows the primary attribute used to assess the performance for each of the three primary safety applications.
Table 5. Primary Performance Classification Variables by Safety Application
Safety Application
Classification Variable Possible Values
FCW Forward Target Location In-path, One lane over, Two lanes over, Other
IMA Intersection Target Location Approaching intersection, in intersection, Overpass, Cloverleaf, Curved Road, Rotary, Other
BSW/LCW Lane Change Target Location Adjacent lane, In-Lane, Two lanes over, Other

Independent Evaluation of Light-Vehicle V2V Safety Applications
16
Additional variables used in the alert classification breakdowns include:
Device manufacturer,Target device type (Integrated vehicle, aftermarket device, vehicle awareness device, heavy truck, etc.),Road curvature,Target vehicle speed, andModel deployment phase (Phase 1/Phase 2).
2.1.1.2 Missed AlertsThe Evaluation also addresses missed alert scenarios, because if a safety application fails to issue an alert in a driving scenario that it was designed to address, the application cannot provide a safety benefit to thedriver.
Volpe approached the analysis of missed alerts in an exploratory manner, with the intent to find scenarios that resembled the vehicle dynamics of the alert scenarios that did not trigger alerts. This analysis was not intended to be exhaustive, but rather to gain anecdotal insight into the types of scenarios in which missed alerts occurred. Volpe does not have the proprietary warning logic to determine when alerts should be issued or suppressed, and therefore cannot confirm or deny the presence of a missed alert. Volpe has sent the potential missed alert scenarios derived through this analysis to the vehicle manufacturers for further analyses and explanation.
The approach for extracting potential missed alerts varies considerably by safety application. Appendix Cdescribes detailed methodologies for extracting potential missed alerts for each safety application.
2.2 System Capability ResultsThe following subsection contains bar charts and scatter plots displaying the application performance results, broken down by device type and safety application. Results are also presented for the proportion of alerts in each category that were analyzed. Labels on top of the bars represent the total number of events in each category.
2.2.1 FCWThis subsection presents results of application performance and missed alerts analyses for integrated vehicle FCW warnings. Because software modifications were made to the FCW application between Phase 1 and Phase 2 (refer to Section 1.2.4), results are presented separately.
2.2.1.1 Integrated VehiclesThe intent of the FCW application is to warn drivers of slower-moving, slowing, or stopped vehicles in their path of travel. FCW performance results are therefore broken down by the relative location of the target vehicle at alert onset:
In-path: Refers to target vehicles that are in the same lane of travel and in the intended path of the host vehicle.10 Alerts were considered in-path if any part of the target vehicle was in the host vehicle’s lane at the onset of the alert.Out of path: Refers to targets that are either in the adjacent lane or two lanes over and therefore do not pose a threat to the host vehicle. Alerts in this category are false alerts.
10 Host vehicle: the vehicle the alert was issued to.
Independent Evaluation of Light-Vehicle V2V Safety Applications
17
Other: Refers to alerts triggered for target vehicles that are not ahead of the host vehicle (e.g., the target is behind or adjacent), or for targets that are ahead of the host vehicle, but traveling faster than the host (target vehicle is moving away). Alerts in this category are false alerts.
Thirteen FCW alerts could not be analyzed due to obstructed video footage and were not included in this analysis.
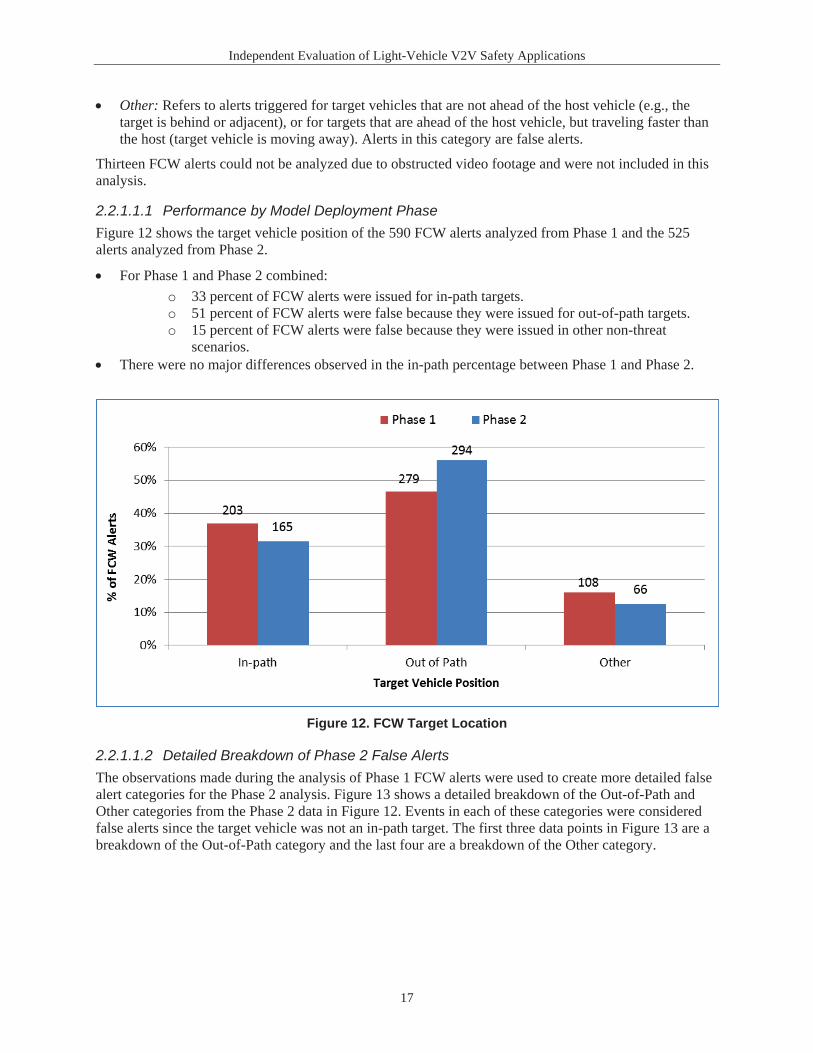
2.2.1.1.1 Performance by Model Deployment PhaseFigure 12 shows the target vehicle position of the 590 FCW alerts analyzed from Phase 1 and the 525 alerts analyzed from Phase 2.
For Phase 1 and Phase 2 combined:o 33 percent of FCW alerts were issued for in-path targets.o 51 percent of FCW alerts were false because they were issued for out-of-path targets.o 15 percent of FCW alerts were false because they were issued in other non-threat
scenarios.There were no major differences observed in the in-path percentage between Phase 1 and Phase 2.
Figure 12. FCW Target Location
2.2.1.1.2 Detailed Breakdown of Phase 2 False AlertsThe observations made during the analysis of Phase 1 FCW alerts were used to create more detailed false alert categories for the Phase 2 analysis. Figure 13 shows a detailed breakdown of the Out-of-Path and Other categories from the Phase 2 data in Figure 12. Events in each of these categories were considered false alerts since the target vehicle was not an in-path target. The first three data points in Figure 13 are a breakdown of the Out-of-Path category and the last four are a breakdown of the Other category.
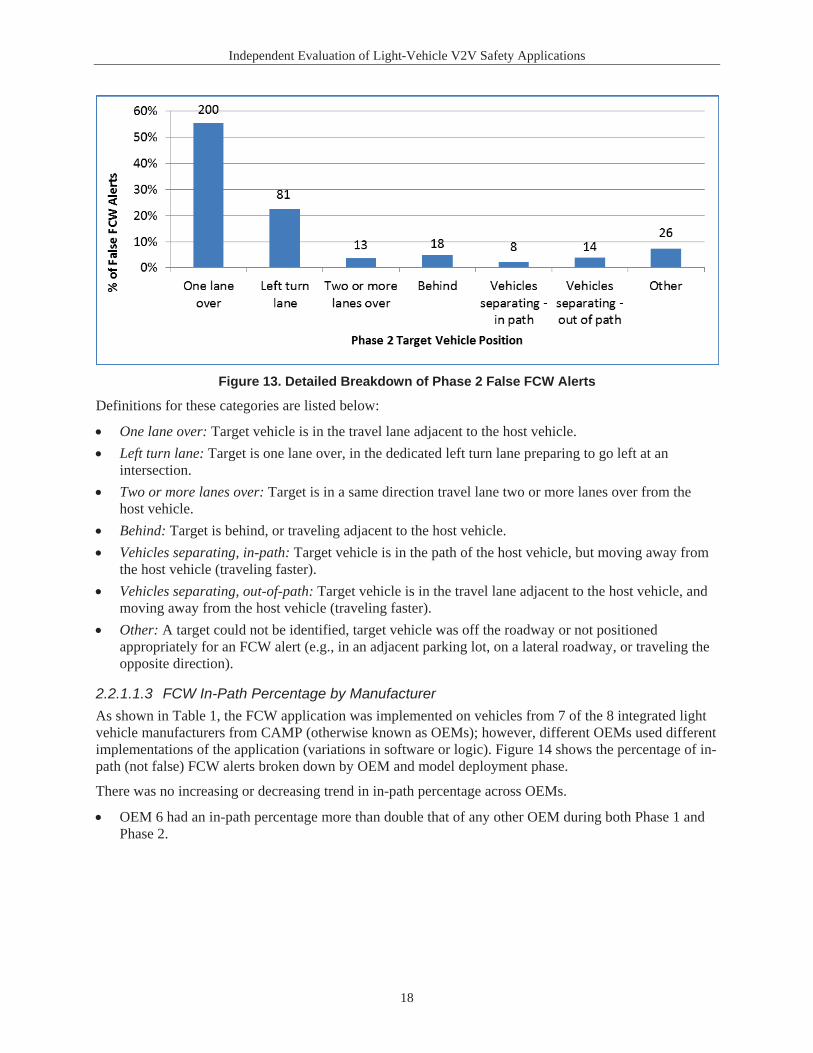
Independent Evaluation of Light-Vehicle V2V Safety Applications
18
Figure 13. Detailed Breakdown of Phase 2 False FCW Alerts
Definitions for these categories are listed below:
One lane over: Target vehicle is in the travel lane adjacent to the host vehicle.Left turn lane: Target is one lane over, in the dedicated left turn lane preparing to go left at an intersection.Two or more lanes over: Target is in a same direction travel lane two or more lanes over from the host vehicle.Behind: Target is behind, or traveling adjacent to the host vehicle.Vehicles separating, in-path: Target vehicle is in the path of the host vehicle, but moving away from the host vehicle (traveling faster).Vehicles separating, out-of-path: Target vehicle is in the travel lane adjacent to the host vehicle, and moving away from the host vehicle (traveling faster).Other: A target could not be identified, target vehicle was off the roadway or not positioned appropriately for an FCW alert (e.g., in an adjacent parking lot, on a lateral roadway, or traveling the opposite direction).
2.2.1.1.3 FCW In-Path Percentage by ManufacturerAs shown in Table 1, the FCW application was implemented on vehicles from 7 of the 8 integrated light vehicle manufacturers from CAMP (otherwise known as OEMs); however, different OEMs used different implementations of the application (variations in software or logic). Figure 14 shows the percentage of in-path (not false) FCW alerts broken down by OEM and model deployment phase.
There was no increasing or decreasing trend in in-path percentage across OEMs.
OEM 6 had an in-path percentage more than double that of any other OEM during both Phase 1 and Phase 2.
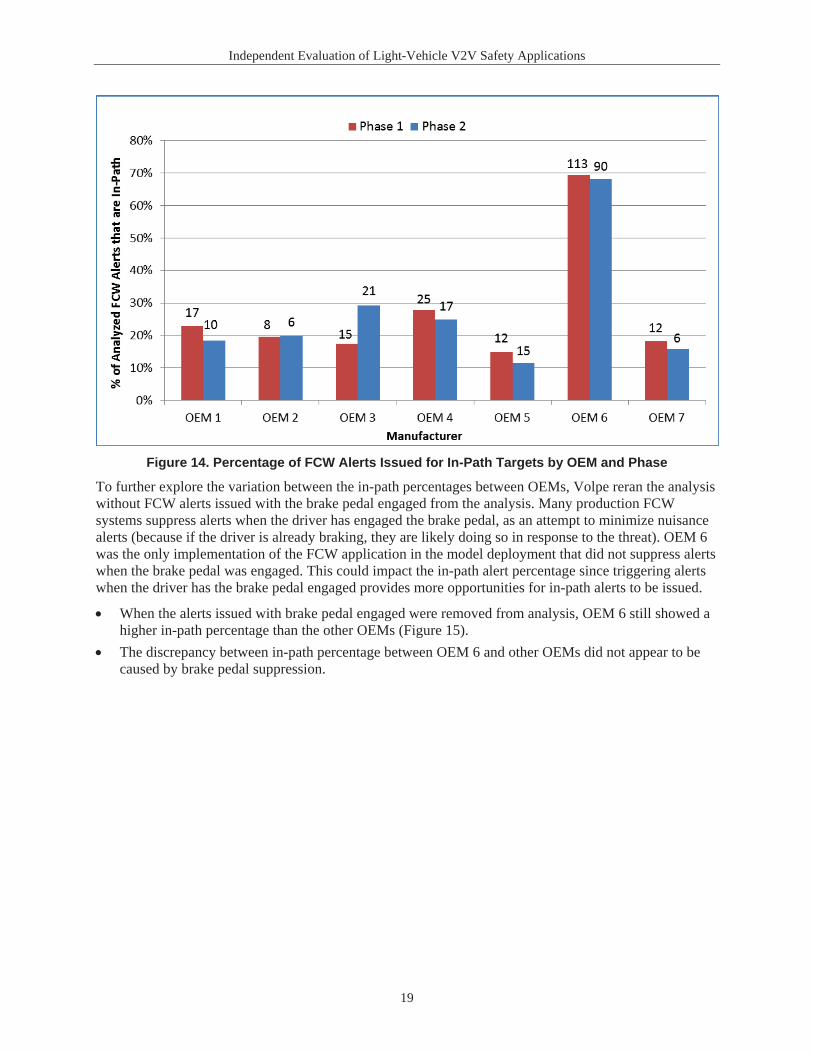
Independent Evaluation of Light-Vehicle V2V Safety Applications
19
Figure 14. Percentage of FCW Alerts Issued for In-Path Targets by OEM and Phase
To further explore the variation between the in-path percentages between OEMs, Volpe reran the analysis without FCW alerts issued with the brake pedal engaged from the analysis. Many production FCW systems suppress alerts when the driver has engaged the brake pedal, as an attempt to minimize nuisance alerts (because if the driver is already braking, they are likely doing so in response to the threat). OEM 6 was the only implementation of the FCW application in the model deployment that did not suppress alerts when the brake pedal was engaged. This could impact the in-path alert percentage since triggering alerts when the driver has the brake pedal engaged provides more opportunities for in-path alerts to be issued.
When the alerts issued with brake pedal engaged were removed from analysis, OEM 6 still showed a higher in-path percentage than the other OEMs (Figure 15).The discrepancy between in-path percentage between OEM 6 and other OEMs did not appear to be caused by brake pedal suppression.
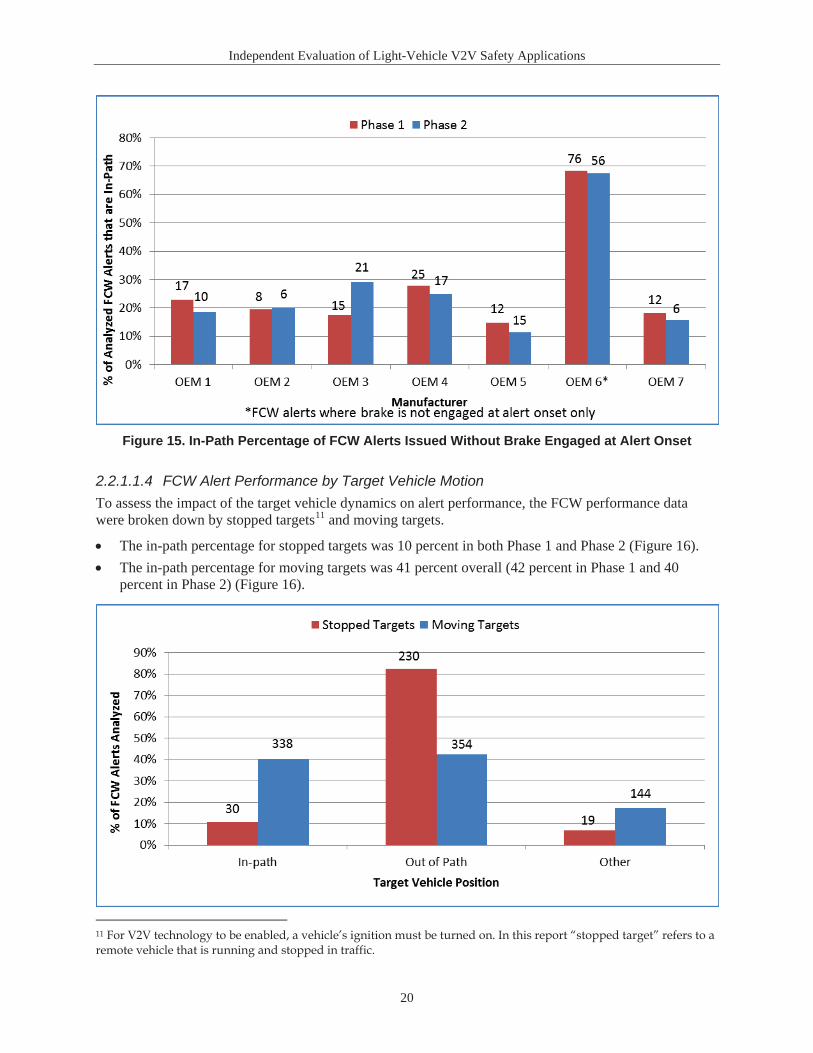
Independent Evaluation of Light-Vehicle V2V Safety Applications
20
Figure 15. In-Path Percentage of FCW Alerts Issued Without Brake Engaged at Alert Onset
2.2.1.1.4 FCW Alert Performance by Target Vehicle MotionTo assess the impact of the target vehicle dynamics on alert performance, the FCW performance data were broken down by stopped targets11 and moving targets.
The in-path percentage for stopped targets was 10 percent in both Phase 1 and Phase 2 (Figure 16).The in-path percentage for moving targets was 41 percent overall (42 percent in Phase 1 and 40 percent in Phase 2) (Figure 16).
11 For V2V technology to be enabled, a vehicle’s ignition must be turned on. In this report “stopped target” refers to a remote vehicle that is running and stopped in traffic.
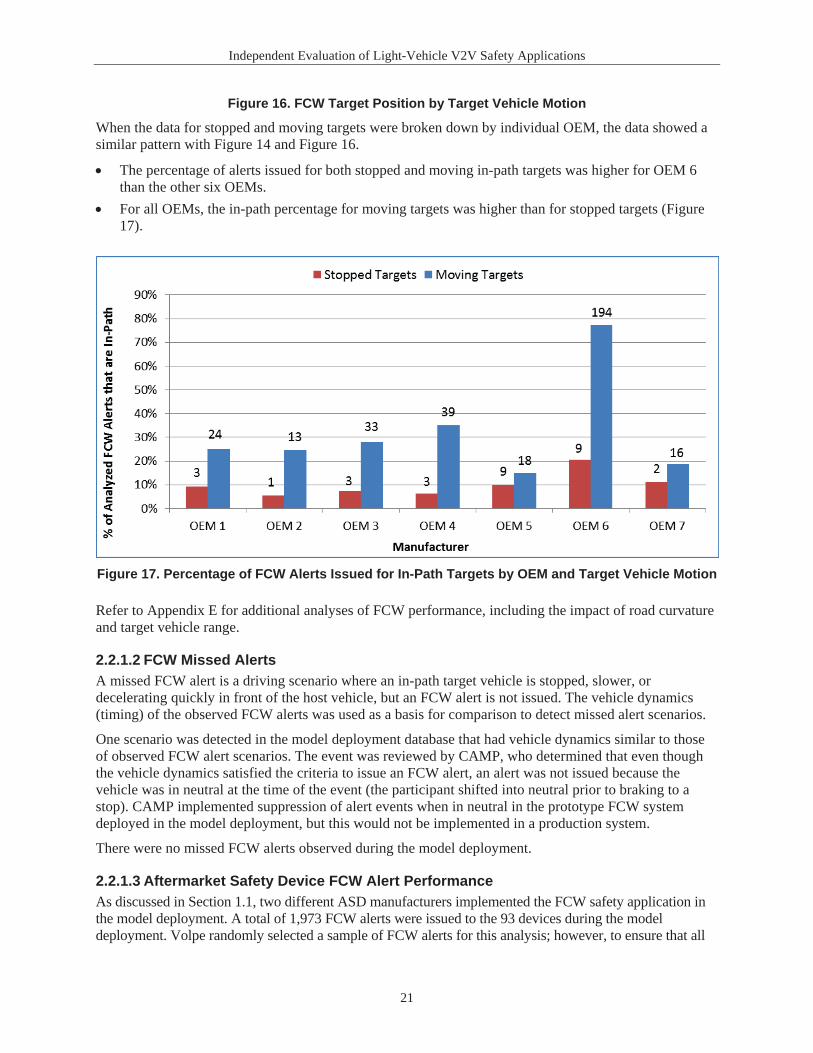
Independent Evaluation of Light-Vehicle V2V Safety Applications
21
Figure 16. FCW Target Position by Target Vehicle Motion
When the data for stopped and moving targets were broken down by individual OEM, the data showed asimilar pattern with Figure 14 and Figure 16.
The percentage of alerts issued for both stopped and moving in-path targets was higher for OEM 6 than the other six OEMs. For all OEMs, the in-path percentage for moving targets was higher than for stopped targets (Figure 17).
Figure 17. Percentage of FCW Alerts Issued for In-Path Targets by OEM and Target Vehicle Motion
Refer to Appendix E for additional analyses of FCW performance, including the impact of road curvature and target vehicle range.
2.2.1.2 FCW Missed AlertsA missed FCW alert is a driving scenario where an in-path target vehicle is stopped, slower, or decelerating quickly in front of the host vehicle, but an FCW alert is not issued. The vehicle dynamics (timing) of the observed FCW alerts was used as a basis for comparison to detect missed alert scenarios.
One scenario was detected in the model deployment database that had vehicle dynamics similar to those of observed FCW alert scenarios. The event was reviewed by CAMP, who determined that even though the vehicle dynamics satisfied the criteria to issue an FCW alert, an alert was not issued because the vehicle was in neutral at the time of the event (the participant shifted into neutral prior to braking to a stop). CAMP implemented suppression of alert events when in neutral in the prototype FCW system deployed in the model deployment, but this would not be implemented in a production system.
There were no missed FCW alerts observed during the model deployment.
2.2.1.3 Aftermarket Safety Device FCW Alert PerformanceAs discussed in Section 1.1, two different ASD manufacturers implemented the FCW safety application in the model deployment. A total of 1,973 FCW alerts were issued to the 93 devices during the model deployment. Volpe randomly selected a sample of FCW alerts for this analysis; however, to ensure that all
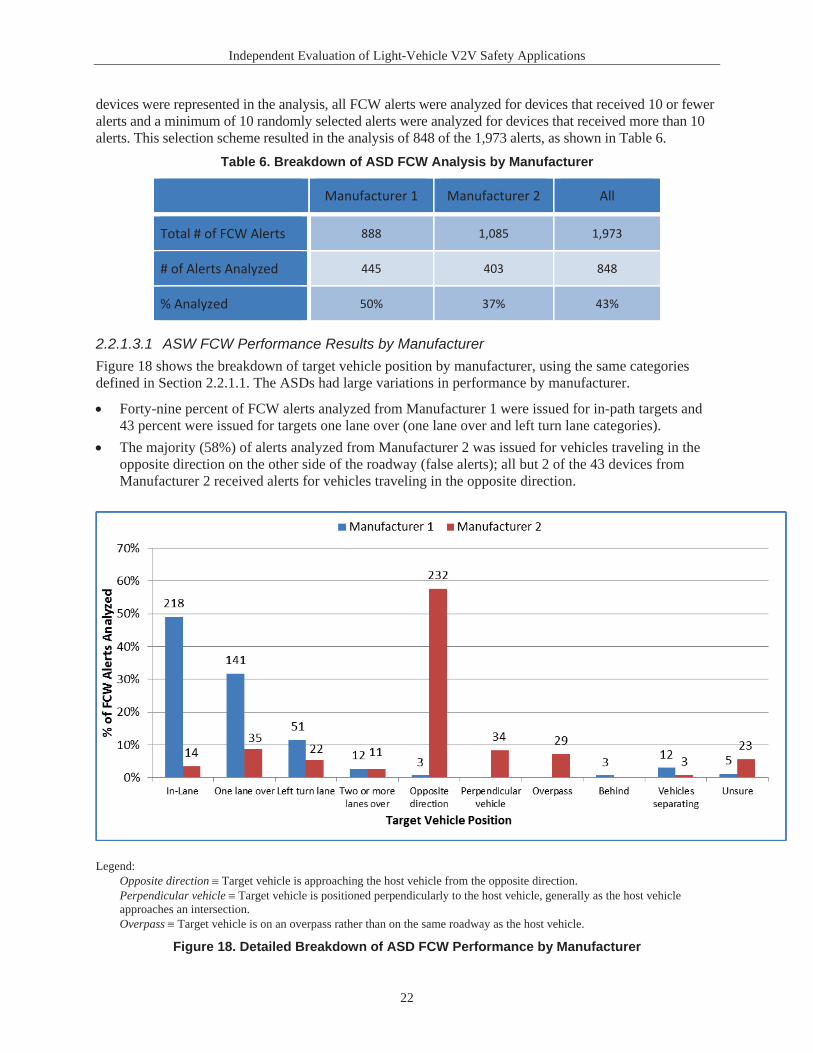
Independent Evaluation of Light-Vehicle V2V Safety Applications
22
devices were represented in the analysis, all FCW alerts were analyzed for devices that received 10 or fewer alerts and a minimum of 10 randomly selected alerts were analyzed for devices that received more than 10 alerts. This selection scheme resulted in the analysis of 848 of the 1,973 alerts, as shown in Table 6.
Table 6. Breakdown of ASD FCW Analysis by Manufacturer
Manufacturer 1 Manufacturer 2 All
Total # of FCW Alerts 888 1,085 1,973
# of Alerts Analyzed 445 403 848
% Analyzed 50% 37% 43%
2.2.1.3.1 ASW FCW Performance Results by ManufacturerFigure 18 shows the breakdown of target vehicle position by manufacturer, using the same categories defined in Section 2.2.1.1. The ASDs had large variations in performance by manufacturer.
Forty-nine percent of FCW alerts analyzed from Manufacturer 1 were issued for in-path targets and 43 percent were issued for targets one lane over (one lane over and left turn lane categories).The majority (58%) of alerts analyzed from Manufacturer 2 was issued for vehicles traveling in the opposite direction on the other side of the roadway (false alerts); all but 2 of the 43 devices from Manufacturer 2 received alerts for vehicles traveling in the opposite direction.
Legend:Opposite direction Target vehicle is approaching the host vehicle from the opposite direction.Perpendicular vehicle Target vehicle is positioned perpendicularly to the host vehicle, generally as the host vehicle approaches an intersection.Overpass Target vehicle is on an overpass rather than on the same roadway as the host vehicle.
Figure 18. Detailed Breakdown of ASD FCW Performance by Manufacturer

Independent Evaluation of Light-Vehicle V2V Safety Applications
23
2.2.1.4 Comparison of Integrated Vehicle Versus Aftermarket Device FCW AlertsThis subsection compares the system capability results of the FCW safety application implementation in integrated light vehicles and aftermarket safety devices. This analysis only considers integrated vehicle data from Phase 2, since these data represent the most recent version of the software.
2.2.1.4.1 In-Path Percentage of FCW Alerts by ManufacturerFigure 19 compares the percentage of FCW alerts that were issued for in-path targets for each integrated vehicle and ASD manufacturer. Like OEM 6, the aftermarket devices did not suppress alerts when the brake pedal was engaged. To normalize the data for this comparison, the alerts issued with the brake pedal engaged for ASD Manufacturer 1, ASD Manufacturer 2, and OEM 6 were not included in this analysis.
The FCW in-path percentage of ASD Manufacturer 1 was comparable to the in-path percentage of most integrated vehicle OEMs.The FCW in-path percentage of ASD Manufacturer 2 alerts was less than half the percentage of the lowest integrated vehicle OEM.
Figure 19. FCW Alert In-Path Percentage for ASDs and Integrated Vehicles (Alerts With No Brake Applied at Alert Onset Only)
2.2.1.4.2 Participant Response Rate to FCW AlertsAnother measure of FCW performance is the response rate by the participant. If a participant does not respond to an in-path alert (by either braking or steering) and does not crash, this suggests that the alert was issued in a scenario that was not a direct threat to the participant. This analysis evaluates the timing of FCW alert onset. None of the vehicles equipped with the FCW application in the Safety Pilot Model Deployment were involved in rear-end crashes, so FCW alerts with no participant response were likely viewed as nuisance (unnecessary) alerts. As shown in Figure 20, the percentage of in-path FCW alerts to which the participant responded within 5 seconds ranged from 33 percent to 79 percent for integrated vehicles, while for ASD it was 72 percent and 57 percent for ASD Manufacturer 1 and ASD Manufacturer 2, respectively.
No major differences were observed in participant response rate to in-path FCW alerts between ASDs and integrated light vehicles.
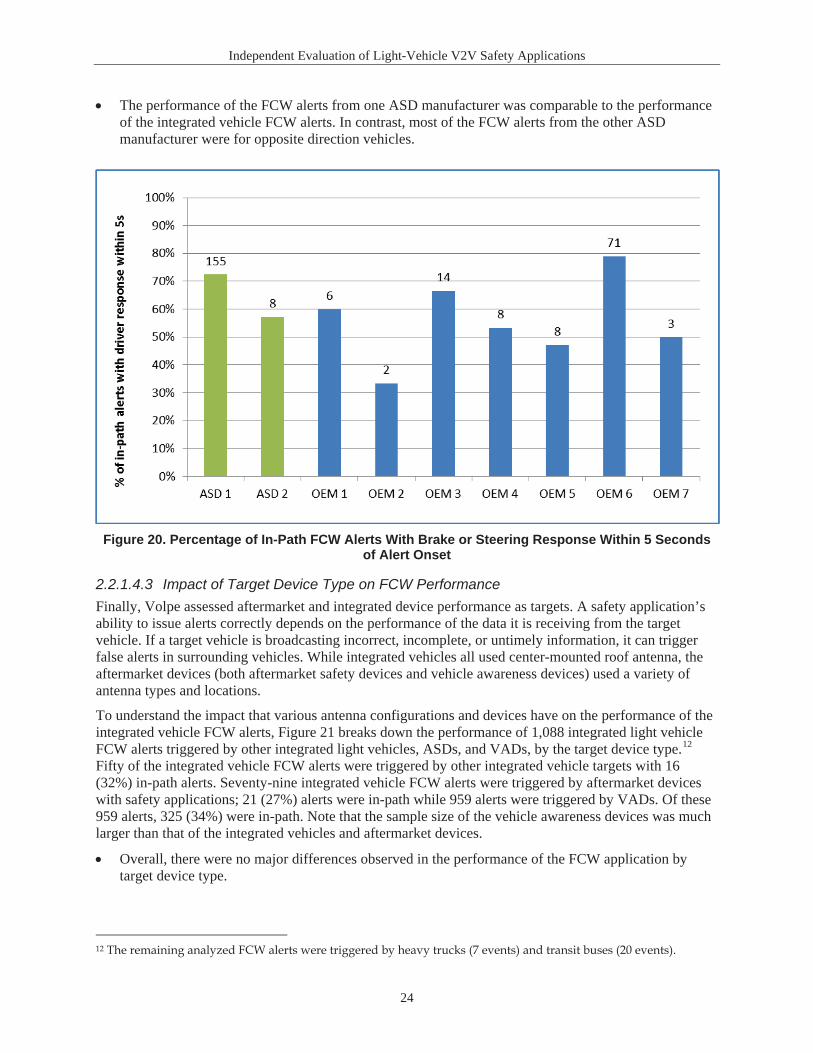
Independent Evaluation of Light-Vehicle V2V Safety Applications
24
The performance of the FCW alerts from one ASD manufacturer was comparable to the performance of the integrated vehicle FCW alerts. In contrast, most of the FCW alerts from the other ASD manufacturer were for opposite direction vehicles.
Figure 20. Percentage of In-Path FCW Alerts With Brake or Steering Response Within 5 Seconds of Alert Onset
2.2.1.4.3 Impact of Target Device Type on FCW PerformanceFinally, Volpe assessed aftermarket and integrated device performance as targets. A safety application’s ability to issue alerts correctly depends on the performance of the data it is receiving from the target vehicle. If a target vehicle is broadcasting incorrect, incomplete, or untimely information, it can trigger false alerts in surrounding vehicles. While integrated vehicles all used center-mounted roof antenna, the aftermarket devices (both aftermarket safety devices and vehicle awareness devices) used a variety of antenna types and locations.
To understand the impact that various antenna configurations and devices have on the performance of the integrated vehicle FCW alerts, Figure 21 breaks down the performance of 1,088 integrated light vehicle FCW alerts triggered by other integrated light vehicles, ASDs, and VADs, by the target device type.12
Fifty of the integrated vehicle FCW alerts were triggered by other integrated vehicle targets with 16 (32%) in-path alerts. Seventy-nine integrated vehicle FCW alerts were triggered by aftermarket devices with safety applications; 21 (27%) alerts were in-path while 959 alerts were triggered by VADs. Of these 959 alerts, 325 (34%) were in-path. Note that the sample size of the vehicle awareness devices was much larger than that of the integrated vehicles and aftermarket devices.
Overall, there were no major differences observed in the performance of the FCW application by target device type.
12 The remaining analyzed FCW alerts were triggered by heavy trucks (7 events) and transit buses (20 events).
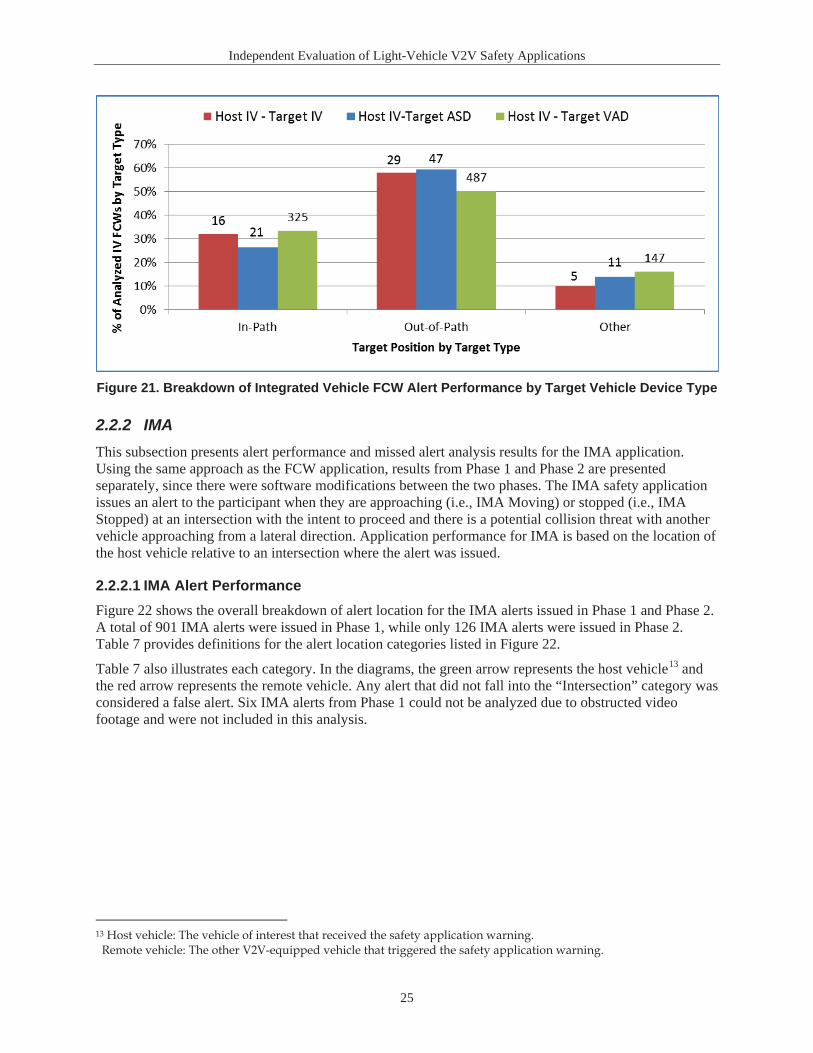
Independent Evaluation of Light-Vehicle V2V Safety Applications
25
Figure 21. Breakdown of Integrated Vehicle FCW Alert Performance by Target Vehicle Device Type
2.2.2 IMAThis subsection presents alert performance and missed alert analysis results for the IMA application. Using the same approach as the FCW application, results from Phase 1 and Phase 2 are presented separately, since there were software modifications between the two phases. The IMA safety application issues an alert to the participant when they are approaching (i.e., IMA Moving) or stopped (i.e., IMA Stopped) at an intersection with the intent to proceed and there is a potential collision threat with another vehicle approaching from a lateral direction. Application performance for IMA is based on the location of the host vehicle relative to an intersection where the alert was issued.
2.2.2.1 IMA Alert PerformanceFigure 22 shows the overall breakdown of alert location for the IMA alerts issued in Phase 1 and Phase 2. A total of 901 IMA alerts were issued in Phase 1, while only 126 IMA alerts were issued in Phase 2. Table 7 provides definitions for the alert location categories listed in Figure 22.
Table 7 also illustrates each category. In the diagrams, the green arrow represents the host vehicle13 and the red arrow represents the remote vehicle. Any alert that did not fall into the “Intersection” category was considered a false alert. Six IMA alerts from Phase 1 could not be analyzed due to obstructed video footage and were not included in this analysis.
13 Host vehicle: The vehicle of interest that received the safety application warning. Remote vehicle: The other V2V-equipped vehicle that triggered the safety application warning.
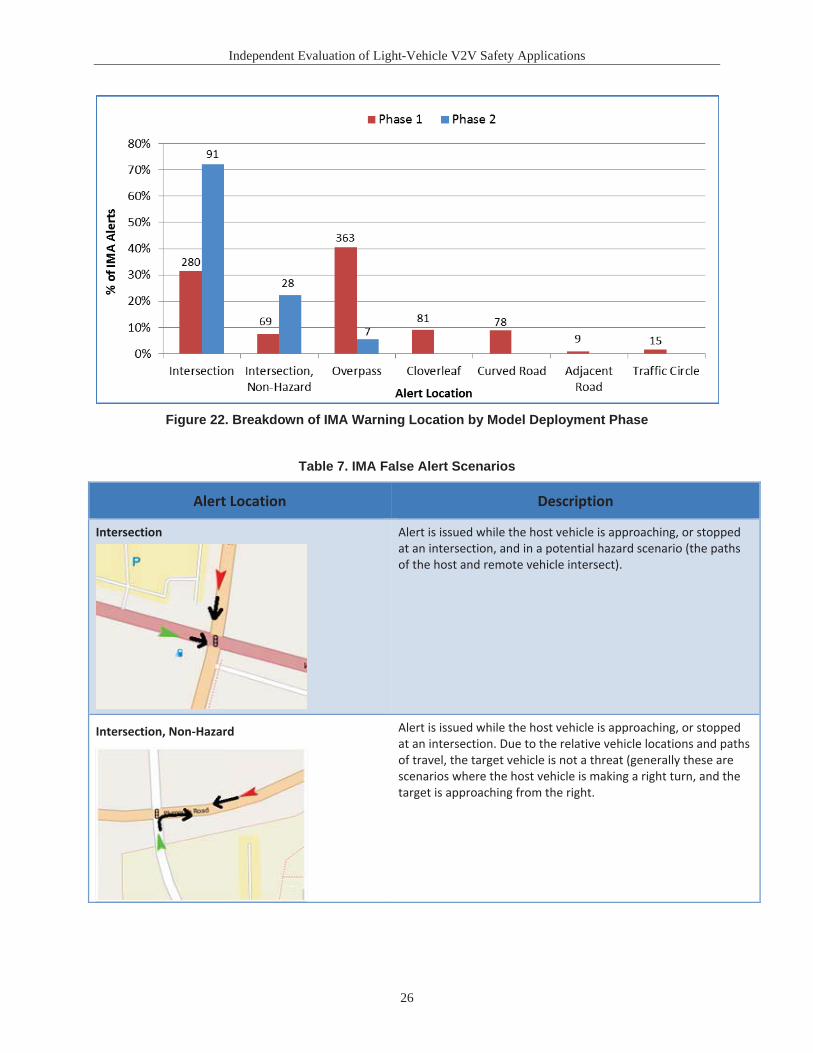
Independent Evaluation of Light-Vehicle V2V Safety Applications
26
Figure 22. Breakdown of IMA Warning Location by Model Deployment Phase
Table 7. IMA False Alert Scenarios
Alert Location Description
Intersection
Alert is issued while the host vehicle is approaching, or stopped at an intersection, and in a potential hazard scenario (the paths of the host and remote vehicle intersect).
Intersection, Non-Hazard Alert is issued while the host vehicle is approaching, or stopped at an intersection. Due to the relative vehicle locations and paths of travel, the target vehicle is not a threat (generally these are scenarios where the host vehicle is making a right turn, and the target is approaching from the right.
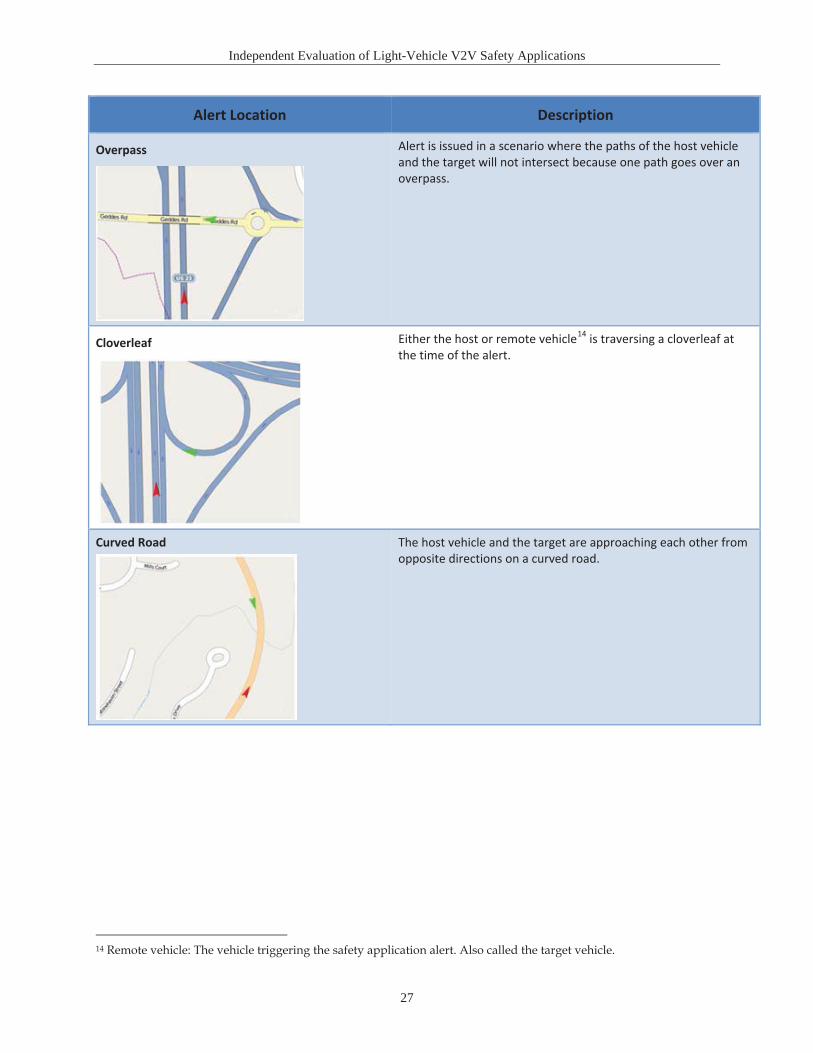
Independent Evaluation of Light-Vehicle V2V Safety Applications
27
Alert Location Description
Overpass Alert is issued in a scenario where the paths of the host vehicle and the target will not intersect because one path goes over an overpass.
Cloverleaf
Either the host or remote vehicle14 is traversing a cloverleaf at the time of the alert.
Curved Road
The host vehicle and the target are approaching each other from opposite directions on a curved road.
14 Remote vehicle: The vehicle triggering the safety application alert. Also called the target vehicle.
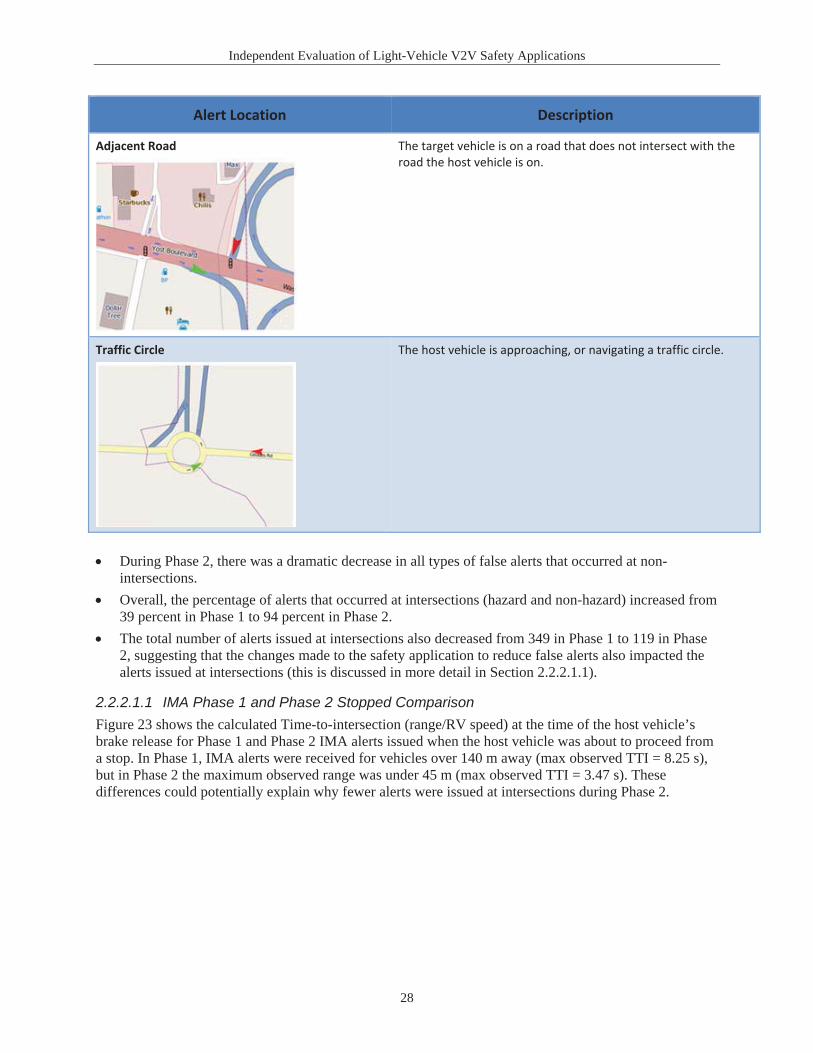
Independent Evaluation of Light-Vehicle V2V Safety Applications
28
Alert Location Description
Adjacent Road
The target vehicle is on a road that does not intersect with the road the host vehicle is on.
Traffic Circle
The host vehicle is approaching, or navigating a traffic circle.
During Phase 2, there was a dramatic decrease in all types of false alerts that occurred at non-intersections.Overall, the percentage of alerts that occurred at intersections (hazard and non-hazard) increased from 39 percent in Phase 1 to 94 percent in Phase 2.The total number of alerts issued at intersections also decreased from 349 in Phase 1 to 119 in Phase 2, suggesting that the changes made to the safety application to reduce false alerts also impacted the alerts issued at intersections (this is discussed in more detail in Section 2.2.2.1.1).
2.2.2.1.1 IMA Phase 1 and Phase 2 Stopped ComparisonFigure 23 shows the calculated Time-to-intersection (range/RV speed) at the time of the host vehicle’s brake release for Phase 1 and Phase 2 IMA alerts issued when the host vehicle was about to proceed froma stop. In Phase 1, IMA alerts were received for vehicles over 140 m away (max observed TTI = 8.25 s),but in Phase 2 the maximum observed range was under 45 m (max observed TTI = 3.47 s). These differences could potentially explain why fewer alerts were issued at intersections during Phase 2.
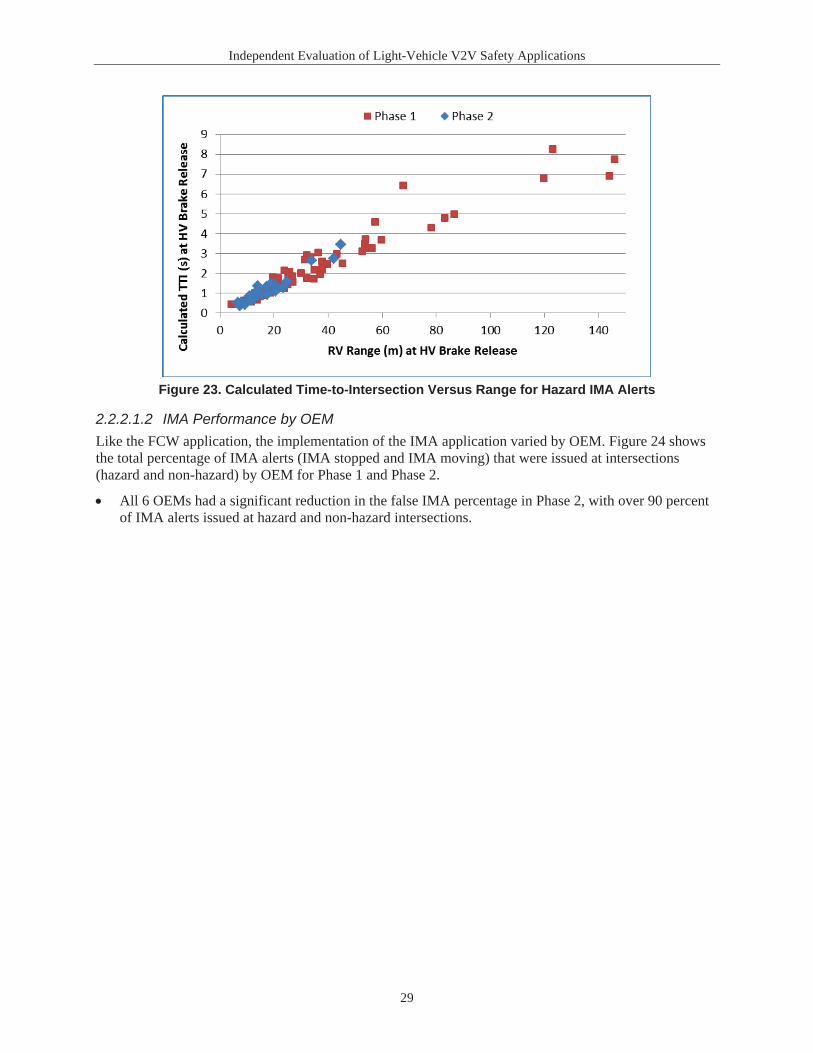
Independent Evaluation of Light-Vehicle V2V Safety Applications
29
Figure 23. Calculated Time-to-Intersection Versus Range for Hazard IMA Alerts
2.2.2.1.2 IMA Performance by OEMLike the FCW application, the implementation of the IMA application varied by OEM. Figure 24 shows the total percentage of IMA alerts (IMA stopped and IMA moving) that were issued at intersections (hazard and non-hazard) by OEM for Phase 1 and Phase 2.
All 6 OEMs had a significant reduction in the false IMA percentage in Phase 2, with over 90 percentof IMA alerts issued at hazard and non-hazard intersections.
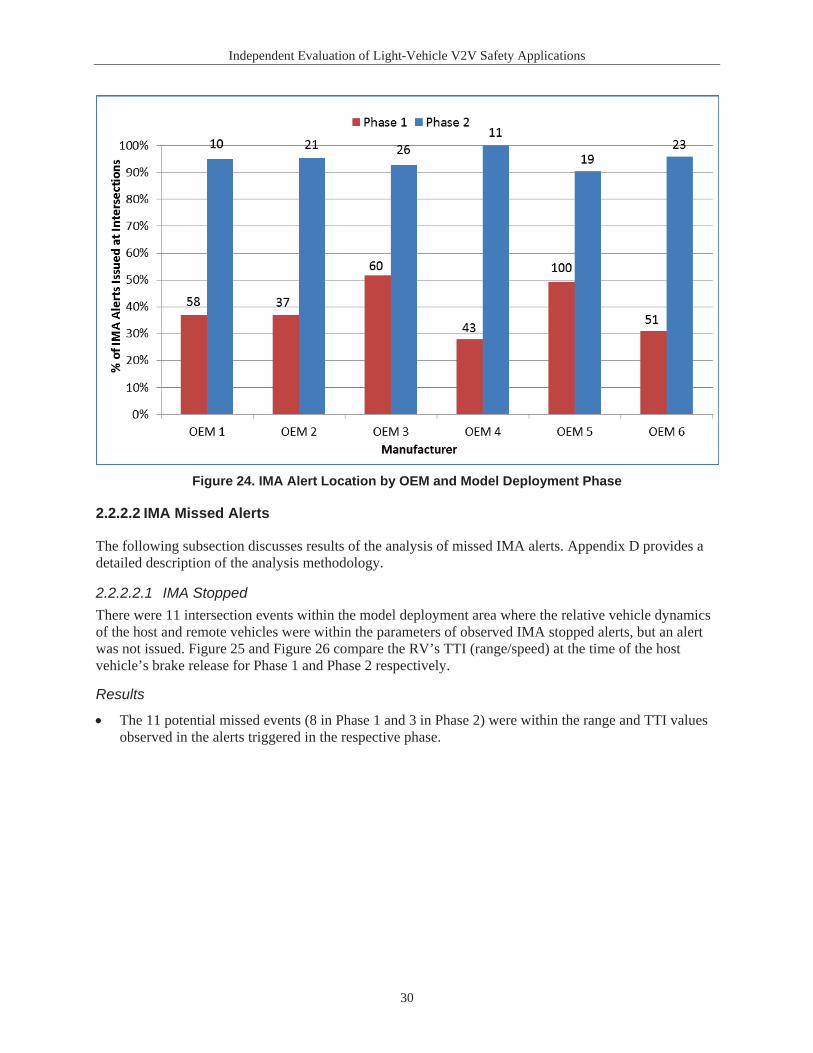
Independent Evaluation of Light-Vehicle V2V Safety Applications
30
Figure 24. IMA Alert Location by OEM and Model Deployment Phase
2.2.2.2 IMA Missed Alerts
The following subsection discusses results of the analysis of missed IMA alerts. Appendix D provides a detailed description of the analysis methodology.
2.2.2.2.1 IMA StoppedThere were 11 intersection events within the model deployment area where the relative vehicle dynamics of the host and remote vehicles were within the parameters of observed IMA stopped alerts, but an alert was not issued. Figure 25 and Figure 26 compare the RV’s TTI (range/speed) at the time of the host vehicle’s brake release for Phase 1 and Phase 2 respectively.
Results
The 11 potential missed events (8 in Phase 1 and 3 in Phase 2) were within the range and TTI valuesobserved in the alerts triggered in the respective phase.
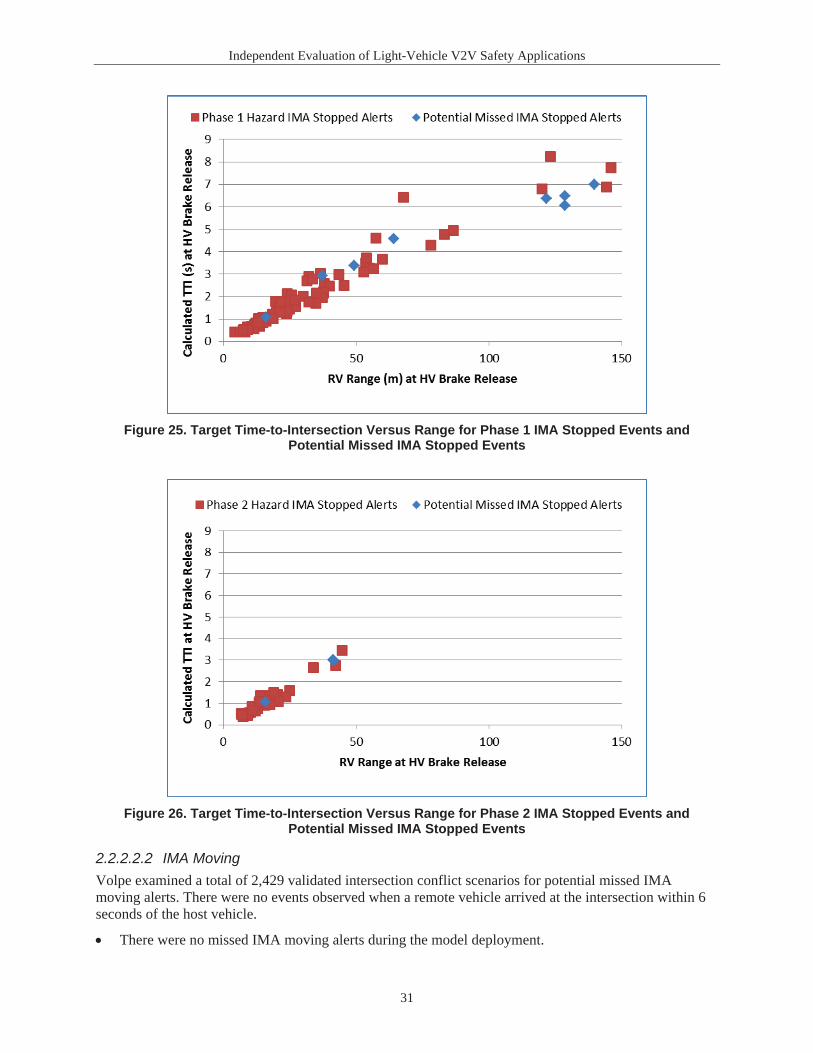
Independent Evaluation of Light-Vehicle V2V Safety Applications
31
Figure 25. Target Time-to-Intersection Versus Range for Phase 1 IMA Stopped Events and Potential Missed IMA Stopped Events
Figure 26. Target Time-to-Intersection Versus Range for Phase 2 IMA Stopped Events and Potential Missed IMA Stopped Events
2.2.2.2.2 IMA MovingVolpe examined a total of 2,429 validated intersection conflict scenarios for potential missed IMA moving alerts. There were no events observed when a remote vehicle arrived at the intersection within 6 seconds of the host vehicle.
There were no missed IMA moving alerts during the model deployment.

Independent Evaluation of Light-Vehicle V2V Safety Applications
32
2.2.3 BSW/LCW This subsection presents results of alert performance and missed alert analyses for the BSW/LCW safety application. Since there were no changes to the application between Phase 1 and Phase 2, the results represent the combined Phase 1 and Phase 2 model deployment data.
2.2.3.1 BSW/LCW Alert PerformanceBlind spot/lane change warnings are designed to warn drivers if a vehicle is in or approaching their blind spot when they intend to make a lane change. The performance of the BSW/LCW warnings is assessed in terms of the position of the target vehicle relative to the host vehicle.
Figure 27 shows the target location of the 242 BSW/LCW alerts analyzed.
Fifty-four percent of BSW/LCW alerts were issued for remote vehicles in the adjacent lane.Forty-six percent of BSW/LCW alerts were issued in non-hazard scenarios (remote vehicles either two lanes over or in the same lane, behind the host vehicle).Sixty-seven percent of all BSW/LCW alerts were issued on straight road segments, 2 percent were issued in curved road segments, and 31 percent were issued when the host vehicle was approaching an intersection.Sixty-three percent of the in-lane alerts (24 percent of all analyzed alerts) were issued when the host vehicle activated their turn signal to make a turn at an intersection.
Figure 27. BSW/LCW Target Position
Figure 28 shows the BSW/LCW performance for each of the 7 OEMs that implemented the application.
While each OEM had the same number of vehicles in the field, over 3 times the number of BSW/LCW alerts were issued to participants with a vehicle from OEM 7 than were issued to participants of any other OEM. The observed minimum speed at the time of a BSW/LCW alert for OEMs 1-6 was 20 mph, while the observed minimum speed for OEM 7 was 6 mph. A lower minimum speed threshold for BSW/LCW alerts likely contributed to the higher total number of warnings for this OEM.OEM 7 had the lowest percentage of alerts with targets in the adjacent lane (37%).
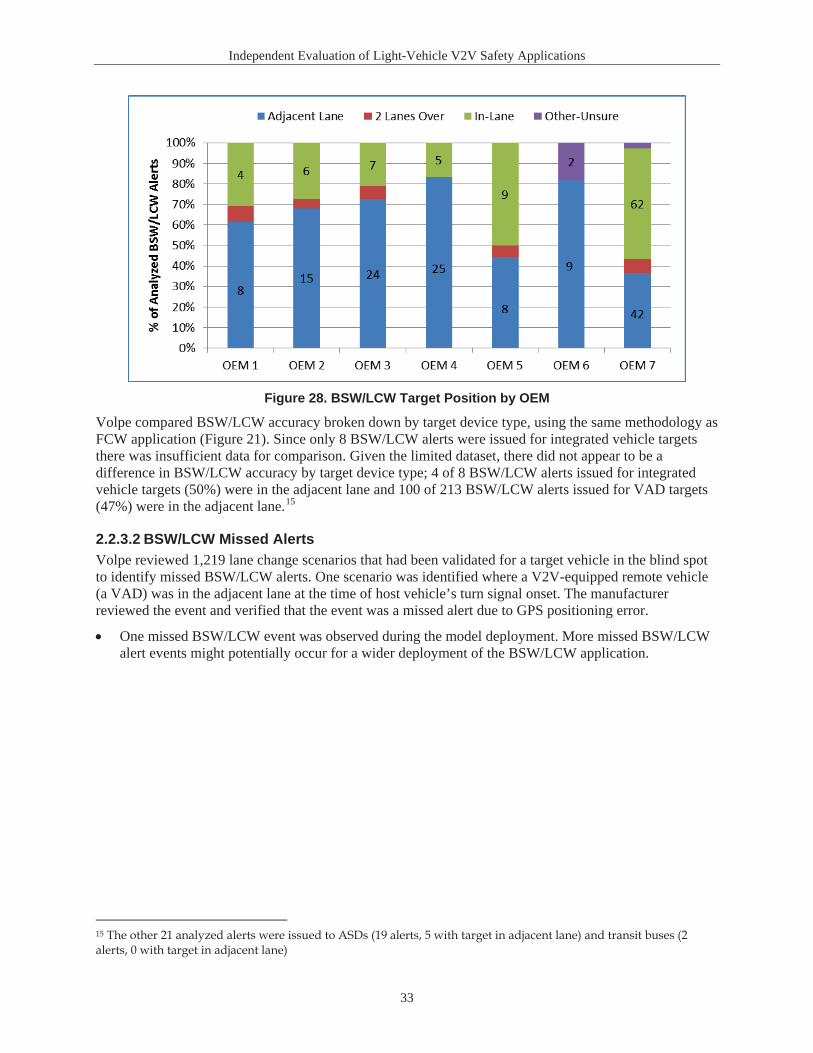
Independent Evaluation of Light-Vehicle V2V Safety Applications
33
Figure 28. BSW/LCW Target Position by OEM
Volpe compared BSW/LCW accuracy broken down by target device type, using the same methodology as FCW application (Figure 21). Since only 8 BSW/LCW alerts were issued for integrated vehicle targets there was insufficient data for comparison. Given the limited dataset, there did not appear to be a difference in BSW/LCW accuracy by target device type; 4 of 8 BSW/LCW alerts issued for integrated vehicle targets (50%) were in the adjacent lane and 100 of 213 BSW/LCW alerts issued for VAD targets (47%) were in the adjacent lane.15
2.2.3.2 BSW/LCW Missed AlertsVolpe reviewed 1,219 lane change scenarios that had been validated for a target vehicle in the blind spot to identify missed BSW/LCW alerts. One scenario was identified where a V2V-equipped remote vehicle(a VAD) was in the adjacent lane at the time of host vehicle’s turn signal onset. The manufacturerreviewed the event and verified that the event was a missed alert due to GPS positioning error.
One missed BSW/LCW event was observed during the model deployment. More missed BSW/LCW alert events might potentially occur for a wider deployment of the BSW/LCW application.
15 The other 21 analyzed alerts were issued to ASDs (19 alerts, 5 with target in adjacent lane) and transit buses (2 alerts, 0 with target in adjacent lane)
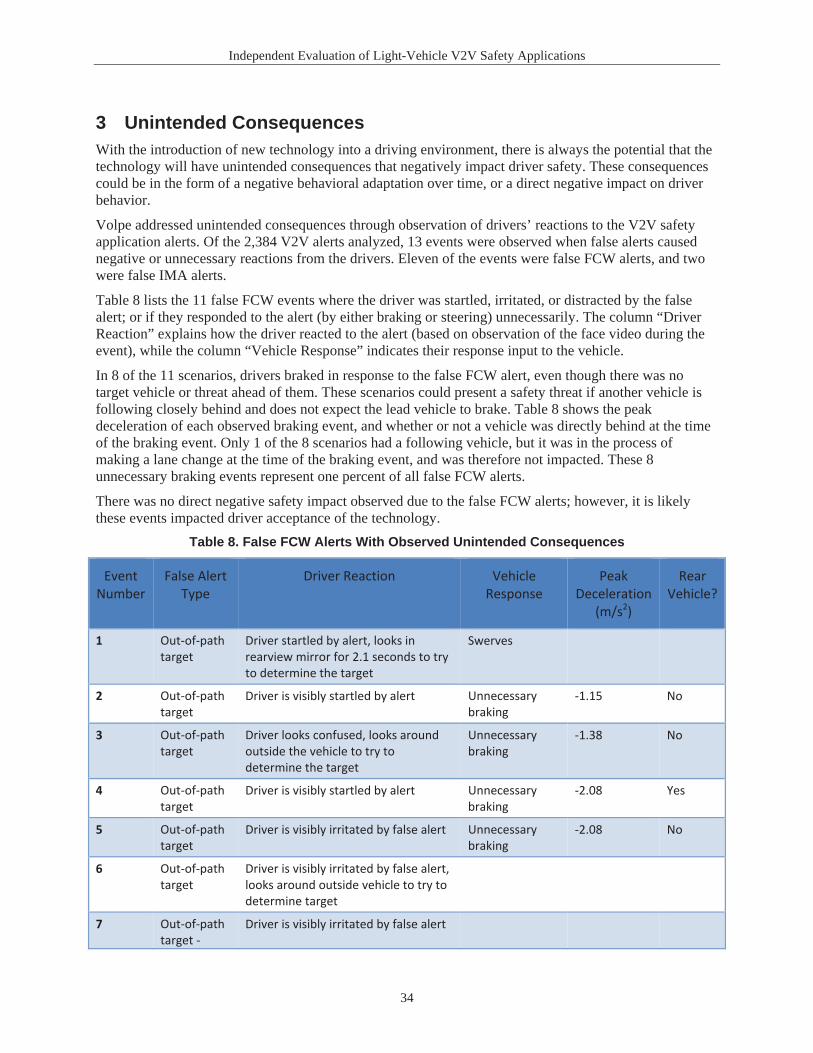
Independent Evaluation of Light-Vehicle V2V Safety Applications
34
3 Unintended ConsequencesWith the introduction of new technology into a driving environment, there is always the potential that the technology will have unintended consequences that negatively impact driver safety. These consequences could be in the form of a negative behavioral adaptation over time, or a direct negative impact on driver behavior.
Volpe addressed unintended consequences through observation of drivers’ reactions to the V2V safety application alerts. Of the 2,384 V2V alerts analyzed, 13 events were observed when false alerts caused negative or unnecessary reactions from the drivers. Eleven of the events were false FCW alerts, and twowere false IMA alerts.
Table 8 lists the 11 false FCW events where the driver was startled, irritated, or distracted by the false alert; or if they responded to the alert (by either braking or steering) unnecessarily. The column “Driver Reaction” explains how the driver reacted to the alert (based on observation of the face video during the event), while the column “Vehicle Response” indicates their response input to the vehicle.
In 8 of the 11 scenarios, drivers braked in response to the false FCW alert, even though there was no target vehicle or threat ahead of them. These scenarios could present a safety threat if another vehicle is following closely behind and does not expect the lead vehicle to brake. Table 8 shows the peak deceleration of each observed braking event, and whether or not a vehicle was directly behind at the time of the braking event. Only 1 of the 8 scenarios had a following vehicle, but it was in the process of making a lane change at the time of the braking event, and was therefore not impacted. These 8unnecessary braking events represent one percent of all false FCW alerts.
There was no direct negative safety impact observed due to the false FCW alerts; however, it is likely these events impacted driver acceptance of the technology.
Table 8. False FCW Alerts With Observed Unintended Consequences
Event Number
False Alert Type
Driver Reaction Vehicle Response
Peak Deceleration
(m/s2)
Rear Vehicle?
1 Out-of-path target
Driver startled by alert, looks in rearview mirror for 2.1 seconds to try to determine the target
Swerves
2 Out-of-path target
Driver is visibly startled by alert Unnecessary braking
-1.15 No
3 Out-of-path target
Driver looks confused, looks around outside the vehicle to try to determine the target
Unnecessary braking
-1.38 No
4 Out-of-path target
Driver is visibly startled by alert Unnecessary braking
-2.08 Yes
5 Out-of-path target
Driver is visibly irritated by false alert Unnecessary braking
-2.08 No
6 Out-of-path target
Driver is visibly irritated by false alert, looks around outside vehicle to try to determine target
7 Out-of-path target -
Driver is visibly irritated by false alert

Independent Evaluation of Light-Vehicle V2V Safety Applications
35
Event Number
False Alert Type
Driver Reaction Vehicle Response
Peak Deceleration
(m/s2)
Rear Vehicle?
turning off
8 Out-of-path target
Unnecessary braking
-2.58 No
9 Out-of-path target
Unnecessary braking
-2.56 No
10 Out-of-path target
Unnecessary braking
-2.72 No
11 Out-of-path target
Driver looks at instrument panel for 1.1 seconds to try to determine cause of false alert
Unnecessary braking
-1.65 No
Table 9 lists the two false IMA alerts that impacted driver behavior. Both events were scenarios where the driver was initiating a safe right turn maneuver when they got the alert. In one of the events, the driver hesitated and looked again for an oncoming vehicle, then proceeded into the intersection; and in the other,the driver stopped the vehicle and aborted the maneuver. Like the FCW events, there was no direct negative safety impact observed due to these events, but they likely impacted the driver acceptance of the application.
Table 9. False IMA Alerts With Observed Unintended Consequences
Event Number
False Alert Type Driver Reaction
1 Right turn no hazard Driver hesitates and looks again for oncoming vehicle, then proceeds into intersection
2 Right turn no hazard Driver aborts maneuver and stops vehicle, looks around outside for cause of alert

Independent Evaluation of Light-Vehicle V2V Safety Applications
36
4 Driver AcceptanceThe following section describes the analysis of driver acceptance of the V2V safety applications for the integrated light vehicles and the ASDs in the Safety Pilot Model Deployment.
4.1 IntroductionThis subsection defines the term “driver acceptance” and describes the objectives of the analysis and the factors that may complicate interpretation of the results.
4.1.1 What is Driver Acceptance?Driver acceptance is difficult to define precisely because it is a complicated phenomenon made up of a variety of opinions, understandings, and attitudes that a driver may have towards a technological system. To further complicate matters, there can be a circular relationship between driver acceptance and system performance, because system performance affects acceptance and in turn, acceptance can influence performance. For example, a driver with low confidence in a system may ignore it, leading to a decrease in its safety benefits. On the other hand, a driver with too much confidence may over-rely on the system and pay less attention to the road; this can also lead to a decrease in safety benefits.
The different opinions, understandings, and attitudes a driver may have towards a piece of technology may vary independently of one another. For example, a driver might rate the understandability of a system high but have low confidence in its performance. In another example, the driver might rate the usefulness of the system high but have concerns over data privacy. Understanding driver acceptance means looking at multiple factors individually to gain a more accurate understanding of what drivers like and, as far as possible, to understand why.
In this analysis, acceptance is defined based on driver perception or beliefs about the following five factors:
Usability: are the V2V safety applications easy to use?Perceived Safety Benefits: will V2V technology contribute to your driving safety?Understandability: are the V2V safety applications easy to understand and learn to use?Desirability: do you want to have and use V2V safety applications in your vehicle?Security and Privacy: how do you feel about security and privacy issues raised by V2V technologies?
4.1.2 Analysis ObjectivesThe objectives are to assess driver acceptance using the five factors listed in Section 4.1.1. Of particular interest is the risk of unintended consequences—including overreliance or distraction caused by the V2V technology—both of which fall under Perceived Safety Benefits.
Acceptance consists not only of preexisting opinions held by a given participant, but is also shaped by experience driving with the system in operation. For example, a participant may start out with a high level of system acceptance then experience repeated and irritating false alerts, causing their acceptance level to plummet. On the other hand, another participant might start out distrusting the system and then experience a close call in which the system helps them avoid a collision, giving them a much higher level of acceptance. Since these relationships between experience and acceptance no longer exist when participants are averaged together, Volpe explored the relationship between a driver’s acceptance and their driving experience. Survey responses were correlated with certain aspects of their individual experience, especially the frequency of true or false alerts received.
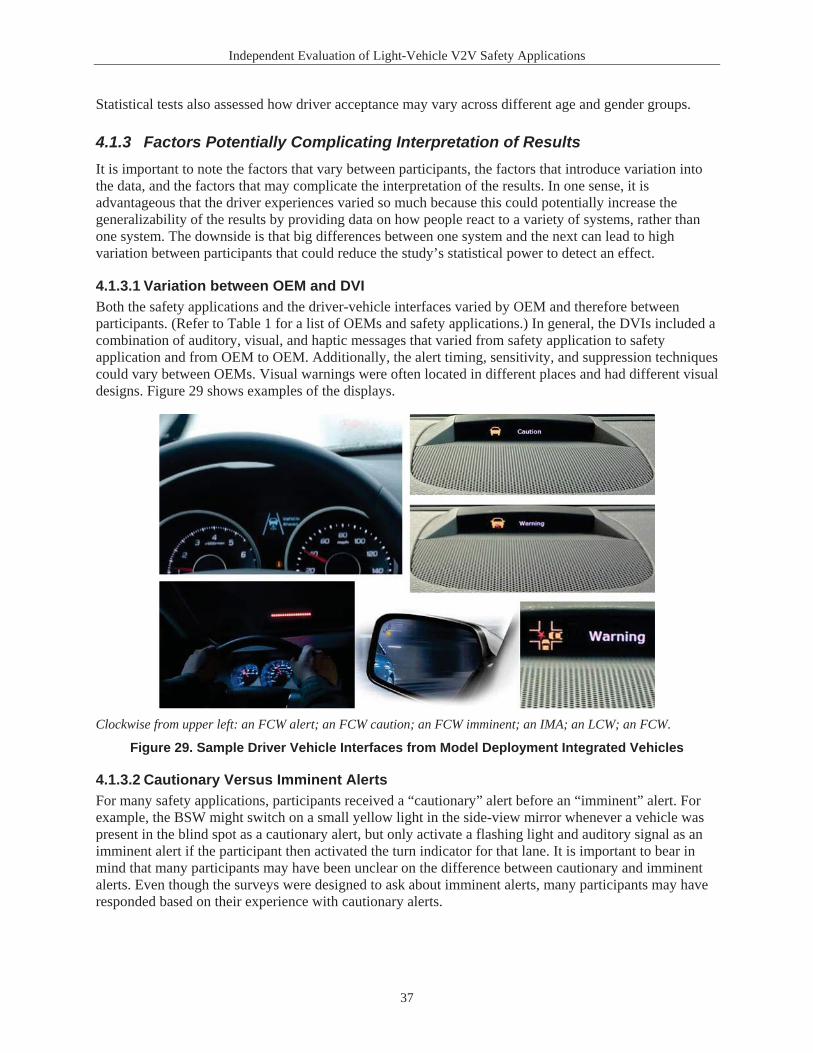
Independent Evaluation of Light-Vehicle V2V Safety Applications
37
Statistical tests also assessed how driver acceptance may vary across different age and gender groups.
4.1.3 Factors Potentially Complicating Interpretation of ResultsIt is important to note the factors that vary between participants, the factors that introduce variation into the data, and the factors that may complicate the interpretation of the results. In one sense, it is advantageous that the driver experiences varied so much because this could potentially increase the generalizability of the results by providing data on how people react to a variety of systems, rather than one system. The downside is that big differences between one system and the next can lead to high variation between participants that could reduce the study’s statistical power to detect an effect.
4.1.3.1 Variation between OEM and DVIBoth the safety applications and the driver-vehicle interfaces varied by OEM and therefore between participants. (Refer to Table 1 for a list of OEMs and safety applications.) In general, the DVIs included acombination of auditory, visual, and haptic messages that varied from safety application to safety application and from OEM to OEM. Additionally, the alert timing, sensitivity, and suppression techniques could vary between OEMs. Visual warnings were often located in different places and had different visual designs. Figure 29 shows examples of the displays.
Clockwise from upper left: an FCW alert; an FCW caution; an FCW imminent; an IMA; an LCW; an FCW.
Figure 29. Sample Driver Vehicle Interfaces from Model Deployment Integrated Vehicles
4.1.3.2 Cautionary Versus Imminent AlertsFor many safety applications, participants received a “cautionary” alert before an “imminent” alert. For example, the BSW might switch on a small yellow light in the side-view mirror whenever a vehicle was present in the blind spot as a cautionary alert, but only activate a flashing light and auditory signal as an imminent alert if the participant then activated the turn indicator for that lane. It is important to bear in mind that many participants may have been unclear on the difference between cautionary and imminent alerts. Even though the surveys were designed to ask about imminent alerts, many participants may have responded based on their experience with cautionary alerts.
Independent Evaluation of Light-Vehicle V2V Safety Applications
38
4.2 Driver Acceptance MethodsThe following subsection describes the methodology of this analysis, including the general statistical approach used.
4.2.1 Likert Scale ResponsesOne of the downsides to survey questions using a scale of 1 to 7 is their built-in subjectivity: one participant’s 5 might be equivalent to another’s 7. To remove some of this subjectivity, Volpe converted scores into one of three bins: “negative,” “neutral,” or “positive” (the actual names of these bins varied from question to question depending on the wording of the question at hand). A conservative approach was taken with neutral scores (counting scores of 3 and 5 as “neutral”).
4.2.2 Open-Ended ResponsesVolpe summarized open-ended responses into bins based on the overarching or dominant concerns or issues raised. Open-ended responses also clarified unusual responses (such as outliers) and illustratedconcerns or trends in the numerical Likert-scale responses.
4.2.3 False AlertsSection 2.1.1 provides a detailed assessment of alert validity and corresponding results.
False alerts may have a large effect on driver acceptance if they undermine trust in the system, increaseannoyance with it, and potentially lead to ignoring or even deactivating the system. Studies such as the model deployment often use prototype technology with higher rates of false alerts than production-ready versions. As a result, it is useful to understand the effect of false alerts on the model deployment results in order to better apply them to the case of deploying production-ready versions with lower false alert rates.
Understanding the effect of false alerts must take place on a case-by-case basis, since false alert rates vary considerably between participants. This variation is probably due not only to variations in design between the various OEM vehicles, but also to differences in driving styles, with some participants pushing their vehicle into situations where false alerts are more likely to occur.
Volpe used two approaches to explore the effect of false alerts. The first approach reviewed survey questions about trust in the system and the frequency of incorrect alerts, and reviewed relevant comments to open-ended questions. The second approach used the vehicle data logs to develop an objective measure of the false alerts received, and to correlate this with the survey responses.
For each safety application, Volpe used the following criteria to determine if an alert was false:
FCW: the target vehicle was not in the path of the host vehicle.IMA: the target vehicle did not occur at an intersection, or occurred in a non-hazard scenario at an intersection (either the host vehicle or the remote vehicle turned so that the vehicles’ paths did not cross).LCW: the target vehicle was not in the travel lane adjacent to the host vehicle.
4.2.4 Phase 1 Versus Phase 2Due to the software updates to certain safety applications from Phase 1 to Phase 2 (refer to Section 1.2.4),it is possible that driver acceptance may vary from one phase to the next due to differences in system performance. To rule out this variance, Volpe statistically compared test results between the two phases.
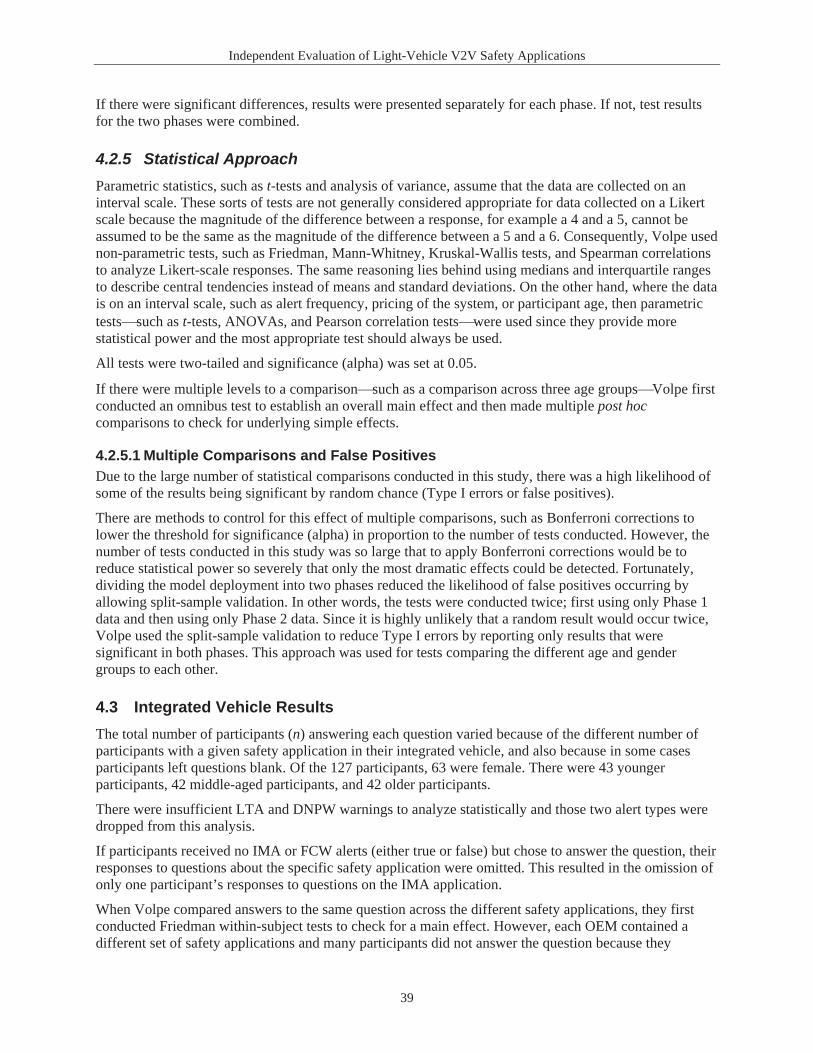
Independent Evaluation of Light-Vehicle V2V Safety Applications
39
If there were significant differences, results were presented separately for each phase. If not, test results for the two phases were combined.
4.2.5 Statistical ApproachParametric statistics, such as t-tests and analysis of variance, assume that the data are collected on an interval scale. These sorts of tests are not generally considered appropriate for data collected on a Likert scale because the magnitude of the difference between a response, for example a 4 and a 5, cannot be assumed to be the same as the magnitude of the difference between a 5 and a 6. Consequently, Volpe used non-parametric tests, such as Friedman, Mann-Whitney, Kruskal-Wallis tests, and Spearman correlationsto analyze Likert-scale responses. The same reasoning lies behind using medians and interquartile ranges to describe central tendencies instead of means and standard deviations. On the other hand, where the data is on an interval scale, such as alert frequency, pricing of the system, or participant age, then parametric tests such as t-tests, ANOVAs, and Pearson correlation tests were used since they provide more statistical power and the most appropriate test should always be used.
All tests were two-tailed and significance (alpha) was set at 0.05.
If there were multiple levels to a comparison such as a comparison across three age groups Volpe first conducted an omnibus test to establish an overall main effect and then made multiple post hoccomparisons to check for underlying simple effects.
4.2.5.1 Multiple Comparisons and False PositivesDue to the large number of statistical comparisons conducted in this study, there was a high likelihood of some of the results being significant by random chance (Type I errors or false positives).
There are methods to control for this effect of multiple comparisons, such as Bonferroni corrections tolower the threshold for significance (alpha) in proportion to the number of tests conducted. However, the number of tests conducted in this study was so large that to apply Bonferroni corrections would be to reduce statistical power so severely that only the most dramatic effects could be detected. Fortunately, dividing the model deployment into two phases reduced the likelihood of false positives occurring by allowing split-sample validation. In other words, the tests were conducted twice; first using only Phase 1 data and then using only Phase 2 data. Since it is highly unlikely that a random result would occur twice, Volpe used the split-sample validation to reduce Type I errors by reporting only results that were significant in both phases. This approach was used for tests comparing the different age and gender groups to each other.
4.3 Integrated Vehicle ResultsThe total number of participants (n) answering each question varied because of the different number of participants with a given safety application in their integrated vehicle, and also because in some cases participants left questions blank. Of the 127 participants, 63 were female. There were 43 younger participants, 42 middle-aged participants, and 42 older participants.
There were insufficient LTA and DNPW warnings to analyze statistically and those two alert types were dropped from this analysis.
If participants received no IMA or FCW alerts (either true or false) but chose to answer the question, their responses to questions about the specific safety application were omitted. This resulted in the omission of only one participant’s responses to questions on the IMA application.
When Volpe compared answers to the same question across the different safety applications, they first conducted Friedman within-subject tests to check for a main effect. However, each OEM contained a different set of safety applications and many participants did not answer the question because they

Independent Evaluation of Light-Vehicle V2V Safety Applications
40
believed they had received no alerts. As a result, there were very few participants who answered questions for all four safety applications. Since the sample size was too small for an omnibus test, Volpe conducted only simple-effect tests for these questions.
For most questions, results are given for each individual safety application as well as for the overall system, “All.” In those cases, the numbers for the overall system are not derived from the individual safety applications, but are from a separate question asking about the system as a whole.
Summaries of two comprehensive open-ended questions are given first, followed by the descriptive statistics, which are organized by the five criteria for driver acceptance listed in Section 4.1.1.
Sections 4.3.1 through 4.3.9 present results of the analyses of the effects of gender, age, and experience with false alerts. In the bar graphs, the numbers in the center of each bar indicate the total number of participants who gave scores falling into that category (“agree”/“neutral”/“disagree”).
4.3.1 General ImpressionsThe first two questions on the survey were open-ended and asked participants to describe what they liked most and least about the V2V-based safety applications, which were referred to in the surveys as the “Connected Vehicle system.”
What Did Participants Like the Most?
Table 10 lists representative responses to the question “What did you like most about the Connected Vehicle system?”
Table 10. What Participants Liked the Most About the Connected Vehicle System
Participant Response
“Alerted me to traffic situations I otherwise wouldn't have been aware of”
“I felt utterly safe in this vehicle. I liked the sense of knowing it would warn me”
“The effort. It is about time that this type of effort was put forth. Needs work but keep going”
“The coolness factor. Great idea, great technology, and I enjoyed helping test it”
The BSW/LCW was the alert most cited by name, e.g., “The blind spot warning system, before turning on blinker to make the lane change”
What Did Participants Like the Least?
Table 11 lists representative responses to the question “What did you like least about the Connected Vehicle system?” Responses focused largely on the rate of alerts that participants regarded as incorrect.Many participants cited incorrect alerts.
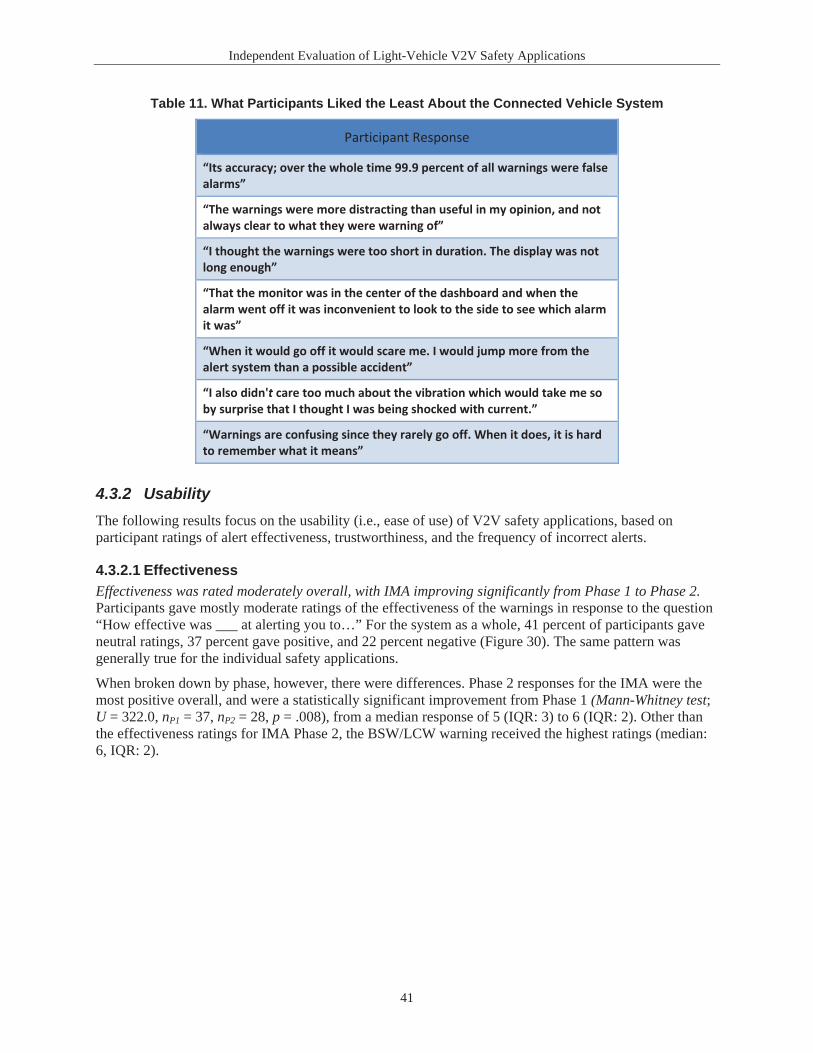
Independent Evaluation of Light-Vehicle V2V Safety Applications
41
Table 11. What Participants Liked the Least About the Connected Vehicle System
Participant Response
“Its accuracy; over the whole time 99.9 percent of all warnings were false alarms”
“The warnings were more distracting than useful in my opinion, and not always clear to what they were warning of”
“I thought the warnings were too short in duration. The display was not long enough”
“That the monitor was in the center of the dashboard and when the alarm went off it was inconvenient to look to the side to see which alarm it was”
“When it would go off it would scare me. I would jump more from the alert system than a possible accident”
“I also didn't care too much about the vibration which would take me so by surprise that I thought I was being shocked with current.”
“Warnings are confusing since they rarely go off. When it does, it is hard to remember what it means”
4.3.2 UsabilityThe following results focus on the usability (i.e., ease of use) of V2V safety applications, based onparticipant ratings of alert effectiveness, trustworthiness, and the frequency of incorrect alerts.
4.3.2.1 EffectivenessEffectiveness was rated moderately overall, with IMA improving significantly from Phase 1 to Phase 2.Participants gave mostly moderate ratings of the effectiveness of the warnings in response to the question “How effective was ___ at alerting you to…” For the system as a whole, 41 percent of participants gave neutral ratings, 37 percent gave positive, and 22 percent negative (Figure 30). The same pattern was generally true for the individual safety applications.
When broken down by phase, however, there were differences. Phase 2 responses for the IMA were the most positive overall, and were a statistically significant improvement from Phase 1 (Mann-Whitney test;U = 322.0, nP1 = 37, nP2 = 28, p = .008), from a median response of 5 (IQR: 3) to 6 (IQR: 2). Other than the effectiveness ratings for IMA Phase 2, the BSW/LCW warning received the highest ratings (median: 6, IQR: 2).

Independent Evaluation of Light-Vehicle V2V Safety Applications
42
Figure 30. Ratings of Warning Effectiveness
Participants were asked to elaborate on their rating for the overall system in a subsequent open-ended follow-up question “Why?” Table 12 lists representative responses.
Table 12. Participants Responses to the Overall Effectiveness of the Connected Vehicle System
Participant Response
“Great aside from false alarms”
“Sometimes in heavy traffic it wasn’t so clear which car was involved”
“Warnings often came at poor times, i.e., merging on the highway”
“Could not understand what the warning was for”
“Most of the time, maybe every time, I was aware of the situation prior to the warning.”
“It put me in high alert and made me more observant”
4.3.2.2 Alert TrustworthinessAlert trustworthiness was rated moderately overall, with both IMA and EEBL improving significantly from Phase 1 to Phase 2. Trust is closely related to effectiveness. Driver responses to the rating “I trusted the [warnings]” followed much the same pattern as they did for effectiveness (Figure 31). The BSW/LCW again was the most highly rated (median: 6, IQR: 2.8), except for the IMA in Phase 2, which again significantly improved from Phase 1 (Mann-Whitney test; U = 280.5, nP1 = 37, nP2 = 28, p = .001), rising from a median of 4 (IQR: 4) to 7 (IQR: 2.5). In almost all cases, only the IMA improved from Phase 1 to 2; but in the case of trustworthiness, the EEBL also showed significant improvement (U = 294.0, nP1 = 30,nP2 = 30, p = .019), rising from a median of 4 (IQR: 3.8) to 5.5 (IQR: 2.8).
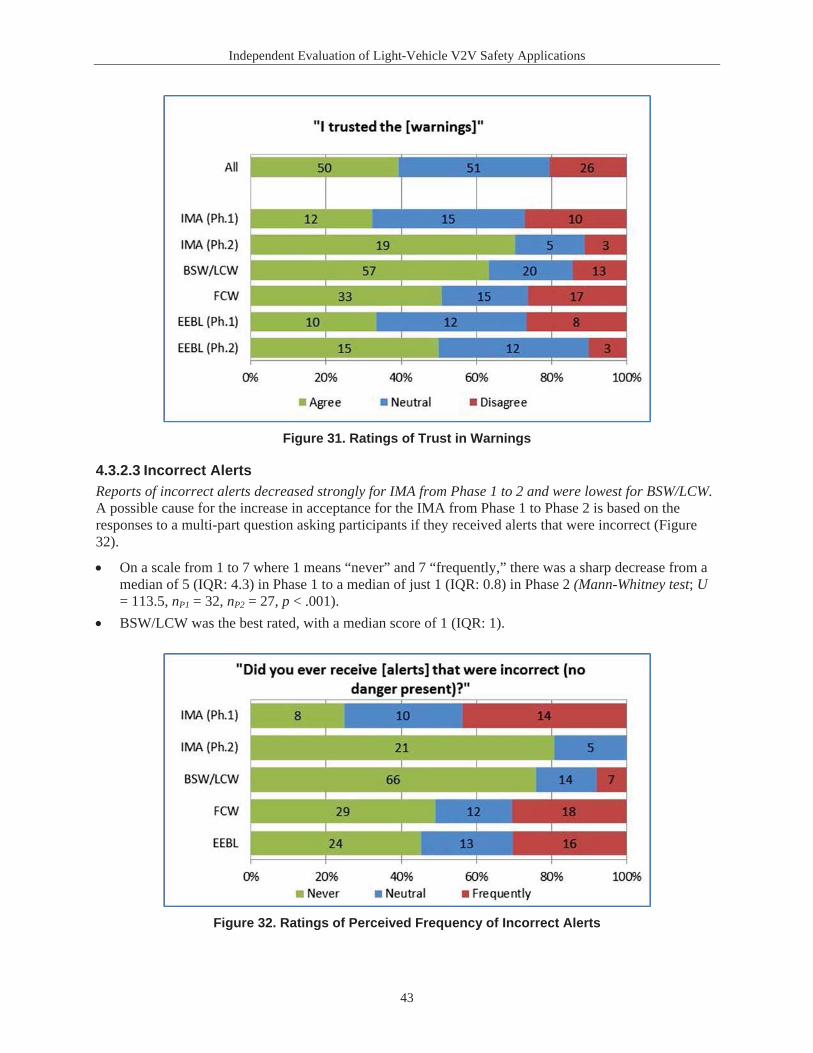
Independent Evaluation of Light-Vehicle V2V Safety Applications
43
Figure 31. Ratings of Trust in Warnings
4.3.2.3 Incorrect AlertsReports of incorrect alerts decreased strongly for IMA from Phase 1 to 2 and were lowest for BSW/LCW.A possible cause for the increase in acceptance for the IMA from Phase 1 to Phase 2 is based on the responses to a multi-part question asking participants if they received alerts that were incorrect (Figure 32).
On a scale from 1 to 7 where 1 means “never” and 7 “frequently,” there was a sharp decrease from a median of 5 (IQR: 4.3) in Phase 1 to a median of just 1 (IQR: 0.8) in Phase 2 (Mann-Whitney test; U= 113.5, nP1 = 32, nP2 = 27, p < .001).BSW/LCW was the best rated, with a median score of 1 (IQR: 1).
Figure 32. Ratings of Perceived Frequency of Incorrect Alerts

Independent Evaluation of Light-Vehicle V2V Safety Applications
44
Those participants who received incorrect alerts more often than “never” were then asked to more specifically rate how often they received them. The majority believed they never received incorrect alerts and so did not respond. For those who responded, the most frequent response for each application was that they “very rarely” received unnecessary alerts (Figure 33).
Figure 33. Ratings of Estimated Frequency of Incorrect Alerts
Finally, participants were asked if they could tell why they had been alerted. Some of these responses indicated a good grasp of factors interfering with the function of the V2V system, such as underpasses or poor GPS placement. Table 13 lists representative responses.
Table 13. Participants Responses in Determining Why They Had Been Alerted
Safety Application Participant Response
EEBL “Not in every situation. I would get a warning sometimes without seeing the hazard, but thinking I was near another vehicle” or “I figured it out that it must be sensing the lane next to mine.”
FCW “Yes, although one day it seemed very sensitive in terms of danger and distance,” and “No, nothing around. Went under bridge first time when it went off. The other time, there were no cars around.”
BSW/LCW “Rain seemed to affect it,” and “I could tell if a car was under me on an overpass.”
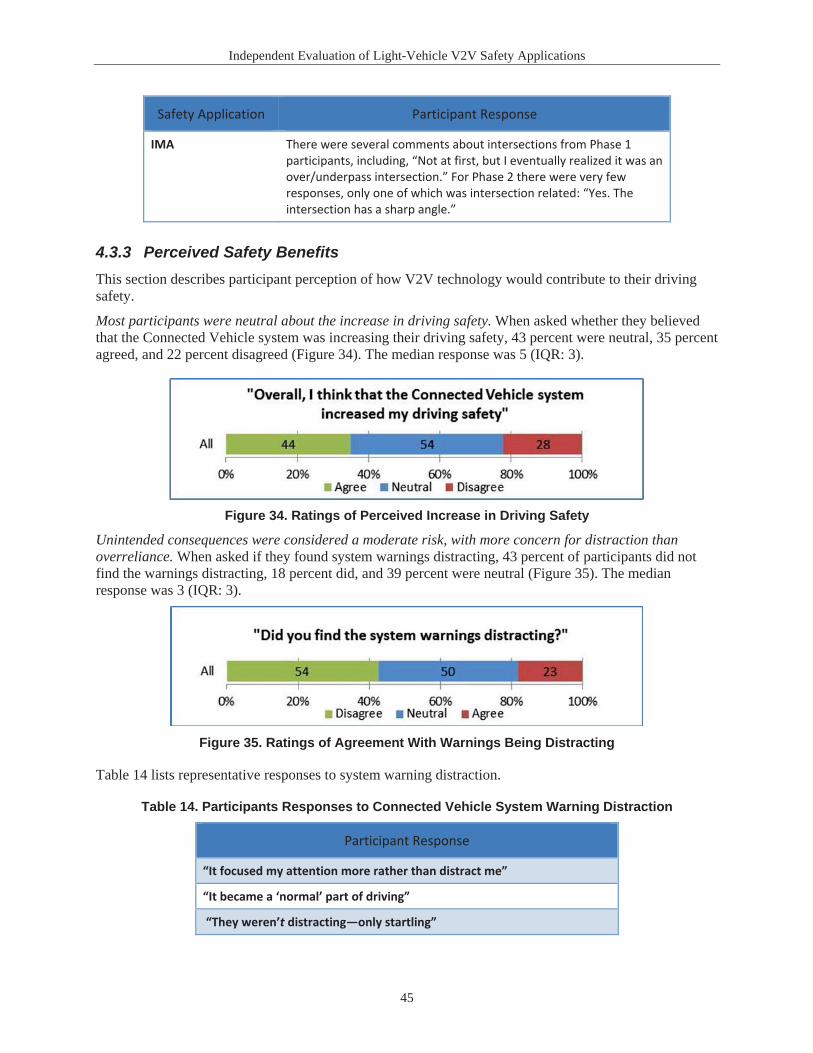
Independent Evaluation of Light-Vehicle V2V Safety Applications
45
Safety Application Participant Response
IMA There were several comments about intersections from Phase 1 participants, including, “Not at first, but I eventually realized it was an over/underpass intersection.” For Phase 2 there were very few responses, only one of which was intersection related: “Yes. The intersection has a sharp angle.”
4.3.3 Perceived Safety BenefitsThis section describes participant perception of how V2V technology would contribute to their driving safety.
Most participants were neutral about the increase in driving safety. When asked whether they believed that the Connected Vehicle system was increasing their driving safety, 43 percent were neutral, 35 percentagreed, and 22 percent disagreed (Figure 34). The median response was 5 (IQR: 3).
Figure 34. Ratings of Perceived Increase in Driving Safety
Unintended consequences were considered a moderate risk, with more concern for distraction than overreliance. When asked if they found system warnings distracting, 43 percent of participants did not find the warnings distracting, 18 percent did, and 39 percent were neutral (Figure 35). The median response was 3 (IQR: 3).
Figure 35. Ratings of Agreement With Warnings Being Distracting
Table 14 lists representative responses to system warning distraction.
Table 14. Participants Responses to Connected Vehicle System Warning Distraction
Participant Response
“It focused my attention more rather than distract me”
“It became a ‘normal’ part of driving”
“They weren’t distracting—only startling”

Independent Evaluation of Light-Vehicle V2V Safety Applications
46
Participant Response
“Mostly because they displayed in center console and took attention off road. Also, they were often for unclear reasons”
“The dash warning took my eyes off the road”
“Sometimes in busy streets I had anxiety of my alarm going off. It was like I was waiting for it to scare me”
“More often than not, I would slam on the brakes in the middle of traffic for no clear reason”
“Only at first”
“Would not say distracting, more like scary, since I did not know what was going on”
“I found trying to determine if it was a true alarm or not distracting. The actual warnings were fine”
“A vibrating seat, lights, and beeping are not conducive to safe driving.”
System distraction in relation to operating a car radio. When asked to describe the distraction potential of the system in more concrete terms in relation to operating their car’s radio, 52 percent of participantsthought the Connected Vehicle system was no more distracting, 34 percent neither agreed nor disagreed, and 14 percent thought it had more distraction potential (Figure 36). The median response was 6 (IQR: 3).
Figure 36. Ratings of System Distraction Compared to Operating a Car Radio
Overreliance is another unintended consequence, although the majority of participants were not worried about it. Sixty-eight percent disagreed with the multi-part statement “Availability of the Connected Vehicle safety applications will cause participants to pay less attention to the driving environment (e.g., the road, other vehicles, etc.)” (Figure 37). The median response was 2 (IQR: 2).
Figure 37. Ratings of System Overreliance
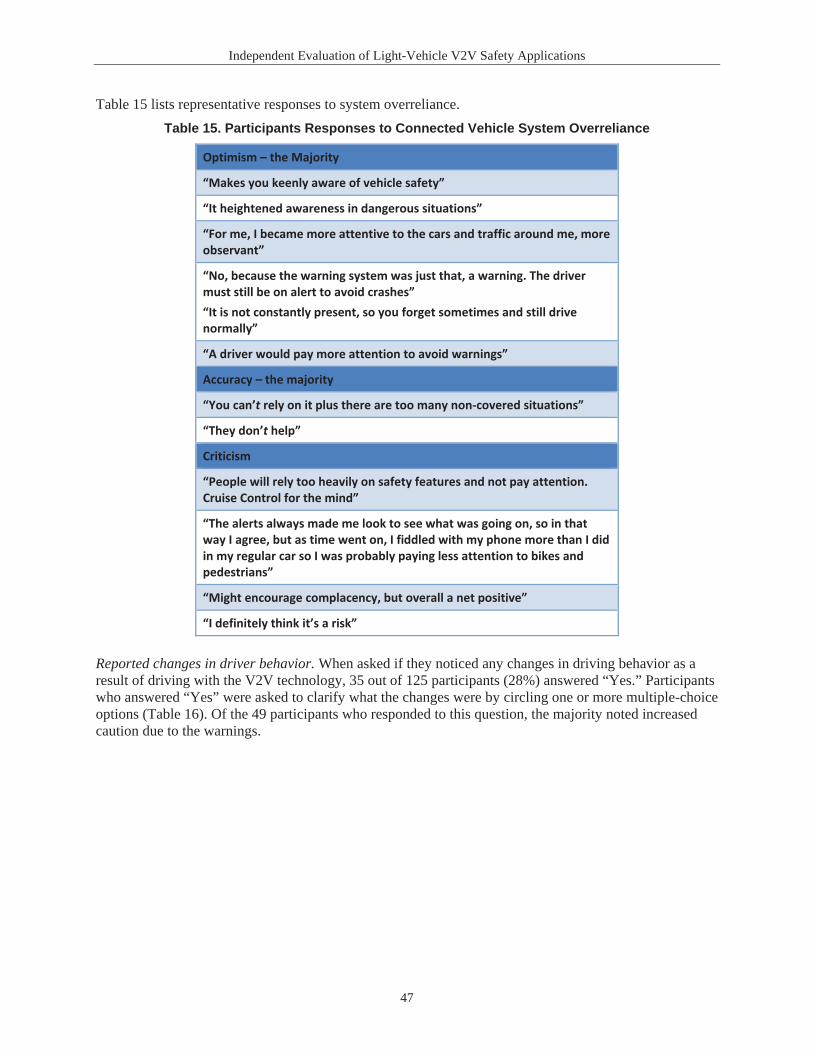
Independent Evaluation of Light-Vehicle V2V Safety Applications
47
Table 15 lists representative responses to system overreliance. Table 15. Participants Responses to Connected Vehicle System Overreliance
Optimism – the Majority
“Makes you keenly aware of vehicle safety”
“It heightened awareness in dangerous situations”
“For me, I became more attentive to the cars and traffic around me, more observant”
“No, because the warning system was just that, a warning. The driver must still be on alert to avoid crashes” “It is not constantly present, so you forget sometimes and still drive normally”
“A driver would pay more attention to avoid warnings”
Accuracy – the majority
“You can’t rely on it plus there are too many non-covered situations”
“They don’t help”
Criticism
“People will rely too heavily on safety features and not pay attention. Cruise Control for the mind”
“The alerts always made me look to see what was going on, so in that way I agree, but as time went on, I fiddled with my phone more than I did in my regular car so I was probably paying less attention to bikes and pedestrians”
“Might encourage complacency, but overall a net positive”
“I definitely think it’s a risk”
Reported changes in driver behavior. When asked if they noticed any changes in driving behavior as a result of driving with the V2V technology, 35 out of 125 participants (28%) answered “Yes.” Participantswho answered “Yes” were asked to clarify what the changes were by circling one or more multiple-choice options (Table 16). Of the 49 participants who responded to this question, the majority noted increasedcaution due to the warnings.
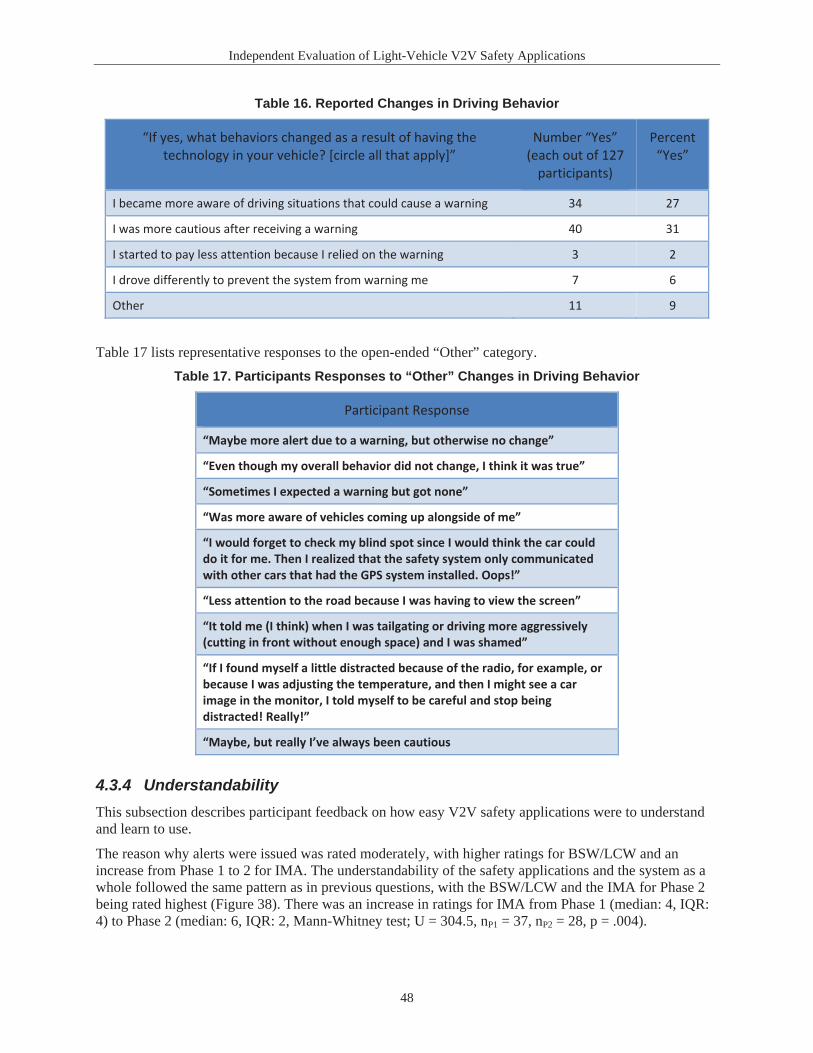
Independent Evaluation of Light-Vehicle V2V Safety Applications
48
Table 16. Reported Changes in Driving Behavior
“If yes, what behaviors changed as a result of having the technology in your vehicle? [circle all that apply]”
Number “Yes” (each out of 127
participants)
Percent “Yes”
I became more aware of driving situations that could cause a warning 34 27
I was more cautious after receiving a warning 40 31
I started to pay less attention because I relied on the warning 3 2
I drove differently to prevent the system from warning me 7 6
Other 11 9
Table 17 lists representative responses to the open-ended “Other” category. Table 17. Participants Responses to “Other” Changes in Driving Behavior
Participant Response
“Maybe more alert due to a warning, but otherwise no change”
“Even though my overall behavior did not change, I think it was true”
“Sometimes I expected a warning but got none”
“Was more aware of vehicles coming up alongside of me”
“I would forget to check my blind spot since I would think the car could do it for me. Then I realized that the safety system only communicated with other cars that had the GPS system installed. Oops!”
“Less attention to the road because I was having to view the screen”
“It told me (I think) when I was tailgating or driving more aggressively (cutting in front without enough space) and I was shamed”
“If I found myself a little distracted because of the radio, for example, or because I was adjusting the temperature, and then I might see a car image in the monitor, I told myself to be careful and stop being distracted! Really!”
“Maybe, but really I’ve always been cautious
4.3.4 UnderstandabilityThis subsection describes participant feedback on how easy V2V safety applications were to understand and learn to use.
The reason why alerts were issued was rated moderately, with higher ratings for BSW/LCW and an increase from Phase 1 to 2 for IMA. The understandability of the safety applications and the system as a whole followed the same pattern as in previous questions, with the BSW/LCW and the IMA for Phase 2 being rated highest (Figure 38). There was an increase in ratings for IMA from Phase 1 (median: 4, IQR: 4) to Phase 2 (median: 6, IQR: 2, Mann-Whitney test; U = 304.5, nP1 = 37, nP2 = 28, p = .004).
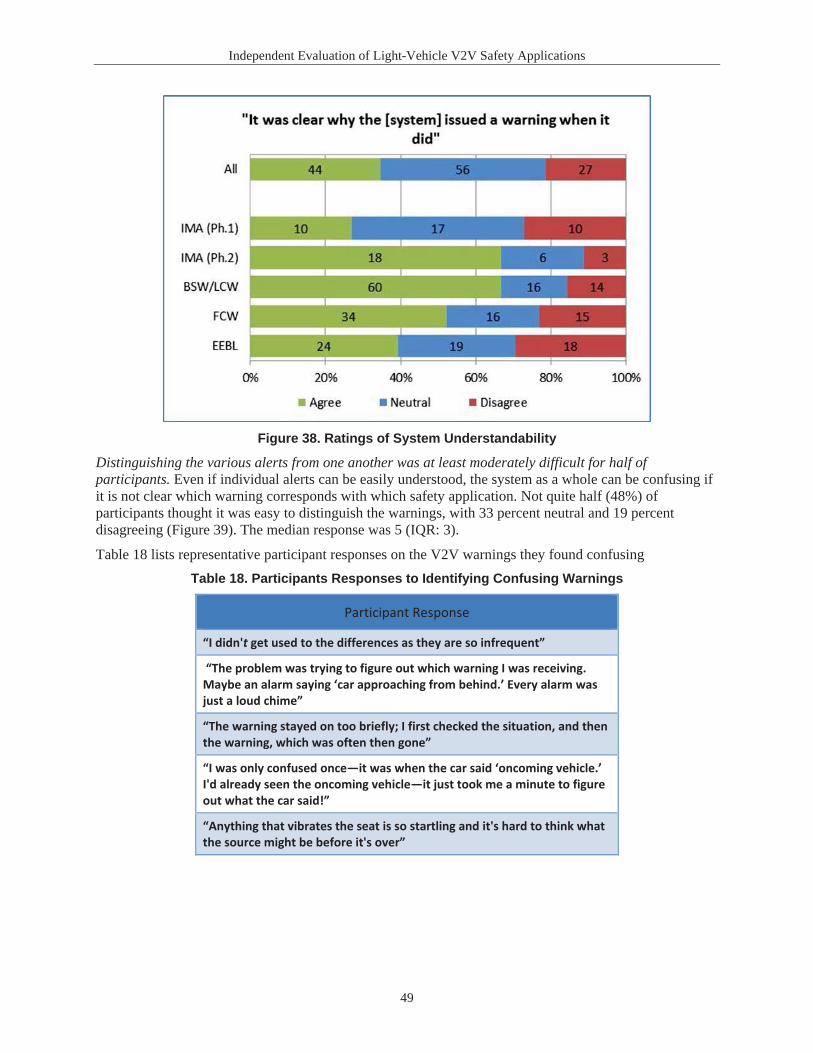
Independent Evaluation of Light-Vehicle V2V Safety Applications
49
Figure 38. Ratings of System Understandability
Distinguishing the various alerts from one another was at least moderately difficult for half of participants. Even if individual alerts can be easily understood, the system as a whole can be confusing if it is not clear which warning corresponds with which safety application. Not quite half (48%) of participants thought it was easy to distinguish the warnings, with 33 percent neutral and 19 percent disagreeing (Figure 39). The median response was 5 (IQR: 3).
Table 18 lists representative participant responses on the V2V warnings they found confusingTable 18. Participants Responses to Identifying Confusing Warnings
Participant Response
“I didn't get used to the differences as they are so infrequent”
“The problem was trying to figure out which warning I was receiving. Maybe an alarm saying ‘car approaching from behind.’ Every alarm was just a loud chime”
“The warning stayed on too briefly; I first checked the situation, and then the warning, which was often then gone”
“I was only confused once—it was when the car said ‘oncoming vehicle.’ I'd already seen the oncoming vehicle—it just took me a minute to figure out what the car said!”
“Anything that vibrates the seat is so startling and it's hard to think what the source might be before it's over”

Independent Evaluation of Light-Vehicle V2V Safety Applications
50
Figure 39. Ratings of the Difficulty of Distinguishing the Different Alert Types
4.3.5 DesirabilityThis subsection describes whether participants wanted to have and use V2V safety applications in their vehicle.
More than half of participants wanted each individual system, though only a third wanted the system as a whole. IMA once again improved from Phase 1 to 2. Although the desirability of the system as a whole was rated moderately (median: 5, IQR: 3), over 50 percent of participants rated desirability high for the BSW/LCW, FCW, EEBL, and for Phase 2 of the IMA (Figure 40). IMA ratings again improved significantly from Phase 1 (median: 4, IQR: 4) to Phase 2 (median: 6, IQR: 3, Mann-Whitney test; U =336.5, nP1 = 35, nP2 = 28, p = .031). Desire for the system overall did not change significantly from Phase 1 (median: 5, IQR: 3) to Phase 2 (median: 5, IQR: 4, Mann-Whitney test; U = 1,907, nP1 = 63, nP2 = 63, p= .70).
Figure 40. Ratings of Desirability of the System
Overall satisfaction with the Connected Vehicle system was mostly neutral. Thirty-nine percent of participants were satisfied, 50 percent neutral, and 11 percent dissatisfied (Figure 41). The median score was 5 (IQR: 2).
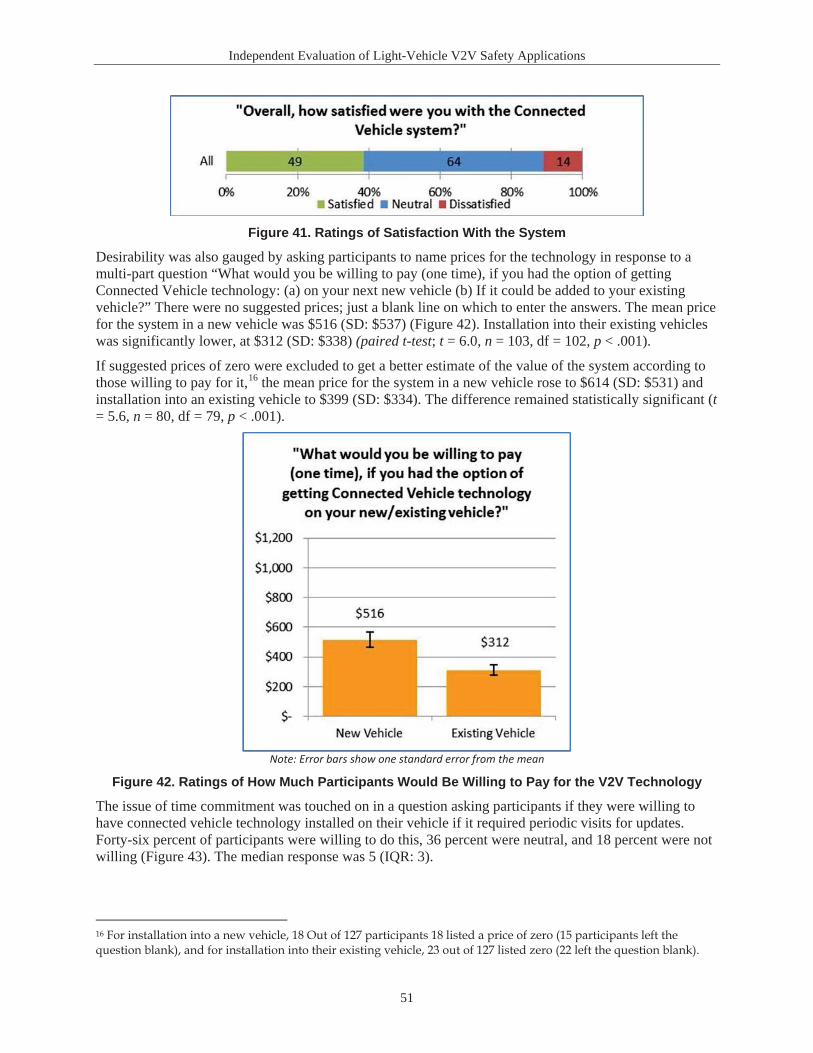
Independent Evaluation of Light-Vehicle V2V Safety Applications
51
Figure 41. Ratings of Satisfaction With the System
Desirability was also gauged by asking participants to name prices for the technology in response to a multi-part question “What would you be willing to pay (one time), if you had the option of getting Connected Vehicle technology: (a) on your next new vehicle (b) If it could be added to your existing vehicle?” There were no suggested prices; just a blank line on which to enter the answers. The mean price for the system in a new vehicle was $516 (SD: $537) (Figure 42). Installation into their existing vehicles was significantly lower, at $312 (SD: $338) (paired t-test; t = 6.0, n = 103, df = 102, p < .001).
If suggested prices of zero were excluded to get a better estimate of the value of the system according to those willing to pay for it,16 the mean price for the system in a new vehicle rose to $614 (SD: $531) and installation into an existing vehicle to $399 (SD: $334). The difference remained statistically significant (t= 5.6, n = 80, df = 79, p < .001).
Note: Error bars show one standard error from the mean
Figure 42. Ratings of How Much Participants Would Be Willing to Pay for the V2V Technology
The issue of time commitment was touched on in a question asking participants if they were willing to have connected vehicle technology installed on their vehicle if it required periodic visits for updates.Forty-six percent of participants were willing to do this, 36 percent were neutral, and 18 percent were not willing (Figure 43). The median response was 5 (IQR: 3).
16 For installation into a new vehicle, 18 Out of 127 participants 18 listed a price of zero (15 participants left the question blank), and for installation into their existing vehicle, 23 out of 127 listed zero (22 left the question blank).
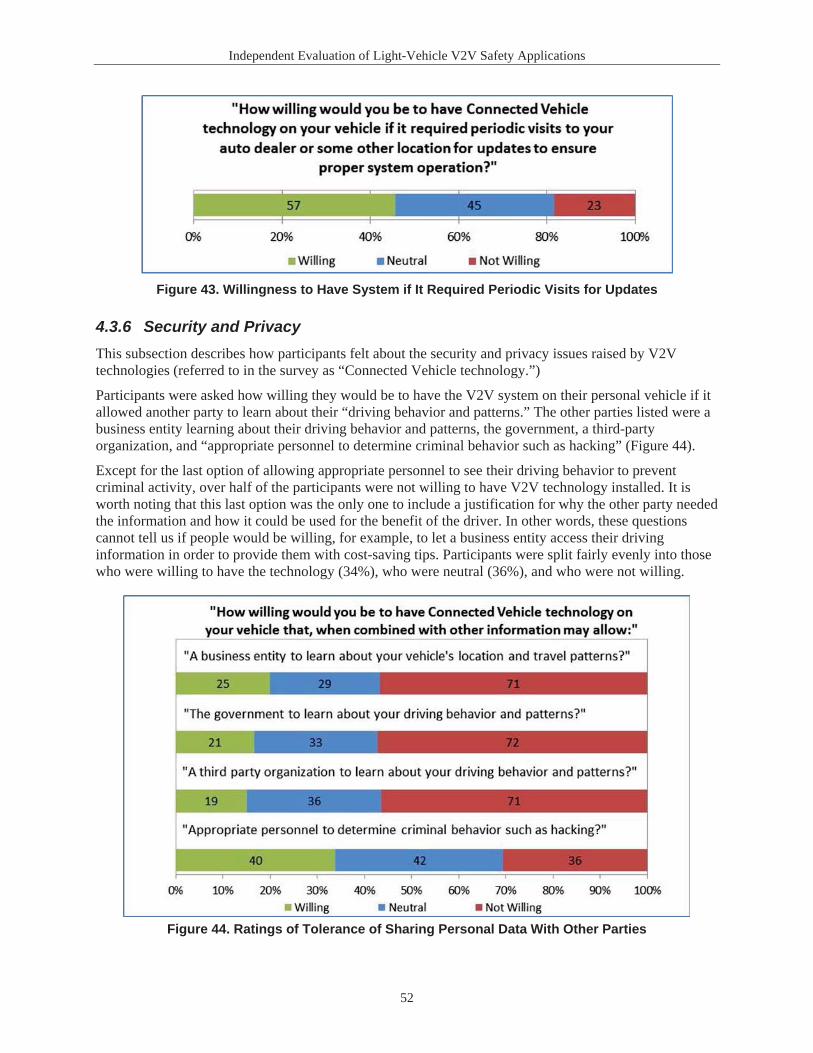
Independent Evaluation of Light-Vehicle V2V Safety Applications
52
Figure 43. Willingness to Have System if It Required Periodic Visits for Updates
4.3.6 Security and PrivacyThis subsection describes how participants felt about the security and privacy issues raised by V2V technologies (referred to in the survey as “Connected Vehicle technology.”)
Participants were asked how willing they would be to have the V2V system on their personal vehicle if it allowed another party to learn about their “driving behavior and patterns.” The other parties listed were abusiness entity learning about their driving behavior and patterns, the government, a third-party organization, and “appropriate personnel to determine criminal behavior such as hacking” (Figure 44).
Except for the last option of allowing appropriate personnel to see their driving behavior to prevent criminal activity, over half of the participants were not willing to have V2V technology installed. It isworth noting that this last option was the only one to include a justification for why the other party needed the information and how it could be used for the benefit of the driver. In other words, these questions cannot tell us if people would be willing, for example, to let a business entity access their driving information in order to provide them with cost-saving tips. Participants were split fairly evenly into thosewho were willing to have the technology (34%), who were neutral (36%), and who were not willing.
Figure 44. Ratings of Tolerance of Sharing Personal Data With Other Parties
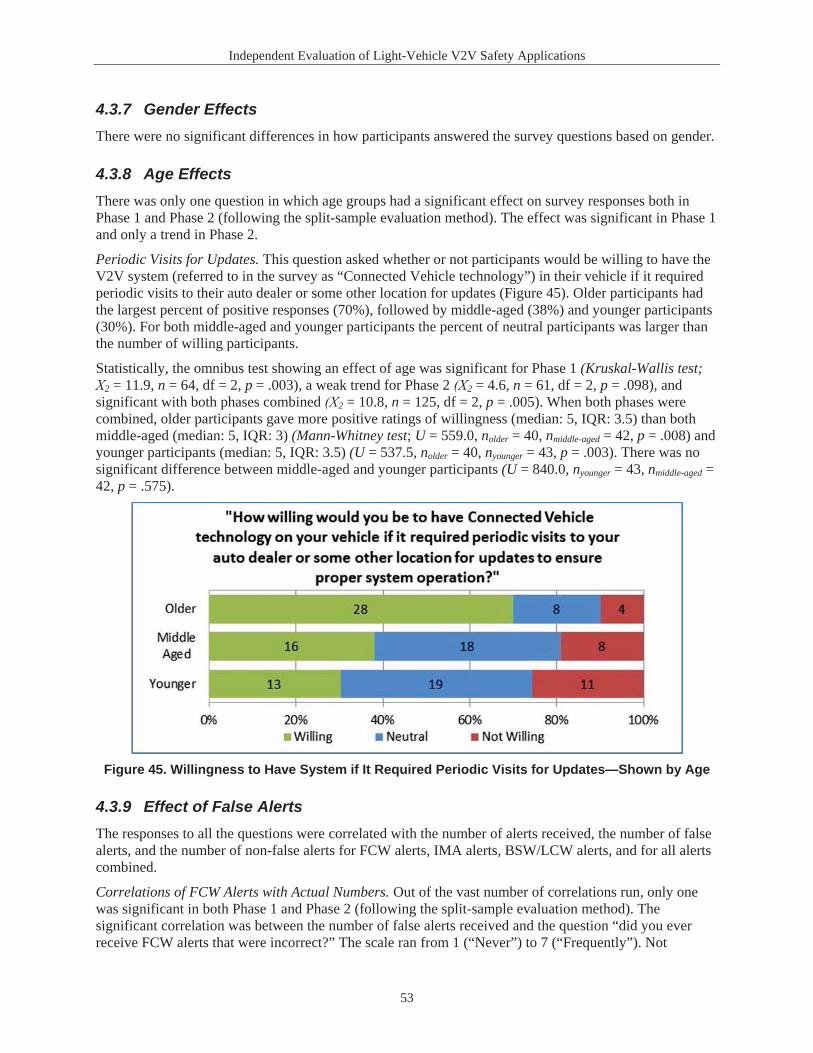
Independent Evaluation of Light-Vehicle V2V Safety Applications
53
4.3.7 Gender EffectsThere were no significant differences in how participants answered the survey questions based on gender.
4.3.8 Age EffectsThere was only one question in which age groups had a significant effect on survey responses both in Phase 1 and Phase 2 (following the split-sample evaluation method). The effect was significant in Phase 1and only a trend in Phase 2.
Periodic Visits for Updates. This question asked whether or not participants would be willing to have the V2V system (referred to in the survey as “Connected Vehicle technology”) in their vehicle if it required periodic visits to their auto dealer or some other location for updates (Figure 45). Older participants had the largest percent of positive responses (70%), followed by middle-aged (38%) and younger participants(30%). For both middle-aged and younger participants the percent of neutral participants was larger thanthe number of willing participants.
Statistically, the omnibus test showing an effect of age was significant for Phase 1 (Kruskal-Wallis test;2 = 11.9, n = 64, df = 2, p = .003), a weak trend for Phase 2 2 = 4.6, n = 61, df = 2, p = .098), and
significant with both phases combined 2 = 10.8, n = 125, df = 2, p = .005). When both phases were combined, older participants gave more positive ratings of willingness (median: 5, IQR: 3.5) than both middle-aged (median: 5, IQR: 3) (Mann-Whitney test; U = 559.0, nolder = 40, nmiddle-aged = 42, p = .008) and younger participants (median: 5, IQR: 3.5) (U = 537.5, nolder = 40, nyounger = 43, p = .003). There was no significant difference between middle-aged and younger participants (U = 840.0, nyounger = 43, nmiddle-aged =42, p = .575).
Figure 45. Willingness to Have System if It Required Periodic Visits for Updates—Shown by Age
4.3.9 Effect of False AlertsThe responses to all the questions were correlated with the number of alerts received, the number of false alerts, and the number of non-false alerts for FCW alerts, IMA alerts, BSW/LCW alerts, and for all alerts combined.
Correlations of FCW Alerts with Actual Numbers. Out of the vast number of correlations run, only one was significant in both Phase 1 and Phase 2 (following the split-sample evaluation method). The significant correlation was between the number of false alerts received and the question “did you ever receive FCW alerts that were incorrect?” The scale ran from 1 (“Never”) to 7 (“Frequently”). Not

Independent Evaluation of Light-Vehicle V2V Safety Applications
54
surprisingly, the more false alerts a participant received, the higher the rating they gave. In other words, participants appeared to be able to tell when they were receiving false FCW alerts (Figure 46).
Figure 46. Rated Frequency of FCW Alerts Received Correlated With Actual Number
Statistically, significant moderate-to-strong positive correlations were observed in Phase 1 (Spearman’s; rs = .43, n = 28, p = .024), Phase 2 (rs = .53, n = 31, p = .002), and for both phases combined (rs = .48, n =59, p < .001).
Correlations of IMA Alerts with Actual Numbers. One exception to the split-sample evaluation method—where only results that were independently significant in both Phases 1 and 2 are shown—was made forIMA. The reason is that IMA included a reduction in false alerts from Phase 1 to 2 from very high to very low, and it was only by including both that there was a range broad enough to capture a correlation (Figure 47). In this case, as with FCW, the more false alerts a participant received, the higher they rated the frequency of “incorrect” alerts.
Figure 47. Rated Frequency of IMA Alerts Received Correlated With Actual Number
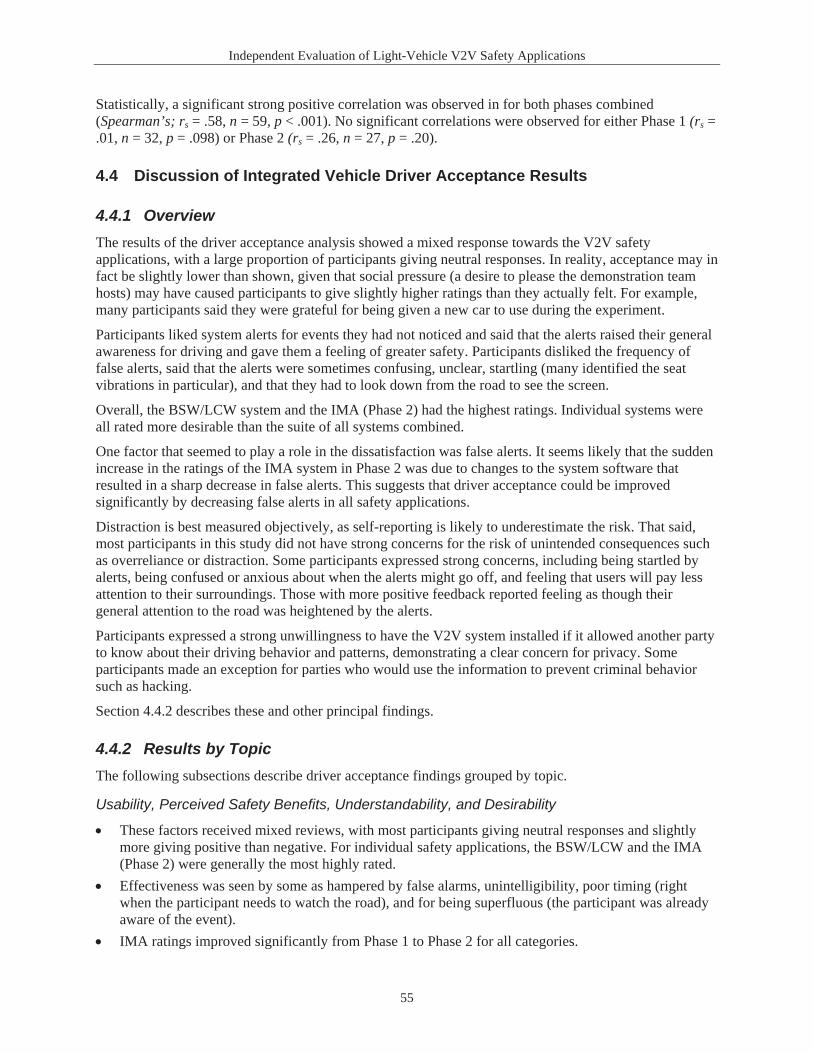
Independent Evaluation of Light-Vehicle V2V Safety Applications
55
Statistically, a significant strong positive correlation was observed in for both phases combined (Spearman’s; rs = .58, n = 59, p < .001). No significant correlations were observed for either Phase 1 (rs =.01, n = 32, p = .098) or Phase 2 (rs = .26, n = 27, p = .20).
4.4 Discussion of Integrated Vehicle Driver Acceptance Results
4.4.1 OverviewThe results of the driver acceptance analysis showed a mixed response towards the V2V safety applications, with a large proportion of participants giving neutral responses. In reality, acceptance may in fact be slightly lower than shown, given that social pressure (a desire to please the demonstration team hosts) may have caused participants to give slightly higher ratings than they actually felt. For example, many participants said they were grateful for being given a new car to use during the experiment.
Participants liked system alerts for events they had not noticed and said that the alerts raised their general awareness for driving and gave them a feeling of greater safety. Participants disliked the frequency of false alerts, said that the alerts were sometimes confusing, unclear, startling (many identified the seat vibrations in particular), and that they had to look down from the road to see the screen.
Overall, the BSW/LCW system and the IMA (Phase 2) had the highest ratings. Individual systems were all rated more desirable than the suite of all systems combined.
One factor that seemed to play a role in the dissatisfaction was false alerts. It seems likely that the sudden increase in the ratings of the IMA system in Phase 2 was due to changes to the system software that resulted in a sharp decrease in false alerts. This suggests that driver acceptance could be improved significantly by decreasing false alerts in all safety applications.
Distraction is best measured objectively, as self-reporting is likely to underestimate the risk. That said, most participants in this study did not have strong concerns for the risk of unintended consequences such as overreliance or distraction. Some participants expressed strong concerns, including being startled by alerts, being confused or anxious about when the alerts might go off, and feeling that users will pay less attention to their surroundings. Those with more positive feedback reported feeling as though their general attention to the road was heightened by the alerts.
Participants expressed a strong unwillingness to have the V2V system installed if it allowed another party to know about their driving behavior and patterns, demonstrating a clear concern for privacy. Some participants made an exception for parties who would use the information to prevent criminal behavior such as hacking.
Section 4.4.2 describes these and other principal findings.
4.4.2 Results by TopicThe following subsections describe driver acceptance findings grouped by topic.
Usability, Perceived Safety Benefits, Understandability, and Desirability
These factors received mixed reviews, with most participants giving neutral responses and slightly more giving positive than negative. For individual safety applications, the BSW/LCW and the IMA (Phase 2) were generally the most highly rated.Effectiveness was seen by some as hampered by false alarms, unintelligibility, poor timing (right when the participant needs to watch the road), and for being superfluous (the participant was already aware of the event).IMA ratings improved significantly from Phase 1 to Phase 2 for all categories.
Independent Evaluation of Light-Vehicle V2V Safety Applications
56
Forty-three percent thought the warnings were not distracting and 39 percent were neutral. Some said the warnings took getting used to and others reported the distraction coming from not knowing why the warning was issued.Half of the participants thought the system was no more distracting than using a car radio and a third were neutral. However, car radios were not likely to suddenly require attention right when a potential collision is about to occur, so this comparison may be of limited value.Most participants (68%) were not concerned with overreliance although in some cases this was only because they thought the system was not accurate enough to be relied upon implying that with a more accurate system the perceived risk of overreliance may increase. Others thought the alerts heightened general awareness of safe driving (by prompting them to look around and become more aware of their surroundings), which is what most participants who noticed a change in their driving behavior reported. However, distraction is best measured objectively.Each individual safety application was rated as desirable by more than half of participants (ignoring IMA from Phase 1), but the overall system was rated more moderately, as was overall satisfaction with the system.A slight majority of participants (particularly older participants) were willing to take their vehicle in for periodic updates to ensure proper operation.Participants were willing to pay more for the system in a new vehicle than to have it installed in their existing vehicle.
Data Security and Privacy
Most participants were very concerned with data privacy.For businesses, the government, and third-party organizations, more than half of participantsexpressed unwillingness to use V2V technology if it involved sharing information about their location and travel patterns.When an example was given of how another party might use their information to their advantage, namely to “determine criminal behavior such as hacking,” opinions were more mixed.
Gender Differences
No significant gender differences were detected.
Age Differences
Older participants were more willing than younger or middle-aged participants to bring their vehicle in for periodic updates to ensure system performance.
False Alerts
False alerts were often listed as one of the major problems with the system.Participants who received more false FCW alerts and false IMA alerts rated their false-alert frequency higher, indicating that they were able to tell which alerts were false and which were not.There were no significant correlations between the false alert rate and desire for the V2V system.
4.4.3 Limitations
4.4.3.1 Rarity of Types of EventsPossibly the most fundamental limitation to the model deployment is the rarity of the types of events for which the V2V safety applications were designed, namely an impending collision that the driver is
Independent Evaluation of Light-Vehicle V2V Safety Applications
57
unaware of. These events are particularly rare due to the fact that the vast majority of vehicles encountered by participants in Ann Arbor were not equipped with V2V technology. Consequently, of the near collisions a participant may have experienced, most did not cause an alert, but when they did cause an alert most were false. Of those alerts that were not false, in many cases the participant was performing a maneuver that, in their opinion, should not have resulted in an alert, and the participant would have considered them “nuisance alerts.” Finally, of those alerts that were not nuisance alerts, the participantwas probably already aware of the danger and reacting to it. As one participant said, “most of the time, maybe every time, I was aware of the situation prior to the warning.” Another said the system “alerted [me] to things I’d already noticed.” This pattern is supported by a previous naturalistic study of an FCW warning [4].
Since the model deployment only tested participants for 6 months, it is likely that the events the system was designed to respond to never occurred for most participants. This means that in the driver acceptance survey, participants were essentially being asked to rate the system based only on its potential with mostly false alerts as their experience. The exception would be safety, which provided useful alerts in daily driving (as opposed to rare collisions), such as the BSW indicator. Combined with its perceived lower false-alert rate, this may be why the BSW/LCW was rated higher: people were able to see it in use. The IMA (Phase 1) was the opposite, with the high numbers of false alerts seemingly outweighing the potential benefits.
4.4.3.2 Number of Different Vehicle Models and Safety ApplicationsThe model deployment included 8 different vehicle models with 8 differently designed combinations of safety applications. On the one hand, this may lessen the effect that individual designs have by averaging across multiple OEMs, but it also introduced more variation and noise into the data (between-subject tests are already very noisy), making trends harder to identify.
4.4.3.3 Evaluation of Driver OverrelianceAs noted in Section 4.4.3.1, since only a portion of the vehicles in Ann Arbor were equipped with V2V technology, not all conflicts that participants experienced were with other equipped vehicles. Several participants were aware of this and noted in their survey responses that they thought overreliance was unlikely as a result of having unequipped vehicles on the road. It is therefore worth stressing that the model deployment may not have allowed for an accurate evaluation of the risk of overreliance as it would exist under full deployment.
4.4.3.4 Imminent WarningsOnly imminent warnings were taken into account in the previous analyses, whereas participants may also have included the accuracy and frequency of cautionary alerts in their assessment of driver acceptance. It is also worth noting that the timings of the alerts used in the model deployment were conservative,relative to how they would be in production systems, and that with different timing it was theoretically possible that acceptance of the system might be different.
4.5 ASD ResultsThe results in this subsection are based on 190 ASD participants who completed the post-drive questionnaire. Of the 190 participants, 165 provided their demographic information. Figure 4 shows theparticipant age and gender breakdown.
As shown in Table 1, the ASDs in the Safety Pilot Model Deployment were equipped with two V2V based safety applications, FCW and EEBL. ASDs were also equipped with a V2I-based application called Curve Speed Warning, which alerted the driver if they were approaching an equipped curve at an unsafe speed. This safety application is not addressed in this analysis because it is a V2I-based application.
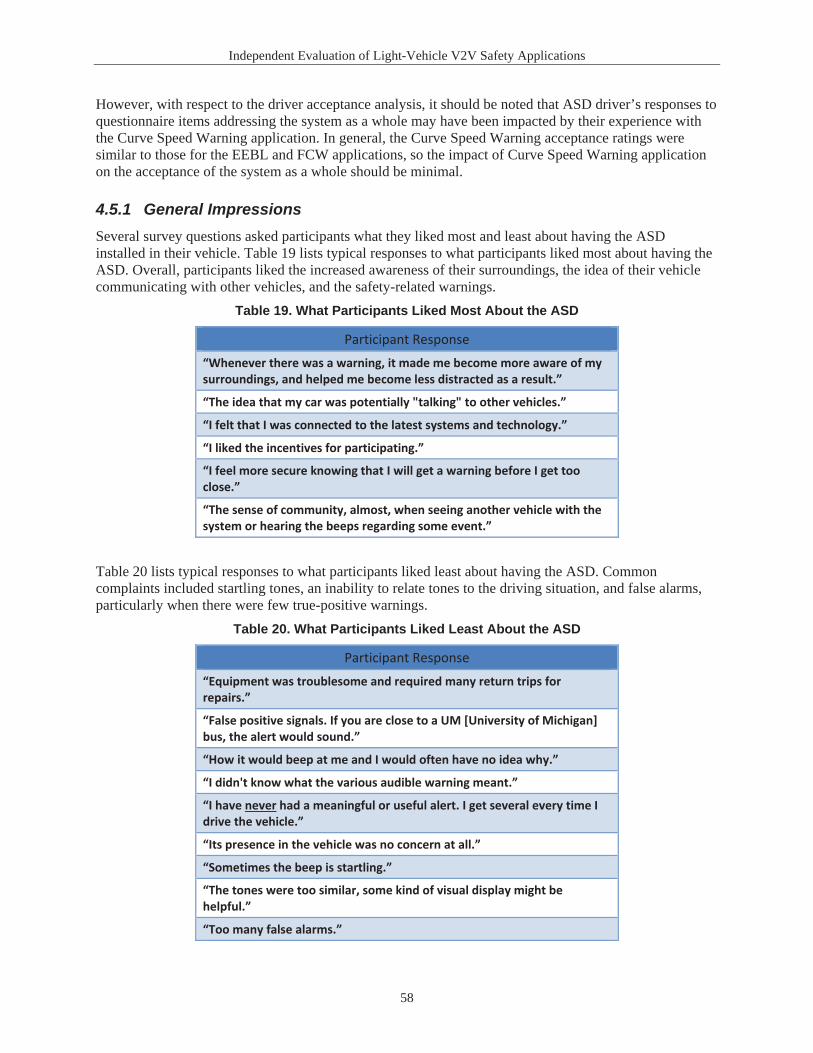
Independent Evaluation of Light-Vehicle V2V Safety Applications
58
However, with respect to the driver acceptance analysis, it should be noted that ASD driver’s responses to questionnaire items addressing the system as a whole may have been impacted by their experience with the Curve Speed Warning application. In general, the Curve Speed Warning acceptance ratings were similar to those for the EEBL and FCW applications, so the impact of Curve Speed Warning application on the acceptance of the system as a whole should be minimal.
4.5.1 General ImpressionsSeveral survey questions asked participants what they liked most and least about having the ASD installed in their vehicle. Table 19 lists typical responses to what participants liked most about having the ASD. Overall, participants liked the increased awareness of their surroundings, the idea of their vehicle communicating with other vehicles, and the safety-related warnings.
Table 19. What Participants Liked Most About the ASD
Participant Response “Whenever there was a warning, it made me become more aware of my surroundings, and helped me become less distracted as a result.”
“The idea that my car was potentially "talking" to other vehicles.”
“I felt that I was connected to the latest systems and technology.”
“I liked the incentives for participating.”
“I feel more secure knowing that I will get a warning before I get too close.”
“The sense of community, almost, when seeing another vehicle with the system or hearing the beeps regarding some event.”
Table 20 lists typical responses to what participants liked least about having the ASD. Common complaints included startling tones, an inability to relate tones to the driving situation, and false alarms,particularly when there were few true-positive warnings.
Table 20. What Participants Liked Least About the ASD
Participant Response
“Equipment was troublesome and required many return trips for repairs.”
“False positive signals. If you are close to a UM [University of Michigan] bus, the alert would sound.”
“How it would beep at me and I would often have no idea why.”
“I didn't know what the various audible warning meant.”
“I have never had a meaningful or useful alert. I get several every time I drive the vehicle.”
“Its presence in the vehicle was no concern at all.”
“Sometimes the beep is startling.”
“The tones were too similar, some kind of visual display might be helpful.”
“Too many false alarms.”
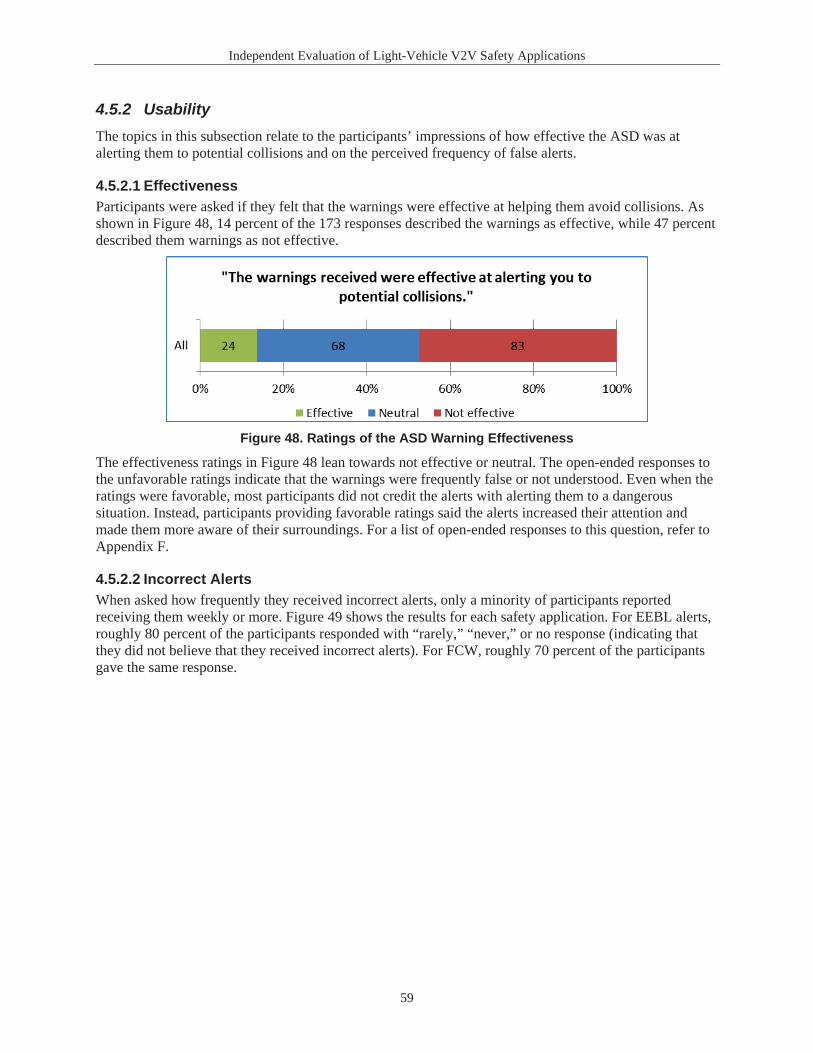
Independent Evaluation of Light-Vehicle V2V Safety Applications
59
4.5.2 UsabilityThe topics in this subsection relate to the participants’ impressions of how effective the ASD was at alerting them to potential collisions and on the perceived frequency of false alerts.
4.5.2.1 EffectivenessParticipants were asked if they felt that the warnings were effective at helping them avoid collisions. As shown in Figure 48, 14 percent of the 173 responses described the warnings as effective, while 47 percent described them warnings as not effective.
Figure 48. Ratings of the ASD Warning Effectiveness
The effectiveness ratings in Figure 48 lean towards not effective or neutral. The open-ended responses to the unfavorable ratings indicate that the warnings were frequently false or not understood. Even when the ratings were favorable, most participants did not credit the alerts with alerting them to a dangerous situation. Instead, participants providing favorable ratings said the alerts increased their attention and made them more aware of their surroundings. For a list of open-ended responses to this question, refer toAppendix F.
4.5.2.2 Incorrect AlertsWhen asked how frequently they received incorrect alerts, only a minority of participants reported receiving them weekly or more. Figure 49 shows the results for each safety application. For EEBL alerts,roughly 80 percent of the participants responded with “rarely,” “never,” or no response (indicating that they did not believe that they received incorrect alerts). For FCW, roughly 70 percent of the participantsgave the same response.
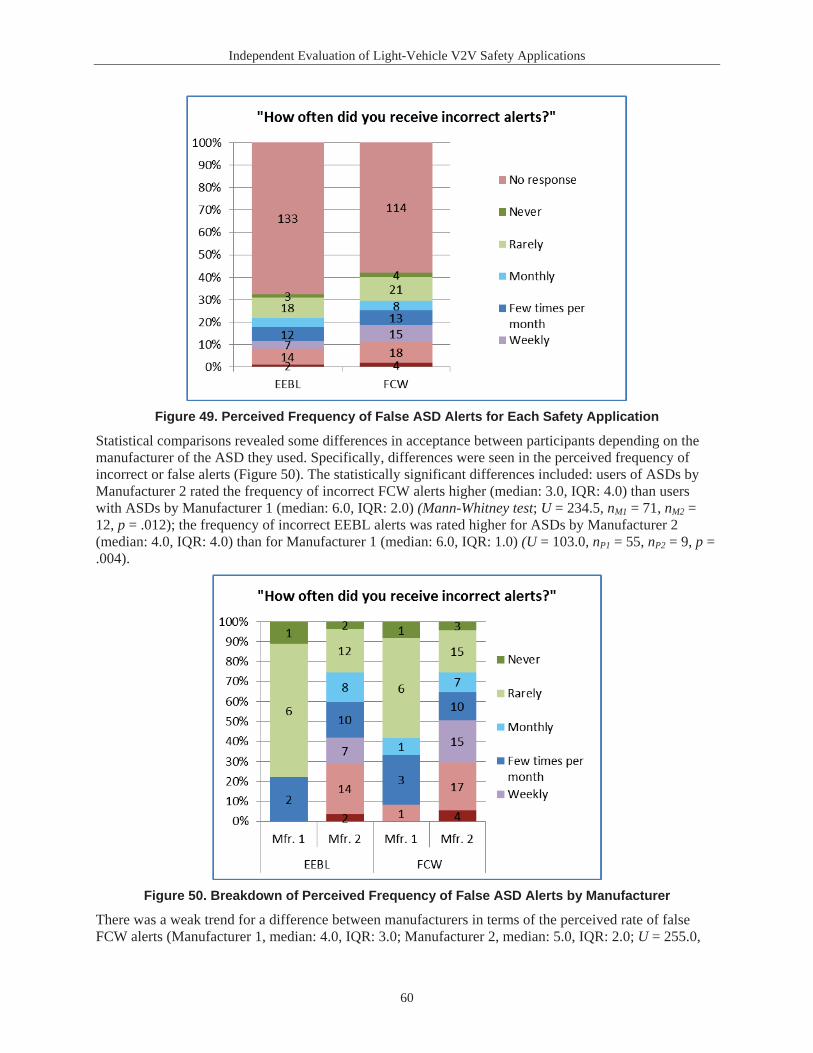
Independent Evaluation of Light-Vehicle V2V Safety Applications
60
Figure 49. Perceived Frequency of False ASD Alerts for Each Safety Application
Statistical comparisons revealed some differences in acceptance between participants depending on the manufacturer of the ASD they used. Specifically, differences were seen in the perceived frequency of incorrect or false alerts (Figure 50). The statistically significant differences included: users of ASDs by Manufacturer 2 rated the frequency of incorrect FCW alerts higher (median: 3.0, IQR: 4.0) than users with ASDs by Manufacturer 1 (median: 6.0, IQR: 2.0) (Mann-Whitney test; U = 234.5, nM1 = 71, nM2 =12, p = .012); the frequency of incorrect EEBL alerts was rated higher for ASDs by Manufacturer 2 (median: 4.0, IQR: 4.0) than for Manufacturer 1 (median: 6.0, IQR: 1.0) (U = 103.0, nP1 = 55, nP2 = 9, p =.004).
Figure 50. Breakdown of Perceived Frequency of False ASD Alerts by Manufacturer
There was a weak trend for a difference between manufacturers in terms of the perceived rate of false FCW alerts (Manufacturer 1, median: 4.0, IQR: 3.0; Manufacturer 2, median: 5.0, IQR: 2.0; U = 255.0,
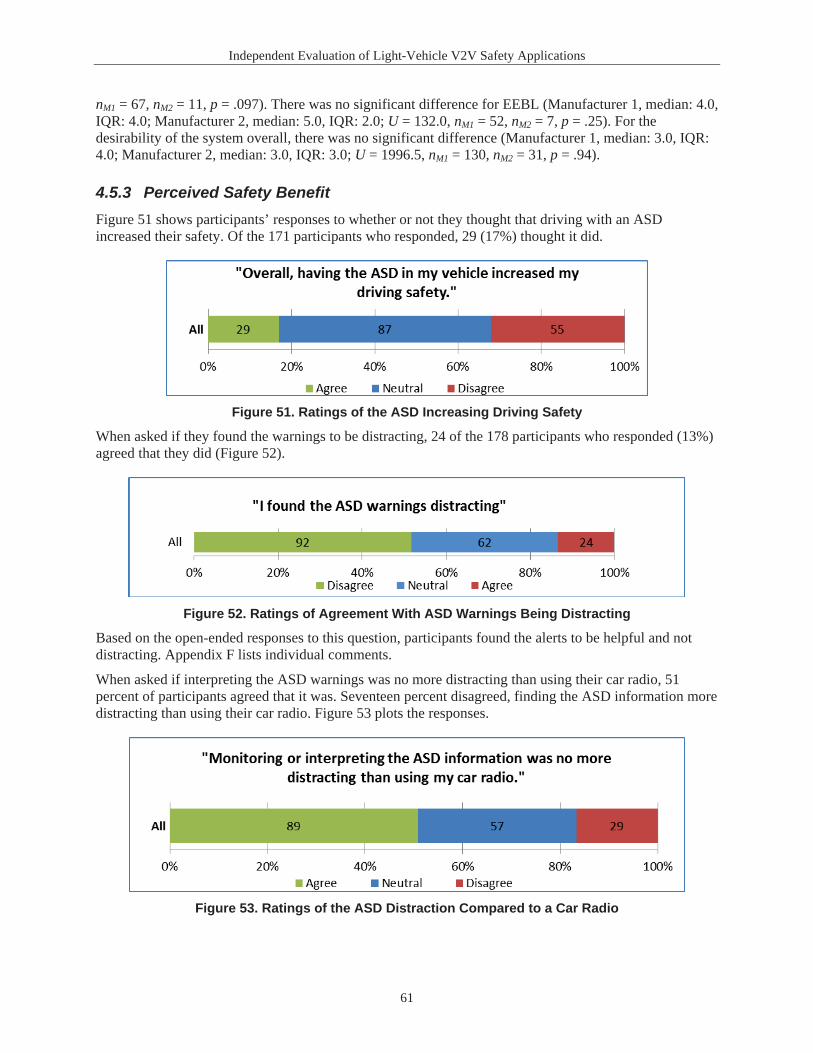
Independent Evaluation of Light-Vehicle V2V Safety Applications
61
nM1 = 67, nM2 = 11, p = .097). There was no significant difference for EEBL (Manufacturer 1, median: 4.0, IQR: 4.0; Manufacturer 2, median: 5.0, IQR: 2.0; U = 132.0, nM1 = 52, nM2 = 7, p = .25). For the desirability of the system overall, there was no significant difference (Manufacturer 1, median: 3.0, IQR: 4.0; Manufacturer 2, median: 3.0, IQR: 3.0; U = 1996.5, nM1 = 130, nM2 = 31, p = .94).
4.5.3 Perceived Safety BenefitFigure 51 shows participants’ responses to whether or not they thought that driving with an ASD increased their safety. Of the 171 participants who responded, 29 (17%) thought it did.
Figure 51. Ratings of the ASD Increasing Driving Safety
When asked if they found the warnings to be distracting, 24 of the 178 participants who responded (13%)agreed that they did (Figure 52).
Figure 52. Ratings of Agreement With ASD Warnings Being Distracting
Based on the open-ended responses to this question, participants found the alerts to be helpful and not distracting. Appendix F lists individual comments.
When asked if interpreting the ASD warnings was no more distracting than using their car radio, 51 percent of participants agreed that it was. Seventeen percent disagreed, finding the ASD information more distracting than using their car radio. Figure 53 plots the responses.
Figure 53. Ratings of the ASD Distraction Compared to a Car Radio
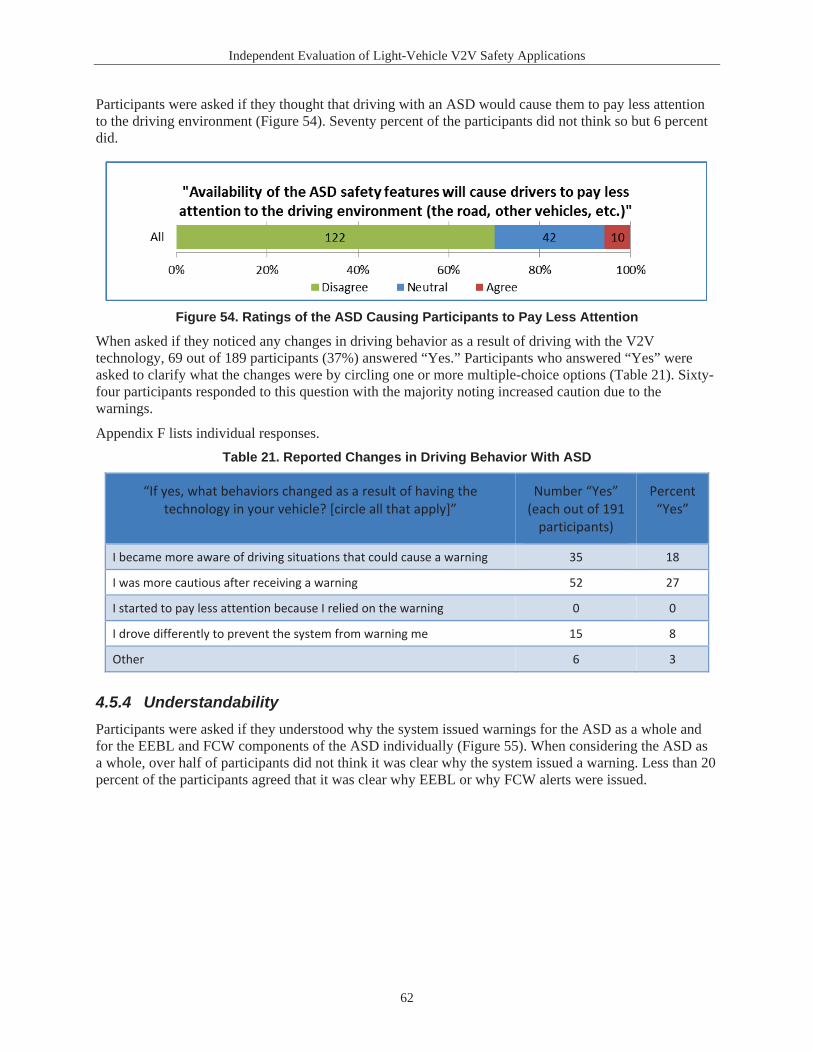
Independent Evaluation of Light-Vehicle V2V Safety Applications
62
Participants were asked if they thought that driving with an ASD would cause them to pay less attention to the driving environment (Figure 54). Seventy percent of the participants did not think so but 6 percent did.
Figure 54. Ratings of the ASD Causing Participants to Pay Less Attention
When asked if they noticed any changes in driving behavior as a result of driving with the V2V technology, 69 out of 189 participants (37%) answered “Yes.” Participants who answered “Yes” were asked to clarify what the changes were by circling one or more multiple-choice options (Table 21). Sixty-four participants responded to this question with the majority noting increased caution due to the warnings.
Appendix F lists individual responses. Table 21. Reported Changes in Driving Behavior With ASD
“If yes, what behaviors changed as a result of having the technology in your vehicle? [circle all that apply]”
Number “Yes” (each out of 191
participants)
Percent “Yes”
I became more aware of driving situations that could cause a warning 35 18
I was more cautious after receiving a warning 52 27
I started to pay less attention because I relied on the warning 0 0
I drove differently to prevent the system from warning me 15 8
Other 6 3
4.5.4 UnderstandabilityParticipants were asked if they understood why the system issued warnings for the ASD as a whole and for the EEBL and FCW components of the ASD individually (Figure 55). When considering the ASD as a whole, over half of participants did not think it was clear why the system issued a warning. Less than 20 percent of the participants agreed that it was clear why EEBL or why FCW alerts were issued.

Independent Evaluation of Light-Vehicle V2V Safety Applications
63
Figure 55. Participant Understanding of ASD Warnings
A consistent theme in the open-ended responses to this question was the inability to understand alerts, especially EEBL and FCW alerts. Appendix F lists individual comments.
Many participants also found it difficult to distinguish between the warnings of the three17 different safety applications (Figure 56). Of the 172 participants who responded, 114 (66%) found it difficult to discriminate among the different warnings. Only 13 found it easy.
Figure 56. Participant Ability to Discriminate Between ASD Alerts
4.5.5 DesirabilityParticipants were asked if they were interested in having the ASD system installed in their personal vehicle. This question was asked for the ASD as a whole as well as for the EEBL and FCW components individually (Figure 57). When considering the ASD as a whole, 24 of the 161 participants who responded (15%) wanted the ASD in their own vehicle.
17 Including the Curve Speed Warning.
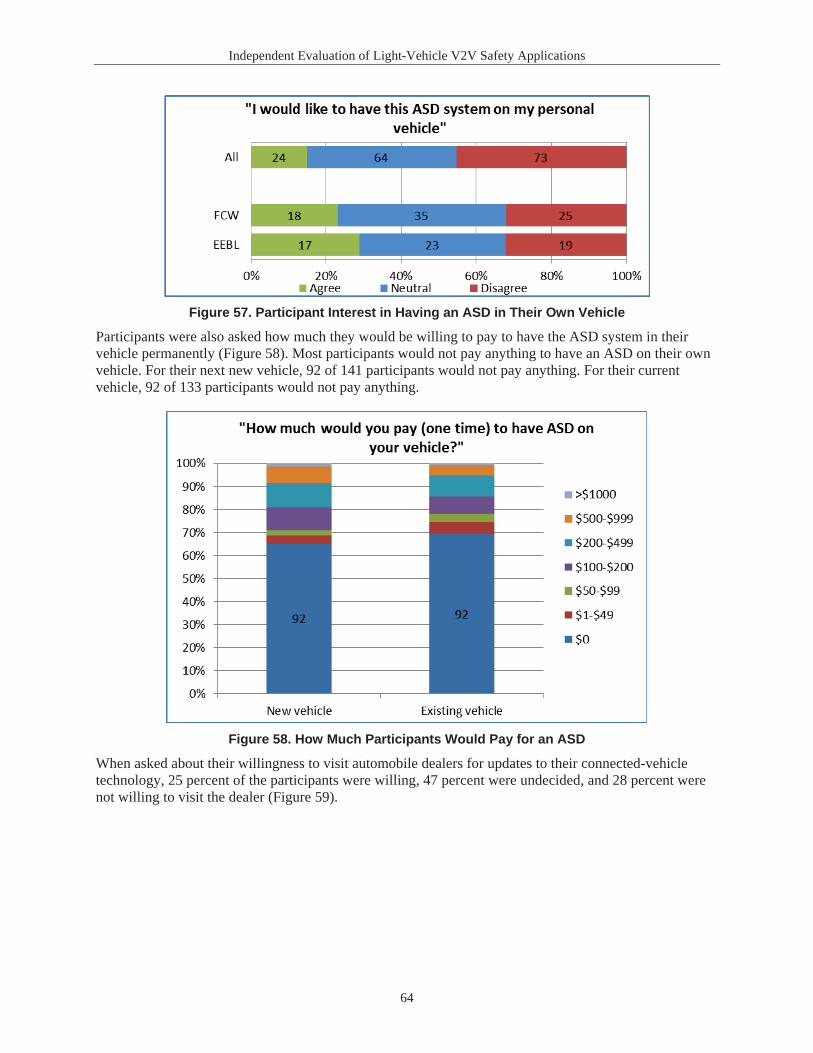
Independent Evaluation of Light-Vehicle V2V Safety Applications
64
Figure 57. Participant Interest in Having an ASD in Their Own Vehicle
Participants were also asked how much they would be willing to pay to have the ASD system in their vehicle permanently (Figure 58). Most participants would not pay anything to have an ASD on their own vehicle. For their next new vehicle, 92 of 141 participants would not pay anything. For their current vehicle, 92 of 133 participants would not pay anything.
Figure 58. How Much Participants Would Pay for an ASD
When asked about their willingness to visit automobile dealers for updates to their connected-vehicle technology, 25 percent of the participants were willing, 47 percent were undecided, and 28 percent were not willing to visit the dealer (Figure 59).
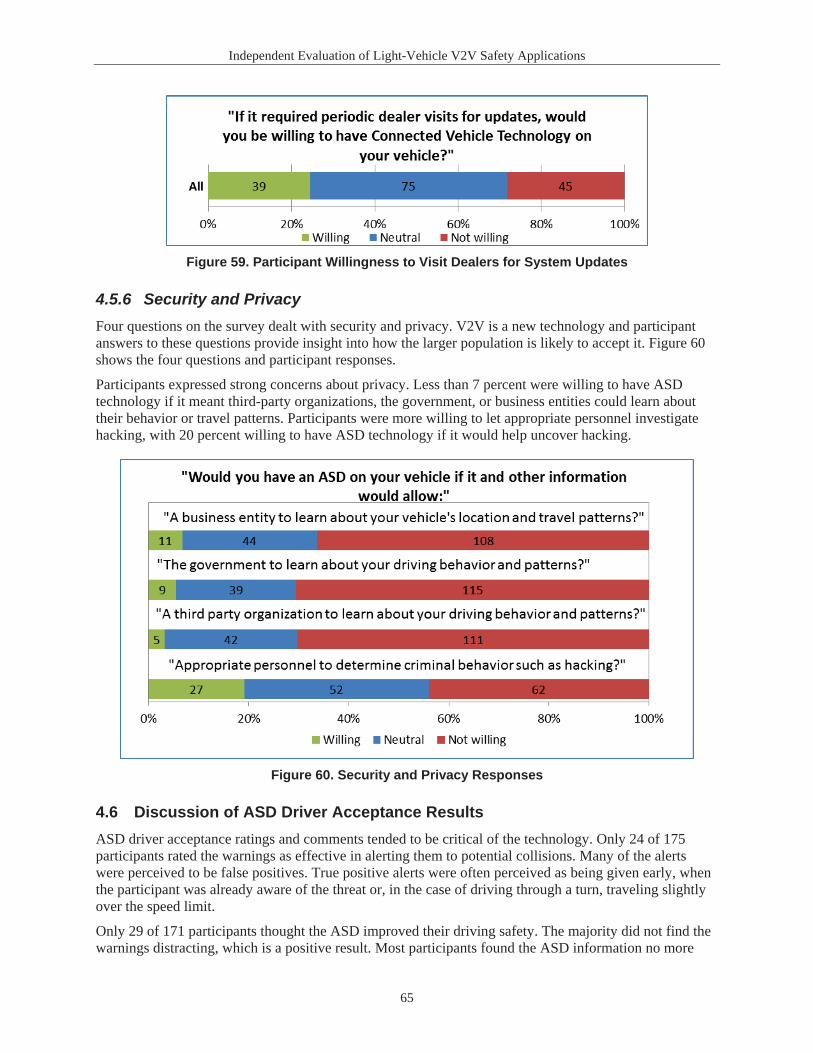
Independent Evaluation of Light-Vehicle V2V Safety Applications
65
Figure 59. Participant Willingness to Visit Dealers for System Updates
4.5.6 Security and PrivacyFour questions on the survey dealt with security and privacy. V2V is a new technology and participantanswers to these questions provide insight into how the larger population is likely to accept it. Figure 60shows the four questions and participant responses.
Participants expressed strong concerns about privacy. Less than 7 percent were willing to have ASD technology if it meant third-party organizations, the government, or business entities could learn about their behavior or travel patterns. Participants were more willing to let appropriate personnel investigate hacking, with 20 percent willing to have ASD technology if it would help uncover hacking.
Figure 60. Security and Privacy Responses
4.6 Discussion of ASD Driver Acceptance ResultsASD driver acceptance ratings and comments tended to be critical of the technology. Only 24 of 175 participants rated the warnings as effective in alerting them to potential collisions. Many of the alerts were perceived to be false positives. True positive alerts were often perceived as being given early, when the participant was already aware of the threat or, in the case of driving through a turn, traveling slightly over the speed limit.
Only 29 of 171 participants thought the ASD improved their driving safety. The majority did not find the warnings distracting, which is a positive result. Most participants found the ASD information no more
Independent Evaluation of Light-Vehicle V2V Safety Applications
66
distracting than using their car radio, and very few (only 10) thought it would cause drivers to pay less attention to the driving environment. Despite the low number of participants who thought the ASD improved their driving safety, many had favorable comments concerning changes in their driving behavior (Table 28).
Often participants did not understand why the ASD issued an alert. For the device as a whole, only 15 of 180 participants agreed that it was clear why the system issued a warning. Furthermore, few participantscould discriminate among the different warning tones (13 of 172). Many participants could not discriminate between an FCW and EEBL alert. (An inability to discriminate between these two, however, may not decrease safety. In either case, a true-positive alert means that a driver needs to decelerate for a slower vehicle.)
The mixed results about usability, perceived safety, and understandability influenced participants’ interest in acquiring an ASD. Only 24 of 161wanted an ASD in their vehicle, and a minority expressed a desire to have the EEBL or FCW applications individually. Responses were mixed concerning participants’ willingness to visit a dealer for periodic software updates. Roughly 25 percent were willing to visit, 25percent were unwilling, and the remaining 50 percent were neutral.
Acceptance of the ASDs varied depending on which manufacturer made the ASD. As shown in Figure 18,Manufacturer 1 had a higher percentage of in-path FCW alerts. Not surprisingly, participants who used an ASD from Manufacturer 1 rated the frequency with which they received incorrect FCW alerts lower than those who used an ASD from Manufacturer 2 (Figure 50). Incorrect EEBL alerts were also considered to be less frequent for Manufacturer 1. Desirability was only slightly higher for the FCW for Manufacturer 2. There were, however, no significant differences in the desirability of the EEBL between manufacturers, nor for the ASD system overall.
Participants had strong opinions about privacy. Although 27 of 141 participants were willing to allow appropriate personnel to access their driving information to determine criminal behavior such as hacking, very few (less than 7%) were willing to have an ASD installed if it meant third-party organizations, the government, or business entities could learn about their behavior or travel patterns.
Finally, questions that refer to the system as a whole may have been influenced by participants’ exposure to the Curve Speed Warning application, which was not reviewed in this analysis. However, subjective ratings of the Curve Speed Warning application were similar to the ratings for the other safety applications, so it is unlikely that the participants’ experiences with this application skewed the results of the system as a whole.
Independent Evaluation of Light-Vehicle V2V Safety Applications
67
5 ConclusionsOverall, the Safety Pilot Model Deployment demonstrated that V2V technology can be deployed in a real-world driving environment. The experimental design was successful in creating naturalistic interactions between DSRC-equipped vehicles, and the safety applications issued warnings in the safety-critical driving scenarios that they were designed to address.
The model deployment was also crucial in revealing areas for improving the performance of the DSRC technology and the prototype safety applications which could not have been identified in controlled testing environments. Some of these improvements were made during the model deployment, while others require further research.
This section presents the key findings from the Safety Pilot Model Deployment evaluation. Findings are separated into three main categories: system capability, unintended consequences, and driver acceptance.
5.1 System CapabilityThe model deployment demonstrated the feasibility of V2V safety applications, but also revealed the areas where the applications have room for improvement.
The most critical area for improvement in the prototype safety applications is properly determining the relative location of target vehicles with lane-level accuracy. This impacted both the FCW and BSW/LCW safety applications, since these applications attempt to issue warnings only for vehicles in the same lane as the host vehicle (FCW) or in the lane adjacent to the host vehicle (BSW/LCW). Relative position accuracy is impacted by many factors including GPS accuracy, the timeliness and accuracy of the messages received from the remote vehicle, road geometry, and the application software. More research is currently being conducted by CAMP and the U.S. DOT to improve relative positioning and lane-level accuracy of V2V technology.
Two major improvement needs observed in the IMA application—suppression of false alerts issued at overpasses and on highway ramps—were corrected during the model deployment via softwaremodifications. One area for future improvement includes tailoring the IMA application so that warnings are not issued when the driver is not in a threat scenario or is not intending to proceed into the intersection. Examples include alerts that are issued when either the host or remove vehicle is turning away from a collision path, or when a driver is creeping forward at an intersection but does not immediately intend to proceed. Additional research on driver behavior at intersections is needed to properly improve the IMA application in timely crash-imminent alerts and false-alert suppression.
Key system capability findings are summarized below for each safety application.
5.1.1 FCWWhen Phase 1 and Phase 2 are combined, only about one third of all integrated vehicle FCW alerts were issued for in-path targets. The remaining alerts were false alerts.Even though the in-path percentage for 6 of the 7 integrated vehicle manufacturers with the FCW application was around 20 percent, it was 70 percent for the seventh manufacturer. This discrepancy suggests updates to the algorithm design are required to improve the in-path percentage of FCW alerts for the six manufacturers with the lower rate.The in-path percentage of integrated vehicle FCW alerts issued for stopped targets was 10 percent; much lower than the 40 percent rate for moving targets. This is likely a result of alerts for stopped targets being issued at a greater range than alerts issued for moving targets (when the lead vehicle is

Independent Evaluation of Light-Vehicle V2V Safety Applications
68
stopped, the host vehicle approaches more quickly than if the lead vehicle is moving, so warningsneed to be issued from further away to give the driver enough time to respond).For integrated vehicle FCW alerts, the highest in-path percentage was observed when the target vehicle was between 10 and 40 meters away.There were no observed differences in the in-path percentage of integrated vehicle FCW alerts when broken down by the device type of the target vehicle.There were no observed missed FCW alerts in the model deployment.The performance of the FCW alerts from one ASD manufacturer was comparable to the performance of the integrated vehicle FCW alerts. In contrast, most of the FCW alerts from another ASDmanufacturer were for opposite direction vehicles.
5.1.2 IMAOnly 6 percent of the IMA alerts issued in Phase 2 were false alerts.Twenty-two percent of IMA alerts issued in Phase 2 were issued at intersections in non-hazard scenarios (the paths of the host and remote vehicles do not intersect due to one or both vehicles turning off of the intersection path). Alerts issued in these scenarios represent opportunities for improved accuracy in future implementations of the IMA application.Eleven events were identified as potential missed IMA stopped scenarios, but these were not validated by the car manufacturers. There were no observed instances of missed IMA moving alerts in the model deployment.
5.1.3 BSW/LCWFifty-four percent of BSW/LCW alerts were issued for remote vehicles in the lane adjacent to the host vehicle. In almost half of these events the host vehicle had just passed the remote vehicle and was moving away (distance between the cars is getting larger and therefore the remote vehicle is unlikely to be considered a threat). These alerts represent opportunities for improvement in future implementations of V2V-based BSW/LCW applications.There was 1 missed BSW/LCW alert event observed during the model deployment. Additional missed BSW/LCW alert events might potentially occur if there was a wider deployment of the BSW/LCW application.
5.2 Unintended ConsequencesThe independent evaluation observed drivers’ reactions to a total of 2,384 crash-imminent alerts issued by the V2V safety applications. In 11 false FCW events, drivers seemed startled, irritated, or distracted by the alerts. In 8 of these 11 events, drivers braked softly even though there was no target vehicle or threat ahead of them. Only 2 false IMA events were observed where drivers either hesitated or aborted making a right-turn maneuver. Generally, there was no direct negative safety impact observed due to the false FCW and IMA alerts; however, it is likely these false events impacted driver acceptance of the technology.
5.3 Driver AcceptanceKey driver acceptance findings for integrated vehicles and ASDs are summarized below.

Independent Evaluation of Light-Vehicle V2V Safety Applications
69
5.3.1 Integrated VehiclesUsability, perceived safety benefits, understandability, and desirability received mixed reviews, with most participants giving neutral responses and slightly more participants giving positive responsesthan negative responses.Effectiveness was seen by some as hampered by false alarms, unintelligibility, poor timing (right when the participant needs to watch the road), and for being superfluous (the participant was already aware of the event).IMA ratings improved significantly from Phase 1 to Phase 2 in all categories.Forty-three percent of participants thought the warnings were not distracting and 39 percent were neutral. Some said the warnings took getting used to and others reported the distraction was from not knowing why the warning was issued.Most participants (68%) were not concerned with overreliance. In some cases this was only because they thought the system was not accurate enough to be relied upon, implying that with a more accurate system the perceived risk of overreliance may increase. Others thought the alerts heightened general awareness of safe driving (by prompting them to look around and become more aware of their surroundings). Each safety application was rated as desirable by more than half of participants (ignoring IMA from Phase 1), but the overall system was rated more moderately, as was overall satisfaction with the system.A slight majority of participants (particularly older participants) were willing to take their vehicle in for periodic updates to ensure proper operation.Participants were willing to pay more for the system in a new vehicle than to have it installed in their existing vehicle.Most participants were very concerned with data privacy. For businesses, the government, and third-party organizations, more than half the participants were unwilling to use V2V technology if it meant sharing information about their location and travel patterns. When an example was given of how another party might use their information to their advantage, namely to “determine criminal behavior such as hacking,” opinions were more mixed. This result was the same for users of the ASD systems.False alerts were often listed as one of the major problems with the system. However, there were no significant correlations between the false alert rate and desire for the V2V system.
5.3.2 Aftermarket DevicesParticipants were critical of the effectiveness of the ASD system in alerting them and slightly more moderate about the perceived safety benefits.Similar to integrated vehicles, most participants (52%) did not find the ASD alerts distracting and 70 percent showed little concern for overreliance (but that could be because the system may be seen as too inaccurate at this point to be relied upon).For the system overall, 55 percent thought it was not clear why the system was warning them. Part of the confusion may have been due to the difficulty in distinguishing between the different alerts, since 66 percent of participants thought it was not easy to do so.

Independent Evaluation of Light-Vehicle V2V Safety Applications
70
Overall desire for the ASD system was moderate, but leaning towards the negative: 15 percent wanted the system on their personal vehicle, 40 percent were neutral, and 45 percent did not want the system. Desire for the system was slightly higher for the EEBL system with 29 percent wanting the system but 32 percent still not wanting it.Similar to integrated vehicles, most participants with ASD systems were very concerned with data privacy, but were slightly more willing to accept their driving patterns and to accept information being made available to others when it was used to prevent hacking.
Independent Evaluation of Light-Vehicle V2V Safety Applications
71
6 References
[1] Yanagisawa, M., & Najm, W. G. (In press). Estimation of safety benefits for light-vehicle crash warning applications based on vehicle-to-vehicle communications. Washington, DC: National Highway Traffic Safety Administration.
[2] Nodine, E., Lam, A., Stevens, S., Razo, M., & Najm, W. G. (2011, October). Integrated Vehicle-Based Safety Systems (IVBSS) Light Vehicle Field Operational Test Independent Evaluation. (Report No. DOT HS 811 516). Washington, DC: National Highway Traffic Safety Administration.
[3] Smith, S., & Razo, M. (2014, April). Using traffic microsimulation to assess deployment strategies for the connected vehicle safety pilot. Journal of Intelligent Transportation Systems: Technology, Planning, and Operations. DOI: 10.1080/15472450.2014.889941.
[4] Stevens, S. (2011). Do drivers brake in response to rear-end collision events or alerts from forward collision warning systems? Volpe National Transportation Systems Center Cambridge, MA, DOT-VNTSC-NHTSA-16-01.
Independent Evaluation of Light-Vehicle V2V Safety Applications
72
Appendix A: Excerpts From the CAMP V2V-MD Final Report (Working Paper)
Publication of full report pending review and approval

Independent Evaluation of Light-Vehicle V2V Safety Applications
73
Note: The following subsections are excerpted from Chapter 3 of the V2V-MD Final report. This is a working report, and as such, is for internal use only and not for publication
3.1 Phase 1 to Phase II Software UpdatesThe following section describes the updates that were performed to each of the major V2V platforms. The software updates were based on the data analysis performed on the Phase I data and predominantly implemented during the “refresh” period between Phase I and Phase II.
3.1.1 Software Updates: VSC-A VehiclesDuring the transition from Phase I to Phase II, modifications were made to improve the quality and real-world appropriateness of the safety application algorithms for VSC-A vehicles. These modifications focused primarily on Target Classification, FCW, and IMA alert applications as a direct result of preliminary reviews of alerts issued during Phase I. As discussed earlier, the majority of false alerts occurred during the IMA application – as such the Project Team focused on improving this application.
VSC-A IMA Algorithm Update to Reduce False AlertsDuring Phase 1, the following scenario characteristics were found to issue false IMA warnings: when the HV and/or RV were traveling on ramps (shown in Figure 28), the HV and RV were approaching the same curve traveling in opposite directions (shown in Figure 29), the HV and/or RV were able to comfortably brake to avoid collision (shown in Figure 30), the HV and/or RV were traveling on overpasses (shown in Figure 31), the HV and/or RV were traveling at speeds such that a collision could be avoided without braking at all (shown in Figure 32), and the HV was stopped while an RV was turning right onto the far lane, not affecting the HV (shown in Figure 33).
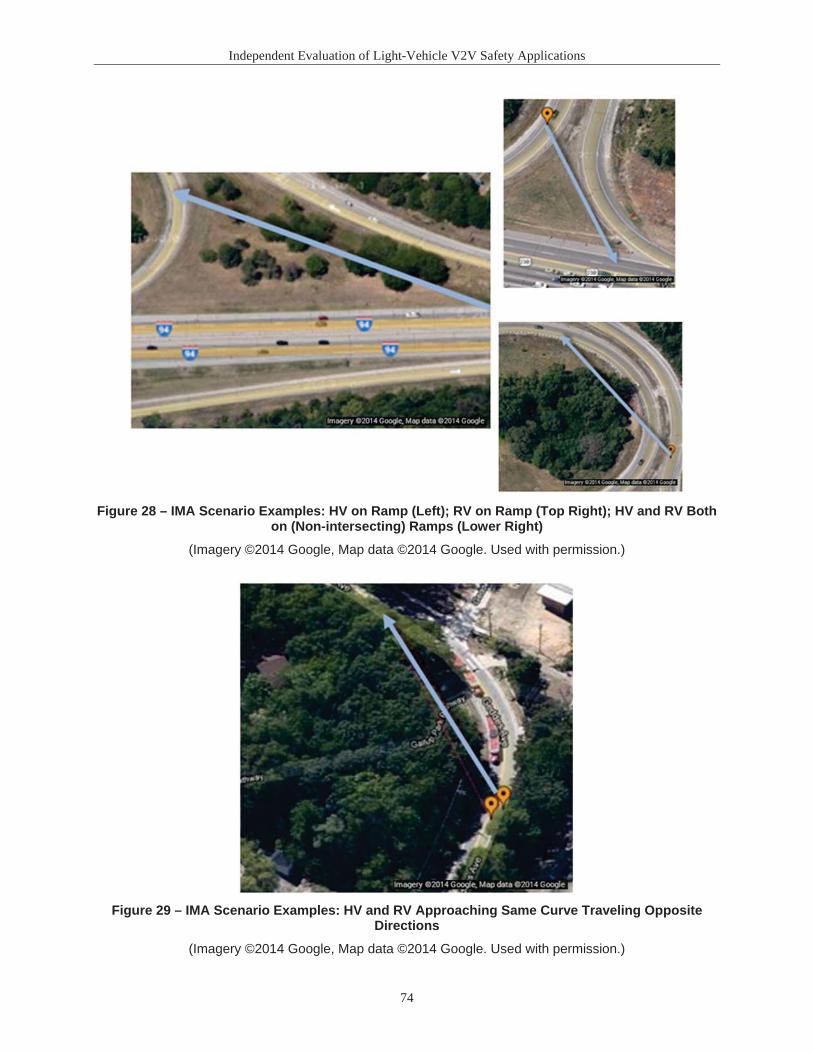
Independent Evaluation of Light-Vehicle V2V Safety Applications
74
Figure 28 – IMA Scenario Examples: HV on Ramp (Left); RV on Ramp (Top Right); HV and RV Both on (Non-intersecting) Ramps (Lower Right)
(Imagery ©2014 Google, Map data ©2014 Google. Used with permission.)
Figure 29 – IMA Scenario Examples: HV and RV Approaching Same Curve Traveling Opposite Directions
(Imagery ©2014 Google, Map data ©2014 Google. Used with permission.)
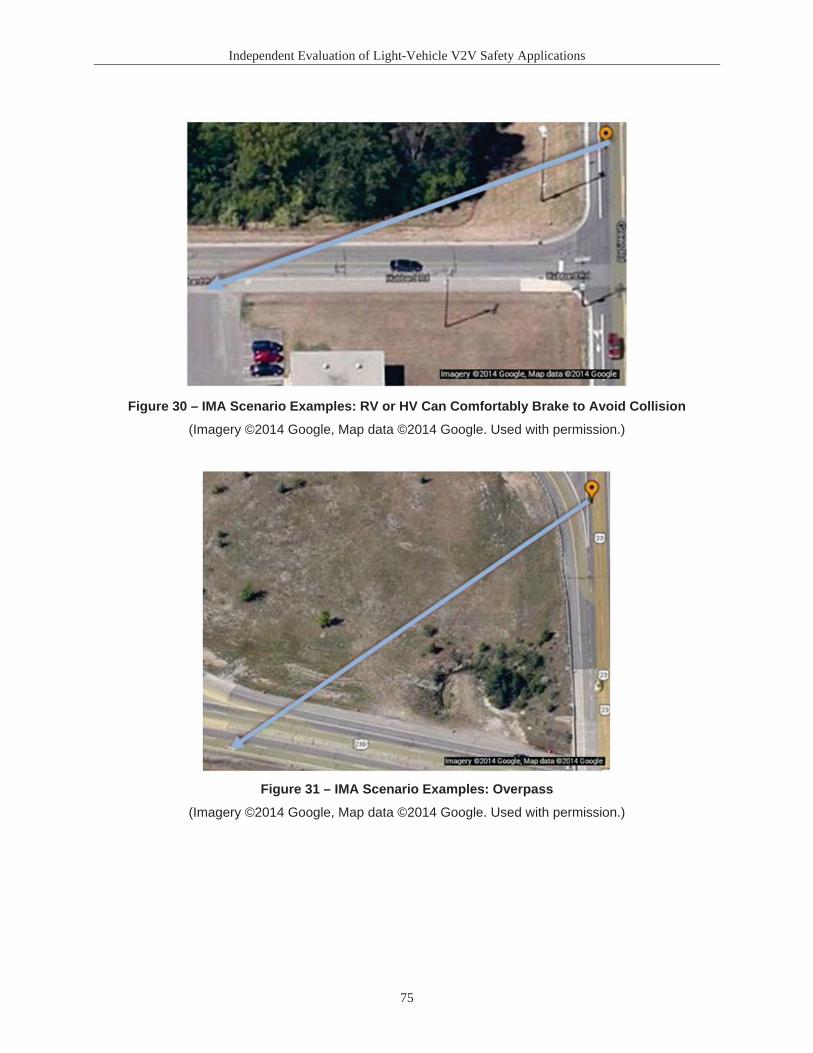
Independent Evaluation of Light-Vehicle V2V Safety Applications
75
Figure 30 – IMA Scenario Examples: RV or HV Can Comfortably Brake to Avoid Collision
(Imagery ©2014 Google, Map data ©2014 Google. Used with permission.)
Figure 31 – IMA Scenario Examples: Overpass
(Imagery ©2014 Google, Map data ©2014 Google. Used with permission.)

Independent Evaluation of Light-Vehicle V2V Safety Applications
76
Figure 32 – IMA Scenario Examples: RV and/or HV Are Traveling at Speeds Such That Collision Can Be Avoided Without Having to Brake
(Imagery ©2014 Google, Map data ©2014 Google. Used with permission.)
Figure 33 – IMA Scenario Examples: HV Stopped While RV Was Turning Right Onto Far Lane
(Imagery ©2014 Google, Map data ©2014 Google. Used with permission.)
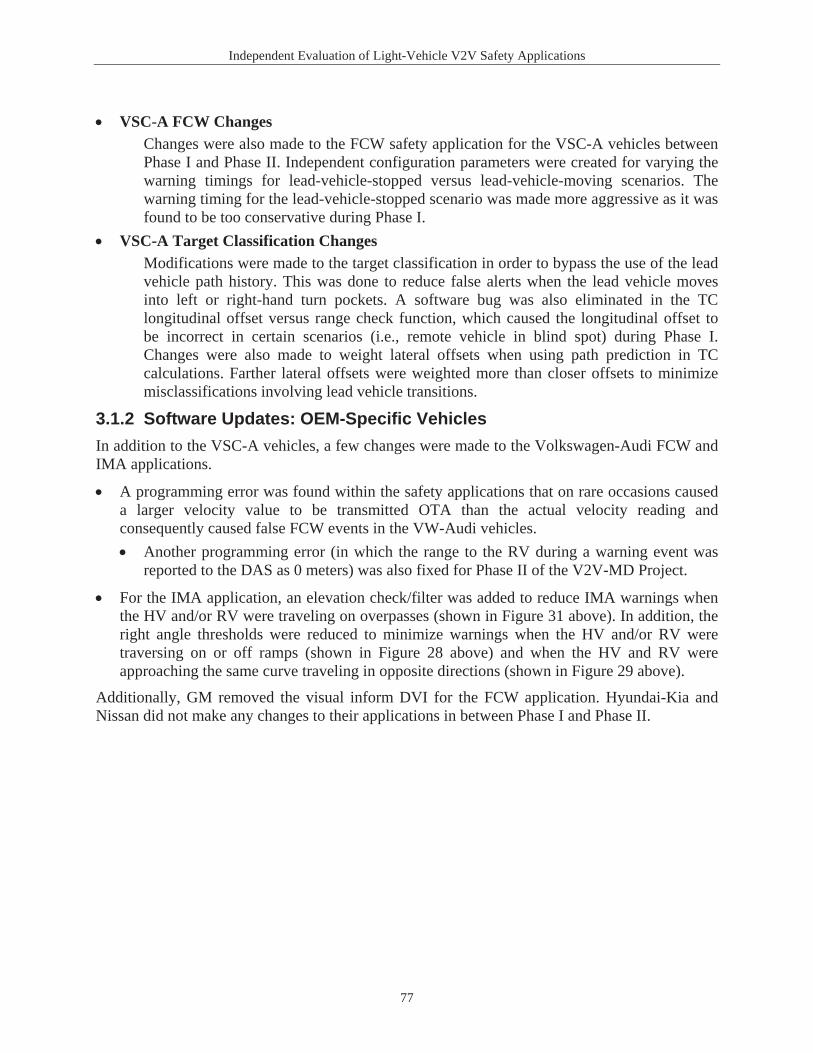
Independent Evaluation of Light-Vehicle V2V Safety Applications
77
VSC-A FCW ChangesChanges were also made to the FCW safety application for the VSC-A vehicles betweenPhase I and Phase II. Independent configuration parameters were created for varying the warning timings for lead-vehicle-stopped versus lead-vehicle-moving scenarios. The warning timing for the lead-vehicle-stopped scenario was made more aggressive as it was found to be too conservative during Phase I.
VSC-A Target Classification ChangesModifications were made to the target classification in order to bypass the use of the lead vehicle path history. This was done to reduce false alerts when the lead vehicle moves into left or right-hand turn pockets. A software bug was also eliminated in the TC longitudinal offset versus range check function, which caused the longitudinal offset to be incorrect in certain scenarios (i.e., remote vehicle in blind spot) during Phase I. Changes were also made to weight lateral offsets when using path prediction in TC calculations. Farther lateral offsets were weighted more than closer offsets to minimize misclassifications involving lead vehicle transitions.
3.1.2 Software Updates: OEM-Specific VehiclesIn addition to the VSC-A vehicles, a few changes were made to the Volkswagen-Audi FCW and IMA applications.
A programming error was found within the safety applications that on rare occasions caused a larger velocity value to be transmitted OTA than the actual velocity reading and consequently caused false FCW events in the VW-Audi vehicles.
Another programming error (in which the range to the RV during a warning event was reported to the DAS as 0 meters) was also fixed for Phase II of the V2V-MD Project.
For the IMA application, an elevation check/filter was added to reduce IMA warnings when the HV and/or RV were traveling on overpasses (shown in Figure 31 above). In addition, the right angle thresholds were reduced to minimize warnings when the HV and/or RV were traversing on or off ramps (shown in Figure 28 above) and when the HV and RV were approaching the same curve traveling in opposite directions (shown in Figure 29 above).
Additionally, GM removed the visual inform DVI for the FCW application. Hyundai-Kia and Nissan did not make any changes to their applications in between Phase I and Phase II.

Independent Evaluation of Light-Vehicle V2V Safety Applications
78
Appendix B: Post-Drive Questionnaire

Independent Evaluation of Light-Vehicle V2V Safety Applications
79
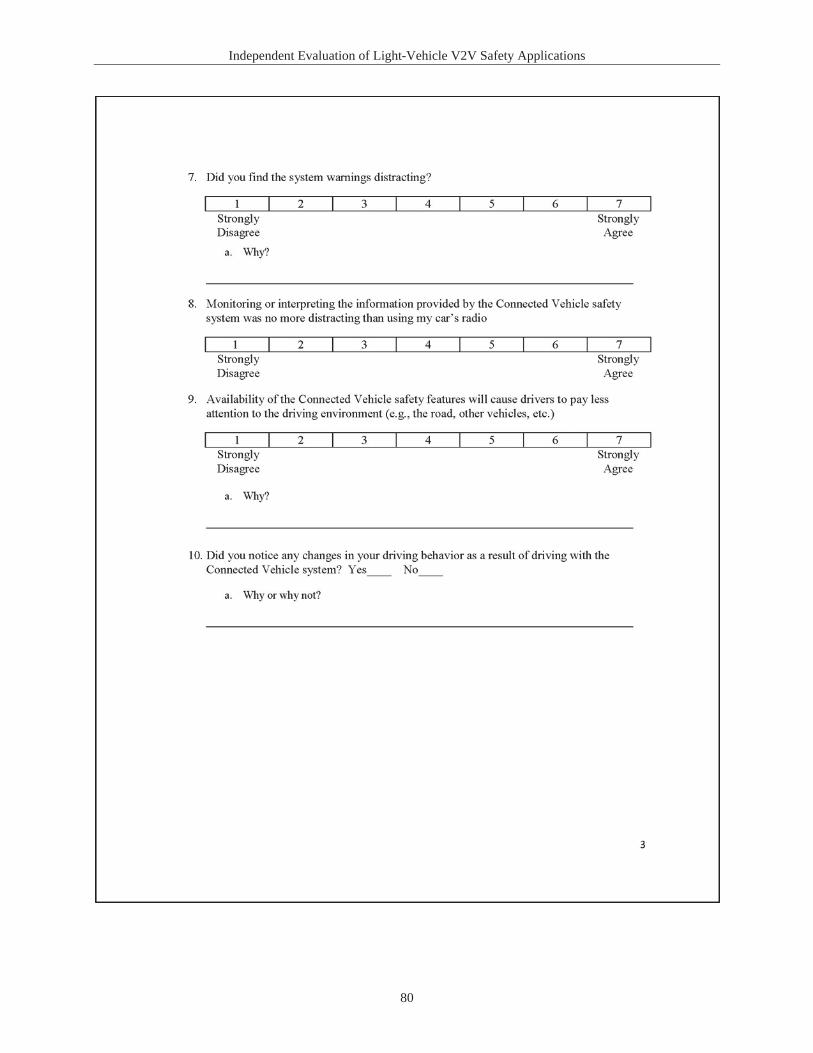
Independent Evaluation of Light-Vehicle V2V Safety Applications
80

Independent Evaluation of Light-Vehicle V2V Safety Applications
81

Independent Evaluation of Light-Vehicle V2V Safety Applications
82

Independent Evaluation of Light-Vehicle V2V Safety Applications
83

Independent Evaluation of Light-Vehicle V2V Safety Applications
84

Independent Evaluation of Light-Vehicle V2V Safety Applications
85
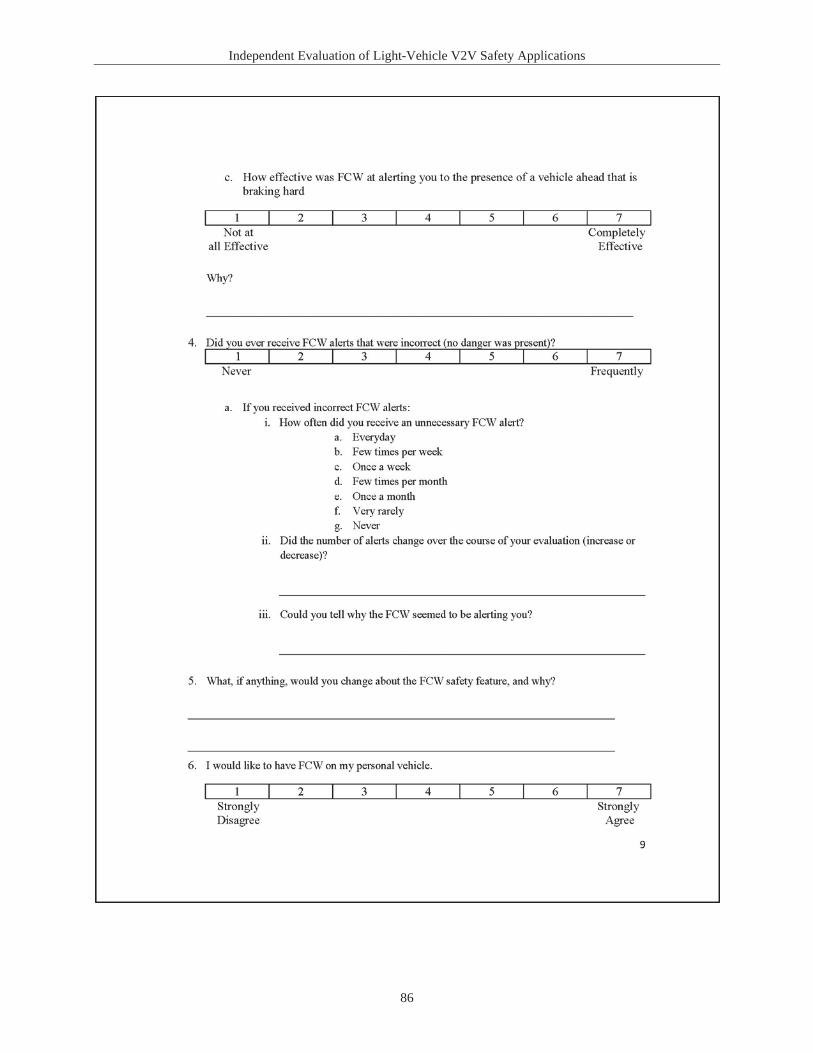
Independent Evaluation of Light-Vehicle V2V Safety Applications
86

Independent Evaluation of Light-Vehicle V2V Safety Applications
87
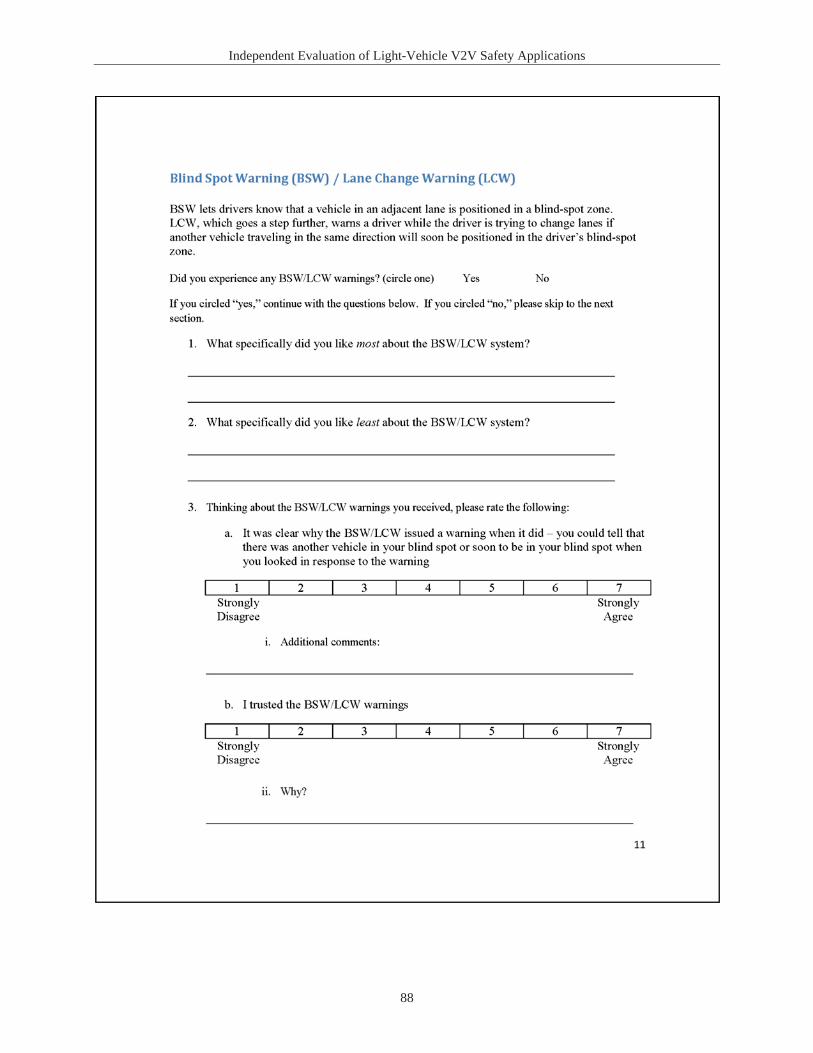
Independent Evaluation of Light-Vehicle V2V Safety Applications
88
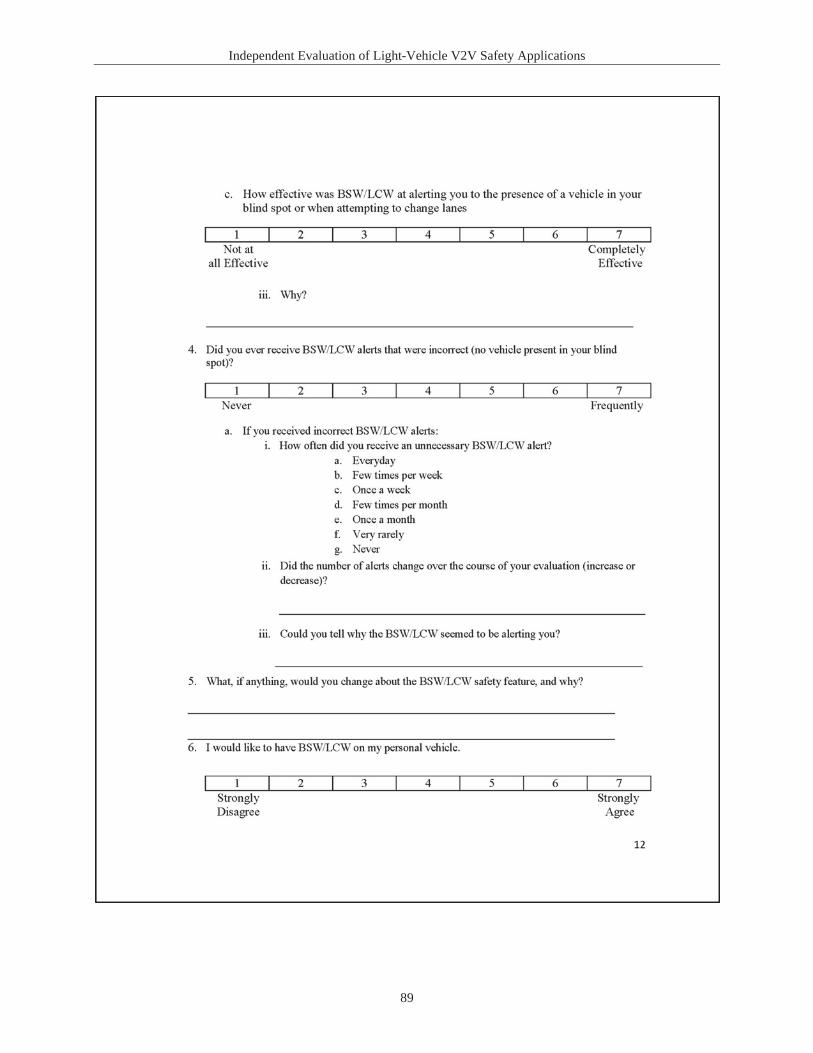
Independent Evaluation of Light-Vehicle V2V Safety Applications
89
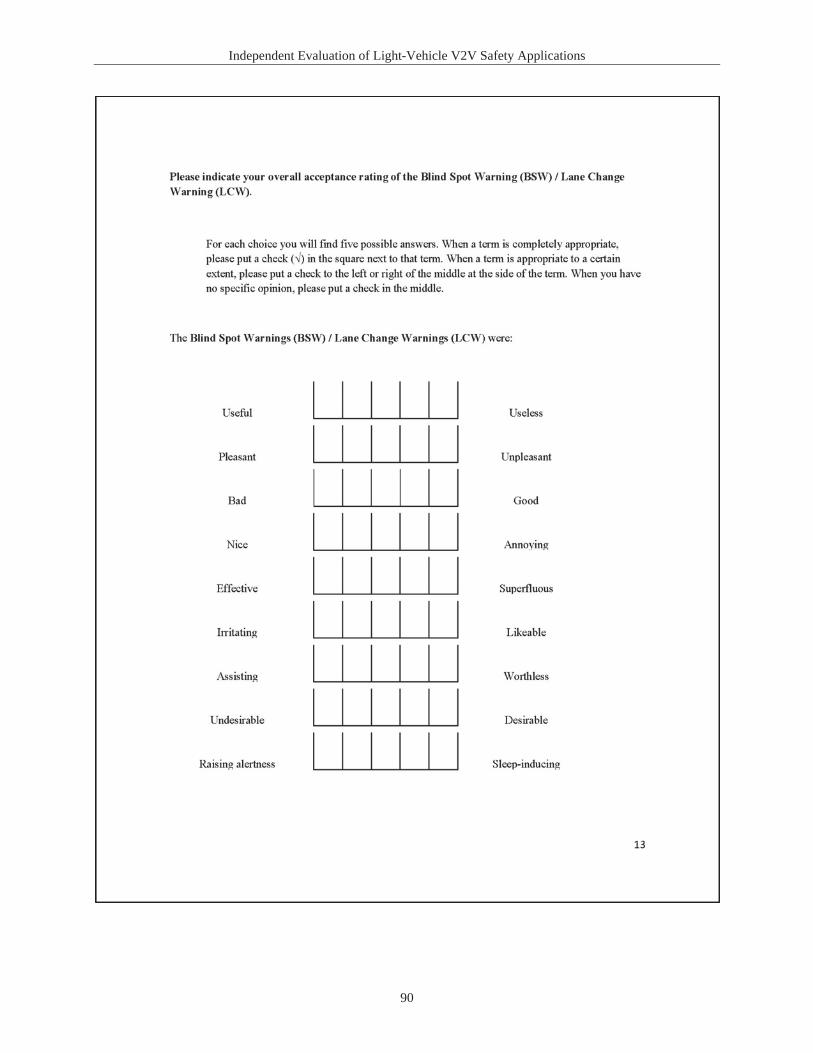
Independent Evaluation of Light-Vehicle V2V Safety Applications
90

Independent Evaluation of Light-Vehicle V2V Safety Applications
91
Independent Evaluation of Light-Vehicle V2V Safety Applications
92

Independent Evaluation of Light-Vehicle V2V Safety Applications
93

Independent Evaluation of Light-Vehicle V2V Safety Applications
94

Independent Evaluation of Light-Vehicle V2V Safety Applications
95

Independent Evaluation of Light-Vehicle V2V Safety Applications
96

Independent Evaluation of Light-Vehicle V2V Safety Applications
97
Independent Evaluation of Light-Vehicle V2V Safety Applications
98

Independent Evaluation of Light-Vehicle V2V Safety Applications
99
Independent Evaluation of Light-Vehicle V2V Safety Applications
100

Independent Evaluation of Light-Vehicle V2V Safety Applications
101
Independent Evaluation of Light-Vehicle V2V Safety Applications
102

Independent Evaluation of Light-Vehicle V2V Safety Applications
103
Appendix C: Video Analysis Coding Scheme
This appendix lists all variables that are coded during the video analysis of safety application alerts. The intent of the video analysis is to capture information that is not available in the numerical database or to validate the numerical data. The captured analysis variables vary by safety application.
Crash Type
Pre-crash scenario: the configuration of vehicles and vehicle dynamics prior to the alert (all alert types).
Driver Attention
Eyes off driving task: was the driver’s attention not focused on the driving task at the time of the event (all alert types).Task responsible for eyes off driving task: the non-driving activity that took the driver’s attention away from the road (all alert types).Eyes off threat: was the driver’s attention not focused on a vehicle that was posing a threat (all alert types).Other secondary tasks: (all alert types).
Host Vehicle
Host vehicle maneuver: the maneuver of the vehicle at the time of the event (all alert types).Host vehicle location: curved road, straight road, intersection, ramp, etc. (all alert types).Steering response to threat: did the driver respond to the scenario with a steering maneuver (all alert types).Host vehicle position within lane: in lane, between lanes, fully in adjacent lane (FCW, LCW).
Environmental
Lighting: day/night (all alert types).Weather: clear/rain/snow (all alert types).
Lead Vehicle Target
Forward target lane location: is the lead vehicle in-path of the target vehicle (FCW, EEBL).Forward target driving maneuver: what is the lead vehicle doing at alert time (FCW, EEBL).Forward target road position: straight road, curved road, etc. (FCW, EEBL).Obstructing vehicle: is a vehicle present between the host and remote vehicles (EEBL).
Side Target
Side target lateral position: adjacent, 2 lanes over, in lane, other (LCW).
Intersection Target
IMA target maneuver: the maneuver/location of the IMA target (IMA).IMA target direction: left/right (IMA).Post encroachment time: the time to point of intersection of the remote vehicle after the host vehicle has passed (IMA where host passes in front of remote).
Independent Evaluation of Light-Vehicle V2V Safety Applications
104
Traffic control device: stop sign, traffic signal, etc. (IMA).View obstructed: was the driver’s view of oncoming traffic obstructed (IMA, left turn across path (LTAP)).
Opposite Direction Target
Opposite direction target location: adjacent lane, two lanes over, other (LTAP, DNPW).Road geometry: did the alert occur on a two-lane, opposite direction road (DNPW).Driver intent to pass: did the driver of the host vehicle intend to pass the lead vehicle (DNPW).Time to collision at warning time: the time to the collision point with the remote vehicle at the warning onset (DNPW).
Independent Evaluation of Light-Vehicle V2V Safety Applications
105
Appendix D: Missed Alert Analysis Detail
FCW
Volpe detected potential missed FCW alerts in the integrated vehicle database using an algorithm that determined the presence of V2V-equipped vehicles during hard braking scenarios that did not trigger FCW alerts. The goal was to find scenarios where the host vehicle braked hard behind a V2V-equipped vehicle but did not receive an alert. Volpe analyzed video data to confirm the presence of the V2V-equipped target then analyzed and compared the range and range rate data with the vehicle dynamics during alert scenarios.
Potential missed FCW alert scenarios fit the following criteria:
V2V-equipped RV within rangeRV heading within 5 degrees of the host vehicle headingRange from V2V data within ±5 m of the range from forward radar data (to target scenarios where the HV is following a lead vehicle that may be the V2V-equipped vehicle within range) Host vehicle (the integrated vehicle of interest, HV) instantaneous deceleration > 0.4g while time to collision (TTC) < 3 sSpeed of primary target detected by radar > 2.5 mph (to filter out roadside objects)Range to lead vehicle is between 8 m and 50 m (zone in which the radar data is least noisy)No FCW or EEBL alerts triggered during the event
When applied to the entire integrated vehicle model deployment dataset, these criteria resulted in nine potential missed FCW events. Volpe compared the vehicle dynamics for these nine events with the vehicle dynamics for valid alert scenarios from the same OEMs with the same pre-crash scenario. In all but one event the participant suppressed the brake pedal before an alert was expected to be issued (based on the timing of observed valid alerts).
IMA Stopped
For IMA events where the HV stopped at the intersection and waited to proceed, potential missed alert events included scenarios where the driver released the brake pedal to proceed into the intersection while an equipped RV was also approaching the intersection from a lateral direction.
Volpe analyzed all integrated vehicle model deployment data within the model deployment area (within or just outside of Ann Arbor), since this is where interactions with other equipped vehicles were most likely to occur. Video data for events fitting these criteria were then analyzed to confirm the presence of the target and its distance away from the intersection when the HV driver released the brake.
Potential missed IMA-stopped scenarios fit the following criteria.
HV enters intersectionHV speed < 4.4 m/s (HV is stopped at intersection prior to entering)RV approaches the same intersection from a lateral direction (heading differential between HV and RV between 80 and 100 degrees)RV speed >11 m/sMinimum range from RV to HV during event is < 20 m
Independent Evaluation of Light-Vehicle V2V Safety Applications
106
RV is not brakingNo IMA alert (inform or warn) during event
IMA Moving
Volpe used two different methods to detect potential missed IMA alerts; one for detecting events when the host vehicle is approaching the intersection, and another for when the host vehicle is stopped at the intersection and then proceeding.
The approach for missed IMA alerts when participants were approaching an intersection looked for scenarios where a participant executed a hard braking maneuver, while an equipped remote vehicle (the target vehicle of interest, i.e., RV) was approaching from a lateral direction. These events mimic events in which an IMA alert is issued because two equipped vehicles are approaching an intersection at speed.
Volpe selected potential missed alerts scenarios from a group of validated intersection scenarios where a target vehicle (either equipped or unequipped) is approaching the intersection at the same time as the host vehicle. Volpe then analyzed video data to confirm that the approaching target was a V2V-equipped vehicle.
Potential missed IMA moving scenarios fit the following criteria.
Maximum host vehicle instantaneous deceleration > 0.4 gV2V-equipped vehicle is approaching intersectionRV approaches the same intersection from a lateral direction (heading differential between HV and RV between 80 and 100 degrees)Equipped RV speed >11 m/s (RV threshold speed for IMA moving alert activation)
Volpe applied these criteria to a dataset of 2,429 validated intersection scenarios across 59 participants. This resulted in 7 events with hard braking approaching an intersection. Video analysis showed there were no scenarios where the equipped RV was in a threat position to the host vehicle (RV arrived at the intersection either substantially before or after the HV).
BSW/LCW
Volpe identified potential missed LCW alerts by looking for non-alerted events when a V2V-equippedvehicle was in close proximity to the host vehicle during a lane change. This analysis used the data extracted for the BSW/LCM control group scenarios (discussed in Appendix H), consisting of 1,219 non-alerted lane change scenarios validated for the presence of a target through video analysis. Volpereviewed data from each potential missed LCM alert to determine if the adjacent vehicle was a V2V-equipped vehicle.
Potential missed LCW scenarios fit the following criteria.
Data is from participants who received a valid LCM alertSpeed within ± 5 percent of the speed at the valid LCM alert onsetTurn signal activatedVehicle is on road with minimum of two same-direction travel lanes Vehicle is not within 100 m before (approaching) intersection (to ignore scenarios where the participant is showing intent to turn at intersection)Vehicle is not on an exit ramp (to ignore scenarios where the participant is showing intent to exit freeway)

Independent Evaluation of Light-Vehicle V2V Safety Applications
107
V2V-equipped RV is within rangeRange to V2V-equipped vehicle is < 20 m at onset of turn signalRV heading is within 5 degrees of HV headingNo LCM event is triggered during the event
The criteria produced seven scenarios to validate using video analysis.
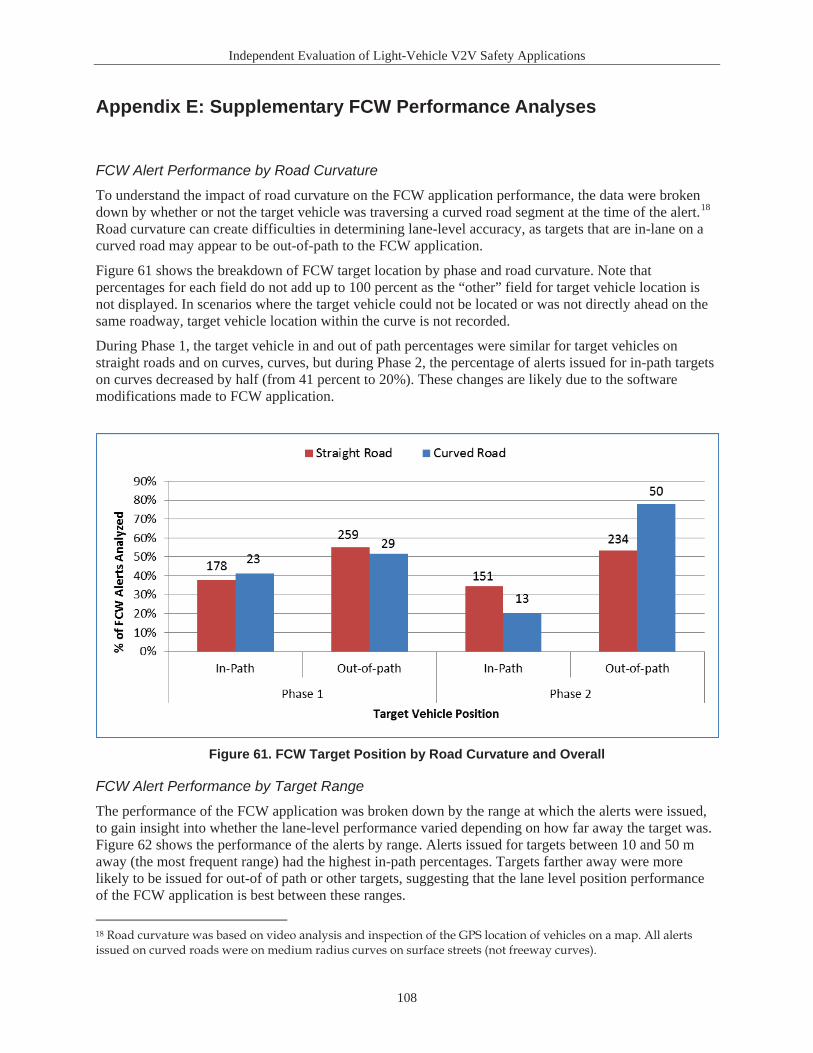
Independent Evaluation of Light-Vehicle V2V Safety Applications
108
Appendix E: Supplementary FCW Performance Analyses
FCW Alert Performance by Road Curvature
To understand the impact of road curvature on the FCW application performance, the data were broken down by whether or not the target vehicle was traversing a curved road segment at the time of the alert.18
Road curvature can create difficulties in determining lane-level accuracy, as targets that are in-lane on a curved road may appear to be out-of-path to the FCW application.
Figure 61 shows the breakdown of FCW target location by phase and road curvature. Note that percentages for each field do not add up to 100 percent as the “other” field for target vehicle location is not displayed. In scenarios where the target vehicle could not be located or was not directly ahead on the same roadway, target vehicle location within the curve is not recorded.
During Phase 1, the target vehicle in and out of path percentages were similar for target vehicles on straight roads and on curves, curves, but during Phase 2, the percentage of alerts issued for in-path targets on curves decreased by half (from 41 percent to 20%). These changes are likely due to the software modifications made to FCW application.
Figure 61. FCW Target Position by Road Curvature and Overall
FCW Alert Performance by Target Range
The performance of the FCW application was broken down by the range at which the alerts were issued, to gain insight into whether the lane-level performance varied depending on how far away the target was. Figure 62 shows the performance of the alerts by range. Alerts issued for targets between 10 and 50 m away (the most frequent range) had the highest in-path percentages. Targets farther away were more likely to be issued for out-of of path or other targets, suggesting that the lane level position performance of the FCW application is best between these ranges.
18 Road curvature was based on video analysis and inspection of the GPS location of vehicles on a map. All alerts issued on curved roads were on medium radius curves on surface streets (not freeway curves).
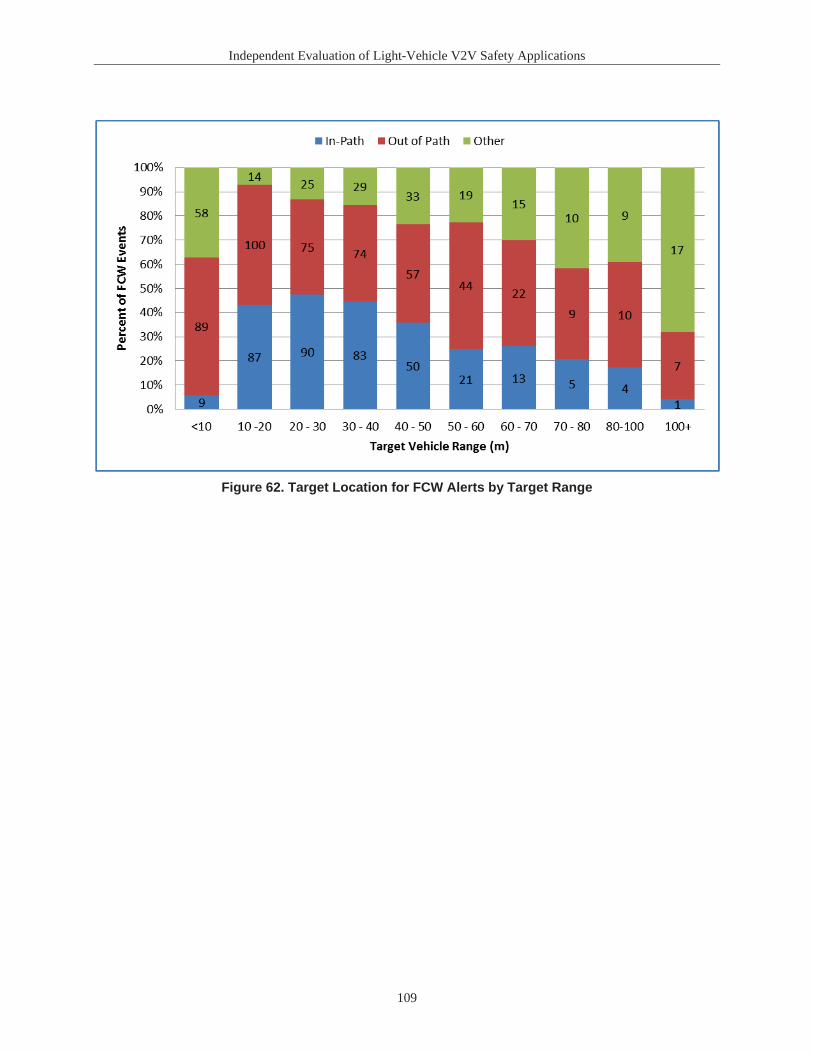
Independent Evaluation of Light-Vehicle V2V Safety Applications
109
Figure 62. Target Location for FCW Alerts by Target Range
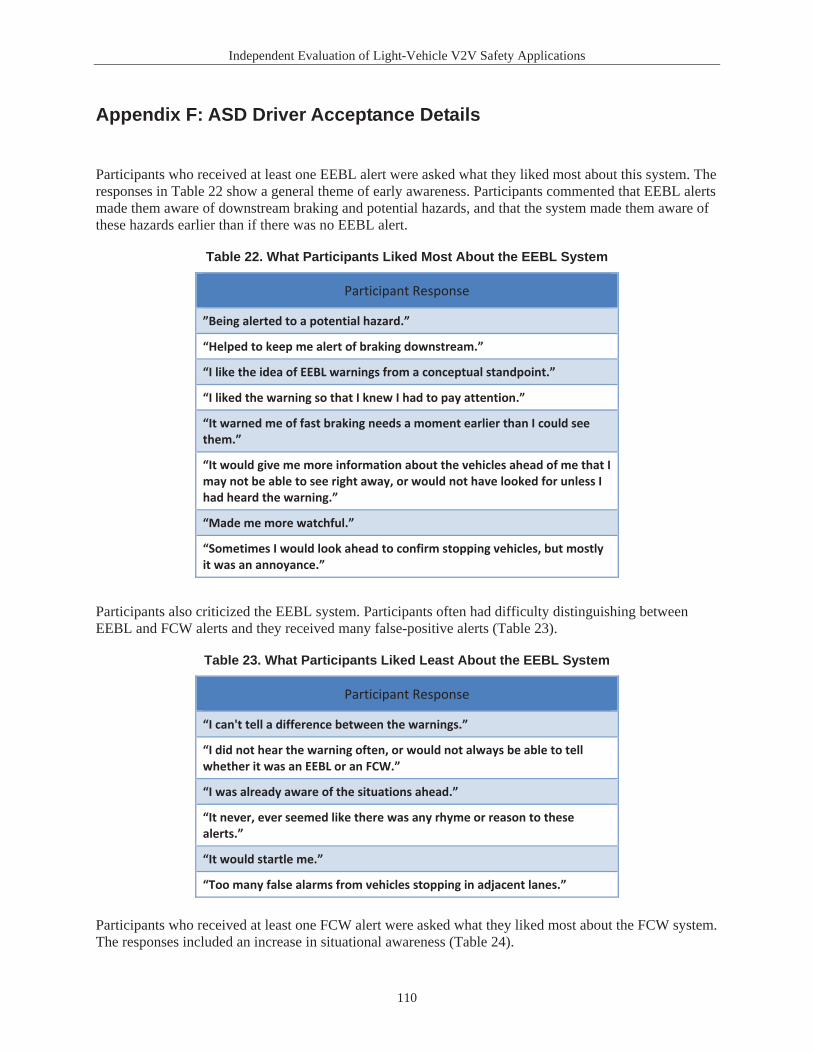
Independent Evaluation of Light-Vehicle V2V Safety Applications
110
Appendix F: ASD Driver Acceptance Details
Participants who received at least one EEBL alert were asked what they liked most about this system. The responses in Table 22 show a general theme of early awareness. Participants commented that EEBL alerts made them aware of downstream braking and potential hazards, and that the system made them aware of these hazards earlier than if there was no EEBL alert.
Table 22. What Participants Liked Most About the EEBL System
Participant Response
”Being alerted to a potential hazard.”
“Helped to keep me alert of braking downstream.”
“I like the idea of EEBL warnings from a conceptual standpoint.”
“I liked the warning so that I knew I had to pay attention.”
“It warned me of fast braking needs a moment earlier than I could see them.”
“It would give me more information about the vehicles ahead of me that I may not be able to see right away, or would not have looked for unless I had heard the warning.”
“Made me more watchful.”
“Sometimes I would look ahead to confirm stopping vehicles, but mostly it was an annoyance.”
Participants also criticized the EEBL system. Participants often had difficulty distinguishing betweenEEBL and FCW alerts and they received many false-positive alerts (Table 23).
Table 23. What Participants Liked Least About the EEBL System
Participant Response
“I can't tell a difference between the warnings.”
“I did not hear the warning often, or would not always be able to tell whether it was an EEBL or an FCW.”
“I was already aware of the situations ahead.”
“It never, ever seemed like there was any rhyme or reason to these alerts.”
“It would startle me.”
“Too many false alarms from vehicles stopping in adjacent lanes.”
Participants who received at least one FCW alert were asked what they liked most about the FCW system. The responses included an increase in situational awareness (Table 24).
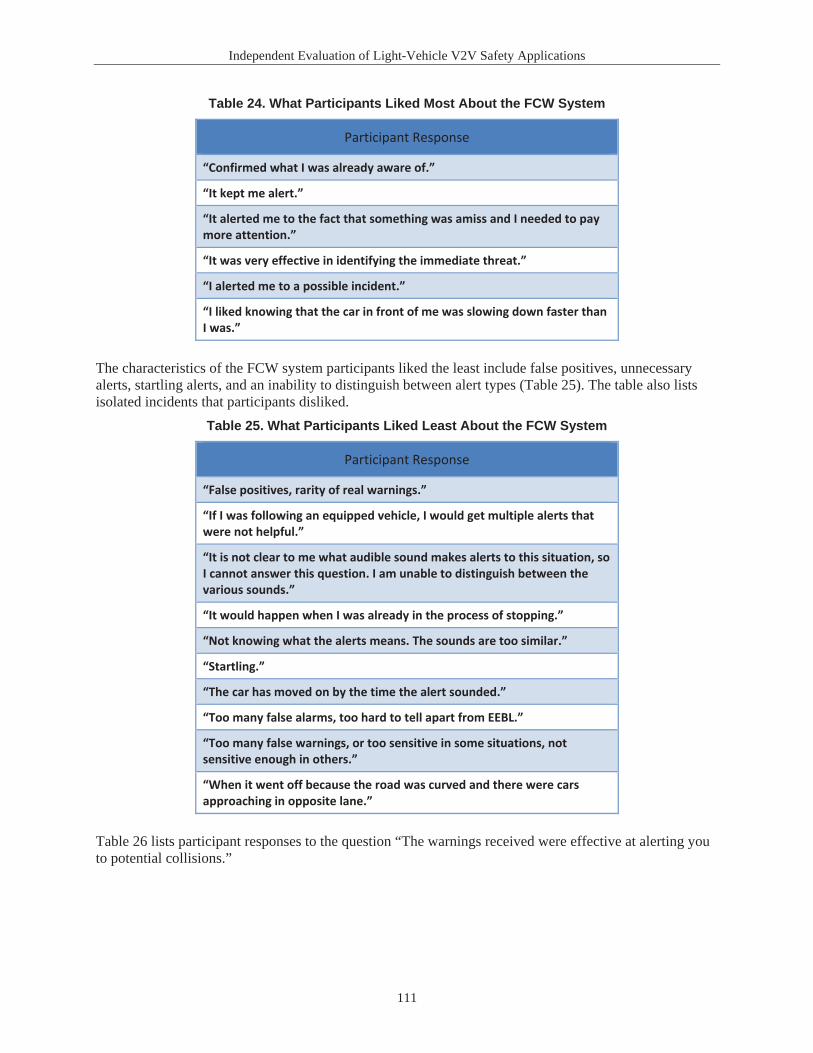
Independent Evaluation of Light-Vehicle V2V Safety Applications
111
Table 24. What Participants Liked Most About the FCW System
Participant Response
“Confirmed what I was already aware of.”
“It kept me alert.”
“It alerted me to the fact that something was amiss and I needed to pay more attention.”
“It was very effective in identifying the immediate threat.”
“I alerted me to a possible incident.”
“I liked knowing that the car in front of me was slowing down faster than I was.”
The characteristics of the FCW system participants liked the least include false positives, unnecessary alerts, startling alerts, and an inability to distinguish between alert types (Table 25). The table also lists isolated incidents that participants disliked.
Table 25. What Participants Liked Least About the FCW System
Participant Response
“False positives, rarity of real warnings.”
“If I was following an equipped vehicle, I would get multiple alerts that were not helpful.”
“It is not clear to me what audible sound makes alerts to this situation, so I cannot answer this question. I am unable to distinguish between the various sounds.”
“It would happen when I was already in the process of stopping.”
“Not knowing what the alerts means. The sounds are too similar.”
“Startling.”
“The car has moved on by the time the alert sounded.”
“Too many false alarms, too hard to tell apart from EEBL.”
“Too many false warnings, or too sensitive in some situations, not sensitive enough in others.”
“When it went off because the road was curved and there were cars approaching in opposite lane.”
Table 26 lists participant responses to the question “The warnings received were effective at alerting you to potential collisions.”

Independent Evaluation of Light-Vehicle V2V Safety Applications
112
Table 26. Participant Responses on Warning Effectiveness
Favorable? Participant Response
No “I never knew what warning I was receiving only that I should be alert.”
No “The warnings are meaningless. Most of the time no even plausible collision is apparent.”
No “Too many false alarms - set off by a vehicle slowing in an adjacent lane, for example.”
Yes “Again, they often made me aware of what was ahead of me. The warnings did not save me from any collisions, but definitely made me aware.”
Yes
“I didn't receive very many warnings. Hence, each one reminded me to pay extra attention. However, if the frequency of warnings increased (such as if double the vehicles around me could provide warnings), then there is a real chance that I would want the warnings disabled/eliminated. One warning (FCW) did get me focused again and allowed for hard braking rather than Slam Braking. So, at least one warning was very beneficial.”
Yes “It is always a good idea to get such warnings. As I grow older, I feel I am a more cautious driver, and this helps me to stay aware of anything that I may have missed.”
Yes “The warning itself engages your attention even if I felt it was often for no reason it would always gain your attention.”
Table 27 lists open-ended participant comments to the question “Monitoring or interpreting the ASD information was no more distracting than using my car radio.”
Table 27. Participant Responses on Alerts Being Distracting
Found Alerts Distracting?
Participant Response
Neutral “At first.”
No
“Not distracting because they were rare. Each warning would remind me to increase focus. If I could find no threat, then I might be slightly annoyed, but not distracted. If I received a warning much more often and without clearly understood causes, then I would not like the warnings.”
No “The alerts were helpful and at reasonable volume not distracting.”
No “The warnings were never distracting. Again, the warnings would provide some additional information, or make me more aware of my surroundings.”
Yes “Beeping for no apparent reason is distracting.”
Yes “Having alerts for no apparent reason is very distracting,”
Yes “It sometimes startled me. Also caused me to check other vehicle systems or my smart phone for the source of the alarms until I became familiar with the alarm sound.”
Yes “Too many false and unnecessary alerts, too few useful ones.”
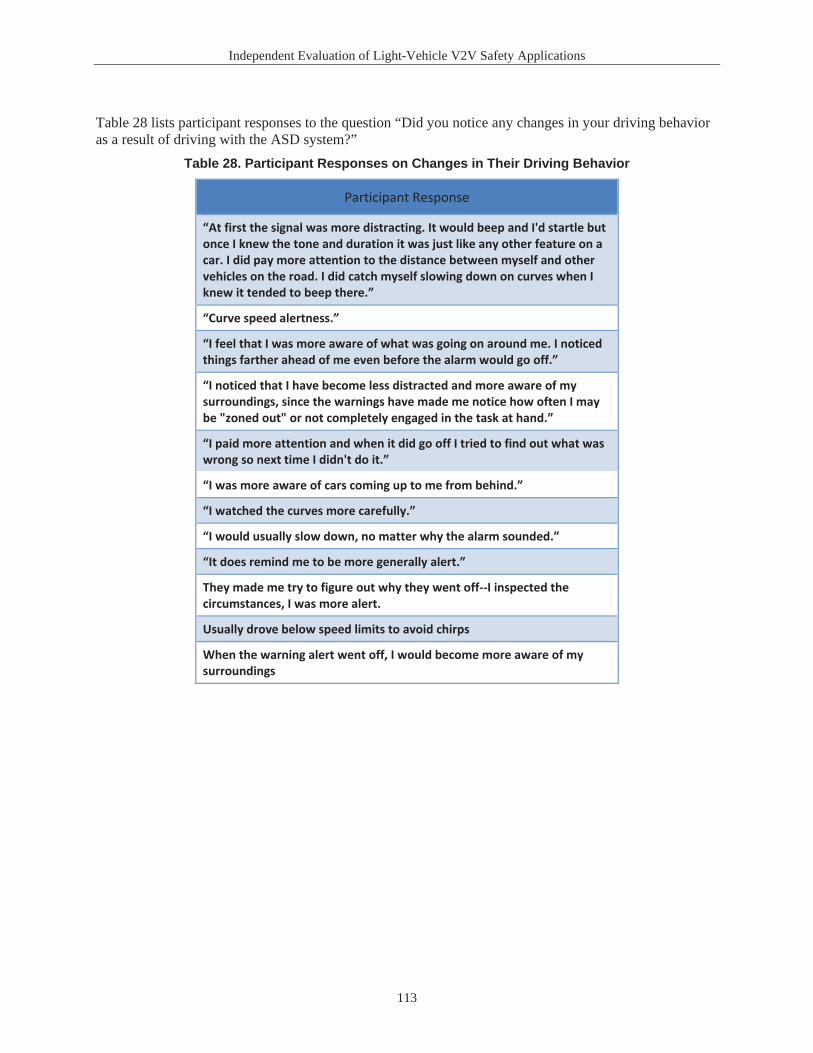
Independent Evaluation of Light-Vehicle V2V Safety Applications
113
Table 28 lists participant responses to the question “Did you notice any changes in your driving behavior as a result of driving with the ASD system?”
Table 28. Participant Responses on Changes in Their Driving Behavior
Participant Response
“At first the signal was more distracting. It would beep and I'd startle but once I knew the tone and duration it was just like any other feature on a car. I did pay more attention to the distance between myself and other vehicles on the road. I did catch myself slowing down on curves when I knew it tended to beep there.”
“Curve speed alertness.”
“I feel that I was more aware of what was going on around me. I noticed things farther ahead of me even before the alarm would go off.”
“I noticed that I have become less distracted and more aware of my surroundings, since the warnings have made me notice how often I may be "zoned out" or not completely engaged in the task at hand.”
“I paid more attention and when it did go off I tried to find out what was wrong so next time I didn't do it.”
“I was more aware of cars coming up to me from behind.”
“I watched the curves more carefully.”
“I would usually slow down, no matter why the alarm sounded.”
“It does remind me to be more generally alert.”
They made me try to figure out why they went off--I inspected the circumstances, I was more alert.
Usually drove below speed limits to avoid chirps
When the warning alert went off, I would become more aware of my surroundings
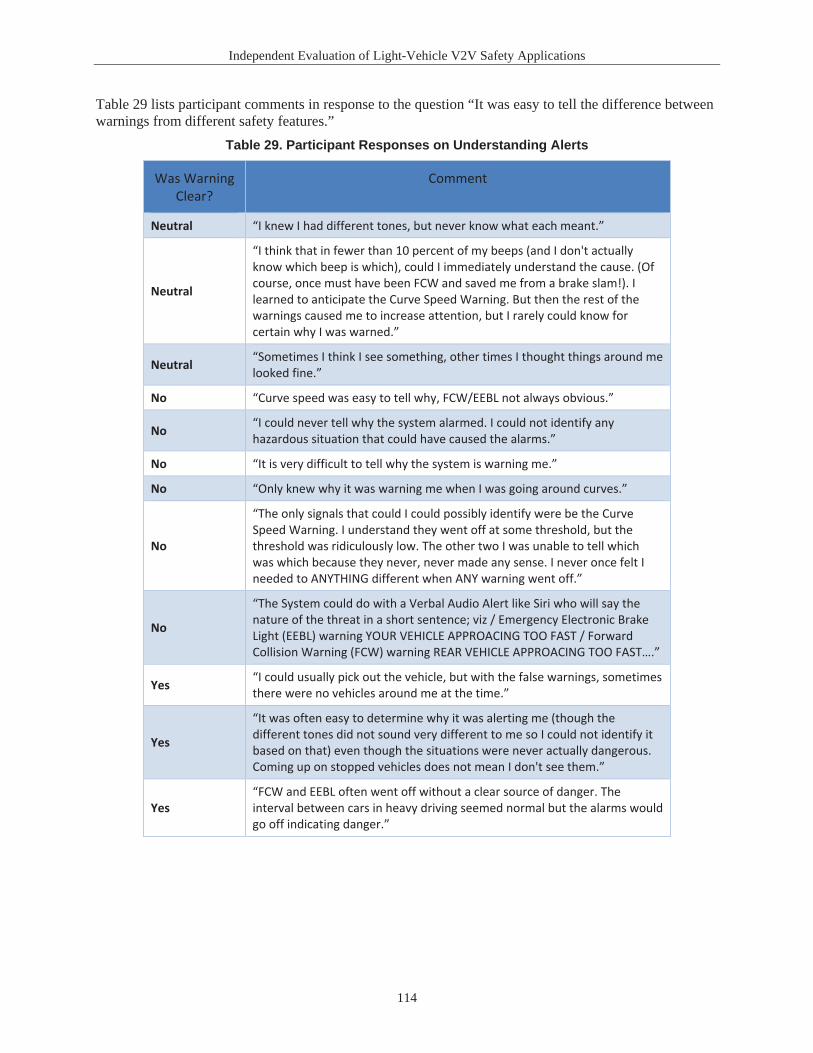
Independent Evaluation of Light-Vehicle V2V Safety Applications
114
Table 29 lists participant comments in response to the question “It was easy to tell the difference between warnings from different safety features.”
Table 29. Participant Responses on Understanding Alerts
Was Warning Clear?
Comment
Neutral “I knew I had different tones, but never know what each meant.”
Neutral
“I think that in fewer than 10 percent of my beeps (and I don't actually know which beep is which), could I immediately understand the cause. (Of course, once must have been FCW and saved me from a brake slam!). I learned to anticipate the Curve Speed Warning. But then the rest of the warnings caused me to increase attention, but I rarely could know for certain why I was warned.”
Neutral “Sometimes I think I see something, other times I thought things around me looked fine.”
No “Curve speed was easy to tell why, FCW/EEBL not always obvious.”
No “I could never tell why the system alarmed. I could not identify any hazardous situation that could have caused the alarms.”
No “It is very difficult to tell why the system is warning me.”
No “Only knew why it was warning me when I was going around curves.”
No
“The only signals that could I could possibly identify were be the Curve Speed Warning. I understand they went off at some threshold, but the threshold was ridiculously low. The other two I was unable to tell which was which because they never, never made any sense. I never once felt I needed to ANYTHING different when ANY warning went off.”
No
“The System could do with a Verbal Audio Alert like Siri who will say the nature of the threat in a short sentence; viz / Emergency Electronic Brake Light (EEBL) warning YOUR VEHICLE APPROACING TOO FAST / Forward Collision Warning (FCW) warning REAR VEHICLE APPROACING TOO FAST….”
Yes “I could usually pick out the vehicle, but with the false warnings, sometimes there were no vehicles around me at the time.”
Yes
“It was often easy to determine why it was alerting me (though the different tones did not sound very different to me so I could not identify it based on that) even though the situations were never actually dangerous. Coming up on stopped vehicles does not mean I don't see them.”
Yes “FCW and EEBL often went off without a clear source of danger. The interval between cars in heavy driving seemed normal but the alarms would go off indicating danger.”

DOT HS 812 222 December 2015
11848-122215-v3