Independent Equity Research - National Stock Exchange of ... · GKB Ophthalmics Limited Independent...
24
GKB Ophthalmics Limited Independent Equity Research Enhancing investment decisions In-depth analysis of the fundamentals and valuation Business Prospects Financial Performance Corporate Governance Management Evaluation
Transcript of Independent Equity Research - National Stock Exchange of ... · GKB Ophthalmics Limited Independent...

GKB Ophthalmics Limited
Independent Equity Research Enhancing investment decisions
In-depth analysis of the fundamentals and valuation
Business ProspectsFinancial Performance
Corporate Governance
Management Evaluation

CRISIL Independent Equity Research Team Mukesh Agarwal [email protected] +91 (22) 3342 3035 Director Tarun Bhatia [email protected] +91 (22) 3342 3226 Director- Capital Markets Analytical Contacts Chetan Majithia [email protected] +91 (22) 3342 4148 Sudhir Nair [email protected] +91 (22) 3342 3526 Suresh Guruprasad [email protected] +91 (22) 3342 3531 Sagar Parikh [email protected] +91 (22) 3342 3502 Vishal Rampuria [email protected] +91 (22) 3342 3525 Nihag Shah [email protected] +91 (22) 3342 3533 Bhaskar Bukrediwala [email protected] +91 (22) 3342 1983 Ravi Dodhia [email protected] +91 (22) 3342 3508 Urmil Shah [email protected] +91 (22) 3342 8135 Neeta Khilnani [email protected] +91 (22) 3342 1882 Niyati Dave [email protected] +91 (22) 3342 3569 Suhel Kapur [email protected] +91 (22) 3342 4149 Amit Murarka [email protected] +91 (22) 3342 3578 Aishvarya Dadheech [email protected] +91 (22) 3342 1994 Amit Kawle [email protected] +91 (22) 3342 1972 Charulata Gaidhani [email protected] +91 (22) 3342 3587 Sector Contacts Nagarajan Narasimhan [email protected] +91 (22) 3342 3536 Ajay D'Souza [email protected] +91 (22) 3342 3567 Manoj Mohta [email protected] +91 (22) 3342 3554 Sachin Mathur [email protected] +91 (22) 3342 3541 Sridhar C [email protected] +91 (22) 3342 3546 Business Development Contacts Vinaya Dongre [email protected] +91 99 202 25174 Sagar Sawarkar [email protected] +91 98 216 38322 Sejal Kothari [email protected] +91 99 206 25746 Salil Srivastava [email protected] +91 98 339 96430 Supriya Tapase [email protected] +91 98 207 45668 Vipin Saboo [email protected] +91 98 207 79873
CRISIL’s Equity Offerings The Equity Group at CRISIL Research provides a wide range of services including: Independent Equity Research IPO Grading White Labelled Research Valuation on companies for use of Institutional Investors, Asset Managers, Corporates
Other Services by the Research group include CRISINFAC Industry research on over 60 industries and Economic Analysis Customised Research on Market sizing, Demand modelling and Entry strategies Customised research content for Information Memorandum and Offer documents

Explanation of CRISIL Fundamental and Valuation (CFV) matrix The CFV Matrix (CRISIL Fundamental and Valuation Matrix) addresses the two important analysis of an investment making process – Analysis of Fundamentals (addressed through Fundamental Grade) and Analysis of Returns (Valuation Grade)
Fundamental Grade CRISIL’s Fundamental Grade represents an overall assessment of the fundamentals of the company graded in relation to other listed equity securities in India. The grade facilitates easy comparison of fundamentals between companies, irrespective of the size or the industry they operate in. The grading factors in the following:
Business Prospects: Business prospects factors in Industry prospects and company’s future financial performance Management Evaluation: Factors such as track record of the management, strategy are taken into consideration Corporate Governance: Assessment of adequacy of corporate governance structure and disclosure norms
The grade is assigned on a five-point scale from grade 5 (indicating Excellent fundamentals) to grade 1 (Poor fundamentals)
CRISIL Fundamental Grade Assessment 5/5 Excellent fundamentals 4/5 Superior fundamentals 3/5 Good fundamentals 2/5 Moderate fundamentals 1/5 Poor fundamentals
Valuation Grade CRISIL’s Valuation Grade represents an assessment of the potential value in the company stock for an equity investor over a 12 month period. The grade is assigned on a five-point scale from grade 5 (indicating strong upside from the current market price (CMP)) to grade 1 (strong downside from the CMP).
CRISIL Valuation Grade Assessment 5/5 Strong upside (>25% from CMP) 4/5 Upside (10-25% from CMP) 3/5 Align (+-10% from CMP) 2/5 Downside (negative 10-25% from CMP) 1/5 Strong downside (<-25% from CMP) Analyst Disclosure Each member of the team involved in the preparation of the grading report, hereby affirms that there exists no conflict of interest that can bias the grading recommendation of the company. Additional Disclosure This report has been sponsored by NSE - Investor Protection Fund Trust (NSEIPFT). Disclaimer: This Exchange-commissioned Report (Report) is based on data publicly available or from sources considered reliable. CRISIL Ltd. (CRISIL) does not represent that it is accurate or complete and hence, it should not be relied upon as such. The data / Report are subject to change without any prior notice. Opinions expressed herein are our current opinions as on the date of this Report. Nothing in this Report constitutes investment, legal, accounting or tax advice or any solicitation, whatsoever. The subscriber / user assumes the entire risk of any use made of this data / Report. CRISIL especially states that it has no financial liability, whatsoever, to the subscribers / users of this Report. This Report is for the personal information only of the authorized recipient in India only. This Report should not be reproduced or redistributed or communicated directly or indirectly in any form to any other person – especially outside India or published or copied in whole or in part, for any purpose.

List of companies under coverage
Initiating Coverage 3QFY10 Update Sl.
No. Report Date
Company Name Sector CMP M. Cap (Rs. Mn)
Fundamental value
Fundamental grade
Fundamental value
Fundamental grade
1 02-Feb-10 Aarti Industries Chemicals 49 3,757 56 3/5 56 3/5
2 31-Jan-10 ABG Shipyard Shipping 315 10,286 242 3/5 259 3/5
3 01-Feb-10 Apollo hospitals Hospitals 712 44,102 642 4/5 724 4/5
4 04-May-10 Beardsell Limited Packaging/Expanded Polystyrene 64 245 54 3/5 - -
5 06-Apr-10 Dhanuka Agritech Ltd Pesticides 271 2,483 283 3/5 - -
6 29-Jan-10 DLF Real Estate 335 568,495 356 3/5 356 3/5
7 27-Jan-10 Dolphin Offshore Oil & Gas 385 6,060 315 3/5 417 3/5
8 05-Feb-10 EID Parry Sugar 348 30,050 394 4/5 395 4/5
9 01-Feb-10 Everest Kanto Manufacturing 131 13,252 270 4/5 135 4/5
10 11-May-10 GKB Ophthalmics Ltd Ophthalmic Lens 48 199 52 2/5 - -
11 23-Feb-10 Havells India Ltd Capital Goods 533 32,070 614 4/5 - -
12 29-Jan-10 Hero Honda Automobiles 1,889 377,240 1,747 5/5 1937# 5/5#13 02-Mar-10 Hindusthan National
Glass & Industries Ltd. Packaging/Glass 240 21,049 314 4/5 - -
14 11-Feb-10 Indiabulls Securities Financial Services 31 7,932 60 4/5 48 4/5
15 05-Feb-10 JBF Industries Textiles 111 6,882 119 3/5 129 3/5
16 05-Feb-10 JM Financial Financial Services 39 30,550 57 4/5 57 4/517 21-Jan-10 KKCL Fashion and
apparels 265 3,292 336 3/5 - -
18 01-Feb-10 KRBL Agriculture/Rice 194 4,716 340 3/5 340 3/5
19 31-Jan-10 NTPC Power 214 1,764,537 228 5/5 231 5/5
20 29-Jan-10 Pantaloon Retail (India) Retail 406 77,282 * 4/5 * 4/521 04-Feb-10 Phoenix Mills Real Estate 203 29,404 160 2/5 183 2/522 22-Apr-10 Polaris Software Information
Technology 186 18,407 247 4/5 - -
23 19-Apr-10 Sangam (India) Ltd Textiles 33 1,380 46 3/5 46 5/524 03-Feb-10 UTV Software Media and
Entertainment 498 17,066 548 3/5 538 3/5
25 07-May-10 Zylog System Information Technology
456 7,494 530 3/5 - -
CMP - Current Market Price (as on date of respective report)
M Cap - Market Capitalisation (as on date of respective report)
*NA - Not Applicable (Company has requested for a fundamental grading only)
# Includes Q4FY10 result update

1
Independent Research Report – GKB Ophthalmics Ltd Correcting vision through plastic Industry: Ophthalmic Lens
Date: May 11, 2010
GKB Ophthalmics Ltd (GKB) is one of the established players in the ophthalmic lens industry in India. It manufactures glass and plastic lenses. We assign GKB a fundamental grade of ‘2/5’ indicating that its fundamentals are ‘moderate’ relative to other listed securities in India. We also assign a valuation grade of ‘3/5’ indicating that the current market price of GKB is ‘aligned’. Established player in the Indian ophthalmic lens industry GKB manufactures basic single vision glass lens and has an installed capacity of 12,000 glass lenses per day. Besides the basic single vision glass lenses, it also manufactures value-added glass lenses – bifocal, progressive and photo chromic – through its associate company GKB Vision, where it holds a 38% stake. The company mainly exports (90%) since the Indian market is dominated by unorganised players which supply low quality, low priced lenses to the price-sensitive Indian market. Foray into plastic lens - better late than never GKB forayed into the manufacturing of plastic lenses in 2009. It currently has a capacity of 4,000 lenses per day which it plans to expand to 10,000 lenses per day by FY12. We expect the company to grow strongly in this segment, driven by a) increased outsourcing of plastic lenses from India and China due to closure of several unviable manufacturing units in Europe and b) low competition from Chinese players as they manufacture mainly the basic variety of plastic lenses. Constraints - competitive industry, lack of unique value offerings Although the opthalmics industry globally is expected to grow at a steady rate of 3-4% (driven by growing population and replacement demand), the industry is competitive with many ophthalmic lens suppliers operating globally. The company has a capacity of 4.5 mn lenses (per annum) in a market of 1 bn lenses globally and, hence, does not have any advantage in terms of size or volume of operations, which can lead to client dependence. Also, the company has no unique value proposition compared to other players in the industry. Weak corporate governance structure GKB does not comply with Clause 49 of the listing agreement as there is only one independent director on the board. [0]Also, interaction with the independent director revealed that his level of engagement in the company’s affairs is below the required level. Revenues to grow to Rs 432 mn[0] by FY12 at a three-year CAGR of 15% We expect GKB Ophthalmics’ revenues to register a three-year CAGR of 15% to reach Rs 432 mn in FY12 driven by growth in plastic lenses which is expected to register a significant jump from ~Rs 19 mn in FY09 to ~Rs 166 mn in FY12E. EBITDA margin is expected to reduce to 9.5% in FY10, driven by higher rejection rates in plastic lenses, and then increase to 12.2% in FY11 and 13.7% in FY12, as the production of plastic lenses stabilises and rejection rates reduce. EPS is expected to decline from Rs 8.8 in FY09 to Rs 8.2 in FY12E due to decreasing profitability of its associate GKB Vision on account of higher tax impact from FY12. Valuations aligned; No upside from these levels We have valued GKB based on the sum of the parts (SOTP) approach. We have used the discounted cash flow method to value both GKB (standalone) and GKB’s 38% stake in GKB Vision. We have taken a higher cost of equity of 18.4% factoring in the liquidity risk due to low volumes of stock traded. Based on SOTP, we arrive at a fair value of Rs 52 per share for GKB. We initiate coverage on GKB with a valuation grade of ‘3/5’ indicating that the valuations of GKB are ‘aligned’ to the current market price of Rs 48 (as on May 10, 2010).
Key forecast (Consolidated financials) (Rs mn) FY08 FY09 FY10E FY11E FY12EOperating income 189 285 378 397 432
EBITDA 30 36 36 49 59
Adj net income* 24 36 35 36 34
EPS-Rs* 5.7 8.8 8.5 8.6 8.2
EPS growth(%) 18.7 93.0 (6.6) 1.1 (4.2)
PE (x) 16.9 5.5 5.6 5.6 5.8
P/BV (x) 2.7 1.3 1.1 0.9 0.8
RoCE (%) 9.6 10.2 9.8 11.1 11.9
RoE (%) 16.0 23.6 20.3 17.5 14.8
EV/EBITDA (x) 16.1 7.6 8.7 6.6 5.5*Adjusted net income and EPS includes share of profit from associates. Company follows the practise of including dividend from its associate in ‘Other Income’. We have adjusted the net income by including the profit from the share of associates instead of taking dividend in ‘Other Income’. Source: Company, CRISIL Equities
CFV Matrix
Fundamental grade of '2/5' indicates Moderate fundamentals
Valuation grade of '3/5' indicates Aligned market price
1
2
3
4
5
1 2 3 4 5
Valuation Grade
Fu
nd
amen
tal G
rad
e
P o o r F undamentals
ExcellentF undamentals
Str
on
gD
ow
nsi
de
Str
on
gU
psi
de
Key stock statistics
NSE Ticker GKB-EQFair value (face value Rs10) 52Current market price (Rs per share)* 48Shares outstanding (mn) 4.2Market cap (Rs mn) 199Enterprise value (Rs mn) 27152-week range (Rs) (H/L) 80.8 / 10.3P/E on EPS estimate (FY11E) 5.6Beta 1.9Free float (%) 34.1%Average daily volumes (30-day average) 3998
* as on the report date
Share price movement
0
50
100
150
200
250
300
350
400
450
2-M
ar-1
0
9-M
ar-1
0
16-M
ar-1
0
23-M
ar-1
0
30-M
ar-1
0
6-A
pr-1
0
13-A
pr-1
0
20-A
pr-1
0
27-A
pr-1
0
4-M
ay-1
0
GKB Ophthalmics Nifty
-Indexed to 100 -Came under the NSE ‘permitted to trade category’ on March 2, 2010
Analytical contact
Chetan Majithia (Head, Equities) +91 22 3342 4148Bhaskar Bukrediwala +91 22 3342 1983Neeta Khilnani +91 22 3342 1882Email: [email protected] +91 22 3342 3561

CRISIL Equities
GKB Ophthalmics Ltd.
2
Table 1: Business Environment Parameter GKB Ophthalmics Ltd. GKB Vision Ltd.
( GKB Ophthalmics holds 38% share in GKB Vision) *
Overall sales break-up (Q3FY10) Export: 90% / Domestic:10% Export:95% / Domestic:5%
Glass Lenses Plastic Lenses Glass Lenses Glass Moulds
% Revenue contribution (FY09) 93 7 94 6
% Revenue contribution (FY12) 62 38 92 8
Product offering Basic category i) Single vision glass lenses
Basic category i) Single vision plastic lenses Value-added category ii) Bifocal lenses iii) Progressive lenses iv) Photochromic lenses v) High index lenses
Value-added category i) Bifocal lenses ii) Progressive lenses iii) Photochromic lenses
Glass moulds which are used in the production of plastic lenses
Capacity (Q3FY10) 12,000 lenses per day 4,000 lenses per day; plans to increase the capacity to 10,000 lenses per day by FY12
3,280 pieces per day on a single shift basis. However, the company is currently operating on a double-shift basis
Major export destinations Germany, California, Arizona, Muscat, Saudi Arabia
Same as glass lenses
Germany, Spain, France, Korea
Same as glass lenses
Key clients LENSCO, Swiss Lens, TIC Optics, Lenstech
Same as glass lenses
LENSCO, TIC Optics, Optical Supplies of Asia, Essilor France
Same as glass lenses
Industry scenario • Global market size: Approximately 1 bn lenses at the end of 2009 • Growth of 3-4% in volume terms for the past two-three years • Of the world population of 6 bn, 4 bn require eye correction, but currently only 1 bn wear lenses; lack of
awareness and ignorance is the main reason • Plastic lenses constitute ~80% of the global ophthalmic lens industry • Indian market – size : Approximately 90 mn lenses; glass lenses constitute approximately 80% of the
market, however demand for plastic lens has been growing by ~20% for the past two-three years
* GKB Vision – 38% is held by GKB while the remaining 62% is held by the promoters of GKB

CRISIL Equities
GKB Ophthalmics Ltd.
3
Parameter GKB Ophthalmics Ltd. GKB Vision Ltd.
Glass Lenses Plastic Lenses Glass Lenses Glass Moulds Sales CAGR forecast (FY09-12) 1% 106% -3% 11% Demand drivers
i) A preferred choice amongst the ageing population; World population is expected to reach 8 bn by 2025; with percentage of people aged more than 45 to increase from 23% to 32% ii) Sometimes glass lenses are prescribed by the doctors specifically as they offer better clarity of vision
i) Closure of several unviable manufacturing units in Europe due to their high cost structure. As a result, lenses are increasingly being outsourced from India and China ii) Replacement demand for plastic lenses; Europe and Japan’s replacement rate is moving close to the replacement rate of the US of 2.5 years from current 3.5 and 4 years respectively
Same as glass lenses under GKB Ophthalmics
As glass moulds are the raw material for manufacturing plastic lenses, they will grow in proportion to the demand for plastic lenses
Margin drivers
i) Reduction in rejection rates will help translate into higher sales with the same amount of raw materials, thereby improving EBITDA margins. ii) Higher realisations of value-added plastic lenses
i) Demand for high indexed glass lenses which command high realisations to drive margins
i) Reduction in rejection rates will help translate into higher sales with the same amount of raw materials, thereby improving EBITDA margins

CRISIL Equities
GKB Ophthalmics Ltd.
4
Grading Rationale Global ophthalmic lens industry growing at a steady pace… The global ophthalmic lens industry was sized at 1 bn lenses in 2009, of which America and Asia were the largest markets at 315 mn lenses each, accounting for 63% of the total market. The industry has evolved significantly from the use of spectacles purely for vision correction to fashion-cum-function accessory. The growth in world population, increasing thrust on eye awareness, changing lifestyles and an increase in the replacement demand of glasses have helped the industry clock 3-4% volume growth over the past two-three years. Further, there is a percenatge of population, especially in Asia, which needs vision correction but is unable to do so due to poverty and lack of awareness. Table 2 : Global ophthalmic lens industry: 1 bn lens market
Market Market size (in units)
Growth rates (1996-2005) Growth drivers
America 315 mn North America: 3% Latin America: 13%
i) Eyeglass replacement rate is 2.5 years, lowest in the world ii) Latest trend of stocking multiple pairs of glasses for different occasions iii) High demand for value-added plastic lenses
Asia 315 mn 12% i) High growth potential as a large proportion of population requires vision correction, but ignores their visual needs ii) Rapid shift from glass lenses to plastic lenses
Europe 250 mn 4% i) Eyeglass replacement rate is 3.5 years; expected to reduce to 2.5 years ii) Western Europe: 85% plastic lenses; Eastern Europe: 52% plastic lenses. Hence, there is a huge potential to penetrate the Eastern European plastic lenses market
Africa and Middle-East
61 mn 6% i) Gradual shift from glass lenses to plastic lenses
Japan, Australia and New Zealand
59 mn 8% i) Eyeglass replacement rate is four years; expected to reduce to 2.5 years. Europe’s and Japan's replacement rate moving to 2.5 years would increase the market by 50 mn lenses
ii) Close to 100% of the market dominated by plastic lens. iii) High demand for value-added plastic lenses
Source: Essilor Presentation, 2009
…However basic needs still remain unsatisfied; growth potential in lens industry is high Of the total world poulation of 6 bn people, only about 1 bn people are estimated to have eyesight correction. However, the number of people that need correction is estimated at 4 bn, which is 65% of the total population, and the reasons for this are lack of awareness, poverty and ignorance. With lenses being the main means of correction (three out of four people wear lenses for correction) there is a huge potential for growth.
Global ophthalmic lens industry has been growing at 3-4% over the past two-three years
Number of persons needing eyesight correction is 4 bn which is 65% of the total population

CRISIL Equities
GKB Ophthalmics Ltd.
5
The other potential customer base is the ageing population. The number of people above the age of 45, who account for 23% of the global population, is expected to reach 32% of the total expected population of 8 bn by 2025.
Table 3: Vision correction needs worldwide
Region % of people that need eye correction
Asia 81
Africa 84
South America 77
Europe 66
North America 41 Source: Essilor Presentation, 2009 Plastic lenses dominate the global ophthalmic lens industry… Currently, plastic lenses dominate the world ophthalmic lens industry, accounting for almost 80% of the total lens market. Plastic lenses are light-weight, more comfortable and stylised, hence are preferred by the fashion conscious people. Glass lenses are cheaper and have a higher shelf life than plastic lenses, but are heavy. Evolving fashion trends have gradually phased out glass lenses from most of the global markets. The transition from glass lens to plastic lens occurred in the period from 1996 to 2001, when the sales of glass lenses declined by an aggregate of 5.7% each year and the sales of plastic lenses increased by an aggregate 12% each year. Today, plastic lenses dominate the global ophthalmic lens industry. Glass lenses still prevail in the Indian ophthalmic lens industry, although the preference is steadily shifting towards the plastic variety.
Chart 1: Glass lens vs. plastic lens Factor Glass Lenses Plastic Lenses
Penetration In developing countries: Glass lenses: 80% of spectacles In developed countries: Glass lenses: 5% of spectacles
In developing countries: Plastic lenses: 20% of spectacles In developed countries: Plastic lenses: 95% of spectacles
Qualitative difference
- Better clarity of vision -Glass lenses are scratch-free and sturdy and, hence, more durable -Brittle and heavier than plastic lenses
-Lighter than glass lenses -a fashion-cum-function product -Susceptible to scratches, hence lesser shelf-life and needs more sensitive handling
- The cost of basic glass lenses and basic plastic lenses is similar
Price
- Progressive glass lenses command high realisations
-High indexed plastic lenses command high realisations
Source: Industry sources
Plastic lenses account for 80% of the total lens market
CRISIL Equities
GKB Ophthalmics Ltd.
6
Chart 2: Declining share of glass lenses in the world market
0
100
200
300
400
500
1979 1982 1985 1988 1991 1994 1997 2000 2003
In M n U nit s
Glass Lens Plast ic Lens
A verag e A nnual Gro wt h ( 19 79 - 2 0 0 4 )Glass Lenses: -11% Plast ic Lenses: +19%
Source: Essilor Presentation, 2004
… However glass lenses will not disappear completely Though plastic lens dominate the ophthalmic lens industry, a certain segment of population still prefers glass lens due to low cost and high durability. People in developing economies, especially in India, prefer the cheaper and long-lasting glass lens over plastic lens. This is validated by the fact that the share of glass lens is ~80% and plastic lens is ~20% in India. Majority of the ageing population prefer glass lenses due to better clarity of vision. Sometimes glass lenses are specifically prescribed by the doctors. Thus, even though there is a shift in demand toward plastic lenses, the demand for glass lenses will remain. GKB Ophthalmics - an established player GKB Ophthalmics is one of the established players in the organised ophthalmic lens manufacturing industry in India. The company manufactures basic single vision glass lens and has an installed capacity of 12,000 glass lenses per day. The company mainly exports (90%) since the Indian market is dominated by unorganised players (accounting for 75%) which supply low quality, cheap lenses to the price-sensitive Indian market. Besides the basic single vision glass lenses, the company also manufactures various value-added glass lenses – bifocal, progressive, photo chromic and high index lenses under a separate company called GKB Vision where it holds a 38% stake (the remaining 62% is held by the promoters of GKB).
The company forayed into the manufacturing of plastic lenses in FY09. It currently has an installed capacity of 4,000 lenses per day which it plans to ramp up to 10,000 lenses by FY12 with a capital expenditure of ~Rs 9 mn. It is one of the two companies in India manufacturing plastic lenses; the other is Hyderabad-based Techtran Polylenses Ltd, which has a manufacturing capacity of ~12000 lenses per day. Foray into plastic lens augurs well for GKB – better late than never With the worldwide ophthalmic lens industry being dominated by plastic lenses, the company has realised, though late, that it can no longer remain restricted to producing glass lenses. Hence, the company forayed into the manufacturing of plastic lenses in 2009. The company initially started with a capacity of 2,000 lenses per day and increased it to 4,000 lenses per day. It plans to expand the capacity to 10,000 pieces
Ageing population prefer glass lenses
Foray into plastic lens to provide future growth

CRISIL Equities
GKB Ophthalmics Ltd.
7
per day by FY12.
Chart 3: Revenue share of plastic lens to increase Chart 4: Expected volume growth of plastic lens
100%93%
77% 71%62%
7%
23% 29%38%
0%
0%
10%
20%
30%
40%
50%
60%
70%
80%
90%
100%
FY08 FY09 FY10E FY11P FY12P
Glass Lens Plast ic Lens
0.41
0.761.06
1.59
0
0.5
1
1.5
2
FY09 FY10P FY11E FY12P
In M n. unit s
Plast ic lens Volume
Source: CRISIL Equities Source: CRISIL Equities Although the company faced teething problems in the production process leading to high rejection rates, things seems to be settling down. Increased outsourcing from India & China
The closure of several unviable manufacturing units in Europe during the 2008 recession (as they had higher cost structures) has resulted in plastic lenses being outsourced from India and China, where the cost of production is relatively cheaper. With China mainly producing the basic variety of plastic lenses there is a huge market for high value-added products in the plastic segment that can be outsourced from India given the cost advantage compared to other European players.
GKB faces limited competition from other players in India. Apart from GKB, Techtran Polylenses Ltd is the only Indian player that manufactures plastic lenses. Hence, GKB is well poised to tap the opportunity in the plastic lenses market.
The closure of units in Europe has also helped the company source second-hand machines from them at a cheaper cost. For increasing its capacity from the current 4,000 plastic lens pieces per day to 10,000 pieces per day, the company has acquired an almost brand-new machine from one of the sick units in Europe at half the cost. This is expected to result in substantial cost savings for the company.
Agreement with Mitsui, a renowned player in chemicals, to ensure supply of high quality raw material
The company has also entered into an agreement with a Japanese firm, Mitsui Chemicals Inc, for the supply of raw materials required in the production of high-indexed plastic lenses. GKB is the only company in India to have signed a contract with Mitsui Chemicals, which is Asia’s largest and the world’s fifth ranked global chemical company in the world. High-indexed plastic lenses command high realisations and are expected to drive the revenue growth in the plastic lens segment of the company going ahead.
Constraints - competitve industry, no unique value propositions The ophthalmic lens industry is competitive with many ophthalmic lens suppliers operating globally. GKB has a capacity of 4.5 mn lenses (per annum) in a market of 1 bn lenses globally and, hence, does not have any advantage in terms of size or volume
Closure of manufacturing units in Europe has led to increased outsourcing from India and China
GKB lacks any unique value proposition which has hindered its ability to retain clients in the past

CRISIL Equities
GKB Ophthalmics Ltd.
8
of operations, which can bring in client dependence. Also, the company has no unique value proposition compared to other players in the industry. Hence, the company has limited ability to retain its clients. Due to the competitive nature of industry and lack of any unique value proposition, the company has failed to retain clients in the past, as a result of which its earnings are marked by a great degree of volatility. For instance, in FY07, the company lost a major client - Essilor AG, one of the largest manufacturers of ophthalmic lens globally. Essilor AG acquired a company in Italy from where it started to directly source its lens requirements.
Chart 5: Glass lens volume and realisations
3.69
2.713.03
2.41
3.49
2.62
1.751.85
1.961.87
1.52 1.49
0
1
2
3
4
FY05 FY06 FY07 FY08 FY09 Q3FY10
In M n. unit s
0
0.5
1
1.5
2In $
Glass Lens Volume Glass Lens Realizat ion
Source: Company, CRISIL Equities

CRISIL Equities
GKB Ophthalmics Ltd.
9
Key risks Adverse impact due to foreign exchange currency fluctuations GKB Ophthalmics earns a major proportion of its revenues from exports, mainly to America. Further, it sources its raw material requirements from France and Germany. As a result, it earns its revenues primarily in USD and incurs costs in Euros. As a result, the company is exposed to currency fluctuations both on revenues and costs. The company does not adopt any hedging practices, leading to the risk of adverse impact on its profitability due to fluctuations in these currencies. Low cost exports from China The company faces competition from the ophthalmic lens manufacturers in China who mainly supply to the export market at low prices. However, China mainly supplies the low-cost, basic finished lenses and, hence, is not a major competitor in value-added lenses. Client concentration The top three clients of the company contributed more than 60% of the company’s revenues in FY09. The client base of the company is marked by a degree of instability due to the inherent fragmented nature of the ophthalmic lens industry. There are many small suppliers of ophthalmic lenses globally. Hence, the company does not enjoy much bargaining power with its clients. As a result, there is always a risk of losing a client which has contributed to volatility in revenues in the past and continues to remain a risk going forward.
Absence of hedging exposes the company to risks of currency fluctuation

CRISIL Equities
GKB Ophthalmics Ltd.
10
Financial Outlook Revenues to grow to Rs 432 mn by FY12 at three-year CAGR of 15% We expect GKB Ophthalmics’ revenues to register a three-year CAGR of 15% to reach Rs 432 mn in FY12 from Rs 284.6 in FY09. The revenue growth forecast during the FY09-12 period is much higher compared to 3% CAGR registered over FY05-09. During this period, the revenue growth was muted as the company was mainly in the production of glass lenses, which was experiencing a declining demand trend the world over. The production of plastic lenses will definitely give a boost to the company’s revenues. Revenues from the plastic segment are expected to grow from ~Rs 19 mn in FY09 to ~Rs 166 mn in FY12E, translating into a contribution of 38% in FY12E compared to 7% in FY09.
Chart 6: Revenue and revenue growth trend Chart 7: Volume and realisation trend
285
377
432397
189
50
9
5
33
-250
100
200
300
400
500
FY08 FY09 FY10E FY11E FY12E
R s M n
-37.5
-25
-12.5
0
12.5
25
37.5
50
62.5( %)
Revenue Revenue Growth
2.41
3.90 4.30 4.605.13
2.06
2.00
1.971.431.96
0
1
2
3
4
5
6
FY08 FY09 FY10E FY11E FY12E
In M n. unit s
0
0.5
1
1.5
2
2.5
3In $
Volume Realizat ion
Source: CRISIL Equities Source: CRISIL Equities
EBITDA margin to increase to 13.7% by FY12 GKB’s EBITDA margin declined from 15.8% in FY08 to 12.5% in FY09. As FY09 was the first year of production of plastic lenses, the rejection rates for lenses were high. As a result, the increase in raw material did not translate into actual sales thereby impacting EBITDA margin. We believe with capacity additions in FY10, stabilisation in production will take a while. Hence, we expect EBITDA margin to dip further to 9.5% in FY10E. The company has so far reported an EBITDA margin of 9.2% for the period ending nine months to December FY10. Going forward, as the plastic lens production process stabilises and the rejection rates reduce, we expect EBITDA margin to increase to 12.2% in FY11 and 13.7% in FY12.
Revenues to post a three-year CAGR of 15% to Rs 432 mn in FY12
EBITDA margin to improve to 13.7% in FY12 with the stabilisation of production of plastic lenses

CRISIL Equities
GKB Ophthalmics Ltd.
11
Chart 8: EBITDA and PAT margins
15.8
12.5
9.5
12.213.7
12.6
9.4 9.07.9
12.8
0
5
10
15
20
FY08 FY09 FY10E FY11E FY12E
in %
EBITDA PAT
Source: Company, CRISIL Equities
GKB Vision’s growth expected to be flat; low profitability due to higer tax impact GKB Vision’s revenues are expected to increase from Rs 293 mn in FY09 to Rs 358 mn in FY12E backed by increase in volume and realisations. The realisations in value-added glass lenses manufactured under GKB Vision increased substantially in FY09 and nine months ending December, FY10 due to higher demand for photo chromic lenses. We expect GKB Vision’s EBITDA margin to slip from 28% in FY09 to 21.8% in FY12E due to higher raw material costs and rejection rates with the commmencement of production of glass moulds in 2009. Driven by flat growth and declining margins, we expect GKB Vision’s PAT to decline from Rs 60 mn in FY09 to Rs 37 mn in FY12. The company will also have to bear the impact of higher taxes in FY12 once the tax exemption expires. GKB Vision is a 100% export oriented unit and enjoys 100% tax exemption till FY11.
Chart 9: GKB Vision’s revenue and revenue trend Chart 10: EBITDA and PAT margins
358349293293 363
-4%
24%
14%
0%
2%
0
100
200
300
400
500
FY08 FY09 FY10E FY11E FY12E
R s M n
-10%
-5%
0%
5%
10%
15%
20%
25%
30%
Revenues Revenue Growth
21.4%
28.5%
24.6%
22.1% 21.8%
15.3%
10.2%
18.3%
11.8%
21.3%
0%
5%
10%
15%
20%
25%
30%
FY08 FY09 FY10E FY11E FY12E
EBITDA PAT
Source: CRISIL Equities Source: CRISIL Equities
GKB Vision’s revenues to increase on account of marginal increase in volume and realisations

CRISIL Equities
GKB Ophthalmics Ltd.
12
EPS expected to decline due to lower profitability of GKB Vision GKB’s consolidated PAT (after adding 38% share of profit from its associate GKB Vision) is expected to decline from Rs 36 mn in FY09 to Rs 34 mn in FY12. Although we expect GKB’s standalone profit to register a healthy CAGR growth of 16% during FY09-FY12E, driven by increasing volumes as well as margins (mentioned above), the profitability of GKB Vision is expected to decline. GKB Vision’s PAT is expected to decrease from Rs 60 mn in FY09 to Rs 37 mn in FY12E due to higher tax impact in FY12.
In line with the profitability, we expect GKB’s EPS to decline to Rs 8.2 per share (after adding 38% share of profit from GKB Vision) in FY12 from Rs 8.8 in FY09.
Chart 11: EPS and ROE
5.7
8.8 8.5 8.6 8.2
16
24
15
18
20
0.0
2.0
4.0
6.0
8.0
10.0
12.0
FY08 FY09 FY10E FY11E FY12E
R s
-10
3
15
28
40( %)
EPS ROE
Source: Company, CRISIL Equities
We expect GKB to earn an EPS of Rs 7.1 in FY12

CRISIL Equities
GKB Ophthalmics Ltd.
13
Management Overview
CRISIL’s fundamental grading methodology includes a broad assessment of management quality, apart from other key factors such as industry and business prospects, and financial performance. Overall, we believe that the management is experienced and well versed with the dynamics of the ophthalmic industry. Experienced management Mr K.G. Gupta, the Chairman and Managing Director, has an experience of close to five decades in the ophthalmic lens industry. He has been instrumental in positioning GKB as an established organised player in this industry in India. Mr Gupta has previously served as the Chairman of Confederation of Indian Industry in Goa and is currently a member of the Western Regional Council. Mr Gupta is supported by his two sons Mr Guarav Gupta and Mr Vikram Gupta, who are now actively involved in chalking out the growth plans for the company and new initiatives. Under the increasing involvement of the two sons, the company has diversified into the manufacturing of plastic lenses and struck a deal with Mitsui Chemicals for raw material supply. Not been proactive in reacting to changing industry dynamics The company entered into the manufacturing of plastic lens in 2009, whereas the transition from glass lens to plastic lens globally took place during 1996-2001. We believe that the management has not been proactive in gauging the change in industry dynamics and adopting to it, which has hurt the growth of GKB Opthalmics. In case the company had moved into the manufacturing of plastic lenses when the transition took place globally, it would have reaped the benefits of high growth in the plastic lenses segment then. Reasonably experienced second line of management The company has a reasonably experienced second line of management in place. We believe that the second line of management has sound technical know-how, is reasonably well experienced in their respective functional areas and have been with the company long enough to ensure smooth operations of the company.
GKB has been late in entering the plastic lens segment, which has hurt its growth in the past
GKB has a reasonably good and experienced management

CRISIL Equities
GKB Ophthalmics Ltd.
14
Corporate Governance CRISIL’s fundamental grading methodology includes a broad assessment of corporate governance and management quality, apart from other key factors such as industry and business prospects, and financial performance. CRISIL Equities also analysed the company’s shareholding structure, board composition, typical board processes, disclosure standards and related-party transactions. Any qualifications by regulators or auditors also served as useful inputs while assessing corporate governance. GKB’s board comprises of five directors, of whom one is an executive director and four are non-executive directors including one independent director. The company does not comply with Clause 49 of the listing agreement as there is only one independent director on the board. Also, interaction with the independent director revealed that his level of engagement with the company’s affairs is below the required level. Board composition The board comprises professional individuals with varied experience. Mr Somnath Priolkar is the sole independent director on the board. He is 77 years old and has worked in the company previously as the head of accounts and finance for about 13 years.
As there is only one independent director on board, GKB Ophthalmic’s board does not meet the SEBI guidelines on board composition. We discussed this with the management, and they recognize this as a shortcoming. They plan to induct more independent directors on the board.
Board processes The balance sheet disclosures indicate that all the processes relating to committees are in place. The audit committee, chaired by the independent director, consists of two other non-executive directors. However, the company does not have a remuneration committee in place and the HR manager assists the board in fulfilling the remuneration policy.
GKB’s board comprises five directors, of whom only one is independent
CRISIL Equities
GKB Ophthalmics Ltd.
15
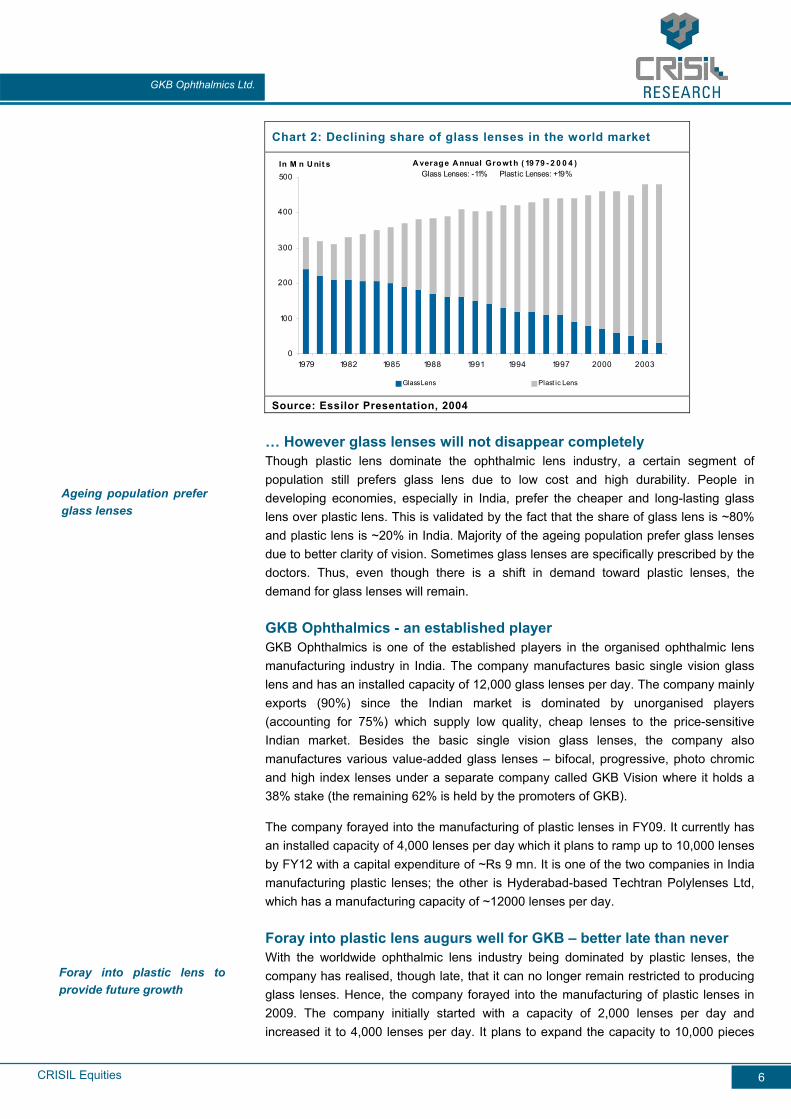
Valuation Grading Grade:3/5
We have used the sum-of-parts approach to value GKB. We have used the discounted cash flow (DCF) method to value both GKB Ophthalmics (standalone) and GKB’s 38% stake in GKB Vision. Based on the DCF method, we arrive at the fair value of Rs 52 per share for GKB. We have valued GKB (standalone) at Rs 26 per share and GKB’s 38% stake in GKB Vision is valued at Rs 26 per share. At our fair value of Rs 52 for GKB, the implied P/E is 6.04x for FY11 and 6.34x for FY12 earnings (including the share of profit from GKB Vision). We initiate coverage on GKB with a valuation grade of ‘3/5’. This grade indicates that GKB’s valuations are ‘aligned’ to the current market price of Rs 48 as on May 10, 2010.
Key components to our valuation We have considered discounted free cash flows from FY11 to FY15. i) Cost of Equity of 18.4% for both GKB Ophthalmics and GKB Vision factoring in
higher risks due to fragmented nature of the industry, small size of the business and low liquidity of the stock.
ii) Terminal Growth rate of 2% in line with the expected growth rate in the global ophthalmic lenses industry.
iii) Cost of Debt (post tax) of 8% for both GKB Ophthalmics and GKB Vision. iv) Capex assumption of Rs. 9.5 mn in a phased manner till FY12 to fund the
increase in plastic lens manufacturing capacity from 4000 lenses per day currently to 10,000 lenses per day by FY12.
Chart 12 : Sensitivity analysis: GKB Ophthalmics Chart 13: Sensitivity analysis: GKB Vision Terminal growth rate
1.0% 1.5% 2.0% 2.5% 3.0%14.3% 32 34 36 38 4115.3% 27 29 30 32 3416.3% 23 24 26 27 2917.3% 19 20 22 23 2418.3% 16 17 18 19 20
Terminal growth rate 1.0% 1.5% 2.0% 2.5% 3.0%
15.6% 28 29 29 30 3116.6% 26 27 28 28 2917.6% 25 26 26 27 2718.6% 24 24 25 25 2619.6% 23 23 24 24 24
Source: CRISIL Equities Source: CRISIL Equities
Fair value estimate of Rs 52 based on DCF

CRISIL Equities
GKB Ophthalmics Ltd.
16
Company Overview GKB Ophthalmics is a manufacturer and exporter of ophthalmic lenses. The company’s manufacturing facilities are located at Tivim Industrial Estate, Goa. It manufactures single vision glass lenses and plastic lenses with a capacity of 12,000 glass lenses per day and 4,000 plastic lenses per day as on Q3FY10. The company earns most of its revenues through exports to Europe, America, Africa, Middle-East and Far East. The glass lens segment of the company contributed 77% of the total revenues as on Q3FY10. The company commenced commercial production of plastic lens in 2009 with a capacity of 2,000 pieces per day which has increased to 4,000 pieces per day. The company plans to further increase its capacity in plastic lens to 10,000 pieces per day by FY12. However, the company has no capacity addition plans in the glass lens segment.
Chart 14: Company structure
Source: Company
Table 4: Timeline
Timeline Details 1983 GKB Ophthalmics Ltd. commenced commercial production of ophthalmic glass lenses 2008 Diversified into the manufacturing of glass moulds and photo chromatic plastic lenses
2008 Entered into a joint venture agreement with Indo Internacional, S.A.Spain, to import and sell optical equipments manufactured by foreign JV partner in India
2009 Entered into an agreement with Japanese firm Mitsui Corporation for the supply of raw materials to produce the high-indexed variety of plastic lenses
Source: Company
GKB Ophthalmics Ltd.
-Commenced commercial production in 1983. -Manufactures single vision glass lenses and plastic lenses -Capacity: 12,000 glass lenses per day; 4,000 plastic lenses per day as on Q3FY10
GKB Vision Ltd. (38% share)
-It is an 100% EOU Manufactures bifocal and progressive glass lenses and glass moulds used in the manufacturing of plastic lenses - Capacity: 3,287 glass lenses per day on a single shift basis
GKB Ophthalmics FZE (100% share)
-Based in Sharjah UAE -Distribution arm of GKB in the Middle East region

CRISIL Equities
GKB Ophthalmics Ltd.
17
Annexure: Financials
Income Statement
(Rs Mn) FY08 FY09 FY10E FY11E FY12E
Net sales 189 285 377 397 432
Operating Income 189 285 378 397 432
EBITDA 30 36 36 49 59
Depreciation 8 12 9 11 12
Interest 16 10 12 16 19
Other Income 9 8 0 1 2
PBT 15 23 15 23 30
PAT (before share in profit from associates) 11 13 10 15 20
Share in profit from associates 13 24 25 20 14
PAT (after share in profit from associates) 24 36 35 36 34
No. of shares 4.2 4.2 4.2 4.2 4.2
Earnings per share (EPS) 5.7 8.8 8.5 8.6 8.2
Balance Sheet
(Rs Mn) FY08 FY09 FY10E FY11E FY12E
Equity (FV Rs 10 per share) 42 42 42 42 42
Reserves and Surplus 108 117 148 176 201
Debt 85 80 122 152 182
Current Liabilities and Provisions 83 134 176 176 188
Deferred Tax Liability/(Asset) 14 11 11 11 11
Capital Employed 331 384 498 557 624
Net Fixed Assets 93 84 100 119 137
Investments 42 44 44 44 44
Loans and advances 10 12 16 17 18
Inventory 131 159 228 240 255
Receivables 50 77 100 106 115
Cash & Bank Balance 6 8 10 32 55
Applications of Funds 331 384 498 557 624 *Adjusted net income and EPS includes share of profit from associates. Company follows the practise of including dividend from its associate in ‘Other
Income’. We have adjusted the net income by including the profit from the share of associates instead of taking dividend in ‘Other Income’.

CRISIL Equities
GKB Ophthalmics Ltd.
18
Cash Flow
(Rs Mn) FY08 FY09 FY10E FY11E FY12E Pre-tax profit 15 23 15 23 30 Total tax paid (3) (12) (5) (8) (10)
Depreciation 8 12 9 11 12
Change in working capital (13) (7) (54) (18) (14)
Cash flow from operating activities 7 15 (35) 8 19 Capital expenditure (10) (2) (25) (30) (30)
Investments and others 17 22 25 20 14
Cash flow from investing activities 7 20 0 (10) (16) Equity raised/(repaid) 0 0 0 0 0
Debt raised/(repaid) 6 (5) 42 30 30
Dividend (incl. tax) (4) (6) (5) (7) (9)
Others (incl extraordinaries) (17) (22) - - -
Cash flow from financing activities (16) (33) 37 23 21 Change in cash position (2) 2 2 21 24 Opening Cash 8 6 8 10 32
Closing Cash 6 8 10 32 55
Ratios FY08 FY09 FY10E FY11E FY12E
Growth ratios Sales growth (%) (25.3) 50.4 32.6 5.2 8.8
EBITDA growth (%) (13.3) 18.8 0.7 35.7 22.1
EPS growth (%) 18.7 93.0 (6.6) 1.1 (4.2)
Profitability Ratios
EBITDA Margin (%) 15.8 12.5 9.5 12.2 13.7
PAT Margin (%) 12.6 12.8 9.4 9.0 7.9
Return on Capital Employed (RoCE) (%) 9.6 10.2 9.8 11.1 11.9
Return on equity (RoE) (%) 16.0 23.6 20.3 17.5 14.8
Dividend and Earnings
Dividend per share (Rs) 0.9 1.4 1.1 1.7 2.2
Dividend payout ratio (%) 36.4 45.8 45.0 45.0 45.0
Dividend yield (%) 1.0 2.8 2.2 3.3 4.4
Earnings Per Share (Rs) 5.7 8.8 8.5 8.6 8.2
Efficiency ratios
Asset Turnover (Sales/GFA) 1.2x 1.7x 2.1x 1.9x 1.8x
Asset Turnover (Sales/NFA) 2.1x 3.2x 4.1x 3.6x 3.4x
Sales/Working Capital 1.9x 2.6x 2.7x 2.2x 2.2x
Financial stability
Net Debt-equity 0.5 0.5 0.6 0.5 0.5
Interest Coverage 1.4 2.5 2.2 2.4 2.5
Current Ratio 2.4 1.9 2.0 2.2 2.4
Valuation Multiples
Price-earnings 16.9x 5.5x 5.6x 5.6x 5.8x
Price-book 2.7x 1.3x 1.1x 0.9x 0.8x
EV/EBITDA 16.1x 7.6x 8.7x 6.6x 5.5x
Source:Company,CRISIL Estimates

CRISIL Equities
GKB Ophthalmics Ltd.
19
Focus Charts
GKB: Revenue and revenue growth trend Shareholding as on March 2010
189
285
377432
397
50
9
5
33
-250
100
200
300
400
500
FY08 FY09 FY10E FY11E FY12E
R s M n
-37.5
-25
-12.5
0
12.5
25
37.5
50
62.5( %)
Revenue Revenue Growth
Non-inst itut ional investors, 32.73%
Domest ic inst itut ions,
1.33%
Indian Promoters,
65.94%
Source: CRISIL Equities Source: Company
Share of plastic lens to increase GKB: Lenses volume and realisation trend
100%93%
77% 71%62%
7%
23%29%
38%
0%
0%
10%
20%
30%
40%
50%
60%
70%
80%
90%
100%
FY08 FY09 FY10E FY11P FY12P
Glass Lens Plast ic Lens
2.41
3.90 4.30 4.605.13
2.06
2.00
1.971.431.96
0
1
2
3
4
5
6
FY08 FY09 FY10E FY11E FY12E
In M n. unit s
0
0.5
1
1.5
2
2.5
3In $
Volume Realizat ion
Source: Company, CRISIL Equities Source: Company, CRISIL Equities
GKB: EBITDA and PAT margins GKB: EPS and ROE
15.8
12.5
9.5
12.213.7
12.6
9.4 9.07.9
12.8
0
5
10
15
20
FY08 FY09 FY10E FY11E FY12E
in %
EBITDA PAT
5.7
8.8 8.5 8.6 8.2
16
24
15
18
20
0.0
2.0
4.0
6.0
8.0
10.0
12.0
FY08 FY09 FY10E FY11E FY12E
R s
-10
3
15
28
40( %)
EPS ROE
Source: Company, CRISIL Equities Source: Company, CRISIL Equities

CRISIL Equities
Company Name Limited
12
For further detailsor more information, please contact:
Client ServicingCRISIL Research
CRISIL HouseCentral Avenue
Hiranandani Business ParkPowai, Mumbai - 400 076, India.
Phone +91 (22) 3342 3561/ 62Fax +91 (22) 3342 3501
E-mail: [email protected]: [email protected]
www.ier.co.in
About CRISIL Limited CRISIL is India's leading Ratings, Research, Risk and Policy Advisory Company About CRISIL Research CRISIL Research is India's largest independent, integrated research house. We leverage our unique,integrated research platform and capabilities spanning the entire economy-industry-companyspectrum to deliver superior perspectives and insights to over 600 domestic and global clients,through a range of subscription products and customised solutions.
Mumbai CRISIL House Central Avenue Hiranandani Business Park Powai, Mumbai - 400 076, India. Phone +91 (22) 3342 8026/29/35 Fax +91 (22) 3342 8088
New Delhi The Mira G-1 (FF),1st Floor, Plot No. 1&2 Ishwar Nagar, Near Okhla Crossing New Delhi -110 065, India. Phone +91 (11) 4250 5100, 2693 0117-21 Fax +91 (11) 2684 2212/ 13
Bangaluru W-101, Sunrise Chambers 22, Ulsoor Road Bengaluru - 560 042, India. Phone +91 (80) 4117 0622 Fax +91 (80) 2559 4801
Kolkata ‘Horizon’, Block ‘B’, 4th floor 57 Chowringhee Road Kolkata - 700 071, India. Phone +91 (33) 2283 0595 Fax +91 (33) 2283 0597
Chennai Mezzanine Floor, Thappar House 43 / 44, Montieth Road Egmore Chennai - 600 008, India. Phone +91 (44) 2854 6205/06, 2854 6093 Fax +91 (44) 2854 7531