Independent Analytical Review for a Road User Satisfaction...
85
Independent Analytical Review for a Road User Satisfaction Survey Report to Transport Focus The Centre for Transport & Society University of the West of England, Bristol June 2015
Transcript of Independent Analytical Review for a Road User Satisfaction...

Independent Analytical Review for a Road User Satisfaction Survey
Report to Transport Focus
The Centre for Transport & Society University of the West of England, Bristol June 2015

2
Authors: Centre for Transport & Society Professor Graham Parkhurst Dr Juliet Jain Dr William Clayton Thomas Calvert Real Research Adam Phillips FMRS, FRSA Bill Blyth FMRS For queries or correspondence regarding this report please contact: Professor Graham Parkhurst Director, Centre for Transport and Society Department of Geography and Environmental Management Faculty of Environment and Technology University of the West of England, Bristol Frenchay Campus Coldharbour Lane Bristol BS16 1QY E-mail: [email protected] Tel: +44 (0)117 32 82133 Or Adam Phillips Managing Director Real Research Ltd Bambers Grayswood Road Haslemere GU27 2BW E-mail: [email protected] Tel: +44 (0)1428 645956

3
CONTENTS
INTRODUCTION AND EXECUTIVE SUMMARY ............................................ 6
1 LITERATURE REVIEW ........................................................................... 12
1.1 Introduction ........................................................................................................ 12
1.2 Conceptual context .............................................................................................. 12 1.2.1 Definitions of customer satisfaction ..................................................................... 12
1.3 Factors which influence satisfaction – Academic and policy context ...................... 13 1.3.1 Travel-time and perceptions of travel-time, and congestion ............................... 13 1.3.2 Instrumental, affective, symbolic and identity factors ......................................... 14 1.3.3 Control and freedom ............................................................................................. 16
1.4 Existing Road User Satisfaction Surveys ................................................................ 17 1.4.1 National Road Users’ Satisfaction Survey (NRUSS) ............................................... 23 1.4.2 National Highways and Transport Survey (NHTS) ................................................. 25 1.4.3 Transport for London Road Network (TLRN) Customer Satisfaction Survey ........ 27 1.4.4 State Route 91 Express Lanes Satisfaction Survey (91SS) ..................................... 28 1.4.5 National Rail and Bus Passenger Surveys .............................................................. 29 1.4.6 Transport Statistics for Great Britain .................................................................... 31 1.4.7 Question formats .................................................................................................. 31
1.5 Summary ............................................................................................................. 33
2 STAKEHOLDER INTERVIEWS .............................................................. 36
2.1 Introduction ........................................................................................................ 36
2.2 Data generation approach .................................................................................... 36
2.3 Key findings from the stakeholder interviews ....................................................... 37 2.3.1 Context of the new Road User Satisfaction Survey ............................................... 37 2.3.2 Views about the NRUSS ......................................................................................... 38 2.3.3 The population of interest .................................................................................... 40 2.3.4 What should be measured and why ..................................................................... 42 2.3.5 Which experience? ................................................................................................ 42 2.3.6 Elements of the experience................................................................................... 43 2.3.7 Geographic granularity .......................................................................................... 48 2.3.8 Other surveys and customer information ............................................................. 48 2.3.9 Gatekeepers to specific populations ..................................................................... 49
2.4 Summary ............................................................................................................. 49
3 PROPOSED SRN SURVEY DESIGN AND SAMPLING ......................... 50
3.1 The research objectives ........................................................................................ 50
3.2 Overall survey design ........................................................................................... 50

4
3.2.1 Current research ................................................................................................... 50 3.2.2 Design of the new Road User Satisfaction Survey ................................................ 50
3.3 Types of road user ............................................................................................... 52 3.3.1 Subgroups within audiences ................................................................................. 53 3.3.2 Changes to the requirements ................................................................................ 53
3.4 General considerations and their implications ...................................................... 54
3.5 Our preferred approaches .................................................................................... 55 3.5.1 Driving Licence Files(s) .......................................................................................... 55 3.5.2 Vehicle registration file ......................................................................................... 57 3.5.3 Other sampling approaches .................................................................................. 58 3.5.4 Incentives for respondents.................................................................................... 58 3.5.5 Recommended sampling approach ....................................................................... 58 3.5.6 Other special samples ........................................................................................... 59
4 CONSIDERATIONS FOR QUESTIONNAIRE SPECIFICATION ............. 61
4.1 The requirements for a new satisfaction survey .................................................... 61
4.2 Design of the interview(s) .................................................................................... 61 4.2.2 Outline of the interviews ....................................................................................... 63 4.2.3 The interview delivery platforms .......................................................................... 64 4.2.4 Timing of interviews .............................................................................................. 64
4.3 Outline of main questionnaire .............................................................................. 65 4.3.1 Introduction and frequency of use of SRN ............................................................ 65 4.3.2 Frequency of use ................................................................................................... 66 4.3.3 Last trip .................................................................................................................. 67
4.4 Questions for infrequent SRN users ...................................................................... 68
4.5 Interviews for special subgroups .......................................................................... 68 4.5.1 Commercial drivers ............................................................................................... 68 4.5.2 Fleet transport managers ...................................................................................... 68
4.6 Analysis of the results .......................................................................................... 69
5 PILOT DESIGN AND EVALUATION ....................................................... 70
5.1 Pilot..................................................................................................................... 70 5.1.1 The pilot plan ......................................................................................................... 70
5.2 Evaluation of the pilot .......................................................................................... 72
6 CONCLUSIONS ...................................................................................... 74
7 REFERENCES ........................................................................................ 77

5
APPENDIX 1: FULL QUESTION TOPIC LIST FROM THE NATIONAL ROAD USER SATISFACTION SURVEY .................................................................. 80
APPENDIX 2: AUTHOR BIOGRAPHIES ...................................................... 84

6
Introduction and Executive Summary
Following the 2011 publication of the Cook Report (Cook, 2011) which examined the English highway network in terms of its effective management, value for money and level of innovation, the government set about a programme of regulatory reform (Department for Transport - DfT, 2012). The programme examined the management of the Strategic Road Network and re-visited its strategic objectives, and how performance against those objectives might be monitored and regulated. The reform process culminated in the Roads Investment Strategy (RIS), which set out strategic long-run objectives until 2021 and an initial funding plan for the first five-year period (DfT, 2014), and Royal Assent being given to the Infrastructure Act 2015. The Act provided the underpinning legislation for transfer of the SRN from the government Highways Agency to the independent public company Highways England. As part of the new regulatory arrangements for Highways England, the independent transport system user ‘watchdog’ Transport Focus had its remit extended by the Act, from a focus hitherto on public transport users also to include people that use the SRN.
In order to support its statutory monitoring role, Transport Focus has responsibility for a new road user satisfaction survey (New RUSS). The primary role of the New RUSS is benchmarking and evaluating the performance of Highways England in terms of the perceptions of its customers, but also, where feasible within the constraints of a single survey instrument, it will collect data which will help understand travellers’1 experiences of using the SRN, and inform the maintenance and development of the network.
The present report is the key output from the study commissioned to advise on the methodology for the New RUSS. It is structured in six chapters, considering in turn:
a review of existing relevant satisfaction surveys and the factors that have been identified by previous studies as shaping the road user experience,
findings from stakeholder interviews undertaken to consult on expectations about the New RUSS,
the overall approach to survey design and sampling,
considerations in questionnaire design,
the design of the pilot,
the conclusions of the review
Chapter 1 reviews existing examples of customer satisfaction surveys in a road user context, with the aim of informing the design of a pilot methodology for the New RUSS for England. It sets out the conceptual context for the road user survey. Customer satisfaction is not a new concept, but there is less research associated with road user satisfaction than with other products and services. Customer satisfaction is most often considered within a situation of choice (i.e. the customer can choose a different product if they are not satisfied by a particular one). In contrast the road user context represents a unique challenge as drivers may often have no other choice of ‘product’ (i.e. the road upon which they are travelling). A further characteristic of the road user experience in England is that it is less clear to the user who is providing the service, as compared with the case of a rail or aviation operator.
1 Whilst the remit extends to all SRN users, there is a focus in the present commission at least on drivers.

7
However, research does demonstrate that there are a number of factors which can influence satisfaction for road users, such as the value that people place upon their time and consequently upon their journey time (or ‘travel-time’). Generally minimising travel-time is understood as an important concern for road users; therefore a reduction in travel-time may lead to an increase in road user satisfaction. Conversely, there could be situations in which road users enjoy or value their travel-time – particularly if they find it useful, which may impact on satisfaction in relation to the experience of time.
Existing surveys into road user satisfaction have focused on the ‘instrumental’ aspects of driving – journey time, financial costs, speed, convenience, comfort, or seamless journeys. Chapter 1 does explore other important factors that shape drivers’ experiences. These have been described as ‘affective’ factors, and involve the psycho-social experience of driving. These are discussed as the pleasant or unpleasant aspects of driving itself, and relate to experiences of stress, excitement, uncertainty, enjoyment, and autonomy. Other studies have identified the importance of feelings of control and the perception of freedom experienced by drivers. Chapter 1 considers the need to understand instrumental and affective factors to construct a useful representation of road users’ levels of satisfaction, but affective factors are not currently core to road user satisfaction surveys. The final part of chapter 1 offers examples of road user surveys from within the UK and further afield to understand how drivers’ experiences have been represented.
Chapter 2 of the report summarises the issues generated by the stakeholder interviews. There are some strong messages about what the likely concerns of road users are to affect satisfaction with the road network, which include journey time sensitivities, safety, and information as headline issues. At the same time the stakeholders recognise that different types of road user may have different needs and concerns. For example, some freight movement is very time sensitive and unplanned delays may have a negative economic impact, whereas other travellers may be more concerned about perceptions of safety, or information. ‘Instrumental’ factors were the focus; the ‘affective’ aspects were noted as important in shaping experience.
The stakeholder interviews explored how the NRUSS had developed and how it was used. The existing Highways England NRUSS was re-shaped through extensive research with road users in 2010. Further research with road users and their perceptions of driving and the SRN has been informing stakeholders during the transition period to Highways England. The stakeholder interviews conducted for this research reported in Chapter 2 revealed the importance of this earlier research in shaping understandings of road users and the wider community affected by the SRN. It also raised concern about the road users’ knowledge of the SRN and the former Highways Agency’s public profile.
The interviews suggested that the design of the existing NRUSS was shaped by extensive experience and knowledge from within Highways England; therefore there is a potential challenge for the New RUSS, which might be more limited in focus, to be seen to offer a similar quality product. The NRUSS is a valued tool for some in Highways England and DfT, particularly in understanding the reasons for poor performance. However, many stakeholders noted the existing NRUSS’ has weaknesses that include its sample and the effective use of the output data in operational management. Stakeholders want an improvement in the sample with the New RUSS so that reporting is more statistically robust and they can justify the need to respond to poor satisfaction. They also want information that is useful in directing future improvements. Specifically there is concern that a single customer satisfaction figure will not be useful.
Most stakeholders saw the ‘last trip’ approach for evaluating satisfaction as best for recall, but some noted that a broader set of indicators of satisfaction should be considered, for

8
example, an overview of the network over the preceding year, or a worst/best journey experience.
The interviews presented in Chapter 2 also consider different types of road users. The concept of ‘strategic’ shaped some stakeholders’ perceptions about who the road network is for, and which road users were most important, i.e. those involved in economic activity. However, most stakeholders believe there is a need to understand the totality of user, from those frequently using short sections of trunk roads to long distance motorway trips. A number of stakeholders saw value in gaining the views of those drivers who avoid motorways, as well as cyclist and pedestrians, and communities affected by roads. While some communities will receive targeted funding to deal with issues such as community severance, it will be the user satisfaction with crossing the SRN, accessing bus stops on the SRN, and cycle infrastructures along the SRN that will the concern of Transport Focus. However, the challenge of a survey capturing the views from such smaller groups of road users is explained in chapters 3 and 4.
Chapters 3 and 4 set out the proposed methodological approach for the New RUSS and pilot questionnaire. These are informed by the two preceding chapters. In summary, the recommended approach is that only drivers are interviewed for the main survey, since drivers will necessarily have higher awareness of the SRN while they are using it than passengers typically will and so drivers are more likely to know where they are when events occur. Passengers have a less comprehensive experience and, to the extent that it is different, this can mostly be reported by the driver, even if not experienced personally.
It is proposed to use online interviews as the most cost-effective way of accessing a larger and better quality sample than the current satisfaction surveys. The proportion of drivers with access to the internet is in excess of 90% and still rising. Online interviewing makes it possible to use background processing to present interview modules that will only be asked if respondents have had a particular experience or given a specific answer and to keep the length of the interview reasonable by not asking more questions than necessary to get reliable results. More importantly, online interviewing will enable a further interview with respondents who have exhibited particular behaviour, or given particular responses, and ask further questions at a very low cost per interview. This will make it possible for the initial questionnaire to be shorter and any follow up questions to be more specific to the respondents’ experiences. Using an online approach for this survey has three important benefits:
1. Short questionnaires get higher response rates, better quality answers and increased willingness to participate in future surveys.
2. Unlike other modes of interviewing surveys can be broken up into modules which target particular experiences. Individual modules can then either be administered to qualifying respondents, if it is a low incidence experience, or a subset of all respondents, if it is high incidence.
3. The database of respondents created by the initial interview makes it possible for them to be re-contacted easily and cheaply if their answers need further explanation, or if they are known to take particular trips which are of interest.
The methodology set out in Chapter 3 is a pragmatic response to the desire to improve the current NRUSS sampling that utilises technological opportunities. It sets out how the preferred option of a sample drawn from the Driver and Vehicle Licencing Agency (DVLA) database in conjunction with an internet delivered questionnaire has the potential for producing robust and reliable data. The DVLA licence database contains the addresses of all drivers with licences, together with information about the type of licence. It therefore

9
provides the only cost-effective route for systematically selecting a large representative sample of drivers which contains within it over-sampled sub-groups which can be difficult to reach, like the elderly, disabled and novice drivers. The need to capture information from a diverse set of road users, and to interview reliable samples of specific sub-groups (e.g. 70+ age group), as well as to consider geographic differences was apparent from the stakeholder interviews. The recommended approach will meet this need.
An alternative methodology is provided based on the Vehicle Registration File. However, this approach is limited to mainly private car drivers, and far less information is available to facilitate refining the sample at the outset. The need to recruit a representative sample of drivers, rather than only vehicle keepers via a letter will require a greater amount of administration and piloting. For these reasons it will produce a considerably lower quality sample and the extra contacts needed to draw the sample mean that is likely to cost more per completed interview. Other options have very significant methodological weaknesses. There are additional challenges such as the need for geographic clustering, multiple call-backs and to oversample certain groups of drivers (e.g. fleet drivers). These lead to high costs for a multi-stage stratified sample option for face-to-face interviewing. Likewise the costs and logistics of employing an unclustered sample which would yield a geographically better-distributed sample, comparable to using the DVLA licence database, would incur significantly higher costs and further reduce its viability. The alternative of telephone interviewing solves the problem of geographic clustering and reduces the cost of calling back, but is severely limited in terms of conveying spatial information without a map.
Chapter 3 also contains recommendations for a survey of fleet transport managers to gain insights into the specifics of the movement of freight, commercial journeys and passenger coaches. Here sampling would be based on businesses.
Chapter 4 contains considerations for the development of pilot questionnaires. The suggested design responds to the need for a reliable satisfaction score based on information that can be accurately recalled by road users. It emphasises that detailed information should only be collected from drivers on very recent journeys (last 7 days) and that interviews should be carried out seven days a week throughout the year in order to make it possible to examine unplanned events and to execute special analyses on topics which require a more granular analysis of the sample. These might include the effect of accidents on satisfaction, or experimental changes to signage, information services or similar topics which impact a subset of the total sample. The online approach also makes it easy and relatively cheap to carry out a further interview if this is needed to elicit more specific diagnostic information.
The review recommends that two interview lengths (10 and 20 minutes) should be piloted, with a different interview for commercial users from other road users. In the final survey it is likely that the improved response rate for the shorter interview will lead to its adoption for the main survey. The longer interview in the pilot will enable the testing of questions to establish the best way to measure satisfaction in a short interview. An outline of a very short (5 minute) interview has also been provided for consideration in the event that certain sub-groups within the sample still find a 10 minute interview too long. It is recommended that the interview is developed and tested in the pilot on all platforms which could be used to complete an online questionnaire. This must include smartphones, since their use is growing rapidly; they are now possessed by more than half the adult population. The interview will be designed to gather last trip experiences, and an overview of satisfaction with the SRN over the previous 12 months.
Chapter 5 details the pilot design and evaluation. It is recommended that not only different length interviews, but also different invitation letters and different incentive levels are tested in the pilot. The pilot survey sample will not be of exactly the same design as the final
10
research: it will over-sample a number of driver categories, such as the disabled, by more than will be necessary in the main survey, in order to provide a sufficiently large base for analysis.
The minimum sample sizes necessary to obtain sufficient email addresses from the Stage 1 contact in order to provide big enough samples to test the questionnaire in Stage 2 have been recommended, based on estimates of the likely response rates at each stage. Much of the costs of the pilot are base costs which will be spent irrespective of the sample size and the scale of the subsequent main survey. It is a matter of fact that for internet research the base costs are always a higher proportion of the total cost and the running costs are much lower than for face-to-face or telephone interviewing.
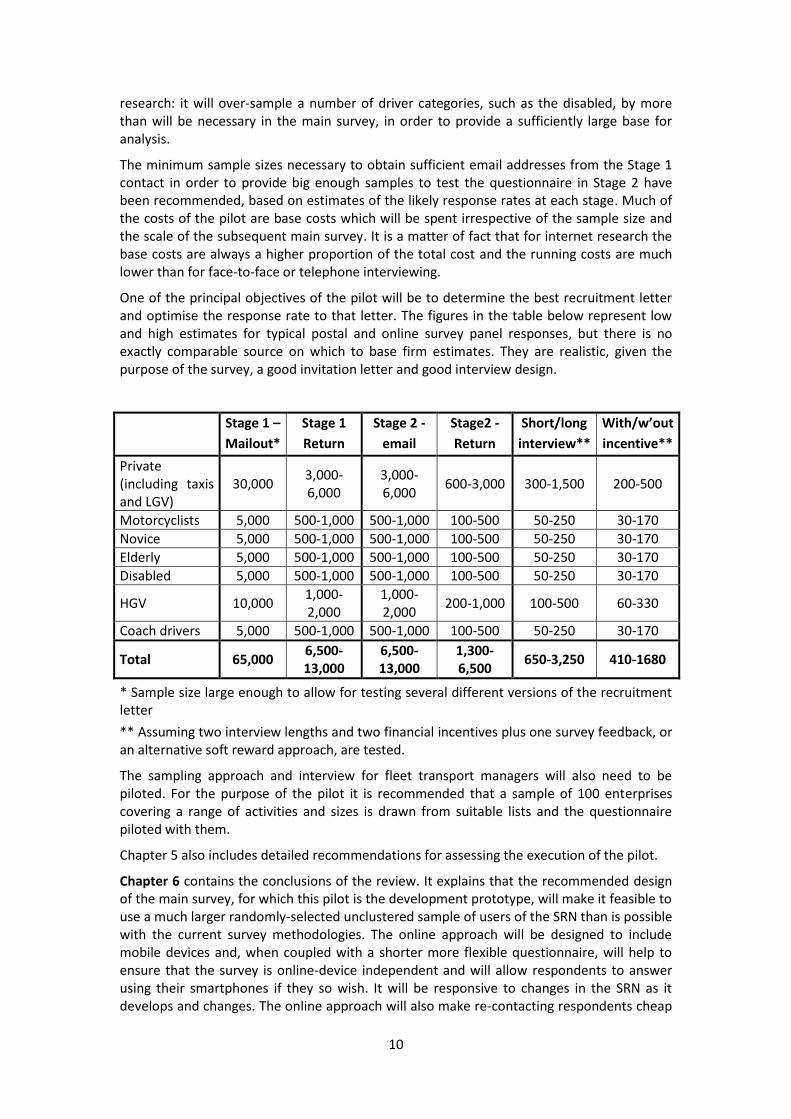
One of the principal objectives of the pilot will be to determine the best recruitment letter and optimise the response rate to that letter. The figures in the table below represent low and high estimates for typical postal and online survey panel responses, but there is no exactly comparable source on which to base firm estimates. They are realistic, given the purpose of the survey, a good invitation letter and good interview design.
Stage 1 –
Mailout*
Stage 1
Return
Stage 2 -
Stage2 -
Return
Short/long
interview**
With/w’out
incentive**
Private (including taxis and LGV)
30,000 3,000-6,000
3,000-6,000
600-3,000 300-1,500 200-500
Motorcyclists 5,000 500-1,000 500-1,000 100-500 50-250 30-170
Novice 5,000 500-1,000 500-1,000 100-500 50-250 30-170
Elderly 5,000 500-1,000 500-1,000 100-500 50-250 30-170
Disabled 5,000 500-1,000 500-1,000 100-500 50-250 30-170
HGV 10,000 1,000-2,000
1,000-2,000
200-1,000 100-500 60-330
Coach drivers 5,000 500-1,000 500-1,000 100-500 50-250 30-170
Total 65,000 6,500-13,000
6,500-13,000
1,300-6,500
650-3,250 410-1680
* Sample size large enough to allow for testing several different versions of the recruitment letter
** Assuming two interview lengths and two financial incentives plus one survey feedback, or an alternative soft reward approach, are tested.
The sampling approach and interview for fleet transport managers will also need to be piloted. For the purpose of the pilot it is recommended that a sample of 100 enterprises covering a range of activities and sizes is drawn from suitable lists and the questionnaire piloted with them.
Chapter 5 also includes detailed recommendations for assessing the execution of the pilot.
Chapter 6 contains the conclusions of the review. It explains that the recommended design of the main survey, for which this pilot is the development prototype, will make it feasible to use a much larger randomly-selected unclustered sample of users of the SRN than is possible with the current survey methodologies. The online approach will be designed to include mobile devices and, when coupled with a shorter more flexible questionnaire, will help to ensure that the survey is online-device independent and will allow respondents to answer using their smartphones if they so wish. It will be responsive to changes in the SRN as it develops and changes. The online approach will also make re-contacting respondents cheap

11
and relatively easy. The large database that will be created over time will provide a unique resource for ad hoc surveys and follow up interviews, both for quantitative and qualitative research.
Taken as a whole, the recommended survey design will provide Transport Focus with a uniquely powerful resource for measuring satisfaction with the SRN and identifying areas of weakness and strength in its performance.

12
1 Literature Review
1.1 Introduction Chapter 1 presents a review of evidence relevant to understanding and measuring road user satisfaction. In terms of its objectives it responds primarily to the criteria included in the original study brief from Transport Focus for the project, namely:
To understand what other relevant research exists, including any international
examples, and to identify key learnings and any gap
To consider the methodological challenges and experiences encountered in previous
roads research and other relevant areas.
During development of the project the scope of the review was refined to focus on:
1. identifying empirical knowledge from studies of customer satisfaction and wider
knowledge from traffic psychology about the factors that influence satisfaction with
transport systems, particularly roads;
2. reviewing the availability of contextual data which could assist in producing a
sampling frame for the survey and to provide objective measures to assist in the
interpretation of findings about satisfaction;
3. summarising the findings of previous road user satisfaction and other relevant
surveys undertaken in the UK and beyond;
4. understanding the extent to which methodologies used in previous surveys can be
regarded as successful and, where successful, considering their applicability in the
UK in terms of whether the particular question scopes and formats were essentially
tied to the chosen methodologies.
1.2 Conceptual context
1.2.1 Definitions of customer satisfaction
Strong claims have been made for the importance of understanding customer satisfaction. It has been suggested that such knowledge has ‘great value in understanding customers’ perceptions and evaluations’ (Oliver, 1997: cited in Felleson and Friman 2008, p.93.) In the context of the Strategic Road Network (SRN) understanding the ‘attitudes and experiences’ of road users has been seen key in informing changes in the network’s management (DfT, 2015, p.9). In a transport context Felleson and Friman (2008, p.94) have suggested customer satisfaction is ‘key to the future development of public transport.’ Satisfaction has also been claimed to be an ‘important indicator of future customer behaviour’ (Fornell, 1992; Johnson and Gustafsson, 2000: cited in Felleson and Friman, 2008).
Customer satisfaction can be conceived of as being part of a chain, coming between what a company or service provides and the ensuing behaviour of potential customers (Felleson and Friman, 2008). In respect to such a chain, the concept of customer satisfaction is often used in combination with the concept of service quality, the latter sometimes being considered an ‘antecedent’ of the latter (Stradling et al., 2007, p.99; Woodside et al. 1989).
Service quality is a comparison made by the consumer between what they expect from a service and the service’s actual performance, and can be ascertained from questions about whether customers’ experience of a service matched their expectations of it. A 26-item scale

13
called SERVQUAL has been used to measure service quality (referred to in Woodside et al. 1989 and Pantouvakis and Lumperopoulos, 2008).
However, customer satisfaction has been distinguished from service quality. Woodside et al. (1989) suggest that satisfaction particularly measures how much a customer likes or dislikes a service once having experienced it. Pantouvakis and Lumperopoulos, (2008, p.627) also propose there are differences between service quality and customer satisfaction as concepts. These include customer satisfaction including a broader and less defined measures of quality than service quality involves.
It should not be understood from the above that customer satisfaction is a simple causal link in a chain, connecting what the service provider does to how the customer will then respond. The satisfaction level of a customer also results from the priorities of the customers themselves. Thus, understanding satisfaction can inform an understanding of the relative importance of specific aspects of a travel experience (Pantouvakis and Lumperopoulos, 2008). Hence Stradling et al. (2007) suggest that transport studies examining satisfaction should include measures of what is important to users as well as their evaluation of the performance of the service. Following this rationale they explored a dissatisfaction measure that combined users’ evaluation of elements of transport modes as well as the importance users gave to each of those elements.
Customer satisfaction can also be disaggregated in other ways. Eboli and Gabriella (2007, p.22) suggest that customer satisfaction can be an overall evaluation or can be specific to a particular aspect of an experience. Pantouvakis and Lumperopoulos (2008) cite Rust and Oliver (1994) in suggesting that customer satisfaction may also have both evaluative and emotive aspects.
Customer satisfaction is often understood in a climate of choice, the customer being able to pick and choose between different products, thus concepts such as loyalty come into play (Pantouvakis and Lumperopoulos, 2008).
Therefore in the case of a road network, the ability to choose an alternative service will largely consist of using another mode of transport. Service quality is relatively easy to establish for the road network based on direct experience. Customer satisfaction is perhaps much more challenging as there is no service provider/customer interaction to directly share the emotive aspects of experience.
1.3 Factors which influence satisfaction – Academic and policy context
The section examines elements which may influence road user satisfaction. Themes are first taken from academic evidence surrounding the topic. These themes are:
travel-time
instrumental, affective, symbolic and identity factors
control and freedom.
1.3.1 Travel-time and perceptions of travel-time, and congestion
There are strong arguments for ‘time and financial costs of the trip’ being the two most important determinants of road user satisfaction (DfT, 2015a, p.1; Buys and Miller, 2011). Thus reducing journey time becomes valuable to the trip maker. Car commuters interviewed by Gardner and Abraham (2007) suggested that minimising travel-time was a major concern, and considered that spent time driving was ‘dead time’ in which other activities could not be pursued simultaneously (see also: Parkhurst et al. 1992). Similarly the journey time savings

14
that can be made by using the car mode can be valued by trip makers to an extent that outweighs factors such as environmental concern (Buys and Miller, 2011).
However, the valuing of journey time savings is not uniform. A reduction in journey time is valued more when the journey is in congested conditions (Handy et al., 2005). This may be because the level of traffic can affect the enjoyment of driving (Handy et al. 2005). This explanation is supported by Buys and Miller’s (2011) unsurprising finding that driving in heavy traffic is associated with stress. Handy et al.’s (2005) data suggested that congested conditions may be particular unwelcome (and thus reductions in travel-time particularly welcomed) due to the driver’s perception of their freedom being curtailed by the surrounding traffic. The importance of perceptions of control and freedom will be discussed below.
The importance of travel-time and travel-time savings can be gauged by ‘willingness-to-pay’. A study on express lanes in San Diego, U.S. showed that specific demographic groups were more willing to pay to use express lanes in order to reduce travel-time (Brownstone et al. 2003 Those more likely to be willing to pay in order to use express lanes included ‘commuters’, those from ‘higher income households’, ‘women’, those aged between 35 and 45, those with higher education level and ‘homeowners’ (Brownstone et al., 2003, p.386) In a review of evidence surrounding road pricing, Parkhurst et al. (2006, p.5) also suggest that certain groups are more likely to be willing to pay in order to reduce travel-time. These groups include the middle-aged, women and those in ‘small middle class households’. It might be initially assumed that such differences between demographic groups simply reflected income levels. However while the Department for Transport (2004, p.4) suggest that ‘the income of the individual traveller’ might affect people’s willingness-to-pay for a more expensive but shorter journey, so might ‘the value of the journey purpose, and its urgency, and the comfort and attractiveness of the journey itself’. In light of this they conclude that the willingness-to-pay for the same journey time reduction may vary by person, but also the willingness-to-pay of a person may vary for different journeys or sections of a journey.
The discussion has suggested that reductions in travel time are conducive to increased road user satisfaction. There is a caveat to this claim: car users can find uses for their time while travelling; although the extent and how travel time in the car is used, and its impact on the travel experience needs further research (Hislop, 2013). Lyons & Urry (2005) suggest that there can be a blurring between travel and activity time due to the activities that can be carried out on the move. Car drivers travelling for business may conduct desk-work and make phone calls for a wide range of reasons (Laurier, 2004), and Ferguson (2009) indicates the key role of the car for communication with clients and managing paper work for social workers. The wisdom of such activity may be questioned, due to the attendant dangers of being distracted and impaired whilst driving (Fitch et al., 2015). Laurier (2004) includes a description of a participant holding and reading a document whilst driving. Non-business activities can also be carried out while driving. These can include attending to ‘romance, family (and) friendship’ (Lyons & Urry, 2005).
1.3.2 Instrumental, affective, symbolic and identity factors
Many of the factors important in car user satisfaction, like the travel-time discussed above, can be classified as ‘instrumental’ factors. These relate to specific goals the user has for the journey, such as reaching a destination by a certain time. Besides travel-time they can include ‘financial costs’, ‘speed’, ‘convenience, flexibility, physical effort or exertion’, ‘ease of travel’, and ‘seamless journeys’(Gardner and Abraham, 2007, p.188; Buys and Miller, 2011, p.295; Parkhurst et al., 1992). These factors are undoubtedly important. For instance the

15
initial ease with which a car driver can enter their vehicle and the absence of interchange required thereafter are difficult for other modes to compete with (Parkhurst, 1992).
These ideas are supported in the qualitative research conducted for Transport Focus (Transport Focus, 2015) in the way in which people plan their journeys and enjoy the personal control the car offers drivers. However, Transport Focus’ research also demonstrated that the driving experience is shaped by affective factors, which other research has also found important (Gardner and Abraham, 2007, p. 188; Steg, 2005). Affective motives derive from the experience of travel itself. They relate to the pleasant or unpleasant aspects of the journey itself and can include ‘stress, excitement, uncertainty, safety, enjoyment and autonomy’ (Gardner and Abraham, 2007, p. 188, Parkhurst et al. 1992). Steg (2005, p.160) argues that motivation such as feelings may be important in car use. She points to car advertising as evidence of this and suggests for instance that some people may drive ‘because they love driving.’ This may be truer of some drivers than others, Gardner and Abraham (2007) found that some drivers seemed more concerned with utilitarian reasons for driving and others with affective reasons.
The affective aspects of a journey can vary according to instrumental factors, such as time available and destination. Gardner and Abraham (2007) suggest that different journey purposes may result in different motivations to drive being important. Similarly Buys and Miller (2011) found that the purpose of the journey affected the priorities the participant had for it, and thus the mode choice that would be made. This suggests that satisfaction with car journeys may be usefully disaggregated by journey length, purpose etc. Different aspects of the road use experience may have different relative importance for different types of journeys.
Positive affective factors within driving may be one reason that people sometimes drive more than is necessary (Handy et al. 2005). Handy et al. (2005) suggest that there are factors within the driving experience that can be valued, such as ‘watching the scenery’, being able to see wildflowers, ‘listening to the radio, getting out of the house, clearing one’s head.’ These contribute to a potential positive utility of driving. Such factors can influence route choice, and led to Handy et al.’s participants talking of preferring driving in the countryside.
Similarly to Gardner and Abraham’s labelling of ‘affective motives,’ Buys and Miller (2011) use the term ‘psycho-social factors’, which can include ‘community values,’ ‘attitudes and beliefs’ (p.290). While Buys and Miller’s study found the instrumental factor of time-efficiency to be the most influential factor in mode choice they also found psycho-social oriented factors such as ‘time of day,’ ‘perceived safety’ and the travel experience were also important to them (p.296.)
Both the studies of Gardner and Abraham, (2007) and Buys and Miller, (2011) suggest that instrumental and affective (or psycho-social) factors can overlap. Gardner and Abraham give the example that a delayed journey time can be disliked because of resulting negative emotional experience such as stress. As another example, the relative seamlessness of car mobility can give a sense of security in relation to household emergencies that might occur (Parkhurst et al. 1992). However Steg (2005) contests the notion that instrumental and affective factors overlap, arguing instead that the two groups of factors were distinct in the minds of her participants. Overall, there would seem to be a strong case though for suggesting that instrumental factors such as travel-time and convenience would feed into the affective experience of car travel.
Affective or psycho-social aspects that can be valued by those driving can be grouped into those that relate to the experience of driving itself and activities that can be conducted whilst driving. Of these, Handy et al. (2005) suggest that the latter seemed more valued by their participants. For instance the drivers used their time to have ‘time to one-self or time

16
to think.’ The drivers also observed their surroundings such as noting changes in their neighbourhood.
A method of measuring the affect experienced while travelling (a method that can be used across different modes) is the ‘Scale for travel satisfaction’ (De Vos et al., 2015, p.122). It builds on the core affect approach to understanding emotions which suggests they can be categorised according to arousal (ranging from ‘activated to deactivate’) and ‘valence’ or ‘pleasure’ (ranging from positive to negative). The scale draws on a hedonic understanding of well-being by measuring both positive vs negative affect whilst travelling, and also a cognitive evaluation of the journey. Hence the scale asks for Likert responses to measure scores between 6 pairs of affective opposites (De Vos et al. 2015, p.124). These are: Bored/Enthusiastic, Fed Up/Engaged, Tired/Alert, Stressed/Calm, Worried/Confident and Hurried/Relaxed. It also measures 3 pairs of opposite cognitive evaluations of a journey. These are: Travel was worst I can think of/Travel was best I can think of, Travel was low standard/ Travel was high standard, Travel did not work out well/Travel worked out well.
A further group of factors that may motivate car use (by being attractive aspects of it) are symbolic and identity factors (Steg, 2005, see also Parkhurst et al. 1992). Symbolic values are related to a person’s identity. They can be held to differing degrees by different demographic groups. Younger respondents have been found to place greater symbolic and affective value on their car use than older people (Steg, 2005). Similarly those on lower income groups placed greater symbolic and affective value than those on higher incomes. Identity factors can relate to either individual or group identities. Gardner and Abraham, 2007, suggest that group identity factors such as being ‘a motorist’ or ‘a resident’ can be important in the driver’s experience of driving.
Steg (2005) explored both affective and symbolic factors in car use. She found strong evidence that such factors were important in car use, even for commuting journeys. However she also notes that people are reluctant to admit to the symbolic and affective motivations behind car use if they are asked about them in a straight forward way. Instead they tend to focus on instrumental aspects. But if they are asked in more subtle ways they reveal that symbolic and affective aspects are important.
The Transport Focus’ research uses similar ideas to create four segments of road users which it calls ‘Invincible, Cavalier, Nostalgic and Reluctant’ (Transport Focus, 2015). The characteristics of each group is related to the level of and duration of driving experience (e.g. professional v vulnerable drivers) and perceptions of risk, and these factors are important to understanding the breadth of road user identity. There is an assumption that these variations may impact on perceptions and attitudes related to the SRN. For instance, a bad experience may be prompted by a situation where the driver feels less in control of the driving situation than usual.
1.3.3 Control and freedom
Alongside travel-time, control is a central underpinning theme in the attractiveness of car use. Gardner and Abraham (2007) explored five motives for car use from their data but suggest that the meta-theme underpinning all these is that of having control. Car drivers can enjoy the feeling of control over the physical space they have in the car, the social interaction they enjoy whilst in the vehicle, their ability to start car journeys when and where they like, and to improvise their route choice. Evidence suggests that the greater the sense of personal control over aspects of the journey the more positively the driver will view the journey and that a high level of perceived control can result in improved levels of well-being (Transport Focus, 2015; Gardner and Abraham, 2007). Steg (2005, p.148) suggests some affective attractions of car use that might relate to a sense of control: feelings of

17
‘power, superiority and arousal.’ Gardner and Abraham suggest that the positives relating to sense of control can even outweigh the negatives of increased journey times. They also suggest that car drivers tend to overestimate the level of control that they have over their car journey relative to public transport trips. This raises the possibility that perceptions of control may not be accurately correlated with objective levels of control.
Linked to the concept of personal control while driving, is the perceived freedom that comes from car use. Handy et al. (2005, p.200) suggest that this sense of freedom is a major positive factor associated with car use. Hence experiences that can restrict the driver’s sense of ‘control and freedom’ can be received negatively (Gardner and Abraham, 2007). These might include policy (Gardner and Abraham, 2007) or high levels of traffic (Handy et al. 2005). The latter may result in a reduction of personal control and freedom that can remove the perceived advantage in choosing car over public transport (Parkhurst et al., 1992).
The following section moves forwards from this discussion of the academic and policy context of factors which influence driver satisfaction to consider how the experience of car travel has been captured and represented in existing examples of road user satisfaction surveys.
1.4 Existing Road User Satisfaction Surveys This literature review has confirmed that there is a very broad range of existing customer satisfaction surveys with a transport focus, and it has therefore been necessary to select a sample of these based upon their potential use in informing the design of a new road user satisfaction survey.
Table 1 below presents contains a review of the content/methodology of selected road user satisfaction surveys, and following this there is a more detailed analysis of those which are most relevant in the context of this review:
Table 1 - Examples of existing road user satisfaction surveys from the UK and elsewhere
Source Extent Type
National Road Users’ Satisfaction Survey (NRUSS) England Survey
https://www.gov.uk/government/publications/national-road-users-satisfaction-survey-nruss
Last trip methodology, survey form focusses on satisfaction with the previous trip made on the SRN, supplemented with some general satisfaction/perception questions. Participant indicates when last journey occurred up to 12 months prior to interview. Last journey recall appears to be any time in last 12 months. The NRUSS uses household quota sampling to collect approximately 2000 responses. Approximately even numbers of participants are selected from each geographical region of England. User categorisation by mode and journey purpose allows some indication of commercial usage; however this is not subject to a specific analysis within the report.
National Highways and Transport Survey (NHTS) Great Britain (participating Authorities)
Survey
http://nhtsurvey.econtrack.co.uk/

18
Source Extent Type
The NHTS is an ‘opt-in’ survey in which Local Authorities can pay to take part. The survey uses general satisfaction questions about people’s experiences in their local area, asking them rate different aspects of their area on a 5 point Likert scale (from Very satisfied to very dissatisfied), accompanied by a number of ranking questions to explore people’s priorities for improvements. The NHTS uses random household sampling via postal survey to collect data from residents in each of the participating LA. A minimum of 3,300 postal surveys are sent out to households in each Authority, with LAs able to ‘opt-in’ to more surveys in their area if they desire. Some data is collected on people’s normal mode of travel and journey purpose, and some data on satisfaction by mode can be drawn out of reports created from the data, however it is not a specific analysis of commercial usage.
Transport for London Road Network (TLRN) Customer Satisfaction Survey
London Survey
https://www.tfl.gov.uk/cdn/static/cms/documents/tlrn-css-2012.pdf
The TLRN customer satisfaction survey uses the TNS online panel (Lightspeed) to construct the survey sample. The actual questionnaire is not in the public domain. Participants are selected based on their having used the TLRN in the previous month. The survey is multi-modal, and includes disaggregated satisfaction ratings from:
Car users
Pedestrians
Cyclists
Motorcyclists
Bus passengers
Commercial/emergency drivers The sample is weighted to account for any significant demographic bias. In 2012 the TLRN survey returned responses from 3,538 participants, recording data from a total of 8,270 trips (respondents are able to enter data for multiple trips). The survey asks satisfaction questions about a number of aspects of people’s experiences of using the TLRN. Satisfaction is rated by participants on a scale of 0-10, and the mean scores are then multiplied up to provide a score out of 100. Specific questions ask about journeys taken in the last 3 months, and a general overall satisfaction for the last year. This survey is particularly relevant in the context of the New RUSS as it provides a disaggregation by commercial users in a number of its analyses.
91 Express Lanes customer survey California Survey
https://www.91expresslanes.com/publications.asp
The 91 Express Lanes Survey asks customers about their use of toll lanes. Questions focus on use of the lanes and of people’s perceived value of paying for the use of dedicated highway lanes. The survey uses a stratified sampling approach using customer records, and has a sample size of 1000. Respondents can either take part in a telephone interview or choose to fill in the survey form online. This survey collects data on users’ journey purposes, however does not collect data on mode and there is no specific analysis of commercial users.

19
Source Extent Type
European Road User Survey (ERUS) Europe Survey
http://www.cedr.fr/home/fileadmin/user_upload/Publications/2007/e_ERUS_2006.doc
The ERUS aimed to provide an international perspective on satisfaction with national roads. International road users were asked to evaluate the networks of a country they had recently visited, as well as commenting on the network or their own country. The survey focussed on the most recent trip for experiences of a network in a foreign country, and on recalled experiences for the network in the home country. This creates an unusual methodological system in which most-recent trip experience is used as a direct comparator to more generally recalled experiences. Manual surveys were conducted out at border crossings between countries (either at the side of the road or on board ferries), with an equal number of surveys collected at each border point chosen. 200 responses were collected at each border crossing, and the sample was stratified by vehicle type (lorries, coaches, cars). In total 3,679 responses were collected. Drivers leaving a country would be asked to comment on the roads in the country they had just visited, and then also to comment on their home network. The ERUS a useful example of a large-scale international RUSS. The ERUS collects data on whether participants were car drivers or lorry drivers, alongside other demographic information, however this is not used extensively in the analysis, and the main disaggregation of users is by nationality.
Eurobarometer Quality of Transport Europe Survey
http://ec.europa.eu/public_opinion/archives/ebs/ebs_422a_sum_en.pdf http://ec.europa.eu/public_opinion/archives/ebs/ebs_422a_en.pdf
A special report produced for the European Commission by TNS. Its aim is to produce statistical insights to a range of policy and decision makers, thus it provides an overview of multiple modes. Journey satisfaction is considered in relation to those of a distance of more than 300km, across all modes, and reports on Likert values for:
Value for money
Archiving expected journey time
Level of amenities for passengers
Perception of safety It also asks if there is a perceived change – better/worse - in any of the main modes (road, rail, air and water) over the previous 5 years also evaluated on a Likert scale. One section of the questionnaire is dedicated to the driving experience and covers three main areas:
the most serious problems affecting roads
the priorities for improving safety on roads
acceptability of having the vehicle technology connected for traffic management The key drivers of satisfaction for public transport are not all applicable to the context of the SRN and driving. However, the one issue that is universally applicable to all modes is time: perceptions and expectations about punctuality and journey duration. Within the public transport sector, customer dissatisfaction is shaped by the operator’s response in managing the impact of delays, and this issue is relevant to the roads context, and examined further in Chapter 2. Comfort and space are other factors in the public transport experience which are also likely to affect the driving experience, but with the important difference that these are aspects that Highways England cannot directly affect in the main. However, there are exceptions, as aspects such as road surface and noise or spray may interact with the perception of comfort. This group of factors is also discussed further in Chapter 2.

20
Source Extent Type
Motorway Services Ratings England ‘Crowd-sourced’ ratings
http://www.motorwayservices.info/ratings
The motorway services ratings follow a different format to the traditional customer satisfaction approach, and use an online portal (http://www.motorwayservices.info/ratings) asking users of the service areas to rate their experiences as positive, negative, or neutral. Respondents are also given the option to indicate whether they feel the services cater well to a range of user groups (truckers, families, caravans, disabled drivers and passengers, dog owners). The results of these ratings are then used to calculate an overall rating score (from 1-5) which is displayed on the website in comparison to other service stations, and people are invited to leave comments to further describe their experiences.
National Travel Survey (NTS) England (since 2013)
Survey
https://www.gov.uk/government/collections/national-travel-survey-statistics#publications-released-during-2014
The NTS is not specifically a satisfaction survey; however is perhaps the primary example of a large-scale transport survey in England. The NTS uses a random sampling strategy to compile a list of households from the Postcode Address File. At total of 12,864 households were sampled for the most recent NTS. The NTS followed a self-completion travel diary approach distributed to all members of the household which collected people’s travel habits over the course of a week. The ‘travel week’ was preceded by a face-to-face set up interview, and a subsequent face-to-face collection interview. The national travel survey disaggregates its users by journey purpose and mode, giving an indication of commercial usage. The analysis reports include a section exploring commuting and business trips; however the reports do not include a specific analysis of commercial usage.
TNZ: State Highway User Survey 2006 New Zealand Survey
http://www.nzta.govt.nz/resources/state-highway-user-survey/state-highway-user-survey.html
The TNZ survey aimed to monitor satisfaction with state highways in New Zealand over time. Users were asked a series of questions related to their use of highways, awareness of highways authorities and available travel information, and levels of satisfaction. Satisfaction was recorded using 5-point Likert scales. The survey was conducted as a phone interview. The survey used a random quota sampling method to identify approximately 1,500 households (at least 200 in each NZ transport region), and alongside the random sampling strategy contact information from other surveys was used to bolster the proportion of truck drives included in the survey. This resulted in 325 truck drivers within the total sample. Demographic data were collected. Due to the focus on truck drivers in this survey, the analysis includes a regular comparison between the experiences of the general sample and the experiences of truck drivers.

21
Source Extent Type
Road user satisfaction survey on the completed section of the golden quadrilateral
India Survey
http://www.lpcb.org/index.php/component/docman/doc_view/11123-2006-india-road-user-satisfaction-survey-on-the-completed-sections-of-the-golden-quadrilateral?Itemid=32
This survey sought to understand satisfaction with the newly-constructed Golden Quadrilateral highways in India. This represents an extensive satisfaction survey, covering a broad range of questions, ranging from more general satisfaction with conditions on the road, levels of congestion, road surfacing, and signage, to understanding people’s main ‘irritants’ and the levels of demand for new amenities. His survey is another example of a toll context, and so people’s satisfaction with the highways can be linked to their perceptions of value. The survey used 32 variables to create a Road User Satisfaction Index (RUSI). “The key factors affecting road users’ satisfaction were extracted using principal component analysis. Seven key factors were extracted. Based on the variables in each factor they were named as value for money and time, visual appeal, signage, travel amenities, accessibility to settlements, safety and tax” (MDRA, 2006, p. 13). The weighting for each factor was then discerned through a regression analysis. An overview of the RUSI is included at the bottom of this example. The survey included 19,816 personal interviews conducted with road users via a random strategy at roadside locations (checkpoints, hotels, restaurants, and tollgates) along stretches of the highway. The segments of highway to be included in the sample were derived as a proportion of the total length of the new highway, and the length of each segment was determined by the total number of cities/commercial hubs along it. Where the selection of road users was random, there was an effort to include the views of vulnerable road users in the sample, and the final sample contained 16,302 main users and 3,014 vulnerable users. The survey was then supplemented with depth interviews with stakeholders (local businesses, roadside hotels, etc…) and road representative bodies. In this aspect this RUSS had a unique focus on commercial users, and even went so far as to include the views of ‘indirect users’ of the network (i.e. those businesses which make use of the network in some indirect way, such as roadside restaurants, hotels, etc…). The survey itself disaggregated users by mode type, and there is some consideration of commercial users in the analysis however no specific analysis of the commercial users as a group. There is a further example of the same approach in India, with the survey ‘Road user satisfaction survey in the state of Himachal Pradesh’.

22
Source Extent Type
(MDNA, 2006, p. 14)

23
Source Extent Type
Crossroads: RUSS Uganda Survey
http://www.ugandaroadsector.org/reports/2012%20Road%20User%20Satification%20Survey.pdf
The crossroads survey aimed to track users’ satisfaction with roads in Uganda across time in a longitudinal study, in order to monitor the performance of the road sector and to assist with making investment and improvements. The survey investigated general levels of satisfaction with roads, reasons for satisfaction/dissatisfaction, perceptions of safety, delays, and people’s (hypothetical) willingness-to-pay tolls for the use of roads. Quota sampling was employed in this survey, the participants stratified by user type (truckers, motor cyclists, car drivers, bus drivers, cyclists, and passengers). The sample was split across six regions in Uganda. The survey was conducted at the roadside on randomly selected stretches of road, and achieved a total sample of 2857. User categorisation by mode and journey purpose allows some indication of commercial usage. The report includes a regular disaggregation by mode, and the discussion briefly considers satisfaction for different user groups.
RUSS: Karnataka India Survey
http://www.kpwd.gov.in/pdf/reports/RUSS%20-II%20FINAL%20REPORT.pdf
This RUSS sought to help senior management improve road conditions in Karnataka by helping them to understand the issues and concerns of different groups of road users. The aim of the survey was to help influence future strategic and operational decisions. The survey involved a sample of 6,484 structured interviews (questionnaires) with road users, supplemented by 700 in-depth interviews with key stakeholders, and 25 focus groups with different groups of road users. The survey sample was split geographically into the 27 districts in the state of Karnataka, with the total sample size of each district based on the population of that district. Within this, population centres were selected using systematic random sampling, stratified by their proximity to different road classes. Within each of the population centres, households were selected for participation and interviewed face-to-face. Supplementary approaches were used to recruit and survey different road user groups such as truckers and bus drivers. In these cases, drives were interviewed at key halting points (petrol stations, etc).
1.4.1 National Road Users’ Satisfaction Survey (NRUSS)
The Highways Agency (now Highways England) has conducted the National Road Users’ Satisfaction Surveys (NRUSS). The Highways Agency gave the objectives of the NRUSS as being to:
Monitor the performance score based on the last journey made on the network; and
Understand the causes of satisfaction and dissatisfaction with use of the network and Agency services. (Highways Agency, 2014, p. 3)
The NRUSS was subject to an extensive review in 2010, following which the questionnaire was updated (Highways Agency, 2010). This review considered how satisfaction could best be measured, as well as what should be included in the key performance indicators, and the way in which data could be meaningfully presented. It drew on extensive qualitative research to understand road users, their concerns and ability to recall trips on the SRN (last

24
trip and more generally). It assessed specific questions and the types of scale on which satisfaction could be measured, the outcomes of which are discussed below.
The methodology for NRUSS is household interviews administered using Computer Assisted Personal Interviewing (CAPI). 500 sample points based on Output Areas are randomly selected from across England so that there is an equal number in each of the Agency’s seven regions.
To be eligible to take part in the survey, respondents must be aged 17 or over and have used the SRN at some time in the 12 months preceding the interview. Interviews are conducted in the respondent’s home using CAPI. 1.2.3 Four respondents from within each sample point are then selected to quota, so that the resulting sample overall reflects the following structure:
Age Between 25% and 33% aged:
17-34;
35-59;
60+ Driver/Passenger
75% who usually travel on motorways/trunk roads as a driver
25% who usually travel on motorways/trunk roads as a passenger Gender
50% Males
50% Females Working Status
50% full time workers,
50% non-full time workers Frequency of Use
50% who use the motorways/trunk roads once a week or more (frequent user)
50 who use the motorways/trunk roads less than once a week (infrequent user) (Methodology extracted from: Highways Agency, 2014b, p. 4) The NRUSS contains a broad range of questions about people’s experiences of using roads. The full list questions included in the survey can be found in Appendix 1. To date the data have been used by the SRN operator to produce a detailed statistical report on a range of different measures of satisfaction. This more detailed statistical summary is also condensed to produce an overall figure for satisfaction with the network. The NRUSS focusses on ‘five key aspects of the most recent journey undertaken on the Agency network’. These aspects are given as:
Journey time
Safety
Roadworks management
Upkeep of the network
Information provision

25
Taken together, these five key aspects were used to produce an overall ‘performance measure’ for the SRN, and this measure was reported to the former Highways Agency monthly. As an example of this output, in the most recent NRUSS annual report for 2013/14, the overall performance measure for all journeys was 89.63(%) – taken to indicate a high level of customer satisfaction with the network.
The NRUSS is a very detailed survey and produces a significant amount of statistical output on a range of different measures of satisfaction. However whilst this survey covers a broad range of the more instrumental factors which might be involved in drivers’ sense of satisfaction with their journey, it is limited in the extent to which it probes the affective, psycho-social experience of the journey – as discussed in the previous section. There is the potential for the more instrumental analysis of driver satisfaction represented by the NRUSS to be combined with an approach such as De Vos et al.’s (2015) Scale for Travel Satisfaction – enabling a ‘triangulation’ of instrumental and affective/psychological responses to provide a fuller understanding/representation of the experience.
1.4.2 National Highways and Transport Survey (NHTS)
The NHT Public Satisfaction Survey is an example of a broader transport satisfaction survey, which is conducted at the Local Authority (LA) level, and focusses on responses from residents living in a particular area. The NHTS is conducted by Ipsos MORI, and managed by ‘measure2improve’. The purpose of the NHTS is as a benchmarking survey, conducted with the aim of helping all participating highways and transport authorities improve their service to the public by finding out:
What service areas need improving most?
Which service areas have most potential to improve?
Who should improvements be targeted at?
Where should improvements be made?
How can improvements be delivered?
The NHTS is a postal survey, open to anyone over the age of 16 living at an address which receives the NHTS questionnaire. Ipsos MORI generates the sample from the Small Users File which is a sub-file of the Postal Address File. A random probability sampling approach is used. This means that each address has a known, and equal, chance of selection. This is the methodology used for the Government’s Place Survey (formerly, the BVPI survey) (measure2improve, 2014).
Given that the NHTS does not have a sole focus on road users, the survey contains a more limited number of questions related to highways than the NRUSS; however these are nonetheless potentially relevant, both as examples of questions exploring people’s satisfaction with roads, and also as a potential source of local comparison to people’s experiences of the SRN.
Questions in the NHTS related to roads are included below:
Views on Transport and Highways services:
Safety of local roads
Levels of traffic and congestion
Provision of street lighting
Condition of roads
Overall satisfaction

26
Views on the condition of roads and pavements:
Condition of road surfaces
Cleanliness of roads
Condition of road markings
Condition and cleanliness of road signs
Provision of street lighting where needed
Speed of repair to damaged street lights
Speed of repair to damaged roads and pavements
Quality of repair to damaged roads and pavements
Maintenance of highway verges, trees, and shrubs
The provision of drains along the sides of roads
Keeping drains clear and working
Amount of potholes compared to previous year Satisfaction with the way the Local Authority:
Deals with potholes and damaged roads
Deals with obstructions on pavements
Keeps roads clear of obstructions such as skips/scaffolding etc…
Deals with illegally parked cars
Undertakes cold weather gritting (salting) and snow clearance
Provides information to residents on cold weather gritting (salting) and snow clearance
Cuts back overgrown hedges obstructing the highway or hiding road signage
Deals with mud on the road
Deals with abandoned cars
Deals with flooding on roads and pavements Views on roadworks:
Notice of roadworks before they happen
Efforts to reduce delays to traffic
Time taken to complete roadworks
Signposting of road diversions
Availability of helplines to find out about roadworks
Efforts to minimise nuisance to residents caused by roadworks Views on managing traffic:
Clarity of road signs
Location of permanent traffic lights
The waiting time at permanent traffic lights
Measures to tackle illegal on-street parking
Restrictions of parking on busy roads
The routes taken by heavy good vehicles Views on road safety:
Speed limits being right for local roads and not too high or too low
The enforcements of speed limits
The number of speed control measures
The location of speed control measures

27
Participants’ use of transport:
Household car ownership
Personal levels of driving
Car sharing (outside of household)
Mode use
Mode use by journey purpose
Ease of accessibility to local amenities and services It is likely that a number of these questions might not be relevant to most of the roads comprising the SRN (for example questions relating to pavements or on-street parking), however at the same time the NHTS provides a useful set of examples of what is seen to be important to people in terms of their local roads.
1.4.3 Transport for London Road Network (TLRN) Customer Satisfaction Survey
The TLRN customer satisfaction survey generates data on all of the modes which use the TLRN. The survey includes a number of different categories of satisfaction – with some questions aimed at all users, and some which are mode-specific.
The TLRN tracks levels of satisfaction longitudinally in relation to all previous years back to the 2010 baseline (its first year). In this way, levels of satisfaction both at the aggregate level and amongst different user groups can be monitored over time.
This survey has two features which are of particular relevance in the context of the New RUSS:
1. Its consideration of users of all modes which use the network. First, it is important to note the survey’s inclusion of commercial/emergency drivers as a specific modal category. The interviews with stakeholders (see Section 5) have identified commercial and freight drivers as potential “priority users” of the SRN, and as-such it is important to be able to identify and analyse the views of these road users. The TLRN survey provides an example of this in practice, and commercial drivers have a number of specific questions (e.g. ‘time of day allowed to stop in loading bay’, ‘time allowed to pick up and drop off in loading bay’).
Related to this point is the inclusion of pedestrians, cyclists, and public transport passengers as road users alongside drivers. Chapter 2, following notes these groups were identified in the stakeholder interviews as potential “priority users” of the SRN – this time from the perspective of their relative physical vulnerability in terms of using the network (i.e. cyclists cycling along the SRN, pedestrians crossing it, and bus passengers having to stand next to it at bus stops, etc…). Whilst it may be the case that the New RUSS focusses at its core on drivers, it is important to note the value in having a multi-modal perspective on the different aspects of customer satisfaction which are relevant to a network with which many different types of road user must interact. In the TLRN survey, the inclusion of more vulnerable road user groups serves to highlight the importance of a number of different elements of customer satisfaction which would be lost in a driver-only survey, for example: ‘ease of crossing side roads’, ‘pedestrian crossings where you need them’, ‘availability of cycle lanes’, ‘condition of cycle lanes’, ‘condition of pavements’, etc…
2. The use of secondary data in analyses. The TLRN survey utilises operational data in its analyses as a comparator for people’s perceptions of the network. As an example, perceptions of disruption are compared to empirical data on the actual numbers of different types of disruption. This comparison provides insight into the areas in

28
which people’s perceptions of issues are out of alignment with the actual situation on the roads, and could therefore be a useful tool in helping to manage people’s expectations through focussing on those issues which are of greatest salience – which can be demonstrated where respondents perceive issues to be much more prevalent than they in fact are.
1.4.4 State Route 91 Express Lanes Satisfaction Survey (91SS)
The 91SS is an international example of a road user satisfaction survey, conducted on users of the Orange County Transportation Authority’s (OCTA) Route 91 Express Lanes (toll) scheme. A toll is operated on express lanes adjoined to the ‘normal’ highway, and drivers that pay a premium are able to use these lanes with the expectation of avoiding traffic and reducing their journey times.
This survey is interesting because of its commercial context – being focussed on users of a toll road. Understanding the experiences of drivers that are directly paying to use a road presents the opportunity to better understand the value people place on their driving experience, and also what the expectations of a highways authority are in this more classical ‘consumer’ scenario i.e. a transaction in the form of a specific payment for a particular road trip.
The aim of the 91SS is to:
Profile customers’ travel behaviour on the 91 Express Lanes, including frequency and time of use, trip purposes, as well as origin and destination
Identify the relative importance that customers place on specific performance aspects/standards when traveling on the 91 Express Lanes
Measure customers’ overall satisfaction with their 91 Express Lanes experiences, as well as how well they feel the 91 Express Lanes is meeting specific performance standards
Measure customers’ perceptions of OCTA’s management of the 91 Express Lanes
Identify customers’ current exposure to OCTA’s communications, as well as their preferences with respect to future communications efforts
(True North Research, 2011)
The 91SS report includes an analysis of the performance needs and priorities of the 91 Express lanes. It identifies three priority areas for improvement:
Strengthening the relationship between perceived convenience and the cost of the lanes
Making it easier to get in touch with a customer service representative
Increasing the perceived use of tolls to improve the 91 Freeway
The report also details the significance of perceived time savings, i.e. the amount of journey time saved by paying customers on these toll roads in comparison to those drivers using the ‘normal’ non-priority lanes. The majority of users listed the journey time and travel-time savings as extremely important to them in their use of the 91 express lanes. This links back to the discussion of willingness-to-pay in relation to travel-time savings in the previous section (see: Brownstone et al., 2003).
These findings are interesting as they provide a direct insight into the notion of ‘value’ in relation to the use of roads. The results of the surveys show that primarily these drivers (customers) want to see that they are getting good value for money, both through a

29
significant time-saving in relation to those not paying, and also in terms of their tolls being used to improve infrastructure. It further demonstrates the importance of customer service to drivers that are paying to use toll roads. These drivers expect to be able to easily get in touch with a customer service advisor, as one might in any other consumer context.
The consumer context of the 91SS is different to non-consumer situation in the UK (although there might be some direct comparability with the few examples of SRN tolls: the M6T and certain bridge and tunnel infrastructures). However it is useful to consider the key perceived factors of the customer/service provider relationship and the effects of this upon customer satisfaction, as these could be relevant to any authority such as Highways England which is seeking to maximise customer satisfaction on the roads. It is also relevant when considering any future move towards greater use of toll roads in the UK.
1.4.5 National Rail and Bus Passenger Surveys
The National Rail and Bus Passenger Surveys are conducted by Transport Focus, and are large-scale customer satisfaction surveys employed to understand passenger experiences on trains and buses across Great Britain.
Passenger satisfaction surveys operate in a different consumer context to road user satisfaction surveys in Great Britain. The relationship between a passenger and the service provider (rail or bus) is more typically ‘consumer’ – in that there is both an established/understood ‘customer’ and a ‘service provider’, there is the (albeit often limited) opportunity for the customer to choose an alternative service, and there is frequent customer/service provider interaction during use of the service. For drivers this is not the case: there is little opportunity to choose another ‘service’ on the same mode, there is little/no interaction between drivers and ‘service providers’ when they are using the roads, and furthermore there is little established cultural understanding of road users as ‘customers’.
As such the passenger satisfaction surveys have limited value as a direct example of questions that could be included in a road user satisfaction survey. However it is useful to consider the different categories of satisfaction included in these surveys, and also the key drivers of satisfaction in this context.
The National Rail Passenger Survey (NRPS) is conducted mostly by handing out questionnaires to passengers waiting to board trains, who are provided with a mail-back envelope for their completed form. Each wave of the survey returns at least 29,000 completed forms, and the data is weighted to accurately represent journey purpose (Passenger Focus, 2014a). The survey collects responses in the form of a 5-point Likert scale from ‘very satisfied/good’ to ‘very dissatisfied/poor’, and overall satisfaction is given as an average of these.
The Bus Passenger Survey (BPS) is conducted using a questionnaire handed out to bus passengers while they are on the bus, following an interaction with a surveyor on the vehicle. The questionnaire asks passengers to rate that journey’s experience. Responses are given in the form of a 5-point Likert scale ranging from ‘very dissatisfied’ to ‘very satisfied’, and overall satisfaction is presented as a percentage of those that are satisfied (Passenger Focus, 2014b).
The NRPS reports on 33 different categories of rail passengers’ satisfaction with their journeys:
Overall satisfaction with the journey
The value for money of the price of the ticket

30
Punctuality and reliability of the train
Sufficient room for all passengers to sit/stand
Overall satisfaction with the station
How well the train company dealt with delays
The BPS reports on six categories of bus passengers’ satisfaction with their journeys:
Overall satisfaction with the journey
Satisfaction with value for money
Satisfaction with punctuality
Satisfaction while sitting on the bus
Satisfaction with on-bus journey time
Satisfaction with the standards of the bus driver
Experiences of anti-social behaviour on the bus
The NRPS includes a ‘key drivers analysis’, which identifies the most statistically significant factors in overall passenger satisfaction. Usefully, the analysis also includes a list of the key drivers of dissatisfaction.
Key drivers of customer satisfaction with rail travel
1. Punctuality/reliability
2. Cleanliness inside train
3. Journey length (speed)
4. Ease of getting on/off train
5. Comfort of the seating area
Key drivers of customer dissatisfaction with rail travel
1. How train companies dealt with delays
2. Punctuality/reliability
3. Sufficient room for all to sit/stand
4. Ease of getting on/off train
5. Journey length (speed)
The key drivers of satisfaction for public transport are not all applicable to the context of the SRN and driving. However, the one issue that is universally applicable to all modes is time: perceptions and expectations about punctuality and journey duration. Within the public transport sector, customer dissatisfaction is shaped by the operator’s response in managing the impact of delays, and this issue is relevant to the roads context, and examined further in Chapter 2. Comfort and space are other factors in the public transport experience which are also likely to affect the driving experience, but with the important difference that these are aspects that Highways England cannot directly affect in the main. However, there are exceptions, as aspects such as road surface and noise or spray may interact with the perception of comfort. This group of factors is also discussed further in Chapter 2.

31
1.4.6 Transport Statistics for Great Britain
The Department for Transport (DfT) collects and reports a wide range of empirical data on the use of the UK transport network. These statistical outputs are collected together under the title ‘Transport Statistics for Great Britain’. These datasets are potentially valuable in providing network performance data in terms of factors such as vehicle throughput, vehicle speeds and safety rates.
1.4.7 Question formats
Existing examples of RUSS’s and other relevant satisfaction surveys show that there is not a great deal of diversity in the ways in which satisfaction questions are posed to customers. All of the surveys follow a relatively similar structure to their questions – which in essence all involve a subjective rating of different aspects of ‘satisfaction’ on an abstract scale.
To illustrate, below are a number of examples of similar satisfaction questions from the surveys presented above:
NRUSS:
“How satisfied or dissatisfied would you say you were with the journey time between [place] and [place] for the section of the journey that was on trunk roads (shown in red on the map)?”
o Very Satisfied
o Fairly Satisfied
o Neither satisfied nor dissatisfied
o Fairly dissatisfied
o Very dissatisfied
o Don’t know
NHTS:
“Now thinking about roads and transport locally, how satisfied or dissatisfied are you with traffic levels and congestion?”
o Very Satisfied
o Fairly Satisfied
o Neither satisfied nor dissatisfied
o Fairly dissatisfied
o Very dissatisfied
o Doesn’t apply/don’t know
TLRN Customer Satisfaction Survey:
No survey form publically available, however included in the report is this comment on the survey methodology:
“Satisfaction questions are scored on a scale of 0-10, where 10 is extremely satisfied and 0 is extremely dissatisfied” (TfL, 2012, p. 28).

32
91 Express Lanes:
“Overall, are you satisfied or dissatisfied with your experiences when using the 91 Express Lanes?”
o Very satisfied
o Somewhat satisfied
o Somewhat dissatisfied
o Very dissatisfied
o Not sure
o Prefer not to answer
ERUS:
No survey form publically available, however included in the report is this comment on the survey methodology:
“In the survey, respondents were asked about satisfaction and the importance of several aspects. Both were measured on a 5-point scale: ‘1’ means extremely dissatisfied and ‘5’ means extremely satisfied” (CEDR, 2006, p. 7).
TNZ:
“Thinking about reducing congestion and improving traffic flows, how would you rate the management of this?”
o Excellent
o Very good
o Good
o Needs some improvement
o Needs a lot of improvement
o Don’t know/refused
Crossroads RUSS:
“On a scale of 1 to 4, how would you rate this road regarding (key road attribute listed)?”
Whilst every survey asks questions in a slightly different way, all of the examples follow a very similar format, and it is not easily possible to determine if one form of wording or type of scale is particularly better or worse at exploring participants’ actual levels of satisfaction with their experience of the road.
The fact that this common format of satisfaction question is included in all of the main survey examples suggests that it is sufficient for determining a meaningful/useful representation of people’s experiences. At the same time the academic literature considered earlier in the Chapter points to a much richer interpretation of subjective experience which might be useful for gaining a more in-depth understanding of road users’ levels of satisfaction.

33
There is merit in considering a survey design which attempts to account for the affective factors (or ‘psycho-social factors’) which influence journey experience – such as stress, anxiety, autonomy, pleasure, and control. These factors have been suggested to overlap with more instrumental factors such as delays.
In practical terms this might be a task that is beyond the practical scope of a large-scale RUSS, however it is worth noting the importance placed on these affective experiential factors in the academic literature.
1.5 Summary This final section of the literature review considers the lessons from previous studies, including existing road user satisfaction surveys discussed in the previous sections. It also draws upon a recent report (Calvert et al. 2015) which summarises important themes from the National Road User Satisfaction Survey (NRUSS) and other sources concerning road user expectations of and satisfaction with the strategic road network (SRN).
A key idea in relation to user satisfaction with the SRN is that it is linked to pragmatic user expectations. Thus the former Highways Agency reported that people they surveyed might not have raised congestion as an area to improve because it ‘appears to be accepted as a ‘fact of life’’ (Highways Agency, 2013, p.10). More generally qualitative research by the Department for Transport (2015, p.1) found that:
‘Satisfaction with SRN roads derives from the extent to which road users’ expectations of the journey outcomes and driving experiences that the roads deliver are met.’
The important point to make then is that ‘an important part of managing satisfaction with road conditions is to manage expectations’ (Calvert et al., 2015). This echoes the definition of service quality given above which can be understood as the comparison made by the consumer between what they expect from a service and the service’s actual performance. This comparison may be key within the broader range of likes and dislikes which form the customer satisfaction with the road network. There is some evidence that when expectations about a journey, such as expected journey time are more highly defined and precise, then satisfaction with the actual journey time may be reduced (Highways Agency, 2013).
If satisfaction may be influenced by expectations, these expectations in turn may be influenced by previous experience. For example, previous experience enables road users to factor in expected delays to their journey and even consider them ‘normal’. This can lead the user to feel in ‘control of their outcomes and experience’ (DfT, 2015, p.1: cited in Calvert et al. 2015). Survey evidence then, like academic evidence, highlights the importance of perception of control in road user satisfaction.
Satisfaction with road trips can be disaggregated in a number of ways. The academic studies discussed above raised the assertion that different groups of people may have different perceptions of their journey (in particular the different groups that might pay differing amounts to reduce journey time were discussed.) The NRUSS also provides information on user satisfaction disaggregated by groups of people, such as personal and business users. It also examines differences by demographic factors, although finding that ‘there were no significant differences in satisfaction ratings (with the Highways Agency) by age, gender, health or ethnicity’ (Highways Agency, 2013, p.9). Building on the academic studies set out above, a further possible avenue for disaggregating user satisfaction by user type might be along more affective lines. Possibly affective profiles of different types of user and their satisfaction with the road network could be explored. These might provide greater

34
delineation of affective responses to the driving experience than those afforded by demographic disaggregation.
The academic studies also suggested that trip experiences may vary by purpose of trip. This was also picked up in the NRUSS, which found that satisfaction with leisure trips was greater than that of non-leisure trips (Calvert et al. 2015, adapted from Highways Agency, 2013). More specifically, in agreement with the academic studies discussed above, the NRUSS found that travel-time can be more important for business trips than for non-business trips (Highways Agency, 2013).
An interest in disaggregating user satisfaction by region is evidenced in the NRUSS (Highways Agency, 2013) and also area road user satisfaction surveys (ARUSS) (Highways Agency, 2014a). These sources have revealed substantial differences of user satisfaction across regions (Calvert et al. 2015).
In harmony with the academic evidence discussed above, the NRUSS examines the importance of journey times and delays on road user satisfaction. Predictably, the greater the delay, the worse the impact is on user satisfaction (Highways Agency, 2013). Understanding of the effects of delays on satisfaction has been supplemented by qualitative research (DfT, 2015). This found that the impact of delays on satisfaction can vary according to the cause of the delay. This is interesting as it suggests the importance of road user perceptions, in addition to the objective road conditions.
The NRUSS study goes into some detail on specific aspects of the road environment and the effect these aspects can have on satisfaction. For instance it discusses roadworks. Qualitative research has suggested that reactions to roadworks depend on perceptions surrounding the extent and benefits of the roadworks (DfT, 2015). This again highlights the importance of perceptions in addition to the objective circumstance of road travel. The NRUSS also examines satisfaction with safety on the SRN, with upkeep and maintenance of roads and with signage/information provision. In short it examines the objective variables in the journey experience that Highways England can influence. The importance of perception for road user satisfaction has also been explored, particularly by the qualitative research carried out by the Department for Transport (2015). There is perhaps scope for a survey to draw out some perceptual themes further.
The Department for Transport (2015, p.1) have stated that ‘time and financial costs of the trip’ are important aspects of car journeys. Clearly these are both negative factors and Calvert et al. (2015) reviewing NRUSS, ARUSS and Department for Transport qualitative investigation concluded that ‘satisfaction with roads on the part of the road user depends more often on the absence of negative factors rather than on the presence of positive factors.’ This argument is borne out by Department for Transport (2015, p.1) research which concluded that ‘a positive driving experience is for most users a neutral state which is not necessarily felt consciously’. The research suggested that the influences which strongly impacted road user satisfaction tended to be negative.
To conclude, there are five factors which are suggested to be particularly important in influencing road user satisfaction:
1. Journey time and delays
2. Upkeep of roads and related infrastructure
3. Safety on the network
4. Provision of travel information
5. Roadside amenities and services.

35
The majority of the existing examples include all of these factors when attempting to explain road users’ experiences, and these are taken to be the key determinants of satisfaction. In seeking to design the New RUSS however, there remains a question as to whether these factors should remain as the core of approaches to measuring driver satisfaction, or whether these should be expanded to gain a more complete understanding of the experience.
A number of academic sources provide evidence that there are affective and symbolic factors which have a significant role to play in influencing drivers’ satisfaction. These psycho-social factors are centred on drivers’ perceptions of control and freedom, and form the core of the actual experience of driving and the attractiveness of car travel.
These factors are relevant here because it is problematic to attempt to separate the experience of using a particular type of road (e.g. the SRN) from the experience of driving more generally, when in fact the two will be heavily interdependent. In seeking to properly understand road user satisfaction there is merit in considering an approach which can encompass the key satisfaction factors for a particular road as listed above, but that can also go some way to explaining satisfaction within the context of people’s actual experiences of driving a vehicle.

36
2 Stakeholder interviews
2.1 Introduction Highways England have a long-standing measure of road user satisfaction (NRUSS), and the future direction of a new Road User Satisfaction Survey was considered widely within the former Highways Agency and by a number of external organisations in preparing the move to being Highways England, prior to the commissioning of this report.
It was important for the present study to consult with these stakeholder organisations, and beyond, to understand the organisational views that could inform the design of a pilot methodology, and assist in justifying a particular research strategy. These organisational views have been treated in confidence, and anonymity has been given to any direct quotes used in this report.
This chapter of the report summarises the conduct of and findings from a series of stakeholder interviews conducted in order to deliver that consultation process, reporting who was included, and setting out the key findings from the interviews.
2.2 Data generation approach In discussion with Transport Focus, ten key organisations were identified as stakeholders, beyond Transport Focus itself. The former Highways Agency2 (now Highways England) and the Department for Transport were central stakeholders, thus more than one opinion was sought within each of these organisations; a further five organisations who had been working with Highways England and Transport Focus as part of the roads reform process as representatives of major road using groups (car drivers and logistics companies) were also seen as key stakeholders. Access to these organisations was facilitated by Transport Focus. Three further organisations were also contacted to understand what Highways England and Transport Focus call ‘vulnerable users’ (in this instance disabled motorists, walkers and cyclists).
Interviews were conducted with the following stakeholder organisations:
Highways England (four representatives)
Department for Transport (three representatives)
AA
RAC
RAC Foundation
Freight Transport Association (FTA)
Road Haulage Association (RHA)
Disabled Motorists UK (DMUK)
Campaign for Better Transport (CBT)
Living Streets
Sustrans.
2 The interviews were conducted shortly before the Highways Agency became Highways England, but are
referred to as Highways England in throughout this chapter.

37
As indicated, all of these organisations have some relationship with Highways England, Department for Transport, and/or Transport Focus around road travel and the SRN, although the DMUK relationship has been smaller through user consultation, rather than the more active role other organisational representatives have taken (e.g. ‘the Chairman’s Committee’). The last three have been active in campaigning for the views of pedestrians and cyclists to be considered within the SRN management.
All the interviews with Highways England3 and Department for Transport were conducted face-to-face with the remaining being a mixture of telephone and face-to-face interviews. The interviews were treated as confidential, and all individuals have been given anonymity within the report. For this reason none of the quotes included in the report are attributed to organisations or individuals.
As part of this consultation process the research team also met with Transport Focus at the outset for information gathering about Transport Focus’ own organisational needs and interests, as well as to gain access to others.
2.3 Key findings from the stakeholder interviews As noted in Section 2.1, the interviews were conducted primarily to understand stakeholder opinions about whose views should be sought by the New RUSS, the segmentation of users, and the measures against which satisfaction should be understood. A second area of focus in the interviews was to find out more about the past NRUSS and understand the contexts in which NRUSS has been used, and why. A third area was to consider specific issues relating to particular segments of road users such as freight or vulnerable users.
Hence, Chapter 2 presents context around expectations of what the new survey will do, it then considers the views of NRUSS, who should be surveyed, and looks in detail at the types of experiences that could be measured. The report also highlights other information being gathered beyond NRUSS by different organisations and notes potential gatekeepers to particular segments of road users.
2.3.1 Context of the new Road User Satisfaction Survey
Transport Focus will be contracting the new Road User Satisfaction Survey (New RUSS). This survey will produce one of the statutory key performance indicators for Highways England4.
Highways England is working to a five-year plan, in which there is an expectation of achieving 90% customer satisfaction with the SRN. Some stakeholders question the actual validity of such a stable customer satisfaction level. It is recognised that this number may need to change within the second five-year period. Highways England was concerned that a single figure may not be a helpful measure; likewise 90% may not be the correct figure, and a figure like 70% might be more realistic for some measures5.
“…a number becomes something that people fixate upon, whereas what they should be looking at is the insight and what it means rather than the number and that will improve satisfaction in a much more meaningful way if [Highways England] can show how [Highways England’s] using the results.”
“My concern with [NRUSS] is it basically comes up with around 90% satisfaction pretty much regardless of what seems to happen.”
3 All were conducted in the weeks immediately prior to the HA statutorily becoming HE.
4 Customer satisfaction is one of a series of KPIs; the other KPIs will be managed by the statutory regulator, the
Office of Roads and Rail (formerly Office of Rail Regulation). 5 During the period of research, travel time reliability, a key component of satisfaction, was around 79%.

38
Highways England representatives within the interviews indicated there is greater value to look at variation across measures in order to understand where action needs to be taken and improvements can be made.
The interviews indicated that the data produced by the new survey must be useful to Highways England, in order that the organisation can respond and make changes where necessary. There may be a point of tension between a customer satisfaction measure that meets the requirements of Transport Focus’ reporting, and more detailed evidence required to direct Highways England’s operational procedures or the Department for Transport’s strategy for roads. Transport Focus needs to take a lead in framing what the customer survey can do, and what needs to be pushed to other research by or for Highways England. However, Transport Focus is interested in the idea that the data from the New RUSS could be more widely used, and it is also exploring the opportunity to develop research beyond customer satisfaction measures.
The NRUSS will continue alongside the new survey to start with, which is widely believed to be a pragmatic decision despite the recognised weaknesses set out below.
2.3.2 Views about the NRUSS
The NRUSS has been used by Highways England since 1983. Its current format has been used for the last four years. Opinions about NRUSS are wide-reaching and mixed. However, it is important to note that many people believe that in essence NRUSS is a good survey shaped by knowledge accumulated over time, and perceived to be useful for internal purposes. Thus, in designing the pilot methodology the value of what is considered good within the existing NRUSS design should not be overlooked. One stakeholder described the NRUSS as ‘solid’ with anything new needing to have the same quality, indicating a level of institutional trust in the existing tool. Likewise, another suggested that any approach should not overlook the value brought by NRUSS without good reason (“don’t throw the baby out with the bath water”).
The most useful part of NRUSS was argued to be the questions that answered ‘Why’: following the questions that ask for a level of dis/satisfaction there are a series of open-ended questions of the form ‘why were you [dis/satisfied] with x?’, and these qualitative answers are subsequently coded. For Highways England, understanding what had affected a particular level was felt to be more illuminating than a percentage figure. These qualitative reasons carried more weight in capturing attention within the organisation, and initiating a response.
Stakeholders were concerned that the public does not have a good understanding about Highways England, and what its role and remit are. For example it was noted that the public believe that Highways England are in charge of the motorway services, when these are actually run by private enterprises. A recent BBC2 documentary had helped raise the profile of the organisation (the former Highways Agency). Knowledge of the former Highways Agency was asked on the NRUSS, but a direct reference to these data was not made in the interviews.
Stakeholders also expressed concern about NRUSS participants’ knowledge of what constitutes the SRN, and whether or not the approach really managed to separate out their experiences from the wider road network.
“I think most people are in a world of their own when they’re driving and they don’t think ‘Oh, am I on a Highways Agency road?’”

39
The ability to identify the network was perceived to be more challenging for the ordinary motorist, whereas regular business travellers and lorry drivers for instance were believed to have a better understanding about what the SRN might be.
Despite NRUSS having value, a number of weaknesses were highlighted. These relate mostly to the sample size, and the suitability of the questions for a customer satisfaction survey.
NRUSS is expensive to run, due to its length and delivery as a computer-assisted personal interviewing (CAPI) interview (i.e. £250,000 for 2000 interviews). It was indicated by a stakeholder that spending cuts had focused NRUSS on the economics of road use; i.e. the SRN supports the concept ‘transport is an economic driver’, referring here to the changes made four years ago. This same stakeholder suggested the survey needs to broaden its remit once more.
The major concern with the NRUSS was with the sample size, and this concern was voiced across organisations. Here the challenge has been making the data meaningful when disaggregated at different levels, whether geographically, by type of driver/vehicle, or for some other socio-demographic variables that resulted in small numbers. (It was noted that there was a good gender balance within the survey.) Geographic granularity is addressed below, and at a regional level the numbers are too small to be particularly meaningful. The monthly reports of the survey (1/12 of the whole sample) again produce very small numbers at a geographic level, which are problematic in terms of justifying any action as this stakeholder indicated:
“If you do dig into it, then it is just one person and then you think well they don't really… in the nicest possible way I don't really care what he thinks about it. You need a few more people don't you to know that it is worth the time to take action on it.”
There was also a difference in opinion about the value of the NRUSS asking about the ‘last journey’ and how this might be separated out from other journeys in their memories. This particular issue is discussed further in Section 2.3.4.
Not all stakeholders interviewed within and outside of Highways England were familiar with the exact the detail of all the questions in the NRUSS questionnaire. This lack of knowledge was due to receiving summary data or it is data that they do not need to regularly engage with because they were an external organisation. One stakeholder suggested that the current way in which the NRUSS is reported does not make the information particularly clear, and that it could be presented in a more meaningful way.
Those stakeholders with greater knowledge of the detail of the NRUSS considered the types of questions currently asked. Here the suitability of the types of questions for measuring customer satisfaction was questioned by a couple of stakeholders, although few alternative suggestions were made. One stakeholder suggested looking at the way customer service evaluations were made in other sectors, where the survey participants might be asked to agree with a statement such as ‘I would recommend this service to a friend’, rather than a scale of satisfaction. A stakeholder also noted that the placing of the satisfaction question within each sub-section of the NRUSS varied (Section H is the only section in which the satisfaction question is placed at the beginning of the section rather than the end). This stakeholder suggested that the different order of presentation might influence the nature of participants’ responses.
The weaknesses around the sample have reduced the credibility of the data’s validity within the organisation, more than the actual survey design. However, not all data are used. For instance, delay data are rarely used as they are perceived as being too ‘subjective’. More ‘objective’ measures of delay are used from other data sources. Yet arguably discussion in Chapter 1 has shown there is value in understanding people’s perceptions of delays in

40
relation to the ‘objective reality’ of delays: Section 1.3.1 presented academic research into the ways in which people’s perceptions of travel-time can change in different contexts (for example when experiencing congestion), and Section 1.4.3 provides the example of the TLRN Customer Satisfaction survey which contains an analysis of the incidents people perceive as the most prevalent, compared to secondary empirical data showing the incidents which are in fact the most prevalent. Such an approach of comparing individuals’ perceptions with reality can provide more meaningful insight into the main drivers of road user satisfaction.
It is possible that a more detailed understanding of what existing data are used or not used, and why, needs to be gained from Highways England to determine what data are collected in the future. The next section considers the types of measures that should or could be included in a new survey, and some of the reasons why, but it is not entirely clear how these data might actually be used and how, and their relevance to Transport Focus’ remit.
2.3.3 The population of interest
As noted in the introduction, Transport Focus has a statutory remit to measure the satisfaction of road users on the SRN. In commissioning this research, Transport Focus recognised that a ‘one size fits all’ survey would not adequately capture the diverse set of people travelling on the SRN. The diversity of road user is a consequence of the SRN serving multiple journey purposes, providing for short and long distance journeys, and because it includes trunk roads that are used by cyclists, local buses, and pedestrians (who both need to cross it and use pavements which run alongside it).
Given that Transport Focus was specifically seeking guidance on appropriate methodologies to reach different road user types, the stakeholder interviews also needed to explore this specific issue. However, early discussions with Transport Focus identified the need to focus on vehicle drivers’ levels of satisfaction rather than passengers. The research brief also required the study to explore different types of vehicle drivers (e.g. car, HGV, coach), and consider the needs of vulnerable road users (e.g. disabled drivers, cyclists and pedestrians). Thus the selection of stakeholder group was based on examining opinions of those representing a variety of road users, and the interviews explored the rationale for understanding different types of road users.
At Highways England the stakeholders effectively wanted to know ‘everything about everyone’. They recognised that their core business was vehicle drivers, but sought to know more about the different segments of drivers (commercial, long-distance, commuters, etc.). The significant impact of the SRN roads on the life of villages and towns was also of concern to Highways England. They also saw the need to understand the experiences of people crossing roads by foot where trunk roads run through built up areas; the needs of cyclists using and crossing trunk roads; the impact of roads on neighbours; and even, for the people who seek to avoid using the SRN, to understand why. Highways England mentioned an interest in better understanding how the SRN could link in with other pieces of national infrastructure – such as the National Cycle Network – as there is little currently known about people’s use of cycle paths which connect with the SRN. Some argue that cyclists have good advocacy and there is a greater need to find out about pedestrians, while others have a specific interest in cycling provision. While ‘vulnerable’ drivers (e.g. older and disabled drivers) appear to be more satisfied within NRUSS results, there is also concern that these groups are not always represented appropriately as they use the SRN less. However, DMUK was keen to emphasise that disabled drivers should not be considered as different to non-disabled drivers (except in relation to specific issues raised 2.3.6).

41
The CBT discussed three groups of ‘vulnerable’ users – walkers, cyclists, and bus users – and suggested that there is a lack of consideration of these users’ needs, and a lack of understanding about the number of different ways in which non-drivers interact with the SRN. For example, walkers must cross the SRN and sometimes also walk alongside it, and cyclists must do the same (often using inappropriate infrastructure to do so). Bus passengers were described as having a unique interaction with the SRN, as this group would sometimes access the bus at stops along the SRN itself – and there is a lack of focus on the infrastructure that is required for them to do this in a safe and acceptable manner (safe, convenient routes to bus stops, etc.). People do not only move along the SRN, but in different places across it, around it, and onto it.
The interviewers asked stakeholders to prioritise users. For some this was challenging because all road users were believed to be important, and they considered that the research should not be prioritising or potentially excluding any user. However, this question did prompt some interesting responses about what purpose the SRN served, i.e. the word strategic was emphasised, and that is the SRN was designed to connect strategic nodes (ports, airports, and key cities), which underscore the economic prioritisation of road travel.
“in terms of the priority of users, I think because we’re looking at motorways and trunk roads, we have to look at the types of users who are primarily motorised users and who are doing more than local journeys probably, but I suppose some users do local journeys but I think we need to get it down to the frequency of use”
“I think we’ve done this question to death, who are the customers, we tend to think it’s all car drivers isn’t it? But it is commuters, leisure use. A big customer is clearly the freight industry isn’t it? Two-thirds of freight. And they should be; they keep the country going”
Some emphasised the importance of those involved in travelling in the course of work, and some the movement of freight as above, and the associated time sensitivities of such journeys. It was also noted that professional drivers are likely to travel for longer distances on the SRN and therefore have a different experience than other users.
Journey time expectations are critical for travellers connecting with flights for leisure, but some of these road travellers may be passengers (e.g. in airport taxis) on an annual trip whose views are less likely to be captured by a survey. Likewise, coach and bus passengers may place just as much importance on delays and congestion as vehicle drivers, and these may include commuters and leisure travellers.
People using the SRN to commute or for leisure trips and shopping, even if only using short sections, were also considered important ‘customers’ by a number of key stakeholders. While these use less of the network, they are more likely to use it frequently. Here the priority between short frequent trips and longer less frequent trips is blurred, but frequency of use is viewed as important.
One stakeholder suggested that a method of identifying priority users is to focus on user groups targeted by government funding, or looking for users groups which have KPIs from policy domains beyond SRN regulation related to them.
In addressing the issues relating to freight logistics there are differences in perceptions between driver experience (services, safety, etc.) and fleet management (time); thus these different perspectives would need to be acknowledged and understood through different mechanisms. Even within freight logistics there are different types of routings, so some drivers spend much more time on the SRN than others. The core of lorry drivers using the SRN are the ones who deliver from hubs to regional distribution centres; others lorry drivers tend to operate more locally. It was noted that light delivery vans are on the increase due to internet shopping, but not all will be significant users of the SRN.

42
The segmentation of road users was thought to be compatible with approaches within the Department for Transport, and it was suggested that this type of segmentation could be more useful to Highways England than geographic granularity (see 2.3.7).
Many of the stakeholders seemed to be informed by the qualitative research conducted by Transport Focus and the Department for Transport6 about different types of road users and their needs. This qualitative evidence appears to be strongly directing opinion about the perceived needs and desires of road users, which the report now considers.
2.3.4 What should be measured and why
The interviews with stakeholders aimed to pin down what the important things are against which customer service should be measured, and why. A broad spectrum of responses emerged, although there were some core themes. Again it was noted that the NRUSS was measuring the right things, but with the caveats raised earlier. A strong message was that any survey is going to have strengths and weaknesses, but it is important to recognise these and be transparent in the reporting.
The discussions raised three key issues that need to be taken into consideration in the design of the pilot methodology: (i) which experience is being measured; (ii) the different elements that constitute the experience; and, (iii) geographic granularity.
2.3.5 Which experience?
Currently the NRUSS asks about the ‘last trip’, and this approach was directing Transport Focus’ thinking too. Transport Focus’ other customer satisfaction research on rail and bus passengers asks about the specific trip the passenger is making, which is obviously fresh in the mind of the passenger. Stakeholders believe that using the last trip focuses the participant’s mind, but if this is not a very recent journey their memories about experiences along discrete sections of road may be blurred with the overall end-to-end experiences, or other more general experiences.
Many stakeholders were adamant that the last trip is a good measurement. Others questioned whether or not last trip is a good measurement, and they made various suggestions - a broader timeframe, asking about best and worst journey, or measuring multiple trips through a travel diary.
“either a travel diary or you do a bit more of what things you’re particularly concerned about and your best journey, your worst journey, rather than just narrowing in, focusing the on one journey. That I think will miss some of the things that have really coloured people’s perceptions perhaps.”
Two stakeholders suggested that questions could be sent to a digital device immediately after a participant has travelled on the network, and reference was made to a trial in Dresden, Germany where participants were given a touch screen to respond to as they moved through roadworks.
As discussed in section 1.3, existing customer satisfaction surveys follow a range of different methodological approaches – from postal and telephone surveys, through travel diaries, to mixed-methods approaches combining surveys and interviews.
6 Transport Focus (2015) Road User Needs and Experiences, and, DfT (2014) Roads Reform Social Research
Programme Summary of Main Findings

43
2.3.6 Elements of the experience
The driving experience is made up of many different factors, not all of which Highways England can affect. However, a number of stakeholders have indicated it is important to understand these broader factors, and one suggested that Highways England may have to ‘think outside the box’ in response.
Currently NRUSS is shaped around the aspects of the journey which Highways England could affect, and Highways England stakeholders saw the continuation this type of set of measures as important in terms of the possibilities to respond to poor performance figures.
Understanding why there is a problem remains more essential to the operation of Highways England than the actual satisfaction figure to be generated by Transport Focus, and this links back to the use of qualitative data alongside quantitative data. However, repeated reference was made to the recent qualitative work that has explored drivers’ perceptions of their experiences, and therefore there does seem to be an existing wealth of qualitative evidence. And one stakeholder indicated that now it was important to have numerical measures to evaluate and drive change, and this was re-iterated by another stakeholder who emphasised the importance of longitudinal data that is stable over time for direct comparisons.
Below is a list of twelve measures that the stakeholders considered important and why. These have been ranked in order of importance linked to the order and frequency raised in the interviews. However, this listing and ranking is primarily an organisational structure to present the findings and needs to be understood in the context of the following points:
Although the stakeholder interviews reveal perspectives that are important to roads management and customer satisfaction, they are not the only views that are important. Indeed, two interviews themselves argued that it is road users themselves who should be deciding how Highways England performance is evaluated, i.e. it should be bottom-up not top-down. The study had constraints on the number of stakeholder perspectives that could be included.
Qualitative data collection methods are not designed to ‘weigh’ participants’ responses but to understand diversity and range of response. Interview participation was dominated by professionals who have been engaged in the roads reform process and in some cases will be affected personally as well as professionally by the outcomes. Therefore the responses reflect personal interests and views as well as reporting the ‘collective’ views of the organisations represented.
1. SRN Profile (Who is Highways England and ‘does anyone care’?)
Prior to the formation of Highways England, the Highways Agency had been seeking to raise its profile with road users, but most stakeholders saw there was a challenge in that the general public does not know who SRN operator is, and what it does, nor how to engage with it to comment or complain. A second element here is drivers actually knowing that they are on an SRN road, and again raising that awareness.
2. Time
Time influences a range of measures, and time appears to be the most important measure from an economic perspective. However, there needs to be some thought put into how ‘subjective’ customer satisfaction data can be utilised alongside other ‘objective’ information, as the delay information collected through NRUSS is poorly used.
Both in Chapter 1 and in the interviews it was suggested that journey time, in terms of customer satisfaction, only becomes problematic when the journey takes longer than

44
expected, and uncertainty emerges. Many journeys encounter delays due to congestion, but because congestion is expected and there is a reliable degree of delay, it is accepted and planned for by regular drivers. Ergo driving a less regular or new route and encountering ‘regular’ congestion for the first time may have a different impact on satisfaction.
Drivers build in extra time within their journeys to mitigate the impact of delay, and one stakeholder commented that there might be acceptable time bands around how much extra time needs to be added on.
One stakeholder noted how the journey time of a trip he made fairly regularly had extended by an hour over a period of 10 years, and how he had absorbed that into his planning. Therefore, it may be worth considering this longitudinal perspective.
Time sensitivities are particularly important to the freight industry and logistics management, as well as business travellers, especially around just-in-time delivery situations, or where meetings with customers and clients are scheduled. A particular sector within freight was also noted as having an extreme time-sensitivity: the delivery of fresh food to supermarkets operates in a very tight delivery window, and if it is missed by more than half an hour the delivery can be rejected and the load wasted.
Journey times are also sensitive for those connecting with other scheduled transport links such as flights, and may impact on airport taxis as well as individual drivers, as noted earlier.
Disruption to journey times has the biggest impact on dissatisfaction, and the management of the disruption is linked to the next point ‘information’.
3. Information flows
Several stakeholders discussed the need for improved information flows between the SRN operator and the public, especially around planned and unplanned road closures and delays caused by accidents and weather. There was inconsistency between different stakeholders’ awareness of what types of operational information have in the past been made available to external organisations by Highways England.
This issue is particularly important to the movement of freight. An example was given by one (non-freight) stakeholder of information about a road closure being given to a major retailer by Highways England around which the logistics were planned. In the event the contractor closed the road an hour earlier; this created a problem for the planned movement of goods for the retailer.
Freight stakeholders indicated that drivers may have constraints around taking alternative routes (weight restrictions, etc.), and need to liaise with the transport manager over decisions as they encounter delays and re-routing.
Highways England indicated that it had been providing information about planned roadworks and delays via its website, and had shared information with other agencies, broadcast media, etc. However, one area noted for improvement is the management of electronic signs on motorways in real time as these may not be updated frequently enough. Other stakeholders thought Highways England should be looking at how information flows can be better managed and mobile technology utilised. One aspect raised in the interviews was assumptions made by the public in relation to seeing parts of the road coned-off but not seeing actual work happening at that moment. It was noted that here information could be given to say ‘work is happening at night’, for instance.
Allied to this issue, is understanding the extent and types of planning drivers undertake before making the journey, and the mechanisms used, if at all, was thought to be important information for Highways England in the future.

45
Highways England representatives discussed the importance of understanding the ways in which road users are using digital technologies such as smartphones to request and view a range of different types of information about the SRN (route planning, incident reports, service locations, etc.). This use could be either before a trip or during a trip. It was suggested that personal devices such as these will increasingly become the primary way in which private users will receive information.
4. Safety
Safety of drivers has understandably been a key concern to Highways England, and in the past they have worked closely with the Driver and Vehicle Standards Agency7 and the Department for Transport in developing public information campaigns around safety issues, and Highways England will have finances for re-engaging with such campaigns. (There could be issues of liability if Highways England is found to be negligent.) Highways England indicated that a large proportion of incidents was arising because drivers’ do not understand how to be safe when they break down, such as appropriate use of the hard shoulder in these instances; often people travel unprepared, without enough fuel, or with a car not in good working order, and therefore put themselves at risk. There is a high risk of death or injury for people who stop on the hard shoulder.
Safety is a concern not only for the outcomes of individuals on the roads, but also the implications of crashes and breakdowns on the network management (road closure and journey delays), which is discussed further below.
Highways England staff, contractors, police, etc, are all at risk when working on the road, whether undertaking maintenance or involved in managing an incident site.
The Department for Transport qualitative research had indicated that people are concerned about safety, but consider that their safety is put at risk by other drivers’ behaviour, rather than their own driving being at fault. Motoring organisations have similar evidence. Thus, these perceptions of safety, and driver behaviour need careful consideration in terms of how they connect with the aspects of road management that Highways England has control over, which include policing, speed cameras etc.
The use of the Red X lane on smart motorways has implications for safety, as it was highlighted that people do not understand or know about it (see below on network management). Some believe this issue will resolve over time, as drivers become accustom to the Red X system.
There is a particular problem for wheelchair users if they breakdown, as it is difficult to exit the car because of the amount of space, and to access a safe refuge. However, DMUK did not think that such safety issues prevented disabled drivers from using the network.
SOS phones were also raised by stakeholders. Despite many people now having a mobile phone, people are concerned that these may be removed in case the mobile phone does not work.
5. Network management
How the public perceives the management of the SRN is critical to customer satisfaction. Several issues were raised that come under network management; the main ones being the management of delays associated with roadworks and reopening of the road after an incident or bad weather.
7 Referred to as DSA in the interview.

46
Roadworks are an important element in network management. Many of the stakeholders talked about the impact of investment into the roads creating more roadworks in the coming years, particularly for road re-surfacing (see point below on road condition). Thus, many drivers will be subjected to new sources of delay in the future. The management of these delays is seen as a critical in influencing future customer satisfaction responses. As raised above, the information flow about roadworks to the travelling public and the movement of freight is critical in creating expectations around journey times.
Highways England stakeholders explained that reopening a road following an incident required interacting with a lot of different organisations, which can make the process difficult and can affect the knowledge of the length of delay.
The management of the road in adverse weather conditions was also raised as an issue by some stakeholders.
Highways England explained that where they have had their own patrols on the SRN, the involvement of traffic police has been reduced. Other stakeholders indicated that the lack of visibility of police impacts on people’s perception of safety, and that other automated mechanisms for managing safety need to be considered (e.g. speed cameras).
Smart Motorways were raised by a number of stakeholders, in the context of concerns about the public’s understanding of how to use them being quite poor. One stakeholder believed that the perception of Smart Motorways would change with time as drivers become more accustomed to them, therefore any assessment of user perceptions on this particular issue may only be needed for a relatively short time period.
One stakeholder also raised the issue that the movement of abnormal loads and impact on other drivers was not always managed appropriately.
6. The road environment
Highways England received a lot of complaints (letters) about litter on the highway. How to manage litter is a problem and one Highways England stakeholder wondered if there needed to be a re-think about how investment should be directed to resolve this problem. Should Highways England spend money on picking up litter (which is dangerous for staff) or should it have a public campaign about the consequences of litter (and why it is there)? (How to deal with litter came across as having been a ‘burning issue’ at Highways England.)
Issues around the road surface and the noise of driving, and surface spray were raised.
A couple of stakeholders mentioned the aesthetics of the road (landscaping) as a driving experience, as well as driving being a way of visually consuming the landscape. This issue was raised in relation to the A303 and Stonehenge. Thus, the question is: how important are these aesthetic aspects in influencing customer satisfaction?
The provision of lighting also affects the user experience. It is discontinuous on the SRN, and this could have an impact on people driving at night or their confidence to do so.
7. Service stations
Many stakeholders touched on service stations and their role in shaping customer experience of the wider network. Although not all SRN customers use a service station, as noted before, a constraint needs to be addressed in assessing customer service arising from one of the most memorable parts of long-distance journeys occurring in a context beyond the SRN operator’s remit, as Highways England does not manage service stations. However, implicitly accepting that some influence on SRN perception ratings is inevitable, the operating model was questioned by some stakeholders, some of whom provided international comparisons. For example in Spain there have to be two competing services at

47
one location. Some stakeholders considered that Highways England could actively enhance services in the future through franchising mechanisms.
In terms of more specific aspects of service stations, stakeholders indicated that drivers express concern about the frequency of provision and the cost of fuel and food. The biggest impact of services is perhaps on lorry drivers, and in some instances disabled drivers. Lorry parking is often at the ‘scruffiest’ end of the service area, and the security is very poor. Many lorries suffer from crime in service areas. The length of stay can be problematic for drivers who need a longer rest because they are professional drivers, or they have a disability (e.g. MS) which makes them tired, and they need to rest for safety reasons. The level of customer assistance for disabled drivers can be a problem when no one will help, as the design is not suitable for wheelchairs to access pumps (not enough space between car and pump) and people with hand impairments may not be able to open fuel caps and operate the pump.
Disabled drivers with assistance dogs would also like an accessible fenced ‘dog toilet’ area. While this sounds a very specific issue, it illustrates how service provision may not fully consider the needs of a disabled driver/passenger by only providing obvious infrastructures (dropped kerb and disabled access toilets).
8. Road capacity
One stakeholder discussed the issue of road capacity and the impact on congestion. However, this could be challenging to measure and Highways England may be limited in its ability to respond in the short-run due to the existence of a five-year Roads Investment Strategy with Government. However, specific capacity concerns might be taken into consideration in deciding priorities for a future RIS.
9. Value for money
One stakeholder suggested that road users should be asked about whether they thought the journey represented good value for money. As noted in the literature review, few road drivers can be expected to have a clear perception of what good value for money might represent, as there is currently a weak perception of being a ‘customer of the road’, in contrast to other countries where toll roads are more common. Should charges to use the SRN ever be introduced, however, this would be expected to change and become important.
10. Experiences of breakdowns/crashes/illness
A stakeholder from a motoring organisation suggested asking about people’s experiences of being involved in an incident, breakdown or being ill, and how these are managed.
11. Emotional state and other affective impacts
A few stakeholders considered how the driver’s experience may be affected by their emotional state, what they are doing or listening to in the car, and/or who else is in the vehicle (e.g. kids, colleagues, etc.). While these are factors outside of the range that can be directly changed by Highways England, there was some discussion about how these factors could impact on a customer satisfaction response, and what was really in the power of Highways England to influence.
12. Non-driver experiences
A number of stakeholders raised the importance of understanding non-driver experiences. While much of the discussion was around walking and cycling and the interface of these groups with the SRN at crossing points or cycling infrastructures etc; the issue of taxi and bus passengers may need specific attention.

48
2.3.7 Geographic granularity
Understanding what is happening in specific regions and/or on specific sections of the SRN has been important to the operations of Highways England. A key constraint of the NRUSS noted earlier is that the sample size is not big enough to give enough statistically robust evidence at the local level. In addition to NRUSS, Highways England has run an area-based survey (ARUSS) in each of the thirteen regions. Currently ARUSS is undergoing a review, and there are some indications that these regional studies will continue for a while although this may be in a different form. Highways England stakeholders emphasised that data collection should not be duplicated, and therefore there was a need for Transport Focus and Highways England to discuss the relationship between the new survey and any further iterations of the ARUSS.
Many stakeholders argued that knowing what is happening at a geographic level is essential, but others were less concerned. For operational procedures, geographic granularity is important to connect with events such as road closures, delays, etc. The operations group within Highways England was interested in having the opportunity to overlay geo-located data to geo-located customer satisfaction. The challenge often is that people present a complaint about a journey (e.g. by letter) but it is not geographically specific enough for the operator to respond to.
“One of the things we always try to do is overlay the information with actually what happens on the network”
“[It’s] geography as well, people are really vague […] even when you read the comments people would be like: “I travelled from Manchester to Leeds and there was a lot of litter” […] “there's a lot of potholes”, and you don't know whether it was consistent along the length of the route or whether there was one area where there were particular problems...”
The Department for Transport also produces ‘hard’ data around road speeds, delays, etc., using TrafficMaster data, which could be linked to customer satisfaction. Currently they have 100,000 vehicles being tracked, which are mainly cars and light vehicles, and receive data on a monthly basis.
A couple of stakeholders noted that people’s knowledge might be of very small bits of the SRN e.g. bits of the local trunk road, and wondered how this level of knowledge would be reflected in a broader account of a road/region. For example, could a customer satisfaction score having used 2 km of the A11 or A303 reflect something meaningful about the whole road?
2.3.8 Other surveys and customer information
During the course of the interviews, the following other customer-focused or related datasets were noted (listed below) as relevant to road user satisfaction. The existence of these sources was also considered during the methodological specification considered in Chapter 3.
Highways England was gathering customer information from a new panel. They were taking specific issues raised by NRUSS to explore with this panel. They also received letters from road users and other representatives (e.g. Parliamentarians) but there is not a systematic tracking system for these communications.
The AA has a panel survey of motorists based on ‘TV’ regions (e.g. South East, East Anglia, North West, etc.). The panel has 160,000 members and 20,000 are surveyed each month online. These surveys are issue-based (e.g. attitudes to speed cameras,

49
price of petrol, mobile phone use, etc.). They also measure customer satisfaction with roadside recovery services.
Likewise the RAC survey of motorists consists of 1,500 people who are a representative cross-section of the population (geographic/demographic). They have a panel for ad hoc views consisting of 5,000 people. They have occasional joint surveys with other organisations, and like the AA have a customer satisfaction of roadside recovery.
DMUK do not survey members in the same way but do offer issues for consultation with members where and when appropriate.
DfT measures road flows with ‘traffic master’ data – now around 10,000 vehicles, but these are mainly commercial users.
Within the freight industry customer service is orientated to measuring the impact of delay and scheduling.
2.3.9 Gatekeepers to specific populations
There are opportunities to use trade and other organisations as gatekeepers to specific populations. For example, the FTA is able to be a gatekeeper to fleet transport managers and drivers, and DMUK is able to be a gatekeeper to their members (who are not all disabled and mostly over 60).
2.4 Summary Interviews were conducted with a range of stakeholders but with an emphasis on those involved in the new institutions of SRN management. Whilst qualitative interviews of this nature seek a ‘representative’ view from the perspective of the interviewee’s organisation, it is inevitable that there is also a personal professional context to the information collected and the study was not able to approach all relevant stakeholders.
The existing NRUSS emerged as having strengths and weaknesses, but generally it is a trusted and respected tool in terms of the content of the survey. A new survey has the opportunity to do something different, but it is challenging to pin down what ‘different’ should be when there is confidence that the NRUSS is measuring the correct things.
The NRUSS weakness is the sample size which reduced its value to the operations side of Highways England. Thus, from this perspective, key to the development of the pilot methodology and new survey, is the sample size, and ensuring it can facilitate different levels of segmentation, and potentially geographic granularity at a level where the figures are statistically robust enough to have meaning.
The interviews raised many issues against which the customer experience might be measured. These have been ordered into twelve key areas, and mostly these overlap with what NRUSS already measures. Some measures are seen to be outside of Highways England’s control, but that should not exclude these aspects being considered in the future.

50
3 Proposed SRN Survey Design and Sampling
3.1 The research objectives The brief itemises the sample requirements in broad terms before proceeding to more specific requirements. The brief is as follows:
It is critical that the survey adopts a robust survey design given metrics from the survey will be used to measure Highways England’s performance, and ultimately may input into remuneration decisions. Key considerations for the review are:
Representativeness of the sample
The ability to generalise from the sample to the population
Sufficient sample sizes for different subgroups to conduct meaningful analysis
Whether this information can all be collected through the same method, or will a number of data collection processes be required to ensure representation of key sub-groups to a level allowing meaningful analysis
How to account for changes in distribution / proportions of different sub-groups within the population of interest over time, especially if a quota-based approach to sampling is adopted.
3.2 Overall survey design The design recommendations for the new survey are discussed in detail in the following sections. This section provides a summary of the overall approach being proposed.
3.2.1 Current research
The current research is a combination of the National Road User Satisfaction Survey and the Area Road Satisfaction Surveys. They are similar in terms of sample design employing a multi-stage stratified sample of areas with a quota sample control placed for selection of individuals. We do not intend to carry out a detailed appraisal of these surveys. They were intended for a body which at that time had very different management objectives and their quota sample design and their sample size rule out their use for the new responsibilities of Transport Focus.
These surveys were designed when online survey technology and the coverage of the internet were much less developed than they are now. The design of the sample and the interview were constrained by the high cost of contacting respondents for face to face interviews and the cost of revisiting them if further information was required.
3.2.2 Design of the new Road User Satisfaction Survey
We recommend using online interviewing for this survey. This may come as a surprise, given the poor reputation for quality of online samples. However, we believe that it is the most appropriate method for reasons which we will discuss in detail in the next section on the sample design. The coverage of the internet means that online interviewing is now a viable method to reach a representative sample of people who possess a driving licence, if a way of obtaining a representative sample of the internet contact addresses of people with different classes of licence can be found.
The benefit of using this approach, apart from the lack of variable interviewer bias and the ability to use an unclustered sample at no additional cost, is that the cost per contact is very much lower than for face to face or telephone interviewing. It is also possible to ask for

51
further information from a respondent, if that is needed, making it possible to use shorter questionnaires, resulting in less respondent fatigue and higher response rates. The new survey should take advantage of the benefits of online interviewing to greatly increase the sample size over the current surveys. This will make possible more detailed analysis, both geographically and over time.
The stakeholder interviews established that the AA interviews 20,000 members a month selected from a panel of 160,000 who have agreed to be interviewed. At present the data relating to use of the SRN is not sufficiently detailed to make it possible to forecast the sample size options for the final survey. Once the pilot data has been collected it will be possible to estimate the level of geographic and event level detail which could be obtained with different sample sizes and set this against the cost of collecting the data.
Online interviewing makes it possible to use background processing to present interview modules that will only be asked if respondents have had a particular experience or given a specific answer and to keep the length of the interview reasonable by not asking more questions than necessary to get reliable results. More importantly, online interviewing will enable a further interview with respondents who have exhibited particular behaviour or given particular responses and ask further questions at a very low cost per interview. This will make it possible for the initial questionnaire to be shorter and any follow up questions to be more specific. This is important for three reasons:
1. Short questionnaires get higher response rates, better quality answers and increased willingness to participate in future surveys.
2. Unlike other modes of interviewing surveys can be broken up into modules which target particular experiences. Individual modules can then either be administered to qualifying respondents if it is a low incidence experience or a subset of all respondents, if it is high incidence.
3. The database of respondents created by the initial interview makes it possible for them to be re-contacted easily and cheaply if their answers need further explanation, or if they are known to take particular trips which are of interest.
To be useful a satisfaction survey needs to collect the impressions of users based on a single known experience that can be related to external known factors like accidents and roadworks. It may also collect an overall view based on impressions over a longer period, but memory effects and averaging make it difficult to determine the importance of different aspects of the service provided by the road network in influencing satisfaction. This requires a representative sample of journeys. Since some people use the SRN more than others and many of those make the same journey regularly, perhaps daily, it is important that the data collected comes from as large a sample of different drivers as possible.
For this reason we think that the survey should collect data on the last trip on the SRN, as long as it is fairly recent, rather than using a smaller sample providing data via a diary over a period of days or weeks like the National Transport Survey. The interviewing will be carried out continuously, ensuring that every day of the year is covered and seasonal and transient events can be assessed. Since online interviewing makes it cheap and easy to re-interview the same respondent, we recommend that they should be interviewed again, after three months for example. This will keep initial recruitment costs lower, because fewer email addresses will need to be collected after the initial set up; only sufficient to replace respondents who refuse to complete another interview. This design will also make the task for respondents easier because they will benefit from the learning effect once they have completed the interview the first time. Over time this survey design will create a large

52
database of people with known characteristics who can be used for more targeted research surveys.
In the next section the various subgroups which need to be covered are discussed in detail. We recommend that in all cases, except for managers of business and public sector users and specific interest groups, the respondent is the driver. The reason for this is that the driver will have a more detailed recall of where they went and what happened on the trip than a passenger. If there are different drivers during a trip we will rely on one to answer for the whole journey. To the extent that passengers’ views are relevant, for example about service areas, the driver should be able to answer the questions on their behalf sufficiently accurately to meet the main objective of this survey.
3.3 Types of road user Given the number and diversity of different types of road users, it is recognised that a one-size-fits-all approach is unlikely to be appropriate. As part of the review, Transport Focus would like guidance on appropriate methodologies to reach different road user types and how they can compare and link different data sources. Again this will be a critical output of the review. They envisage covering the following users in the satisfaction survey, and this review should comment on the relevance and practicalities of addressing each target group:
Individual motorists:
o Car drivers
o Van drivers
o Light Goods Vehicles (LGV) drivers (including different classes of LGV vehicles)
o Heavy Goods Vehicles (HGV) drivers (including different classes of HGV vehicles)
Commercial/business road users (covering public and private sector, different size organisations)
o Decision makers within freight companies, fleet managers etc.
o Coach operators
Professional drivers:
o Taxi drivers
o Service people / tradesmen
o Logistics industry
Vulnerable road users e.g. disabled, novice and older drivers
Passengers
o Car
o Coach
Transport Focus would also like to consider the relative value of including international users of the SRN, particularly within the freight sector, and the implications of doing this.
Other users of the SRN need to be considered; and this may require a different methodology from the main surveys, or perhaps be undertaken as ad hoc research.

53
Transport Focus may also seek to understand their needs through stakeholder engagement with representative bodies for:
Motorcyclists
Cyclists
Pedestrians
3.3.1 Subgroups within audiences
It will be important to identify differences between the following subgroups by audience:
Types of road (e.g. motorway, trunk roads of different size, capacity, traffic volumes and location (e.g. urban vs. rural))
By Highways England regions / areas
By individual routes within the SRN. These would need to align with the 18 route strategy areas, which may also evolve over time, and so there must be sufficient flexibility to reflect any changes
Trip purpose/activity, for example travelling for business or commercial purposes, leisure and commuting (time critical vs not time critical)
Frequent users and less frequent users
Users making familiar/unfamiliar journeys
Distance travelling
Travelling during peak times, different times of day (e.g. during daylight hours and darkness), different weather conditions and seasons
Drivers of ultra-low emission vehicles
This is a detailed requirement and the needs are discussed below in light of the results of the desk research and stakeholder interviews, as well our more general experience of both high quality social research and transport research in particular.
3.3.2 Changes to the requirements
Since the research requirements were issued it has been agreed with Transport Focus that the sample for this survey should initially be drivers who are resident in England. Once experience has been gained it may be decided to extend the survey to include drivers who are resident in the other nations of the United Kingdom (UK) who use the SRN. The sample design should allow for this possibility.
The reason for focusing on drivers, rather than passengers is that they will necessarily focus on the SRN while they are using it and are more likely to know where they are when events occur. Passengers will have a less comprehensive experience and, to the extent that it is different, this can mostly be reported by the driver, even if not experienced personally.
It will also be important to obtain the opinions of transport fleet decision makers as well as those of commercial drivers. However, work to establish the satisfaction of pedestrians and cyclists will be handled separately, since the needs of both groups will often be focused on specific local issues or topics and are therefore likely to be better dealt with by using surveys targeted at the specific topic rather than a large national umbrella survey which can collect general opinions but lacks sufficient sample detail to provide useable evidence of the type this survey is designed to produce.

54
3.4 General considerations and their implications The description of the general considerations of the sample design make it clear to us that the research design must employ some form of random sampling, particularly given the new relationship with Highways England and the likelihood of this research being used as at least some input into remuneration decisions. Of the three random design solutions that need consideration we rule out telephone not on sample grounds, but rather on the grounds of its unsuitability as an efficient way of displaying maps and other prompt materials necessary for carrying out the detailed interview. While telephone is now a sampling technique with extremely high levels of coverage - 98% - a large amount of this is via mobile and is unsuitable for interviews in which a substantial amount of secondary material - maps etc. - is required, as this would need to be sent before a full interview could be undertaken. We therefore rule out telephone interviews as being suitable for this research.
The picture regarding personal interviewing is more complicated. The National Travel Survey – NTS - is the core transport survey and continues to employ a random probability design with personal interviewing. We have no criticism of the survey and, were resources available and the sample needs the same for Transport Focus as for the Department for Transport, would not hesitate to use such a design. However, the requirements for the Transport Focus survey vary in a number of ways.
Firstly, there is the issue of who to interview and with what frequency. Clearly the priority of the Transport Focus survey is to interview drivers of vehicles, and to oversample various categories of drivers because of their economic priority - commercial drivers in all their variety - or because of their social needs, the disabled, old or novices. This requirement either makes for differing forms of sample contact to get sufficient numbers, or very high costs to screen a sample of adults to yield adequate samples of specific categories of drivers if employing a personal interview approach. We do not think it proper that a major customer satisfaction survey uses different forms of sampling and data collection for the measurement of its primary dataset across different categories of user. There is the highest likelihood that the results of differing forms of customer satisfaction surveys will become bogged down in arguments about different techniques rather than the more important matter of common wants and needs. We do not believe personal interviewing is an approach that is open to Transport Focus for the core measures of this survey.
Secondly, there is the problem of using very high levels of sampling contacts for personal interviewing to provide adequate numbers of populations such as HGV or disabled drivers. Certainly we believe it is possible to painstakingly build up a series of sampling frames of groups such as HGV drivers, disabled drivers or taxi drivers, but there are severe problems of integrating them adequately into a single clustered area sampling frame. Also the cost of building up a complex master sample of all these different groups would be high as it would have to be repeated annually on most samples. In our experience we judge that the cost of such an approach, when added to the high cost of personal interviewing, will make this an unacceptable option.
Thirdly, it is a fact that resources have to be rationed between the many requirements for them at a time when the emphasis is on austerity. The coverage of the Internet amongst individuals - the percentage of adult population that have access to the Internet - is now in excess of 86% (Eurobarometer 20148) of individuals. Amongst drivers of any form of car, commercial vehicle or motor bike we estimate that it is higher - of the order of 90% plus,
8 Special EB 414 - E-Communications & Telecom Single Market Household Survey, January 2014. Extract from special analysis of data for publication by ESOMAR.

55
given licence holders bias toward the 18-74 age group and to those of the top four quintiles of income distribution. At this level we believe the coverage is more than acceptable and at normally accepted levels of a very strong coverage.
On balance therefore the concept of a self-completion interview, one using the Internet rather than a postal survey, is preferred given that one can oversample sub-populations of both commercial and socially interesting drivers if the Driver and Vehicle Licensing Agency (DVLA) licence database can be used for drawing the sample.
3.5 Our preferred approaches When considering the primary population of interest, it is apparent that the emphasis in the research that Transport Focus is seeking to carry out should be the experience of the most recent journey as a driver on a route which included any part of the SRN. This raises some interesting definitional issues that need to be addressed prior to designing alternative research approaches. Firstly people can be drivers of cars, commercial vehicles, motorbikes, cycles or be passengers - there are one or two hardy souls that can be in all categories at different times. So if we want to interview about the most recent experience we may need to choose between the different categories that they are eligible for. Alternatively, in a vehicle that actually made the most recent journey there may be more than one driver to choose between. Thus there is typically for a private vehicle one adult whose name is on the taxation form for the vehicle, but there may be additional or different adults actually driving the vehicle. Neither of these factors stops either sampling technique being used, but they are points which one has to be aware of.
Secondly, it is apparent from the research data already collected, that the frequency of travelling on the SRN varies from every day down to once a month or less often. We need to allow for weighting the data by frequency of use so as to represent the heavier users’ views in the right proportions.
Thirdly we need to agree the length of time since a qualifying journey that we ask respondents to try to recall - for example in the last seven days, four weeks or last three months - to make the research reasonably accurate.
Finally, irrespective of the sample employed, we cannot use results if drivers have not made any recent current trips - we need to consider ways in which non users of the SRN network could be under-sampled to stop wasting resources. Section 3.5.1 proposes a systematic way of doing this by sampling postcode sectors with probability proportional to their distance from the SRN.
The DVLA possesses files of both drivers and vehicles which are maintained for administration and statistics. This gives them an opportunity to use the files for building a sampling frame for self-completion or face to face research. Both files are complete and up to date lists of their sampling populations aside from any normal delays due to administrative work load. In view of the objectives of this survey, it would not surprise driving licence holders if they were contacted by the DVLA and asked if they were willing to participate in a road user satisfaction survey. This is the best and most cost effective way to draw a sample of drivers and to oversample specific interest groups while maintaining the overall integrity of the sample design.
3.5.1 Driving Licence Files(s)
Of the two files available we prefer the file containing the driver information. This file, we understand, contains full name, address and postcode, age, whether the driver has conditions by which they are disabled in a variety of ways, vehicle types for which licences
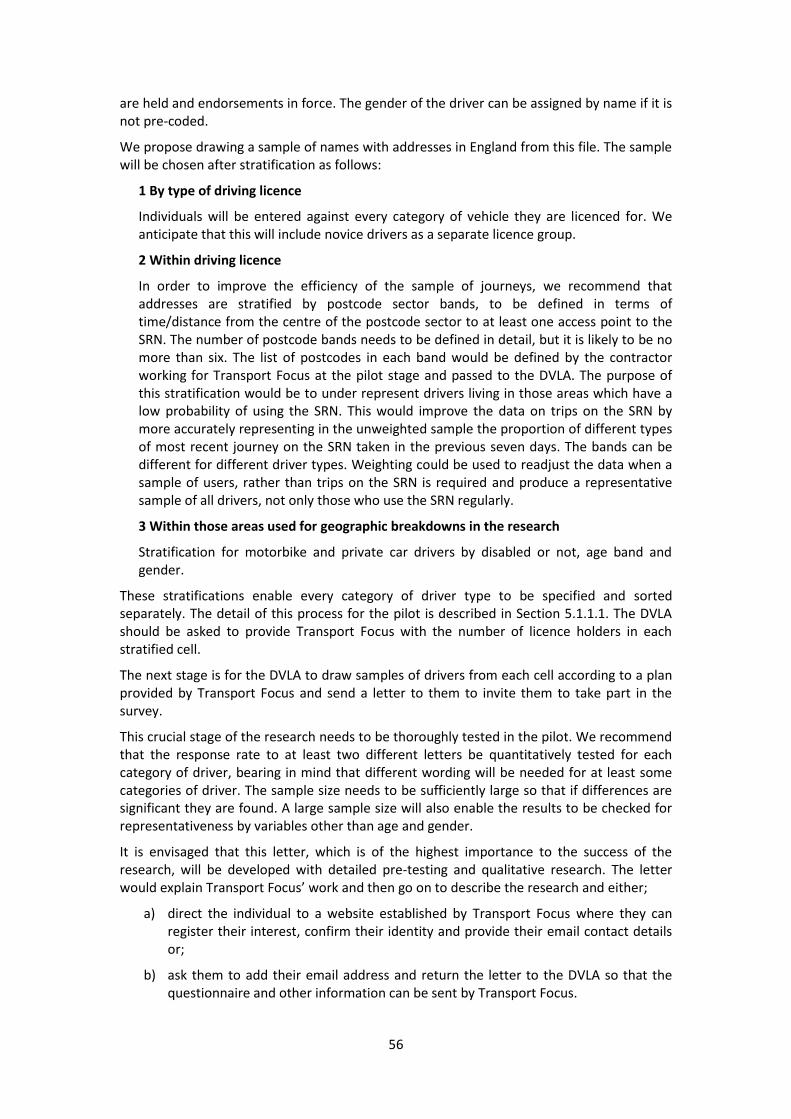
56
are held and endorsements in force. The gender of the driver can be assigned by name if it is not pre-coded.
We propose drawing a sample of names with addresses in England from this file. The sample will be chosen after stratification as follows:
1 By type of driving licence
Individuals will be entered against every category of vehicle they are licenced for. We anticipate that this will include novice drivers as a separate licence group.
2 Within driving licence
In order to improve the efficiency of the sample of journeys, we recommend that addresses are stratified by postcode sector bands, to be defined in terms of time/distance from the centre of the postcode sector to at least one access point to the SRN. The number of postcode bands needs to be defined in detail, but it is likely to be no more than six. The list of postcodes in each band would be defined by the contractor working for Transport Focus at the pilot stage and passed to the DVLA. The purpose of this stratification would be to under represent drivers living in those areas which have a low probability of using the SRN. This would improve the data on trips on the SRN by more accurately representing in the unweighted sample the proportion of different types of most recent journey on the SRN taken in the previous seven days. The bands can be different for different driver types. Weighting could be used to readjust the data when a sample of users, rather than trips on the SRN is required and produce a representative sample of all drivers, not only those who use the SRN regularly.
3 Within those areas used for geographic breakdowns in the research
Stratification for motorbike and private car drivers by disabled or not, age band and gender.
These stratifications enable every category of driver type to be specified and sorted separately. The detail of this process for the pilot is described in Section 5.1.1.1. The DVLA should be asked to provide Transport Focus with the number of licence holders in each stratified cell.
The next stage is for the DVLA to draw samples of drivers from each cell according to a plan provided by Transport Focus and send a letter to them to invite them to take part in the survey.
This crucial stage of the research needs to be thoroughly tested in the pilot. We recommend that the response rate to at least two different letters be quantitatively tested for each category of driver, bearing in mind that different wording will be needed for at least some categories of driver. The sample size needs to be sufficiently large so that if differences are significant they are found. A large sample size will also enable the results to be checked for representativeness by variables other than age and gender.
It is envisaged that this letter, which is of the highest importance to the success of the research, will be developed with detailed pre-testing and qualitative research. The letter would explain Transport Focus’ work and then go on to describe the research and either;
a) direct the individual to a website established by Transport Focus where they can register their interest, confirm their identity and provide their email contact details or;
b) ask them to add their email address and return the letter to the DVLA so that the questionnaire and other information can be sent by Transport Focus.

57
Although the first alternative is more straightforward, it is possible that a straight return to the DVLA will produce a higher response rate. It will not only be possible to identify which invitation approach produces the best response, but also check the response rate for each stratified cell and if necessary adjust the number of invitations issued in the main survey to particular cells which may have a lower response rate (e.g. HGV drivers) or a higher one (e.g. elderly drivers).
This approach to sample design will produce a sample of different categories of drivers which are of interest, including several categories of private driver and the same of commercial drivers. Each of these categories can be treated as separate samples, but they can also be joined together to produce larger aggregates of drivers. When making this combination a weight will be applied to each category to adjust them to represent the right proportion for each category in the combined total. Within the separate categories, weights will be applied to correct for differential sampling by distance from the SRN, and also by the demographics of each driver category to correct for any differential response by area, gender, social class, age, class of car, annual mileage, or any other factor found to be correlated with use of the SRN. It is recommended that this uses a mixture of sources, depending on what is available to Transport Focus.
The data will need to be analysed in two ways; the first by drivers and the second by trips. To make this possible an additional stage of weighting will be introduced to weight drivers by frequency of trips on the SRN, because only data about one trip is collected in full. Allowance will also need to be made for those private drivers who make more than one there and back trip a day, and a similar procedure can be applied.
This amount of weighting is typical of a pan-industry survey. By sampling all driver categories from the same sampling frame, it is possible to make the data genuinely comparable, rather than the more common approach of having different streams of data for different driver categories.
3.5.2 Vehicle registration file
The second method is less viable because it uses the vehicle registration file and therefore only private cars, and a small number of privately owned taxis, vans, minibuses and the like are contained on it. Only the registered keeper need be shown for each vehicle and therefore other drivers have to be sampled via the registered keeper or left out of the research. Unless all the files are linked there is no age information and furthermore distinctions such as whether the driver if disabled is not available. It is therefore necessary to build in more steps if the information that lies in the first approach is to be duplicated.
The master file consists of nominated keepers of registered vehicles. Drivers of fleet vehicles are largely excluded. The stratification approach would be similar to sampling holders of driving licences:
1 Sort as before by travel time/distance band that the address postcode is from an SRN access points.
2 Sort by gender
Draw a sample from the list and send a letter explaining the purpose of the research, asking for registration on a website established by Transport Focus where they can register their interest, confirm their identity and provide email contact details where the nominated driver can be contacted and also the email addresses of any other drivers of private or commercial vehicles found within the household.
As with the driving licence file the development of the letter will require significant qualitative research and pre-testing and the emails to other household members will require

58
the same. Clearly response rates to both the letter asking for other members of the households email addresses and the subsequent replies from those members will be lower because of the greater number of stages and also possible problematic relationships within households, particularly those with non-familial relationships.
We do not envisage this method making it possible to oversample groups such as the elderly, the disabled and novice drivers unless an extremely large number of contacts is made at the first mailing stage. Nor does this method lead to a sample of commercial vehicle drivers of sufficient size.
We would not measure commercial drivers on the registered keeper sample except for some small vehicles garaged at home. These would need to be recruited separately via their employer and would therefore provide a more clustered sample of users
3.5.3 Other sampling approaches
We have given substantial efforts to identifying another sample frame for drivers of fleet vehicles. Whilst there are methods of sampling users, using telephone for example, the costs of compiling a sampling frame that is built up to cover all the different varieties of drivers, some of which are of very low incidence in the general population or frequently away from home (e.g. disabled and high mileage drivers) and the costs that would be further added to get a sample of commercial drivers cannot be cost justified in our opinion.
3.5.4 Incentives for respondents
Incentivisation is a complex area, as is the subject of response rates more generally. With either method we will have at least two stages at which a refusal is possible. We expect to offer those who take part in the main study an invitation to participate in future waves of the survey and opportunities to participate in further studies. A non-financial incentive, like a top-line summary of the survey results, or a straight financial incentive, might improve the response rate to both the initial survey and subsequent invitations to respond to further surveys. We therefore recommend testing a non-financial incentive and two financial incentives in the pilot to establish the impact on response rates and willingness to participate in future surveys.
3.5.5 Recommended sampling approach
To recap, our recommendation is to use the driving licence file to draw a representative sample of drivers across all categories of road user. We recommend a letter from the DVLA to collect the email addresses of drivers and some profile information, if they are directed to a website established by Transport Focus for the purpose. This would be followed by an online interview administered via the Internet, including on mobile devices. This interviewing would be carried out continuously throughout the year. In order to maximise the cost-efficiency we would expect to re-interview respondents in the main survey several times at roughly three month intervals before deleting them from the sample.
It is worth summarising why we have chosen this approach and not one of the others.
The Transport Focus responsibility is to act as a watchdog on behalf of the users of the SRN. The main users of the SRN are drivers of vehicles including commercial and private. It is vital therefore that all categories of driver are included and that the sub-groups of interest – the disabled, the elderly, novice drivers, motorcyclists, as well as all classes of commercial drivers are included.
A classic research design using multi-stage stratified clustered sampling is perfect for the NTS, but providing a satisfaction survey for the SRN cannot be done using a clustered sample because of the need to avoid too many drivers using the same part of the SRN, even joining

59
and leaving it at the same junctions. The inability to pre-identify drivers in minority sub-samples which need to be boosted will make the exercise much more costly if the DVLA file cannot be used and effectively unworkable for this purpose if interviewing in person. Whilst it would be possible to screen for minority driver types using some suitable frames, this would still be very difficult and expensive using personal interviewing and the costs would be sharply increased by the need to use an unclustered sample. Furthermore, high mileage business and commercial drivers are likely to be much more difficult to contact at home than the average, requiring multiple recall visits. Telephone interviewing would overcome the problems associated with clustering, but the cost will still be significantly higher than using a postal contact followed by online interviewing approach. We estimate internet coverage for the driver population to be of the order of 90% plus. This level of coverage is easily sufficient for our needs. The telephone interviewing method would also make it difficult to map routes which will require maps to accompany the interview. Arranging to do this would be extremely difficult, if not impossible to do when conducting the interview on a mobile phone.
The driving licence file and the vehicle keeper file could both be used as stratified sample frames. The driving licence file fills all the needs of Transport Focus in terms of stratification whereas the vehicle keeper file is limited to private and smaller commercial vehicle drivers and only goes to the vehicle keeper, not all drivers, and it lacks fleet drivers altogether. We have no hesitation in proposing the use the driving licence file as the best and most efficient sampling frame.
3.5.6 Other special samples
There are a number of other categories of driver or interested party that are listed for research. If it is necessary to cover foreign drivers of commercial vehicles we would recruit a sample of drivers using interviewers in person at ports/Eurotunnel.
3.5.6.1 Fleet transport managers
For decision makers in commercial freight and fleet organisations and coach operators an annual internet survey of 300-500 companies would be undertaken.
The sample should be designed to over sample decision makers in large organisations, relative to smaller ones, in proportion to the number of vehicles operated. This will ensure that the sample gives more weight to the responses from larger operators and reflects the actual numbers of vehicles on the road.
For small and medium size operators the best way to generate a representative sample is to ask an unclustered random sample of commercial drivers who they work for. This information can be collected from commercial drivers in the main sample. The large organisations are more efficiently sampled by using lists, to ensure that the balance of types of transport work and size reflect the structure of the industry. It is possible that some of these organisations may be sited in Scotland and Wales and of sufficient importance that they should be included even though not English.
Unlike the samples of drivers, it is recommended that the fieldwork for this research takes place over a fixed period of a month or so. A limited fieldwork period makes it possible to avoid times of the year when different political discussions, industry issues or media coverage may affect the results. The questionnaire will be very different from the interview with drivers. It will focus on the issues relevant to fleet managers in different sectors. Some of these issues have already been identified in the stakeholder interviews for this review.
Interviewing such a sample is almost certainly best done using the internet and we would expect the questionnaire to be developed and pilot tested after qualitative research. It is

60
quite likely that the organisation doing this research will be different from the contractor handling the main survey fieldwork

61
4 Considerations for Questionnaire Specification
4.1 The requirements for a new satisfaction survey Transport Focus has a number of key requirements for the new satisfaction survey:
Detailed information about road user’ experience of using the SRN and their satisfaction with different aspects of the provision
Results that accurately distinguish between road users of motorways, trunk roads (i.e. A-roads operated by Highways England) and exclude, as much as possible, opinions about roads outside the SRN. However, we may also want to capture feedback on the door-to-door journey whilst being able to disaggregate feedback on the SRN and specific types of SRN roads too
Understanding satisfaction scores for different parts of the SRN, for example A-roads that are dual carriageways, single carriageways, run through built-up areas, etc.
The needs and experiences of commercial road users, e.g. HGV and LGV drivers, and the freight/logistics businesses
Inclusion of vulnerable road users’ opinions such as disabled, older or novice drivers
Inclusion of the opinions from other individuals such as cyclists and pedestrians
A consistent way of measuring satisfaction levels that cover all aspects of the road user’s experience
An overall satisfaction score for the SRN. Highways England conducted significant development work on a satisfaction score as part of NRUSS KPIs in 2010; this work should be considered as part of this review.
4.2 Design of the interview(s) The most important objective of this survey is the last one; the provision of a reliable overall satisfaction score. However, that is not of much operational use without some information about the reasons for the score. As the literature review demonstrates, it is possible to ask a huge number of questions providing detailed analysis of every part of a trip. A limit is imposed by what it is reasonable for respondents to be asked to recall. This limit depends to quite a large extent on how recently they last used the SRN, but also on the length of the interview that people are willing to complete before fatigue sets in.
It is also important to remember that events which create a strong impression, like major hold-ups, dangerous driving and crowded service areas are likely to remembered for longer than positive experiences, like good signage and information, effective roadworks management and pleasant service areas, unless the impact was far above expectations. This may be a reason why some of the work carried out on the drivers of user satisfaction with roads focuses more attention on the importance of eliminating bad experiences than on other areas of service delivery. We are therefore recommending that detailed data is only collected on a trip which has been made in the last seven days. The desk research in Chapter 1 draws attention to the NRUSS, ARUSS, Transport Focus’ and the Department for Transport’s qualitative research which demonstrate the importance of eliminating negative experiences, but nevertheless concludes that other work on user satisfaction emphasises the role of factors which influence users’ perception of their experience of using the roads. Information which helps manage users’ expectations and provides them with ways to control their journey to minimise bad experiences is an important way to achieve this. The design of the interview, although close to the existing NRUSS in many aspects, must include

62
questions designed to measure these “softer” aspects at the expense of some of the more detailed questions on network performance, which can either be derived from other sources, like traffic flow measurement, accident data and observations of the state of the roads and signage performance, or from recall surveys designed to cover specific topics.
As discussed in the section on sample design, an online survey design which provides the possibility of re-interview makes it relatively simple to ask further questions about specific experiences or identify sub-samples who use particular parts of the network on a regular basis for a more detailed interview. In considering the structure of the interview and outline questionnaire we have attempted to ensure that all the important elements that go to make up customer satisfaction are covered, while leaving out detail that can be collected from a recall interview or by re-interviewing respondents who are likely to make the same journey regularly. In this respect a further benefit of online interviewing is the ability to use background processing of responses to ask additional questions about particular topics using a probabilistic selection filter. This ensures that not everyone has to answer all questions by presenting questions on experiences that are less common only to those for whom the questions are relevant.
4.2.1.1 Interview length
We are recommending that two questionnaires should be piloted with lengths of 10 minutes and 20 minutes for private licence holders, and small commercial vehicles. A questionnaire that is much longer than 10 minutes is going to reduce participation rates and data quality. This relates to the rapid growth in the use of mobile internet via smart phones and tablets as the primary way of connecting with the internet for personal communication making longer interviews difficult to obtain. If the objective is to represent all users of the SRN and get a reliable overall measure of satisfaction it is essential that the data collection system is easy and straightforward to use and takes account of the environment of respondents. Some commercial users, in particular, are less likely to regularly connect to the internet to review their email or visit their Facebook page using a PC or laptop and more likely to use a smartphone. The reason for choosing to test a longer questionnaire in the pilot, is not primarily to measure the impact of interview length on the level of response, but to enable us to collect enough data to examine the best way to measure satisfaction and refine the questionnaire for the final survey.
It may emerge that even a 10 minute questionnaire is too long for some categories of user (particularly commercial drivers) and that the interview for some categories will have to be much shorter (5-6 minutes) to obtain an acceptable response rate. If the response rate cannot be improved by good questionnaire design and incentives, the questionnaire will need to focus on collecting less detailed diagnostic data and will therefore require more reliance on recall interviews if the reasons for scores are not clear enough from the answers. General suggestions have been made about what such a questionnaire will look like in Section 4.3. We recommend that this reduced alternative questionnaire is only developed after the pilot if it becomes clear that it will be necessary. More information will be available after the pilot about what works and must be included and what can be dropped to achieve a shorter questionnaire which is still sufficiently sensitive if the response rate is poor.
The questionnaire for private vehicle use and taxis should establish whether drivers have used the SRN in the previous year and the frequency and purposes for which it has been used. The questions should be similar to their equivalents in the current NRUSS. It is recommended that the questionnaire collects detailed information on one trip on the SRN that has taken place in the preceding seven days. If respondents have not made such a trip on the SRN more general information will still be collected about their opinion of the SRN and a satisfaction score obtained. If they have made more than one trip on the day the last

63
trip was made, the software will choose a trip according to rules which will be designed to get a representative sample of different trips, times of day and days of the week. The questionnaire will then cover the experience of that trip in some detail and satisfaction with different elements and features of the SRN. The final part of the interview which will be administered to all respondents who have used the SRN in the previous year, or possibly longer if trend data is required, will cover an overall evaluation of different aspects of the network and overall satisfaction.
We propose that the trip-based measure derived from the most recent experience should provide the single overall measure of satisfaction. A second measure that will provide an overall measure of satisfaction among the population, equivalent to an opinion poll should also be produced. This second measure will not be weighted to account for frequency of use and therefore is not a “fair” measure of user experience, but it provides an overall measure of public satisfaction which is inevitably more strongly influenced by infrequent users. It will be useful for Transport Focus in explaining its user satisfaction scores in relation to other surveys which are normally based on individuals, not trips. This also allows for the collection of information about awareness and satisfaction with Highways England, if that is regarded as necessary.
The interview for commercial users – HGV, Coaches and possibly LGV - will need to employ a different way of measuring trips since these respondents are likely to visit multiple destinations over a single day and return to base. We suggest using the day as the unit, because the stakeholder interviews suggested that it would be better to focus on the problems during the day, rather than picking arbitrarily a sub-set of the day and miss a key experience. This will probably mean a longer interview. The trade-offs necessary to design the best way to deal with this will have to be evaluated during the pilot.
4.2.2 Outline of the interviews
4.2.2.1 The main interview
The main interview will be confined to drivers of vehicles who have used the SRN in the previous 12 months. Those who drive a car regularly and have not used the SRN will be asked the reason(s) for this, to establish if there is a significant level of conscious avoidance of the SRN and an emerging trend, which can be followed up subsequently. The interview will cover:
Introduce SRN and establish frequency of different types of trip in previous 12 months and select appropriate questionnaire
Establish last trip within 7 days and choose trip to cover
Collect route, time, purpose etc.
Collect selection of information by road (sector)
General rating of aspects of trip
Overall assessment of performance of SRN on that trip
Taking last 12 months as a whole, experience of and satisfaction with SRN
Respondent profile data can be collected at recruitment if the recruitment letter from the DVLA directs the potential respondent to a website where they can accept the invitation to take part in the survey. The design of the interview should allow for optional questions to be inserted in the final survey for a period of months. This will make it possible to pilot new questions which may be needed as the network and technology improve, and also allow the collection of information for extra analysis. An additional question collecting more detail on

64
the use of information systems, experience with service areas or attitudes to driving, for example, over a period of three months is likely to provide a large enough sample for most kinds of extra analysis. This built in flexibility will also allow respondents whose trip covers particular roads to be presented with extra questions focused a topic of interest specific to that road, for example a different way of managing roadworks or accidents.
4.2.2.2 Interest group interviews
This basic shape of the interview will work for all subgroups apart from transport fleet managers, other interest groups and visitors from outside England. Transport Focus needs to decide the extent to which the other nations of the UK need representation. All of these groups will need specific interviews tailored to assess their experience and satisfaction. We expect them to provide an assessment of the performance of the network, rather than specific trips, and therefore to be more like a traditional survey design.
4.2.3 The interview delivery platforms
The interview interface for most respondents will be their PC or laptop. However, as discussed above, increasing numbers will need to be offered the chance to respond on their smartphone or tablet. This is a platform which must be tested in the pilot, since the use of mobile internet is growing fast (see graph below).
It will be necessary to experiment with ways to present the SRN on smartphones with different screen sizes. We have doubts about whether the SRN can be described sufficiently accurately in an interview administered on a screen smaller than a medium sized smartphone [e.g. the Samsung Galaxy S6 (130mm, 5.1 inches diagonal), the iPhone 6 (120mm diagonal, 4.7 inches diagonal), the HTC One (119mm, 4.7 inches diagonal) or the Nokia Lumia 920 (115mm, 4.5 inches diagonal)]. The technology of presenting maps and questionnaires is, however, evolving rapidly and our concern about respondents not being able to identify their use of the SRN on smartphones with smaller screens may prove to be unfounded. Any experimentation and software development should ideally be carried out before Stage 2 of the pilot survey begins. It could be carried out during the Stage 1 of the sampling phase, in order to avoid causing a delay.
4.2.4 Timing of interviews
It will be desirable to interview continuously in order to meet the objective of providing coverage of the whole network and transient and unexpected events. A process will need to be applied over major holiday periods like Christmas to ensure of coverage of days when interviewing cannot be carried out and it may be decided to boost bank holidays and other periods of interest where behaviour changes to increase the number of infrequent trips in the sample. This will provide a larger sample for analysis of unusual or infrequent trips while weighting can be used to ensure that the total remains representative.

65
One of the objectives of the pilot will be to understand how soon after receiving a questionnaire interviewees respond and, if necessary build some time management into the administration software, to ensure a regular distribution of replies over the seven days of the week. This can then be optimised further as the main survey data collection is running.
4.3 Outline of main questionnaire Each of the elements of the main interview will be discussed in more detail in the following sections. It is recommended that the pilot survey is used to test the elements of the questionnaire and improve question design. For this reason, we would expect the chosen contractor to arrange to pilot all the questionnaires on small samples to optimise the question wording, before embarking on the main Stage 2 pilot interviews.
In preparing the questionnaire detail we have carefully considered the development work carried out by the Department for Transport on KPIs for the NRUSS (NRUSS KPI Development Overall Report, Highways Agency 2010). We agree with the factors identified, although as set out in Chapter 1, satisfaction is strongly influenced by the extent to which experienced travel time reflects expected travel time, and we believe that to be comprehensive and cater fully for future developments, steadily increasing congestion which may be so slow as to not be apparent from the last journey data needs to be taken into account9. Also, data on any possible increase in journeys or parts of journey avoiding sectors of the SRN because of congestion or other perceived weaknesses like safety need to be collected. Experience of this can be asked at the end of the interview as a general question. Furthermore, soft factors like providing more information and managing expectations may become more relevant to satisfaction as more vehicles are equipped with suitable technology and the number of people using smartphones with unlimited (or high volume) data contracts continues to grow.
The sections identify proposed lengths which together make up 10 minutes for the shorter interview and 20-25 minutes for the longer one. These timings are feasible but will require some constraint by potential users and a focus on the key drivers of satisfaction at the expense of detailed diagnostic data. This can be collected separately, if needed, using recall interviews.
4.3.1 Introduction and frequency of use of SRN
The introduction will explain the purpose of the survey and its approximate length. It will cover:
Confirmation that respondent has driven a vehicle in previous year (in England) and of licence class(es)
Experience, as a driver, of different classes of vehicle in previous 12 months and allocation to specific sample
Introduction of SRN
Total length 3 minutes (If the driver’s experience can be established at the recruitment sign up using a dedicated website the time can be limited to confirmation that the respondent has driven a vehicle in the previous year and introduction of the SRN, the total time for this section can be reduced to 1.0 minute.)
9 National Statistic ‘Reliability of journeys on the Highways Agency motorway and A-road network’ shows a last
five years’ peak of 81.5% of journeys ‘on time’ in Spring 2012. Since then performance declined to 77.0% in May 2013 before improving to 78.7% in January 2015 (https://www.gov.uk/government/publications/reliability-of-journeys-on-the-highways-agency-s-motorway-and-a-road-network).

66
The most important single element of this interview will be how the SRN is explained to respondents. Software exists which can provide maps with the SRN clearly distinguished from other roads. This can also propose routes once the starting and finishing point are the known and allow for them to be adjusted to fit an actual trip. We believe it would be feasible to write software which would highlight the different sections of the SRN used on a particular trip and present the questions about each sector together with the map. This would work well on a PC, laptop or tablet (like an iPad Mini) and on a large smartphone. What is not clear, without experimentation, is whether this could be made to work on the small screen of smartphones with screens smaller than 5 -6 inches diagonal measurement.
The recent research for Transport Focus - “Maps and Apps” carried out by Future Thinking -has identified some of the problems of using interactive maps presented on screen and also proposed solutions. Three of the key findings are that:
a. the SRN needs to be more clearly delineated than is the case on the digital maps used in SatNav devices, copying the colour highlighting approach used in NRUSS paper maps;
b. small linking roads, especially trunk roads and those in the peripheral areas of large cities can be confusing and get mis-identified and,
c. using the system takes longer than working with paper maps, although the results will be more accurate than paper if the interface is improved as recommended.
Since the development of the special software will require adding new modules to standard online interviewing software, it is likely that there will be significant development cost and time. We have not obtained any estimates, but it would be wise to allow three months for development and possibly longer. For this reason, there may be a wish to use a version of the existing NRUSS approach in the pilot. This would use images of maps which are not interactive. Identification of use of the SRN might not be easy or accurate on a device smaller than a medium size smartphone10. However, this approach could be tested using the internet browser in mobile phones and therefore use standard software. If this does not work very well in the pilot, the investment in developing suitable software should be considered for the main survey.
There will inevitably be concern that a recall based approach, even using interactive mapping, may still contain errors. As part of the pilot exercise, it would be feasible to use special satellite tracking devices to track a sample of SRN users to establish how accurate their recall of their journey on the SRN was. In this case, people would be recruited who use the network and asked to carry the GPS device for two weeks. They would agree to answer questions about their experience at the end. What they would not be told is that part of the final survey would be to complete the last SRN trip element of the survey questionnaire. The equipment to do this already exists and is available to use for this purpose. However, there would be a lead time of around three months for delivery and customisation as well as a fieldwork period that would probably need to last around 6-8 weeks.
4.3.2 Frequency of use
We would aim to replicate the frequency questions in the existing NRUSS as closely as possible, since they appear to be good questions and there will be a benefit in continuity of this data. The one area where a slight change may be needed is in the questions for commercial users, since there may be a need to establish more detail about the general nature of their journeys as well as the frequency
10 This is discussed in more detail in Section 4.2.3

67
Frequency of use in total and for specific purposes e.g. commercial (plus by type of trip for commercial questionnaire), business, leisure/friends/shopping etc., commuting etc.
Frequency of use of motorways and trunk roads separately
Total length 2 minutes
In the very short (5-6 minute) interview only total frequency and frequency of use of motorways and trunk roads separately would be collected – total length 1 minute.
4.3.3 Last trip
This section and the next are the ones where restricting the interview length is likely to cause the most difficulty for users of the survey who are used to receiving detailed data about every aspect of road use. What has to be remembered is that this is a satisfaction survey primarily and not a comprehensive management tool in a single piece of research. The quality of the data about how the SRN is being used and satisfaction with its performance on key measures needs to be as accurate as possible. Making the questionnaire very long will provide more detail, but not a great deal more accuracy and, as length increases, at a certain point respondent fatigue will set in reducing the response rate and the reliability of the data.
To keep the interview to a reasonable length and to make answering easier for respondents, it is recommended that roads in the peripheral areas of large cities are linked, rather than seeking answers on each separate segment. This is a relatively straightforward piece of programming. It can also be used to break up sections of long roads for additional questioning, or just for analysis purposes, without adding any questions. The A303 is an example where this might be useful.
Identification of last trip, listing roads used (using interactive map) Start time of trip on SRN and length of journey including stops, plus length of stops/delays, if longer than expected amount of extra time and reasons For each sector – Rating of journey and unprompted reasons for answer if below a certain score e.g. less than 7 out of 10 Overall rating of trip on SRN and whether better or worse than expected plus unprompted reasons Overall rating of local roads used to get to and continue on from SRN and unprompted reasons if low score Rating of SRN for that trip on a range of factors e.g. congestion, poor driving upkeep, service areas, signage, information, roadworks, management of accidents, etc. and pre-coded reasons for low scoring answers – This will be more extensive in the longer interview Use of planning information before and during trip e.g. online, broadcast, signage etc. and whether this changed their original choice of route – this will be more extensive in the longer interview Space could be left in this section for a small number of additional questions to be inserted in this section for short periods to collect extra information on specific roads or topics if needed
Total length average 5 minutes – longer interview 9 minutes
In the pilot the open ended questions on reasons will be coded by experienced coders. However, in order to keep costs under control, for the main survey we expect the contractor to consider using an automated coding system with human quality control of the coding. Automated coding systems are now highly developed and should be able to handle the sort of responses we expect in this survey, given the large sample size and continuous data

68
collection. This should produce more useful responses than a pre-coded list, which is the more common way to keep costs down.
This is the principal part of the interview where a short (5 minute) questionnaire would collect much less detail. It would simply establish:
Identification of last trip, listing roads used (using interactive map) Start time of trip on SRN and length of journey including stops, if longer than expected amount of extra time and reasons Overall rating of trip on SRN and whether better or worse than expected plus unprompted reasons Total length average 2.5 minutes.
4.4 Questions for infrequent SRN users Everyone who has used the SRN in the preceding 12 months should be asked the following questions, including those who did not qualify to provide trip data:
Overall satisfaction with the quality of the SRN over the last 12 months, if used in that time, plus whether better or worse than previously plus reasons Use of information systems Confidence as a driver on different types of road – the attitudes and behaviours collected would be more extensive in the longer interview Space could also be left in this section for a small number of additional questions to be inserted in this section for short periods to collect extra information on specific roads or topics if needed Comments on the interview Total length 2 minutes – longer interview 7 minutes
The remaining individuals contacted to take part in the survey who drive a car regularly and have not used the SRN in the preceding 12 months will be asked the reasons for this using a pre-coded list plus other reasons. Demographic profile data can be collected at the initial recruitment sign up, if it is done using a dedicated website, rather than by returning the letter to the DVLA.
In the very short (5 minute) interview only overall satisfaction with the quality of the SRN over the last 12 months, if used in that time, plus whether better or worse than previously would be asked. Total length – 0.5 minutes
4.5 Interviews for special subgroups
4.5.1 Commercial drivers
It is possible that drivers of large commercial vehicles and coaches will need a different questionnaire. Nevertheless length remains an issue, especially since they are probably one of the groups that will be more likely to use a mobile device. For this reason we think the lengths should still be targeted at 15 and 25 minutes. The differences from the main survey will be fairly minor, with the last trip taking up more time with more information on the time spent on different stages being collected and the information about the purpose of the journey, systems used and reasons for answers being different from the main questionnaire.
4.5.2 Fleet transport managers
This element of the research will need to be executed by an organisation with experience of quantitative business to business B2B research. They may need to carry out some initial qualitative work, if suitably up to date exploratory research is not available. The

69
questionnaire is likely to be best administered on the internet and may need to be longer than that for drivers. It is suggested that two lengths are pilot tested 15 minutes and 25-30 minutes.
4.6 Analysis of the results There is a lot which can be done beyond simple tabulation and charting trends to maximise the utility of this survey. Some suggestions about how additional work could be carried out on the main survey are set out here:
Post processing can be used to identify respondents who are likely to have encountered transient issues like accidents and roadworks. Their responses can be examined in detail.
Different approaches to congestion management can be examined by inferring the time and date when an individual respondent will have been on the main motorways and trunk roads. This can be used to evaluate communication processes to manage drivers’ expectations and behaviour, as well more direct interventions to reduce peak demand on parts of the system.
Indices are a powerful way of comparing differences between groups travelling at different times of day and days of the week on different roads.
Segmentation is likely to identify different types of driver with different needs and behaviours. The large sample size will make it possible to do segmentation analysis with much greater granularity than is possible with normal surveys, more like the work that is done by retailers when analysing loyalty cards.
Several different measures of satisfaction could be derived. Statistical analysis of the overall score can be used to identify the different factors that contribute to satisfaction. However, this may not yield an insensitive measurement, given the apparent importance of negative events and experiences on the way the current measures of overall satisfaction is calculated. It should be possible to develop alternative measurements which respond more to positive change.
One of unusual characteristics of this sector is that users of the SRN frequently have limited (or no) alternatives to using the network and they become used to congestion, delay and poor service if the change happens slowly, like the frog letting itself be cooked if the water temperature rises towards boiling point slowly enough. This kind of survey will not detect a decline in service if it happens slowly enough, because the change will be built into expectations about regular journeys. That is why the questions at the end are important. Encouraging respondents to take a longer view will help to identify the impact of change, but perhaps 12 months is too short. It would be worth experimenting with this question and asking about a longer timescale for part of the year, or the sample. A question about no longer using the network because of congestion, or other reasons, should operate in the same way. An occasional question module covering congestion avoidance experiences and strategies would help to identify any trends developing on particular sectors.
The advantage of having a continuous online interviewing approach with flexibility in the questionnaire and the ability to recall on a large database will provide a unique and very cost-effective research resource for a sector where the most frequent users are hard to reach.

70
5 Pilot design and evaluation
5.1 Pilot The pilot survey will not be of the same design as the final research. It is recommended that different length interviews, different invitation letters and possibly different incentive levels are tested in the pilot. The pilot will over-sample a number of driver categories, such as disabled, by more than will be necessary in the main survey, in order to provide a sufficiently large base for analysis.
The minimum sample sizes necessary to fix the response rates of the Stage 1 contact and to obtain email addresses for the Stage 2 questionnaire testing research have been recommended. Much of the costs of the pilot are base costs which will be spent irrespective of the sample size. The base costs of internet research are always a higher proportion of the total cost, but the running costs are much lower than for face-to-face or telephone interviewing.
In administering the questionnaires there is a need to be able to precisely control the day of week the respondent is talking about to make sure the sample is balanced. This will be done by asking the respondent to talk about the trip made before a defined date. For the main survey, it will be possible to oversample trips made on weekends as opposed to weekdays, because these trips are more likely to vary in route coverage. Similarly, certain times of the year can be oversampled, for example bank holiday weekends, to provide enough trips to represent these days fully. Again, this can be corrected for in the main analysis via weighting. The pilot can use this approach to test the questionnaire more fully by over-sampling particular days, even if it is decided not to use this technique in the main survey.
5.1.1 The pilot plan
The pilot plan in more detail is as follows.
5.1.1.1 Stage 1
The following steps would require access to the primary DVLA database, so would need to be conducted by DVLA or under its authority:
I. Prepare the driver file.
Geographical Information System (GIS)-based analysis will be necessary to estimate the proximity of addresses to the SRN if it is decided to use this approach to increase the proportion of SRN users in the sample in a systematic way. To achieve this, we recommend allocating all postcode sectors in England to one of up to six categories of driving time/distance from an access point to the SRN and providing the DVLA with a list of the sectors that fall into each category so that they can assign to each driver a code representing distance from the SRN.
II. Split the DVLA file into driver types. Where more than one type of driver’s licence is held the record will be duplicated for each type of licence. Within private licences codes will appended for novice drivers, the disabled and people over age 70. Gender and age codes will be added to all records and the post code will be available for subsequent geo-demographic analysis. Commercial drivers will be coded by type of licence, proximity to SRN route and age and gender.
III. Within driver type stratify by area.

71
IV. Draw a sample of drivers’ names and addresses, under sampling those who live further away from an access point to the SRN, if this sampling approach is adopted to increase the efficiency of the sample in measuring use of the SRN.
V. Write to the sample by post asking for cooperation in the survey and the provision of an email address for contact purposes. It is suggested that the alternatives of a response by letter or by registering on a website are tested in the pilot. The response by registering on a website will obviously be cheaper and make the first interview shorter because some demographic and other data can be collected at this stage, but may lead to a lower response rate to either this invitation and/or the online interview at Stage 2.
The numbers that need to be sent letters in order to generate sufficient positive responses cannot be accurately forecast without experimentation. One approach would be to pilot two or three letters on smaller samples initially and use the most promising of these to recruit the rest of the sample. This is the approach we prefer.
We expect the development of suitable letters to require qualitative research and therefore would be surprised if more than two or three final examples need to be tested.
For the testing of the questionnaire and data collection approach in Stage 2, we recommend using the Stage 1 mailing to assemble a sample of 3,000 private licence holders and a further 500 novice and disabled drivers and a sample of 1,000 over-70s. We would also need 1,000 HGV and LGV drivers and 1,000 taxi, bus and coach drivers who have agreed to take part in the online survey.
5.1.1.2 Stage 2
We plan to test a short questionnaire, 10 minutes, and a longer questionnaire of around 20 minutes.
The response from this longer questionnaire will support the development of the final survey questionnaire. We anticipate that the response rate from the best letter in Stage 1 will be of the order of 20% at most and the response rate to the internet questionnaire for Stage 2 will be of the order of 50%. However, we should stress that this is based on a range of experiences and it may be higher or lower. Response rates are typically lower in internet research, but the completeness of the frame, the ability to calculate any response bias, the absence of interviewer effects and the lack of clustering in the sample will, we believe in this case, compensate. This is particularly true when compared with only a partial coverage of the universe with expensive fieldwork using the main alternative sampling approach, which will result in very little usable data.
Assuming that at least one combination of letters and questionnaires delivers this result we would then be confident to carry out the first wave of the main survey. We would recommend that the first wave of the main survey is treated as a full scale pilot, since there will inevitably be issues that emerge and improvements that can be made once a really large sample is employed.
5.1.1.3 Summary of pilot sample
One of the principal objectives of the pilot will be to determine the best recruitment letter and optimise the response rate to that letter. There is no hard evidence on which to base the estimates. The figures in the table below represent low and high estimates for typical postal and online survey panel responses. They are realistic estimates, given the purpose of the survey, a good invitation letter and good questionnaire design. The numbers in the various samples could well be bigger than the ‘high’ estimate, they are unlikely to be below the low one.

72
Stage 1 –
Mailout*
Stage 1
Return
Stage 2 -
Stage2 -
Return
Short/long
interview**
With/w’out
incentive**
Private (including taxis and LGV)
30,000 3,000-6,000
3,000-6,000
600-3,000 300-1,500 200-500
Motorcyclists 5,000 500-1,000 500-1,000 100-500 50-250 30-170
Novice 5,000 500-1,000 500-1,000 100-500 50-250 30-170
Elderly 5,000 500-1,000 500-1,000 100-500 50-250 30-170
Disabled 5,000 500-1,000 500-1,000 100-500 50-250 30-170
HGV 10,000 1,000-2,000
1,000-2,000
200-1,000 100-500 60-330
Coach drivers 5,000 500-1,000 500-1,000 100-500 50-250 30-170
Total 65,000 6,500-13,000
6,500-13,000
1,300-6,500
650-3,250 410-1680
* Sample size large enough to allow for testing several different versions of the recruitment letter
** Assuming two interview lengths and two financial incentives plus one survey feedback, or an alternative soft reward approach, are tested.
The sampling approach and interview for fleet transport managers will also need to be piloted. For the purpose of the pilot it is recommended that a sample of 100 enterprises covering a range of activities and sizes is drawn from suitable lists and the questionnaire piloted with them. Once the main survey starts continuously, it will be possible to derive the sample for smaller organisations from the employers of the drivers, once it has been running for some months. The final weighting system will require careful development by an organisation with experience of quantitative business to business B2B research. They may also need to do initial qualitative work, if suitably up to date exploratory research is not available.
5.2 Evaluation of the pilot The pilot will evaluate:
1. The most effective way to get a good agreement to participate in the survey at Stage 1 and to provide an email contact address, including the possible role of incentives.
2. The profile of response to the letter invitation at Stage 1 and any recommendations about how to further increase response rates from different sub-samples.
3. The most effective way to get a good response rate to the online interview at Stage 2, including the possible role of incentives.
4. The profile of response to the online survey at Stage 2 and any recommendations about how to further increase response rates from different sub-samples.
5. The ability to correctly and quickly identify the last journey taken on the SRN using a selection of both fixed and mobile online devices. This will probably require a separate initial piloting exercise to build on the work already carried out by Transport Focus (“Maps and Apps”, carried out by Future Thinking).

73
6. The ability to correctly describe the last trip accurately and quickly using a selection of both fixed and mobile online devices. This may require a separate initial pilot exercise. Transport Focus should also consider testing the final system using a panel of drivers that represent the different key target groups. They will be asked to carry a tracking device and subsequently describe their last trip on the SRN using the survey questionnaire. The Maps and Apps project suggests a particular focus should be on areas around large cities where the intersections of different elements of the SRN and junctions with other roads are complex and confusing.
7. The time it takes to complete the questionnaire and the effect of the length on response rate.
8. The ability of the questions to distinguish and describe overall satisfaction with the SRN and the different factors which contribute to satisfaction and whether this is different for different target groups.
In addition, evaluation will cover any other key elements which may emerge during the development of the pilot phase and a more detailed specification for the final survey.

74
6 Conclusions
This review recommends an approach to developing a high quality and flexible approach to collecting the views of road users on the Strategic Road Network (SRN). Transport Focus need to measure road users’ satisfaction with the SRN but also to understand road users’ views on a range of aspects concerned with using the SRN.
Our key recommendation is to develop a robust online survey of satisfaction that selects representative drivers from a panel drawn from the DVLA driving licence database. The DVLA licence database contains the addresses of all drivers with licences together with information about the type of licence. It therefore provides the only cost-effective route for systematically selecting and contacting a large representative sample of drivers which contains within it over-sampled sub-groups, like older, disabled and novice drivers. The need to capture information from a diverse set of road users, and to interview reliable samples of specific sub-groups (e.g. 70+ age group), as well as to consider geographic differences was apparent from the stakeholder interviews. The recommended approach will meet this need.
We also strongly recommend that the invitation from the DVLA encourages respondents to sign up to take part in the survey on a website developed by Transport Focus for this purpose. This will enable demographic profile and other data to be collected in advance, keeping the length of the survey interview as short as possible and improving the sampling efficiency by ensuring the selected respondents meet the criteria for the sample cell for which they were selected. It will also make it possible to explain the purpose of the survey, the task and the incentive method in detail in an attractive way which will help to encourage a better engagement and response to the survey questionnaire. Nevertheless we recommend also piloting a direct postal response to the DVLA, as this may produce a higher overall response rate to the survey.
The review recommends an online method for data collection. Specific positives from an online survey include access to a large geographically-unclustered sample at sharply reduced cost compared with face-to-face and telephone methods, the ability to use interactive maps and the elimination of variable interviewer bias. It will allow a much larger sample for the same cost as any other survey method, which will make it possible to collect experiences which are fresher in the respondents’ minds. An online approach will also support interactive mapping, which should enable better identification of use of the SRN. It will allow for question modules to be dynamically inserted into the interview to collect specific information on infrequent experiences. The online character of the data collection and the option to use automated reporting for topline results will mean production times can be greatly reduced.
The survey will collect interviews continuously throughout the year: on all seven days of the week and in each of 52 weeks, and will re-interview each participant several times. This will reduce the amount of fresh recruitment needed for each wave and use the experience of the questionnaire and storage of previous answers to ease the participant’s task in subsequent interviews, increasing the effective response rate. Using continuous interviewing will also mean that transient events can be captured without the need for advance notice, for example major, unplanned road closure incidents. It will make it possible to analyse results over any time period, in order to build a bigger sample for more granular analysis, or to examine a specific topic like the impact of collisions or an experimental change to signage. Technological advances may mean that, in the future, this approach could include geo-fencing apps to look at specific locations such as roadworks.

75
As the survey continues it will create a large database of drivers with known travel behaviour that can be easily and cheaply re-contacted at very low cost for follow-up interviews and other surveys. This will also provide a valuable resource from which to draw sample drivers to participate in other research, including ‘deep-dives’ to explore the issues raised in the satisfaction survey.
The desk-based research and the stakeholder interviews explained that most other methods of collecting road user data, including the current NRUSS, are unable to achieve an equivalent sample quality and size without being exceptionally costly. It was recognised by many key stakeholders that statistical robustness is essential, especially for reliable measurement of transient events and variations in satisfaction at different times of day, days of the week and at holiday times. This requirement needs continuous interviewing and a large sample size.
The review recommends a shorter, less-detailed interview than that used by NRUSS, in order to maintain a good response rate. The primary focus of the interview is on the last trip on the SRN, in the previous seven days. This compares with the NRUSS where data on the last trip within the last 12 months is collected and in practice around 60% of these fall within the previous 7 days. The recommendation is to use the same frequency questions as the NRUSS. The questionnaire focuses on the essence of the satisfaction data collected by the NRUSS, without reproducing what is a very lengthy interview. This is made possible by limiting the amount of detailed diagnostic information collected. Further diagnostic information can be collected by re-interviewing or by substituting question modules. The questionnaire design of the main survey should allow for specific question series to be inserted and withdrawn, since we do not think it is necessary to collect all information continuously from everyone. It will also make the introduction of new questions possible as the SRN changes.
It is recommended that the pilot tests two different questionnaire lengths – 10 minutes and 20 minutes. This will provide an indication of the impact of questionnaire length on the response rate and the longer interview will also make it possible to experiment with questions and identify the most essential ones, since the main survey is likely to use the shorter interview in order to get a better response rate.
The literature and previous survey review research has indicated some of the approaches to framing satisfaction questions, but found that these are not too dissimilar to what is already being used. It nevertheless concludes that other work on user satisfaction emphasises the role of factors which influence users’ perceptions of their experience of using the roads. Information which helps manage users’ expectations and provides them with ways to control their journeys to minimise bad experiences is an important way to achieve this. The design of the interview, although close to the existing NRUSS in many aspects, should consider including questions designed to measure these more subjective or ‘softer’, aspects at the expense of some of the more detailed questions on network performance. Network performance information can either be derived from other sources, like traffic flow measurement, accident data and observations of the state of the roads and signage performance, or from recall surveys designed to cover specific topics.
In response to evidence from stakeholders, and the research brief, the review also recommends conducting a separate annual survey of fleet transport managers.
Neither the methodological review nor the literature review identified any compelling and practical ways to enhance identification of the SRN roads which would be superior to participants being guided to select their recently-experienced routes on a screen during the seven days immediately previous. Although there are some examples of within-trip or immediately post-trip delivery, there are practical constraints around the use of mobile technology, particularly at the sampling scales proposed. However, we believe that better

76
signage on the roadside indicating where the SRN begins and ends may assist survey recall whilst also helping Highways England achieve a more distinct profile amongst road operations more generally.
The design of the main survey, for which this pilot is the development prototype, will make it feasible to use a much larger randomly-selected unclustered sample of users of the SRN than is possible with the current survey methodologies. The online approach will be designed to include mobile devices. When coupled with a shorter more flexible questionnaire, this overall design will help ensure that the survey is platform independent and responsive to changes in the SRN as it develops. The online approach will also make re-contacting respondents cheap and relatively easy. The large database that will be created over time will provide a unique resource for ad hoc surveys and follow up interviews, both for quantitative and qualitative research. Taken as a whole, this survey design will provide Transport Focus with a uniquely powerful resource for measuring satisfaction with the SRN and identifying areas of weakness and strength in its performance.

77
7 References
Brownstone, D., Ghosh, A., Golob, T., Kazimi, C., Van Amelsfort, D. (2003) Drivers’ willingness-to-pay to reduce travel time: evidence from the San Diego I-15 congestion pricing project. Transportation Research Part A. Vol. 37
Buys, L., Miller, E. (2011) Conceptualising convenience: Transportation practices and perceptions of inner-urban high density residents in Brisbane, Australia. Transport Policy. Vol. 18
Calvert, T., Parkhurst, G., Parkin, J.(2015) User and community expectations of the Major road Network (MRN). A report for the Rees Jeffreys Road Fund (RJRF). UK.
Conference of European Directors of Roads (2006) European Road User Survey. Report: 2006/70. Online. [Available from:] http://www.cedr.fr/home/fileadmin/user_upload/Publications/2007/e_ERUS_2006.doc
Cook, A (2011) A Fresh Start for the Strategic Road Network: Managing our Roads Better to Drive Economic Growth, Boost Innovation and Give Road Users More for their Money. Department for Transport: London. [Available From: https://www.gov.uk/government/uploads/system/uploads/attachment_data/file/4378/strategic-road-network.pdf]
De Vos, J., Schwanen, T., Van Acker, V., Witlox, F. (2015) How satisfying is the scale for travel satisfaction? Transportation Research Part F. Vol.29
DfT (2004) Values of time and operating costs. Transport Analysis Guidance. Tag unit 3.5.6. Department for Transport: London.
DfT (2012) A Fresh Start for the Strategic Road Network: The Government Response. Department for Transport: London [Available From: https://www.gov.uk/government/publications/a-fresh-start-for-the-strategic-road-network]
DfT (2014) Transport Statistics for Great Britain. Statistical release collection (online). https://www.gov.uk/government/statistics/transport-statistics-great-britain-2014
DfT (2014) Roads Investment Strategy. Department for Transport: London [Available from: https://www.gov.uk/government/collections/road-investment-strategy]
DfT (2015) Understanding strategic road network users’ experiences and needs. Wave 2. May 2014. Uk: Department for transport
Eboli, L., Mazzulla, G. (2007) Affecting customer satisfaction for bus transit. Journal of public transportation. Vol. 10
Felleson, M., Friman, M. (2008) Perceived Satisfaction with Public Transport Service in Nine European Cities. Journal of the Transportation Research Forum. Public transit special issue. Vol. 47 (3)
Ferguson, H. (2009) Driven to care: the car, automobility and social work. Mobilities, 4, 275–293.
Fitch, G., Hanowski, R., Guo, F. (2015) The Risk of a Safety-Critical Event Associated With Mobile Device Use in Specific Driving Contexts. Traffic Injury Prevention. Vol. 16 (2)
Gardner, B., Abraham, C. (2007) What drives car use? A grounded theory analysis of commuters’ reasons for driving. Transportation Research Part F. Vol. 10

78
Handy, S., Weston, L., Mokhtarian, P. (2005) Driving by choice or necessity? Transportation Research Part A. Vol.39
Her Majesty’s Government (2015) The Infrastructure Act 2015. [Available from: http://www.legislation.gov.uk/ukpga/2015/7/contents/enacted].
Hislop, D. (2013) Driving, Communicating and Working: Understanding the Work-related Communication Behaviours of Business Travellers on Work-related Car Journeys. Mobilities Vol. 8 (2)
Highways Agency (2010) NRUSS KPI Development. Overall Report. Highways Agency
Highways Agency (2013) National road users’ satisfaction survey: results 2012 to 2013. UK: Highways Agency
Highways Agency (2014a) South West region: Area 1 report November 2013 to April 2014. UK: Highways Agency
Highways Agency (2014b) National road users’ satisfaction survey: results 2013 to 2014. UK: Highways Agency
Laurier, E. (2004) Doing office work on the motorway. Theory, Culture & Society. Vol. 21
Lyons, G., Urry, J. (2005) Travel time use in the information age. Transportation Research Part A. Vol. 39
Marketing and Development Research Associates (MDRA) (2006) Road user satisfaction survey on the completed sections of the Golden Quadrilateral. Report to the National Highways Authority of India. New Delhi, India.
Measure2imporve (2014) National Highways and Transport Survey (website). http://nhtsurvey.econtrack.co.uk/.
Pantouvakis, A. Lymperopoulos, K. (2008) Customer satisfaction and loyalty in the eyes of new and repeat customers. Evidence from the transport sector. Managing Service Quality. Vol. 18 (6)
Parkhurst, G., Kenny, F., Goodwin, P. (1992) Quality attributes of a journey: Their identification and impact on travellers. UK: Department for transport
Parkhurst, G., Dudley, G., Lyons, G., Avineri, E., Chatterjee, K., Holley, D. (2006) Rapid Evidence Assessment- Understanding the Distributional Impacts of Road Pricing. UK: Department for transport.
Passenger Focus (2013) Bus Passenger Satisfaction Survey – Autumn 2013 report. Passenger Focus.
Passenger Focus (2014) National Rail Passenger Satisfaction Survey – Autumn 2014 Main Report. Passenger Focus.
Stradling, S., Anable, J., Carreno, M. (2007) Performance, importance and user disgruntlement: A six step method for measuring satisfaction with travel modes. Transportation Research part A: Policy and practice. Vol .41 (1)
Steg, L. (2005) Car use: lust and must. Instrumental, symbolic and affective, motives for car use. Transportation Research Part A. Vol. 39
Transport Focus (2015) Road user needs and experiences. [Available from:] http://www.transportfocus.org.uk/research/publications/road-user-needs-and-experiences-full-report

79
Transport for London (2012) TLRN Customer Satisfaction Survey. Report: 10103. Online. [Available from:] http://www.tfl.gov.uk/cdn/static/cms/documents/tlrn-css-2012.pdf
True North Research (2011) Customer Satisfaction Survey for 91 Express Lanes. Report prepared for the Orange County Transportation Authority. California, US.
Woodside, A., Frey, L., Daly, R. (1989) Linking service quality, customer satisfaction, and behavioural intention. Journal of Health Care Marketing. Vol.9 (4)

80
APPENDIX 1: Full question topic list from the National Road User Satisfaction Survey
Knowledge of Highways England o Source of knowledge o Perception of responsibilities o Awareness of Highways Agency Traffic Officers o Perception of Highways Agency Traffic Officers
Driving licence details
Driving habits o Total distance driven o Distance travelled on motorway/trunk network o Frequency of motorway/trunk network use o Proximity to motorway/trunk network roads
Employment status
Use of motorway/trunk roads for commuting
Use of motorway/trunk roads for job/business o Frequency of motorway/trunk road use for job/business (excl. commute)
Frequency of motorway/trunk road use for non-work/business
Last journey on motorway/trunk network (journey information and satisfaction) o Origin o Destination o Journey to or from home o Recency of last journey o Day of last journey o Trunk road(s) used for last journey o Region of last journey o Navigation methods used (if any) o Navigation website used (if any) o Total journey distance o Journey purpose o Accompanying party details o Age details of accompanying party o Driver or passenger o Vehicle type o Vehicle ownership o Rating of sections of last journey on local roads o Qualitative explanation of above o Rating of section(s) of last journey that were on motorway(s) o Qualitative explanation of above o Rating of section(s) of last journey that were on trunk road(s) o Qualitative explanation of above o Frequency of journey o Comparison of last journey to other similar journeys
Last journey on motorway/trunk network (delays) o Time of departure from origin o Expected time of arrival at destination o Actual duration of journey o Pre-checking of travel conditions for trip

81
o Method of checking travel conditions o Website used for checking travel conditions o Allocation of extra time in case of delays o Amount of extra time allocated (if any) o Importance of prompt arrival at destination o Explanation of level of importance placed upon prompt arrival (question to
match participant’s response) o Stops en route for pick-up/drop-off of passengers o Stops en route for breaks o Use of travel information en route for update on conditions o Experience of delays o Roads on which delays experienced o Reasons for delays experienced o Amount of time added to journey as result of delay o Impact of the delay (mix practical/experiential impacts) o Advance warnings of delays o Method of advance warnings of delays o Satisfaction with journey time on motorways sections of journey o Qualitative explanations of above o Satisfaction with journey time on trunk road sections of journey o Qualitative explanations of above
Last journey on motorway/trunk network (roadworks) o Journey planning to avoid roadworks o Encountered roadworks o Roads on which roadworks were encountered o Advance knowledge of roadworks on motorway/trunk roads o Method of advanced knowledge of roadworks on motorway/trunk roads o Types of roadworks o Witnessing of work underway at roadwork site o Expectation of witnessing work at roadwork site o Explanation of expectation of witnessing work taking place at roadwork site o Signage explaining reasons for roadworks o Legibility of explanatory signing o Explanations of illegibility of explanatory signing o Satisfaction with the management of motorway sections of journey o Qualitative explanations of above o Satisfaction with the management of trunk road sections of journey o Qualitative explanations of above
Last journey on motorway/trunk network (safety) o Perceptions of safety when travelling on motorway sections of journey o Qualitative explanations of above o Perceptions of safety when travelling on trunk road sections of journey o Qualitative explanations of above o Perceptions of other road users’ driving o Examples of poor driving witnessed (if any) o Roads on which poor driving was encountered o Experiential response to bad driving
Last journey on motorway/trunk network (general upkeep) o Satisfaction with the general upkeep of motorway sections of journey o Qualitative explanations of above o Satisfaction with the general upkeep of trunk road sections of journey

82
o Qualitative explanations of above o Witnessing litter on road o Reaction to witnessing litter on road
Last journey on motorway/trunk network (information) o Satisfaction with the road signage on motorway sections of journey o Qualitative explanations of above o Satisfaction with the road signage on trunk road sections of journey o Qualitative explanations of above o Experience of Variable Message Signs (VMS) o Messages seen on VMS (if any) o Perception of blank VMS o Example of VMS message o Changes to driving behaviour as result of VMS o Helpfulness of VMS information o Importance of different types of VMS messages o Accuracy of VMS messages o Improvement or worsening of VMS messages over time o Other functions for VMS messages o Examples of other functions of VMS messages
Last journey on motorway/trunk network (Traffic Officers) o Witnessing any Highways Agency Traffic Officers o Importance of Highways Agency Traffic Officers o Explanations for importance of Highways Agency Traffic Officers (question
to match participant’s response)
All journeys on motorway/trunk network (emergency phones) o Use of emergency phones o Qualitative explanation of satisfaction with emergency phones
All journeys on motorway/trunk network (managed motorways) o Awareness of managed motorway measures o Impacts of managed motorway measures
All journeys on motorway/trunk network (severe weather warnings) o Satisfaction with severe weather warning information o Qualitative explanation of above o Accuracy of severe weather warning information o Qualitative explanation of above o Vehicle check as result of severe weather warning information o Additional items carried as result of severe weather warning information o Other effects on journey as result of severe weather warning information
Attitudinal questions o Typical speeds on motorways o Confidence/nervousness as driver and/or passenger on motorways and
trunk roads o Actions to improve travel habits/experience o Actions to improve road safety/fuel consumption and emissions o Satisfaction with Highways England overall performance o Suggested improvements to Highways Agency performance
Personal details o Household size o Main earner occupation o Gross household income o Access to driving and route-planning information

83
o In vehicle navigation o Car radio type o Mobile phone type o Access to DAB radio o Gender o Health issues making travel difficult o Blue Badge status o Number of cars/vans available to household o Nationality/ethnicity o Age range o Contact details o Further comments

84
APPENDIX 2: Author Biographies
University of the West of England, Bristol (UWE) Professor Graham Parkhurst has more than two decades of experience researching and teaching transport policy and strategy. He is Director of CTS, UWE. Graham has led and contributed to a number of research projects for the DfT, including literature reviews following rapid evidence assessment protocols into the effects of road pricing and the social distributional impacts of major transport schemes. Recently he provided advisory input into a study for DfT which examined SRN users’ attitudes towards, and expectations of, that network, which informed the roads reform legislative process. He is also a member of the Roads Reform Expert Group. At the beginning of 2015 he also co-led a short data and evidence review project for the Rees Jeffreys Road Fund collating the established findings relating to users and non-users of the UK’s major roads. Graham’s ongoing research focuses on how new transport technologies may disrupt the status quo of transport policy and practice. From April 2015 he will lead the social research work package of the Venturer project due to trial ‘driverless vehicles’ in Bristol. Dr Juliet Jain is a Senior Research Fellow at UWE who has worked in research for 15 years. Juliet has significant experience as a qualitative researcher, including interviewing transport and rail industry stakeholders and Local Authority transport planners about transport futures and future travellers, travel time use and the journey experience, and gender equality. Most recently she has been the project manager of a two-year Research Council funded project ‘Family Rituals 2.0’ (which included interviews with business stakeholders), and a shorter three-month consultancy project for Bristol Women’s Commission. Juliet also has an existing relationship with Transport Focus using data collected through the Rail Passenger Survey in 2004, 2010 and 2014 to explore the travel-time use and journey experience of rail passengers. Dr Billy Clayton joined the CTS, UWE research team four years ago as a Research Fellow, following the completion of his PhD in the Centre. As a Research Fellow, Billy has developed his research skills to include methodical literature review conduct, designing and conducting data collection exercises, data analysis, and writing project reports and academic papers. His work has encompassed qualitative interviewing for Family Rituals 2.0, process evaluation of the Better Bus Area fund, spatial analysis of Park and Ride use using GIS for the CIVITAS Renaissance project, and significant quantitative analysis on the Local Sustainable Transport Fund evaluation - often working to tight deadlines. Recently he has been engaged in analysing road user data for the Rees Jeffrey’s Road Fund, understanding road user profiles and network characteristics of the major road network. Thomas Calvert is completing his PhD that examines the experience of walking within the Centre for Transport and Society, UWE, and also holds a Masters in Transport Planning. He has undertaken a literature review on road user attitudes for the Rees Jeffery’s Road Fund.
Real Research Adam Phillips is an experienced researcher who has worked in customer satisfaction, media research, social research and advertising and communication research for nearly 40 years in the UK, the USA and the Netherlands. He is also involved in the regulation of research

85
standards through his chairmanship of the ESOMAR Professional Standards Committee and membership of the ISO Technical Committee which develops ISO Standards for market and social research. He is a Fellow of the Market Research Society Adam is managing Director of Real Research. He worked for WPP in the Kantar group for more than 30 years and set up Real Research 12 years ago. His most recent job in Kantar was CEO of Advanced Television Research which was a company he established for AGB Italia to provide the TV audience measurement for BARB. He recently reviewed the design of a major out of home audience measurement survey involving panel measurement of individuals’ travel behaviour using GPS devices and traffic flow models to predict audience exposure to out of home advertising. He chaired a technical group of statisticians and researchers from leading European research companies and institutes advising the European Commission on Eurobarometer telephone survey sample design. He designed and implemented a sophisticated telephone communication tracking survey for the European Commission (the Eurobarometer CTS) to monitor the impact on public opinion of unpredictable events and he set up the customer satisfaction measurement division in BMRB. Bill Blyth is regarded as one of the leading survey research statisticians working in the UK. He is a Chartered member of the Royal Statistical Society and a Fellow of the Market Research Society. Bill worked at TNS from 1982 until last year. He was Research Director, in charge of sample design and related subjects for the company as it grew from being purely British to becoming one of the largest research companies in the world. He designed, among other surveys, the World Bank Corporate surveys and Eurobarometer for both CAPI and CATI series. He designed and implemented Superpanel, the first in-home bar code scanning panel. He has also advised on the design of the National Readership Survey, the TGI and has been Technical Director of BARB. He chairs the ISO Technical Committee which develops ISO Standards for market and social research.