INDEPENDENT ACCOUNTANTS' REVIEW REPORT Board of …...INDEPENDENT ACCOUNTANTS' REVIEW REPORT...
26
Transcript of INDEPENDENT ACCOUNTANTS' REVIEW REPORT Board of …...INDEPENDENT ACCOUNTANTS' REVIEW REPORT...


INDEPENDENT ACCOUNTANTS' REVIEW REPORT
(English Translation of a Report Originally Issued in Korean) To the Shareholders and Board of Directors of Hyundai Motor Company: We have reviewed the accompanying non-consolidated balance sheets of Hyundai Motor Company as of June 30, 2002 and 2001, and the related non-consolidated statements of income for the six-month periods then ended, all expressed in Korean won. These financial statements are the responsibility of the Company's management. Our responsibility is to issue a report on these financial statements based on our reviews. We conducted our reviews in accordance with standards for independent accountants’ review of semi-annual financial statements as established by the Securities & Futures Commission of the Republic of Korea applicable to review engagements. These standards require that we plan and perform the review to obtain moderate assurance as to whether the financial statements are free of material misstatement. A review is limited primarily to inquiries of company personnel and analytical procedures applied to financial data and thus provides less assurance than an audit. We have not performed an audit and, accordingly, we do not express an audit opinion. Based on our reviews, nothing has come to our attention that causes us to believe that the accompanying financial statements are not presented fairly, in all material respects, in accordance with standards for preparing semi-annual financial statements in the Republic of Korea (see Note 2). The translated amounts in the accompanying financial statements have been translated into U.S. dollars, solely for the convenience of the reader, on the basis set forth in Note 2. As we draw attention to Note 1, the operations of the Company may be directly or indirectly affected by the general unstable economic conditions in the Republic of Korea and the impact of the implementation of structural reforms. As explained in Note 2, in the first half of 2002, the Company recognizes accrued liabilities of ₩246,984 million (US$ 205,512 thousand) for the projected expenses of all vehicles placed in service prior to July 2002 that are expected to be still in operation up to January 2007 due to an End-of-Life Vehicles (ELV) directive in European Union. The provision for this accrual was accounted for as selling expense of ₩22,519 million (US$ 18,738 thousand) and non-operating expense of ₩224,465 million (US$ 186,774 thousand).

Accounting principles and review standards and their application in practice vary among countries. The accompanying financial statements are not intended to present the financial position and results of operations in accordance with accounting principles and practices generally accepted in countries other than the Republic of Korea. In addition, the procedures and practices utilized in the Republic of Korea to review such financial statements may differ from those generally accepted and applied in other countries. Accordingly, this report and the accompanying financial statements are for use by those knowledgeable about Korean accounting procedures and review standards and their application in practice. Anjin & Co. (A former member firm of Andersen Worldwide. Anjin & Co. became an associate member firm of Deloitte Touche Tohmatsu effective July 2, 2002) Seoul, Korea, August 1, 2002

HYUNDAI MOTOR COMPANY
NON-CONSOLIDATED BALANCE SHEETS
AS OF JUNE 30, 2002 AND 2001 (See Independent Accountants’ Review Report)
Korean won
(In millions)
Translation into U. S. dollars (Note 2) (In thousands)
ASSETS 2002 2001 2002 2001
Current assets: Cash and cash equivalents ₩ 1,522,061 ₩ 2,035,856 $ 1,266,484 $ 1,694,006 Short-term financial instruments 1,828,347 312,600 1,521,341 260,109 Marketable securities (Note 4) 651,000 605,743 541,687 504,030 Trade notes and accounts receivable, less allowance for doubtful accounts of ₩38,868 million in 2002 and ₩22,576 million in 2001 746,013
1,015,185 620,746 844,720
Inventories (Note 3) 695,654 887,153 578,843 738,187 Advances and other 585,109 581,526 486,862 483,880 Total current assets 6,028,184 5,438,063 5,015,963 4,524,932
Non-current assets: Investment securities (Notes 4, 10 and 12) 4,008,866 2,883,012 3,335,718 2,398,912 Property, plant and equipment, net of accumulated depreciation of ₩3,275,368 million in 2002 and ₩2,572,562 million in 2001 (Notes 5, 6, 7, 10 and 12) 8,656,351
8,594,236 7,202,822 7,151,137
Intangibles (Note 8) 1,457,964 1,603,863 1,213,150 1,334,551 Other assets (Note 9) 407,884 641,696 339,394 533,946 Deferred income tax assets (Note 17) 283,382 404,092 235,798 336,237 Total non-current assets 14,814,447 14,126,899 12,326,882 11,754,783
TOTAL ASSETS ₩ 20,842,631 ₩ 19,564,962 $ 17,342,845 $ 16,279,715
(continued)

HYUNDAI MOTOR COMPANY
NON-CONSOLIDATED BALANCE SHEETS (CONTINUED)
AS OF JUNE 30, 2002 AND 2001 (See Independent Accountants’ Review Report)
Korean won
(In millions)
Translation into U. S. dollars (Note 2) (In thousands)
2002 2001 2002 2001 LIABILITIES AND SHAREHOLDERS’ EQUITY Current liabilities: Short-term borrowings (Note 10) ₩ 405,897 ₩ 828,144 $ 337,741 $ 689,086 Current maturities of long-term debt (Note 11) 949,069 1,769,331 789,706 1,472,234 Trade notes and accounts payable 2,690,641 2,759,007 2,238,843 2,295,729 Accrued warranties 379,897 211,022 316,107 175,588 Accounts payable-other 448,065 451,436 372,828 375,633 Income tax payable 439,569 336,888 365,759 280,320 Accrued expense and other 863,261 631,482 718,306 525,447 Total current liabilities 6,176,399 6,987,310 5,139,290 5,814,037 Long-term liabilities: Long-term debt, net of current maturities (Notes 7 and 11) 2,834,068
2,861,877 2,358,186 2,381,326
Accrued severance benefits, net of National Pension payments for employees of ₩77,392 million in 2002 and ₩92,148 million in 2001 and individual severance insurance
deposits of ₩662,097 million in 2002 and ₩432,186 million in 2001 (Note 2) 410,825
472,673 341,841 393,304
Accrued warranties and other 1,331,945 722,437 1,108,293 601,129 Total long-term liabilities 4,576,838 4,056,987 3,808,320 3,375,759 Total liabilities 10,753,237 11,044,297 8,947,610 9,189,796 Commitments and contingencies (Note 12) Shareholders’ equity: Capital stock (Note 13) 1,476,454 1,476,454 1,228,536 1,228,536 Capital surplus (Note 14) 5,376,073 5,380,954 4,473,351 4,477,412 Retained earnings (Note 15) (Net income of ₩893,426 million in 2002 and ₩610,521 million in 2001) 3,114,129
1,974,834 2,591,221 1,643,230
Capital adjustments (Note 16) 122,738 (311,577) 102,127 (259,259) Total shareholders’ equity 10,089,394 8,520,665 8,395,235 7,089,919
TOTAL LIABILITIES AND SHAREHOLDERS’ EQUITY ₩ 20,842,631 ₩ 19,564,962 $ 17,342,845 $ 16,279,715
See accompanying notes to non-consolidated semi-annual financial statements.

HYUNDAI MOTOR COMPANY
NON-CONSOLIDATED STATEMENTS OF INCOME
FOR THE SIX-MONTH PERIODS ENDED JUNE 30, 2002 AND 2001 (See Independent Accountants’ Review Report)
Korean won (In millions, except per
share amounts)
Translation into U. S. dollars (Note 2) (In thousands, except per share amounts)
2002 2001 2002 2001
Sales (Note 20) ₩ 12,319,272 ₩ 11,093,557 $ 10,250,684 $ 9,230,785 Cost of sales 9,306,414 8,328,786 7,743,729 6,930,260 Gross profit 3,012,858 2,764,771 2,506,955 2,300,525 Selling and administrative expenses (Note 21) 2,123,872 1,655,133 1,767,243 1,377,212 Operating income 888,986 1,109,638 739,712 923,313 Other income (expenses): Interest expense, net (82,516) (114,896) (68,660) (95,603) Foreign exchange gain (loss), net 126,607 (104,289) 105,348 (86,777) Gain on valuation of investments accounted for using the equity method, net 350,452 45,915 291,606 38,205 Other, net (17,926) (144,568) (14,916) (120,293) 376,617 (317,838) 313,378 (264,468) Ordinary income 1,265,603 791,800 1,053,090 658,845 Income before income tax 1,265,603 791,800 1,053,090 658,845 Income tax expense (Note 17) 372,177 181,279 309,683 150,840 Net income ₩ 893,426 ₩ 610,521 $ 743,407 $ 508,005 Earnings per common share (Note 2) ₩ 3,979 ₩ 2,766 $ 3,311 $ 2,302
Earnings per fully diluted common share (Note 2) ₩ 3,965 ₩ 2,762 $ 3,299 $ 2,298
See accompanying notes to non-consolidated semi-annual financial statements.

HYUNDAI MOTOR COMPANY
NOTES TO NON-CONSOLIDATED SEMI-ANNUAL FINANCIAL STATEMENTS
AS OF JUNE 30, 2002 AND 2001
(See Independent Accountants’ Review Report) 1. General Hyundai Motor Company (the “Company”) was incorporated in December 1967, under the laws of the Republic of Korea, to manufacture and distribute motor vehicles and parts. The shares of the Company have been listed on the Korea Stock Exchange since 1974. As of June 30, 2002, 48.43 percent of the Company's stock (excluding preferred stock) is owned by Korean investors and the remaining 51.57 percent is owned by foreign investors, including DaimlerChrysler (10.46 percent) and Mitsubishi of Japan (4.55 percent) under the foreign investment agreements. The Company acquired 214,200 thousand shares (51 percent) of the outstanding shares of Kia Motors Corp. (Kia) and Asia Motors Co., Inc. (Asia Motors) through a consortium, consisting with its affiliates, at a total acquisition amount of ₩1,178,100 million paid on March 29, 1999 based on a stock acquisition agreement dated December 1, 1998, enabling the Company to exercise substantial control of Kia (Asia Motors merged into Kia on June 30, 1999) and its subsidiaries. In addition, as of July 31, 1999, the Company merged the automobile and machine tool divisions of Hyundai Precision and Industry Co., Ltd. Due to such merger and acquisition, the Company’s production and sales in domestic and foreign market have expanded significantly. The Company has three domestic production plants as follows:
Location Commenced Production Types of major products Ulsan December 1967 Passenger cars, Commercial vehicles (Small trucks) Chunbuk Chunjoo April 1995 Commercial vehicles (Bus, Trucks) Chungnam Ahsan November 1996 Passenger cars
In connection with the foreign business, the Company operates major foreign subsidiaries and a branch as follows:
Subsidiaries Description Production:
Hyundai Assan Otomotive Sanayi Ve Ticaret A.S. (HAOSVT. Turkey)
Manufacturer of passenger cars since September 1997
Hyundai Motor India (HMI) Manufacturer of passenger cars since October 1998 Alabama state, United States (Construction in progress)
To manufacture passenger cars and SUV after 2005
Distribution:
Hyundai Motor America (HMA) Exclusive importer and distributor of motor vehicles and parts Hyundai Motor Japan Co. (HMJ) 〃 Hyundai Machine Tool Europe GmbH (HYME) 〃 Hyundai Motor Poland Sp. Zo.O (HMP) 〃 Hyundai Motor Europe GmbH (HME) 〃 Hyundai Translead (HT) Distributor of van trailers and equipment Hyundai Machine Tools America Branch for the distribution of machine tools
Research and Development
Hyundai America Technical Center Inc. (HATCI) Conducts research and development for motor vehicles Hyundai Motor Japan R&D Center Inc. (HMJ R&D) 〃

- 2 - In response to general unstable economic conditions, the Korean government and the private sector have been implementing structural reforms to historical business practices. Implementation of these reforms is progressing slowly, particularly in the areas of restructuring private enterprises and reforming the banking industry. The Korean government continues to apply pressure to Korean companies to restructure into more efficient and profitable firms. The Company may be either directly or indirectly affected by these general unstable economic conditions and the reform program described above. The accompanying non-consolidated financial statements reflect management’s assessment of the impact to date of the economic situation on the financial position of the Company. Actual results may differ materially from management’s current assessment. 2. Summary of Significant Accounting Policies Basis of Financial Statement Presentation The Company maintains its official accounting records in Korean won and prepares statutory non-consolidated financial statements in the Korean language (Hangul) in conformity with the accounting principles generally accepted in the Republic of Korea. Certain accounting principles applied by the Company that conform with financial accounting standards and accounting principles in the Republic of Korea may not conform with generally accepted accounting principles in other countries. Accordingly, these financial statements are intended for use by those who are informed about Korean accounting principles and practices. The accompanying financial statements have been condensed, restructured and translated into English (with certain expanded descriptions) from the Korean language financial statements. Certain information included in the Korean language financial statements, but not required for a fair presentation of the Company's financial position, results of operations is not presented in the accompanying financial statements. The US dollar amounts presented in these financial statements were computed by translating the Korean won into US dollar based on the basic exchange rate of ₩1,201.80 to US$1.00 at June 30, 2002, solely for the convenience of the reader. This convenience translation into US dollars should not be construed as a representation that the Korean won amounts have been, could have been, or could in the future be, converted at this or any other rate of exchange. The significant accounting policies followed by the Company in preparing its financial statements are summarized below: Revenue Recognition Revenue, including long-term installment sales, is recognized upon shipment of motor vehicles and parts. However, interest income arising from long-term installment sales is recognized using the level yield method. Valuation of Marketable Securities Marketable securities are stated at fair value. The difference between book value and fair value is recognized in current operations. Allowance for Doubtful Accounts The Company provides an allowance for doubtful accounts based on management’s estimate of the collectibility of receivables. Inventories Inventories are stated at the lower of cost or net realizable value, cost being determined by the moving average cost method.

- 3 - Valuation of Investment Securities Equity securities held for investment (excluding those accounted for using the equity method discussed in the next paragraph) that are not actively traded (unlisted security) are stated at acquisition cost, as determined by the moving average method. Actively quoted (listed) securities, including those traded over-the-counter, are stated at fair value, with the resulting valuation gain or loss reported as a capital adjustment within shareholders’ equity. If the fair value of a listed equity security or the net equity value of an unlisted security held for investment declines compared to acquisition cost and is not expected to recover (impaired investment security), the carrying value of the equity security is adjusted to fair value or net equity value, with the resulting valuation loss charged to current operations. If the net equity value or fair value subsequently recovers, in the case of an unlisted security, the increase in value is recorded in current operations, up to the amount of the previously recognized impairment loss, and in the case of a listed security, the increase in value is recorded in capital adjustments. Equity securities held for investment that are in companies in which the Company is able to exercise significant influence over the operating and financial policies of the investees are accounted for using the equity method. The Company’s share in the net income or net loss of investees is reflected in current operations. Changes in the retained earnings, capital surplus or other capital accounts of investees are accounted for as an adjustment to retained earnings or to capital adjustment. Debt securities held for investment are classified as either held-to-maturity investment debt securities or available for sale investment debt securities at the time of purchase. Held-to-maturity debt securities are stated at acquisition cost, as determined by the moving average method. When the face value of a held-to-maturity investment debt security differs from its acquisition cost, the effective interest method is applied to amortize the difference over the remaining term of the security. Available-for-sale investment debt securities are stated at fair value, with the resulting valuation gain or loss reported as a capital adjustment within shareholder’ equity. However, if the fair value of a held-to-maturity or an available-for-sale investment debt security declines compared to the acquisition cost and is not expected to recover (impaired investment security), the carrying value of the debt security is adjusted to fair value, with the resulting valuation loss charged to current operations. If the fair value of the security subsequently recovers, in the case of a held-to-maturity debt security, the increase in value is recorded in current operations, up to the amount of the previously recognized impairment loss, and in the case of an available-for-sale debt security, the increase in value is recorded in capital adjustments. The lower of the acquisition cost of investments in treasury stock funds and the fair value of treasury stock included in a fund is accounted for as treasury stock in capital adjustments. Property, Plant and Equipment and Related Depreciation Property, plant and equipment are stated at cost, except for assets revalue upward in accordance with the Asset Revaluation Law of Korea. Routine maintenance and repairs are expensed as incurred. Expenditures that result in the enhancement of the value or extension of the useful lives of the facilities involved are treated as additions to property, plant and equipment. Korea Accounting Standards Boards (KASB) Statement No. 7, effective December 31, 2002 but adoptable early in 2002 fiscal year, presents that principally, all financing cost must be charged to current operations but capitalization of financial cost to meet conditions can be acceptable and one of such accounting methods for financing cost must be elected and applied consistently. As though the election of adopting accounting method of charging all financing cost to current operations results in the change of accounting method, in accordance with this Statement, this change is accounted for using prospective approach. Before 2002, the Company had capitalized a portion of financial cost including interest expense and similar expenses in conformity with Financial Accounting Standards of Republic of Korea. However, in the first half of 2002, the Company elected to adopt the accounting method of charging all financing cost to current operations in accordance with KASB Statement No. 7. This change of accounting method resulted in the decrease of net income and assets by ₩24,269 million ($20,194 thousand) compared with the results based on the previous method. The Company capitalized financial cost of ₩42,556 million (US$ 35,410 thousand) as part of the cost of constructing major facilities and equipment for the first half of 2001.

- 4 - Depreciation is computed using the straight-line method based on the estimated useful lives of the assets as follows:
Useful lives (Years) Buildings and structures 15 – 50 Machinery and equipment 12 – 15 Vehicles 6 Dies and molds 6 Tools 6 Other equipment 6
Intangibles Intangible assets are stated at cost, net of amortization computed using the straight-line method over the estimated economic useful lives of the related assets (5 – 20 years). Development costs are amortized over the estimated economic useful life (not exceeding 5 years) from the usable date of the related products using the straight-line method. Ordinary development expenses and research expenses are charged to current operations. Cost in excess of net identifiable assets acquired (goodwill) is amortized over 20 years, using the straight-line method. Valuation of Receivables and Payables at Present Value Receivables and payables arising from long-term installment transactions, long-term cash loans (borrowings) and other similar loan (borrowing) transactions are stated at present value, if the difference between nominal value and present value is material. The present value discount is amortized using the effective interest rate method. The Company's long-term accounts receivable included in other assets are stated net of unamortized present value discount of ₩4,990 million (US$ 4,152 thousand) and ₩1,496 million (US$ 1,245 thousand) as of June 30, 2002 and 2001, using an interest rate of 8.25 percent and 10.0 percent, respectively. If principal, interest rate or repayment period of receivables is changed unfavourably for the Company by the court imposition such as commencement of reorganization or by mutual agreements that the difference between nominal value and present value is material, such difference is recorded in other expense as provision for doubtful accounts. Accrued Severance Benefits Employees and directors with more than one year of service are entitled to receive a lump-sum payment upon termination of their service with the Company, based on their length of service and rate of pay at the time of termination. The accrued severance benefits that would be payable assuming all eligible employees were to resign as of June 30, 2002 and 2001 amount to ₩1,150,314 million (US$ 957,159 thousand) and ₩997,007 million (US$ 829,595 thousand), respectively. Actual payments of severance benefits in the first half of 2002 and 2001 amounted to ₩92,699 million ($77,133 thousand) and ₩243,891 million ($202,938 thousand) , respectively. Accrued severance benefits are approximately 60 percent funded as of June 30, 2002 and 2001, through a group severance insurance plan and individual severance insurance plan. The group severance insurance deposits under this insurance plan are classified as other assets. Subsequent provisions are funded at the discretion of the Company. Group severance insurance deposits may only be withdrawn for the payment of severance benefits. Individual severance insurance deposits, in which the beneficiary is a respective employee, are presented as a deduction from accrued severance benefits. Before April 1999, the Company and its employees paid 3 percent and 6 percent, respectively, of monthly pay (as defined) to the National Pension Fund in accordance with the National Pension Law of Korea. The Company paid half of the employees’ 6 percent portion and is paid back at the termination of service by netting the receivable against the severance payment. Such receivables, totaling ₩77,392 million (US$ 64,397 thousand) and ₩92,148 million (US$ 76,675 thousand) as of June 30, 2002and 2001, respectively, are presented as a deduction from accrued severance benefits. Since April 1999, according to a revision in the National Pension Law, the Company and its employees each pay 4.5 percent of monthly pay to the Fund.

- 5 - Accrued Warranties and Product Liabilities The Company generally provides a warranty to the ultimate consumer for each product and accrues warranty expense at the time of sale based on actual claims history. The Company accrues potential expenses, which may occur due to product liabilities suits and voluntary recall campaign pending as of the balance sheet date. Additionally, in the first half of 2002, the Company recognizes accrued liabilities of ₩246,984 million (US$ 205,512 thousand) for the projected expenses of all vehicles placed in service prior to July 2002 that are expected to be still in operation up to January 2007 due to an End-of-Life Vehicles (ELV) directive in European Union. Under the directive, manufacturers are financially responsible for a portion of the cost of the dismantling and recycling of all vehicles placed in service prior to July 2002 that are still in operation up to January 2007 as well as vehicles placed in service after July 2002. In the first half of 2002, the provision for the accrual due to ELV directive was accounted for as selling expense of ₩22,519 million (US$ 18,738 thousand) and non-operating expense of ₩224,465 million (US$ 186,774 thousand). Stock Options The Company computes total compensation expense for stock options, which are granted to employees and directors, by the fair value method using the option-pricing model. The compensation expense has been accounted for as a charge to current operations and a credit to capital adjustment from the grant date using the straight-line method. Derivative Instruments All derivative instruments are accounted for at fair value with the valuation gain or loss recorded as an asset or liability. If the derivative instrument is not part of a transaction qualifying as a hedge, the adjustment to fair value is reflected in current operations. The accounting for derivative transactions that are part of a qualified hedge based both on the purpose of the transaction and on meeting the specified criteria for hedge accounting differs depending on whether the transaction is a fair value hedge or a cash flow hedge. Fair value hedge accounting is applied to a derivative instrument designated as hedging the exposure to changes in the fair value of an asset or a liability or a firm commitment (hedged item) that is attributable to a particular risk. The gain or loss both on the hedging derivative instruments and on the hedged item attributable to the hedged risk is reflected in current operations. Cash flow hedge accounting is applied to a derivative instrument designated as hedging the exposure to variability in expected future cash flows of an asset or a liability or a forecasted transaction that is attributable to a particular risk. The effective portion of gain or loss on a derivative instrument designated as a cash flow hedge is recorded as a capital adjustment and the ineffective portion is recorded in current operations. The effective portion of gain or loss recorded as a capital adjustment is reclassified to current earnings in the same period during which the hedged forecasted transaction affects earnings. If the hedged transaction results in the acquisition of an asset or the incurrence of a liability, the gain or loss in capital adjustment is added to or deducted from the asset or the liability. The Company entered into derivative instrument contracts related to forward, option and swap to hedge the exposure to changes in foreign exchange rate. In the first half of 2002, the Company deferred the gain on valuation of the effective portion of derivative instruments for cash flow hedging purpose from forecasted exports as capital adjustments, amounting to ₩65,795 million (US$54,747 thousand) as of June 30, 2002, and recognized gain of ₩29,937 million (US$ 24,910 thousand) on valuation of the ineffective portion of such instruments and the other derivative instruments in current operations. The period in which the forecasted transactions is expected to occur is within 14 months from June 30, 2002, and all deferred gains in capital adjustments at that date are expected to enter into the determination of net income within the 12 month period. As of June 30, 2002, the Company recorded total gain on valuation of derivatives of ₩85,156 million (US$ 70,857 thousand ) in assets and total loss on valuation of derivatives of ₩3,957 million (US$ 3,293 thousand) in liabilities. In the first half of 2001, the Company recognized loss on the derivative instruments amounting to ₩5,421 million (US$ 4,511 thousand) in current operations and deferred the loss on valuation of the effective portion of derivative instruments for cash flow hedging purpose from forecasted exports as capital adjustments, amounting to ₩27,725 million (US$ 23,070 thousand) and recorded total loss on valuation of derivatives of ₩44,579 million (US$ 37,094 thousand) in liabilities as of June 30, 2001.

- 6 - Accounting for Foreign Currency Transactions and Translation The Company maintains its accounts in Korea won. Transactions in foreign currencies are recorded in Korean won based on the prevailing rates of exchange on the transaction date. Monetary accounts with balances denominated in foreign currencies are recorded and reported in the accompanying financial statements at the exchange rates prevailing at the balance sheet dates. The balances have been translated using the Bank of Korea Basic Rate, which was ₩1,201.80 and ₩1,300.70 to US $1.00 at June 30, 2002 and 2001, respectively, and translation gains or losses is reflected in current operations. Assets and liabilities of the Branch outside the Republic of Korea are translated at the rate of exchange in effect on the balance sheet date; income and expenses are translated at the average rates of exchange prevailing in the first half of 2002 and 2001, which was ₩1,294.70 and ₩1,288.70 to US$1.00, respectively. Income Tax Expense The Company recognizes deferred income taxes arising from temporary differences between pre-tax accounting income and taxable income. Accordingly, income tax expense consists of the total income tax and surtaxes currently payable and the changes in deferred income tax assets or liabilities during the period. Earnings Per Share Primary earnings per common share is computed by dividing net income, after deduction for expected dividends for six months on preferred stock, by the weighted average number of common shares outstanding during the period. The number of shares used in computing earnings per common share is 218,076,805 and 213,084,573 in 2002 and 2001, respectively. Earnings per diluted share is computed by dividing net income, after deduction for expected dividends for six months on preferred stock and addition for the effect of expenses related to diluted securities on net income, by the weighted average number of common shares plus the dilutive potential common shares. The number of shares used in computing earnings per diluted share is 218,927,213 and 213,423,686 in 2002 and 2001, respectively. 3. Inventories Inventories as of June 30, 2002 and 2001 consist of the following:
Korean won (In millions)
U.S. dollars (Note 2) (In thousands)
2002 2001 2002 2001 Finished goods and merchandise ₩ 190,152 ₩ 375,113 $ 158,223 $ 312,126 Semi-finished goods and work in process
243,794 234,685 202,857 195,278
Raw materials and supplies 217,043 216,965 180,598 180,533 Materials in transit 44,665 60,390 37,165 50,250 ₩ 695,654 ₩ 887,153 $ 578,843 $ 738,187
4. Marketable Securities and Investment Securities (1) Marketable securities as of June 30, 2002 and 2001 consist of the following:
Korean won (In millions)
U.S. dollars (Note 2) (In thousands)
2002 2001 2002 2001 Beneficiary certificates \ 626,378 \ 589,321 $ 521,200 $ 490,365 Debt securities 24,622 16,422 20,487 13,665 \ 651,000 \ 605,743 $ 541,687 $ 504,030
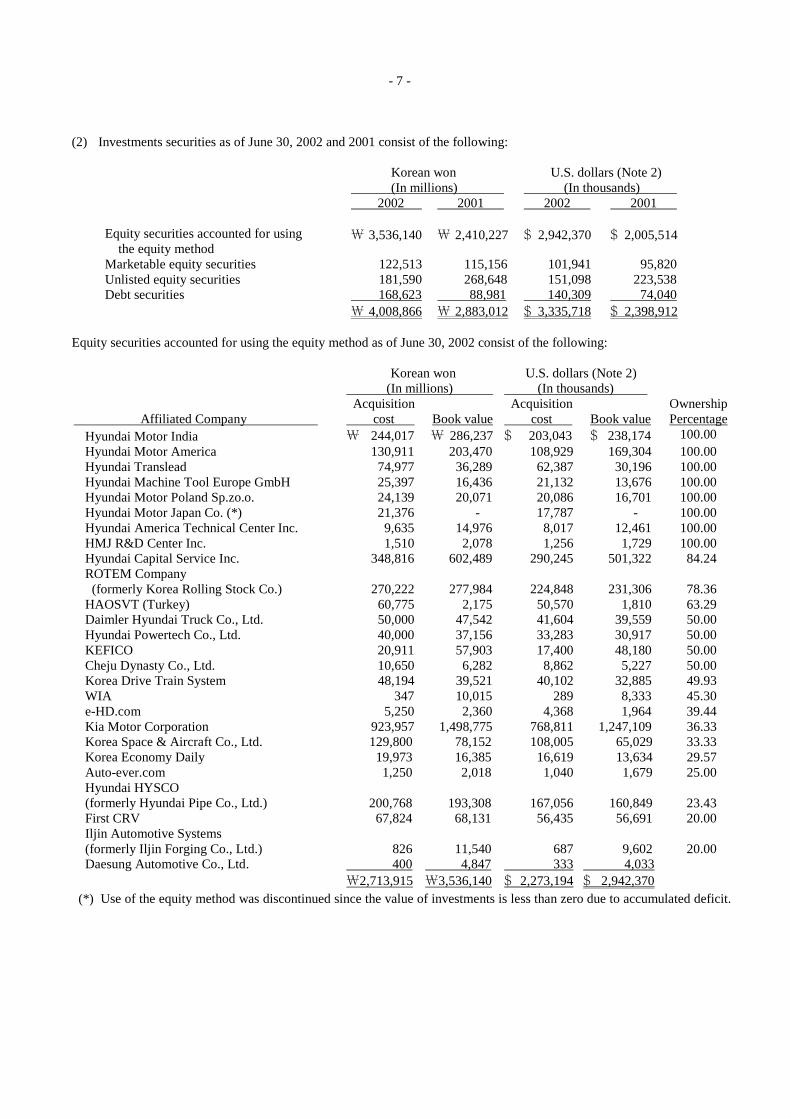
- 7 - (2) Investments securities as of June 30, 2002 and 2001 consist of the following:
Korean won (In millions)
U.S. dollars (Note 2) (In thousands)
2002 2001 2002 2001 Equity securities accounted for using the equity method
\ 3,536,140 \ 2,410,227 $ 2,942,370 $ 2,005,514
Marketable equity securities 122,513 115,156 101,941 95,820 Unlisted equity securities 181,590 268,648 151,098 223,538 Debt securities 168,623 88,981 140,309 74,040 \ 4,008,866 \ 2,883,012 $ 3,335,718 $ 2,398,912
Equity securities accounted for using the equity method as of June 30, 2002 consist of the following:
Korean won U.S. dollars (Note 2) (In millions) (In thousands)
Affiliated Company
Acquisition cost
Book value
Acquisition cost
Book value
Ownership Percentage
Hyundai Motor India \ 244,017 \ 286,237 $ 203,043 $ 238,174 100.00 Hyundai Motor America 130,911 203,470 108,929 169,304 100.00 Hyundai Translead 74,977 36,289 62,387 30,196 100.00 Hyundai Machine Tool Europe GmbH 25,397 16,436 21,132 13,676 100.00 Hyundai Motor Poland Sp.zo.o. 24,139 20,071 20,086 16,701 100.00 Hyundai Motor Japan Co. (*) 21,376 - 17,787 - 100.00 Hyundai America Technical Center Inc. 9,635 14,976 8,017 12,461 100.00 HMJ R&D Center Inc. 1,510 2,078 1,256 1,729 100.00 Hyundai Capital Service Inc. 348,816 602,489 290,245 501,322 84.24 ROTEM Company (formerly Korea Rolling Stock Co.) 270,222 277,984 224,848 231,306 78.36 HAOSVT (Turkey) 60,775 2,175 50,570 1,810 63.29 Daimler Hyundai Truck Co., Ltd. 50,000 47,542 41,604 39,559 50.00 Hyundai Powertech Co., Ltd. 40,000 37,156 33,283 30,917 50.00 KEFICO 20,911 57,903 17,400 48,180 50.00 Cheju Dynasty Co., Ltd. 10,650 6,282 8,862 5,227 50.00 Korea Drive Train System 48,194 39,521 40,102 32,885 49.93 WIA 347 10,015 289 8,333 45.30 e-HD.com 5,250 2,360 4,368 1,964 39.44 Kia Motor Corporation 923,957 1,498,775 768,811 1,247,109 36.33 Korea Space & Aircraft Co., Ltd. 129,800 78,152 108,005 65,029 33.33 Korea Economy Daily 19,973 16,385 16,619 13,634 29.57 Auto-ever.com 1,250 2,018 1,040 1,679 25.00 Hyundai HYSCO (formerly Hyundai Pipe Co., Ltd.) 200,768 193,308 167,056 160,849 23.43 First CRV 67,824 68,131 56,435 56,691 20.00 Iljin Automotive Systems (formerly Iljin Forging Co., Ltd.) 826 11,540 687 9,602 20.00 Daesung Automotive Co., Ltd. 400 4,847 333 4,033 \2,713,915 \3,536,140 $ 2,273,194 $ 2,942,370
(*) Use of the equity method was discontinued since the value of investments is less than zero due to accumulated deficit.

- 8 - Equity securities accounted for using the equity method as of June 30, 2001 consist of the following:
Korean won U.S. dollars (Note 2) (In millions) (In thousands)
Affiliated Company
Acquisition cost
Book value
Acquisition cost
Book value
Ownership Percentage
Hyundai Motor India ₩ 244,017 ₩ 235,234 $ 203,043 $ 195,735 100.00 Hyundai Motor America (*) 129,582 - 107,823 - 100.00 Hyundai Translead 74,977 44,627 62,387 37,133 100.00 Hyundai Machine Tool Europe GmbH 25,397 20,585 21,132 17,128 100.00 Hyundai Motor Japan Co. 11,152 7,203 9,279 5,994 100.00 Hyundai Motor Poland Sp.zo.o. 11,082 10,759 9,221 8,952 100.00 Hyundai America Technical Center Inc. 5,956 11,416 4,956 9,499 100.00 Hyundai Motor Europe Parts 2,715 1,673 2,259 1,392 100.00 HMJ R&D Center Inc. 1,510 1,980 1,256 1,648 100.00 Hyundai Capital Service Inc. 272,573 337,683 226,805 280,981 85.57 HAOSVT (Turkey) 48,042 20,223 39,975 16,827 50.00 Hyundai Powertrain Technology Co., Ltd. 40,000 40,000 33,283 33,283 50.00 KEFICO 20,911 49,707 17,400 41,360 50.00 Cheju Dynasty Co., Ltd. 8,150 8,066 6,781 6,712 50.00 Korea Drive Train System 48,194 40,586 40,102 33,771 49.93 e-HD.com 5,250 5,053 4,368 4,205 49.30 Korea Rolling Stock Co. 113,694 91,560 94,603 76,186 39.18 Beijing Hyundai Namyang Real Estate Development center Ltd.
8,832
8,832 7,349 7,349
35.00
Kia Motor Corporation 923,957 1,136,806 768,812 945,919 34.47 Korea Space & Aircraft Co., Ltd. 129,800 111,270 108,005 92,586 33.33 Hyundai Space & Aircraft Co., Ltd. (*) 112,595 - 93,689 - 25.96 Hyundai HYSCO (formerly Hyundai Pipe Co., Ltd.)
200,768
179,016 167,056 148,957
23.43
Korea Economy Daily 19,973 26,175 16,619 21,780 22.75 Wuhan Grand Motor Co., Ltd. 5,502 8,122 4,578 6,758 21.43 Hyundai-Kia-Yueda Motor Company 3,354 2,980 2,791 2,480 20.00 Iljin Forging Co., Ltd. 826 7,253 687 6,035 20.00 Daesung Automotive Co., Ltd. 400 3,418 333 2,844 20.00 ₩2,469,209 ₩2,410,227 $ 2,054,592 $ 2,005,514
(*) Use of the equity method was discontinued since the value of investments is less than zero due to accumulated deficit. The difference between the acquisition cost and the Company’s portion of an investee’s net equity at the date the Company was considered to be able to exercise significant influence over the operating and financial policy of an investee is amortized (or reversed) over 20 years, using the straight-line method. The unamortized balance of goodwill as of June 30, 2002 and 2001 is ₩190,943 million (US$158,881 thousand) and ₩18,232 million (US$15,171 thousand), respectively. Significant unrealized profits (losses) that occurred in transactions with investees are eliminated. Investments as of June 30, 2002 are valued based on the financial statements as of June 30, 2002, which were not audited nor reviewed by an external auditor. Investments as of June 30, 2001 are valued based on the latest audited financial statements since the investees did not prepare financial statements as of June 30, 2001.

- 9 - Marketable equity securities as of June 30, 2002 and 2001 consist of the following:
Korean won U.S. dollars (Note 2) (in millions) (in thousands) Ownership
Acquisition cost Book value Book value Percentage Company 2002 2001 2002 2001 2002 2001 2002 2001
Jin Heung Mutual Savings Bank (formerly Jin Heung Mutual Savings & Finance Co., Ltd.)
\ 2,000 \ 2,000 \ 3,292 840 $ 2,739 $ 699 9.01 9.01
Korea Mutual Savings Bank (formerly Comet Savings & Finance Co., Ltd.)
3,097 2,700 3,921 1,598 3,263 1,330 8.85 9.00
Korea Industrial Development Co., Ltd. 2,894 - 2,736 - 2,277 - 6.00 - Hyundai Corporation 13,626 13,625 2,168 3,776 1,804 3,142 2.99 2.99 Hyundai Heavy Industries Co., Ltd. 56,924 59,004 55,079 69,689 45,830 57,988 2.88 2.99 Hyundai Information Technology Co., Ltd. 10,000 10,000 1,947 5,000 1,620 4,160 2.21 2.21 LG Telecom 9,795 - 13,085 - 10,888 - 0.69 - Hyundai Merchant Marine Co., Ltd. 7,329 7,328 1,478 1,551 1,230 1,291 0.55 0.55 Chohung Bank 25,000 25,000 14,735 7,407 12,261 6,163 0.48 0.48 Treasury Stock Funds 13,828 26,485 5,524 9,944 4,596 8,274 Stock Market Stabilization Fund 14,006 17,664 18,521 15,191 15,411 12,640 Other 283 473 27 160 22 133 \ 158,782 \ 164,279 \ 122,513 \ 115,156 $ 101,941 $ 95,820
The acquisition costs of Treasury Stock Funds are presented after the deduction of fair value of treasury stocks included in those funds. The fair values of such treasury stock as of June 30, 2002 and 2001 amount to ₩35,157 million (US$29,254 thousand) and ₩22,357 million (US$18,603 thousand), respectively, and are recorded as treasury stock in capital adjustments on the basis set forth in Note 2. Marketable equity securities are stated at fair value and the difference of ₩36,269 million (US$30,179 thousand) between acquisition cost and fair value as of June 30, 2002 was recorded as loss on valuation of investment equity securities in capital adjustments. Of the difference of ₩49,123 million (US$40,875 thousand) between acquisition cost and fair value as of June 30, 2001, the Company recorded ₩46,650 million (US$38,817 thousand) as loss on valuation of investment equity securities in capital adjustments and recognized ₩2,473 million (US$2,058 thousand) of valuation loss on investments of Stock Market Stabilization Fund in current operations in the first half of 2001. Unlisted investment equity securities as of June 30, 2002 and 2001 consist of the following:
Korean won U.S. dollars (Note 2) (in millions) (in thousands) Ownership
Acquisition cost Book value Book value Percentage Company 2002 2001 2002 2001 2002 2001 2002 2001
Hyundai Motor Europe GmbH (*) \ 17,529 \ 5,590 \ 17,529 \ 5,590 $ 14,586 $ 4,651 100.00 100.00 Hyundai Motor Shanghai Co., Ltd. (*) - 2,706 - 2,706 - 2,252 100.00 Hyundai Jingxian Motor Safeguard Service Co., Ltd. (*) 2,019
2,019 2,019
2,019 1,680 1,680
84.88 84.88
NGVTEK.com (*) 450 450 450 450 374 374 43.90 43.90 Auto-ever.com (*) - 1,250 - 1,250 0 1,040 25.00 Jinil MVC Co., Ltd. 180 180 180 180 150 150 18.00 18.00 Industri Otomotif Komersial 4,439 4,439 4,439 4,439 3,694 3,694 15.00 15.00 Hyundai Petro-Chemical Co., Ltd. - 88,163 - 88,163 - 73,359 14.99 Hyundai Technology Investment Co., Ltd. 4,490 4,490 4,490 4,490 3,736 3,736 14.97 14.97 Hyundai Unicorns Co., Ltd. 5,795 5,795 5,795 5,795 4,822 4,822 14.90 14.90 Hyundai Research Institute 1,271 1,271 1,271 1,271 1,058 1,058 14.90 14.90 Kihyup Technology Banking Corporation (formerly Kihyup Finance) 3,000
3,000 3,000
3,000 2,496 2,496
10.34
10.34
Hyundai Motor Deutschland GmbH 802 738 802 738 667 614 10.00 10.00 Yonhap Capital Co., Ltd. 10,000 10,000 10,000 10,000 8,321 8,321 9.99 9.99 Korea Environment Technology Co., Ltd. (formerly Ulsan Environmental Development) 1,500
1,500 1,500
1,500 1,248 1,248
7.50
7.50
Internet Hankyoreh Inc. 4,800 4,800 4,800 4,800 3,994 3,994 7.41 7.41 Hyundai Oil refinery Co., ltd. 78,134 78,134 78,134 78,134 65,013 65,014 6.33 6.33 Hyundai Asan Corporation 22,500 22,500 8,861 22,500 7,373 18,722 5.00 5.00 U.S Electrical Inc. 2,204 2,204 2,204 2,204 1,834 1,834 3.80 3.80 Alcan Taihan Aluminum Ltd. 18,655 13,625 18,655 13,625 15,522 11,337 0.75 0.17 KT Icom 10,800 10,800 10,800 10,800 8,987 8,987 0.60 0.60 Other 6,661 4,994 6,661 4,994 5,543 4,155
\ 195,229 \ 268,648 \ 181,590 \ 268,648 $ 151,098 $ 223,538

- 10 - (*) In conformity with Financial Accounting Standards in the Republic of Korea, the equity securities of these affiliates were excluded
from using the equity method since the Company believes the changes in the investment value due to the changes in the net assets of the investee, whose individual beginning balance of total assets or paid-in capital at the date of its establishment is less than ₩7,000 million, are not material.
Unlisted investment equity securities are stated at cost, except where an investee’s net equity value has declined and is not expected to recover. Impairment loss of ₩13,639 million ($11,349 thousand) between book value and acquisition cost of Hyundai Asan Corporation are recognized in current operations in the first half of 2002. Total net equity value of unlisted equity securities as of June 30, 2002 and 2001, amount to ₩137,171 million (US$114,138 thousand) and ₩269,729 million (US$224,438thound), respectively, based on the investees’ latest financial statements. Debt securities as of June 30, 2002 and 2001 consist of the following:
Korean won (In millions)
U.S. dollars (Note 2) (In thousands)
2002 2001 2002 2001 Non-guaranteed bonds \ 33,239 \ - $ 27,658 $ - Foreign currency notes 44,466 48,741 37,000 40,557 Stock financial bonds 90,853 - 75,597 - Government bonds 65 65 54 54 Convertible bonds - 40,175 - 33,429 \ 168,623 \ 88,981 $ 140,309 $ 74,040
Debt securities are all held-to-maturity and stated at cost, except for foreign currency notes and debt securities of which the fair value has declined and is not expected to recover. In the first half of 2002, the Company recognized impaired loss of debt securities amounting to ₩32,385 million ($26,947 thousand) in current operations. 5. Insured Assets As of June 30, 2002, property, plant and equipment are insured for ₩4,717,377 million (US$3,925,260 thousand). In addition, the Company carries products and completed operations liability insurance with a maximum coverage of $120,000 thousand, general insurance for vehicles, and workers' compensation and casualty insurance for employees. 6. Property, Plant and Equipment Property, plant and equipment as of June 30, 2002 and 2001 consist of the following:
Korean won (in millions)
U. S. dollars (Note 2) (in thousands)
2002 2001 2002 2001 Buildings and structures ₩ 2,755,013 ₩ 2,506,670 $ 2,292,406 $ 2,085,763 Machinery and equipment 4,022,262 3,671,690 3,346,865 3,055,159 Vehicles 46,052 36,782 38,319 30,606 Dies and molds 1,668,866 1,551,367 1,388,639 1,290,870 Tools 540,646 481,094 449,864 400,311 Other equipment 513,332 413,052 427,136 343,694 9,546,171 8,660,655 7,943,228 7,206,403 Less: Accumulated depreciation (3,275,368) (2,572,562) (2,725,385) (2,140,591) 6,270,803 6,088,093 5,217,842 5,065,812 Land 1,822,582 1,754,646 1,516,544 1,460,015 Construction in progress 562,966 751,497 468,436 625,310 ₩ 8,656,351 ₩ 8,594,236 $ 7,202,822 $ 7,151,137
A substantial portion of the Company's property, plant and equipment is pledged as collateral for various loans up to a maximum of ₩945,227 million (US$786,509 thousand) (see Note 12). As of June 30, 2002, the published value of the Company-owned land (12,767 thousand square meters) was ₩1,728,353 million (US$1,438,137 thousand) in terms of land prices officially announced by the Korean government.

- 11 - 7. Leased Assets The Company has entered into capital lease agreements for certain machinery and equipment. The lease obligations are included in long-term debt in the accompanying balance sheets. Annual payments on the lease agreements as of June 30, 2002 are as follows:
Capital Leases (Korean won in millions) Lease Payments Interest Portion Lease Obligations July 1, 2002 - June 30, 2003 ₩ 32,506 ₩ 1,227 ₩ 31,279 July 1, 2003 - June 30, 2004 14,519 387 14,132 Thereafter 3,727 73 3,644 ₩ 50,752 ₩ 1,687 ₩ 49,055
8. Intangibles Intangibles as of June 30, 2002 and 2001 consist of the following:
Korean won (in millions)
U. S. dollars (Note 2) (in thousands)
2002 2001 2002 2001 Cost in excess of fair values of identifiable net assets acquired ₩ 522,248 ₩ 552,818 $ 434,555 $ 459,992 Development costs 904,473 1,022,063 752,599 850,443 Other 31,243 28,982 25,996 24,116 ₩ 1,457,964 ₩ 1,603,863 $ 1,213,150 $ 1,334,551
The changes in development costs for the periods ended June 30, 2002 and 2001 are as follows:
Korean won (in millions)
U. S. dollars (Note 2) (in thousands)
2002 2001 2002 2001 Beginning of the period ₩1,028,322 ₩ 910,566 $ 855,652 $ 757,668 Addition: Expenditures for the first half 249,681 255,644 207,756 212,718 Deduction: Ordinary development expenses (183,025) (205) (152,292) (171) Research expenses (59,455) (2,600) (49,472) (2,163) Amortization (131,050) (141,342) (109,045) (117,608) End of the period ₩ 904,473 ₩1,022,063 $ 752,599 $ 850,444
Development costs are amortized over a period not to exceed 5 years from the usable date of the related products using the straight-line method. Ordinary development expenses and research expenses are charged to current operations.

- 12 - 9. Other Assets Other assets as of June 30, 2002 and 2001 consist of the following:
Korean won (in millions)
U. S. dollars (Note 2) (in thousands)
2002 2001 2002 2001 Long-term notes and accounts receivable, less unamortized present value
discount of ₩4,990 million in 2002 and ₩1,496 million in 2001
₩ 19,034 ₩ 14,171 $ 15,838 $ 11,791
Other long-term accounts receivable - 110,401 - 91,863 Lease and rental deposits 174,842 190,335 145,483 158,375 Long-term deposits 34,005 206,073 28,295 171,470 Accrued gain on valuation of derivatives (See Note 2) 85,156 - 70,857 - Other 94,847 120,716 78,921 100,447 ₩ 407,884 ₩ 641,696 $ 339,394 $ 533,946
10. Short-term Borrowings Short-term borrowings as of June 30, 2002 and 2001 amount to ₩405,897 million (US$337,741 thousand) and ₩828,144 million (US$689,086 thousand), respectively, and consist primarily of bank loans and export financing loans with annual interest rates ranging from 8.0 percent to 9.5 percent. 11. Long-term Debt Long-term debt as of June 30, 2002 and 2001 consists of the following: Korean won U.S. dollars (Note 2) Annual (in millions) (in thousands) interest rate(%) 2002 2001 2002 2001 Debentures 5.00~9.01 ₩ 3,535,543 ₩ 3,882,987 $ 2,941,873 $ 3,230,976 Local currency loans Capital lease (Note 7) 14.25~14.31 118 186 98 155 General loans 3.00~7.44 43,113 71,035 35,874 59,107 43,231 71,221 35,972 59,262 Foreign currency loans Capital lease (Note 7) Libor+0.55~3.20 48,935 157,429 40,718 130,994 Other Libor+0.50~3.00 155,428 519,571 129,329 432,328 204,363 677,000 170,047 563,322 3,783,137 4,631,208 3,147,892 3,853,560 Less: Current maturities (949,069) (1,769,331) (789,706) (1,472,234) ₩ 2,834,068 ₩ 2,861,877 $ 2,358,186 $ 2,381,326

- 13 - Debentures as of June 30, 2002 and 2001 consist of the following: Korean won U.S. dollars (Note 2) Annual (in millions) (in thousands) Maturity interest rate (%) 2002 2001 2002 2001 Non-guaranteed Debentures 02.7.31~06.8.13 5.00~9.01 ₩ 2,960,000 ₩ 3,605,200 ₩ 2,462,972 ₩ 2,999,834 Overseas debentures 04.10.18~07.7.15 7.33~8.20 641,761 357,693 534,000 297,631 3,601,761 3,962,893 2,996,972 3,297,465 Discount on debentures (66,218) (79,906) (55,099) (66,489) ₩ 3,535,543 ₩ 3,882,987 $ 2,941,873 $ 3,230,976 The maturity of long-term debt as of June 30, 2002 due within the twelve-month periods ending June 30 is as follows:
Korean won (in millions)
U. S. dollars (Note 2)(in thousands)
Debentures
Local currency
loans
Foreign currency
loans
Total
Total
2002.7.1~2003.6.30 ₩ 800,000 ₩ 8,158 ₩ 140,911 ₩ 949,069 ₩ 789,706 2003.7.1~2004.6.30 1,160,000 8,668 56,976 1,225,644 1,019,840 2004.7.1~2005.6.30 830,270 6,225 6,476 842,971 701,424 2005.7.1~2006.6.30 430,270 10,178 - 440,448 366,490 Thereafter 381,221 10,002 - 391,223 325,531 Less: Discount on debentures (66,218) - - (66,218) (55,099) ₩3,535,543 ₩ 43,231 ₩ 204,363 ₩3,783,137 $ 3,147,892
12. Commitments and Contingent liabilities (1) The Company is contingently liable for guarantees of indebtedness, primarily for the following affiliates (including foreign subsidiaries) as of June 30, 2002.
Korean won (in millions)
U.S. dollars (Note 2) (in thousands)
Hyundai Merchant Marine ₩ 428,960 $ 356,931 HMA 13,177 10,964 HMFC 255,384 212,501 HMI 101,529 84,481 Hyundai Translead (formerly HYPA) 175,464 146,001 HAOSVT 93,253 77,594 HME 7,202 5,993 HYME 2,405 2,001 HMP 10,296 8,567 HMJ 15,069 12,539 Other 2,995 2,493 ₩ 1,105,734 $ 920,065

- 14 - (2) Investment securities of ₩53,722 million (US$44,701 thousand) at book value, 30 blank promissory notes, 1 check
amounting to ₩2,624 million (US$2,183 thousand) and property, plant and equipment are pledged as collateral for short-term borrowings, the local currency and foreign currency loans and other payables (see Note 6). Certain bank deposits of ₩43,074 million (US$35,841 thousand) are restricted for use due to guarantees for customer financing transactions and other obligations and research and development.
(3) The Company uses a customer financing system related to a long-term installment sales system and has
provided guarantees of ₩407,334 million (US$338,937 thousand) to the banks concerned as of June 30, 2002. These guarantees are all covered by insurance contracts, which regulates a customer and the Company as a contractor and a beneficiary, respectively.
(4) As of June 30, 2002, the outstanding balance of accounts receivable discounted with recourse amounts to
₩883,337 million (US$735,012 thousand), including discounted overseas accounts receivable translated using the foreign exchange rate at June 30, 2002.
(5) In connection with merger of the Automobile and Tools Divisions of Hyundai MOBIS (formerly Hyundai Precision
& Ind. Co., Ltd. (HPI)) with the Company in 1999, under the Korea Commercial Code, the Company becomes liable for the payment of the full amount of liabilities previously owed by HPI. As a result, the Company is deemed to have assumed additional contingent liabilities of ₩27,908 million (US$23,222 thousand) as of June 30, 2002.
(6) The Company accrues estimated product liabilities expenses (see Note 2) and carries the products and completed
operations liability insurance (see Note 5) in order to cover the potential loss, which may occur due to the law suits related to its operation such as product liabilities. However, the Company expects that the resolution of cases pending against the Company as of June 301, 2002 will not have any material effect on its financial position.
13. Capital Stock Capital stock as of June 30, 2002 consists of the following:
Authorized Issued
Par value
Korean won (in millions)
U.S. dollars (Note 2) (in thousands)
Common stock 450,000,000 shares 219,088,702shares ₩ 5,000 ₩ 1,145,443 $ 953,106 Preferred stock 150,000,000 shares 65,202,146shares 5,000 331,011 275,430 ₩ 1,476,454 $ 1,228,536 Capital stock as of June 30, 2001 consists of the following:
Authorized Issued
Par value
Korean won (in millions)
U.S. dollars (Note 2) (in thousands)
Common stock 450,000,000 shares 219,088,702 shares ₩ 5,000 ₩ 1,145,443 $ 953,106 Preferred stock 150,000,000 shares 65,202,146 shares 5,000 331,011 275,430 ₩ 1,476,454 $ 1,228,536 The preferred shares are non-cumulative, non-participating and non-voting. Of the total preferred stock issued of 65,202,146 shares as of June 30, 2002, 27,588,281 preferred shares are eligible to receive cash dividends if declared equal to that declared for common shares plus an additional 1 percent minimum increase while the dividend rate for the remaining 37,613,865 preferred shares is 2 percent higher than that declared for common shares. The Company acquired treasury stocks after cancellation of Trust Cash Funds as of March 2, 2001 and then, in accordance with the decision of the Board of Directors, retired 10,000,000 common shares in treasury and 1,000,000 preferred shares in treasury, which had additional dividends rate of 1 percent to the rate of common stock on March 5, 2001, using retained earnings.

- 15 - In September 2000, the Company issued 20,618,000 common shares with a total proceeds of ₩430,916 million (US$358,559 thousand) (at a per share price of ₩20,900), which included paid-in capital in excess of par value of ₩327,222 million ($272,277 thousand) after the deduction of new stock issuance cost of ₩15,378 million (US$12,796 thousand), to DaimlerChrysler Aktiengesellschaft (DCAG). The Company issued 10,000,000 Global Depositary Receipts (GDRs) representing 5,000,000 shares of preferred stock in November 1992, 4,675,324 GDRs representing 2,337,662 shares of preferred stock in June 1995 and 7,812,500 GDRs representing 3,906,250 shares of preferred stock in June 1996, all of which have been listed on the Luxembourg Stock Exchange. In the second half of 1999, the Company issued 45,788,000 Global Depositary Shares representing 22,894,000 common shares for ₩601,356 million ($453,477 thousand), which include paid-in capital in excess of par value of ₩486,886 million ($367,156 thousand). 14. Capital Surplus Capital surplus as of June 30, 2002 and 2001 consists of the following:
Korean won U.S. dollars (Note 2) (in millions) (in thousands) 2002 2001 2002 2001 Paid-in capital in excess of par value ₩3,256,236 ₩3,256,236 $ 2,709,466 $ 2,709,466 Asset revaluation surplus 1,852,871 1,852,871 1,541,747 1,541,747 Other 266,966 271,847 222,138 226,199 ₩5,376,073 ₩5,380,954 $ 4,473,351 $ 4,477,412
On January 1, 1981, January 1, 1993 and July 1, 1998, the Company revalued property, plant and equipment at their respective appraised values (which were appraised by the Korea Appraisal Board and approved by the relevant tax office). The resultant cumulative appraisal gains, amounting to ₩2,547,417 million (US$2,119,668 thousand), were included in capital surplus, after offsetting accumulated deficit of ₩16,022 million (US$13,332 thousand), a deferred foreign currency translation loss of ₩594,275 million (US$494,487 thousand), reduction for an asset revaluation tax payment of ₩67,547 million (US$56,205 thousand) and adjustment of ₩16,702 million (US$ 13,897 thousand) due to the disposal of revalued assets within 1 year after revaluation. In the first half of 2001, the Company sold 2,290,800 shares of its common stock in treasury to DaimlerChrysler Aktiengesellschaft at the disposal value of ₩47,878 million (US$ 39,839 thousand) with a gain of ₩10,252 million (US$ 8,531 thousand) and 10,659,010 common shares in treasury to INI Steel Company (formerly Inchon Iron & Steel Co., Ltd.) at the disposal value of ₩185,725 million (US$ 154,539 thousand) with a gain of ₩10,008 million (US$ 8,328 thousand). Total gains of ₩20,260 million (US$ 16,858 thousand) were recorded in capital surplus. 15. Retained Earnings Retained earnings as of June 30, 2002 and 2001 consist of the following:
Korean won U.S. dollars (Note 2) (in millions) (in thousands) 2002 2001 2002 2001 Appropriated: Legal reserve ₩ 101,870 ₩ 79,870 $ 84,765 $ 66,459 Reserve for business rationalization 545,800 385,800 454,152 321,018 Reserve for improvement of financial structure 98,947 98,947 82,332 82,332 Reserve for overseas market development 48,800 48,800 40,606 40,606 Reserve for technological development 1,465,100 747,600 1,219,088 622,067 2,260,517 1,361,017 1,880,943 1,132,482 Unappropriated 853,612 613,817 710,278 510,748 ₩ 3,114,129 ₩ 1,974,834 $ 2,591,221 $ 1,643,230

- 16 -
The Korean Commercial Code requires the Company to appropriate, as a legal reserve, a minimum of 10 percent of annual cash dividends declared, until such reserve equals 50 percent of its capital stock issued. Pursuant to the Tax Incentive Limitation Law, the Company is required to appropriate, as a reserve for business rationalization, the exemption of income taxes resulting from investment tax credits and certain deductions from taxable income specified by the Law. The Regulation on Issues and Disclosures of the Securities for listed companies requires the Company to appropriate, as a reserve for improvement of financial structure, an amount equal to at least 50 percent of the net gain on disposition of property, plant and equipment and 10 percent of net income for each year until the Company's net worth equals 30 percent of total assets. These reserves are not available for the payment of cash dividends, but may be transferred to capital stock or may be used to reduce any accumulated deficit. The reserves for overseas market development and technological development are voluntary reserves, which are available for the payment of dividends. 16. Capital Adjustments Capital adjustments as of June 30, 2002 and 2001 consist of the following:
Korean won U.S. dollars (Note 2) (in millions) (in thousands) 2002 2001 2002 2001 Treasury stock ₩ (79,978) ₩ (67,178) $ (66,549) $ (55,898) Gain (Loss) on valuation of investment
equity securities 123,625
(224,326)
102,867
(186,658)
Stock option cost 12,611 9,079 10,493 7,555 Cumulative translation adjustments for overseas branches
685
(1,427)
569
(1,188)
Gain (Loss) on valuation of derivatives 65,795 (27,725) 54,747 (23,070) ₩ 122,738 ₩ (311,577) $ 102,127 $ (259,259)
(1) Treasury stock
The Company has treasury stock consisting of 960,880 common shares and 3,169,260 preferred shares amounting to ₩79,978 million (US$66,549 thousand) and 1,083,380 common shares and 3,178,600 preferred shares amounting to ₩67,178 million (US$55,898 thousand) as of June 30, 2002 and 2001, respectively, acquired directly or indirectly through Treasury Stock Funds and Trust Cash Funds.
(2) Gain (loss) on valuation of investment equity securities Gain (loss) on valuation of investment equity securities as of June 30, 2002 and 2001 consist of the following:
Korean won U.S. dollars (Note 2) (in millions) (in thousands) 2002 2001 2002 2001 Gain (loss) on equity method valuation ₩ 159,894 ₩ (177,676) $ 133,046 $ (147,842) Gain (loss) on valuation of marketable investment equity securities
(36,269)
(46,650)
(30,179)
(38,816)
₩ 123,625 ₩ (224,326) $ 102,867 $ (186,658)

- 17 - (3) Stock option cost
The Company granted 104 directors to stock options (grant date : March 10, 2000, exercise date : March 10, 2003, expiry date : March 10, 2008), at an exercise price of ₩14,900 as determined during the meeting of the Shareholders on March 10, 2000. As of June 30, 2002, 79 directors are entitled to these stock options due to the retirement of 25 directors after grant date. If all of the stock options as of June 30, 2002, which require at least two-year continued service, are exercised, 1,375,000 new shares or shares held as treasury stock will be granted in accordance with the decision of the Board of Directors. The Company calculates the total compensation expense using the option-pricing model. In the model, the Risk-free rate of 9.04%, the expected exercise period of 5.5 years and the expected variation rate of stock price of 71.1 percent are adopted. Total compensation expense amounting to ₩12,611 million (US$10,493 thousand) and ₩13,895 million (US$11,562 thousand) as of June 30, 2002 and 2001, respectively, has been accounted for as a charge to current operations and a credit to capital adjustment over the required period of service (two years) from the grant date using the straight-line method.
(5) Cumulative translation adjustments for overseas branches
Cumulative translation credits of ₩685 million (US$570 thousand) and debits of ₩1,427 million (US$ 1,187 thousand) as of June 30, 2002 and 2001, respectively, which result from the translation of financial statements of the branch located in the United States, is included in capital adjustments on the basis set forth in Note 2.
(6) Gain (Loss) on valuation of derivatives
Gain on valuation of the effective portion of derivative instruments for cash flow hedging purpose from forecasted exports, amounting to ₩65,795 million (US$54,747 thousand) and loss on valuation of the effective portion of derivative instruments for cash flow hedging purpose from forecasted exports, amounting to ₩27,725 million (US$23,070 thousand) as of June 30, 2002 and 2001, respectively, is included in capital adjustments on the basis set forth in Note 2.
17. Income Tax Expense and Deferred Income Tax Assets Income tax expense for the first half of 2002 and 2001 consists of the following:
Korean won U.S. dollars (Note 2) (in millions) (in thousands) Description 2002 2001 2002 2001
Income tax currently payable ₩ 413,989 ₩ 344,517 $ 344,474 $ 286,668 Changes in deferred income taxes due to: Temporary differences (41,812) (71,773) (34,791) (59,721) Tax credit carried over - (91,465) - (76,107) (41,812) (163,238) (34,791) (135,828) Income tax expense ₩ 372,177 ₩ 181,279 $ 309,683 $ 150,840
In the first half of 2002 and 2001, the differences between income before tax in financial accounting and taxable income pursuant to Corporate Income Tax Law of Korea are as follows:
Korean won U.S. dollars (Note 2) (in millions) (in thousands) Description 2002 2001 2002 2001
Income before tax ₩1,265,603 ₩ 791,800 $ 1,053,090 $ 658,845 Additions 1,122,735 844,771 934,211 702,921 Deductions (852,299) (517,964) (709,186) (430,990) Taxable income ₩1,536,039 ₩1,118,607 $ 1,278,115 $ 930,776

- 18 - The changes in accumulated temporary differences for the first half of 2002 and 2001 are as follows:
Korean won U.S. dollars (Note 2) (in millions) (in thousands) Description 2002 2001 2002 2001
Beginning of period, net ₩ 315,155 ₩ 73,283 $ 262,236 $ 60,978 Changes in the current period, net 241,914 233,031 201,293 193,901 End of period, net ₩ 557,069 ₩ 306,314 $ 463,529 $ 254,879
Deferred income tax assets as of June 30, 2002 and 2001 are computed as follows:
Korean won U.S. dollars (Note 2) (in millions) (in thousands) Description 2002 2001 2002 2001 Accumulated temporary differences, net ₩ 557,069 ₩ 306,314 $ 463,529 $ 254,879 Adjustments (*): Gain on revaluation of land and other 397,078 499,891 330,403 415,952 954,147 806,205 793,932 670,831 Statutory tax rate (%) X 29.7 X 30.8 X 29.7 X 30.8 283,382 248,311 235,798 206,616 Tax credit carried over - 155,781 - 129,623 Deferred income tax assets ₩ 283,382 ₩ 404,092 $ 235,798 $ 336,239
(*) The Company believes that temporary difference of ₩397,078 million (US$330,403 thousand) and ₩499,891 million (US$415,952 thousand) as of June 30, 2002 and 2001, respectively, related to gain on revaluation of land and other will not be realized in the near future.
When each temporary difference reverses in the future, it will result in a decrease (increase) of taxable income and income tax payable. Deferred income tax assets are recognized only when it is probable the tax benefits from the accumulated temporary differences will be realized in the future. The Company believes the deductible temporary difference of ₩954,147 million (US$793,932 thousand) and ₩806,205 million (US$670,831 thousand) as of June 30, 2002 and 2001, respectively, can be realized in the future. Also, the Company believes average ordinary income in the coming years will exceed the amount of deferred taxes to be realized every year based on its assessment. Accordingly, the Company has recognized deferred income tax assets as of June 30, 2002 and 2001 and as a result, its effective tax rate is 29.41 percent and 22.89 percent in the first half of 2002 and 2001, respectively. 18. Related Party Transactions Significant transactions with affiliated companies for the first half of 2002 and outstanding balances as of June 30, 2002 are summarized below: Sales (Purchases) Receivables (Payables) Korean won U.S. dollars (Note 2) Korean won U.S. dollars (Note 2) Affiliated Company (in millions) (in thousands) (in millions) (in thousands) HMA ₩ 3,203,264 $ 2,665,389 ₩ 57,272 $ 47,655 HAOSVT 23,916 19,900 1,021 850 HMI 65,914 54,846 4,681 3,895 HMJ 19,846 16,514 1,701 1,415 HMP 38,043 31,655 2,103 1,750 Kia Motor Corporation 444,734 370,057 105,179 87,518 (201,634) (167,777) (54,153) (45,060) KEFICO 9,370 7,797 1,119 931 (134,652) (112,042) (47,912) (39,867) Hyundai MOBIS 145,843 121,354 23,292 19,381 (367,022) (305,394) (115,921) (96,456)

- 19 -
Sales (Purchases) Receivables (Payables) Korean won U.S. dollars (Note 2) Korean won U.S. dollars (Note 2) Affiliated Company (in millions) (in thousands) (in millions) (in thousands) Hyundai HYSCO 1,425 1,186 - - (84,667) (70,450) (50,658) (42,152) Korea Drive Train System 49,061 40,823 2,734 2,275 (188,752) (157,058) (49,300) (41,022) Hyundai Translead - - (431) (359)
Significant transactions with affiliated companies for the first half of 2001 and outstanding balances as of June 30, 2001 are summarized below: Sales (Purchases) Receivables (Payables) Korean won U.S. dollars (Note 2) Korean won U.S. dollars (Note 2) Affiliated Company (in millions) (in thousands) (in millions) (in thousands) HMA ₩ 2,272,161 $ 1,890,632 ₩ 118,163 $ 98,322 HMI 45,415 37,789 1,085 903 Kia Motor Corporation 425,820 354,319 87,415 72,737 (279,105) (232,239) (65,471) (54,477) KEFICO (132,426) (110,190) (52,176) (43,415) Hyundai MOBIS 105,772 88,011 130,605 108,674 (263,585) (219,325) (98,838) (82,242) Hyundai HYSCO (105,906) (88,123) (60,529) (50,365) Korea Drive Train System (103,116) (85,801) (46,598) (38,774) Hyundai Translead - - (42,712) (35,540)
19. Foreign Currency Denominated Assets and Liabilities The following is a summary of the assets and liabilities denominated in foreign currencies as of June 30, 2002 and 2001.
Foreign Currencies Korean won (in millions) 2002 2001 2002 2001
Assets US$ 163,318,278 US$ 611,416,342 ₩ 196,276 ₩ 795,148 JP¥ 206,397,059 JP¥ 25,897,212 2,073 270 EUR 54,171,620 EUR 13,707,472 64,501 15,144 GBP 3,561,808 GBP 5,781,592 6,556 10,649 CAD 5,289,035 CAD 27,313,248 4,188 23,473 AUS 10,953,402 - 7,416 - - DEM 68,833,351 - 38,883 - ESP 5,247,743,632 - 34,845 - ITL 32,833,607,400 - 18,735 ₩ 281,010 ₩ 937,147
Liabilities US$ 871,111,221 US$ 925,414,919 ₩ 1,046,901 ₩ 1,202,816 JP¥17,282,092,904 JP¥11,814,691,149 173,600 123,372 EUR 124,153,812 EUR 25,932,069 147,828 28,650 GBP 6,538,703 GBP 4,781,272 12,035 8,806 CAD 567,058 CAD 2,310,249 449 1,985 AUS 17,945,318 AUS 9,347,039 12,151 6,216 DEM 4,535,303 DEM 55,784,587 727 31,516 SFR 44,423 SFR 25,936 36 19 - ESP 323,837,382 - 2,150 - ITL 153,215,603 - 87 - FFR 1,405,327 - 237 ₩ 1,393,727 ₩ 1,405,854

- 20 -
20. Regional Sales Information Sales by region in the first half of 2002 and 2001 are as follows:
Korean won U.S. dollars (Note 2) (in millions) (in thousands) 2002 2001 2002 2001 Domestic sales ₩ 6,919,693 ₩ 5,901,876 $ 5,757,774 $ 4,910,864 Export sales - Vehicle products North America 3,203,263 2,665,726 2,665,388 2,218,111 Europe 1,070,050 1,157,107 890,373 962,812 South America 198,683 324,108 165,321 269,685 Asia & Pacific 264,189 309,334 219,828 257,392 Middle Asia & Africa 311,160 306,481 258,911 255,019 5,047,345 4,762,756 4,199,821 3,963,019 Export sales - Other 352,234 428,925 293,089 356,902 Export sales 5,399,579 5,191,681 4,492,910 4,319,921 Total sales ₩12,319,272 ₩11,093,557 $ 10,250,684 $ 9,230,785
21. Selling and Administrative Expenses Selling and administrative expenses for the six-month periods ended June 30, 2002 and 2001 are as follows:
Korean won U.S. dollars (Note 2) (in millions) (in thousands) 2002 2001 2002 2001 Salaries ₩ 456,966 ₩ 352,298 $ 380,235 $ 293,142Export costs 237,198 227,949 197,369 189,673 Sales promotion 291,062 264,590 242,188 220,161 Sales commissions 150,303 114,505 125,065 95,278 Sales warranties 670,751 416,029 558,122 346,172 Taxes and dues 6,252 7,397 5,202 6,155 Communications 11,873 13,378 9,879 11,132 Utilities 11,332 10,522 9,429 8,755 Freight and warehousing 39,943 32,886 33,236 27,364 Rent 12,573 12,988 10,462 10,807 Travel 25,815 28,065 21,480 23,352 Service charges 68,028 64,559 56,605 53,719 Supplies 12,997 14,111 10,815 11,742 Depreciation 27,442 17,576 22,834 14,625 Amortization 18,714 17,976 15,572 14,958 Provision for doubtful accounts 13,489 46,531 11,224 38,718 Other 69,134 13,773 57,526 11,459 ₩ 2,123,872 ₩ 1,655,133 $ 1,767,243 $ 1,377,212