Independence High School - ESUHSD - Parents/Instruction...2017-18 School Accountability Report Card...
10
2017-18 School Accountability Report Card for Independence High School Page 1 of 10 Independence High School 617 North Jackson Avenue • San Jose, CA, 95133-1703 • 408.928.9511 • Grades Bjorn Berg, Principal [email protected] https://ihs.schoolloop.com/ 2017-18 School Accountability Report Card Published During the 2018-19 School Year ---- ---- East Side Union High School District 830 N. Capitol Avenue San Jose, CA 95133 (408) 347-5000 www.esuhsd.org District Governing Board Lan Nguyen Frank Biehl J. Manuel Herrera Van Thi Le Pattie Cortese District Administration Chris D. Funk Superintendent Glenn Vander Zee Associate Superintendent Educational Services Chris Jew Associate Superintendent Business Services Dr. John Rubio Associate Superintendent Human Resources ---- ---- School Description Our school slogan is - Where students find their passion, purpose, and path. Our vision is the following - Independence High School is an intercultural community that provides students with rich opportunities for personal and academic growth while embracing diversity, belonging and open access for all. OUR GUIDING PRINCIPLES are the following - Equity. We address inequities and direct resources to meet every student’s needs. Community. We cultivate a relationship-centered community where every student and adult feels a sense of connection and belonging. Mastery. We empower students toward mastery through a solid foundation of skills and knowledge for ongoing growth and a successful future. Independence High School boasts nearly 3000 students on 105 acres. Our newly renovated theater opened in the 2016 spring semester, and will again be home to our acclaimed performing groups such as IndepenDance, school bands, orchestra, drama class, and many others. Our new art facility opened in August of 2017 to welcome our students. We have added many new Advanced Placement course and are incorporating the 5-C's into the teaching and learning on campus so that all students will be college and career ready upon graduation. Through a grant from Goodwill we are able to provide an extensive after-school program that includes a variety of types of academic tutoring, physical fitness, and artistic engagement; and is accompanied by a full, hot meal for students. We continue to host very diverse and successful athletic teams and many school clubs, including those devoted to honoring the cultures of those who live in our area. Independence High School is a cultural center and a gem in the east side of San Jose.
Transcript of Independence High School - ESUHSD - Parents/Instruction...2017-18 School Accountability Report Card...

2017-18 School Accountability Report Card for Independence High School Page 1 of 10
Independence High School
617 North Jackson Avenue • San Jose, CA, 95133-1703 • 408.928.9511 • Grades Bjorn Berg, Principal [email protected]
https://ihs.schoolloop.com/
2017-18 School Accountability Report Card
Published During the 2018-19 School Year ----
----
East Side Union High School District
830 N. Capitol Avenue San Jose, CA 95133
(408) 347-5000 www.esuhsd.org
District Governing Board
Lan Nguyen
Frank Biehl
J. Manuel Herrera
Van Thi Le
Pattie Cortese
District Administration
Chris D. Funk Superintendent
Glenn Vander Zee Associate Superintendent
Educational Services
Chris Jew Associate Superintendent
Business Services
Dr. John Rubio Associate Superintendent
Human Resources
---- ----
School Description Our school slogan is - Where students find their passion, purpose, and path. Our vision is the following - Independence High School is an intercultural community that provides students with rich opportunities for personal and academic growth while embracing diversity, belonging and open access for all. OUR GUIDING PRINCIPLES are the following - Equity. We address inequities and direct resources to meet every student’s needs. Community. We cultivate a relationship-centered community where every student and adult feels a sense of connection and belonging. Mastery. We empower students toward mastery through a solid foundation of skills and knowledge for ongoing growth and a successful future. Independence High School boasts nearly 3000 students on 105 acres. Our newly renovated theater opened in the 2016 spring semester, and will again be home to our acclaimed performing groups such as IndepenDance, school bands, orchestra, drama class, and many others. Our new art facility opened in August of 2017 to welcome our students. We have added many new Advanced Placement course and are incorporating the 5-C's into the teaching and learning on campus so that all students will be college and career ready upon graduation. Through a grant from Goodwill we are able to provide an extensive after-school program that includes a variety of types of academic tutoring, physical fitness, and artistic engagement; and is accompanied by a full, hot meal for students. We continue to host very diverse and successful athletic teams and many school clubs, including those devoted to honoring the cultures of those who live in our area. Independence High School is a cultural center and a gem in the east side of San Jose.

2017-18 School Accountability Report Card for Independence High School Page 2 of 10
About the SARC By February 1 of each year, every school in California is required by state law to publish a School Accountability Report Card (SARC). The SARC contains information about the condition and performance of each California public school. Under the Local Control Funding Formula (LCFF) all local educational agencies (LEAs) are required to prepare a Local Control and Accountability Plan (LCAP), which describes how they intend to meet annual school-specific goals for all pupils, with specific activities to address state and local priorities. Additionally, data reported in an LCAP is to be consistent with data reported in the SARC. • For more information about SARC requirements, see the California
Department of Education (CDE) SARC web page at https://www.cde.ca.gov/ta/ac/sa/.
• For more information about the LCFF or LCAP, see the CDE LCFF web page at https://www.cde.ca.gov/fg/aa/lc/.
• For additional information about the school, parents/guardians and community members should contact the school principal or the district office.
2017-18 Student Enrollment by Grade Level
Grade Level Number of Students
Grade 9 744
Grade 10 736
Grade 11 680
Grade 12 754
Total Enrollment 2,914
2017-18 Student Enrollment by Group
Group Percent of Total Enrollment
Black or African American 2.2
American Indian or Alaska Native 0.2
Asian 42.1
Filipino 18.4
Hispanic or Latino 31.8
Native Hawaiian or Pacific Islander 1.0
White 3.0
Socioeconomically Disadvantaged 56.8
English Learners 17.4
Students with Disabilities 9.7
Foster Youth 0.4
A. Conditions of Learning State Priority: Basic The SARC provides the following information relevant to the State priority: Basic (Priority 1): • Degree to which teachers are appropriately assigned and fully
credentialed in the subject area and for the pupils they are teaching; • Pupils have access to standards-aligned instructional materials; and • School facilities are maintained in good repair
Teacher Credentials
Independence High School 16-17 17-18 18-19
With Full Credential 120 118.4 118.7
Without Full Credential 8 3 6
Teaching Outside Subject Area of Competence 0 0 0
East Side Union High School District 16-17 17-18 18-19
With Full Credential ♦ ♦ 991.5
Without Full Credential ♦ ♦ 50.6
Teaching Outside Subject Area of Competence ♦ ♦ 0
Teacher Misassignments and Vacant Teacher Positions at this School
Independence High School 16-17 17-18 18-19
Teachers of English Learners 0 0 0
Total Teacher Misassignments 0 0 0
Vacant Teacher Positions 0 4 1
* Note: “Misassignments” refers to the number of positions filled by teachers who lack legal authorization to teach that grade level, subject area, student group, etc. *Total Teacher Misassignments includes the number of Misassignments of Teachers of English Learners.

2017-18 School Accountability Report Card for Independence High School Page 3 of 10
Quality, Currency, Availability of Textbooks and Instructional Materials (School Year 2018-19) Independence High School utilizes textbooks and instructional materials approved and adopted through our IPC. These materials most directly support standards-based teaching aligned with common core teaching.
Textbooks and Instructional Materials
Year and month in which data were collected: October 2018
Core Curriculum Area Textbooks and Instructional Materials/Year of Adoption
Reading/Language Arts English 1 – “The Language of Literature ” Grade 9 McDougal Littell 2002 English 2 – “The Language of Literature” Grade 10 McDougal Littell 2002 English 3 – MyPerspectives: American Literature//Pearson ERWC (English 4)-- Expository Reading and Writing Course Student Reader 2013 AP Composition and Language-- The Norton Reader AP Composition and Literature--The Intro to Literature
The textbooks listed are from most recent adoption: Yes
Percent of students lacking their own assigned textbook: 0%
Mathematics CCSS Math 1 – "Big Ideas Integrated Mathematics I," Big Ideas Learning, LLC 2016 CCSS Math 2 – "Big Ideas Integrated Mathematics II," Big Ideas Learning, LLC 2016 CCSS Math 3 – "Big Ideas Integrated Mathematics III," Big Ideas Learning, LLC 2016 Math Analysis – “Precalculus With Limits A Graphing Approach” Brooks/Cole Cengage Learning 2012 AP Calculus AB - Calculus w/Analytic Geometry, 9th ed: Houghton Mifflin Harcourt; 2010 AP Calculus BC - Calculus w/Analytic Geometry, 9th ed: Houghton Mifflin Harcourt; 2010 AP Statistics - The Practice of Statistics, 4th ed: Freeman; 2010 Exploring Computer Science - ECS: Exploring Computer Science; Joanna Goode, Gail Chapman 2016 AP Computer Science A - Online materials Mathematical Reasoning with Connections - MRWC materials
The textbooks listed are from most recent adoption: Yes
Percent of students lacking their own assigned textbook: 0%
Science Forensics- Criminalistics: An Introduction to Forensic Science, Prentice Hall 2004 Biology – NGSS Biology - The Living Earth -- STEMscopes, eTextbook and Web-based resources Chemistry – “Chemistry: Connections to our Changing World” Prentice-Hall 2000, 02 Physics – “Conceptual Physics” Addison-Wesley 1992, 99, 02, 06 A Hands on Introduction to Forensic Science 2014 AP Biology- AP Biology In Focus- Prentice Hall 2004 AP Chemistry- Chemistry The Central Science- Prentice-Hall 1991 AP Physics 1 and 2- Physics AP- Wiley 2012 AP Environmental Science- Living In The Environment- Cengage 2015 AP Physics C- Physics For Scientists and Engineers- Pearson 2013
The textbooks listed are from most recent adoption: Yes
Percent of students lacking their own assigned textbook: 0%
History-Social Science World History – “Modern World History” McDougal-Littell 2003 US History – “The American Vision” Glencoe/McGraw Hill 2006 American Government – "Government Alive! Power, Politics and You" TCI 2014 Economics – “Econ Alive! The Power to Choose" TCI 2015 AP World History - "The Earth and Its Peoples AP Edition" Cengage Learning 2018 AP US History - "America's History for the AP Course" Bedford 2014 AP Government - "Government in America" Pearson Learning 2014 AP Macro/Micro Economics - "Economics (AP)" McGraw Hill 2014 AP Human Geography - "The Cultural Landscape: An Introduction" Prentice Hall 2014 AP Psychology - "Psychology for AP" Worth 2015 World Geography - "Geography Alive!" TCI 2011
The textbooks listed are from most recent adoption: Yes
Percent of students lacking their own assigned textbook: 0%
Note: Cells with N/A values do not require data.

2017-18 School Accountability Report Card for Independence High School Page 4 of 10
School Facility Conditions and Planned Improvements (Most Recent Year) Overview The District makes every effort to ensure that all schools are clean, safe, and functional. To assist in this effort, the district uses a facility survey instrument developed by the State of California Office of Public School Construction. The results of this survey are available at the school office and at the district office. Cleaning Process and Schedule The district’s Board of Trustees has adopted cleaning standards for all schools in the district. The Leadership Team works daily with the custodial staff to develop cleaning schedules to ensure a clean and safe school. Deferred Maintenance Budget The district participates in the State School Deferred Maintenance Program, which provides state matching funds on a dollar-for-dollar basis, to assist school districts with expenditures for major repair or replacement of existing school building components. Typically, this includes roofing, plumbing, heating, air conditioning, electrical systems, interior or exterior painting, and floors systems. Age of School Buildings Although the main school campus was constructed in 1976, most building have since been renovated or on track to be renovated. Modernization Projects The renovated theater returned to use by Independence High School in December, 2015. This boosts our performing arts program, which has been a cornerstone of our school for decades. A new Visual Arts Center was opened in 2016. The N-1 front office and health clinic, as well as the N-2 counseling center and tutorial/student-innovation spaces are proving to be very effective ways for students and parents to seek and receive the help that they need. During the 2004-2006 school year, local Measure A and Measure G funds and state matching funds were used to renovate existing facilities. The remolding of the main gym was completed. In addition, the district has made every effort to renovate and comply with Title IV requirements. Independence has completed the renovation of the girl’s and boy’s locker rooms bringing them to ADA and Title IV standards. During the 2011-13 school years with the help of the remaining Measure G funds and additional funding from Measure E, our Olympic sized racing and diving pool have been upgraded, including a new filter system, diving boards and ADA lift. The Jim Plunkett/Lee Evans International Sports Stadium had new turf installed, and the track was re-paved. In addition, new sod has been installed in all of main fields. Future projects include a new visual arts complex, state of the art administration building and a renovated performing arts center. Technology continues to be a major focus for Independence. Monies will be dedicated to upgrading the computers and adding mobile labs. The entire campus is now wireless. The campus is awaiting the dispersal of our Measure Z funds with renovations approved by our School Site Council at that time.
School Facility Good Repair Status (Most Recent Year) Year and month in which data were collected: 6/22/18
System Inspected Repair Status Repair Needed and
Action Taken or Planned
Systems: Gas Leaks, Mechanical/HVAC, Sewer
XGood
Interior: Interior Surfaces
XGood
Cleanliness: Overall Cleanliness, Pest/ Vermin Infestation
XGood
Pest Infestation - on all fields gophers/squirrels - being addressed
Electrical: Electrical
XGood
Electrical panel in C commons needs to be replaced - work order submitted
Restrooms/Fountains: Restrooms, Sinks/ Fountains
XGood
Tennis Courts - water fountain not working - work order submitted / Tennis Court Complex under contract for renovation
Safety: Fire Safety, Hazardous Materials
XGood
Structural: Structural Damage, Roofs
XGood
Parking lots are being repaved and there are three areas slated for repaving this academic year.
External: Playground/School Grounds, Windows/ Doors/Gates/Fences
XGood
Overall Rating XGood
----------

2017-18 School Accountability Report Card for Independence High School Page 5 of 10
B. Pupil Outcomes
State Priority: Pupil Achievement The SARC provides the following information relevant to the State priority: Pupil Achievement (Priority 4): • Statewide assessments (i.e., California Assessment of Student
Performance and Progress [CAASPP] System, which includes the Smarter Balanced Summative Assessments for students in the general education population and the California Alternate Assessments [CAAs] for English language arts/literacy [ELA] and mathematics given in grades three through eight and grade eleven. Only eligible students may participate in the administration of the CAAs. CAAs items are aligned with alternate achievement standards, which are linked with the Common Core State Standards [CCSS] for students with the most significant cognitive disabilities); and
• The percentage of students who have successfully completed courses
that satisfy the requirements for entrance to the University of California and the California State University, or career technical education sequences or programs of study
2017-18 CAASPP Results for All Students
Subject
Percent of Students Meeting or Exceeding the State Standards (grades 3-8 and 11)
School District State
16-17 17-18 16-17 17-18 16-17 17-18
ELA 68.0 63.0 63.0 59.0 48.0 50.0
Math 41.0 39.0 39.0 38.0 37.0 38.0
Note: Percentages are not calculated when the number of students tested is ten or less, either because the number of students in this category is too small for statistical accuracy or to protect student privacy. Note: ELA and mathematics test results include the Smarter Balanced Summative Assessment and the CAA. The “Percent Met or Exceeded” is calculated by taking the total number of students who met or exceeded the standard on the Smarter
Balanced Summative Assessment plus the total number of students who met the standard (i.e., achieved Level 3–Alternate) on the CAAs divided by the total number of students who participated in both assessments.
CAASPP Test Results in Science for All Students
Subject
Percent of Students Scoring at Proficient or Advanced (meeting or exceeding the state standards)
School District State
16-17 17-18 16-17 17-18 16-17 17-18
Science N/A N/A N/A N/A N/A N/A
Note: Cells with N/A values do not require data. Note: The 2016–17 and 2017–18 data are not available. The CDE is developing a new science assessment based on the Next Generation Science Standards for California Public Schools (CA NGSS). The CAST was pilot-tested in spring 2017 and field-tested in spring 2018. The CAST will be administered operationally during the 2018–19 school year. The CAA for Science was pilot-tested for two years (i.e., 2016–17 and 2017–18) and the CAA for Science will be field-tested in 2018–19. Note: Science test results include the CAST and the CAA for Science. The “Percent Met or Exceeded” is calculated by taking the total number of students who met or exceeded the standard on the CAST plus the total number of students who met the standard (i.e., achieved Level 3–Alternate) on the CAA for Science divided by the total number of students who participated on both assessments.
State Priority: Other Pupil Outcomes The SARC provides the following information relevant to the State priority: Other Pupil Outcomes (Priority 8): • Pupil outcomes in the subject area of physical education
Grade Level
2017-18 Percent of Students Meeting Fitness Standards
4 of 6 5 of 6 6 of 6
---9--- 17.8 31.5 24.9 * Percentages are not calculated when the number of students tested is ten or
less, either because the number of students in this category is too small for statistical accuracy or to protect student privacy.
2017-18 School Accountability Report Card for Independence High School Page 6 of 10
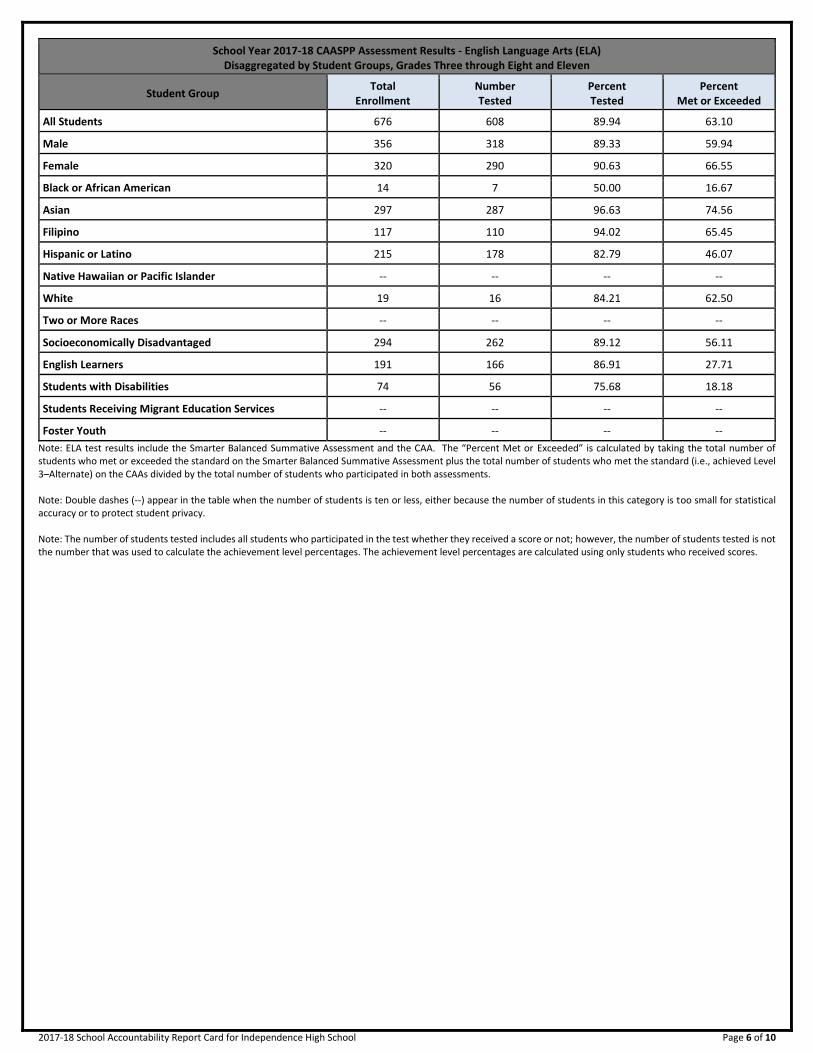
School Year 2017-18 CAASPP Assessment Results - English Language Arts (ELA) Disaggregated by Student Groups, Grades Three through Eight and Eleven
Student Group Total
Enrollment Number Tested
Percent Tested
Percent Met or Exceeded
All Students 676 608 89.94 63.10
Male 356 318 89.33 59.94
Female 320 290 90.63 66.55
Black or African American 14 7 50.00 16.67
Asian 297 287 96.63 74.56
Filipino 117 110 94.02 65.45
Hispanic or Latino 215 178 82.79 46.07
Native Hawaiian or Pacific Islander -- -- -- --
White 19 16 84.21 62.50
Two or More Races -- -- -- --
Socioeconomically Disadvantaged 294 262 89.12 56.11
English Learners 191 166 86.91 27.71
Students with Disabilities 74 56 75.68 18.18
Students Receiving Migrant Education Services -- -- -- --
Foster Youth -- -- -- --
Note: ELA test results include the Smarter Balanced Summative Assessment and the CAA. The “Percent Met or Exceeded” is calculated by taking the total number of students who met or exceeded the standard on the Smarter Balanced Summative Assessment plus the total number of students who met the standard (i.e., achieved Level 3–Alternate) on the CAAs divided by the total number of students who participated in both assessments. Note: Double dashes (--) appear in the table when the number of students is ten or less, either because the number of students in this category is too small for statistical accuracy or to protect student privacy. Note: The number of students tested includes all students who participated in the test whether they received a score or not; however, the number of students tested is not the number that was used to calculate the achievement level percentages. The achievement level percentages are calculated using only students who received scores.

2017-18 School Accountability Report Card for Independence High School Page 7 of 10
School Year 2017-18 CAASPP Assessment Results - Mathematics Disaggregated by Student Groups, Grades Three through Eight and Eleven
Student Group Total
Enrollment Number Tested
Percent Tested
Percent Met or Exceeded
All Students 676 560 82.84 38.75
Male 356 289 81.18 38.06
Female 320 271 84.69 39.48
Black or African American 14 5 35.71 20
Asian 297 274 92.26 58.03
Filipino 117 101 86.32 32.67
Hispanic or Latino 215 154 71.63 12.99
Native Hawaiian or Pacific Islander -- -- -- --
White 19 16 84.21 18.75
Two or More Races -- -- -- --
Socioeconomically Disadvantaged 294 238 80.95 32.35
English Learners 191 149 78.01 20.81
Students with Disabilities 74 49 66.22 2.04
Students Receiving Migrant Education Services -- -- -- --
Foster Youth -- -- -- --
Note: Mathematics test results include the Smarter Balanced Summative Assessment and the CAA. The “Percent Met or Exceeded” is calculated by taking the total number of students who met or exceeded the standard on the Smarter Balanced Summative Assessment plus the total number of students who met the standard (i.e., achieved Level 3–Alternate) on the CAAs divided by the total number of students who participated in both assessments. Note: Double dashes (--) appear in the table when the number of students is ten or less, either because the number of students in this category is too small for statistical accuracy or to protect student privacy. Note: The number of students tested includes all students who participated in the test whether they received a score or not; however, the number of students tested is not the number that was used to calculate the achievement level percentages. The achievement level percentages are calculated using only students who received scores.
C. Engagement
State Priority: Parental Involvement The SARC provides the following information relevant to the State priority: Parental Involvement (Priority 3): • Efforts the school district makes to seek parent input in making decisions for the school district and each school site
Opportunities for Parental Involvement (School Year 2018-19) Our Parent Center fosters a collaborative relationship between students, families, and our school. It provides resources and monthly workshops for parents and guardians to ensure academic achievement and success in school and in life. Parents are invited to participate in the English Learner Advisory Committee (ELAC), School Site Council (SSC), and our Coffee with the Principal series. In these ways parents can effect school policy and the use of public funds in ways that most positively impact their students. SSC meets in the N administration building at 5:30, on the first Tuesday of each month while school is in session. Voting members are elected annually, and all parents are able to self nominate and run, but meetings are open to the public, and public discussion is encouraged. We are always looking to increase the avenues of parent involvement, and are eager to hear from any parent who would like a greater role in their child's education. Parent & Community Involvement Specialist Maggie Rodriguez is eager to engage parents, assure online SchoolLoop access, and to increase participation of parents in ways that positively effect students. She can be emailed at [email protected], or called at (408) 928-9541.
State Priority: School Climate The SARC provides the following information relevant to the State priority: School Climate (Priority 6): • Pupil suspension rates; • Pupil expulsion rates; and • Other local measures on the sense of safety.
2017-18 School Accountability Report Card for Independence High School Page 8 of 10
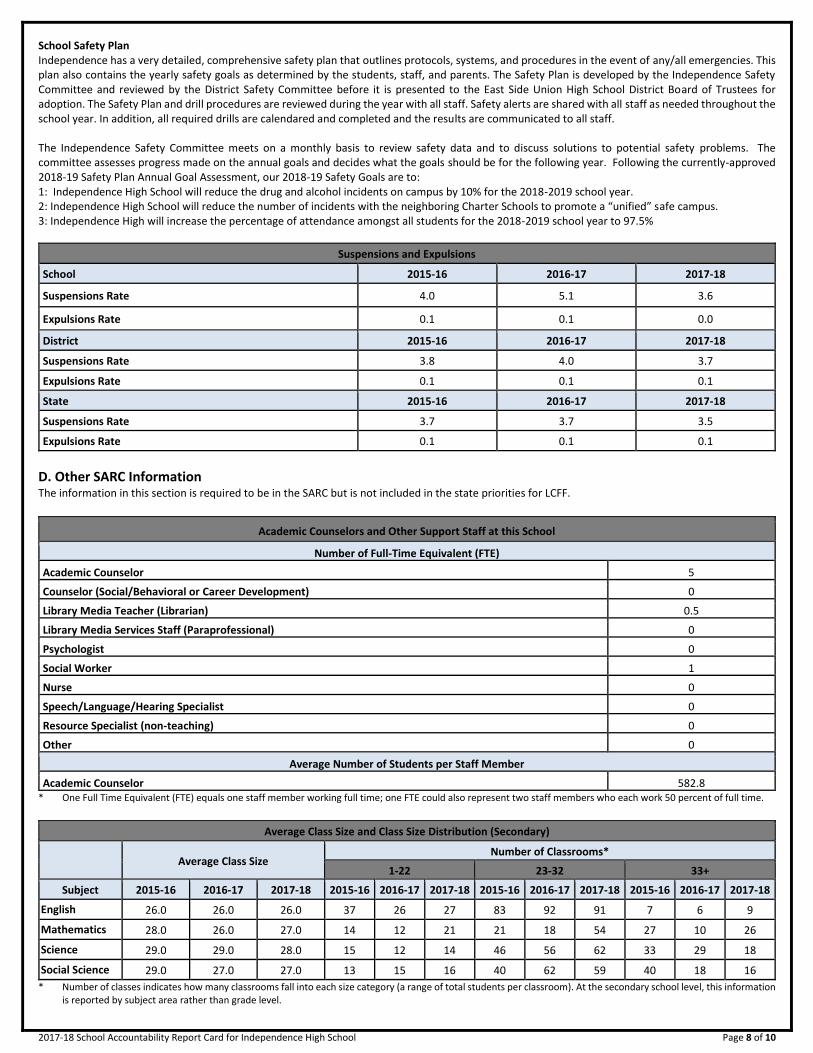
School Safety Plan Independence has a very detailed, comprehensive safety plan that outlines protocols, systems, and procedures in the event of any/all emergencies. This plan also contains the yearly safety goals as determined by the students, staff, and parents. The Safety Plan is developed by the Independence Safety Committee and reviewed by the District Safety Committee before it is presented to the East Side Union High School District Board of Trustees for adoption. The Safety Plan and drill procedures are reviewed during the year with all staff. Safety alerts are shared with all staff as needed throughout the school year. In addition, all required drills are calendared and completed and the results are communicated to all staff. The Independence Safety Committee meets on a monthly basis to review safety data and to discuss solutions to potential safety problems. The committee assesses progress made on the annual goals and decides what the goals should be for the following year. Following the currently-approved 2018-19 Safety Plan Annual Goal Assessment, our 2018-19 Safety Goals are to: 1: Independence High School will reduce the drug and alcohol incidents on campus by 10% for the 2018-2019 school year. 2: Independence High School will reduce the number of incidents with the neighboring Charter Schools to promote a “unified” safe campus. 3: Independence High will increase the percentage of attendance amongst all students for the 2018-2019 school year to 97.5%
Suspensions and Expulsions
School 2015-16 2016-17 2017-18
Suspensions Rate 4.0 5.1 3.6
Expulsions Rate 0.1 0.1 0.0
District 2015-16 2016-17 2017-18
Suspensions Rate 3.8 4.0 3.7
Expulsions Rate 0.1 0.1 0.1
State 2015-16 2016-17 2017-18
Suspensions Rate 3.7 3.7 3.5
Expulsions Rate 0.1 0.1 0.1
D. Other SARC Information
The information in this section is required to be in the SARC but is not included in the state priorities for LCFF.
Academic Counselors and Other Support Staff at this School
Number of Full-Time Equivalent (FTE)
Academic Counselor------- 5
Counselor (Social/Behavioral or Career Development) 0
Library Media Teacher (Librarian) 0.5
Library Media Services Staff (Paraprofessional) 0
Psychologist------- 0
Social Worker------- 1
Nurse------- 0
Speech/Language/Hearing Specialist 0
Resource Specialist (non-teaching)------- 0
Other------- 0
Average Number of Students per Staff Member
Academic Counselor------- 582.8 * One Full Time Equivalent (FTE) equals one staff member working full time; one FTE could also represent two staff members who each work 50 percent of full time.
Average Class Size and Class Size Distribution (Secondary)
Average Class Size Number of Classrooms*
1-22 23-32 33+
Subject 2015-16 2016-17 2017-18 2015-16 2016-17 2017-18 2015-16 2016-17 2017-18 2015-16 2016-17 2017-18
English------- ----------
26.0 26.0 26.0 37 26 27 83 92 91 7 6 9
Mathematics ----------
28.0 26.0 27.0 14 12 21 21 18 54 27 10 26
Science------- ----------
29.0 29.0 28.0 15 12 14 46 56 62 33 29 18
Social Science ----------
29.0 27.0 27.0 13 15 16 40 62 59 40 18 16
* Number of classes indicates how many classrooms fall into each size category (a range of total students per classroom). At the secondary school level, this information is reported by subject area rather than grade level.
2017-18 School Accountability Report Card for Independence High School Page 9 of 10
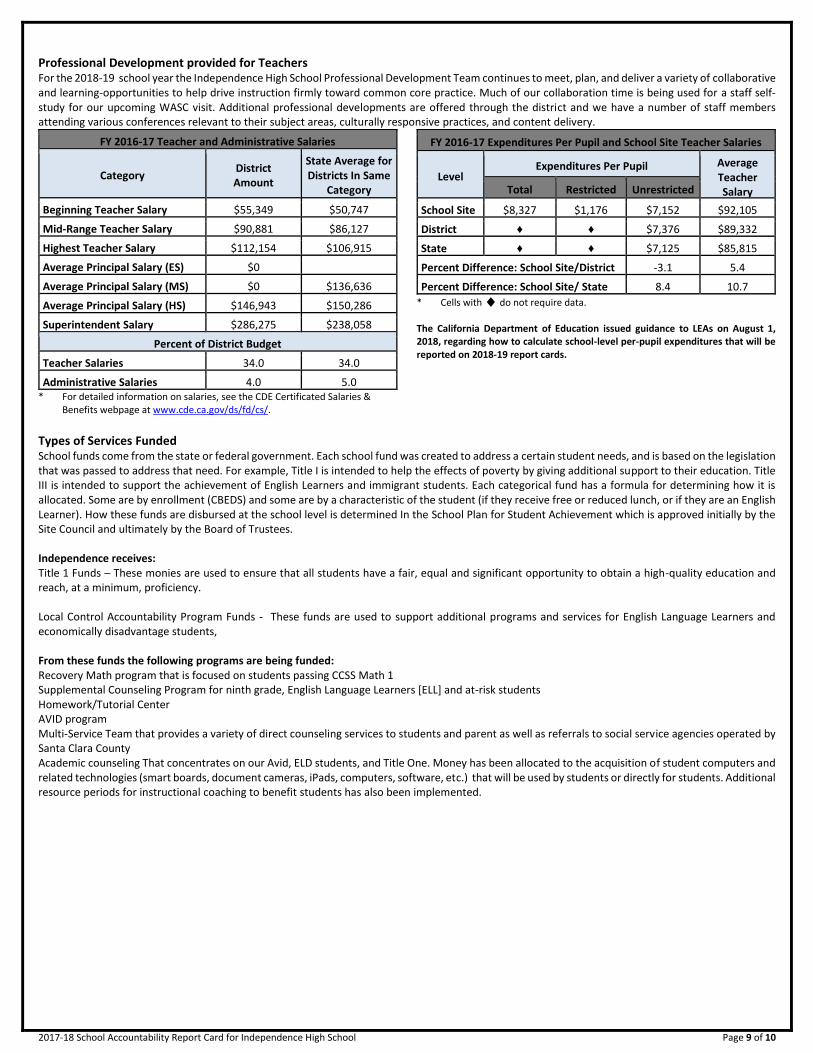
Professional Development provided for Teachers For the 2018-19 school year the Independence High School Professional Development Team continues to meet, plan, and deliver a variety of collaborative and learning-opportunities to help drive instruction firmly toward common core practice. Much of our collaboration time is being used for a staff self-study for our upcoming WASC visit. Additional professional developments are offered through the district and we have a number of staff members attending various conferences relevant to their subject areas, culturally responsive practices, and content delivery.
FY 2016-17 Teacher and Administrative Salaries
Category District Amount
State Average for Districts In Same
Category
Beginning Teacher Salary $55,349 $50,747
Mid-Range Teacher Salary $90,881 $86,127
Highest Teacher Salary $112,154 $106,915
Average Principal Salary (ES) $0
Average Principal Salary (MS) $0 $136,636
Average Principal Salary (HS) $146,943 $150,286
Superintendent Salary $286,275 $238,058
Percent of District Budget
Teacher Salaries 34.0 34.0
Administrative Salaries 4.0 5.0 * For detailed information on salaries, see the CDE Certificated Salaries &
Benefits webpage at www.cde.ca.gov/ds/fd/cs/.
FY 2016-17 Expenditures Per Pupil and School Site Teacher Salaries
Level Expenditures Per Pupil Average
Teacher Salary Total Restricted Unrestricted
School Site-------
$8,327 $1,176 $7,152 $92,105
District-------
♦ ♦ $7,376 $89,332
State------- ♦ ♦ $7,125 $85,815
Percent Difference: School Site/District -3.1 5.4
Percent Difference: School Site/ State 8.4 10.7
* Cells with ♦ do not require data. The California Department of Education issued guidance to LEAs on August 1, 2018, regarding how to calculate school-level per-pupil expenditures that will be reported on 2018-19 report cards.
Types of Services Funded School funds come from the state or federal government. Each school fund was created to address a certain student needs, and is based on the legislation that was passed to address that need. For example, Title I is intended to help the effects of poverty by giving additional support to their education. Title III is intended to support the achievement of English Learners and immigrant students. Each categorical fund has a formula for determining how it is allocated. Some are by enrollment (CBEDS) and some are by a characteristic of the student (if they receive free or reduced lunch, or if they are an English Learner). How these funds are disbursed at the school level is determined In the School Plan for Student Achievement which is approved initially by the Site Council and ultimately by the Board of Trustees. Independence receives: Title 1 Funds – These monies are used to ensure that all students have a fair, equal and significant opportunity to obtain a high-quality education and reach, at a minimum, proficiency. Local Control Accountability Program Funds - These funds are used to support additional programs and services for English Language Learners and economically disadvantage students, From these funds the following programs are being funded: Recovery Math program that is focused on students passing CCSS Math 1 Supplemental Counseling Program for ninth grade, English Language Learners [ELL] and at-risk students Homework/Tutorial Center AVID program Multi-Service Team that provides a variety of direct counseling services to students and parent as well as referrals to social service agencies operated by Santa Clara County Academic counseling That concentrates on our Avid, ELD students, and Title One. Money has been allocated to the acquisition of student computers and related technologies (smart boards, document cameras, iPads, computers, software, etc.) that will be used by students or directly for students. Additional resource periods for instructional coaching to benefit students has also been implemented.

2017-18 School Accountability Report Card for Independence High School Page 10 of 10
Dropout Rate and Graduation Rate (Four-Year Cohort Rate)
Independence High School 2014-15 2015-16 2016-17
Dropout Rate 9.4 9.6 8.6
Graduation Rate 85.5 86.2 86.4
East Side Union High School District 2014-15 2015-16 2016-17
Dropout Rate 11.7 10.0 20.5
Graduation Rate 83.0 85.0 71.5
California 2014-15 2015-16 2016-17
Dropout Rate 10.7 9.7 9.1
Graduation Rate 82.3 83.8 82.7
Career Technical Education Participation
Measure CTE Program Participation
Number of pupils participating in CTE 690
% of pupils completing a CTE program and earning a high school diploma
38%
% of CTE courses sequenced or articulated between the school and institutions of postsecondary education
33%
Courses for University of California (UC) and/or California State University (CSU) Admission
UC/CSU Course Measure Percent
2017-18 Students Enrolled in Courses Required for UC/CSU Admission
98.3
2016-17 Graduates Who Completed All Courses Required for UC/CSU Admission
44.8
* Where there are student course enrollments.
2017-18 Advanced Placement Courses
Subject Number of AP Courses
Offered*
Percent of Students In AP Courses
Computer Science 0 ♦
English------- 3 ♦
Fine and Performing Arts 2 ♦
Foreign Language 6 ♦
Mathematics 12 ♦
Science------- 10 ♦
Social Science 11 ♦
All courses 44 27.1
Completion of High School Graduation Requirements
Group Graduating Class of 2017
School District State
All Students 87.9 84.1 88.7
Black or African American 80.0 75.3 82.2
American Indian or Alaska Native 0.0 0.0 82.8
Asian 93.0 95.0 94.9
Filipino 94.1 92.2 93.5
Hispanic or Latino 77.7 76.3 86.5
Native Hawaiian/Pacific Islander 0.0 67.7 88.6
White 100.0 92.7 92.1
Two or More Races 62.5 89.2 91.2
Socioeconomically Disadvantaged 92.8 83.8 88.6
English Learners 65.0 62.3 56.7
Students with Disabilities 67.2 62.0 67.1
Foster Youth 100.0 59.3 74.1
Career Technical Education Programs Independence High School offers courses intended to help students prepare for the world of work. These career technical education courses (CTE) are open to all students. In addition to the courses offered at Independence, junior and senior students also have the opportunity to participate in the Silicon Valley Career Technical Center (SV-CTE). The programs Independence offers are in the area of: Finance and Business, Information Technology, Teaching Academy, Automotive (Transportation) Technology, Electronics Academy, and Carpentry/Construction. With the focus on Common Core Standards there is heavy concentration on College-to-Career education.
DataQuest DataQuest is an online data tool located on the CDE DataQuest web page at https://dq.cde.ca.gov/dataquest/ that contains additional information about this school and comparisons of the school to the district and the county. Specifically, DataQuest is a dynamic system that provides reports for accountability (e.g., test data, enrollment, high school graduates, dropouts, course enrollments, staffing, and data regarding English learners).
Internet Access Internet access is available at public libraries and other locations that are publicly accessible (e.g., the California State Library). Access to the Internet at libraries and public locations is generally provided on a first-come, first-served basis. Other use restrictions may include the hours of operation, the length of time that a workstation may be used (depending on availability), the types of software programs available on a workstation, and the ability to print documents.