Indentation Creep Behavior and Microstructure of Cu...
7
Materials Sciences and Application, 2011, 2, 1076-1082 doi:10.4236/msa.2011.28145 Published Online August 2011 (http://www.SciRP.org/journal/msa) Copyright © 2011 SciRes. MSA Indentation Creep Behavior and Microstructure of Cu-Ge Ferrites Hesham Mohaned Zaki 1,2* , Ali Mohamed Abdel-Daiem 1,2 , Yahia Ibrahim Swilem 1,2 , Farid El-Tantawy 3 , Fahad Masoud Al-Marzouki 1 , Ahmed Abdallah Al-Ghamdi 1 , Saleh Al-Heniti 1 , Farag Said Al-Hazmi 1 , Talal Sadaka Al-Harbi 1 1 Department of Physics, Faculty of Science, King Abdulaziz University, Jeddah, Kingdom of Saudi Arabia; 2 Department of Physics, Faculty of Science, Zagazig University, Zagazig, Egypt; 3 Department of Physics, Faculty of Science, Suez Canal University, Ismailia, Egypt Department of Physics. Email: * [email protected]; [email protected] Received February 26 th , 2011; revised May 5 th , 2011; accepted May 20 th , 2011. ABSTRACT Cu-Ge ferrite was prepared using the standard ceramic method. The creep rate of polycrystalline Cu 1+x Ge x Fe 2-2x O 4 ferrite has been measured as a function of time at room temperature. It is found that the indentation length increases with the increase of both time and applied load. A regime of individual creep curves is observed for the first and second stages. It is not possible to record the third stage of the curve as usually happened in an ordinary creep test, because fracture of the samples does not occur. The slope is found to increase with increasing germanium and copper content in the steady state region. The high value of n (stress exponent factor) indicates that the dislocation creep is the dominate mechanism. The porosity arrangements developed within the specimens were examined using optical microscope. The results are discussed with regard to models describing the role of the steady state creep rate of metals. The morphology of the samples shows that the porosity is increased by increasing both copper and germanium ions. Keywords: Ferrites, Indentation Creep, Microstructure 1. Introduction Ferrites—ceramic ferromagnetic materials have been considered as highly important electronic materials for more than half a century. Ceramic like ferromagnetic materials, which are mainly composed of ferric oxide, α-Fe 2 O 3 , are called “ferrites”. Although the saturation magnetization for fer- rites is less than half that of ferromagnetic alloys, they have advantages, such as applicability at higher frequen- cy, greater heat resistance, higher corrosion resistance and lower cost. The practical applications of ferrites have been expanded by completely utilizing these advantages. Individual creep curves generally show primary, sec- ondary, and tertiary creep. The majority of the primary creep is not recoverable. The best representation of the data is one where the creep rate depends exponentially on the stress, rather than on the traditional power law. The steady state rate equation for creep of crystalline materials is often represented by / n p Q RT A d e σ − − ∈= (1) where ∈ is the strain rate, σ is the applied stress, A is a material parameter, d is the grain size, Q is the activa- tion energy for creep, R is the gas constant, T is the tem- perature, n denotes the stress exponent factor and p is the grain size exponent. Nishikawal et al. [1], Nishikawa and okamoto [2] dis- cussed the control of deformation mechanisms for creep under some conditions by analyzing stress, grain size and temperature dependency of steady state strain rate. Ac- cording to their study, at intermediate stresses, power low creep is the dominant mechanism giving size of n = 3 to 5 , p = 0 and Q = Q L , in which Q L is the activation energy of the lattice diffusion. There are three distinct deformation mechanisms which exhibit the stress depen- dence. Two of them include the flow of vacancies from surfaces and grain boundaries under relative compression. In the case that vacancies flow through the crystal lattice , p = 2, Q = Q L (Nabarro-Herring creep) [3,4]. In the case that the vacancies flow along grain boundaries, p = 3 and Q = Q b , where Q b is the activation energy for grain boundary diffusion (Coble creep) [5]. The third process was reported firstly by Harper and Dorn [ 6 ] on alumi- num, involves dislocation, multiplication and motion.
-
Upload
dangnguyet -
Category
Documents
-
view
224 -
download
0
Transcript of Indentation Creep Behavior and Microstructure of Cu...

Materials Sciences and Application, 2011, 2, 1076-1082 doi:10.4236/msa.2011.28145 Published Online August 2011 (http://www.SciRP.org/journal/msa)
Copyright © 2011 SciRes. MSA
Indentation Creep Behavior and Microstructure of Cu-Ge Ferrites Hesham Mohaned Zaki1,2*, Ali Mohamed Abdel-Daiem1,2, Yahia Ibrahim Swilem1,2, Farid El-Tantawy3, Fahad Masoud Al-Marzouki1, Ahmed Abdallah Al-Ghamdi1, Saleh Al-Heniti1, Farag Said Al-Hazmi1, Talal Sadaka Al-Harbi1
1Department of Physics, Faculty of Science, King Abdulaziz University, Jeddah, Kingdom of Saudi Arabia; 2Department of Physics, Faculty of Science, Zagazig University, Zagazig, Egypt;3Department of Physics, Faculty of Science, Suez Canal University, Ismailia, Egypt Department of Physics. Email: *[email protected]; [email protected] Received February 26th, 2011; revised May 5th, 2011; accepted May 20th, 2011. ABSTRACT Cu-Ge ferrite was prepared using the standard ceramic method. The creep rate of polycrystalline Cu1+xGexFe2-2xO4 ferrite has been measured as a function of time at room temperature. It is found that the indentation length increases with the increase of both time and applied load. A regime of individual creep curves is observed for the first and second stages. It is not possible to record the third stage of the curve as usually happened in an ordinary creep test, because fracture of the samples does not occur. The slope is found to increase with increasing germanium and copper content in the steady state region. The high value of n (stress exponent factor) indicates that the dislocation creep is the dominate mechanism. The porosity arrangements developed within the specimens were examined using optical microscope. The results are discussed with regard to models describing the role of the steady state creep rate of metals. The morphology of the samples shows that the porosity is increased by increasing both copper and germanium ions. Keywords: Ferrites, Indentation Creep, Microstructure
1. Introduction Ferrites—ceramic ferromagnetic materials have been considered as highly important electronic materials for more than half a century.
Ceramic like ferromagnetic materials, which are mainly composed of ferric oxide, α-Fe2O3, are called “ferrites”. Although the saturation magnetization for fer-rites is less than half that of ferromagnetic alloys, they have advantages, such as applicability at higher frequen-cy, greater heat resistance, higher corrosion resistance and lower cost. The practical applications of ferrites have been expanded by completely utilizing these advantages.
Individual creep curves generally show primary, sec-ondary, and tertiary creep. The majority of the primary creep is not recoverable. The best representation of the data is one where the creep rate depends exponentially on the stress, rather than on the traditional power law.
The steady state rate equation for creep of crystalline materials is often represented by
/n p Q RTA d eσ − −∈= (1) where ∈ is the strain rate, σ is the applied stress, A is
a material parameter, d is the grain size, Q is the activa-tion energy for creep, R is the gas constant, T is the tem-perature, n denotes the stress exponent factor and p is the grain size exponent.
Nishikawal et al. [1], Nishikawa and okamoto [2] dis-cussed the control of deformation mechanisms for creep under some conditions by analyzing stress, grain size and temperature dependency of steady state strain rate. Ac-cording to their study, at intermediate stresses, power low creep is the dominant mechanism giving size of n = 3 to 5 , p = 0 and Q = QL, in which QL is the activation energy of the lattice diffusion. There are three distinct deformation mechanisms which exhibit the stress depen-dence. Two of them include the flow of vacancies from surfaces and grain boundaries under relative compression. In the case that vacancies flow through the crystal lattice , p = 2, Q = QL (Nabarro-Herring creep) [3,4]. In the case that the vacancies flow along grain boundaries, p = 3 and Q = Qb, where Qb is the activation energy for grain boundary diffusion (Coble creep) [5]. The third process was reported firstly by Harper and Dorn [ 6 ] on alumi-num, involves dislocation, multiplication and motion.
Indentation Creep Behavior and Microstructure of Cu-Ge Ferrites
Copyright © 2011 SciRes. MSA
1077
Nishikawa et al. [1], Nishikawa and okamoto [2] stu-died Mn-Zn ferrite (Mn0.5 Zn0.5 Fe2 O4) with a wide range of temperature, stress and grain size. They showed con-vincing evidence for the operation of diffusional creep at low stress and small grain size accordingly the strain rate can be expressed in the form {Norton–Baley–Arrhenius (NBA) model [7,8 ]} :
/n Q RTA eσ −∈= (2)
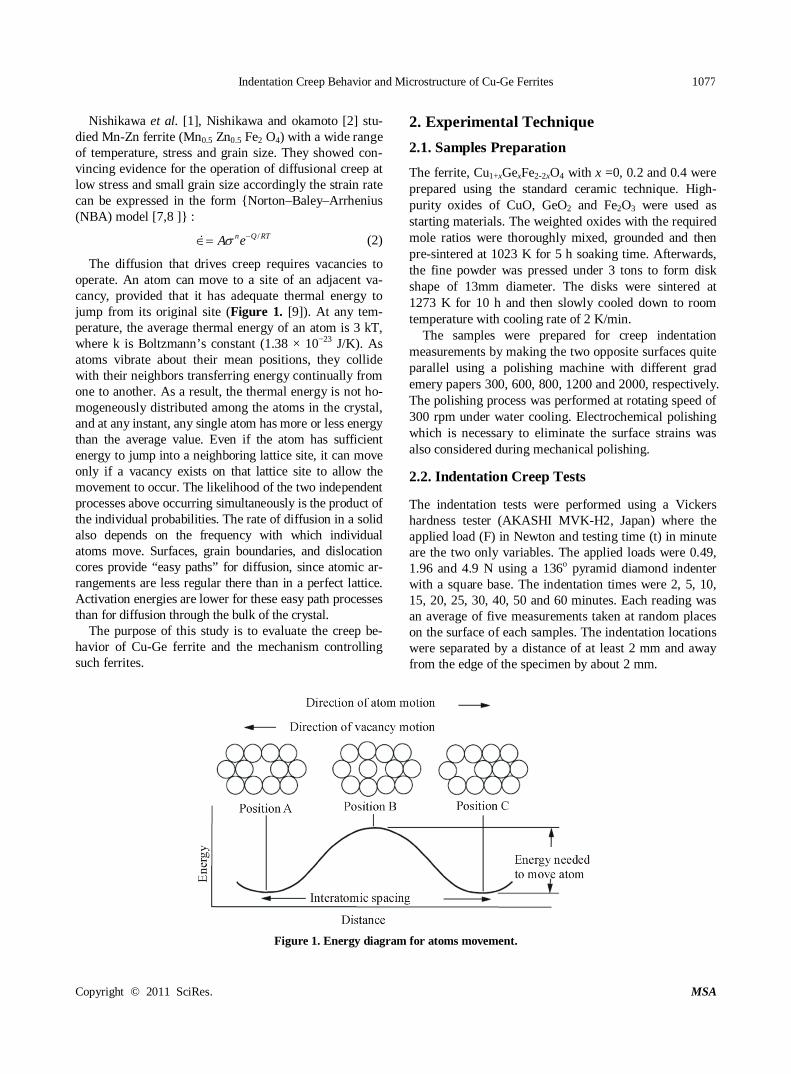
The diffusion that drives creep requires vacancies to operate. An atom can move to a site of an adjacent va-cancy, provided that it has adequate thermal energy to jump from its original site (Figure 1. [9]). At any tem-perature, the average thermal energy of an atom is 3 kT, where k is Boltzmann’s constant (1.38 × 10⁻²³ J/K). As atoms vibrate about their mean positions, they collide with their neighbors transferring energy continually from one to another. As a result, the thermal energy is not ho-mogeneously distributed among the atoms in the crystal, and at any instant, any single atom has more or less energy than the average value. Even if the atom has sufficient energy to jump into a neighboring lattice site, it can move only if a vacancy exists on that lattice site to allow the movement to occur. The likelihood of the two independent processes above occurring simultaneously is the product of the individual probabilities. The rate of diffusion in a solid also depends on the frequency with which individual atoms move. Surfaces, grain boundaries, and dislocation cores provide “easy paths” for diffusion, since atomic ar-rangements are less regular there than in a perfect lattice. Activation energies are lower for these easy path processes than for diffusion through the bulk of the crystal.
The purpose of this study is to evaluate the creep be-havior of Cu-Ge ferrite and the mechanism controlling such ferrites.
2. Experimental Technique 2.1. Samples Preparation
The ferrite, Cu1+xGexFe2-2xO4 with x =0, 0.2 and 0.4 were prepared using the standard ceramic technique. High- purity oxides of CuO, GeO2 and Fe2O3 were used as starting materials. The weighted oxides with the required mole ratios were thoroughly mixed, grounded and then pre-sintered at 1023 K for 5 h soaking time. Afterwards, the fine powder was pressed under 3 tons to form disk shape of 13mm diameter. The disks were sintered at 1273 K for 10 h and then slowly cooled down to room temperature with cooling rate of 2 K/min.
The samples were prepared for creep indentation measurements by making the two opposite surfaces quite parallel using a polishing machine with different grad emery papers 300, 600, 800, 1200 and 2000, respectively. The polishing process was performed at rotating speed of 300 rpm under water cooling. Electrochemical polishing which is necessary to eliminate the surface strains was also considered during mechanical polishing.
2.2. Indentation Creep Tests
The indentation tests were performed using a Vickers hardness tester (AKASHI MVK-H2, Japan) where the applied load (F) in Newton and testing time (t) in minute are the two only variables. The applied loads were 0.49, 1.96 and 4.9 N using a 136o pyramid diamond indenter with a square base. The indentation times were 2, 5, 10, 15, 20, 25, 30, 40, 50 and 60 minutes. Each reading was an average of five measurements taken at random places on the surface of each samples. The indentation locations were separated by a distance of at least 2 mm and away from the edge of the specimen by about 2 mm.
Figure 1. Energy diagram for atoms movement.

Indentation Creep Behavior and Microstructure of Cu-Ge Ferrites
Copyright © 2011 SciRes. MSA
1078
2.3. Microstructure The microstructure of the ferrite specimens was obtained using Nikon optical microscope model (M 001-378, Ja-pan) provided with a computerized camera (FUJIX Digi-tal Camera HC-300 I). An electrochemical etching is performed in an etching cell with Pt hollow cylindrical cathode, where the sample is placed as an anode in the center of cylindrical cathode. The samples were etched in a solution composed of 90% acetic acid and 10% pe-rochloric acid for 20 sec. After that the samples were washed using deionized water and finally cleaned in acetone using ultrasound cleaner. 3. Results and Discussion 3.1. Creep Behavior Figure 2 shows the variation of indentation diagonal length d versus time under constant loads of 0.49, 1.96 and 4.9 N for the studied ferrite with different Cu and Ge concentration. It can be seen from the figure that the in-dentation length increases with the increase of both
Figure 2. Indentation diagonal length curves obtained at different loads for Cu-Ge ferrites. time and applied load. It also shows the two stages which are similar to an ordinary creep curve. The first stage indicates a rapid increase in indentation length up to 20 min for all samples when the load is at its highest value (4.9 N) followed by the second stage with a steady or linear increase. Since compression is used as the hard-ness test, fracture of the samples does not occur. There-fore, it is not possible to record the third stage of the curve as usually happened in an ordinary creep test. In addition, the figure shows that the level in the steady state region and slope are increased by increasing the germanium and copper concentration instead of iron. This implies that as Ge4+ and Cu2+ ions increase, room temperature creep occurs more rapidly.
Figure 3 shows the rate of variation in indentation length (do) against dwell time, which obtained by diffe-rentiation of the curves in figure 1 to show the effect of increasing copper and germanium more clearly. One can see from this figure that there is a sharp drop in the creep rates at short times corresponding to the primary creep stage, followed by a lower decreasing rate region which corresponding to the steady state stage of the studied compositions. It is further demonstrated that samples with high concentration of both copper and germanium ions have higher creep rates than that of lower concentra-tions. It is also observed that the almost for all composi-tions, there is exists of an apparent steady state.
To obtain the steady state creep exponents, the fol-lowing equation of creep analysis was applied to the in-dentation data of the samples [10].
n = ln lnln ln v
dH
δδ
(3)
where Hv is the Vickers hardness number which calcu-
0 20 40 60
0.010
0.015
0.020
0.025
Cu-Ge(x=0.0_ Cu-Ge(x=0.2) Cu-Ge(x=0.4)
d (m
m)
t (min)
F=0.49 N
0 20 40 60
0.024
0.030
0.036
0.042
Cu-Ge(x=0.0) Cu-Ge(x=0.2) Cu-Ge(x=0.4)
d (m
m)
t (min)
F=1.96 N
0 20 40 600.03
0.04
0.05
0.06
0.07
Cu-Ge(x=0.0) Cu-Ge(x=0.2) Cu-Ge(x=0.4)
d (m
m)
t (min)
F=4.9 N

Indentation Creep Behavior and Microstructure of Cu-Ge Ferrites
Copyright © 2011 SciRes. MSA
1079
Figure 3. Indentation length rate (do) plotted against dwell time for 0.49 up to 4.9 N loads for Cux Ge 1_x Fe2O4. lated from the relation, Hv = 0.1854 [F/d2] [11], in which d is the indentation diagonal length and F is the applied load, �̇�𝑑 is the rate variation in indentation length and F
is the applied load. The rate of diagonal variation is plotted against the
Vickers hardness number as shown in Figure 4 for all samples and testing loads. A straight line is resulted from the least square fitting of all data points using origin lab program for each sample and load. M. Sternitze and H. Hubner [12] studied the creep properties for Al2O3/ Sic nano-composite and they found that the stress exponent factor (n) ranged from 2.5 to 5.5.
Creep stress exponent can help to narrow the field
Figure 4. Plots of ln (do) versus ln (HV) at different loads to determine the stress exponent for the studied ferrites.
0 10 20 30 40 50 60
0.0000
0.0002
0.0004
0.0006
do ( mm
min
-1)
Dewell time, min.
Cu-Ge0
Cu-Ge0.2
Cu-Ge0.4
F=0.49 N
0 10 20 30 40 50 60
0.0000
0.0002
0.0004
0.0006
0.0008
0.0010
do ( mm
min
-1)
Dewll time, min.
Cu-Ge0
Cu-Ge0.2
Cu-Ge0.4
F=1.96 N
0 10 20 30 40 50 60
0.0000
0.0005
0.0010
0.0015
0.0020
do (mm
min
-1)
Dewell time, min
Cu-Ge0
Cu-Ge0.2
Cu-Ge0.4
F=4.9 N
5.5 6.0 6.5-12
-10
-8
-6
ln do , m
m, m
in-1
ln H
Cu-Ge0 n=7.95 Cu-Ge0.2 n=4.74 Cu-Ge0.4 n=3.02
F=0.49 N
5.6 6.0 6.4 6.8-12
-10
-8
-6
-4
ln do
ln Hv
Cu-Ge0 n=12.1 Cu-Ge0.2 n=14.5 Cu-Ge0.4 n=3.4
F=1.96 N
5.6 6.0 6.4 6.8-12
-10
-8
-6
-4
F=4.9 N Cu-Ge0 n=10.7 Cu-Ge0.2 n=6.8 Cu-Ge0.4 n=4.7
ln do
ln Hv

1080 Indentation Creep Behavior and Microstructure of Cu-Ge Ferrites
Copyright © 2011 SciRes. MSA
among many theoretical possibilities [13]. It was re-ported that diffusion creep is associated with n value around one [14], grain boundaries sliding leads to n val-ues close to 2 [15] and dislocation climbs responsible for n values in the range of 4 - 6 [16]. Goetze [17] and Dur-than [18] indicated that the dislocation creep is the do-minating mechanism when the values of the stress com-ponent n lie between 3 and 10. In our present work the relatively high values of n (3 - 14.5) imply that the oper-ative creep mechanism in the studied samples is disloca-tion creep.
The variation of hardness with dwell time due to in-dentation creep is shown in Figure 5. It is obvious that hardness decreases with increasing the dwell time. The decrease is very sharp in the first stage followed by a linear decrease with increasing time.
Kagiarova et al. [19] stated that the low value of the stress exponent is consistent with samples with low cavity concentration. According to the morphology of the inves-tigated samples, the porosity increases by increasing cop-per and germanium concentration; accordingly the expo-nent stress factor would be increased too. As a result of that, we can assume that a higher concentration of dopent associated with the enhancement of cavity formation. Moreover, the indentation caused by the applied stress may create new cavities. Then, as the stress increases the contribution of cavitations is expected to increase and hence the contribution to the creep rate will increase and consequently the exponent stress factor will increase.
3.2. Microstructure In order to give an accurtate view about the morphology, optical microstructure for Cu-Ge ferrites are depicted in Figure 6. The micrographs of the studied samples reveal circular pores narrowly distributed, spread throughout the entire microstructure. The interaction of grain boundary and porosity along with sintering temperature is impor-tant in determining the limiting grain size [20]. When many pores are present and the sintering temperature is not too high, grain growth is inhibited.
Figure 6 shows that the porosity of the samples are increased by increasing Ge and Cu ions content which making the density to decreases. When substituting Ge in small amount, the effect on the microstructure of Cu-ferrite can be explained in terms of the increased pore mobility. This is due to the creation of excess cation va-cancy formation by doping the ferrite with high valence cations which can be argued from the site and change neutrality as well as the oxidation-reduction equilibrium of iron. It has been reported that the presence of large pores is due to the amount of metal ion vacancies caused by oxidation [21]. This structure indicates that the sam-ples can easily exhibit absorption and condensation of
Figure 5. The variation of hardness against time for differ-ent loads of Cu-Ge ferrites. water vapor as Ge4+ ions increase. According to Hemeda [22,23] and Ecklet [24] the increase of Cu2+ ions leads to the increase of porosity. Also Visser et al. [25] state that
0 20 40 60
200
400
600
800
1000
Cu-Ge0
Cu-Ge0.2
Cu-Ge0.4
H v
t (min)
F=1.96 N
0 20 40 60
200
400
600
800
1000
Cu-Ge0
Cu-Ge0.2
Cu-Ge0.4
H v
t (min)
F=4.9 N
0 20 40 60
200
400
600
800
1000
Cu-Ge0
Cu-Ge0.2
Cu-Ge0.4
H v
t (min)
F=0.49 N

Indentation Creep Behavior and Microstructure of Cu-Ge Ferrites
Copyright © 2011 SciRes. MSA
1081
Figure 6. Cu-Ge ferrites morphology.
the non magnetic particles and trace amount of impurities forming a non magnetic grain boundary leads to the re-duction of grain size and increasing of porosity. Accurate measurements of the grain size were hard to obtain be-
cause of the difficulty to observe grain boundary by us-ing optical microscopy.
4. Conclusions 1) The indentation length increases with the increase of both time and applied load.
2) By increasing the germanium and copper concen-tration on the expenses of iron, room temperature creep occurs more rapidly.
3) The samples with high concentration of both copper and germanium ions have higher creep rates than that of lower concentrations.
4) The relatively high values of, creep stress exponent (3 - 14.5) imply that the operative creep mechanism in the studied samples is dislocation creep.
The porosity of the samples is increased by increasing Ge and Cu ions content.
REFERENCES [1] T. Nishikawa, Y. Okamoto, T. Nakagawa, H. Kimura and
H. Takeda, “Dislocation Climb-Controlled Creep of Po-lycrystalline Mn-Zn Ferrite,” Journal of Applied Physics, Vol. 88, 1980, p. 538.
[2] T. Nishikawa and Y. Okamoto, “Creep Deformation of Polycrystalline Mn-Zn Ferrite Proceeding of the Third International Conference in Ferrite,” Center for Academic Publications, Japan, 1981, p. 306.
[3] F. R. N. Nabarro, “Deformation of Crystals by the Motion of Single Lonsin Report of a Conference on the Strength of Solids (Bristol, U.K.),” Physical Society, London, 1948, pp. 75-90.
[4] C. Herring, “Diffusional Viscoyity of a Polycrystalline Solid,” Journal of Applied Physics, Vol. 21, No. 5, 1950, pp. 437-445.
[5] R. L. Coble, “A Model for Boundary Diffusion Con-trolled Creep in Polycrystalline Materials,” Journal of Applied Physics, Vol. 34, No. 6, 1963, pp. 1679-1682. doi:10.1063/1.1702656.
[6] J. C. Harper and J. E. Dom, “Viscous Creep of Aluminum near Its Melting Temperature,” Acta Metallurgica, Vol. 5. No. 11, November 1957, pp. 654-665. doi:10.1016/0001-6160(57)90112-8.
[7] F. H. Norton, “The Creep of Steel at High Temperature,” McGraw Hill, New York, 1929.
[8] S.-H. Song, J. Wu, X. J. Wei, D. Kumar, S. J. Liu and L. Q. Weng, “Creep Preoperty Evaluation 2.25 Cr-1Mo Low Alloy Steel,” Material Science and Engineering A, Vol. 527, No. 9, 2010, pp. 2398. doi:10.1016/j.msea.2010.01.007
[9] B. Wilshire and R. W. Evans, “Creep and Fracture of Engineering Materials and Structures,” Proceedings of Fifth International Conference, the Institute of Materials, 1993, p. 812.
[10] A. Juhasz, P. Tasnadi and I. Kovacs, “Superplastic In-
Cu-Ge(x = 0.0)
Cu-Ge(x = 0.2)
Cu-Ge(x = 0.4)
1082 Indentation Creep Behavior and Microstructure of Cu-Ge Ferrites
Copyright © 2011 SciRes. MSA
dentation Creep of Lead-Tin Eutectic,” Journal of Ma-terial Science Letters, Vol. 5, No. 1, 1986, pp. 535-536.
[11] R. Roumina, B. Raeisinia and R. Mahmudi, “Room Tem- perature Indentation Creep of Cast Pb-Sb Alloys,” Sci- ence Material, Vol. 51, 2004, p. 497. doi:10.1016/j.scriptamat.2004.05.048.
[12] M. Sternitzke and H. Hubner, “Creep Mechanisms Of Alumina/Sic Nanocomposites Ceramic Engineering and Science Proceedings,” Mrityunjay Singh & Todd Jessen, The American Ceramic Society, 2001, p. 145.
[13] A. R. Geranmayeh, R. Mahmudi, “Room-Temperature Indentation Creep of Lead Free Alloy,” Journal of Elec-tricity Material, 2005, Vol. 34, pp. 1002-1009.
[14] T. G. Langdon, “Identifying Creep Mechanisms at Low Stresses,” Material Science Engeneering, Vol. A283, 2000, pp. 266-273.
[15] B. Walser and O. D. Sherby, “Structure Dependence of Power Law Creep,” Scripta Metall, Vol. 16, No. 2, 1982, pp. 213-219. doi:10.1016/0036-9748(82)90389-1
[16] G. Sharma, R. V. Ramanujan, T. R. G. Kutty and G. P. Tiwari, “Hot Hardness and Indentation Creep Studies of a Fe-28Al-3Cr-0.2C Alloy,” Material Science Engeneering, Vol. A278, 2000, pp.106-112.
[17] C. Goetze and W. F. Brace, “Laboratory Observations of High-Temperature Rheology of Rocks,” Tectonophysics, Vol. 113, No. 1-4, 1972, pp. 583-600. doi:10.1016/0040-1951(72)90039-X
[18] D. L. Kohlstedt and C. Goetze, “Low-Stress High Tem-
perature Creep in Olivine Single Crystals,” Journal of Geophysial Research, Vol. 79, 1974, p. 2045.
[19] M. Kagiarova, W. Z. Barbara, Y. Shollock, Y. A. Boc-caccini and J. Dusza, “Microstructure and Creep Behavior of a Si3N4-SiC Micronanocomposite,” Journal of Ameri-can Ceramic Society, Vol. 92, No. 2, 2009, pp. 439-444. doi:10.1111/j.1551-2916.2008.02848.x
[20] W. D. Kingery, H. K. Bowen and D. R. Uhimann, “In-troduction to Ceramic Science,” Wiley, New York, 1975, p. 474.
[21] J. Smith, “Magnetic Properties of Materials,” McGraw Hill, New York, 1971.
[22] D. M. Hemeda and O. M. Hemeda, “Electrical, Structural, Magnetic and Transport Properties of Zn2BaFe16O27 Doped with Cu2+,” Journal Magnetism Magnetic Matte-rials, Vol. 320, No. 8, 2008, pp. 1557-1562. doi:10.1016/j.jmmm.2008.01.006
[23] D. M. Hemeda and O. M. Hemeda, “Electrical, Structural, Magnetic and Transport Properties of Zn2 BaFe16O27 Doped with Cu2+,” American Journal of Applied Sciences, Vol. 5, No. 4, 2008, pp. 289- 295. doi:10.3844/ajassp.2008.289.295
[24] J. Eckelt, C. Bottger and J. Hesse, “AC Susceptibility in the Reentrant Spin-Glass System (Fe0.65Ni0.35)1-xMn,” Journal Magnetism Magnetic Matterials, Vol. 104, No. 3, 1992, pp.1665-1667. doi:10.1016/0304-8853(92)91502-K
[25] E. G. Visser, M. T. Johnson, P. J. V. D. Zaag, “Ferrites: Production,” International Flavour-6, Japan, 1992, p. 807.