
Incremental fishing gear modifications fail to ... · Incremental fishing gear modifications fail...
12
ENDANGERED SPECIES RESEARCH Endang Species Res Vol. 26: 115–126, 2014 doi: 10.3354/esr00635 Published online December 10 INTRODUCTION Cetaceans, including large whales, frequently become entangled in commercial fishing gear, and some entanglements result in injuries that may lead to the whale’s death (Moore et al. 2005). In the USA, all entanglements, regardless of their lethality, con- stitute ‘a take’ or form of harassment that the Marine Mammal Protection Act (MMPA) and the Endan- gered Species Act (ESA) are intended to restrict. When human-caused mortality exceeds a prescribed threshold value, the MMPA compels the US govern- ment, in this case the National Marine Fisheries Service (NMFS; US Department of Commerce), to convene a take reduction team to develop rules to reduce human-caused mortality related to commer- cial fishing within the exclusive economic zone (EEZ) of the USA. In developing take reduction plans, NMFS convenes meetings of stakeholders, primarily state government representatives, fishing industry participants, conservation advocates, and academic scientists, in an attempt to negotiate practical mitiga- tion measures through consensus agreements. Regu- lations may target both lethal and non-lethal takes, and it is important that NMFS can demonstrate that a reduction in entanglements results from these rules. The set of rules described in the Atlantic Large Whale Take Reduction Plan (ALWTRP) (National Marine Fisheries Service 2007) attempts to reduce entanglement mortality of North Atlantic right Outside the USA © The US Government 2014. Open Access under Creative Commons by Attribution Licence. Use, distribution and reproduction are unrestricted. Authors and original publication must be credited. Publisher: Inter-Research · www.int-res.com *Corresponding author: [email protected] Incremental fishing gear modifications fail to significantly reduce large whale serious injury rates Richard M. Pace III*, Timothy V. N. Cole, Allison G. Henry Northeast Fisheries Science Center, National Marine Fisheries Service, 166 Water Street, Woods Hole, MA 02543, USA ABSTRACT: A major and immediate goal of the US Marine Mammal Protection Act is the reduc- tion of marine mammal mortality incidental with commercial fishing operations. Under articles of the Act, the Atlantic Large Whale Take Reduction Plan (ALWTRP) was developed and imple- mented to reduce entanglement mortality of North Atlantic right whales Eubalaena glacialis, Gulf of Maine humpback whales Megaptera novaeangliae, and western North Atlantic fin whales Bal- aenoptera physalus by requiring modifications to commercial fishing gear (i.e. pots and sink gill- nets). Although they undercount the number of entanglements, counts of detected incidents of entanglements and entanglement-related mortality are the primary index to entanglement mor- tality. We analyzed the annual counts of large whale entanglements including serious injuries and mortalities attributed to entanglements to evaluate the effectiveness of the ALWTRP from 1999 to 2009. The annual number of mortality events (including serious injuries) related to fishing gear entanglements averaged 2.5 for right whales, 6.5 for humpbacks, 0.6 for fin whales, and 2.4 for minke whales B. acutorostrata. Annual entanglement rates increased during the study period, but evidence for increased rates of entanglement-related mortality was equivocal. No significant changes occurred in waiting time (the number of days between entanglement events) in response to any management measures implemented to reduce large whale mortalities between 1998 and 2009, implying that these measures were generally ineffective in abating whale deaths from entanglements in fishing gear. KEY WORDS: By-catch · Human-caused mortality · Large whales · Efficacy tests OPEN PEN ACCESS CCESS
Transcript of Incremental fishing gear modifications fail to ... · Incremental fishing gear modifications fail...
ENDANGERED SPECIES RESEARCHEndang Species Res
Vol. 26: 115–126, 2014doi: 10.3354/esr00635
Published online December 10
INTRODUCTION
Cetaceans, including large whales, frequentlybecome entangled in commercial fishing gear, andsome entanglements result in injuries that may leadto the whale’s death (Moore et al. 2005). In the USA,all entanglements, regardless of their lethality, con-stitute ‘a take’ or form of harassment that the MarineMammal Protection Act (MMPA) and the Endan-gered Species Act (ESA) are intended to restrict.When human-caused mortality exceeds a prescribedthreshold value, the MMPA compels the US govern-ment, in this case the National Marine FisheriesService (NMFS; US Department of Commerce), toconvene a take reduction team to develop rules to
reduce human-caused mortality related to commer-cial fishing within the exclusive economic zone (EEZ)of the USA. In developing take reduction plans,NMFS convenes meetings of stakeholders, primarilystate government representatives, fishing industryparticipants, conservation advocates, and academicscientists, in an attempt to negotiate practical mitiga-tion measures through consensus agreements. Regu-lations may target both lethal and non-lethal takes,and it is important that NMFS can demonstrate that areduction in entanglements results from these rules.The set of rules described in the Atlantic LargeWhale Take Reduction Plan (ALWTRP) (NationalMarine Fisheries Service 2007) attempts to reduceentanglement mortality of North Atlantic right
Outside the USA © The US Government 2014. Open Access underCreative Commons by Attribution Licence. Use, distribution andreproduction are un restricted. Authors and original publicationmust be credited. Publisher: Inter-Research · www.int-res.com
*Corresponding author: [email protected]
Incremental fishing gear modifications fail to significantly reduce large whale serious injury rates
Richard M. Pace III*, Timothy V. N. Cole, Allison G. Henry
Northeast Fisheries Science Center, National Marine Fisheries Service, 166 Water Street, Woods Hole, MA 02543, USA
ABSTRACT: A major and immediate goal of the US Marine Mammal Protection Act is the reduc-tion of marine mammal mortality incidental with commercial fishing operations. Under articles ofthe Act, the Atlantic Large Whale Take Reduction Plan (ALWTRP) was developed and imple-mented to reduce entanglement mortality of North Atlantic right whales Eubalaena glacialis, Gulfof Maine humpback whales Megaptera novaeangliae, and western North Atlantic fin whales Bal-aenoptera physalus by requiring modifications to commercial fishing gear (i.e. pots and sink gill-nets). Although they undercount the number of entanglements, counts of detected incidents ofentanglements and entanglement-related mortality are the primary index to entanglement mor-tality. We analyzed the annual counts of large whale entanglements including serious injuries andmortalities attributed to entanglements to evaluate the effectiveness of the ALWTRP from 1999 to2009. The annual number of mortality events (including serious injuries) related to fishing gearentanglements averaged 2.5 for right whales, 6.5 for humpbacks, 0.6 for fin whales, and 2.4 forminke whales B. acutorostrata. Annual entanglement rates increased during the study period, butevidence for increased rates of entanglement-related mortality was equivocal. No significantchanges occurred in waiting time (the number of days between entanglement events) in responseto any management measures implemented to reduce large whale mortalities between 1998 and2009, implying that these measures were generally ineffective in abating whale deaths fromentanglements in fishing gear.
KEY WORDS: By-catch · Human-caused mortality · Large whales · Efficacy tests
OPENPEN ACCESSCCESS
Endang Species Res 26: 115–126, 2014
whales Eubalaena glacialis, Gulf of Maine hump-back whales Megaptera novaeangliae, and westernNorth Atlantic fin whales Balaenoptera physalus bystipulating fishing restrictions and re quirements formodifications to commercial pot fishing gear and sink-ing gillnets in the temperate western North Atlantic.
Ideally, the best indicator of the biological effec-tiveness of ALWTRP rules would be to comparemeasures of the incidence of entanglement or mortal-ity rate due to entanglement both before and afterregulations are in place. If we could estimate thecause-specific mortality due to entanglement at dif-ferent times, we could gauge the effectiveness of reg-ulations and measure the influence of entanglementon demographic patterns. However, the logistics ofstudying wild cetaceans renders estimates of cause-specific mortality unlikely in the near future. Mostwhales die far from shore, and few carcasses are dis-covered for which the cause of mortality can be rea-sonably assured. Finally, detectability rates may varysignificantly among causes of mortality so thatobserved proportions of detected causes may be un -reliable estimates (Williams et al. 2011). This detec-tion issue influences any measure of incidence rates,such that records of entanglement or mortality due toentanglement likely represent a small subset ofactual entanglements. Using counts of incidents tojudge effectiveness requires an assumption that thefraction of detected entanglements is not greatlyinfluenced by the rate of occurrence and has a con-stant expectation throughout the time series beingexamined. Because unbiased estimates of annualnumbers of entanglements, mortality due to entan-glement, or even population sizes are not available,the basic data of raw counts of detected entangle-ments and deaths are the only direct measure of fish-eries interactions with large whales.
We evaluated the ALWTRP’s (National MarineFisheries Service 2007) effectiveness in meeting thestated management goals directed at stocks of sev-eral baleen whales that spend significant time in USwaters off the northeastern US coast. These rulesattempt to reduce entanglement mortality of NorthAtlantic right whales, Gulf of Maine humpbackwhales, and western North Atlantic fin whales byregulating both commercial pot and sink gillnet fish-eries. We note that with the exception of rightwhales, we are referencing stocks which are subpop-ulations recognized in US regulations as spendingsignificant time in US waters. We were particularlyinterested in entanglement data prior to the enact-ment of a relatively contentious regulation referred toas the ‘ground line rule’, which requires fishers to use
sinking lines in their gear configurations (Na tionalMarine Fisheries Service 2008). We believed that ifthe ALWTRP rules were effective, there would be areduction in entanglement-related deaths and con-comitantly in the detection of such deaths for thesewhale stocks, as well as for the Canadian east coastminke whale (Balaenoptera acutorostrata) stock,which is common in the same US waters. Specifically,we examined entanglement event data to determinethe basic character of the event time series from 1999through 2009. We also used simulation to examinethe power of these methods, including an assessmentof the influence of population change on the discov-ery of decreased incidence rates.
METHODS
Large whale entanglements were detected oppor-tunistically by a wide range of observers, includingbiologists, commercial fishermen, commercial whalewatchers, recreational boaters, and others. Theywere reported to the NMFS primarily through theAtlantic Large Whale Disentanglement Network andformal marine mammal stranding networks along theeast coast of the USA and Canada. Those reportswere evaluated by the Northeast Fisheries ScienceCenter as part of a federal process to quantify seriousinjuries and mortalities (e.g. Henry et al. 2011). Here,those data were used to examine temporal patternsin reported entanglements of right, humpback, fin,and minke whales from 1 January 1999 through31 December 2009. We removed all entanglementswith strong evidence that they occurred outside theUS EEZ (first seen entangled east of Halifax, NovaScotia, or entangled in Canadian gear) and thoseentangled in gear from fisheries not regulated by theALWTRP (principally fish weirs). We evaluated 2 datasets: all entanglements, and the subset of entangle-ments judged to result in mortality or serious injury.Hereafter, the term mortality will refer to any knowndead animals or those judged to have received seri-ous injuries caused by fishery inter actions that,according to NMFS guidelines, would likely result indeath.
We examined these data in 2 different forms: theannual counts and the waiting times betweendetected events. Counts per unit time and waitingtimes are 2 measures associated with the sameprocess, and either type of data may be used to eval-uate rates of events through time. Annual counts ofentanglement and mortality events for each speciesshould resemble a Poisson process, each with its own
116
Pace et al.: NW Atlantic whale entanglements 117
inherent rate, and can be summarized with general-ized linear models for Poisson data. Waiting times,which we defined as the numbers of days elapsedbetween the discovery dates of 2 subsequent events,are a continuous analog to the count data and mayoffer advantages when analyzing relatively rareevents. In particular, they have a cumulative distribu-tion along a time axis that may inform our examina-tions. Based on a simulation experiment, Pace (2011)concluded that waiting times were more sensitivethan counts per unit time for detecting modestchanges (e.g. 50% reduction) when annual detec-tions averaged fewer than 10. Because rates of entan-glement detections are low, we focused our analysison waiting times.
Statistical analysis
We conducted pair-wise comparisons of annualrates of entanglements between stocks, and calcu-lated generalized linear models of annual counts and‘waiting times’ to judge competing hypotheses aboutchanges in entanglement rates through time. Foreach of the 4 stocks, we first examined the waitingtime data relative to fits of models of exponentialwaiting times assuming a constant mean annual rateof entanglement. We estimated the mean exponen-tial waiting time over the entire period and plottedthe empirical cumulative distribution against a theo-retical one with the estimated mean as its soleparameter. Second, we examined pair-wise plots ofcounts of entanglements between stocks to look forcommon patterns and evaluated Poisson regressionsfor pairs that appeared correlated. We combined allevent data in the same model allowing ‘species’ as apossible predictor, and we fit a series of generalizedlinear models (McCullagh & Nelder 1989) to countsand their associated waiting times between events.Competing models were, in ascending order of com-plexity with regard to time:
(1) a single constant rate (null model);(2) species-specific intercepts and a constant rate
through time;(3) species-specific intercepts plus 2 different rates
representing the time frames of the initial ALWTRPand the subsequent expanded gear modifications be -ginning in 2002 (a breakdown of regulation changesover time appears in the supplemental material invan der Hoop et al. 2013);
(4) species-specific intercepts and a linearly (in thelink) changing rate through time;
(5) species-specific intercepts plus a quadratic mo -
del of continuous time to accommodate possible mul-tiple reductions in entanglements or entanglement-related mortalities over time;
(6) species-specific intercepts plus variable ratesamong years (i.e. 11 rates, 1 per year 1999−2009); and
(7) species-specific rates (i.e. species by continuoustime interaction).
To count data, we fit analogous logistic regressionmodels to examine evidence for changes in the pro-portions of mortalities observed per detected entan-glement. All models were developed using the gen-eralized linear model (‘glm’) procedure in R (ver. 2.14)(R Development Core Team 2011). Model compar-isons were based on corrected Akaike’s informationcriterion (AICc) and associated weight of evidencecalculations for likelihood models (Anderson 2008).When there was no clear best model, we used model-averaged predictions calculated using the R package‘AICcmodavg’ (ver. 1.24) to summarize relationships.
Evaluations of similar data suggested that a rela-tively powerful approach for detecting changes maybe to develop regressions of event times againstorder of occurrence (cumulative waiting time for anevent versus its occurrence), and to compare modelswith and without change points (Pace 2011). Theapproach is attractive in that one can visualize andtest for divergence (change point) occurring when aspecific conservation measure is enacted or becomeseffective. However, arranging the data thusly likelyimputes an auto-correlated error structure whichbears consideration, and because the predictor isnow order of occurrence, the method is most suitablefor one species at a time or pooled events. TheALWTRP rules have been amended in ways that pre-sumably would have increased protection to whalesduring the study period, so we fit generalized leastsquares models (Pinheiro & Bates 2000) to eventtimes allowing for auto-correlated errors to examinethe evidence for a change in the rate of entanglementand entanglement mortality detections in the period1999 to 2009. Specifically, competing models were(Fig. 1):
(8) a single slope (a constant rate, not shown inFig. 1);
(9) a fixed change point having 2 slopes coincidingwith initial ALWTRP and expanded gear modifica-tions in 2002;
(10) a fixed change point having 2 slopes on eitherside of the implementation date for another set ofexpanded gear modifications (starting with an entan-glement prior to 5 October 2008); and
(11) a linear model with a quadratic term to test forcurvilinear change over the study period.
Endang Species Res 26: 115–126, 2014
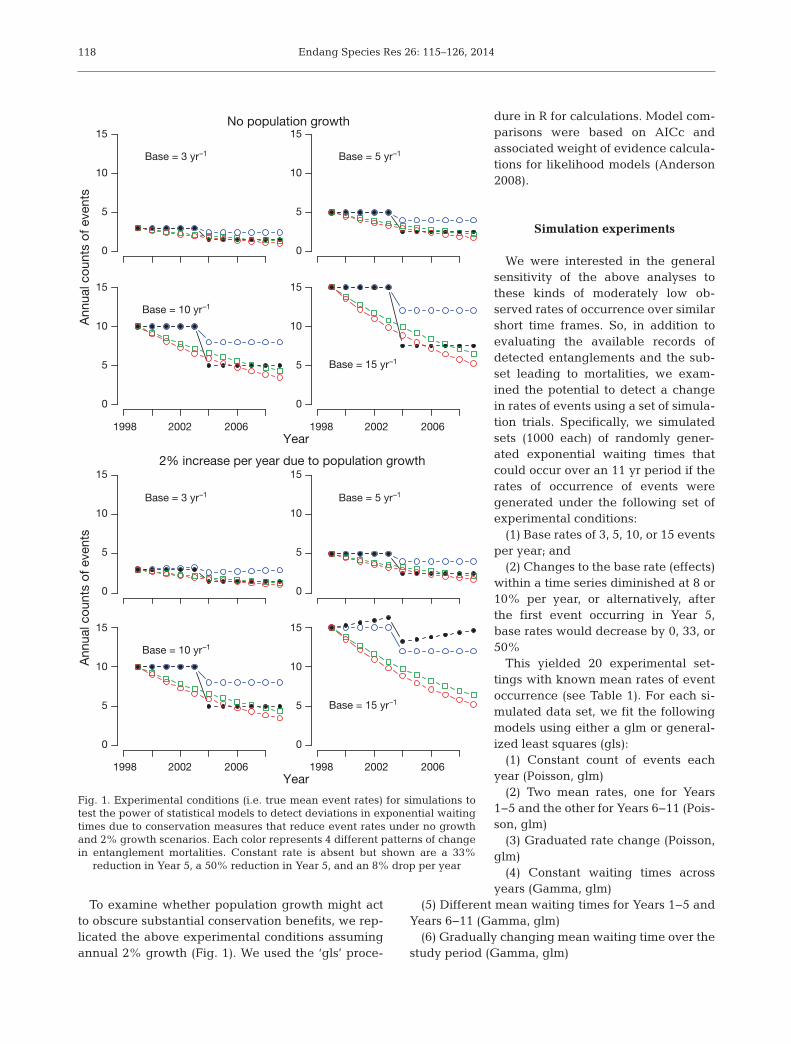
To examine whether population growth might actto obscure substantial conservation benefits, we rep -licated the above experimental conditions assumingannual 2% growth (Fig. 1). We used the ‘gls’ proce-
dure in R for calculations. Model com-parisons were based on AICc andassociated weight of evidence calcula-tions for likelihood models (Anderson2008).
Simulation experiments
We were interested in the generalsensitivity of the above analyses tothese kinds of moderately low ob -served rates of occurrence over similarshort time frames. So, in addition toevaluating the available records ofdetected entanglements and the sub-set leading to mortalities, we exam-ined the potential to detect a changein rates of events using a set of simula-tion trials. Specifically, we simulatedsets (1000 each) of randomly gener-ated exponential waiting times thatcould occur over an 11 yr period if therates of occurrence of events weregenerated under the following set ofexperimental conditions:
(1) Base rates of 3, 5, 10, or 15 eventsper year; and
(2) Changes to the base rate (effects)within a time series diminished at 8 or10% per year, or alternatively, afterthe first event occurring in Year 5,base rates would decrease by 0, 33, or50%
This yielded 20 experimental set-tings with known mean rates of eventoccurrence (see Table 1). For each si -mu lated data set, we fit the followingmodels using either a glm or general-ized least squares (gls):
(1) Constant count of events eachyear (Poisson, glm)
(2) Two mean rates, one for Years1−5 and the other for Years 6−11 (Pois-son, glm)
(3) Graduated rate change (Poisson,glm)
(4) Constant waiting times acrossyears (Gamma, glm)
(5) Different mean waiting times for Years 1−5 andYears 6−11 (Gamma, glm)
(6) Gradually changing mean waiting time over thestudy period (Gamma, glm)
118
Base = 3 yr–1 Base = 5 yr–1
Base = 10 yr–1
Base = 15 yr–1
Ann
ual c
ount
s of
eve
nts
Base = 3 yr–1 Base = 5 yr–1
1998 2002 2006 1998 2002 2006
15
10
5
0
15
10
5
0
15
10
5
0
15
10
5
0
Ann
ual c
ount
s of
eve
nts
15
10
5
0
15
10
5
0
15
10
5
0
15
10
5
0
Year
1998 2002 2006 1998 2002 2006Year
Base = 10 yr–1
Base = 15 yr–1
No population growth
2% increase per year due to population growth
Fig. 1. Experimental conditions (i.e. true mean event rates) for simulations totest the power of statistical models to detect deviations in exponential waitingtimes due to conservation measures that reduce event rates under no growthand 2% growth scenarios. Each color represents 4 different patterns of changein entanglement mortalities. Constant rate is absent but shown are a 33%
reduction in Year 5, a 50% reduction in Year 5, and an 8% drop per year
Pace et al.: NW Atlantic whale entanglements
(7) Event time series with a constant slope (gls,auto-correlated errors)
(8) Segmented regression allowing the slope of theevent time series to change at the start of Year 6 (gls,auto-correlated errors)
(9) Linear regression including a quadratic term toallow for continuous change over the event timeseries (gls, auto-correlated errors).
For each trial, we used deviance tests to make thefollowing model comparisons: 2 vs. 1, 3 vs. 1, 5 vs. 4,6 vs. 4, 8 vs. 7, and 9 vs. 7. The percent rejections(alpha = 0.05) were taken as Type I errors under nochange, or as measure of power to detect a truechange for the 20 combinations of 4 base levels and 5effects.
RESULTS
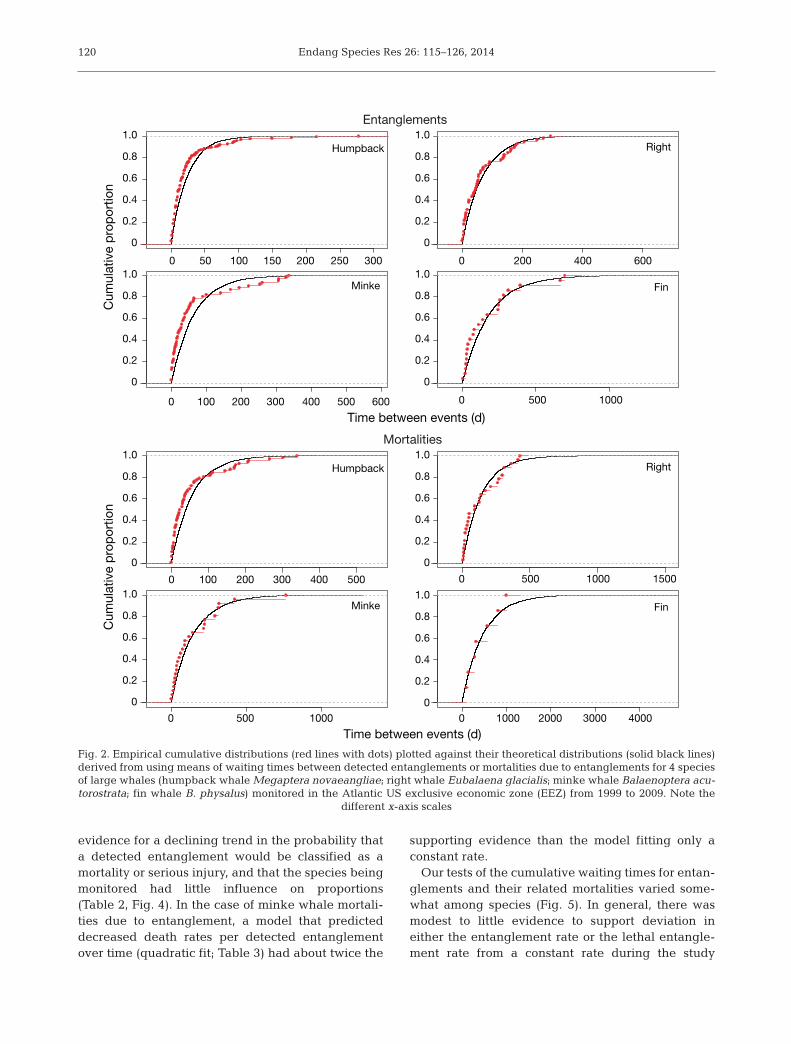
Whale events evaluated by theNortheast Fisheries Science Centerfor the 11 yr period prior to enactmentof the ground-line rule (1999− 2009)included 167, 59, 62, and 22 records ofentanglements of humpback, right,minke, and fin whales, respectively,of which 72, 28, 26, and 7 were classi-fied as serious injuries or mortalities.Comparisons of counts of entangle-ments and mortalities be tween speciesshowed little agreement, except thatannual right whale entanglementswere correlated with those of hump-back whales (Poisson regression withlog link: slope = 0.082 ± 0.30 SE [Pr >|Z | = 0.0058] probability of a greaterabsolute Z-statistic). Empirical distri-butions of species-specific waitingtimes had the same general appear-ance of exponential random variablesgenerated by theoretical distributionsderived using the calculated meansas the theoretical mean. Close inspec-tion of these comparisons gave theimpression of a slight lack-of-fit dueto excessive clus tering of shorterwaiting times (Fig. 2), but there wasno substantive statistical evidencethat single species models of waitingtimes were different from a constantPoisson process through time.
Generalized linear models providedsubstantial evidence that counts of
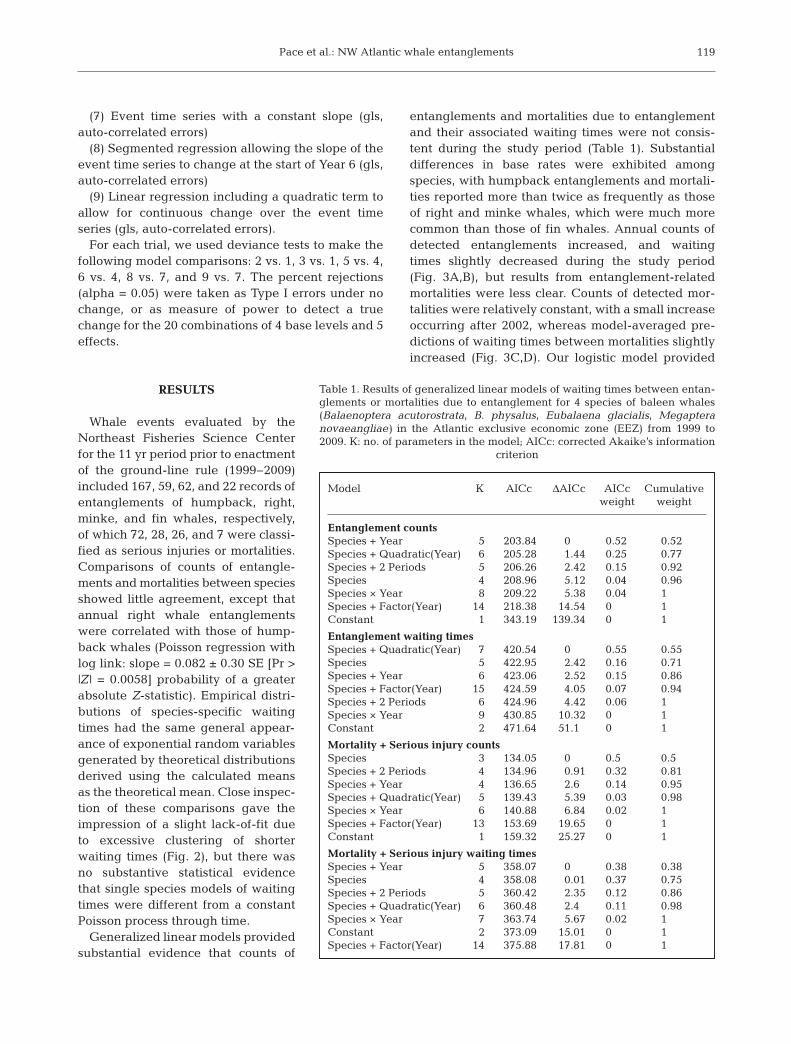
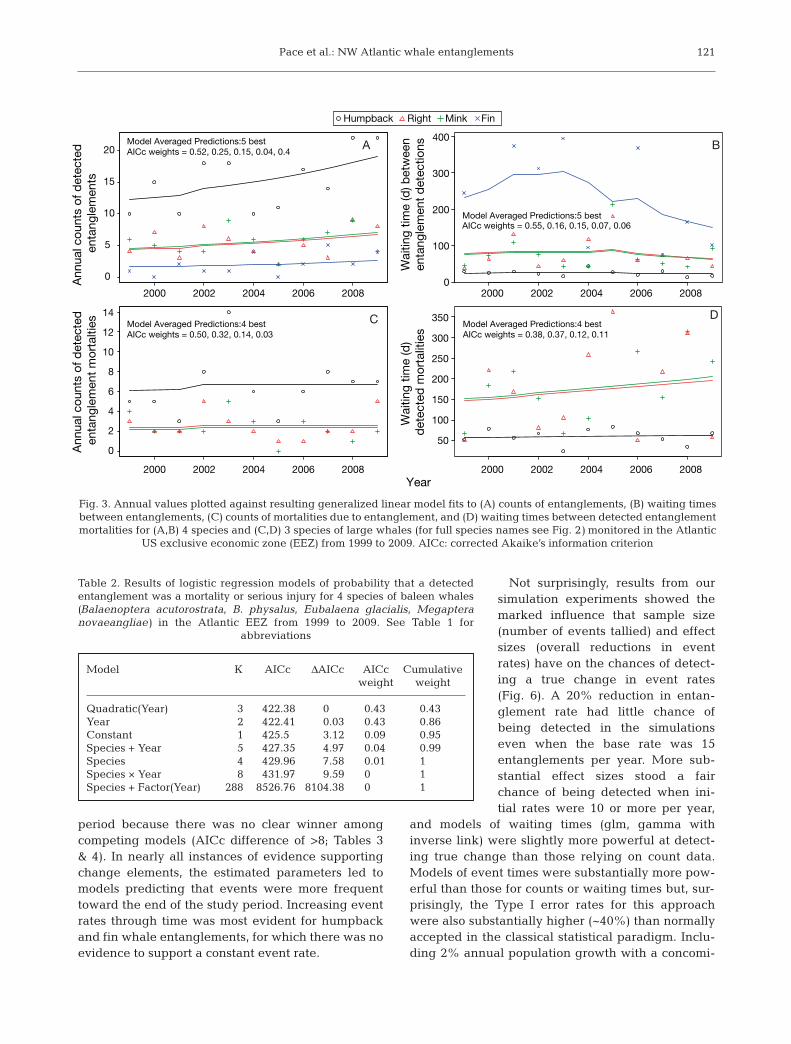
entanglements and mortalities due to entanglementand their associated waiting times were not consis-tent during the study period (Table 1). Substantialdifferences in base rates were exhibited amongspecies, with humpback entanglements and mortali-ties re por ted more than twice as frequently as thoseof right and minke whales, which were much morecommon than those of fin whales. Annual counts ofdetected entanglements increased, and waitingtimes slightly decreased during the study period(Fig. 3A,B), but results from entanglement-re la tedmortalities were less clear. Counts of detected mor-talities were re latively constant, with a small increaseoccurring after 2002, whereas model-averaged pre-dictions of waiting times between mortalities slightlyin creased (Fig. 3C,D). Our logistic model provided
119
Model K AICc ΔAICc AICc Cumulative weight weight
Entanglement countsSpecies + Year 5 203.84 0 0.52 0.52Species + Quadratic(Year) 6 205.28 1.44 0.25 0.77Species + 2 Periods 5 206.26 2.42 0.15 0.92Species 4 208.96 5.12 0.04 0.96Species × Year 8 209.22 5.38 0.04 1Species + Factor(Year) 14 218.38 14.54 0 1Constant 1 343.19 139.34 0 1
Entanglement waiting timesSpecies + Quadratic(Year) 7 420.54 0 0.55 0.55Species 5 422.95 2.42 0.16 0.71Species + Year 6 423.06 2.52 0.15 0.86Species + Factor(Year) 15 424.59 4.05 0.07 0.94Species + 2 Periods 6 424.96 4.42 0.06 1Species × Year 9 430.85 10.32 0 1Constant 2 471.64 51.1 0 1
Mortality + Serious injury countsSpecies 3 134.05 0 0.5 0.5Species + 2 Periods 4 134.96 0.91 0.32 0.81Species + Year 4 136.65 2.6 0.14 0.95Species + Quadratic(Year) 5 139.43 5.39 0.03 0.98Species × Year 6 140.88 6.84 0.02 1Species + Factor(Year) 13 153.69 19.65 0 1Constant 1 159.32 25.27 0 1
Mortality + Serious injury waiting timesSpecies + Year 5 358.07 0 0.38 0.38Species 4 358.08 0.01 0.37 0.75Species + 2 Periods 5 360.42 2.35 0.12 0.86Species + Quadratic(Year) 6 360.48 2.4 0.11 0.98Species × Year 7 363.74 5.67 0.02 1Constant 2 373.09 15.01 0 1Species + Factor(Year) 14 375.88 17.81 0 1
Table 1. Results of generalized linear models of waiting times between entan-glements or mortalities due to entanglement for 4 species of baleen whales(Balaenoptera acutorostrata, B. physalus, Eubalaena glacialis, Megapteranovaeangliae) in the Atlantic exclusive economic zone (EEZ) from 1999 to2009. K: no. of parameters in the model; AICc: corrected Akaike’s information
criterion
Endang Species Res 26: 115–126, 2014
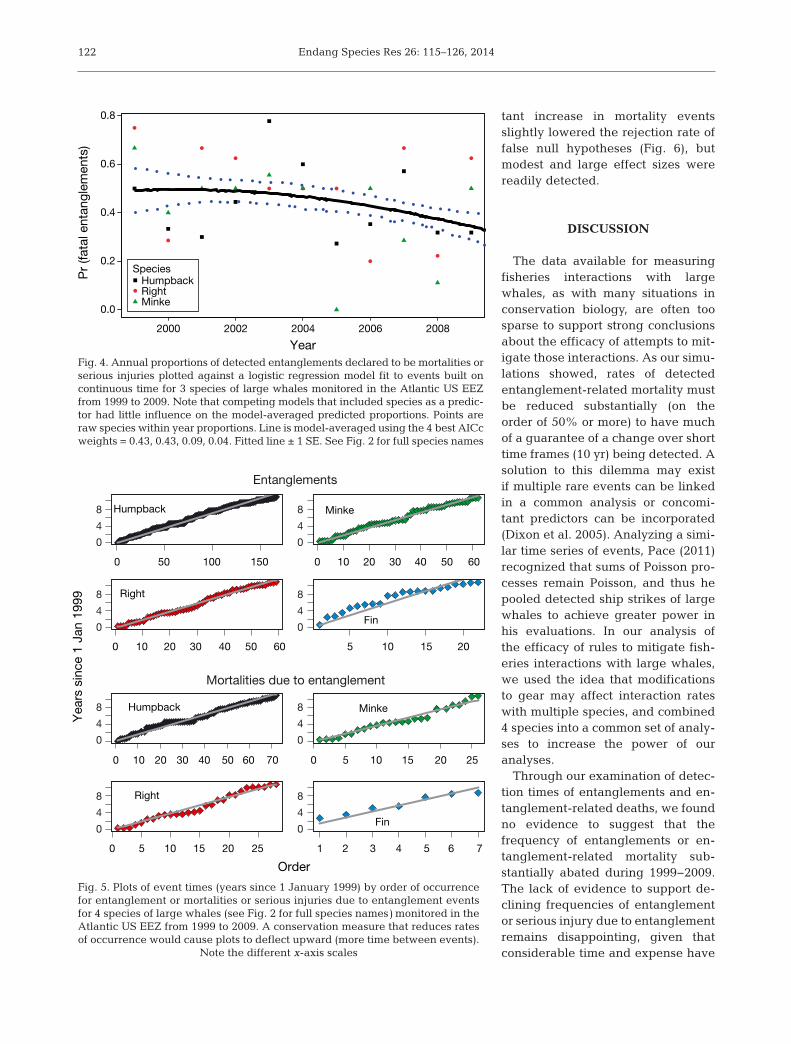
evidence for a declining trend in the probability thata detected entanglement would be classified as a mortality or serious injury, and that the species beingmonitored had little influence on proportions(Table 2, Fig. 4). In the case of minke whale mortali-ties due to entanglement, a model that predicteddecreased death rates per detected entanglementover time (quadratic fit; Table 3) had about twice the
supporting evidence than the model fitting only aconstant rate.
Our tests of the cumulative waiting times for entan-glements and their related mortalities varied some-what among species (Fig. 5). In general, there wasmodest to little evidence to support deviation ineither the entanglement rate or the lethal entangle-ment rate from a constant rate during the study
120
0 50 100 150 200 250 300
1.0
0.8
0.6
0.4
0.2
0
1.0
0.8
0.6
0.4
0.2
0
1.0
0.8
0.6
0.4
0.2
0
1.0
0.8
0.6
0.4
0.2
0
Humpback
Time between events (d)
Time between events (d)
0 200 400 600
Right
0 100 200 300 400 500 600
Minke
Cum
ulat
ive
pro
por
tion
1.0
0.8
0.6
0.4
0.2
0
1.0
0.8
0.6
0.4
0.2
0
1.0
0.8
0.6
0.4
0.2
0
1.0
0.8
0.6
0.4
0.2
0
Cum
ulat
ive
pro
por
tion
0 500 1000
Fin
Humpback Right
Minke Fin
0 100 200 300 400 500 0 500 1000 1500
0 500 1000 0 1000 2000 3000 4000
Mortalities
Entanglements
Fig. 2. Empirical cumulative distributions (red lines with dots) plotted against their theoretical distributions (solid black lines)derived from using means of waiting times between detected entanglements or mortalities due to entanglements for 4 speciesof large whales (humpback whale Megaptera novaeangliae; right whale Eubalaena glacialis; minke whale Balaenoptera acu-torostrata; fin whale B. physalus) monitored in the Atlantic US exclusive economic zone (EEZ) from 1999 to 2009. Note the
different x-axis scales
Pace et al.: NW Atlantic whale entanglements
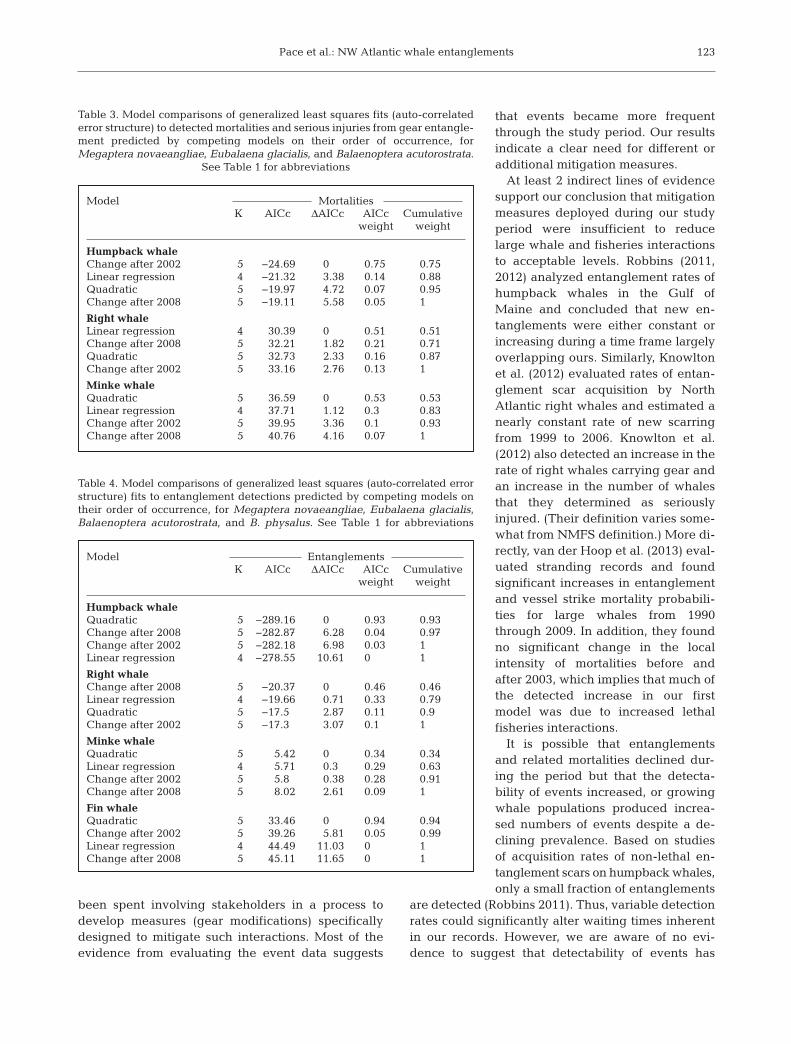
period because there was no clear winner amongcompeting models (AICc difference of >8; Tables 3& 4). In nearly all instances of evidence supportingchange elements, the estimated parameters led tomodels predicting that events were more frequenttoward the end of the study period. Increasing eventrates through time was most evident for humpbackand fin whale entanglements, for which there was noevidence to support a constant event rate.
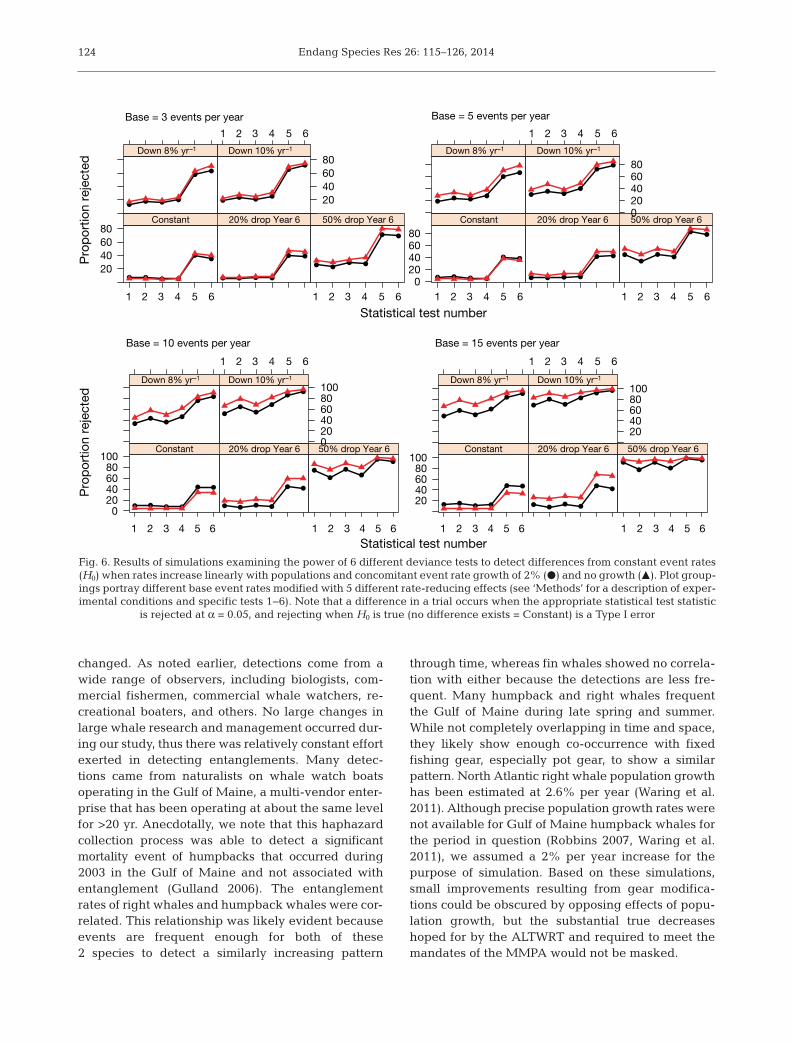
Not surprisingly, results from oursimulation experiments showed themarked influence that sample size(number of events tallied) and effectsizes (overall reductions in eventrates) have on the chances of detect-ing a true change in event rates(Fig. 6). A 20% reduction in entan-glement rate had little chance ofbeing detected in the simulationseven when the base rate was 15entanglements per year. More sub-stantial effect sizes stood a fairchance of being detected when ini-tial rates were 10 or more per year,
and models of waiting times (glm, gamma withinverse link) were slightly more powerful at detect-ing true change than those relying on count data.Models of event times were substantially more pow-erful than those for counts or waiting times but, sur-prisingly, the Type I error rates for this approachwere also substantially higher (~40%) than normallyaccepted in the classical statistical paradigm. In clu -ding 2% annual population growth with a concomi-
121
Model K AICc ΔAICc AICc Cumulative weight weight
Quadratic(Year) 3 422.38 0 0.43 0.43Year 2 422.41 0.03 0.43 0.86Constant 1 425.5 3.12 0.09 0.95Species + Year 5 427.35 4.97 0.04 0.99Species 4 429.96 7.58 0.01 1Species × Year 8 431.97 9.59 0 1Species + Factor(Year) 288 8526.76 8104.38 0 1
Table 2. Results of logistic regression models of probability that a detectedentanglement was a mortality or serious injury for 4 species of baleen whales(Balaenoptera acutorostrata, B. physalus, Eubalaena glacialis, Me gap terano vaeangliae) in the Atlantic EEZ from 1999 to 2009. See Table 1 for
abbreviations
2000 2002 2004 2006 2008
0246
8101
214
Year
Model Averaged Predictions−4 best
AICc weights = 0.50, 0.32, 0.14, 0.03
Model Averaged Predictions:4 bestAICc weights = 0.38, 0.37, 0.12, 0.11
Model Averaged Predictions:5 bestAICc weights = 0.55, 0.16, 0.15, 0.07, 0.06
2000 2002 2004 2006 2008 2000 2002 2004 2006 2008
0
5
10
15
20
Ann
ual c
ount
s of
det
ecte
d
enta
ngle
men
ts
Model Averaged Predictions:5 bestAICc weights = 0.52, 0.25, 0.15, 0.04, 0.4
14
12
10
8
6
4
2
0
350
300
250
200
150
100
50
400
300
200
100
0
Year
Ann
ual c
ount
s of
det
ecte
d
enta
ngle
men
t m
orta
lties Model Averaged Predictions:4 best
AICc weights = 0.50, 0.32, 0.14, 0.03
BA
C D
2000 2002 2004 2006 2008 2000 2002 2004 2006 2008
Humpback Right Mink Fin
Wai
ting
time
(d)
det
ecte
d m
orta
litie
sW
aitin
g tim
e (d
) bet
wee
nen
tang
lem
ent
det
ectio
ns
Fig. 3. Annual values plotted against resulting generalized linear model fits to (A) counts of entanglements, (B) waiting timesbetween entanglements, (C) counts of mortalities due to entanglement, and (D) waiting times between detected entanglementmortalities for (A,B) 4 species and (C,D) 3 species of large whales (for full species names see Fig. 2) monitored in the Atlantic
US exclusive economic zone (EEZ) from 1999 to 2009. AICc: corrected Akaike’s information criterion
Endang Species Res 26: 115–126, 2014
tant increase in mortality eventsslightly lowered the rejection rate offalse null hypotheses (Fig. 6), butmodest and large effect sizes werereadily detected.
DISCUSSION
The data available for measuringfisheries interactions with largewhales, as with many situations inconservation biology, are often toosparse to support strong conclusionsabout the efficacy of attempts to mit-igate those interactions. As our simu-lations showed, rates of de tectedentanglement-related mortality mustbe reduced substantially (on theorder of 50% or more) to have muchof a guarantee of a change over shorttime frames (10 yr) being detected. Asolution to this dilemma may existif multiple rare events can be linkedin a common analysis or concomi-tant predictors can be incorporated(Di xon et al. 2005). Analyzing a simi-lar time series of events, Pace (2011)recognized that sums of Poisson pro -cesses remain Poisson, and thus hepooled detected ship strikes of largewhales to achieve greater power inhis evaluations. In our analysis ofthe efficacy of rules to mitigate fish-eries inter actions with large whales,we used the idea that modificationsto gear may affect in teraction rateswith multiple species, and combined4 species into a common set of analy-ses to increase the power of ouranalyses.
Through our examination of detec-tion times of entanglements and en -tanglement-related deaths, we foundno evidence to suggest that the frequency of entanglements or en -tanglement-related mortality sub-stantially abated during 1999−2009.The lack of evidence to support de -clining frequencies of entanglementor serious injury due to entanglementre mains disappointing, given thatconsiderable time and expense have
122
0 10 20 30 40 50 60 70
Yea
rs s
ince
1 J
an 1
999
Humpback
0 5 10 15 20 25
Minke
0 5 10 15 20 25
Right
1 2 3 4 5 6 7
Order
Fin
0 50 100 150
Humpback
0 10 20 30 40 50 60
Minke
0 10 20 30 40 50 60
Right
5 10 15 20
Fin
Entanglements
Mortalities due to entanglement
8
4
0
8
4
0
8
4
0
8
4
0
8
4
0
8
4
0
8
4
0
8
4
0
2000 2002 2004 2006 2008
0.0
0.2
0.4
0.6
0.8
Year
Pr
(fata
l ent
angl
emen
ts)
SpeciesHumpbackRightMinke
Fig. 4. Annual proportions of detected entanglements declared to be mortalities orserious injuries plotted against a logistic regression model fit to events built oncontinuous time for 3 species of large whales monitored in the Atlantic US EEZfrom 1999 to 2009. Note that competing models that included species as a predic-tor had little influence on the model-averaged predicted proportions. Points areraw species within year proportions. Line is model-averaged using the 4 best AICcweights = 0.43, 0.43, 0.09, 0.04. Fitted line ± 1 SE. See Fig. 2 for full species names
Fig. 5. Plots of event times (years since 1 January 1999) by order of occurrencefor entanglement or mortalities or serious injuries due to entanglement eventsfor 4 species of large whales (see Fig. 2 for full species names) monitored in theAtlantic US EEZ from 1999 to 2009. A conservation measure that reduces ratesof occurrence would cause plots to deflect upward (more time between events).
Note the different x-axis scales
been spent involving stakeholders in a process todevelop measures (gear modifications) specificallydesigned to mitigate such interactions. Most of theevidence from evaluating the event data suggests
that events be came more frequentthrough the study period. Our resultsindicate a clear need for different oradditional mitigation measures.
At least 2 indirect lines of evidencesupport our conclusion that mitigationmeasures deployed during our studyperiod were insufficient to reducelarge whale and fisheries interactionsto acceptable levels. Robbins (2011,2012) analyzed entanglement rates ofhumpback whales in the Gulf ofMaine and conclu ded that new en -tanglements were either constant orincreasing during a time frame largelyoverlapping ours. Similarly, Knowltonet al. (2012) evaluated rates of entan-glement scar acquisition by NorthAtlantic right whales and estimated anearly constant rate of new scarringfrom 1999 to 2006. Knowlton et al.(2012) also detected an increase in therate of right whales carrying gear andan increase in the number of whalesthat they determined as seriouslyinjured. (Their definition varies some-what from NMFS definition.) More di -rectly, van der Hoop et al. (2013) eval-uated stranding records and foundsignificant increases in entanglementand vessel strike mortality probabili-ties for large whales from 1990through 2009. In addition, they foundno significant change in the localintensity of mortalities be fore andafter 2003, which implies that much ofthe detected increase in our firstmodel was due to increased lethalfisheries interactions.
It is possible that entanglementsand related mortalities declined dur-ing the period but that the detecta -bility of events increased, or growingwhale populations produced in crea -sed numbers of events despite a de -clining prevalence. Based on studiesof acquisition rates of non-lethal en -tanglement scars on humpback whales,only a small fraction of en tanglements
are detected (Robbins 2011). Thus, variable detectionrates could significantly alter waiting times inherentin our records. However, we are aware of no evi-dence to suggest that detectability of events has
Pace et al.: NW Atlantic whale entanglements 123
Model MortalitiesK AICc ΔAICc AICc Cumulative
weight weight
Humpback whaleChange after 2002 5 −24.69 0 0.75 0.75Linear regression 4 −21.32 3.38 0.14 0.88Quadratic 5 −19.97 4.72 0.07 0.95Change after 2008 5 −19.11 5.58 0.05 1
Right whaleLinear regression 4 30.39 0 0.51 0.51Change after 2008 5 32.21 1.82 0.21 0.71Quadratic 5 32.73 2.33 0.16 0.87Change after 2002 5 33.16 2.76 0.13 1
Minke whaleQuadratic 5 36.59 0 0.53 0.53Linear regression 4 37.71 1.12 0.3 0.83Change after 2002 5 39.95 3.36 0.1 0.93Change after 2008 5 40.76 4.16 0.07 1
Table 3. Model comparisons of generalized least squares fits (auto-correlatederror structure) to detected mortalities and serious injuries from gear entangle-ment predicted by competing models on their order of occurrence, forMegaptera novaeangliae, Eubalaena glacialis, and Balaenoptera acutorostrata.
See Table 1 for abbreviations
Model EntanglementsK AICc ΔAICc AICc Cumulative
weight weight
Humpback whaleQuadratic 5 −289.16 0 0.93 0.93Change after 2008 5 −282.87 6.28 0.04 0.97Change after 2002 5 −282.18 6.98 0.03 1Linear regression 4 −278.55 10.61 0 1
Right whaleChange after 2008 5 −20.37 0 0.46 0.46Linear regression 4 −19.66 0.71 0.33 0.79Quadratic 5 −17.5 2.87 0.11 0.9Change after 2002 5 −17.3 3.07 0.1 1
Minke whaleQuadratic 5 5.42 0 0.34 0.34Linear regression 4 5.71 0.3 0.29 0.63Change after 2002 5 5.8 0.38 0.28 0.91Change after 2008 5 8.02 2.61 0.09 1
Fin whaleQuadratic 5 33.46 0 0.94 0.94Change after 2002 5 39.26 5.81 0.05 0.99Linear regression 4 44.49 11.03 0 1Change after 2008 5 45.11 11.65 0 1
Table 4. Model comparisons of generalized least squares (auto-correlated errorstructure) fits to entanglement detections predicted by competing models ontheir order of occurrence, for Megaptera novaeangliae, Eubalaena glacialis,Balaenoptera acutorostrata, and B. physalus. See Table 1 for abbreviations
Endang Species Res 26: 115–126, 2014
changed. As noted earlier, detections come from awide range of observers, including biologists, com-mercial fishermen, commercial whale watchers, re -creational boaters, and others. No large changes inlarge whale re search and management occurred dur-ing our study, thus there was relatively constant effortexerted in de tecting entanglements. Many detec-tions came from naturalists on whale watch boatsoperating in the Gulf of Maine, a multi-vendor enter-prise that has been operating at about the same levelfor >20 yr. Anecdotally, we note that this haphazardcollection process was able to detect a significantmortality event of humpbacks that occurred during2003 in the Gulf of Maine and not associated withentanglement (Gulland 2006). The entanglementrates of right whales and humpback whales were cor-related. This relationship was likely evident becauseevents are frequent enough for both of these2 species to detect a similarly in creasing pattern
through time, whereas fin whales showed no correla-tion with either because the detections are less fre-quent. Many humpback and right whales frequentthe Gulf of Maine during late spring and summer.While not completely overlapping in time and space,they likely show enough co-occurrence with fixedfishing gear, especially pot gear, to show a similarpattern. North Atlantic right whale population growthhas been estimated at 2.6% per year (Waring et al.2011). Although precise population growth rates werenot available for Gulf of Maine humpback whales forthe period in question (Robbins 2007, Waring et al.2011), we assumed a 2% per year increase for thepurpose of simulation. Based on these simulations,small improvements resulting from gear modifica-tions could be obscured by opposing effects of popu-lation growth, but the substantial true de creaseshoped for by the ALTWRT and required to meet themandates of the MMPA would not be masked.
124
Base = 3 events per year
Pro
por
tion
reje
cted
Pro
por
tion
reje
cted
20406080
Constant 20% drop Year 6 50% drop Year 6
Down 8% yr–1
1 2 3 4 5 6 1 2 3 4 5 6
1 2 3 4 5 6 1 2 3 4 5 6 1 2 3 4 5 6 1 2 3 4 5 6
20406080
Down 10% yr–1
Base = 5 events per year
Statistical test number
1 2 3 4 5 6 1 2 3 4 5 6
1 2 3 4 5 6 1 2 3 4 5 6 1 2 3 4 5 6 1 2 3 4 5 6
Statistical test number
020406080
Constant 20% drop Year 6 50% drop Year 6
Down 8% yr–1
020406080
Down 10% yr–1
Base = 10 events per year
020406080
100Constant 20% drop Year 6 50% drop Year 6
Down 8% yr–1
020406080100
Down 10% yr–1
Base = 15 events per year
20406080
100Constant 20% drop Year 6 50% drop Year 6
Down 8% yr–1
20406080100
Down 10% yr–1
Fig. 6. Results of simulations examining the power of 6 different deviance tests to detect differences from constant event rates(H0) when rates increase linearly with populations and concomitant event rate growth of 2% (d) and no growth (m). Plot group-ings portray different base event rates modified with 5 different rate-reducing effects (see ‘Methods’ for a description of exper-imental conditions and specific tests 1−6). Note that a difference in a trial occurs when the appropriate statistical test statistic
is rejected at α = 0.05, and rejecting when H0 is true (no difference exists = Constant) is a Type I error
Pace et al.: NW Atlantic whale entanglements 125
NMFS is mandated to reduce human-caused mor-tality of marine mammals to levels not compromisingstock viability. In agreement with other studies, ouranalysis causes us to strongly reject the notion thatsignificant conservation gains resulted from the first10 yr of ALWTRT negotiated incremental mitigationmeasures. The key word here is significant reduc-tions which would not likely be masked by smallamounts of population growth or shifts in whale andgear distribution. Further, our findings support deci-sions by NMFS to impose further conservation meas-ures such as the recently instituted ‘ground line rule’,and to seek other means of reducing whale–gearinteractions. However, the lack of progress duringthe first 10 yr is cause for concern. That the develop-ment of measures to reduce large whale entangle-ments has been incremental may have been pre-dicted, given the lack of fundamental knowledge ofhow entanglements occur (Johnson et al. 2007) andthe economic value of the fisheries responsible forentanglements (Myers et al. 2007). Measured ap -proaches seem warranted when knowledge is lack-ing and economic costs are potentially high. Whatseems to have received little weight in the evolutionof rules was that, in the early stages, an analysis ofright whale demographics concluded that the species,one of the most critically endangered ceta ceans inthe world, was headed for extinction if human-causedmortality was not reduced (Fujiwara & Caswell2001). We believed that, to be effective, mitigationmeasures would produce substantial direct reduc-tions in mortality (biological response). However, wemay be experiencing a common problem in conser-vation: we are attempting to evaluate a process with-out any explicitly measurable goals or trade-offs(Lonergan 2011). Although the MMPA does providean explicit goal to reduce takes below a stock’s‘potential biological removal’ (PBR) in 6 mo, that goalwas not achieved for most large whale stocks foundoff the northeast USA. PBR is typically exceededeven when using confirmed human-caused mortali-ties as a measure, which is likely a biased low ac -counting of takes. Moreover, it has not proven usefulto compare observed takes to the PBR threshold as an‘on-off’ switch approach to evaluating effectivenessof management actions, where observed takes whichare below PBR indicate effective actions, and takeswhich exceed PBR indicate ineffective measures.Observed entanglements and entanglement-relatedmortalities have frequently exceeded PBR (van derHoop et al. 2013) for more than a decade for westernNorth Atlantic baleen whales with no apparent cata-strophic consequences for these stocks (Waring et al.
2011). Without more sensitive effectiveness meas-ures, the lack of definitive positive results such asours will be a frequent result of effectiveness evalua-tions. In this paper, we have produced an evaluationof management action effectiveness despite the mea-ger data available for that evaluation.
Acknowledgements. We are especially grateful to the USand the Canadian Maritime Provinces and Newfoundlandstranding and entanglement networks, and the AtlanticLarge Whale Disentanglement Network, whose memberssearched for and examined whales both live and dead. It is adifficult, dirty, and ceaseless job that deserves special recog-nition. The United States Coast Guard was instrumental inconveying sightings reported by mariners, investigating car-casses at sea, and assisting in disentanglement efforts. Weare also grateful to the staff of the Provincetown Center forCoastal Studies (PCCS), New England Aquarium, WhaleCenter of New England (WCNE), NOAA aerial surveyteams, Wildlife Trust, the states of Florida and Georgia,Northeast Fisheries Observer Program, Marine AnimalResponse Society, New Brunswick Museum, Atlantic Veteri-nary College, Grand Manan Whale and Seabird ResearchStation, Whale Release and Stranding, and many others forproviding the sightings that have allowed this work to beconducted.
LITERATURE CITED
Anderson DR (2008) Model based inference in the life sci-ences: a primer on evidence. Springer, New York, NY
Dixon PM, Ellison AM, Gotelli NJ (2005) Improving the pre-cision of estimates of rare events. Ecology 86: 1114−1123
Fujiwara M, Caswell H (2001) Demography of the endan-gered North Atlantic right whale. Nature 414: 537−541
Gulland FMD (2006) Review of the Marine MammalUnusual Mortality Event Response Program of theNational Marine Fisheries Service. NOAA Tech MemoNMFS-OPR-33. US Dept of Commerce, Office of Pro-tected Resources, Silver Spring, MD
Henry AG, Cole TVN, Garron M, Hall L (2011) Mortality andserious injury determinations for baleen whale stocksalong the Gulf of Mexico, United States and Canadianeastern seaboards, 2005-2009. Northeast Fish Sci CentRef Doc 11-18. US Dept of Commerce, Northeast Fish-eries Science Center, Woods Hole, MA
Johnson AJ, Kraus SD, Kenny JF, Mayo CA (2007) Theentangled lives of whales and fisherman: can they coex-ist? In: Kraus SD, Rolland RM (eds) The urban whale: North Atlantic right whales at the crossroads. HarvardUniversity Press, Cambridge, MA, p 380−408
Knowlton AR, Hamilton PK, Marx MK, Pettis HM, Kraus SD(2012) Monitoring North Atlantic right whale Eubalaenaglacialis entanglement rates: a 30 yr retrospective. MarEcol Prog Ser 466: 293−302
Lonergan M (2011) Potential biological removal and othercurrently used management rules for marine mammalpopulations: a comparison. Mar Policy 35: 584−589
McCullagh P, Nelder JA (1989) Generalized linear models,2nd edn. Chapman & Hall, London
Moore MJ, Knowlton AR, Kraus SD, McLellan WA, BondeRK (2005) Morphomety, gross morphology and available
Endang Species Res 26: 115–126, 2014
histopathology in North Atlantic right whale (Eubalaenaglacialis) mortalities (1970–2002). J Cetacean Res Man-age 6: 199−214
Myers RA, Boudreau SA, Kenney RD, Moore MJ, RosenbergAA, Sherrill-Mix SA, Worm B (2007) Saving endangeredwhales at no cost. Curr Biol 17: R10−R11
National Marine Fisheries Service (2007) Taking of marinemammals incidental to commercial fishing operations;Atlantic large whale take reduction plan — final rule. FedReg 72: 57104−57194
National Marine Fisheries Service (2008) Taking of marinemammals incidental to commercial fishing operations;Atlantic large whale take reduction plan — final rule. FedReg 73: 51228−51242
Pace RM (2011) Frequency of whale and vessel collisions onthe US Eastern seaboard: ten years prior and two years postship strike rule. Northeast Fish Sci Cent Ref Doc 11-15. USDept of Commerce, National Marine Fisheries Ser vice,Woods Hole, MA. http: //nefsc.noaa.gov/publications/
Pinheiro JC, Bates DM (2000) Mixed-effects models in S andS-PLUS. Statistics and Computing Series. Springer- Verlag, New York, NY
R Development Core Team (2011) R: a language and envi-ronment for statistical computing. R Foundation for Sta-
tistical Computing, Vienna. www.R-project.orgRobbins J (2007) Structure and dynamics of the Gulf of
Maine humpback whale population. PhD thesis, Univer-sity of St. Andrews
Robbins J (2011) Scar-based inference into Gulf of Mainehumpback whale entanglement: 2009. Order no.EA133F09CN0253. Report to the National Marine Fish-eries Service, Woods Hole, MA
Robbins J (2012) Scar-based inference into Gulf of Mainehumpback whale entanglement: 2010. Order no.EA133F09CN0253. Report to the National Marine Fish-eries Service, Woods Hole, MA
van der Hoop JM, Moore MJ, Barco SG, Cole TVN and others(2013) Assessment of management to mitigate anthro-pogenic effects on large whales. Conserv Biol 27: 121−133
Waring GT, Josephson E, Maze-Foley K, Rosel PE (eds)(2011) U.S. Atlantic and Gulf of Mexico marine mammalstock assessments — 2010. NOAA Tech Memo NMFS NE219. National Marine Fisheries Service, Woods Hole,MA. www.nefsc.noaa.gov/nefsc/publications/
Williams R, Gero S, Bejder L, Calambokidis J, Kraus S (2011)Underestimating the damage: interpreting cetacean car-cass recoveries in the context of the Deepwater Hori-zon/BP incident. Conserv Lett 4: 228−233
126
Editorial responsibility: Eric Gilman, Honululu, Hawaii, USA
Submitted: July 15, 2013; Accepted: July 19, 2014Proofs received from author(s): October 17, 2014