Big Data Revolution: Increasing Transparency to Risk and Valuation
Upload
truongmienCategory
view
215download
0
Increasing Transparency of Access Qualifications for Higher Education in Europe
2
Increasing Transparency of Access Qualifications for Higher Education in Europe
2004-3279/001-001/SO2 61-NAR This research project report is published by UK NARIC. The project has been funded with support from the European Community. Reproduction is authorised provided the source is acknowledged. Please cite this publication as: UK NARIC, Increasing Transparency of Access Qualifications for Higher Education in Europe, 2004, Cheltenham, England. © 2004 UK NARIC The National Recognition Information Centre for the United Kingdom Oriel House Oriel Road Cheltenham GL50 1XP e.: [email protected] w.: www.naric.org.uk
3
Contents
1. Introduction ........................................................................................................... 4
1.1 Purpose of the project ...................................................................................... 4
1.2 Aims of the project ............................................................................................ 4
1.3 Structure of the project ..................................................................................... 4
2. Methodology ........................................................................................................... 8
3. Outcomes and Issues ........................................................................................... 18
Appendix 1: List of A-level Probabilities ................................................................... 28
Appendix 2 ............................................................................................................... 31
4
1. Introduction
1.1 Purpose of the project
The main reasons for undertaking this project are as follows:
To provide a European grade comparison service, where possible, by developing a two-tiered information system moving away from the general recommendations to more specific value comparisons;
To improve understanding of European upper secondary school systems through detailed research into grading systems of university entry qualifications.
To act as a pilot project, which may lead to further countries being included or database systems that allow greater flexibility.
1.2 Aims of the project
It has become evident over the past few years that, as university admission departments have been increasingly fine-tuning their entrance requirements, they have also been struggling to accurately analyse the performance and competence of European students. As a result of this process, it has become clear that both universities and students alike could greatly benefit from having a comprehensive resource detailing value comparisons of selected European entry qualifications. This project is therefore intended to provide these detailed value comparisons, with an aim to assist universities in making an informed opinion on admission decisions according to the various institutional requirements. The study has therefore been designed with an aim to facilitate the mobility of European students by greatly increasing the transparency of European tertiary entrance qualifications.
1.3 Structure of the project
Source data UK A Levels are distributed according to relative performance within the year group. Therefore, in order to accurately establish how grades from overseas relate to UK grades, it is necessary to obtain details of their grade distribution. By comparing these results, it is possible to make recommendations on comparable levels between UK A Levels and equivalents from overseas.
5
Formula As UK grades are alphabetical, it was necessary to accord them numerical scores – a tariff- which reflects their relative status. The tariff accords:
Grade A five points Grade B four points, etc Grade U/N not scoring any points at all.
[This information is outlined in Section 2.2] (The sample of UK grades is from the DfES website, and represents an average of all A levels taken between 2000 and 2002.) By comparing the proportional distribution of grades, it is possible to specify that, for example, three A grades at GCE Advanced level are obtained by 5% of examinees. The top 5% of a specified country achieve a mark of x and this therefore reflects a similar level of achievement and therefore university entrance entitlement in the UK.
Selection of countries
72 Countries were originally identified as offering awards specified as undergraduate entry standard by UK NARIC, and of these awards it was agreed that the primary focus of this study should be selected European countries. These were: Austria, Bosnia-Herzegovina, Bulgaria, Croatia, Czech Republic, Denmark, France, Finland, Germany, Greece, Hungary, Italy, Iceland, Ireland, Liechtenstein, Lithuania, The Netherlands, Norway, Poland, Portugal, Serbia, Slovakia, Slovenia, Spain, Sweden, Switzerland, & Romania.
This project focuses on the above-mentioned countries. It is intended that building on the Grades Conversion Formula, which has been established, necessary data will be collected for all identified countries during 2003-04. This can then be developed into NARIC points or similar.
6
1.4 Previous Research into Grade Comparison Systems Little research has previously been conducted on the equivalence of different international grading systems. Other than work conducted by individual universities for the benefit of their own admissions policy (for example, UK universities, with the aim of formulating a precise policy towards the Irish Leaving Certificate), there are two main precedents. World Education Series: The World Education Series has developed a Grade Conversion Guide for Higher Education. This set of online tables has been created to compare 120 international higher education grading systems (rather than secondary) to the US grade point average system. The underlying methodology of the WES system takes into account tradition, philosophy, rules and regulations, specifically making adjustments, for example, for when a national system tends to cluster passing grades within a narrow range at the mid to low end of the scale. In practice, however, the WES guide constitutes little more than stating overseas grades are closest to certain American grades (A, B, C, D, E or F). It rarely goes into further detail such as comparing to A+, A-, B+ etc, and does not go further to give ranges of grade point averages between which the overseas systems may vary. Its expressiveness and therefore its utility is limited. Universities are advised that the information provided is broad guidance and that the perception of grading systems varies widely. Subjective criteria are predominantly used to determine comparisons. There is little mathematical basis behind the information provided. European Credit Transfer System (ECTS): As a transnational system designed to harmonise education, the ECTS System has paid particular attention to the issue of grade conversions. It is different in approach to the WES system because outcomes are derived from a set of mathematical distributions, rather than subjective criteria. Grades from one member state have been compared to a centrally devised ECTS grade and, upon moving to another member state, the performance of the student is converted into the local system.
7
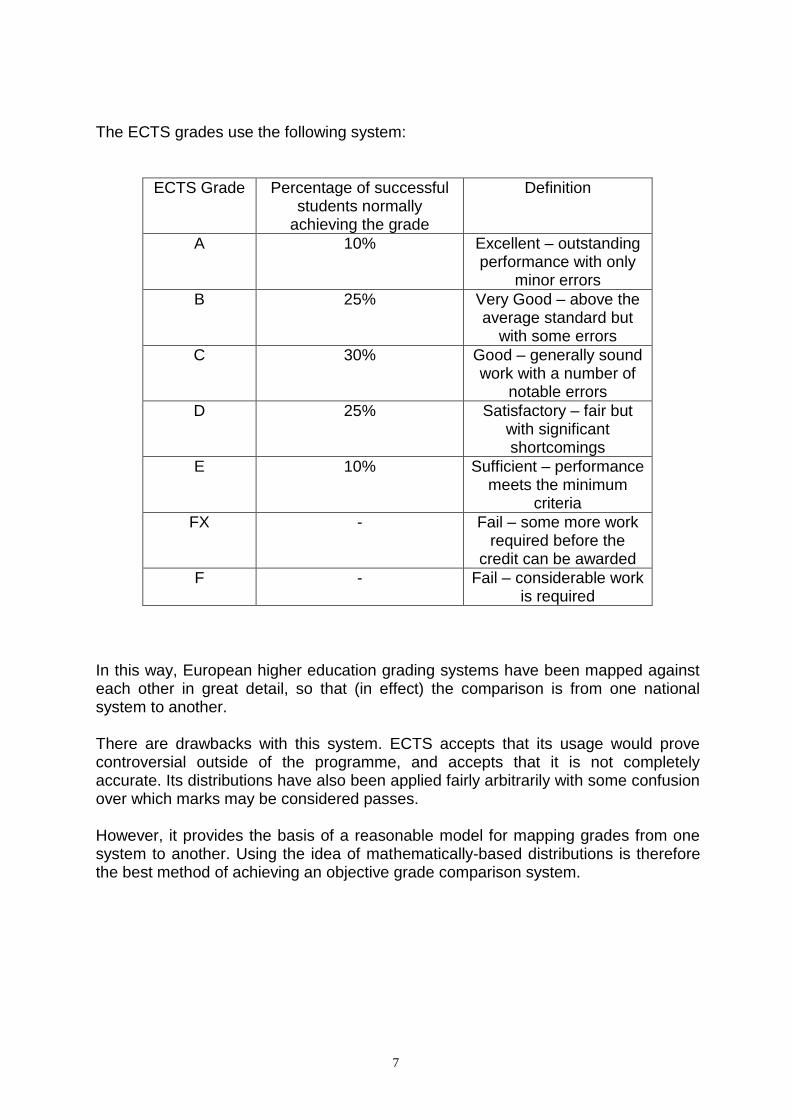
The ECTS grades use the following system:
ECTS Grade Percentage of successful students normally
achieving the grade
Definition
A 10% Excellent – outstanding performance with only
minor errors
B 25% Very Good – above the average standard but
with some errors
C 30% Good – generally sound work with a number of
notable errors
D 25% Satisfactory – fair but with significant shortcomings
E 10% Sufficient – performance meets the minimum
criteria
FX - Fail – some more work required before the
credit can be awarded
F - Fail – considerable work is required
In this way, European higher education grading systems have been mapped against each other in great detail, so that (in effect) the comparison is from one national system to another.
There are drawbacks with this system. ECTS accepts that its usage would prove controversial outside of the programme, and accepts that it is not completely accurate. Its distributions have also been applied fairly arbitrarily with some confusion over which marks may be considered passes.
However, it provides the basis of a reasonable model for mapping grades from one system to another. Using the idea of mathematically-based distributions is therefore the best method of achieving an objective grade comparison system.

8
2. Methodology
In order to provide the detailed information described above, it is essential to create a system that provides us with grade comparisons upon inputting relevant data from the education system in question. The report given below in this section summarises the process of constructing such a system, the NARIC tariff used in this project and issues pertaining to data collection.
It should be noted that this project is not designed to create a single grade comparison system for each of the overseas qualifications comparable to UK A-levels.1 It is intended to accommodate those, which are comparable to A-level standard, but making it possible in the meantime to devise the system that would be capable of handling many different qualifications.
The project is therefore structured into the following two stages:
1. Providing detailed value comparisons for selected qualifications based on
data available 2. Identifying qualifications and comparisons, which are considered to be below
A-level standard.
1 This method would not only take an extraordinary amount of time, but it would also be rather cumbersome – in
order to provide grade comparisons, it must be the case that there are constants running through all the systems – if many different systems exist, then it would be very hard to prove whether (and ensure that) we were treating each qualification fairly.
9
2.1. A-Level Data
Taking the general academic entrance requirements of UK Universities, A-levels have been used as the control data against which all European secondary school grades are compared. One single A-level is insufficient for university admission in the UK (two are the minimum entrance requirements), and there is no established maximum. Universities tend to look only at the first 3 A-level results (the three A-levels most relevant to the course being applied for). As there are several grade combinations to take into account (A – E and U for each of the three subjects), a simplified ranking system can be used.
To ensure the accuracy of the grade comparisons, it is necessary to first calculate accurately the probability of a student obtaining certain grades at A-level by gathering all the available statistical data pertaining to A-level results. The data used for the comparison originates from the Department for Education and Skills website (http://www.dfes.gov.uk/statistics/). This is the entire graded breakdown for each A-level subject taken between 2000 and 2002. The sample is large and creates a reliable distribution.2 It is worth noting that this data has been taken during a period of A-level reform in the UK. It is expected that there are some statistical anomalies throughout the data as a result of this change in structure and form of A-levels, however because of the size of the sample and also because the updating of this data can remain ongoing, we can ensure the continued accuracy of of the grade comparisons.
2 It has been noted that for a more accurate, though inevitably not entirely different distribution, we could combine
more than just the results from the period between 2000 and 2002 thus increasing the size of the sample and improving the accuracy. If official proportional figures can be uncovered indicating the same percentage of ‘A’ grades each year, then this would be ideal.
10
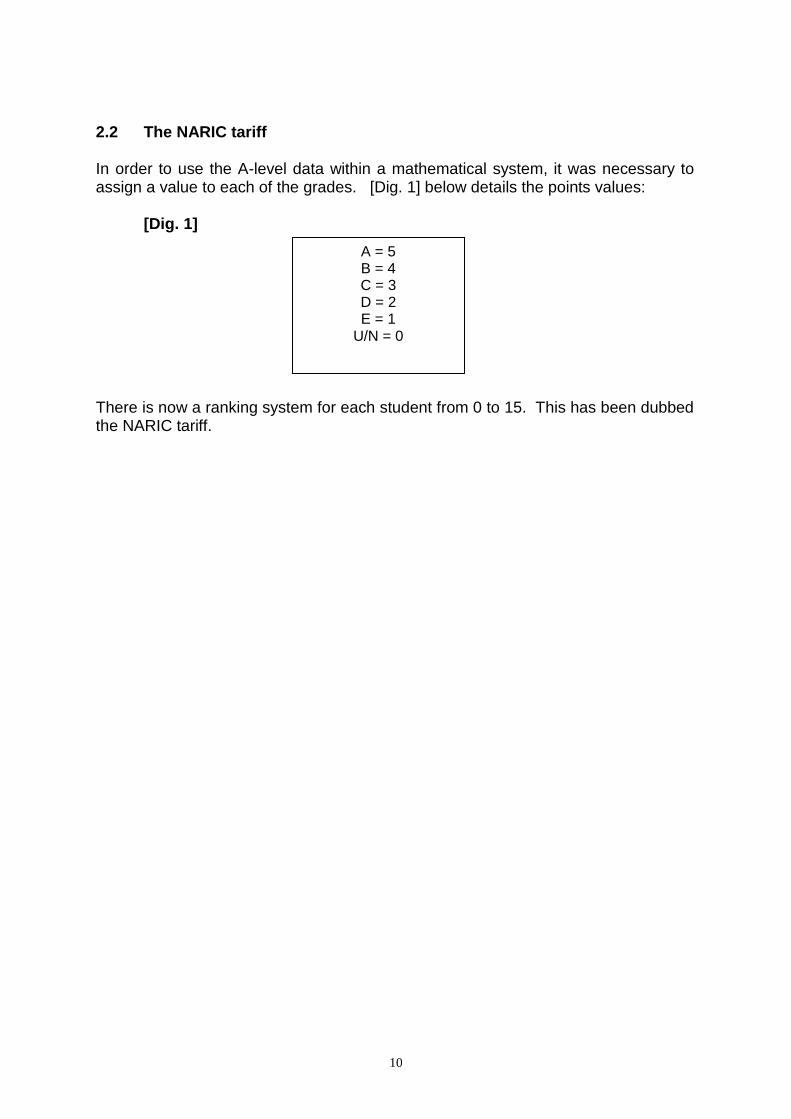
2.2 The NARIC tariff In order to use the A-level data within a mathematical system, it was necessary to assign a value to each of the grades. [Dig. 1] below details the points values: [Dig. 1] There is now a ranking system for each student from 0 to 15. This has been dubbed the NARIC tariff.
A = 5 B = 4 C = 3 D = 2 E = 1
U/N = 0

11
2.3. A Level grades to NARIC tariff conversion Individually the Breakdown of each subject grade is of little use. Converting this to the NARIC tariff will provide a percentile rank. This is done by calculating every grade combination by any one student (any one of 6 grades for each of their 3 subjects, 63 = 216 combinations). As many of these are repeated values, it is seen that only 56 of these are different grade combinations. The theory of calculation is based upon any one student being mutually exclusive to the next, and also that each subject taken is again mutually exclusive to the next. This enables the grade percentages to be converted to probabilities. The total probability of a student’s NARIC tariff, p(S), can then be calculated using this formula:
p(S) = p(A1,A2,A3) where: p(A1) = the probability of the grade of the 1st A Level subject
p(A2) = the probability of the grade of the 2nd A Level subject
p(A3) = the probability of the grade of the 3rd A Level subject These are calculated by multiplying the individual grade probabilities. Each of the 216 combinations has been calculated and this data is contained within the Appendix (Section 5). In reality, different subjects taken by the same student are not mutually exclusive. For instance, a student who has attained 2 ‘A’s in the first two subjects is more likely to attain another ‘A’ grade than another student who has obtained 2 ‘E’s in the first two subjects. This may be true but in using the NARIC tariff system we have resolved any uneven representations, and this combined with a large sample of results means that this should make little or no difference in the results. [Table 1] below demonstrates the probabilities pertaining to the acquisition of A-levels. [Dig. 2] shows the cumulative distribution of grades plotted against NARIC tariff points. It should be noted that this graph is the most important ‘tool’ used within the system. Once cumulative percentages reflecting the grade distribution of any overseas qualification (comparable to UK A-level standard) have been established, horizontal graph-lines can be drawn intersecting the Cumulative NARIC tariff curve. A vertical line can then be dropped from each intersect to the x-axis (NARIC tariff axis) indicating the tariff points values of each grade category.

12
[Table 1]
NARIC tariff Points
Probability of each points tally
Distribution (%) Cumulative Distribution (%)
15 0.0058085 0.58 0.58085
14 0.0185396 1.85 2.43481
13 0.0404562 4.05 6.48042
12 0.0691453 6.91 13.39496
11 0.0986157 9.86 23.25652
10 0.1254330 12.54 35.79982
9 0.1381090 13.81 49.61072
8 0.1365629 13.66 63.26701
7 0.1208950 12.09 75.35651
6 0.0957778 9.58 84.93429
5 0.0686354 6.86 91.79783
4 0.0424504 4.25 96.0428
3 0.0234383 2.34 98.38670
2 0.0109345 1.09 99.48015
1 0.0040672 0.41 99.88688
0 0.0011312 .011 100
Total (check) 1.0000000 100 100
[Dig. 2]
Cumulative Percentage of NARIC tariff for A Levels
0
20
40
60
80
100
120
1514131211109876543210
NARIC Tariff total
Cu
mu
lati
ve
Pe
rce
nta
ge
/ %
Cumulative
Percentage
of grades
13
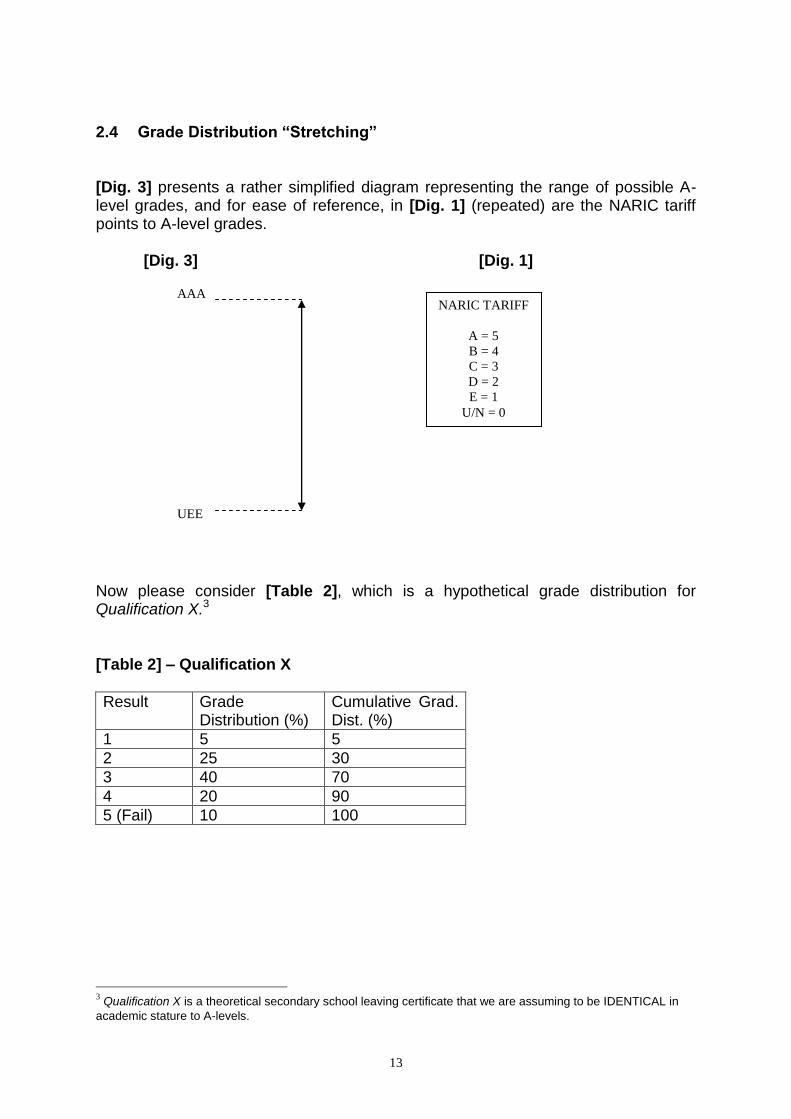
2.4 Grade Distribution “Stretching”
[Dig. 3] presents a rather simplified diagram representing the range of possible A-level grades, and for ease of reference, in [Dig. 1] (repeated) are the NARIC tariff points to A-level grades.
[Dig. 3] [Dig. 1] Now please consider [Table 2], which is a hypothetical grade distribution for Qualification X.3
[Table 2] – Qualification X
Result Grade Distribution (%)
Cumulative Grad. Dist. (%)
1 5 5
2 25 30
3 40 70
4 20 90
5 (Fail) 10 100
3 Qualification X is a theoretical secondary school leaving certificate that we are assuming to be IDENTICAL in
academic stature to A-levels.
AAA
UEE
NARIC TARIFF
A = 5
B = 4
C = 3
D = 2
E = 1
U/N = 0
14
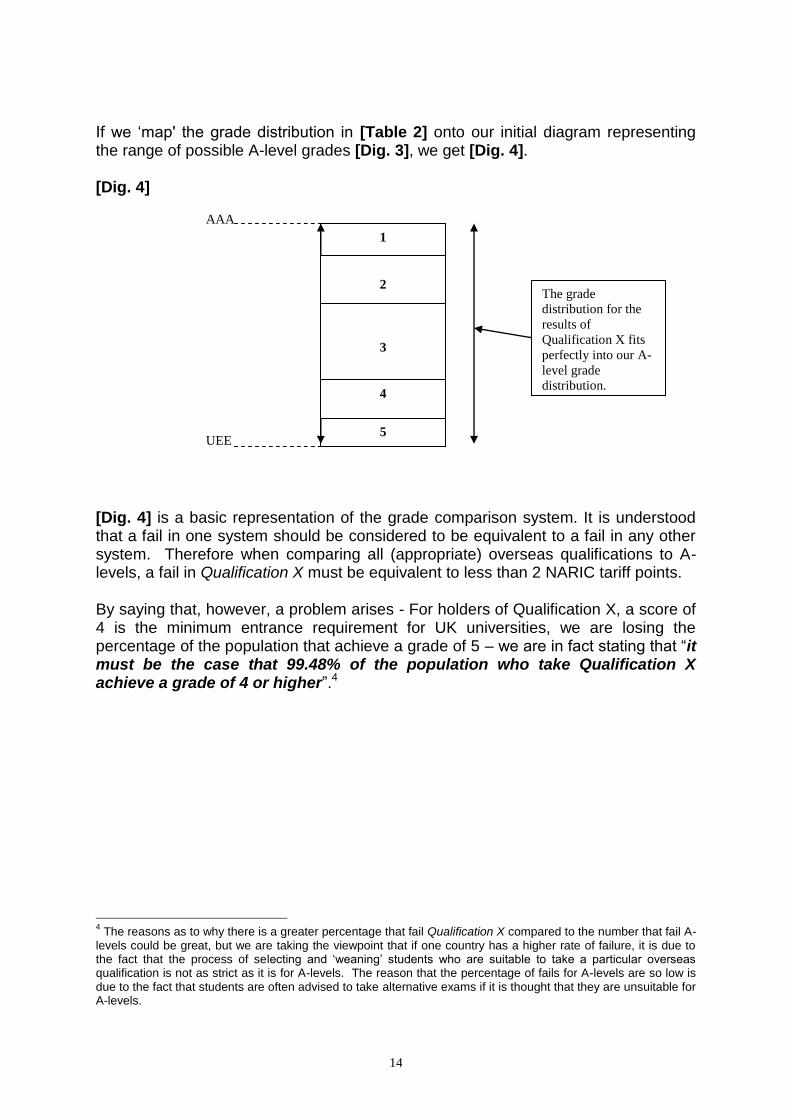
If we ‘map' the grade distribution in [Table 2] onto our initial diagram representing the range of possible A-level grades [Dig. 3], we get [Dig. 4]. [Dig. 4] [Dig. 4] is a basic representation of the grade comparison system. It is understood that a fail in one system should be considered to be equivalent to a fail in any other system. Therefore when comparing all (appropriate) overseas qualifications to A-levels, a fail in Qualification X must be equivalent to less than 2 NARIC tariff points. By saying that, however, a problem arises - For holders of Qualification X, a score of 4 is the minimum entrance requirement for UK universities, we are losing the percentage of the population that achieve a grade of 5 – we are in fact stating that “it must be the case that 99.48% of the population who take Qualification X achieve a grade of 4 or higher”.4
4 The reasons as to why there is a greater percentage that fail Qualification X compared to the number that fail A-
levels could be great, but we are taking the viewpoint that if one country has a higher rate of failure, it is due to the fact that the process of selecting and ‘weaning’ students who are suitable to take a particular overseas qualification is not as strict as it is for A-levels. The reason that the percentage of fails for A-levels are so low is due to the fact that students are often advised to take alternative exams if it is thought that they are unsuitable for A-levels.
AAA
UEE
1
5
4
3
2 The grade
distribution for the
results of
Qualification X fits
perfectly into our A-
level grade
distribution.
15
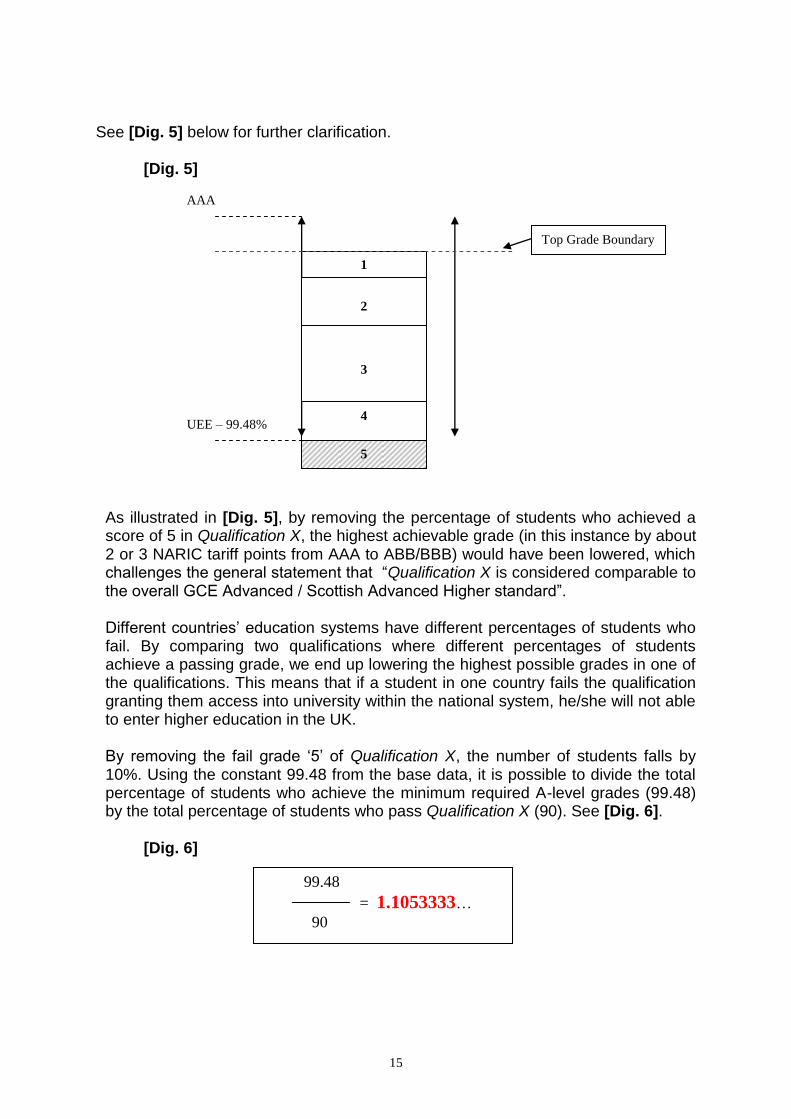
See [Dig. 5] below for further clarification.
[Dig. 5]
As illustrated in [Dig. 5], by removing the percentage of students who achieved a score of 5 in Qualification X, the highest achievable grade (in this instance by about 2 or 3 NARIC tariff points from AAA to ABB/BBB) would have been lowered, which challenges the general statement that “Qualification X is considered comparable to the overall GCE Advanced / Scottish Advanced Higher standard”. Different countries’ education systems have different percentages of students who fail. By comparing two qualifications where different percentages of students achieve a passing grade, we end up lowering the highest possible grades in one of the qualifications. This means that if a student in one country fails the qualification granting them access into university within the national system, he/she will not able to enter higher education in the UK. By removing the fail grade ‘5’ of Qualification X, the number of students falls by 10%. Using the constant 99.48 from the base data, it is possible to divide the total percentage of students who achieve the minimum required A-level grades (99.48) by the total percentage of students who pass Qualification X (90). See [Dig. 6].
[Dig. 6]
AAA
UEE – 99.48%
1
5
4
3
2
Top Grade Boundary
99.48
= 1.1053333…
90
16
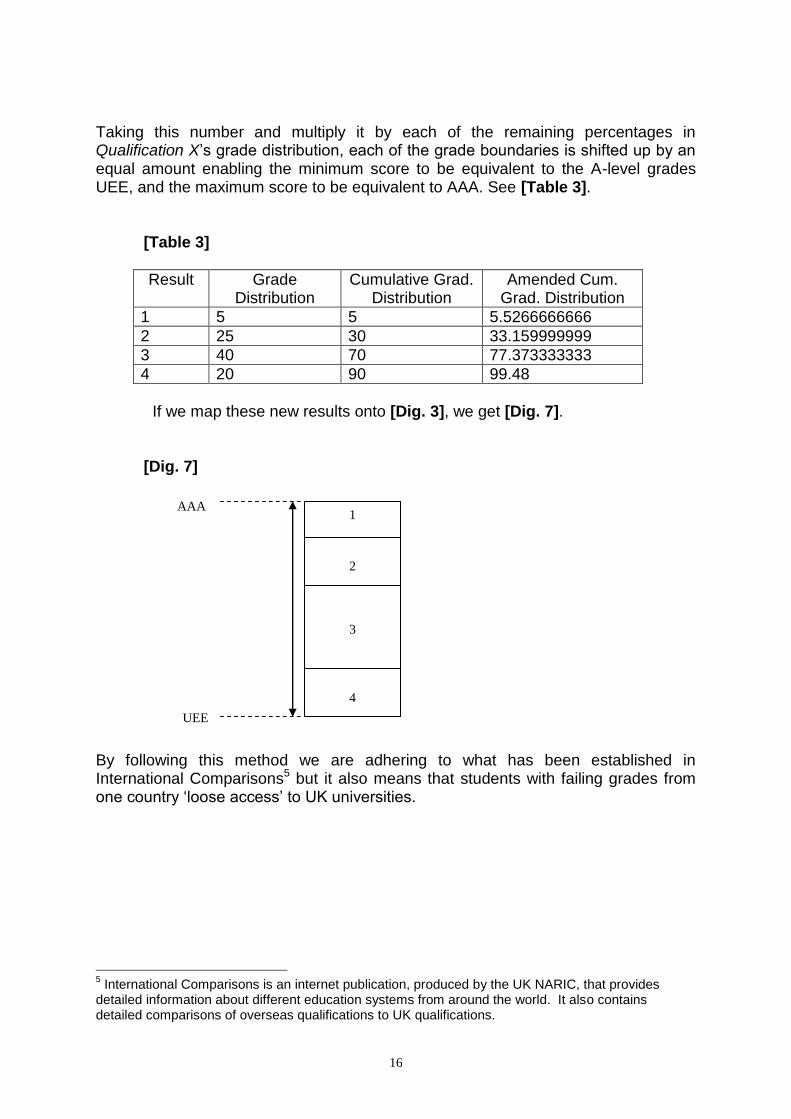
Taking this number and multiply it by each of the remaining percentages in Qualification X’s grade distribution, each of the grade boundaries is shifted up by an equal amount enabling the minimum score to be equivalent to the A-level grades UEE, and the maximum score to be equivalent to AAA. See [Table 3].
[Table 3]
Result Grade Distribution
Cumulative Grad. Distribution
Amended Cum. Grad. Distribution
1 5 5 5.5266666666
2 25 30 33.159999999
3 40 70 77.373333333
4 20 90 99.48
If we map these new results onto [Dig. 3], we get [Dig. 7].
[Dig. 7]
By following this method we are adhering to what has been established in International Comparisons5 but it also means that students with failing grades from one country ‘loose access’ to UK universities.
5 International Comparisons is an internet publication, produced by the UK NARIC, that provides
detailed information about different education systems from around the world. It also contains detailed comparisons of overseas qualifications to UK qualifications.
AAA
UEE
4
3
2
1
17
2.5 Data Collection The essential data required is the proportional distribution guidelines and/or a breakdown of grades attained by students in any one year for each of the overseas secondary school qualifications.
There are a number of key issues to consider in the data collection process:
Comparable qualifications in each country
First of all, we need to identify qualifications that are comparable to British A-levels. In general this is the university entrance requirement of the country in question (although in some countries entry level to higher education is lower that that in the UK). The majority of this information can be found within International Comparisons and the research outcome undertaken by NARIC team.
Difference in levels of university entrance in various countries Many qualifications have particular grade restrictions when compared to A-level standard. In some cases, students holding an ‘entry’ qualification must achieve a certain score in order to qualify as having reached A-level standard. This had to be taken into account in the data gathering and analysis process.
Difference in methods of examination and marking An example of this can be seen if we look at the French Baccalaureate. In this qualification, the top mark is 20/20, however the highest obtainable grade is 16 (our statistical data regarding grade distribution showed that no-one who took the exam scored more than 16 in any stream). Since this qualification is deemed comparable to UK A-level standard, it is expected that a score of 16 must therefore equate to the highest possible A-level results (i.e. 3 As). For systems like this, it is essential to establish a difference in allocating grade boundaries, or set achievement levels.
Having considered the data required and the complexity of the available data, the following sources have been identified as the main data providers:
The NARIC/ENICs
Statistical functions of the Ministry of Education
Main schools and/or universities in that country
Independent research as secondary source
18
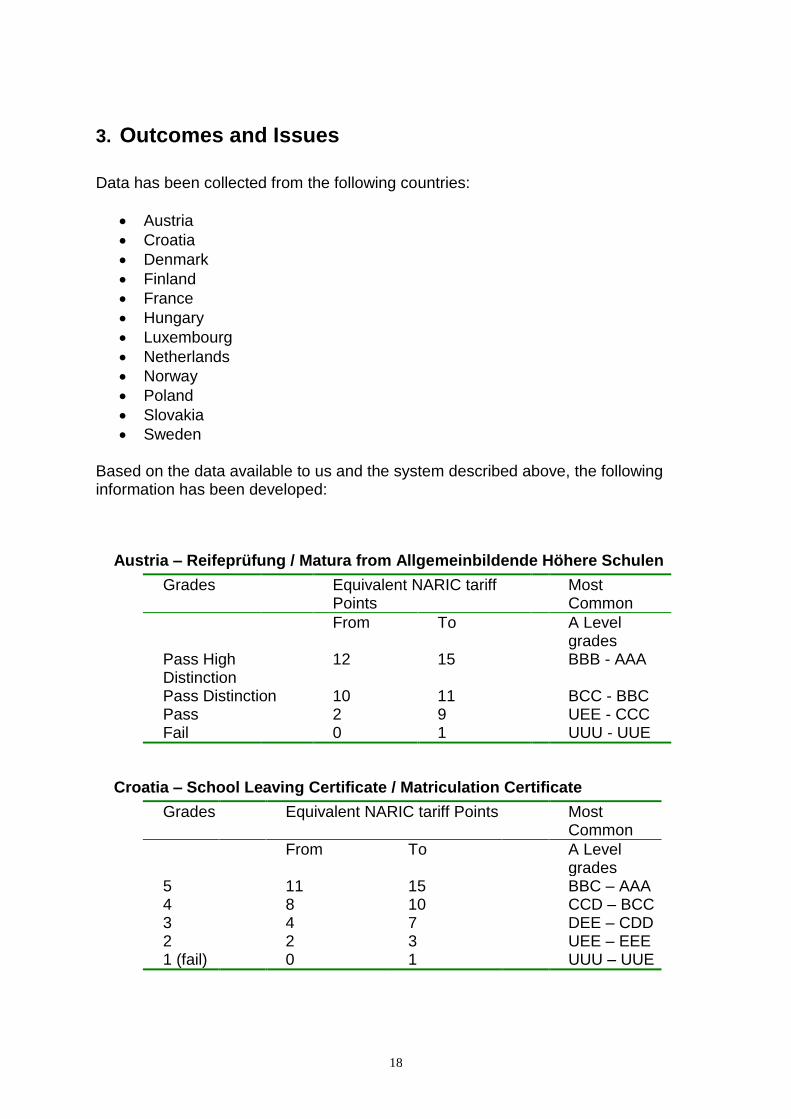
3. Outcomes and Issues
Data has been collected from the following countries:
Austria
Croatia
Denmark
Finland
France
Hungary
Luxembourg
Netherlands
Norway
Poland
Slovakia
Sweden Based on the data available to us and the system described above, the following information has been developed:
Austria – Reifeprüfung / Matura from Allgemeinbildende Höhere Schulen
Grades Equivalent NARIC tariff Points
Most Common
From To A Level grades
Pass High Distinction
12 15 BBB - AAA
Pass Distinction 10 11 BCC - BBC Pass 2 9 UEE - CCC Fail 0 1 UUU - UUE
Croatia – School Leaving Certificate / Matriculation Certificate
Grades Equivalent NARIC tariff Points Most Common
From To A Level grades
5 11 15 BBC – AAA 4 8 10 CCD – BCC 3 4 7 DEE – CDD 2 2 3 UEE – EEE 1 (fail) 0 1 UUU – UUE
19
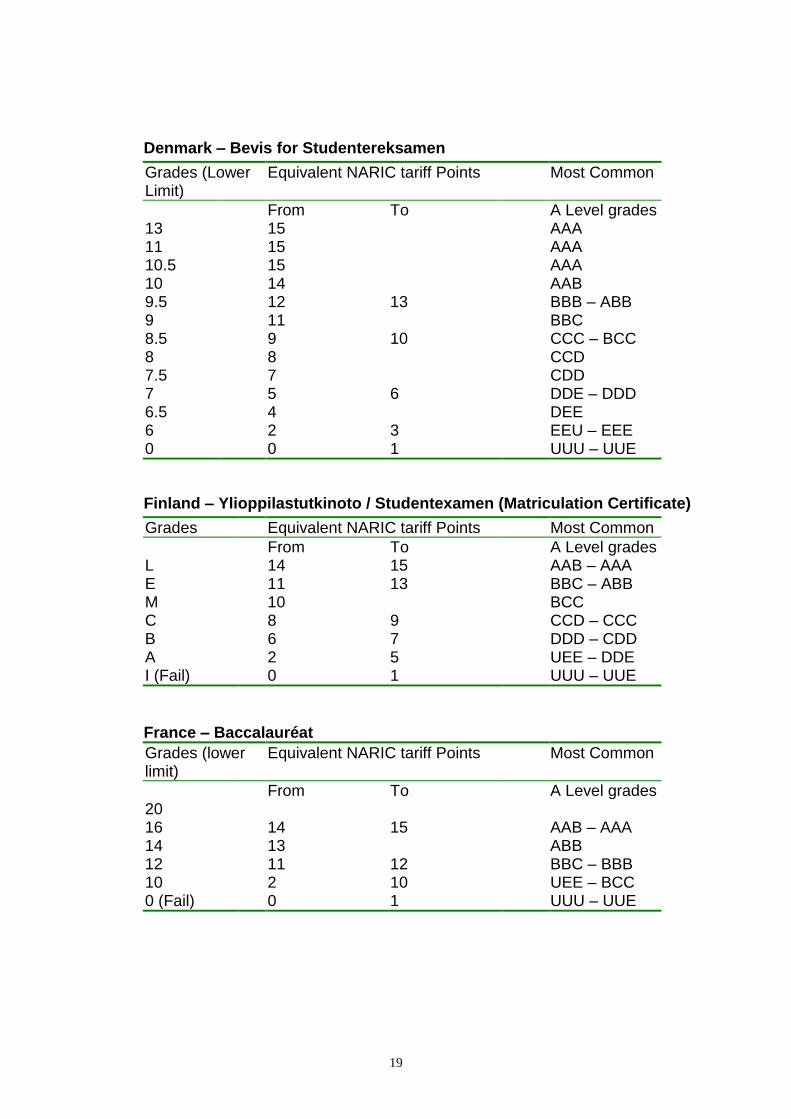
Denmark – Bevis for Studentereksamen
Grades (Lower Limit)
Equivalent NARIC tariff Points Most Common
From To A Level grades 13 15 AAA 11 15 AAA 10.5 15 AAA 10 14 AAB 9.5 12 13 BBB – ABB 9 11 BBC 8.5 9 10 CCC – BCC 8 8 CCD 7.5 7 CDD 7 5 6 DDE – DDD 6.5 4 DEE 6 2 3 EEU – EEE 0 0 1 UUU – UUE
Finland – Ylioppilastutkinoto / Studentexamen (Matriculation Certificate)
Grades Equivalent NARIC tariff Points Most Common
From To A Level grades L 14 15 AAB – AAA E 11 13 BBC – ABB M 10 BCC C 8 9 CCD – CCC B 6 7 DDD – CDD A 2 5 UEE – DDE I (Fail) 0 1 UUU – UUE
France – Baccalauréat
Grades (lower limit)
Equivalent NARIC tariff Points Most Common
From To A Level grades 20 16 14 15 AAB – AAA 14 13 ABB 12 11 12 BBC – BBB 10 2 10 UEE – BCC 0 (Fail) 0 1 UUU – UUE
20
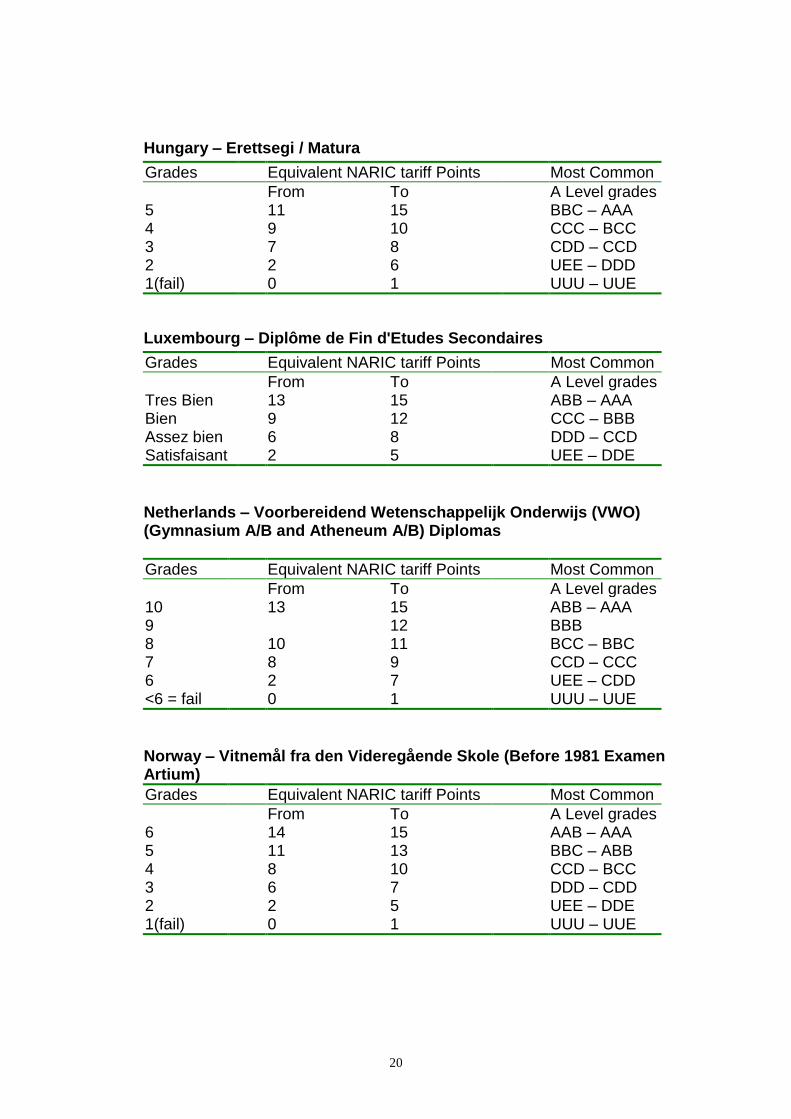
Hungary – Erettsegi / Matura
Grades Equivalent NARIC tariff Points Most Common
From To A Level grades 5 11 15 BBC – AAA 4 9 10 CCC – BCC 3 7 8 CDD – CCD 2 2 6 UEE – DDD 1(fail) 0 1 UUU – UUE
Luxembourg – Diplôme de Fin d'Etudes Secondaires
Grades Equivalent NARIC tariff Points Most Common
From To A Level grades Tres Bien 13 15 ABB – AAA Bien 9 12 CCC – BBB Assez bien 6 8 DDD – CCD Satisfaisant 2 5 UEE – DDE
Netherlands – Voorbereidend Wetenschappelijk Onderwijs (VWO) (Gymnasium A/B and Atheneum A/B) Diplomas
Grades Equivalent NARIC tariff Points Most Common
From To A Level grades 10 13 15 ABB – AAA 9 12 BBB 8 10 11 BCC – BBC 7 8 9 CCD – CCC 6 2 7 UEE – CDD <6 = fail 0 1 UUU – UUE
Norway – Vitnemål fra den Videregående Skole (Before 1981 Examen Artium)
Grades Equivalent NARIC tariff Points Most Common
From To A Level grades 6 14 15 AAB – AAA 5 11 13 BBC – ABB 4 8 10 CCD – BCC 3 6 7 DDD – CDD 2 2 5 UEE – DDE 1(fail) 0 1 UUU – UUE
21
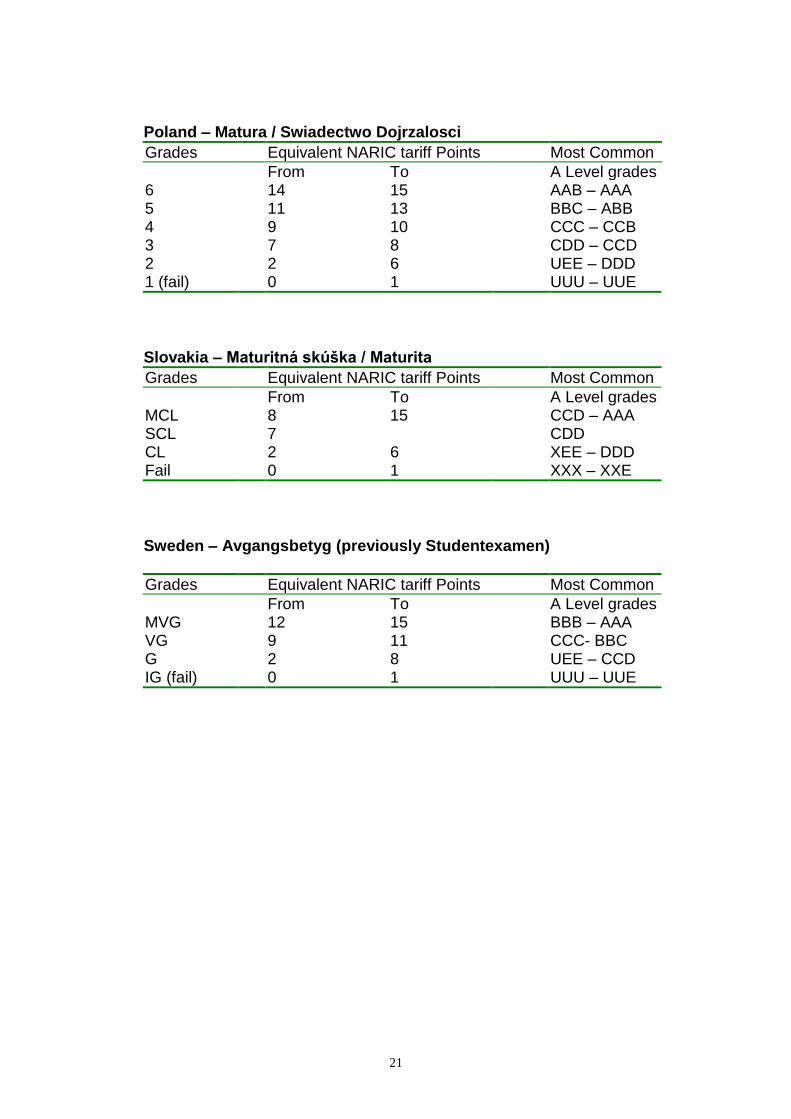
Poland – Matura / Swiadectwo Dojrzalosci
Grades Equivalent NARIC tariff Points Most Common
From To A Level grades 6 14 15 AAB – AAA 5 11 13 BBC – ABB 4 9 10 CCC – CCB 3 7 8 CDD – CCD 2 2 6 UEE – DDD 1 (fail) 0 1 UUU – UUE
Slovakia – Maturitná skúška / Maturita
Grades Equivalent NARIC tariff Points Most Common
From To A Level grades MCL 8 15 CCD – AAA SCL 7 CDD CL 2 6 XEE – DDD Fail 0 1 XXX – XXE
Sweden – Avgangsbetyg (previously Studentexamen)
Grades Equivalent NARIC tariff Points Most Common
From To A Level grades MVG 12 15 BBB – AAA VG 9 11 CCC- BBC G 2 8 UEE – CCD IG (fail) 0 1 UUU – UUE
22
3.2 Case Studies The work undertaken during within this study presents a complicated process in that value comparisons vary and that the system needs to be flexible enough to accommodate the differences in qualifications derived from differing educational systems.
This section presents two case studies to illustrate the methods used for different value comparisons and their outcomes.
3.2.1 Case study 1
Finland - Ylioppilastutkinoto / Studentexamen (Matriculation Certificate) The research result confirms that the following possible grades exist within the Finnish secondary school grading system:
7 laudatur (L) 6 eximia cum laude approbatur (E) 5 magna cum laude approbatur (M) 4 cum laude approbatur (C) 3 lubenter approbatur (B) 2 approbatur (A) 0 improbatur (I) fail
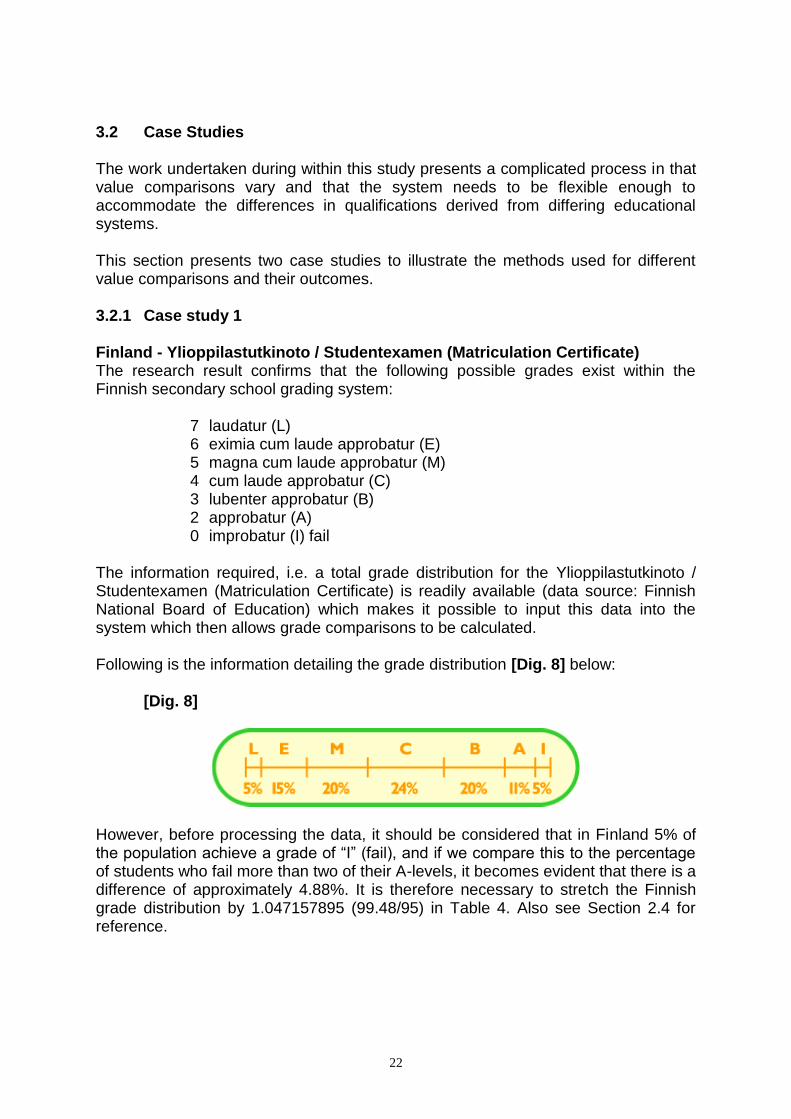
The information required, i.e. a total grade distribution for the Ylioppilastutkinoto / Studentexamen (Matriculation Certificate) is readily available (data source: Finnish National Board of Education) which makes it possible to input this data into the system which then allows grade comparisons to be calculated. Following is the information detailing the grade distribution [Dig. 8] below:
[Dig. 8]
However, before processing the data, it should be considered that in Finland 5% of the population achieve a grade of “I” (fail), and if we compare this to the percentage of students who fail more than two of their A-levels, it becomes evident that there is a difference of approximately 4.88%. It is therefore necessary to stretch the Finnish grade distribution by 1.047157895 (99.48/95) in Table 4. Also see Section 2.4 for reference.
23
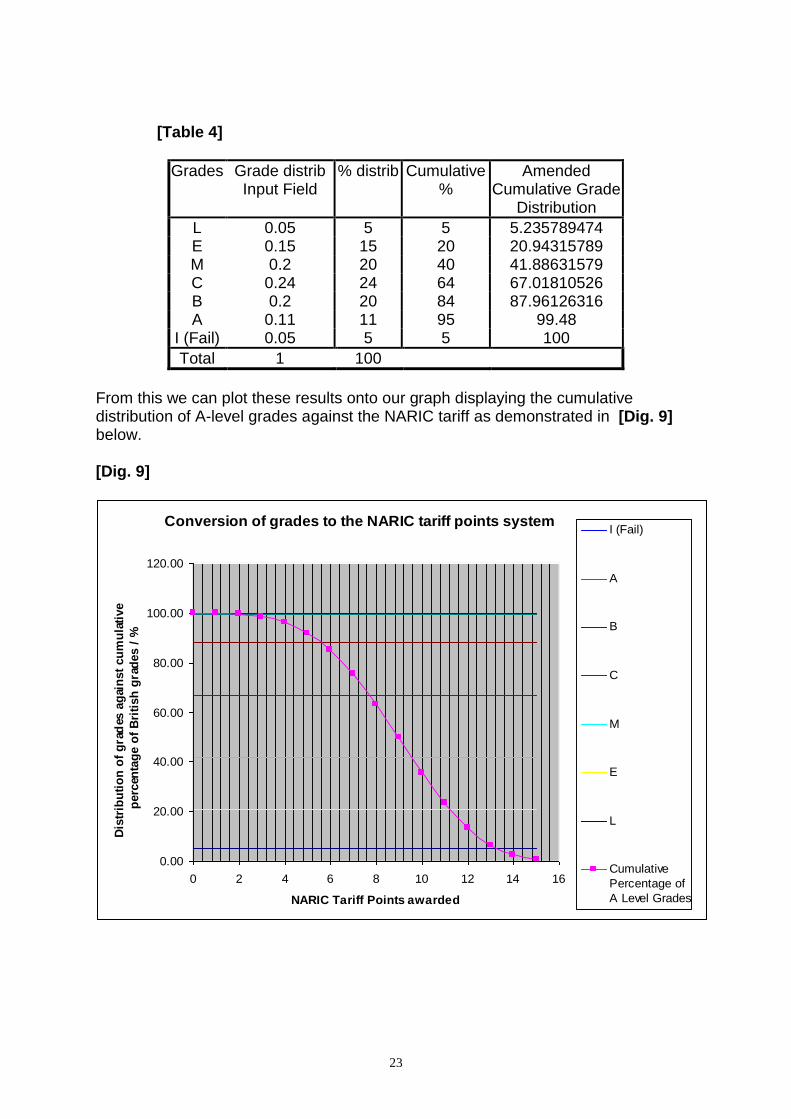
[Table 4]
Grades Grade distrib Input Field
% distrib Cumulative %
Amended Cumulative Grade
Distribution
L 0.05 5 5 5.235789474 E 0.15 15 20 20.94315789 M 0.2 20 40 41.88631579 C 0.24 24 64 67.01810526 B 0.2 20 84 87.96126316 A 0.11 11 95 99.48
I (Fail) 0.05 5 5 100
Total 1 100
From this we can plot these results onto our graph displaying the cumulative distribution of A-level grades against the NARIC tariff as demonstrated in [Dig. 9] below. [Dig. 9]
Conversion of grades to the NARIC tariff points system
0.00
20.00
40.00
60.00
80.00
100.00
120.00
0 2 4 6 8 10 12 14 16
NARIC Tariff Points awarded
Dis
trib
uti
on
of
gra
des
ag
ain
st
cu
mu
lati
ve
perc
enta
ge o
f B
riti
sh
gra
des /
%
I (Fail)
A
B
C
M
E
L
Cumulative
Percentage of
A Level Grades
24
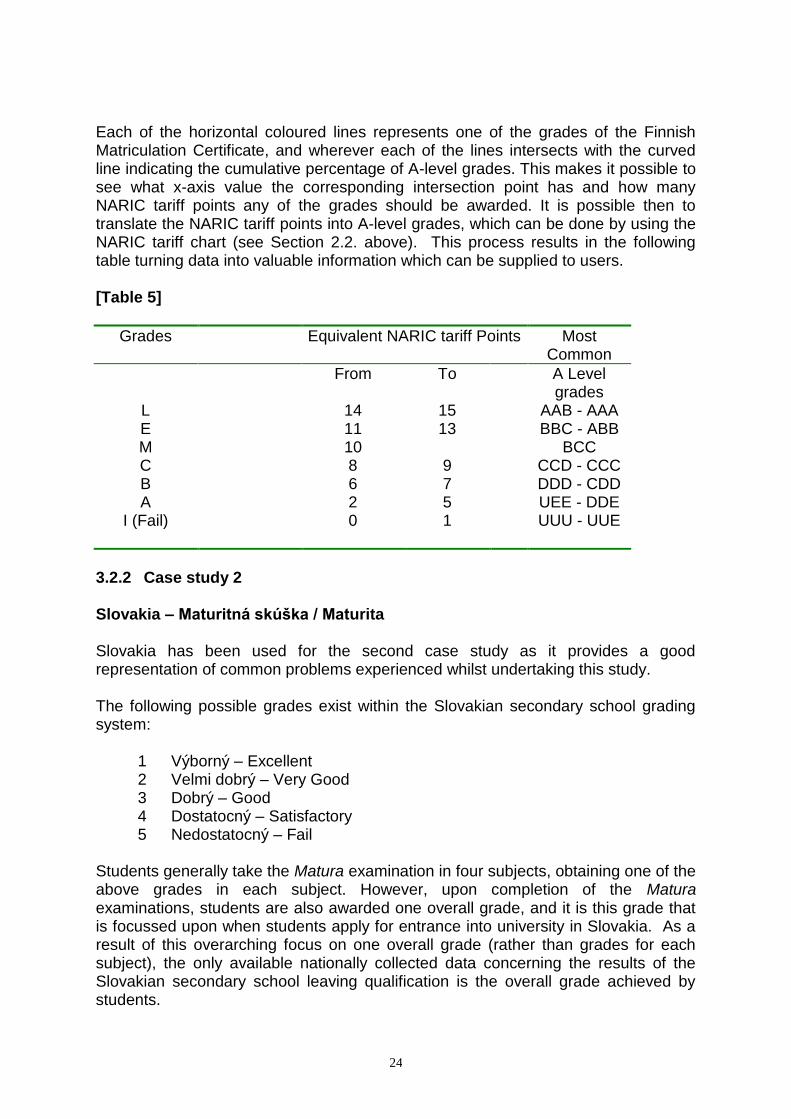
Each of the horizontal coloured lines represents one of the grades of the Finnish Matriculation Certificate, and wherever each of the lines intersects with the curved line indicating the cumulative percentage of A-level grades. This makes it possible to see what x-axis value the corresponding intersection point has and how many NARIC tariff points any of the grades should be awarded. It is possible then to translate the NARIC tariff points into A-level grades, which can be done by using the NARIC tariff chart (see Section 2.2. above). This process results in the following table turning data into valuable information which can be supplied to users. [Table 5]
Grades Equivalent NARIC tariff Points Most Common
From To A Level grades
L 14 15 AAB - AAA E 11 13 BBC - ABB M 10 BCC C 8 9 CCD - CCC B 6 7 DDD - CDD A 2 5 UEE - DDE
I (Fail) 0 1 UUU - UUE
3.2.2 Case study 2
Slovakia – Maturitná skúška / Maturita Slovakia has been used for the second case study as it provides a good representation of common problems experienced whilst undertaking this study. The following possible grades exist within the Slovakian secondary school grading system:
1 Výborný – Excellent 2 Velmi dobrý – Very Good 3 Dobrý – Good 4 Dostatocný – Satisfactory 5 Nedostatocný – Fail
Students generally take the Matura examination in four subjects, obtaining one of the above grades in each subject. However, upon completion of the Matura examinations, students are also awarded one overall grade, and it is this grade that is focussed upon when students apply for entrance into university in Slovakia. As a result of this overarching focus on one overall grade (rather than grades for each subject), the only available nationally collected data concerning the results of the Slovakian secondary school leaving qualification is the overall grade achieved by students.

25
The possible overall grades that exist within the Slovakian secondary school grading system are as follows:
Magna Cum Laude (MCL) Summa Cum Laude (SCL) Cum Laude (CL)
This overall grading is calculated as a grade average, so to obtain the score MCL, a student’s grade average must be no worse than 1.5, and no grade of 3 (Dobrý) or worse can be obtained. To obtain an overall score of SCL, a student must obtain a grade average of no worse than 2, and no grade of 4 (Dostatocný) or worse can be obtained. Finally, to obtain an overall grade of CL, a student’s grade average can be below 2, but the student must not have obtained a score of 5 (Nedostatocný) in any of the subjects taken. Since the only available data detailed the overall grade results, and also since this is the data pertinent to university entrance in Slovakia, it is the information used to provide the set of grade comparisons. The main problem that arises from using this data is due to the substantial difference in the number of possible grades available to A-level students and the number of possible grades available to Matura students. It is also the case that in taking the Matura, it is far more common for a student to obtain a grade of MCL than it is for an A-level student to obtain three A grades. Both of these factors have the result of widening the available A-level grade band comparisons available to a grade in the Matura i.e. one grade in the Matura can be compared to several different A-level grades, and this can be seen in the Slovakia grade comparison table in Section 3.1 (repeated below for ease of reference). Slovakia – Maturitná skúška / Maturita
Grades Equivalent NARIC tariff Points Most Common
From To A Level grades MCL 8 15 CCD – AAA SCL 7 CDD CL 2 6 XEE – DDD Fail 0 1 XXX – XXE
This is an issue that nearly always arises when dealing with qualifications that award the student one single grade following study and examinations in several subjects, however despite the broad ranges of A-level grades that can fall into one single result from an overseas qualification, the comparisons given will nevertheless represent a standard to which a particular grade can be compared.
26
3.3. Qualifications currently outside the A-level comparison system There are systems, however, that highlight a different scenario. An example is qualifications from the following four countries:
Belgium
Germany
Iceland
Switzerland Although each of the four countries selected here has its distinct system, they have identifiable common features in that they appear to flout certain essential rules of the A-level system.
No nationally coordinated final year examination.
Belgium & Iceland - In these two systems the student is awarded a qualification upon passing an examination set by the school, and this qualification permits them to attend university. Each school is responsible for assigning certificates and marking examination results. In the absence of a nationally coordinated examination, such a national system makes it difficult to provide accurate comparisons against A-level results since we do not have an official, national benchmarking standard in either of the countries in question.
No centrally recorded data
Belgium, Germany, Iceland, & Switzerland - None of these countries collect national statistics concerning examinations and student performance, which makes it difficult to identify academic disparity between individual schools in these countries. It appears that precise grade comparisons may not be available for all qualifications comparable to A-level standard, particularly in the case of countries with a very open regard on access into higher education. For example, in Belgium, as long as a student has been awarded a diploma of secondary education, he/she is given free entrance to university. It also seems to be the case that in systems such as this there is a high dropout rate within the first year of entry. Recognising that UK universities do not operate in this way, it is necessary to devise an alternative method to reflect this difference.
27
3.4 Levels of Comparison This section is devoted to looking at an alternative method of providing grade comparisons for overseas qualifications that do not quite match the standards of A-levels. As described above the grade comparison system is, understandably, based on the assumption that we are dealing with qualifications that are very similar (if not identical) in academic stature to A-levels. However, certain systems fall slightly short in that respect, despite the qualification granting access to higher education within the national system. A good example to consider is the Greek Apolytirion of Lykeio. As a HE entry qualification in Greece, it falls slightly short of A-level standard in academic terms. Many UK institutions set their own minimum required grades for admission purpose. Another example is the Irish Leaving Certificate whereby the holder ‘is considered to have satisfied the general university admission requirements’, but will be required to carry out a foundation period in order to study certain subjects. An alternative system for developing more detailed comparisons for qualifications similar to the Greek Apolytirion could be possible by linking to Scottish Highers, or AS-level grade distributions as the base data. This requires research into running a parallel grade comparison service that will contain data from either the grade distribution of Scottish Highers, or AS-levels. This will accommodate those overseas qualifications that do not quite meet the academic requirements of A-levels, but that may nevertheless permit the holder to enter into higher education in exceptional cases. The overall methodology for this system will not vary from that of the current system, although the comparison will be made on a different ‘letter grading system’.
28
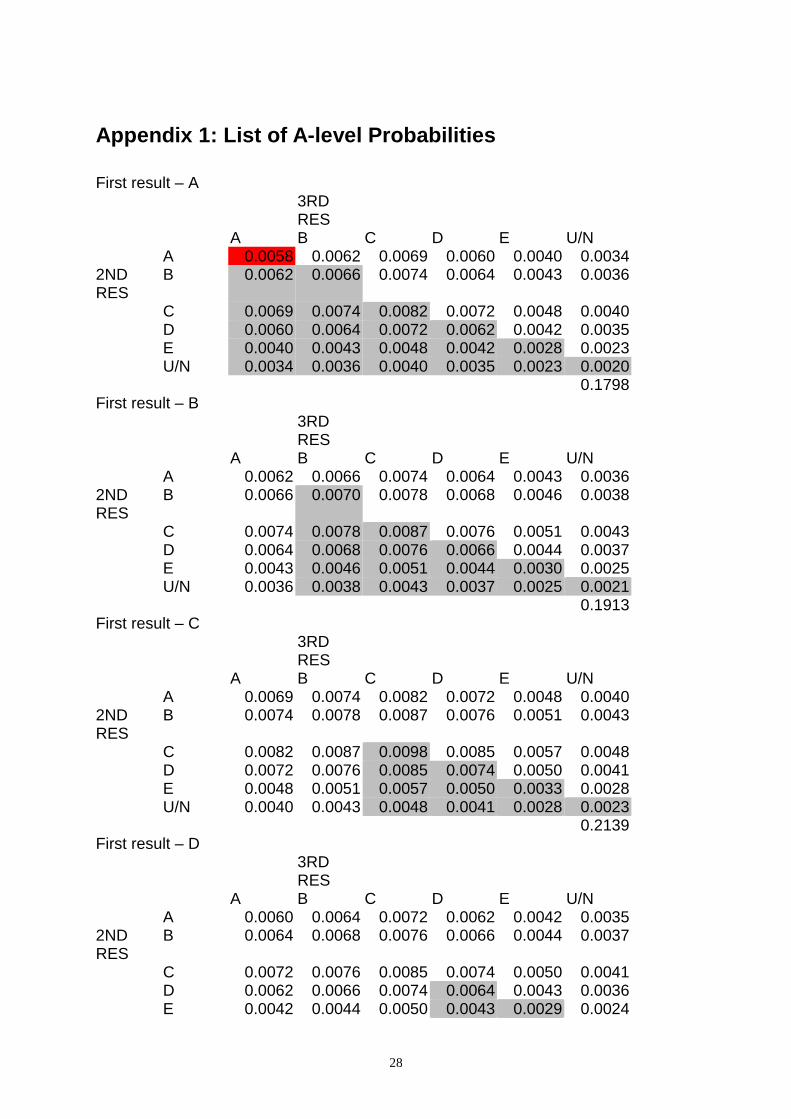
Appendix 1: List of A-level Probabilities
First result – A
3RD RES
A B C D E U/N A 0.0058 0.0062 0.0069 0.0060 0.0040 0.0034
2ND RES
B 0.0062 0.0066 0.0074 0.0064 0.0043 0.0036
C 0.0069 0.0074 0.0082 0.0072 0.0048 0.0040 D 0.0060 0.0064 0.0072 0.0062 0.0042 0.0035 E 0.0040 0.0043 0.0048 0.0042 0.0028 0.0023 U/N 0.0034 0.0036 0.0040 0.0035 0.0023 0.0020 0.1798
First result – B 3RD
RES
A B C D E U/N A 0.0062 0.0066 0.0074 0.0064 0.0043 0.0036
2ND RES
B 0.0066 0.0070 0.0078 0.0068 0.0046 0.0038
C 0.0074 0.0078 0.0087 0.0076 0.0051 0.0043 D 0.0064 0.0068 0.0076 0.0066 0.0044 0.0037 E 0.0043 0.0046 0.0051 0.0044 0.0030 0.0025 U/N 0.0036 0.0038 0.0043 0.0037 0.0025 0.0021 0.1913
First result – C 3RD
RES
A B C D E U/N A 0.0069 0.0074 0.0082 0.0072 0.0048 0.0040
2ND RES
B 0.0074 0.0078 0.0087 0.0076 0.0051 0.0043
C 0.0082 0.0087 0.0098 0.0085 0.0057 0.0048 D 0.0072 0.0076 0.0085 0.0074 0.0050 0.0041 E 0.0048 0.0051 0.0057 0.0050 0.0033 0.0028 U/N 0.0040 0.0043 0.0048 0.0041 0.0028 0.0023 0.2139
First result – D 3RD
RES
A B C D E U/N A 0.0060 0.0064 0.0072 0.0062 0.0042 0.0035
2ND RES
B 0.0064 0.0068 0.0076 0.0066 0.0044 0.0037
C 0.0072 0.0076 0.0085 0.0074 0.0050 0.0041 D 0.0062 0.0066 0.0074 0.0064 0.0043 0.0036 E 0.0042 0.0044 0.0050 0.0043 0.0029 0.0024
29
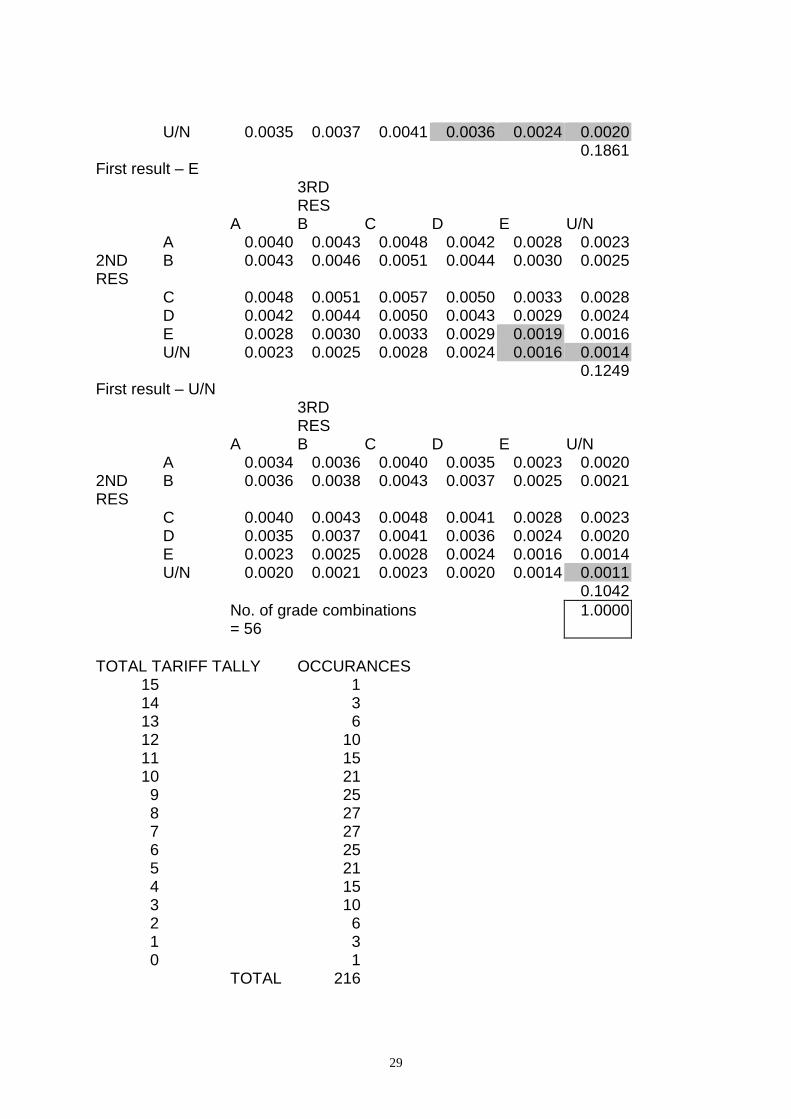
U/N 0.0035 0.0037 0.0041 0.0036 0.0024 0.0020 0.1861
First result – E 3RD
RES
A B C D E U/N A 0.0040 0.0043 0.0048 0.0042 0.0028 0.0023
2ND RES
B 0.0043 0.0046 0.0051 0.0044 0.0030 0.0025
C 0.0048 0.0051 0.0057 0.0050 0.0033 0.0028 D 0.0042 0.0044 0.0050 0.0043 0.0029 0.0024 E 0.0028 0.0030 0.0033 0.0029 0.0019 0.0016 U/N 0.0023 0.0025 0.0028 0.0024 0.0016 0.0014 0.1249
First result – U/N 3RD
RES
A B C D E U/N A 0.0034 0.0036 0.0040 0.0035 0.0023 0.0020
2ND RES
B 0.0036 0.0038 0.0043 0.0037 0.0025 0.0021
C 0.0040 0.0043 0.0048 0.0041 0.0028 0.0023 D 0.0035 0.0037 0.0041 0.0036 0.0024 0.0020 E 0.0023 0.0025 0.0028 0.0024 0.0016 0.0014 U/N 0.0020 0.0021 0.0023 0.0020 0.0014 0.0011 0.1042
No. of grade combinations = 56
1.0000
TOTAL TARIFF TALLY OCCURANCES
15 1 14 3 13 6 12 10 11 15 10 21 9 25 8 27 7 27 6 25 5 21 4 15 3 10 2 6 1 3 0 1
TOTAL 216
30
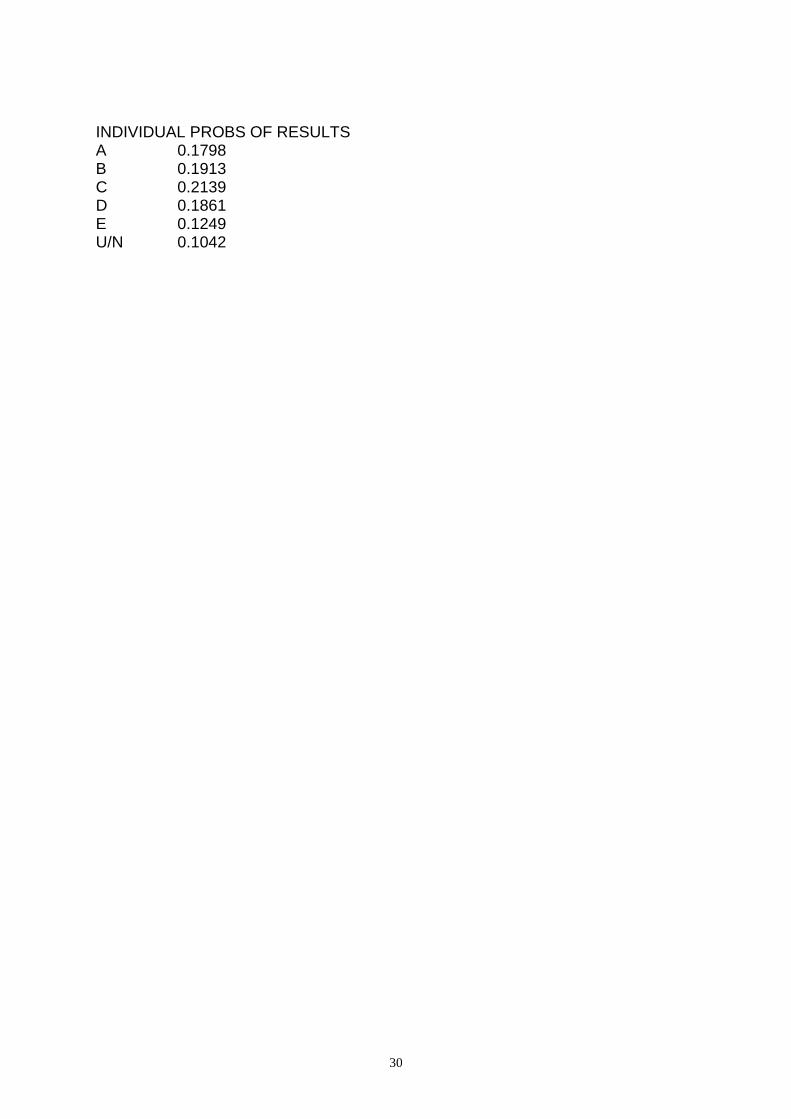
INDIVIDUAL PROBS OF RESULTS A 0.1798 B 0.1913 C 0.2139 D 0.1861 E 0.1249 U/N 0.1042
31
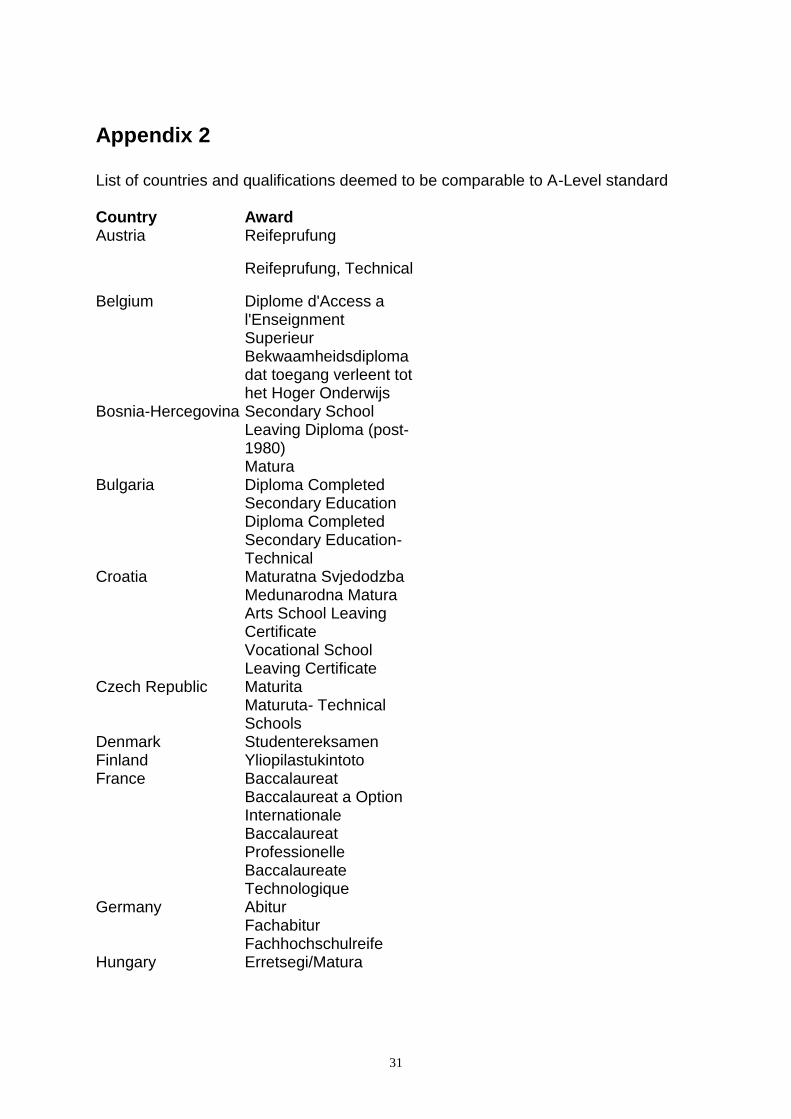
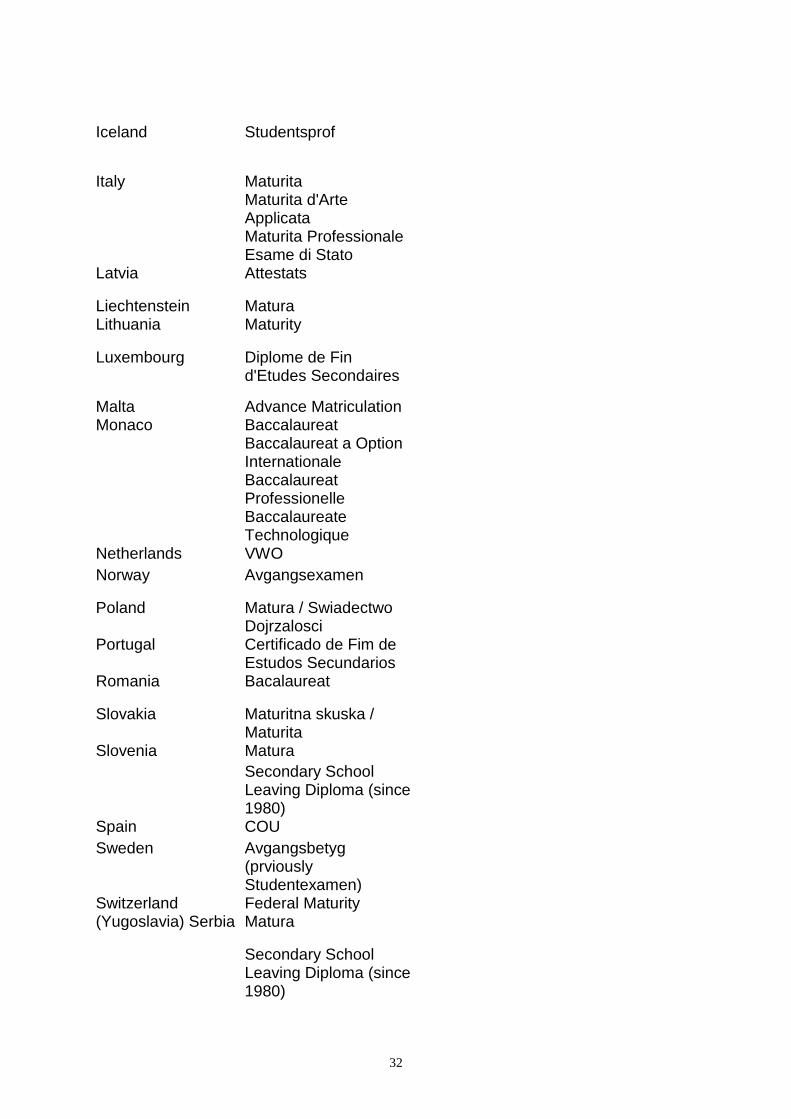
Appendix 2
List of countries and qualifications deemed to be comparable to A-Level standard Country Award Austria Reifeprufung
Reifeprufung, Technical
Belgium Diplome d'Access a l'Enseignment Superieur Bekwaamheidsdiploma dat toegang verleent tot het Hoger Onderwijs
Bosnia-Hercegovina Secondary School Leaving Diploma (post-1980) Matura
Bulgaria Diploma Completed Secondary Education Diploma Completed Secondary Education- Technical
Croatia Maturatna Svjedodzba Medunarodna Matura Arts School Leaving Certificate Vocational School Leaving Certificate
Czech Republic Maturita Maturuta- Technical Schools
Denmark Studentereksamen Finland Yliopilastukintoto France Baccalaureat
Baccalaureat a Option Internationale Baccalaureat Professionelle Baccalaureate Technologique
Germany Abitur Fachabitur Fachhochschulreife
Hungary Erretsegi/Matura
32
Iceland Studentsprof
Italy Maturita Maturita d'Arte Applicata Maturita Professionale Esame di Stato
Latvia Attestats
Liechtenstein Matura Lithuania Maturity
Luxembourg Diplome de Fin d'Etudes Secondaires
Malta Advance Matriculation Monaco Baccalaureat
Baccalaureat a Option Internationale Baccalaureat Professionelle Baccalaureate Technologique
Netherlands VWO
Norway Avgangsexamen
Poland Matura / Swiadectwo Dojrzalosci
Portugal Certificado de Fim de Estudos Secundarios
Romania Bacalaureat
Slovakia Maturitna skuska / Maturita
Slovenia Matura
Secondary School Leaving Diploma (since 1980)
Spain COU
Sweden Avgangsbetyg (prviously Studentexamen)
Switzerland Federal Maturity (Yugoslavia) Serbia Matura
Secondary School Leaving Diploma (since 1980)