
INCREASING SUCCESS OF TREE ESTABLISHMENT … · INCREASING SUCCESS OF TREE ESTABLISHMENT BY ......
63
1 INCREASING SUCCESS OF TREE ESTABLISHMENT BY USING SEASONAL CLIMATE FORECASTS Final Report for Land and Water Australia Managing Climate Variability Program July 2007 McGinness, H.M., Graham, S., Huth, N., Thomas, D., Carr, D., O’Connell, D., Carberry, P.
Transcript of INCREASING SUCCESS OF TREE ESTABLISHMENT … · INCREASING SUCCESS OF TREE ESTABLISHMENT BY ......
1
INCREASING SUCCESS OF TREE ESTABLISHMENT BY USING SEASONAL CLIMATE FORECASTS
Final Report for Land and Water Australia Managing Climate Variability Program
July 2007
McGinness, H.M., Graham, S., Huth, N., Thomas, D., Carr, D., O’Connell, D., Carberry, P.

1
TABLE OF CONTENTS 1. PROJECT DETAILS.............................................................................................................................................. 1
ACKNOWLEDGEMENTS ................................................................................................................................................... 1 2. ABSTRACT............................................................................................................................................................. 2 3. PROJECT OBJECTIVES...................................................................................................................................... 2 4. METHODS .............................................................................................................................................................. 2 5. SUMMARY OF RESULTS.................................................................................................................................... 3
5.1 INTRODUCTION: ENABLING REVEGETATION PROVIDERS AND COMMERCIAL FORESTRY OPERATIONS TO IMPROVE ON-GROUND REVEGETATION OUTCOMES ........................................................................................................................ 3 5.2 DEFINING STRATEGIES TO REDUCE RISK OF UNSUCCESSFUL ESTABLISHMENT........................................................... 3 5.3 PREDICTING OCCURRENCE OF CONDITIONS THAT ARE CONDUCIVE TO SUCCESSFUL ESTABLISHMENT USING CLIMATE FORECASTING ................................................................................................................................................................. 4 5.4 IDENTIFYING BARRIERS AND SYNERGIES TO THE USE OF SEASONAL CLIMATE FORECASTING .................................... 6 5.5 ENGAGING THE REVEGETATION AND COMMERCIAL PLANTING INDUSTRIES TO PROVIDE PATHWAYS FOR ADOPTION 7
6. OUTPUT COMMUNICATION AND ADOPTION.................................................................................................. 8 7. ASSESSMENT OF COMMERCIAL POTENTIAL............................................................................................ 8 8. PUBLICATIONS AND ADDITIONAL INFORMATION ................................................................................. 8 9. APPENDICES: DETAILED RESULTS............................................................................................................... 9
9.1 REGIONAL DATA COLLECTION .................................................................................................................................. 9 9.2 INTENSIVE FIELD EXPERIMENTS .............................................................................................................................. 17 9.3 MODEL DEVELOPMENT ........................................................................................................................................... 38 9.4 WORKSHOP............................................................................................................................................................. 57 9.5 CONCLUSIONS......................................................................................................................................................... 59
10. REFERENCES ................................................................................................................................................. 60
1. PROJECT DETAILS
Project Title: Increasing Success of Tree Establishment by Using Seasonal Climate Forecasts LWA Project Number: CSE20 Research Organisation: CSIRO Sustainable Ecosystems Principal Investigator: Dr Peter Carberry, CSIRO Sustainable Ecosystems Collaborators: Dane Thomas (Forests NSW) and Dave Carr (Greening Australia) Project Duration: 15 October 2005 – 1 August 2007 Final Report Due Date: 31 July 2007 Report prepared by: Heather McGinness and Sonia Graham, July 2007 Cover Photograph: Tree planting at Melrose in NSW, photo by Greening Australia
Acknowledgements The authors would like to take this opportunity to thank the MCVP for their financial support. Our team comprised: Sonia Graham, Heather McGinness, Deborah O’Connell, Neil Huth, Brett Cocks, and Peter Carberry (CSIRO Sustainable Ecosystems). Collaboration with Dane Thomas of NSW Forests, and Greening Australia staff - Dave Carr, Sue Streatfield, Hayden Burgess, Tim Emmott, Justine Watt, and Anne Brown - was invaluable. Project inception and scoping involved Mark Howden (CSE), John Carter (QDNRM), Steve Crimp (QDNRM), and Paul Brennan (FNSW).

2
2. ABSTRACT
This project aimed to provide information enabling revegetation providers and commercial forestry operations across Australia to improve on-the-ground establishment outcomes. Through experiments, data collection, modelling and community consultation, it has identified key strategies that reduce the risk of establishment failure from adverse climatic conditions. These are dominated by the primary strategy of ensuring adequate initial (at-planting) soil moisture via effective forward-planning and site management. This includes the use of best-practice planning and management techniques such as ground preparation (e.g. ripping), weed control (pre- and post-planting), mulching, and watering at planting (if necessary). Correct timing of preparation is crucial – the further in advance of planting, the greater the effectiveness. Detailed knowledge of the site and soil type is also beneficial, including water holding capacity and nutrient status. Finally, wise species choice is a key determinant of success. Eucalypt seedlings are resilient and use multiple strategies to survive climatic risks such as drought, however some species are more sensitive than others. This research found that the utility of seasonal climate forecast (SCF) information for revegetation tubestock planting is currently limited by short lead times and lack of accuracy. Revegetation practitioners typically require lead times of >3 months, ideally >1 year, usually plant in Autumn or Spring, and prefer accuracy of >80%. Seasonal climate forecasts currently have lowest accuracy for: a) >3 month lead times; b) the south and west of the continent (where much revegetation currently occurs); and c) Autumn. The usefulness of forecasting is outweighed by the usefulness of effective site management for soil moisture conservation, in reducing the impacts of climate variability. However SCF may be useful under certain circumstances and for particular users. For example, ‘last-minute’ practitioners who prepare for their planting <3 months ahead may find forecasts useful - however this is not best management practice. Direct seeding or facilitation of natural regeneration may also benefit from SCF because of their more flexible decision-making structures. Overall, best practice planting and management techniques currently reduce risk of tubestock establishment failure more than use of seasonal climate forecasts.
3. PROJECT OBJECTIVES
The overall goal of this project was to enable revegetation providers and commercial forestry operations across Australia to improve on-the-ground establishment outcomes. Sub-objectives were: • Define strategies to reduce risk of unsuccessful establishment and to predict occurrence of
conditions that are conducive to successful establishment by using seasonal climate forecasting • Identify barriers and synergies to the use of this information and engage the revegetation and
commercial planting industries to provide pathways for faster adoption • Communicate the results extensively in the three regions proposed (Victoria, South and Western
Australia), by consultation with catchment authorities and via other avenues.
4. METHODS
This project comprised the following phases: • Regional data collection (seedling survival, soil moisture and site preparation) – with Greening
Australia (landholder sites in WA, VIC, SA) and Forests NSW (north-east NSW) • Intensive field experiments investigating detailed relationships between eucalypt seedling
survival and growth and soil moisture – a) at Gungahlin ACT and b) at Wellcamp QLD • Model development – APSIM (Agricultural Production Systems SIMulator eucalypt seedling
module); and BBNs (Bayesian Belief Networks examining the utility of seasonal climate forecasts)
• Workshop presentation and feedback – road-testing results and models with practitioners, and identifying barriers and synergies to the use of models and climate forecasting information

3
The results of each of these phases is summarised in relation to the objectives of the project in the following pages. Detailed results are presented in the Appendices.
5. SUMMARY OF RESULTS
5.1 Introduction: Enabling revegetation providers and commercial forestry operations to improve on-ground revegetation outcomes Enormous effort is being made to plant trees and shrubs across Australia for a range of reasons, including economic gains and ecosystem services such as timber production, salinity amelioration, carbon sequestration, aesthetic appeal, and biodiversity enhancement. This effort is unlikely to wane in the foreseeable future given the huge scale of areas projected by the National Land and Water Audit to be affected by salinity, the ongoing need for diversification of farm income, and the growing recognition of the need to re-establish vegetation to replace that in areas cleared. It is important to maximise the efficiency of such investment. This project is aimed at tree planting activities which are at least partly supported by public funding or achieving public-good goals, as well as commercial forestry plantings. Improvement of our knowledge of the determinants of on-the-ground establishment outcomes demands that we first address the data gaps that exist on tree establishment in relation to interactions between site conditions, climate and management. Hence, at the core of this project were field experiments and a model which were designed to provide the data required to assess the feasibility of using seasonal climate forecasts in planning successful planting programs.
5.2 Defining strategies to reduce risk of unsuccessful establishment Drought induced mortality of seedlings is affected by the interplay between water supply and demand. The amount of water available to seedlings will depend on rainfall occurring during the establishment phase and the amount of water stored in the soil prior to planting. When making planting decisions to minimise the risk of planting failure, land managers can choose planting windows to maximise the likelihood of rainfall after planting and to minimise the evaporation rates experienced by the seedlings. Ground preparation prior to planting can be employed to store moisture during a preceding fallow period to reduce reliance on rainfall in variable climates. The way in which the seedlings respond to these methods of managing risk may depend on the particular growth characteristics of the species being planted, and so recommendations for planting windows and ground preparation may need to consider species characteristics. Overall, this project has found that the most effective strategy to reduce risk is ensuring adequate initial (at-planting) soil moisture, via effective planning and management. This includes: • Use of best-practice planning and management techniques:
- Ground preparation (e.g. ripping) - Weed control (pre- and post-planting) - Mulching and watering (if necessary and practical)
• Correct timing of ground preparation and weed control is crucial – the further in advance of planting, the greater the effectiveness
• Knowing your site and soil type, including its water holding capacity and nutrient status • Wise species choice - eucalypt seedlings are resilient and use multiple strategies to survive
climatic risks such as drought, including rapid root extension and leaf ‘shut-down’ mechanisms – however some species are more sensitive than others.
Intensive experiments at Gungahlin ACT and Wellcamp QLD, regional data collection, and modelling emphasised the overriding influence of stored (initial) soil moisture. Soil moisture level at planting is a primary determinant of tubestock establishment success. In particular:

4
- Soil moisture is the underlying (and under-appreciated) driver of most well-known best practice management techniques (e.g. weed control, soil preparation)
- Small differences in soil moisture at planting can produce large differences in tubestock growth and survival, if rainfall following planting is low or variable
- Consequently risk management should focus on conservation of soil moisture before, during and after planting
At Gungahlin seedling survival was high (84-96%). The seedlings were planted into a soil profile that was artificially filled with water. This experiment indicated that planting seedlings into such a situation virtually guarantees their success, at least until frosts occur. Minor species differences were observed in terms of survival, growth, and ecophysiological response to artificial drought. The more drought-tolerant, inland species (Eucalyptus melliodora) allocated more resources to below-ground production (root growth); while the drought-sensitive, coastal species (Eucalyptus pilularis) allocated its resources primarily to above-ground production. At Wellcamp, relatively small differences in initial soil moisture levels were demonstrated to have significant effects upon survival and growth of two species (E. melliodora and E. populnea) . The data showed that with small increases in planting moisture seedlings are able to maintain signs of an actively growing canopy for longer; ie. seedlings are able to maintain health for longer periods before showing signs of mortality when even small amounts of extra water are available. This is because of the ability of these seedlings to quickly establish their root systems to make use of any deeper soil moisture. The root extraction front velocity for these species was sufficient to allow access to deeper moisture over relatively short periods. E. melliodora was again shown to be very drought tolerant with only the driest treatments showing significant mortality after several months. Mortality rates for E. populnea were even lower with only the very driest treatment showing drought induced death. The results of our regional data collection on farmer sites displayed excellent survival (69-100%). This was attributed to sufficient soil moisture at planting, follow-up rainfall, and the use of effective management techniques such as weed control (all sites), ground preparation (all sites) and watering at planting (some sites). Survival at the forestry sites was much more variable (25-97%), and at these sites appeared to be indirectly related to soil moisture through variables such as site, species, planting date and aspect, with easterly aspects performing the best. Unfortunately, the usefulness of the soil moisture samples taken for the regional and forestry monitoring was limited by a lack of soil bulk density data, preventing conversion of gravimetric measurements to volumetric measurements for direct comparisons and data interpretation. Nevertheless, the regional and forestry data support the strategy developed from the intensive experiments, indicating the importance of site preparation, site and species choice for ensuring adequate soil moisture supply.
5.3 Predicting occurrence of conditions that are conducive to successful establishment using climate forecasting Seedling establishment entails a certain amount of risk due to climate variability, particularly in low rainfall zones where many new plantings are occurring. Poor establishment is costly and can sap confidence, significantly reducing the social capital of participants. Studies overseas have shown that the probability of tree and shrub establishment is strongly linked to large-scale climatic events such as the El Niño and La Niña phases of the ENSO system (Curran et al. 1999). In Australia, the one published study to date has shown the importance of such events for pasture legumes (Menke et al. 1999) with the probability of successful establishment ranging from 1% in El Niño conditions to 70% in La Niña conditions. It has been suggested that there may be some value in using seasonal climate forecasts in planting decisions to minimise establishment risks (Howden et al. 2004), especially since the benefits of forecasts in decision-making have been demonstrated previously in terms of agricultural production (Hammer et al. 1996). This project tests this idea by linking field
5
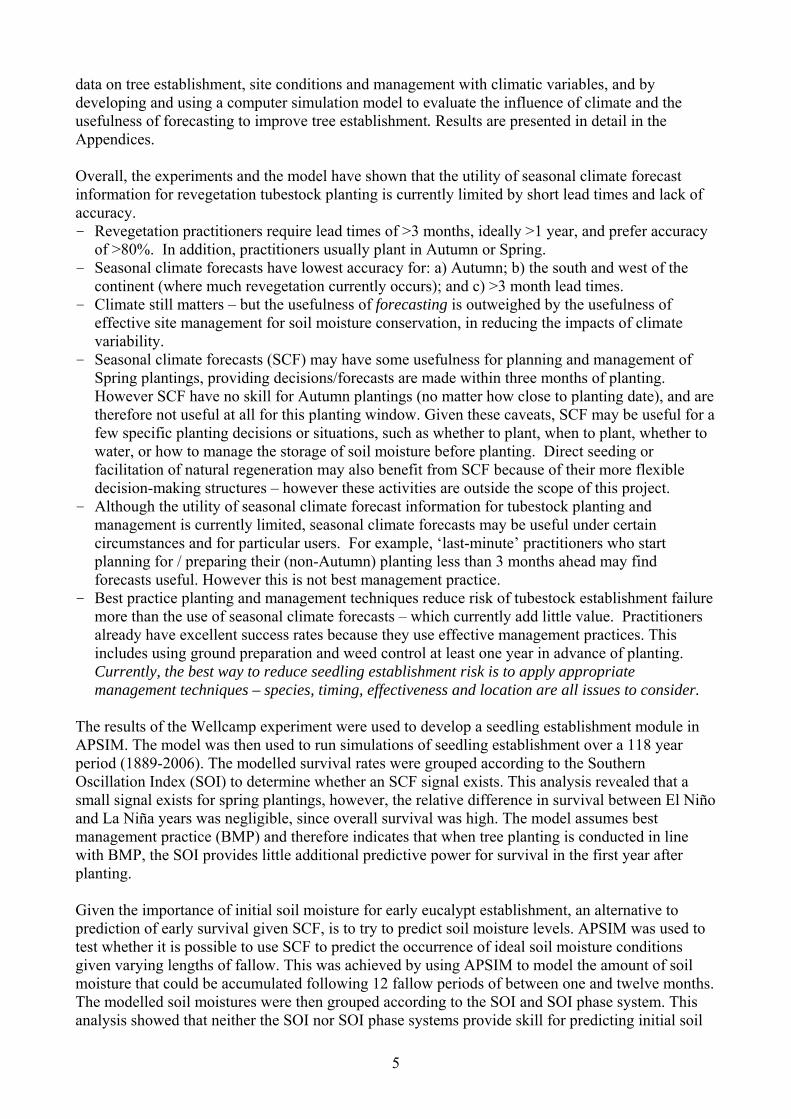
data on tree establishment, site conditions and management with climatic variables, and by developing and using a computer simulation model to evaluate the influence of climate and the usefulness of forecasting to improve tree establishment. Results are presented in detail in the Appendices. Overall, the experiments and the model have shown that the utility of seasonal climate forecast information for revegetation tubestock planting is currently limited by short lead times and lack of accuracy. - Revegetation practitioners require lead times of >3 months, ideally >1 year, and prefer accuracy
of >80%. In addition, practitioners usually plant in Autumn or Spring. - Seasonal climate forecasts have lowest accuracy for: a) Autumn; b) the south and west of the
continent (where much revegetation currently occurs); and c) >3 month lead times. - Climate still matters – but the usefulness of forecasting is outweighed by the usefulness of
effective site management for soil moisture conservation, in reducing the impacts of climate variability.
- Seasonal climate forecasts (SCF) may have some usefulness for planning and management of Spring plantings, providing decisions/forecasts are made within three months of planting. However SCF have no skill for Autumn plantings (no matter how close to planting date), and are therefore not useful at all for this planting window. Given these caveats, SCF may be useful for a few specific planting decisions or situations, such as whether to plant, when to plant, whether to water, or how to manage the storage of soil moisture before planting. Direct seeding or facilitation of natural regeneration may also benefit from SCF because of their more flexible decision-making structures – however these activities are outside the scope of this project.
- Although the utility of seasonal climate forecast information for tubestock planting and management is currently limited, seasonal climate forecasts may be useful under certain circumstances and for particular users. For example, ‘last-minute’ practitioners who start planning for / preparing their (non-Autumn) planting less than 3 months ahead may find forecasts useful. However this is not best management practice.
- Best practice planting and management techniques reduce risk of tubestock establishment failure more than the use of seasonal climate forecasts – which currently add little value. Practitioners already have excellent success rates because they use effective management practices. This includes using ground preparation and weed control at least one year in advance of planting. Currently, the best way to reduce seedling establishment risk is to apply appropriate management techniques – species, timing, effectiveness and location are all issues to consider.
The results of the Wellcamp experiment were used to develop a seedling establishment module in APSIM. The model was then used to run simulations of seedling establishment over a 118 year period (1889-2006). The modelled survival rates were grouped according to the Southern Oscillation Index (SOI) to determine whether an SCF signal exists. This analysis revealed that a small signal exists for spring plantings, however, the relative difference in survival between El Niño and La Niña years was negligible, since overall survival was high. The model assumes best management practice (BMP) and therefore indicates that when tree planting is conducted in line with BMP, the SOI provides little additional predictive power for survival in the first year after planting. Given the importance of initial soil moisture for early eucalypt establishment, an alternative to prediction of early survival given SCF, is to try to predict soil moisture levels. APSIM was used to test whether it is possible to use SCF to predict the occurrence of ideal soil moisture conditions given varying lengths of fallow. This was achieved by using APSIM to model the amount of soil moisture that could be accumulated following 12 fallow periods of between one and twelve months. The modelled soil moistures were then grouped according to the SOI and SOI phase system. This analysis showed that neither the SOI nor SOI phase systems provide skill for predicting initial soil

6
moistures for an autumn planting with a one, three and six month lead time. For spring plantings the SOI provided no skill up to six months ahead of planting, while the SOI phase system possessed skill up to four months ahead of planting. The model results re-emphasise the importance of conducting pre-planting management such as weed control to encourage accumulation of soil moisure, with longer fallows being more likely to result in ideal soil moisture conditions. In another set of simulations, seedlings of each species were planted at the middle of each month and survival was evaluated six months after this date. A range of planting moisture conditions (30, 60 and 90 mm of plant available soil water) were simulated for each planting to see if increased moisture at planting could provide a method for minimising the risk of planting failure within a variable climate. Simulations were run across three sites with similar mean annual rainfall but differing in the distribution of rainfall throughout the year. At all sites there is a risk of planting failure due to frequent extended dry periods. However the results indicated that these risks can be managed via the storage of about 90 mm of soil moisture through fallowing prior to planting. Although climate influences survival more strongly for (unwise) summer plantings in locations with strongly winter dominant rainfall patterns, and where rainfall rates are low and evaporation rates are very high, planting windows exist for which the chances of failure are relatively low. The planting window for the more drought-tolerant species is somewhat wider for the drier sites and the levels of mortality are generally lower, suggesting that species-specific planting rules may need to be developed. Overall, stored soil moisture enables managers to minimise the effect of both species and climate variability on establishment success.
5.4 Identifying barriers and synergies to the use of seasonal climate forecasting The following outline of barriers and synergies to the use of seasonal climate forecasting in planting practice was developed from our collaboration with planting practitioners, feedback from workshops and field days, and surveys from related work (Graham et al. 2006; Graham 2007; Graham et al. 2007b).
Barriers to Adoption I. Mismatch between SCF lead times and stakeholder information needs
There is a mismatch between when SCF have predictive capacity and when information is required by landholders, revegetation practitioners and nurseries.
Placing orders
- Best practice tree planting techniques with emphasis on planting local provenances require landholders and practitioners to place orders for seedlings between three and twelve months ahead of planting.
- Nurseries begin preparing seedlings a minimum of three months ahead of the autumn plantings and at least five months ahead of spring plantings
- SCF capability: Australia’s two accessible forecast schemes (BOM and QDNRMW) provide three month outlooks for rainfall up to one week before the forecast period. However, SCF derived from sea surface temperatures (e.g. BOM) have no skill for forecasting autumn rainfall (McIntosh pers. comm.). Some skill exists for forecasting spring rainfall, however this information is only available up to three months ahead of the forecast period which is inadequate for meeting the majority of stakeholder needs.
Site preparation - Best practice tree planting involves conducting ground preparation ahead of planting. Ground
preparation is begun between one week and eight years ahead of planting. - Best practice tree planting requires weed control to be conducted well ahead of planting. Weed
control is begun between one day and five years ahead of planting.

7
- SCF capability: As mentioned above SCF are only available up to three months ahead of spring plantings. This means that SCF may only be useful for informing site preparation for people who do not plant in autumn and who conduct their site preparation within three months of planting.
II. Uncertainty surrounds the skill available in seasonal climate forecasts
There is much uncertainty within the scientific community as to how to communicate the level of forecast skill that is contained within seasonal climate forecasts. This uncertainty is reflected in planting practitioner attitudes towards SCF with references to insufficient accuracy being frequently cited as factor which affects SCF use.
III. Climate is not perceived to be the most important factor influencing seedling survival
Site preparation is perceived to be the most important factor affecting the success of plantings; by engaging in site preparation stakeholders can mitigate the effects of climate at both weed control and ground preparation act to increase the soil moisture in the profile.
Synergies to Adoption I. Optimism regarding the potential of SCF
Despite limitations regarding SCF skill and lead times there is considerable optimism regarding the potential use of SCF. It is perceived that it would be particularly useful for predicting extreme dry periods as this would allow people to reconsider whether they should plant at all.
II. Useful for short timeframes
While best practice tree planting techniques recommend ordering seedlings and conducting site preparation well ahead of planting, there are a number of landholders and practitioners who are unable to prepare so far in advance due to other commitments and funding arrangements. For these people SCF may prove useful as skill lies within three months of spring plantings.
III. Direct seeding and regeneration
Direct seeding and regeneration involve smaller investments of time and resources than tubestock planting, are much more susceptible to climatic conditions at planting, and are not constrained by the requirement to order seedlings many months in advance of planting. Therefore SCF may prove more useful for direct seeding and regeneration than tree planting.
5.5 Engaging the revegetation and commercial planting industries to provide pathways for adoption Engagement with revegetation and forestry practitioners through forestry and farmer trials, workshops and presentations during this project was productive, particularly in terms of providing ‘perspective’. These activities encouraged the project to re-examine its logic, and first establish whether SCF is currently useful for these industries, before presuming to promote pathways for adoption. As part of this process, important issues were raised that have considerable impact upon the success of revegetation in both the short and long term. These included:
Flexibility and adaptive choices are needed - in terms of policy/funding, utilisation of new knowledge, and management practices. There is an often-repeated but as-yet poorly documented view that there is considerable inefficient expenditure on vegetation establishment. This occurs during unfavourable climatic conditions due to imposed budgetary timetables, when the expenditure or plantings may be better postponed to a more suitable time. The policy and institutional constraints that restrict more rational expenditure procedures include: - Current funding arrangements indirectly promote inefficient revegetation practices, via a) short
timeframes within which funding must be spent, and b) funding announcements being made out of sync with planting windows.

8
- Current funding arrangements do not take into account who bears the risk of unfavourable climatic conditions, such as drought (e.g. nurseries).
Best management practice techniques should be mandatory in order for planting proposals to receive funding, but must be tailored to the area in which planting is planned.
Progressive adaptation of planting practices and technology to climate variability will help to facilitate adaptation to long-term climate change. - This will require effective local and scientific knowledge dissemination. - There are knowledge gaps regarding the mechanisms driving successful seedling establishment.
However knowledge gaps provide no cause for inaction in terms of planting – best management practice still ensures good success rates.
6. OUTPUT COMMUNICATION AND ADOPTION
These strategies to reduce risk, and analyses of the utility of seasonal climate forecasts, together with the barriers and synergies to the use of this information, have been communicated to a range of revegetation and forestry practitioners and scientists through workshops, field days, and meetings. A field day on 28th July 2006 at Wellcamp displayed the experimental site, presented key results and discussed their implications. This day produced good feedback, and was followed-up by a radio interview discussing the research. The key messages are straightforward, however in terms of communication the detailed experimental results and models themselves are not targeted toward wider distribution among on-ground planting practitioners. Taking this into consideration, a significant achievement in terms of output communication during this project involved the running of a workshop on the utility of seasonal climate forecasting for tree establishment. The workshop was held in February 2007 and was attended by a range of revegetation practitioners, landholders and scientists. The day was run interactively and required significant planning and organisation, including preparation of presentations, compilation of a workshop booklet, and general logistics. Its aims were to present the results of the project; road-test the models; explore the “barriers to adoption” of this knowledge and of seasonal climate forecasting; and explore pathways forward, documenting gaps between these pathways and current knowledge and methods The organisations represented by the participants included: Greening Australia (3), Environment ACT (2), Forests NSW (3), Upper Murrumbidgee Catchment Coordinating Committee (1), CSIRO (1), ENSIS (1), and independent landholders (3). The workshop was a success, with stimulating discussion and positive feedback from all who attended.
7. ASSESSMENT OF COMMERCIAL POTENTIAL
This research is concerned with knowledge-generation; no commercial potential has been identified.
8. PUBLICATIONS AND ADDITIONAL INFORMATION
The primary refereed journal publication planned from this work is: Huth, N.I., Carberry, P.S. Cocks, B., Graham, S., McGinness, H.M., O’Connell, D.A. (2007) Managing drought risk in seedling establishment: an analysis using experiment and model [in prep]. This paper is currently in draft form and will be submitted to the international journal Forest Ecology and Management. For further information, please contact: Heather McGinness CSIRO Sustainable Ecosystems, GPO Box 284 Canberra ACT Australia 2601 Ph: +61 2 62421701, Email: [email protected]
9
9. APPENDICES: DETAILED RESULTS
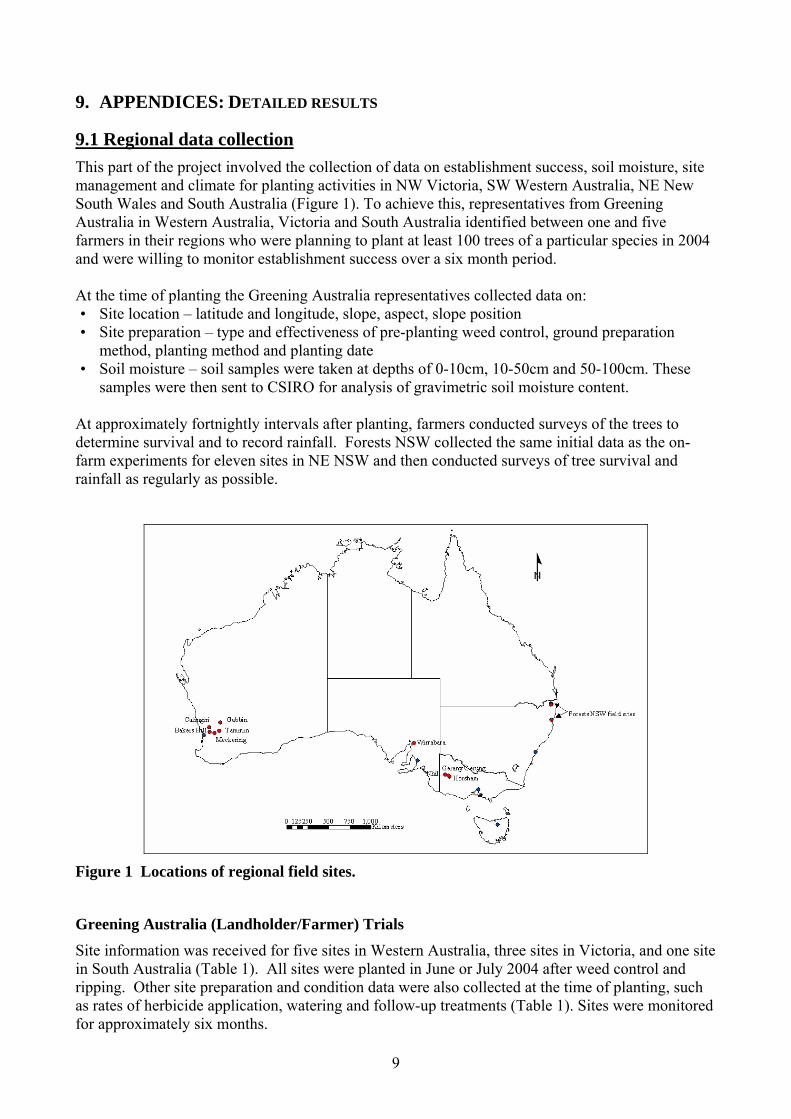
9.1 Regional data collection This part of the project involved the collection of data on establishment success, soil moisture, site management and climate for planting activities in NW Victoria, SW Western Australia, NE New South Wales and South Australia (Figure 1). To achieve this, representatives from Greening Australia in Western Australia, Victoria and South Australia identified between one and five farmers in their regions who were planning to plant at least 100 trees of a particular species in 2004 and were willing to monitor establishment success over a six month period. At the time of planting the Greening Australia representatives collected data on: • Site location – latitude and longitude, slope, aspect, slope position • Site preparation – type and effectiveness of pre-planting weed control, ground preparation
method, planting method and planting date • Soil moisture – soil samples were taken at depths of 0-10cm, 10-50cm and 50-100cm. These
samples were then sent to CSIRO for analysis of gravimetric soil moisture content. At approximately fortnightly intervals after planting, farmers conducted surveys of the trees to determine survival and to record rainfall. Forests NSW collected the same initial data as the on-farm experiments for eleven sites in NE NSW and then conducted surveys of tree survival and rainfall as regularly as possible.
Figure 1 Locations of regional field sites.
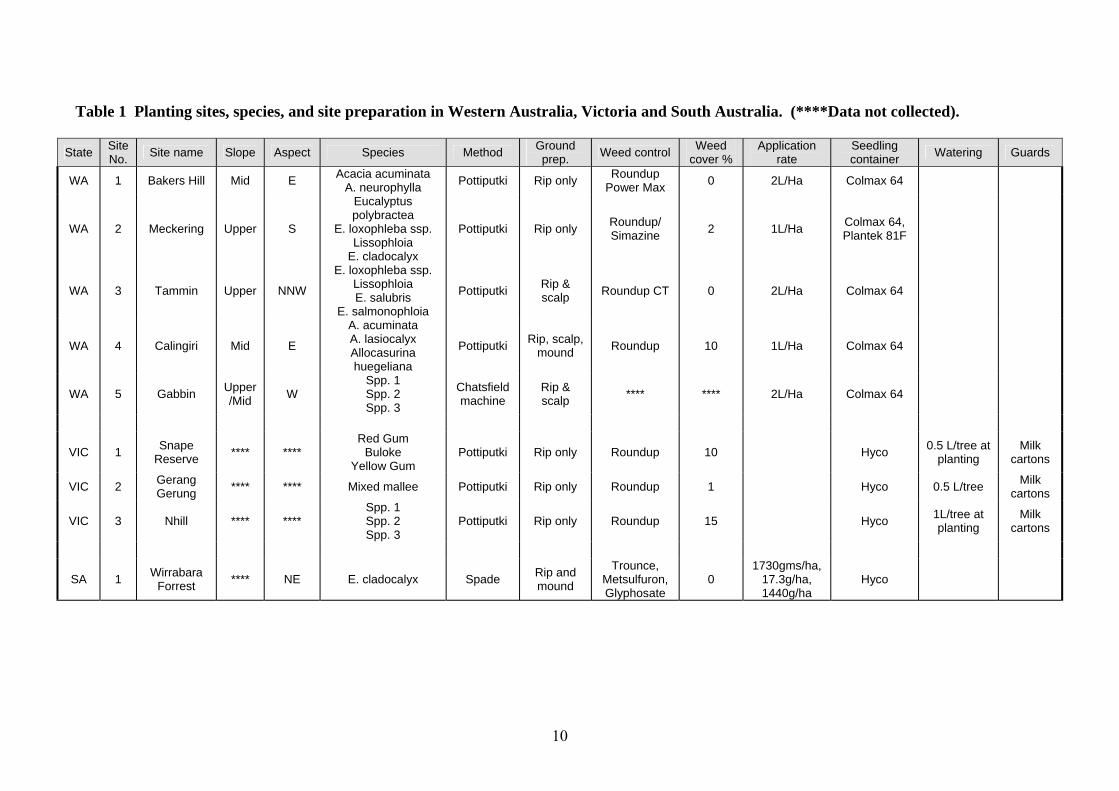
Greening Australia (Landholder/Farmer) Trials Site information was received for five sites in Western Australia, three sites in Victoria, and one site in South Australia (Table 1). All sites were planted in June or July 2004 after weed control and ripping. Other site preparation and condition data were also collected at the time of planting, such as rates of herbicide application, watering and follow-up treatments (Table 1). Sites were monitored for approximately six months.
10
Table 1 Planting sites, species, and site preparation in Western Australia, Victoria and South Australia. (****Data not collected).
State Site No. Site name Slope Aspect Species Method Ground
prep. Weed control Weed cover %
Application rate
Seedling container Watering Guards
WA 1 Bakers Hill Mid E Acacia acuminata A. neurophylla Pottiputki Rip only Roundup
Power Max 0 2L/Ha Colmax 64
WA 2 Meckering Upper S
Eucalyptus polybractea
E. loxophleba ssp. Lissophloia
E. cladocalyx
Pottiputki Rip only Roundup/ Simazine 2 1L/Ha Colmax 64,
Plantek 81F
WA 3 Tammin Upper NNW
E. loxophleba ssp. Lissophloia E. salubris
E. salmonophloia
Pottiputki Rip & scalp Roundup CT 0 2L/Ha Colmax 64
WA 4 Calingiri Mid E
A. acuminata A. lasiocalyx Allocasurina huegeliana
Pottiputki Rip, scalp, mound Roundup 10 1L/Ha Colmax 64
WA 5 Gabbin Upper/Mid W
Spp. 1 Spp. 2 Spp. 3
Chatsfield machine
Rip & scalp **** **** 2L/Ha Colmax 64
VIC 1 Snape Reserve **** ****
Red Gum Buloke
Yellow Gum Pottiputki Rip only Roundup 10 Hyco 0.5 L/tree at
planting Milk
cartons
VIC 2 Gerang Gerung **** **** Mixed mallee Pottiputki Rip only Roundup 1 Hyco 0.5 L/tree Milk
cartons
VIC 3 Nhill **** **** Spp. 1 Spp. 2 Spp. 3
Pottiputki Rip only Roundup 15 Hyco 1L/tree at planting
Milk cartons
SA 1 Wirrabara Forrest **** NE E. cladocalyx Spade Rip and
mound
Trounce, Metsulfuron, Glyphosate
0 1730gms/ha,
17.3g/ha, 1440g/ha
Hyco

11
Seedling survival
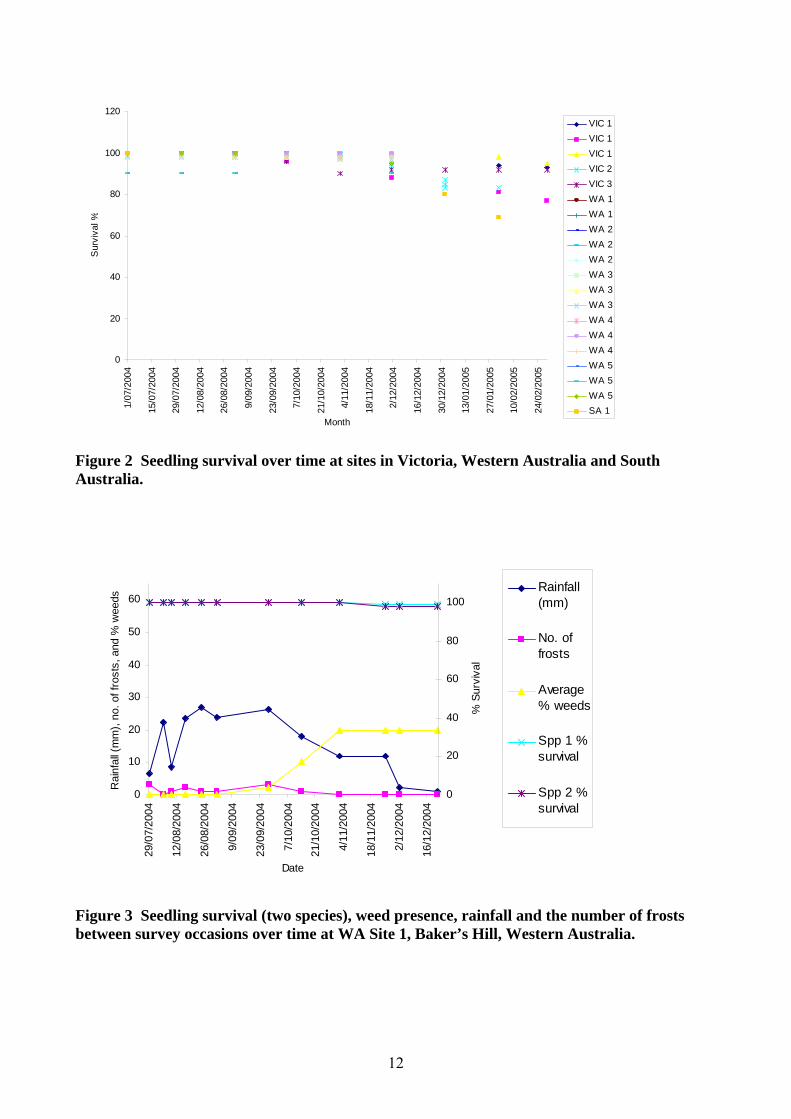
Seedling survival at the farmer sites was high (69-100%) in all areas for which data were collected (Figure 2; Table 2). This is despite variation in species, rainfall, weed presence, and frost incidence over time and between sites (e.g. Figure 3; Table 3). The relatively high initial soil moisture levels, together with the follow-up rainfall that occurred over the six months that were monitored, was apparently sufficient to ensure survival in most cases. These results have implications for our ability to interpret and predict the effects of climate. The low mortalities at all sites and for each species provided no correlation with climate factors; when this is attempted with the sparse data available, the relationships are not informative.
Table 2 Average final survival of each species monitored.
Species Average final survival (%) Eucalyptus polybractea 100 Acacia lasiocalyx 100 Acacia acuminata 99.5 Eucalyptus loxophelba ssp. lissophloia 99 Eucalyptus salubris 97 Eucalyptus salmonophloia 97 Acacia assimilis 95 Yellow Gum 95 Acacia neurophylla 94 Allocasurina huegeliana 94 Red Gum 93 Eucalyptus cladocalyx 84.5 Mixed mallee 83 Buloke 77
12
0
20
40
60
80
100
120
1/07
/200
4
15/0
7/20
04
29/0
7/20
04
12/0
8/20
04
26/0
8/20
04
9/09
/200
4
23/0
9/20
04
7/10
/200
4
21/1
0/20
04
4/11
/200
4
18/1
1/20
04
2/12
/200
4
16/1
2/20
04
30/1
2/20
04
13/0
1/20
05
27/0
1/20
05
10/0
2/20
05
24/0
2/20
05
Month
Sur
viva
l %
VIC 1VIC 1VIC 1VIC 2VIC 3WA 1WA 1WA 2WA 2WA 2WA 3WA 3WA 3WA 4WA 4WA 4WA 5WA 5WA 5SA 1
Figure 2 Seedling survival over time at sites in Victoria, Western Australia and South Australia.
0
10
20
30
40
50
60
29/0
7/20
04
12/0
8/20
04
26/0
8/20
04
9/09
/200
4
23/0
9/20
04
7/10
/200
4
21/1
0/20
04
4/11
/200
4
18/1
1/20
04
2/12
/200
4
16/1
2/20
04
Date
Rai
nfal
l (m
m),
no. o
f fro
sts,
and
% w
eeds
0
20
40
60
80
100
% S
urvi
val
Rainfall(mm)
No. offrosts
Average% weeds
Spp 1 %survival
Spp 2 %survival
Figure 3 Seedling survival (two species), weed presence, rainfall and the number of frosts between survey occasions over time at WA Site 1, Baker’s Hill, Western Australia.

13
Table 3 Final survival (%) and major climate-related factors at each site.
State Site No. Final survival (%) Total rainfall (mm)
Total # of frosts Initial soil moisture (gravimetric)
0-10cm 10-50cm 50-100cm WA 1 99 183.5 12 24.7 10.9 11.1
98 183.5 12 24.7 10.9 11.1 WA 2 100 143 10 8.4 9.5 9.3
100 143 10 8.4 9.5 9.3 100 143 10 8.4 9.5 9.3
WA 3 98 113 12 16.8 18.2 16.8 97 113 12 16.8 18.2 16.8 97 113 12 16.8 18.2 16.8
WA 4 100 120 8 18.2 8.8 9.8 100 120 8 18.2 8.8 9.8 98 120 8 18.2 8.8 9.8
WA 5 90 91.4 5 5.6 7.9 6.7 90 91.4 5 5.6 7.9 6.7 95 91.4 5 5.6 7.9 6.7
VIC 1 93 166 24.7 24.7 28.7 77 166 24.7 24.7 28.7 95 166 24.7 24.7 28.7
VIC 2 83 222 5 27.7 26.3 26 VIC 3 92 299 11 7.9 15.2 20.7
100 299 11 7.9 15.2 20.7 100 299 11 7.9 15.2 20.7
SA 1 69 375 28.41
14
Soil moisture
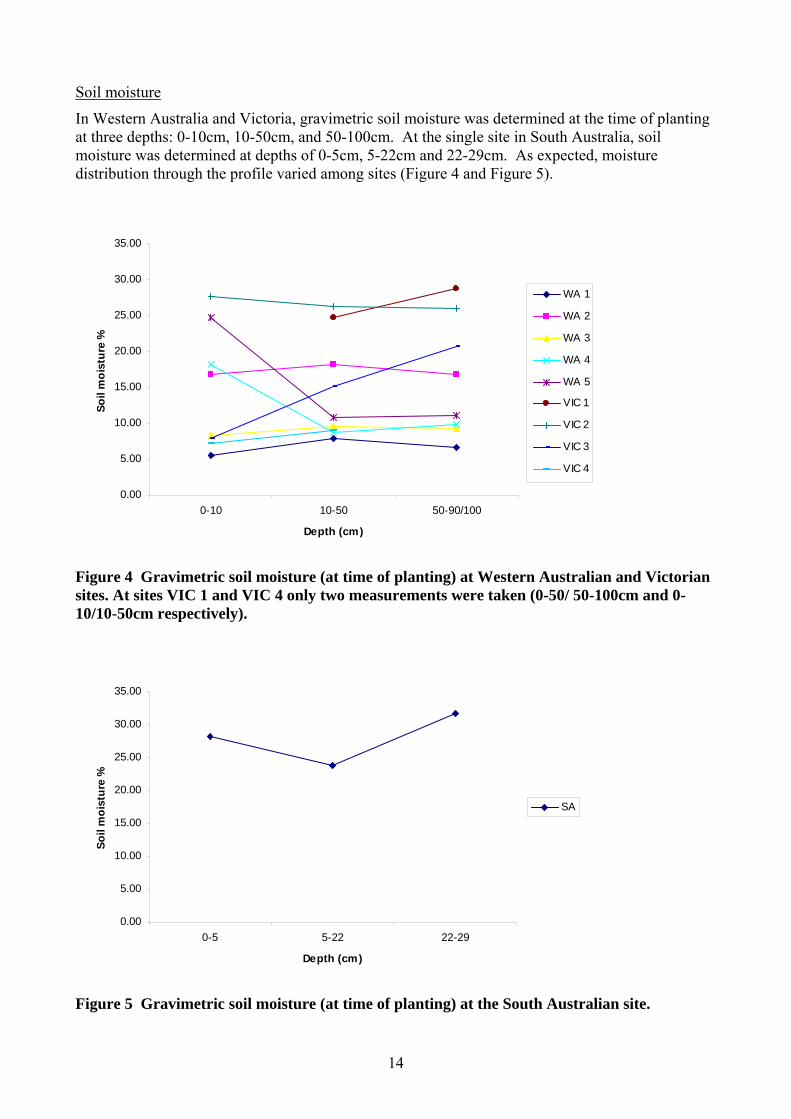
In Western Australia and Victoria, gravimetric soil moisture was determined at the time of planting at three depths: 0-10cm, 10-50cm, and 50-100cm. At the single site in South Australia, soil moisture was determined at depths of 0-5cm, 5-22cm and 22-29cm. As expected, moisture distribution through the profile varied among sites (Figure 4 and Figure 5).
0.00
5.00
10.00
15.00
20.00
25.00
30.00
35.00
0-10 10-50 50-90/100
Depth (cm)
Soil
moi
stur
e %
WA 1
WA 2
WA 3
WA 4
WA 5
VIC 1
VIC 2
VIC 3
VIC 4
Figure 4 Gravimetric soil moisture (at time of planting) at Western Australian and Victorian sites. At sites VIC 1 and VIC 4 only two measurements were taken (0-50/ 50-100cm and 0-10/10-50cm respectively).
0.00
5.00
10.00
15.00
20.00
25.00
30.00
35.00
0-5 5-22 22-29
Depth (cm)
Soil
moi
stur
e %
SA
Figure 5 Gravimetric soil moisture (at time of planting) at the South Australian site.

15
Forests NSW Trials Data was collected by NSW Forests at three plantations in northern NSW, with three to four sites at each (total of 11 sites; Table 4). Eucalyptus pilularis was planted at 6 sites, Corymbia variegata was planted at 4 sites, and Eucalyptus dunnii was planted at 1 site. Most sites contain several plots – data from these has been averaged for this report to produce a single value for each site. Site preparation was generally uniform across sites. Initial soil moisture samples (to 1m) were taken at each site, with some follow-up samples also taken. Rainfall and survival data was collected at semi-regular intervals over a six month period.
Table 4 NSW Forests planting sites, species and preparation.
Plantation Site name
No. of plots Slope Aspect Species Planting
method Ground
Prep.
Weed Cover
% Tuckers Knob NSW 1 3 Lower W Eucalyptus
pilularis PotiPuki 0.7m Rip + Mound 80
NSW 2 3 Mid W E.pilularis PotiPuki 0.7m Rip + Mound 80
NSW 3 2 Lower NE E.pilularis PotiPuki 0.7m Rip + Mound 80
NSW 4 3 Mid W E.pilularis PotiPuki 0.7m Rip + Mound 80
ROTH01 NSW 5 3 Upper NW Corymbia
citriodora ssp. variegata
PotiPuki 0.7m Rip + Mound 5
NSW 6 1 Mid S C.variegata PotiPuki 0.7m Rip + Mound 5
NSW 7 3 Lower E E.dunnii PotiPuki 0.7m Rip + Mound 5
Banyabba NSW 8 4 Mid E E.pilularis PotiPuki 0.7m Rip + Mound 10
NSW 9 4 Mid E C.variegata PotiPuki 0.7m Rip + Mound 10
NSW 10 5 Mid E E.pilularis PotiPuki 0.7m Rip + Mound 10
NSW 11 5 Mid E C.variegata PotiPuki 0.7m Rip + Mound 10
Seedling survival
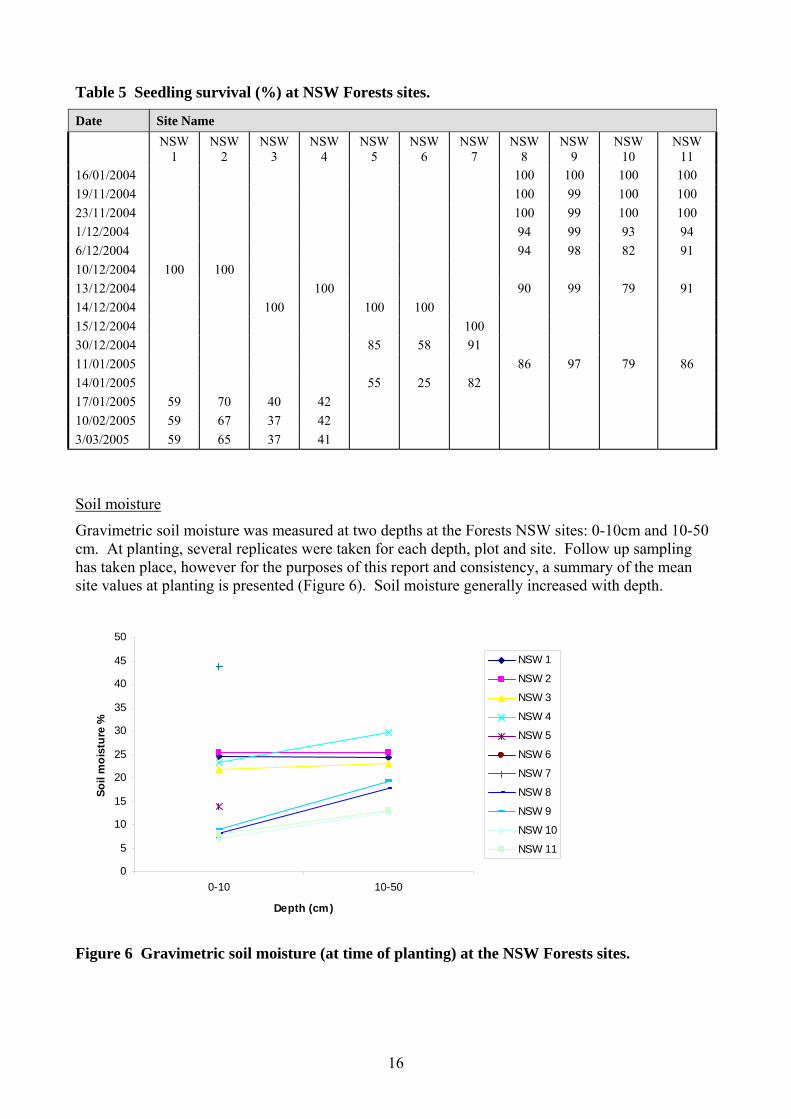
The Forests NSW trials resulted in variable seedling survival (Table 5). Overall, there was substantially higher mortality than that observed at the farmer sites. In addition, sites planted in December 2004 appear to have suffered greater mortalities than sites planted in January 2004. Survival for each species ranged from 37-79% (E. pilularis), to 25-97% (C. variegata), to 82% (E. dunnii). Survival appeared to be unrelated to initial or follow up gravimetric soil moisture; however it did appear to be affected by site, species, planting date and aspect, with easterly aspects performing the best.
16
Table 5 Seedling survival (%) at NSW Forests sites.
Date Site Name
NSW 1
NSW 2
NSW 3
NSW 4
NSW 5
NSW 6
NSW 7
NSW 8
NSW 9
NSW 10
NSW 11
16/01/2004 100 100 100 100 19/11/2004 100 99 100 100 23/11/2004 100 99 100 100 1/12/2004 94 99 93 94 6/12/2004 94 98 82 91 10/12/2004 100 100 13/12/2004 100 90 99 79 91 14/12/2004 100 100 100 15/12/2004 100 30/12/2004 85 58 91 11/01/2005 86 97 79 86 14/01/2005 55 25 82 17/01/2005 59 70 40 42 10/02/2005 59 67 37 42 3/03/2005 59 65 37 41
Soil moisture
Gravimetric soil moisture was measured at two depths at the Forests NSW sites: 0-10cm and 10-50 cm. At planting, several replicates were taken for each depth, plot and site. Follow up sampling has taken place, however for the purposes of this report and consistency, a summary of the mean site values at planting is presented (Figure 6). Soil moisture generally increased with depth.
0
5
10
15
20
25
30
35
40
45
50
0-10 10-50
Depth (cm)
Soil
moi
stur
e %
NSW 1
NSW 2
NSW 3
NSW 4
NSW 5
NSW 6
NSW 7
NSW 8
NSW 9
NSW 10
NSW 11
Figure 6 Gravimetric soil moisture (at time of planting) at the NSW Forests sites.

17
Summary The farmer and forestry trials generally demonstrated good survival for the period of monitoring. Good survival was attributed to good management practices, adequate initial soil water conditions, and favourable climate conditions experienced during the establishment period. Unfortunately, the usefulness of the soil moisture samples taken for the regional and forestry monitoring was limited by a lack of soil bulk density data, preventing conversion of gravimetric measurements to volumetric measurements for comparisons. However they do demonstrate the importance of site preparation and site choice for ensuring adequate soil moisture supply.
9.2 Intensive field experiments The aim of the intensive field experiments was to collect detailed data to describe relationships between seedling establishment in the field and climate-related factors (ultimately soil moisture levels – examined using various specific treatments). These data were then used to enhance seedling establishment modelling (in APSIM), and were subsequently used to examine the utility of climate forecasting for improving tree establishment success. There were two study areas: 1. Gungahlin ACT (Gungahlin Homestead, CSIRO Sustainable Ecosystems, Canberra) • Experiment under rainout shelters • Treated for weeds • Weather station on-site • Conducted Summer-Autumn 2005
2. Wellcamp QLD (near Toowoomba) • Experiment under rainout shelters • Established experimental planting site • Established CSE presence, and field expertise available • Conducted Summer – Spring 2006
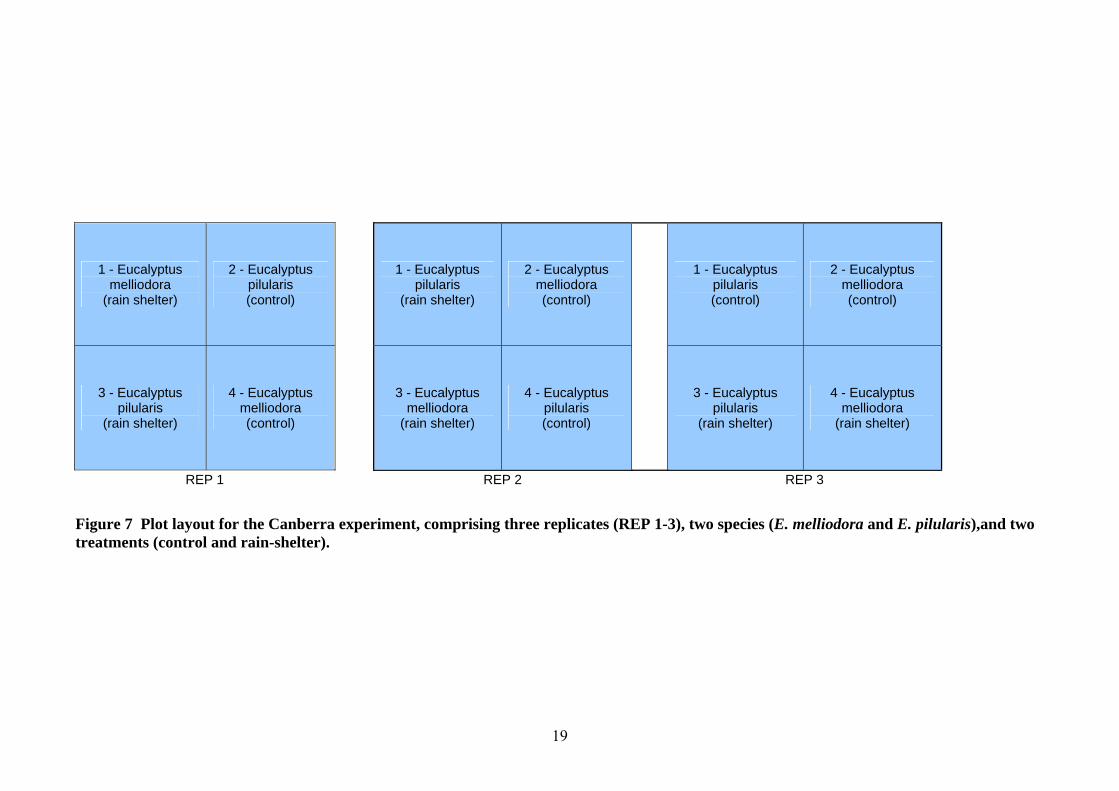
Gungahlin ACT This experiment monitored eucalypt seedling establishment in relation to artificially imposed drought (soil moisture stress). Two eucalypt species were used: Eucalyptus melliodora (Yellow Box) and Eucalyptus pilularis (Black Butt). These two species were chosen because they represent opposite ends of the spectrum of frost and drought tolerance in eucalypts. E. melliodora is both frost and drought tolerant, with a widespread distribution throughout inland SE Australia, while E. pilularis is frost and drought sensitive, and is restricted to relatively high-rainfall, coastal areas of SE Australia. Three replicates of four plots each were planted (Figure 7). Drought was simulated using rain shelters over plots to exclude rain; adjacent plots were open to rain and treated as controls. Measurements of seedling mortality, seedling growth parameters, soil moisture, soil characteristics, and above and below ground biomass, were made over four months. Plots were prepared by double ripping to 45cm. Rip lines were at 1m spacings with double rip lines at approximately 0.5m spacings to the first set of lines. The first set of lines was driven over by the tractor tyres in order to do the double ripping. Additional rips were done close to external trees to minimise their influence on the seedlings. Photos were taken of the rip lines, and markers were placed to identify plot limits. Roundup was applied to all plots to eliminate weeds, Sentek Diviner (soil moisture) tubes were installed, and rainout shelter frames erected. Seedlings were planted on 13/12/2004, and soil moisture readings taken. Some seedlings with broken stems were replanted on 16/12/2004. All seedlings were watered for 8-9 hours between 16-17/12/2004, filling the soil profile. In February 2005 the plots were subject to insect attack and heavy weed growth, and insecticide was applied, followed by hand application of herbicide.

18
Regular measurements included: • Weekly: Sentek Diviner (soil moisture) • Weekly: Health and vigour assessment sheets (seedling mortality) • Monthly: Stem diameter at 5cm above ground surface (digital vernier calipers; average of two
measures), stem height to top leaf, plant height to crown apex, crown diameter (average of two measures).
• Gravimetric soil moisture: once, before planting (standard methods) • Soil bulk density: once • Leaf area indices: once, at 3 months growth • Whole-plant biomass and allometry: initial (before planting) and after two months growth
(destructive sampling) The rain-out shelters were temporary structures, and were moved over the appropriate plots just before rain, and removed when the weather was clear. In this way the plots experienced all normal climatic conditions excepting rainfall. Unfortunately, problems with the design of the rain-out shelters, together with unusually high wind conditions during weekend storms, resulted in several structural failures. Some of the ‘drought’ treatments received water at different times, and some seedlings were killed through plastic burn. These occurrences were documented, and review of the results revealed no discernible effects on the experiment’s progress, other than the introduction of greater variability.
19
1 - Eucalyptus melliodora
(rain shelter)
2 - Eucalyptus pilularis (control)
1 - Eucalyptus
pilularis (rain shelter)
2 - Eucalyptus melliodora (control)
1 - Eucalyptus
pilularis (control)
2 - Eucalyptus melliodora (control)
3 - Eucalyptus pilularis
(rain shelter)
4 - Eucalyptus melliodora (control)
3 - Eucalyptus
melliodora (rain shelter)
4 - Eucalyptus pilularis (control)
3 - Eucalyptus
pilularis (rain shelter)
4 - Eucalyptus melliodora
(rain shelter)
REP 1 REP 2 REP 3
Figure 7 Plot layout for the Canberra experiment, comprising three replicates (REP 1-3), two species (E. melliodora and E. pilularis),and two treatments (control and rain-shelter).

20
Results
Seedling mortality
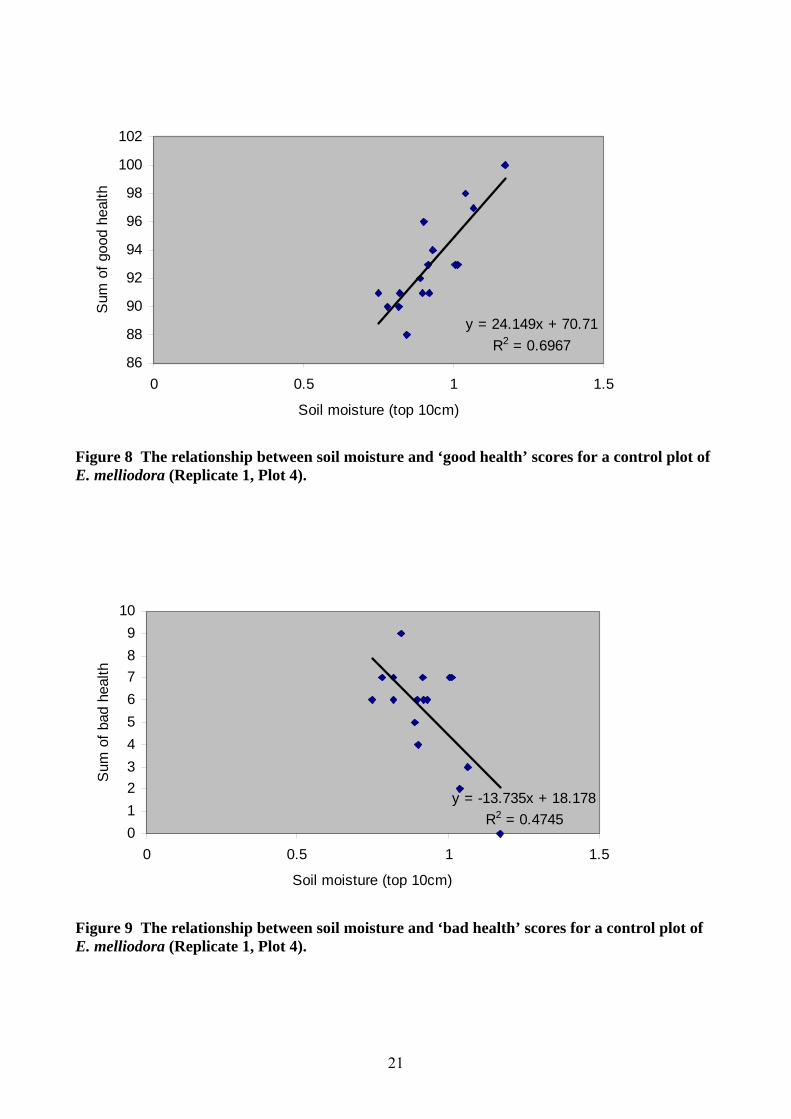
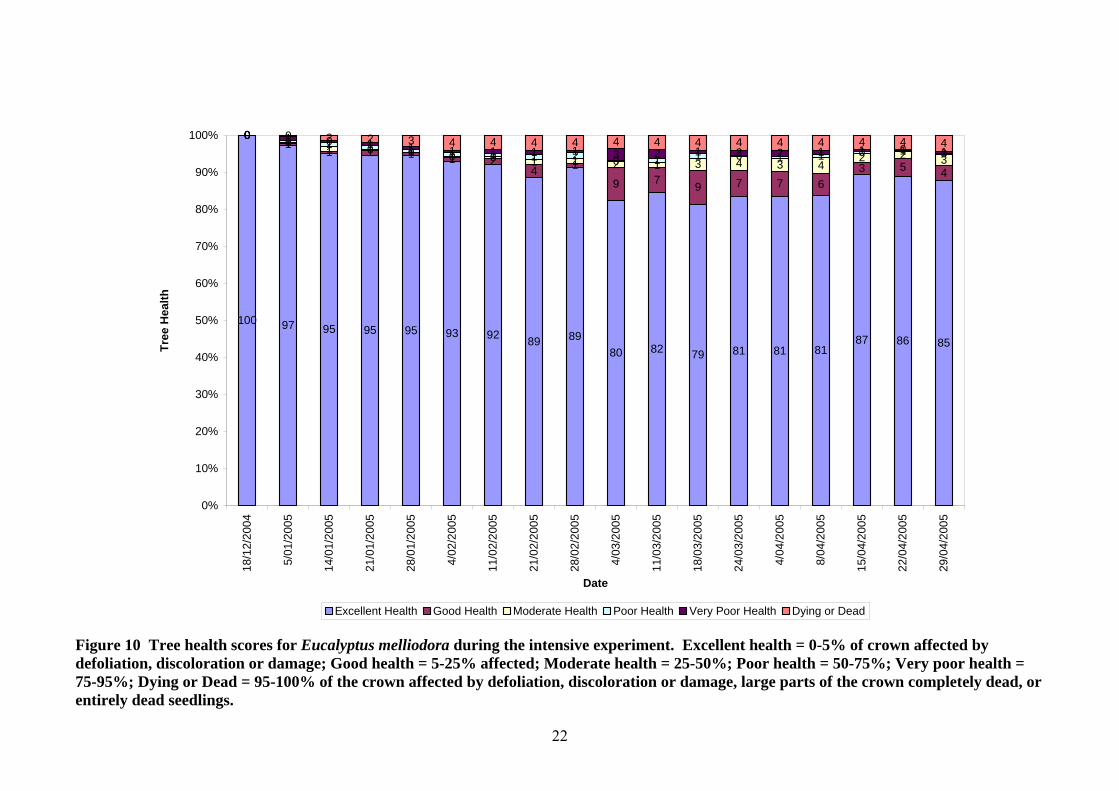
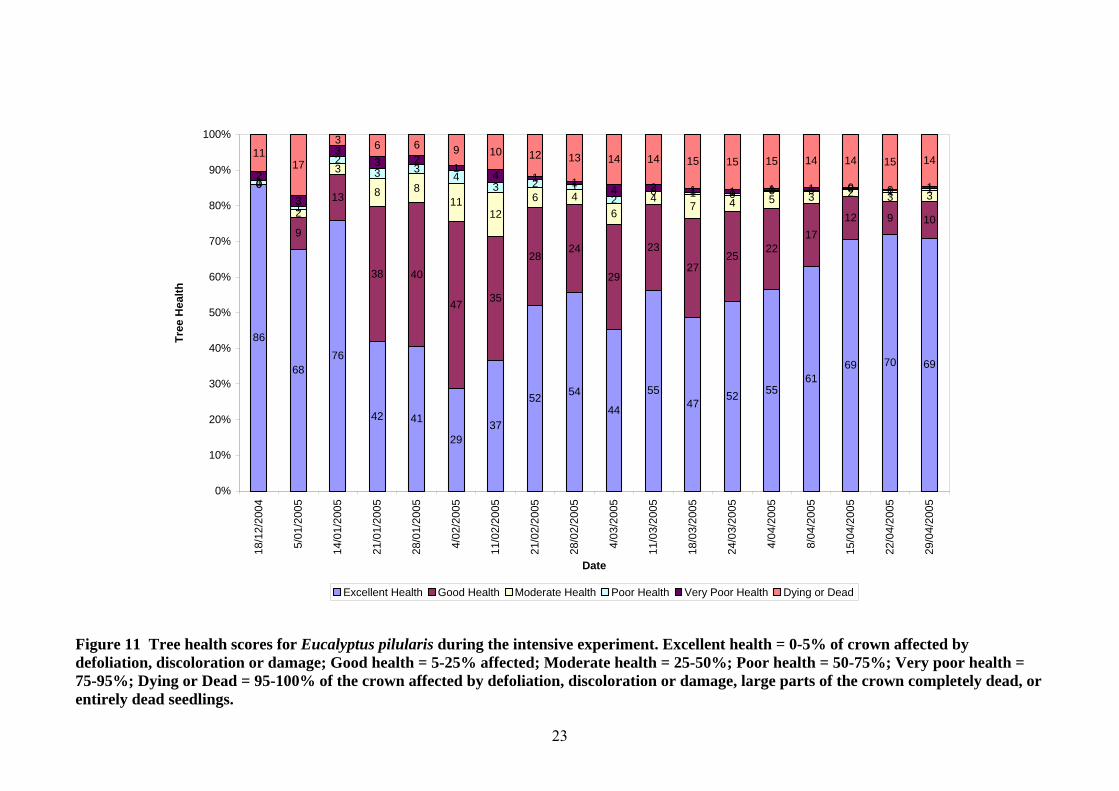
Seedling mortality was generally low, and those deaths that occurred were largely as a result of transplanting influences, insect damage and burns from collapsed rainout shelters, rather than soil moisture stress. The seedlings were planted into a soil profile that had been artificially filled with water, and this experiment together with subsequent discussions indicate that planting seedlings into such a situation virtually guarantees their success, at least until frosts occur. Results of this experiment were further affected by the unexpected regeneration of dead seedlings from lignotubers, which caused variation in mortality counts over time. In general, soil moisture stress affected seedling health more than it affected seedling mortality. Treatment differences The influence of natural (control) and simulated drought (rain shelter) conditions upon seedling mortality patterns was unclear both spatially and temporally, because of the aforementioned variables. In order to clarify the results, health scores ranging from moderate to excellent health were summed for each plot (0-50% of crown affected), and health scores ranging from poor health to dying or dead were also summed (50-100% of crown affected or dead), to produce a ‘Sum of good health’ or positive score and a ‘Sum of bad health’ or negative score. This was then plotted in relation to soil moisture in the top 10 cm of soil. As a result of this process, positive linear relationships were found between soil moisture in the top 10cm of soil and plants with positive health scores, but only in E. melliodora control plots (R2 values 0.6-0.7; e.g. Figure 8). Some E. melliodora control plots also show negative linear relationships between soil moisture in the top 10cm of soil and plants with negative health scores (R2 values 0.3-0.5; e.g. Figure 9). Other plots did not show any clear relationships, however the data suggest that soil moisture levels affect ‘good health’ rather than ‘poor health’ or mortality. Species differences In general, E. pilularis suffered worse health and more mortalities than E. melliodora (Figure 10 and Figure 11). In addition, all E. pilularis plots were affected by frost, and the significant increase in deaths shown in Figure 11 is related to frost for this species rather than soil moisture.
Seedling growth over time
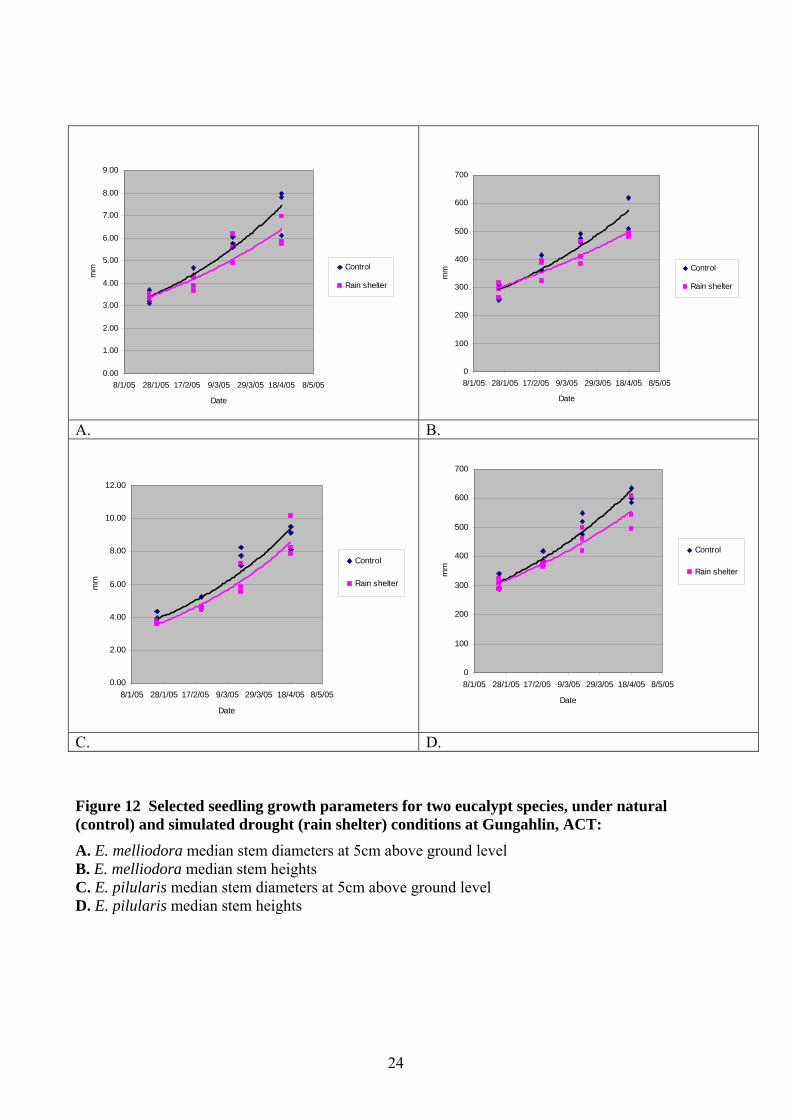
The growth of seedlings in plots protected from rain by rainout shelters differed from those in control plots, for both species (Figure 12). Over the four months, stem diameter, seedling height and crown diameter increased more rapidly in control plots than in sheltered plots. Differences in both mean and median growth measurements became most apparent after two months growth for both species, however median values show larger differences between control and shelter plots than mean values. Regardless of species or treatment, stem diameter increased faster than seedling height. Seedlings grew to maximum heights of up to 970 mm, with stem diameters up to 16 mm, and crown widths up to 825 mm.
21
y = 24.149x + 70.71R2 = 0.6967
86
88
90
92
94
96
98
100
102
0 0.5 1 1.5
Soil moisture (top 10cm)
Sum
of g
ood
heal
th
Figure 8 The relationship between soil moisture and ‘good health’ scores for a control plot of E. melliodora (Replicate 1, Plot 4).
y = -13.735x + 18.178R2 = 0.4745
0123456789
10
0 0.5 1 1.5
Soil moisture (top 10cm)
Sum
of b
ad h
ealth
Figure 9 The relationship between soil moisture and ‘bad health’ scores for a control plot of E. melliodora (Replicate 1, Plot 4).
22
100 97 95 95 95 93 92 89 8980 82 79 81 81 81
87 86 85
01
1 1 1 1 24 1
9 7 9 7 7 63 5 4
0 0 1 0 0 0 0 1 1 2 1 3 4 3 42 2 3
0 1 1 1 1 1 1 1 2 0 1 1 0 1 1 0 1 00 1 0 1 1 1 1 1 1 3 2 1 2 2 1 1 0 10 0 2 2 3 4 4 4 4 4 4 4 4 4 4 4 4 4
0%
10%
20%
30%
40%
50%
60%
70%
80%
90%
100%
18/1
2/20
04
5/01
/200
5
14/0
1/20
05
21/0
1/20
05
28/0
1/20
05
4/02
/200
5
11/0
2/20
05
21/0
2/20
05
28/0
2/20
05
4/03
/200
5
11/0
3/20
05
18/0
3/20
05
24/0
3/20
05
4/04
/200
5
8/04
/200
5
15/0
4/20
05
22/0
4/20
05
29/0
4/20
05
Date
Tree
Hea
lth
Excellent Health Good Health Moderate Health Poor Health Very Poor Health Dying or Dead
Figure 10 Tree health scores for Eucalyptus melliodora during the intensive experiment. Excellent health = 0-5% of crown affected by defoliation, discoloration or damage; Good health = 5-25% affected; Moderate health = 25-50%; Poor health = 50-75%; Very poor health = 75-95%; Dying or Dead = 95-100% of the crown affected by defoliation, discoloration or damage, large parts of the crown completely dead, or entirely dead seedlings.
23
86
6876
42 41
2937
52 54
44
5547
52 5561
69 70 69
0
9
13
38 40
47 35
2824
29
23
2725
2217
12 9 10
0
2
3
8 811
126 4
64
7 4 5 3 2 3 31
1
23 3
43 2 1
20 1 0 0 0 0 1 1
2
3
33 2
14 1 1
4 2 1 1 1 1 0 0 1
1117
3 6 6 9 10 12 13 14 14 15 15 15 14 14 15 14
0%
10%
20%
30%
40%
50%
60%
70%
80%
90%
100%
18/1
2/20
04
5/01
/200
5
14/0
1/20
05
21/0
1/20
05
28/0
1/20
05
4/02
/200
5
11/0
2/20
05
21/0
2/20
05
28/0
2/20
05
4/03
/200
5
11/0
3/20
05
18/0
3/20
05
24/0
3/20
05
4/04
/200
5
8/04
/200
5
15/0
4/20
05
22/0
4/20
05
29/0
4/20
05
Date
Tree
Hea
lth
Excellent Health Good Health Moderate Health Poor Health Very Poor Health Dying or Dead
Figure 11 Tree health scores for Eucalyptus pilularis during the intensive experiment. Excellent health = 0-5% of crown affected by defoliation, discoloration or damage; Good health = 5-25% affected; Moderate health = 25-50%; Poor health = 50-75%; Very poor health = 75-95%; Dying or Dead = 95-100% of the crown affected by defoliation, discoloration or damage, large parts of the crown completely dead, or entirely dead seedlings.
24
Figure 12 Selected seedling growth parameters for two eucalypt species, under natural (control) and simulated drought (rain shelter) conditions at Gungahlin, ACT: A. E. melliodora median stem diameters at 5cm above ground level B. E. melliodora median stem heights C. E. pilularis median stem diameters at 5cm above ground level D. E. pilularis median stem heights
0.00
1.00
2.00
3.00
4.00
5.00
6.00
7.00
8.00
9.00
8/1/05 28/1/05 17/2/05 9/3/05 29/3/05 18/4/05 8/5/05
Date
mm Control
Rain shelter
0
100
200
300
400
500
600
700
8/1/05 28/1/05 17/2/05 9/3/05 29/3/05 18/4/05 8/5/05
Date
mm Control
Rain shelter
A. B.
0.00
2.00
4.00
6.00
8.00
10.00
12.00
8/1/05 28/1/05 17/2/05 9/3/05 29/3/05 18/4/05 8/5/05
Date
mm
Control
Rain shelter
0
100
200
300
400
500
600
700
8/1/05 28/1/05 17/2/05 9/3/05 29/3/05 18/4/05 8/5/05
Date
mm
Control
Rain shelter
C. D.
25
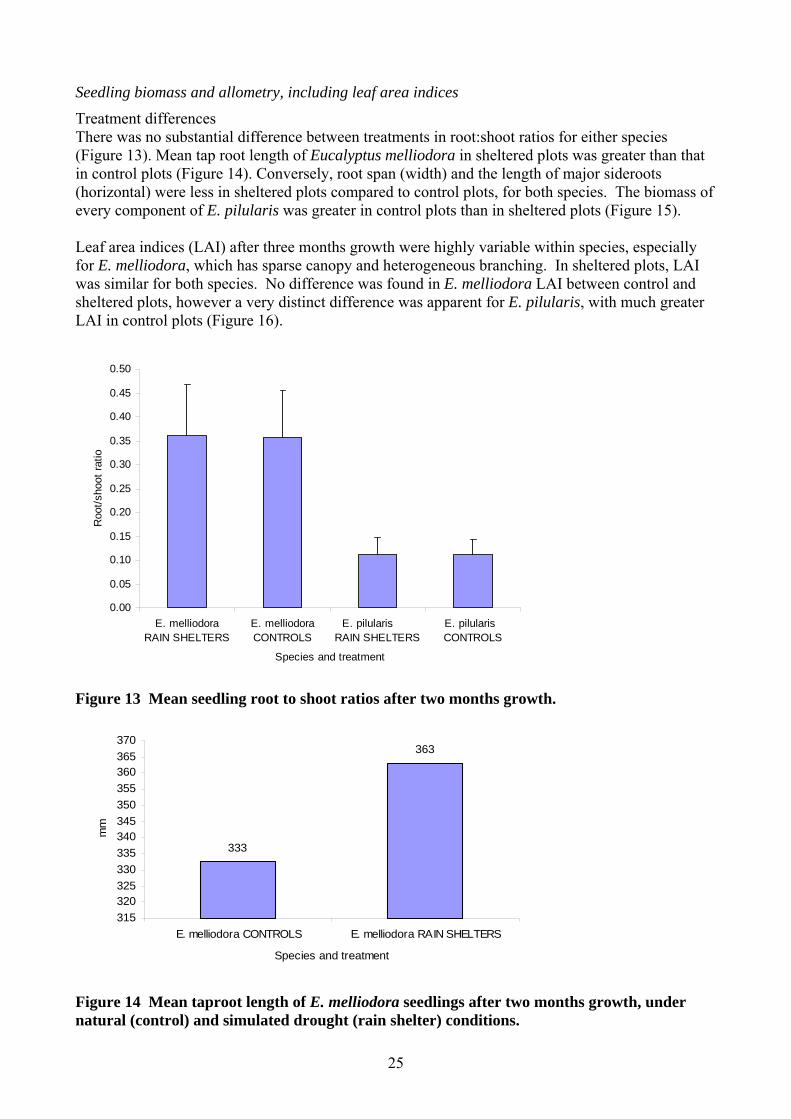
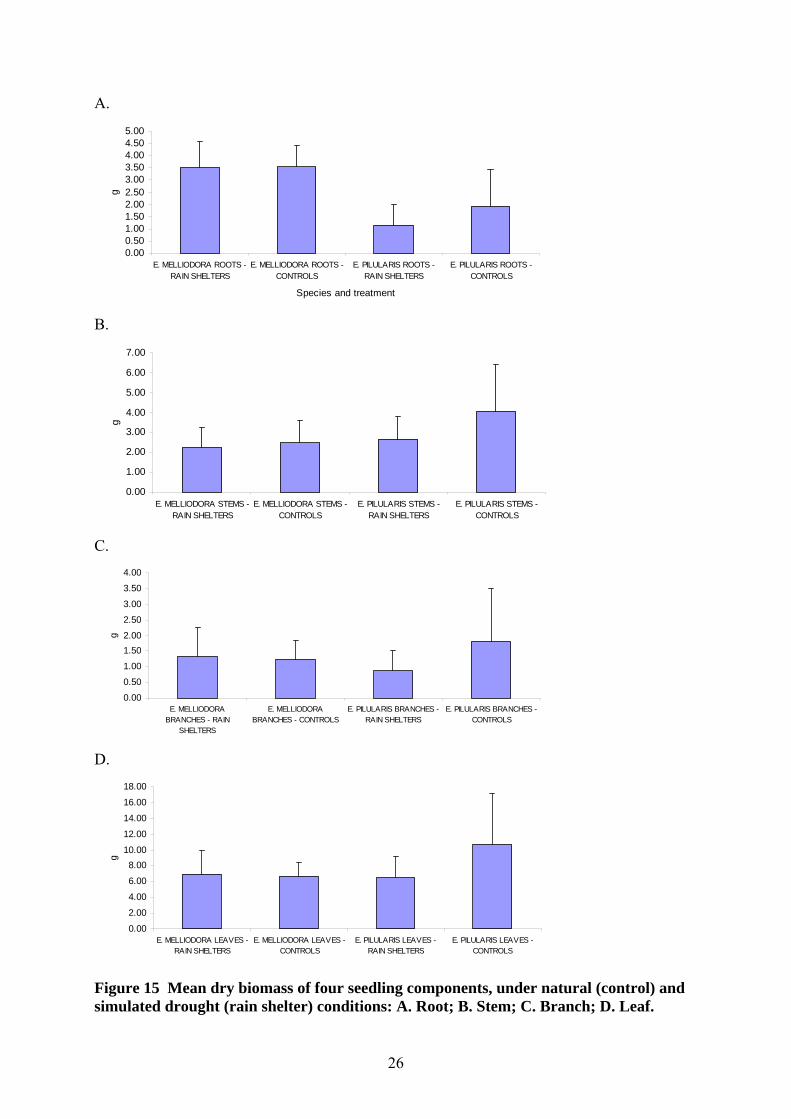
Seedling biomass and allometry, including leaf area indices
Treatment differences There was no substantial difference between treatments in root:shoot ratios for either species (Figure 13). Mean tap root length of Eucalyptus melliodora in sheltered plots was greater than that in control plots (Figure 14). Conversely, root span (width) and the length of major sideroots (horizontal) were less in sheltered plots compared to control plots, for both species. The biomass of every component of E. pilularis was greater in control plots than in sheltered plots (Figure 15). Leaf area indices (LAI) after three months growth were highly variable within species, especially for E. melliodora, which has sparse canopy and heterogeneous branching. In sheltered plots, LAI was similar for both species. No difference was found in E. melliodora LAI between control and sheltered plots, however a very distinct difference was apparent for E. pilularis, with much greater LAI in control plots (Figure 16).
0.00
0.05
0.10
0.15
0.20
0.25
0.30
0.35
0.40
0.45
0.50
E. melliodoraRAIN SHELTERS
E. melliodoraCONTROLS
E. pilularis RAIN SHELTERS
E. pilularis CONTROLS
Species and treatment
Roo
t/sho
ot ra
tio
Figure 13 Mean seedling root to shoot ratios after two months growth.
333
363
315320325330335340345350355360365370
E. melliodora CONTROLS E. melliodora RAIN SHELTERS
Species and treatment
mm
Figure 14 Mean taproot length of E. melliodora seedlings after two months growth, under natural (control) and simulated drought (rain shelter) conditions.
26
A.
0.000.501.001.502.002.503.003.504.004.505.00
E. MELLIODORA ROOTS -RAIN SHELTERS
E. MELLIODORA ROOTS -CONTROLS
E. PILULARIS ROOTS -RAIN SHELTERS
E. PILULARIS ROOTS -CONTROLS
Species and treatment
g
B.
0.00
1.00
2.00
3.00
4.00
5.00
6.00
7.00
E. MELLIODORA STEMS -RAIN SHELTERS
E. MELLIODORA STEMS -CONTROLS
E. PILULARIS STEMS -RAIN SHELTERS
E. PILULARIS STEMS -CONTROLS
g
C.
0.00
0.50
1.00
1.502.00
2.50
3.00
3.50
4.00
E. MELLIODORABRANCHES - RAIN
SHELTERS
E. MELLIODORABRANCHES - CONTROLS
E. PILULARIS BRANCHES -RAIN SHELTERS
E. PILULARIS BRANCHES -CONTROLS
g
D.
0.00
2.00
4.00
6.00
8.0010.00
12.00
14.00
16.00
18.00
E. MELLIODORA LEAVES -RAIN SHELTERS
E. MELLIODORA LEAVES -CONTROLS
E. PILULARIS LEAVES -RAIN SHELTERS
E. PILULARIS LEAVES -CONTROLS
g
Figure 15 Mean dry biomass of four seedling components, under natural (control) and simulated drought (rain shelter) conditions: A. Root; B. Stem; C. Branch; D. Leaf.
27
0
0.1
0.2
0.3
0.4
0.5
0.6
0.7
0.8
0.9
1
Controls Shelters
Treatment
Mea
n LA
I
E. melliodora
E. pilularis
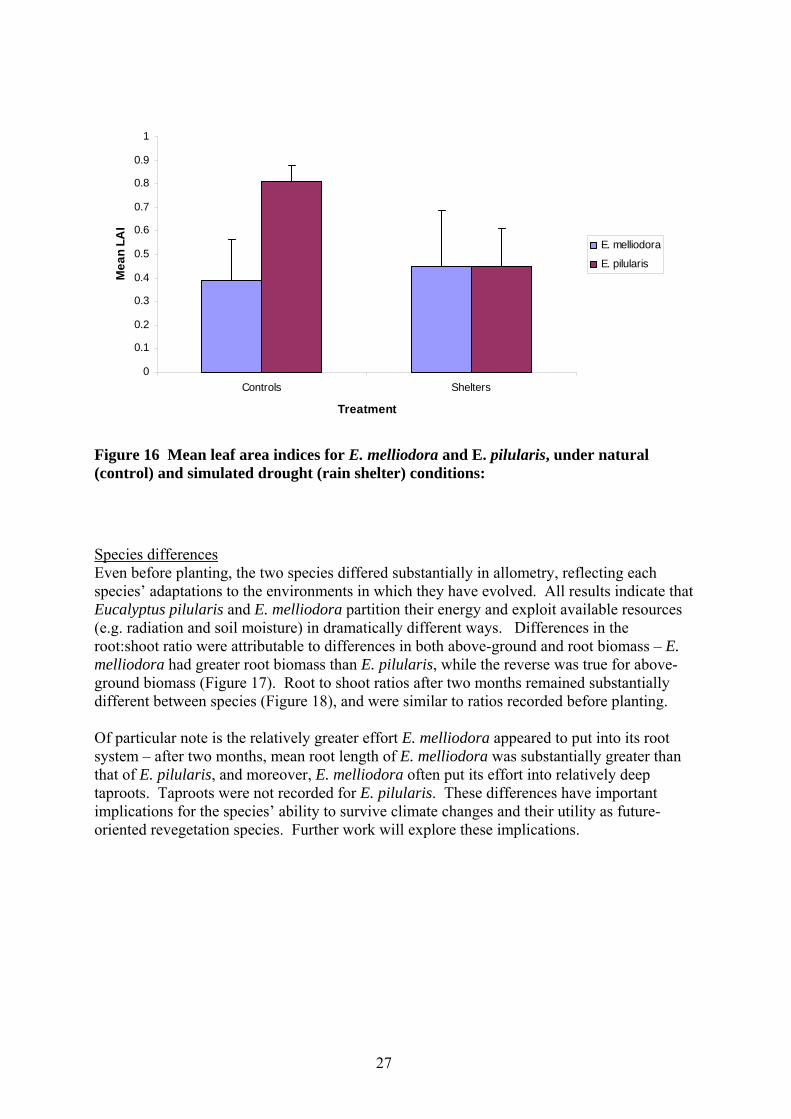
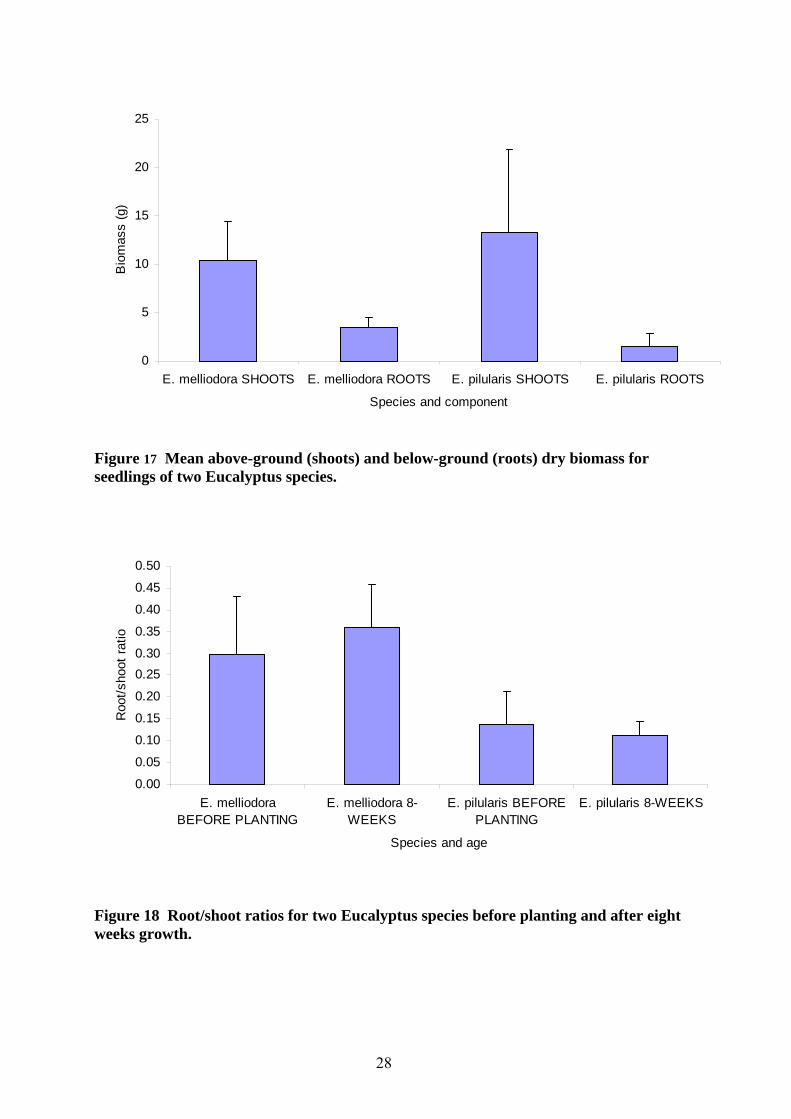
Figure 16 Mean leaf area indices for E. melliodora and E. pilularis, under natural (control) and simulated drought (rain shelter) conditions: Species differences Even before planting, the two species differed substantially in allometry, reflecting each species’ adaptations to the environments in which they have evolved. All results indicate that Eucalyptus pilularis and E. melliodora partition their energy and exploit available resources (e.g. radiation and soil moisture) in dramatically different ways. Differences in the root:shoot ratio were attributable to differences in both above-ground and root biomass – E. melliodora had greater root biomass than E. pilularis, while the reverse was true for above-ground biomass (Figure 17). Root to shoot ratios after two months remained substantially different between species (Figure 18), and were similar to ratios recorded before planting. Of particular note is the relatively greater effort E. melliodora appeared to put into its root system – after two months, mean root length of E. melliodora was substantially greater than that of E. pilularis, and moreover, E. melliodora often put its effort into relatively deep taproots. Taproots were not recorded for E. pilularis. These differences have important implications for the species’ ability to survive climate changes and their utility as future-oriented revegetation species. Further work will explore these implications.
28
0
5
10
15
20
25
E. melliodora SHOOTS E. melliodora ROOTS E. pilularis SHOOTS E. pilularis ROOTS
Species and component
Bio
mas
s (g
)
Figure 17 Mean above-ground (shoots) and below-ground (roots) dry biomass for seedlings of two Eucalyptus species.
0.00
0.05
0.10
0.15
0.20
0.250.30
0.35
0.40
0.45
0.50
E. melliodoraBEFORE PLANTING
E. melliodora 8-WEEKS
E. pilularis BEFOREPLANTING
E. pilularis 8-WEEKS
Species and age
Roo
t/sho
ot ra
tio
Figure 18 Root/shoot ratios for two Eucalyptus species before planting and after eight weeks growth.

29
Wellcamp QLD Following the Gungahlin ACT experiment, it was hypothesised that the high survival rates observed were a result of the high initial soil moisture content at planting. In addition, it was recognised that an analysis of revegetation management options for climatic risk like those employed for agricultural industries requires simulation capacity. To investigate this hypothesis and provide data for development of simulation capacity, an experiment was established to test the effects of initial soil moisture on eucalypt seedling survival and growth. This field experiment was located at the Queensland Department of Primary Industries and Fisheries research station near Wellcamp, Queensland (27° 34’S, 151° 52’E). The soil at this site is a Craigmore deep to very deep (100-180 cm), self-mulching, black cracking clay with a distinct red-brown subsoil on basalt (Isbell 1996; Dalgliesh and Foale 1998; Harris et al. 1999). The two species included in this experiment were E. melliodora (Yellow Box) and E. populnea (Bimble Box). Both species are native to much of eastern Australia but differ in their climatic niche. Herbarium records (http://www.rgb.vic.gov.au/avh; verified 7 June 2007) indicate that the natural range of E. melliodora extends for much of the 600 mm to 1000 mm rainfall zone from central Queensland to Southern Victoria (latitude 23.8 S to 38.5 S). E. populnea is commonly found within the drier 300 mm to 700 mm rainfall zone extending from central Queensland to Southern NSW (latitude 20.2 S to 34.0 S). A gradient of water regimes was established across which seedling growth and survival was tested. Three rainout shelters, each measuring 10 m x 4 m were used. Shelter 1 and Shelter 2 were set up as replicates, each to provide a gradient of 6 planting soil water levels with 12 trees planted in at each level. Shelter 3 was set up as a control, with three control treatments, including a continuously irrigated treatment, a plastic film “mulch” treatment (minimal evaporation) and a bare soil treatment (evaporation only). There were two replicates of each of these. Outside the shelters four plots (2 plots/species) were planted with 10 trees for comparison with those inside the shelters. A cover crop of forage sorghum (Sorghum bicolour cv. Sugargraze) was planted prior to tree establishment to reduce water and nitrogen variability across the site and to provide dry initial conditions for the experiment. Drip irrigation lines were set up across the width of all shelters to pre-wet the soil to a range of plant available soil water levels at the time of planting. Such a ‘line source’ approach has been used previously (Abrecht and Carberry 1993) and maintains the proximity of similar treatments to minimise the edge effects likely to occur in such small plots if treatment differences between neighbouring plots were significant. These were used throughout the experiment for the continuous irrigation treatments. The seedlings were planted on 20 February 2006 at 0.4 m x 0.4 m spacing throughout. Guard rows were included on the perimeter of the treatment area. Measurements: • Neutron Moisture Meter (NMM) access tubes were set up prior to the water treatments
being applied. They were installed to a depth of 1.5 m, in the centre of each treatment. • Tiny tag® (Gemini Data Loggers) data loggers were set up underneath one shelter to
record the actual conditions (temperature, solar radiation) under which the plants were growing.
• Comparative data on open field conditions were obtained from outside the shelters (temperature, solar radiation, rainfall).

30
• Soil moisture (NMM) and individual seedling health and survival were monitored on a weekly basis. Seedling health was recorded using a simple 4 category scale (Table 6).
• At the end of the experiment, every plant was harvested and data recorded for stem length, stem diameter at base, leaf dry mass, senesced leaf dry mass, stem dry mass, lignotuber dry mass, total leaf number and total leaf area.
Table 6 Description of tree health scoring categories.
Category Description 0 Apparent seedling death 1 Seedling showing severe stress indicating possible imminent death 2 Seedling maintaining green leaf but no sign of active leaf growth 3 Seedling showing definite signs of growth (i.e. appearance of new leaves)
Results
Aggregation of plots into treatments Preliminary analysis of the experimental results indicated that the small increments in water supply applied to the individual plots as treatments had been surpassed by similar variation in antecedent moisture conditions. The latter had various sources. Firstly, it was observed that water extraction by the preceding cover crop had not been uniform across the plots. Secondly, there had been a series of extreme rainfall events just prior to seedling establishment. Windblown entry of rainfall beneath the shelters had affected some plots on the windward side of the shelters. At the same time, some increase in soil water content at greater than 1 m depth occurred in a small number of plots, presumably due to entry of overland flow into deep cracks in the soil beneath the shelters created by the soil water extraction by the cover crop. The decision was made therefore to aggregate plots into treatments based upon the realised soil water conditions rather than the originally intended treatments. A review of the data indicated very strong relationships between water use and plant measurements (e.g. final plot plant biomass, R2 > 0.91, P<0.0001) which suggested measured water use would provide an appropriate means for grouping plots. The number of treatments in the main experiment was reduced from 8 to 5 to provide an increased number of replicate plots (range 2 to 4) per treatment. These have been labelled as W1 to W5 from driest to wettest. Treatments based upon water use ranged from 17.2 mm to 120.2 mm for E. melliodora and from 20.7 mm to 148.5 mm for E. populnea (Table 7). The reader must consider this when making any comparisons between species when interpreting these results. There was of course no need to reorganise the design of the irrigated, bare or external treatment plots.
Water Use
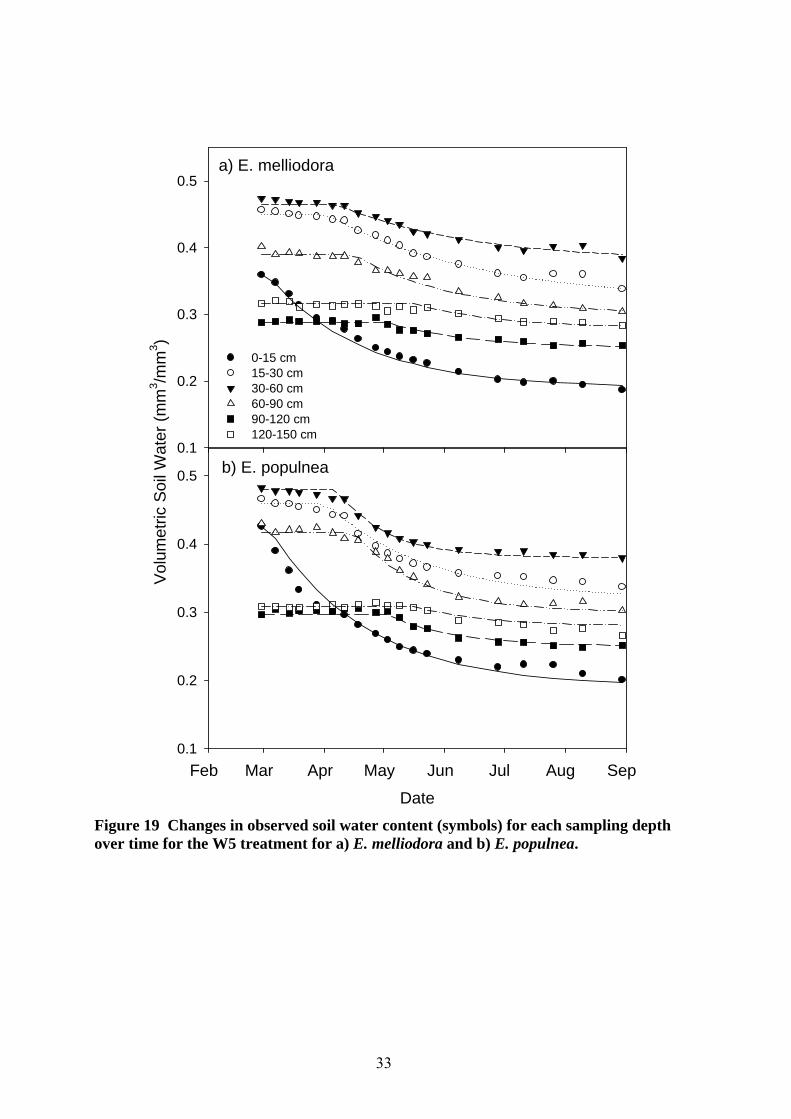
Total water use for the entire experimental period varied greatly across the treatments (Table 7). The irrigated and rainfed plots showed high levels of water use ranging from 223 mm to 390 mm. This is commensurate with winter agricultural crops within this region (Meinke 1996; Whish et al. 2007). The varied and much lower water use within the main part of the experiment demonstrates the wide range of stress conditions achieved (Figure 19). A comparison of the water loss from the bare soil plots to that from the planted plots indicated the importance of evaporative losses on seedling growth and survival during these early stages. A total of 48.5 mm was lost as evaporation from the bare treatment over the

31
experimental period. The time course of water loss from the bare plot closely followed that from the W4 treatment for E. melliodora and the W3 treatment for E. populnea (data not shown). This is likely due to the fact that a wet soil surface provides a much larger evaporative surface than the seedling canopy during early establishment and hence water loss will be mostly from soil surface rather than the seedlings.
Canopy Development
Studies on field crops have demonstrated that the impacts of water stress on canopy development will be evident earlier and more pronounced than those on plant growth rate (Stone et al. 2001). Therefore, the measurements on the various canopy attributes (Table 7) should provide a clear indication of the level of stress across the range of treatments. Whilst the response to soil water supply had only a minor effect upon plant height, the varying severity and time of onset of water stress had a large effect on average plant leaf area, especially for E. melliodora. In this species, the number of leaf nodes on the main stem varied greatly from dry to wet treatments. An even greater response in the total number of leaves indicates a more severe effect on branching. In contrast, the more conservative approach to canopy development employed by E. populnea resulted in a less pronounced response to water limitation.
Mortality
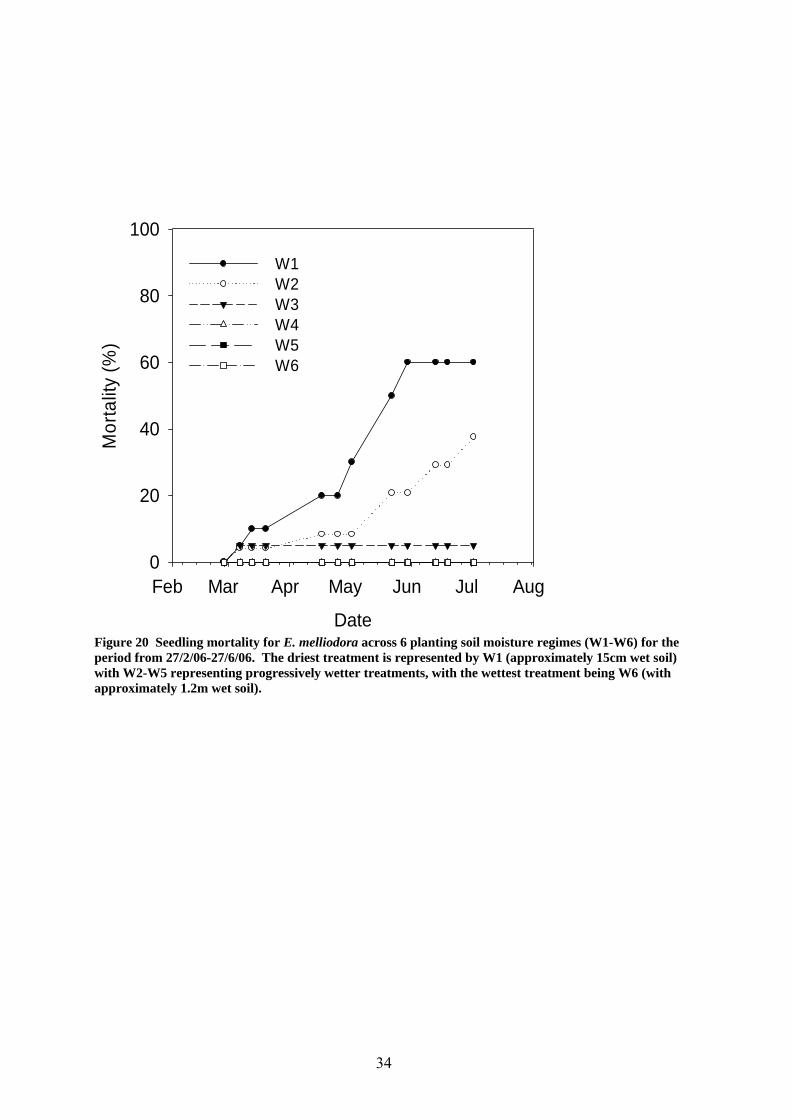
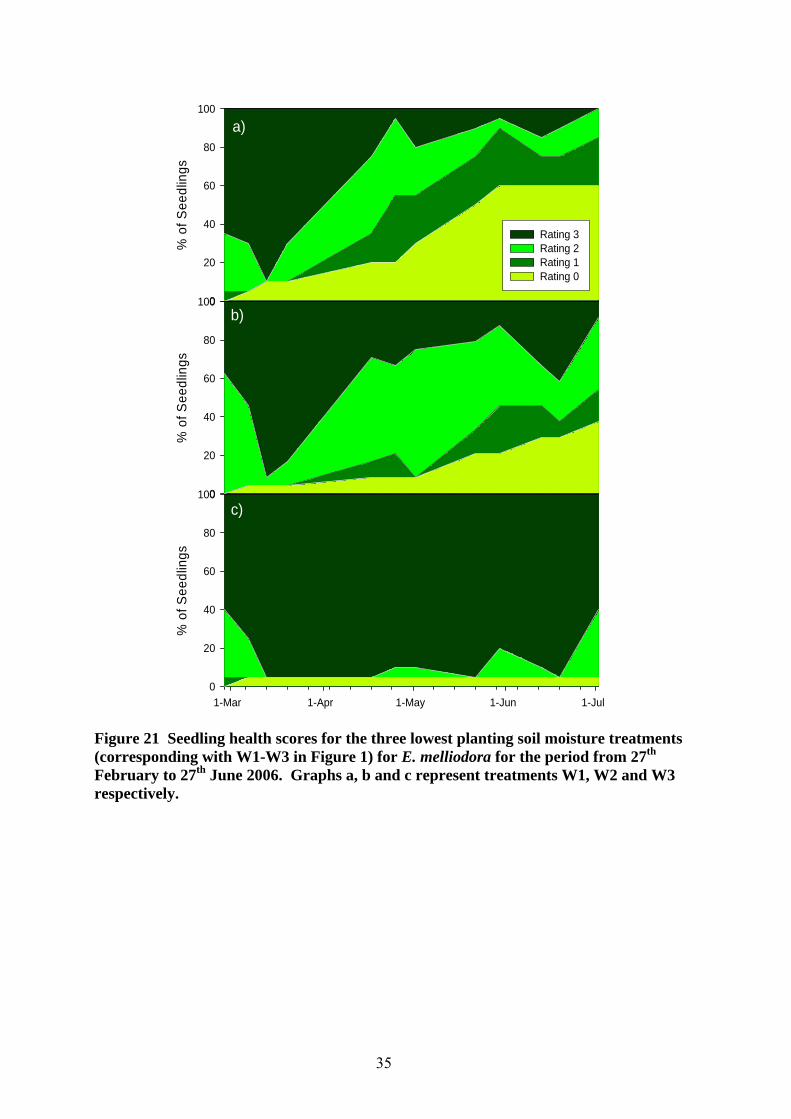
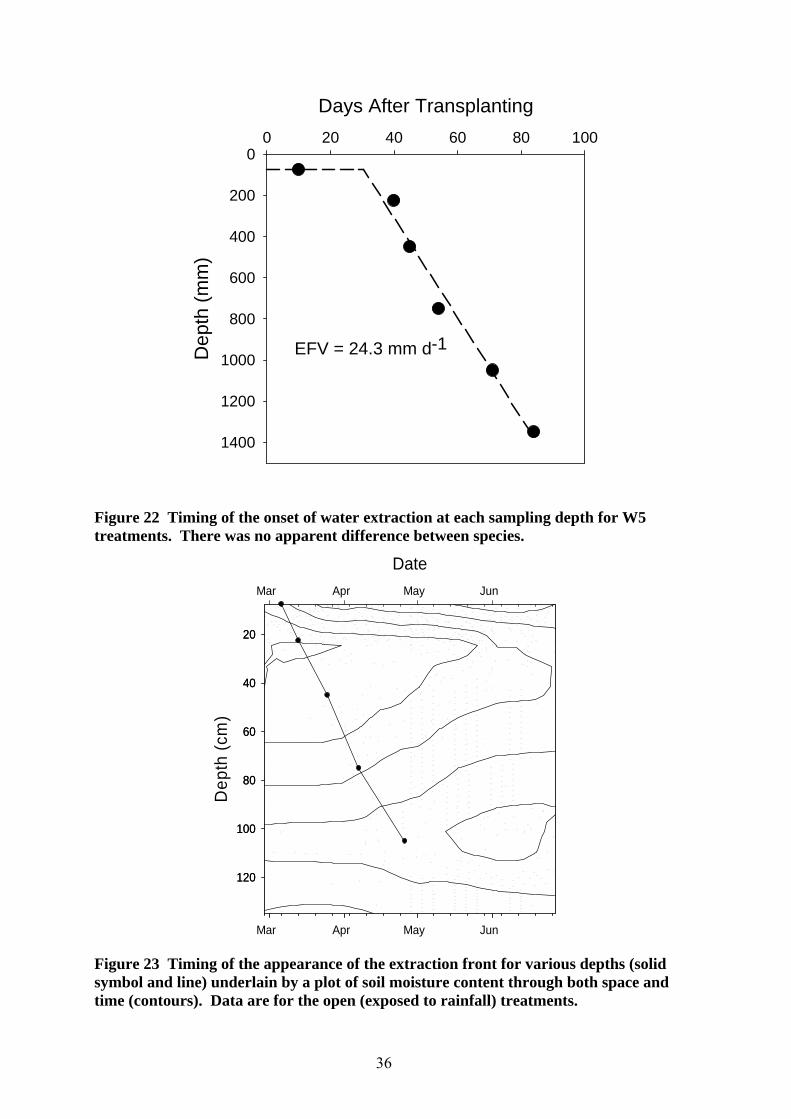
The measurements of seedling mortality indicate the survival capacity of eucalypt species adapted to low rainfall zones. After six months, drought-induced mortality was only evident in the 3 driest treatments (Table 7). Only one plant was lost from the combination of all irrigated or rain fed plots and that loss appeared to be due to damage during planting. Figure 20 shows the mortality of E. melliodora through time for the six planting moisture contents. The data indicate that this species is indeed very drought tolerant with only the driest treatments showing significant mortality after several months. Mortality rates for E. populnea were even lower with only the very driest treatment showing drought induced death. Very small differences in starting moisture had pronounced effects on mortality indicating that these species are able to make use of even very small amounts water for survival. For example, a very small difference in starting soil moisture between W1 (17.2 mm) and W2 (21.4 mm) for E. melliodora resulted in an increase in plant survival at six months from 25% to 44%. Differences in starting moisture also showed a strong influence upon the timing of the onset of mortality with a range of 1 to 5 months for the 3 driest treatments of both species. Figure 21 compares tree health for the three driest treatments, for E. melliodora. These data show that with small increases in planting moisture these seedlings are able to maintain signs of an actively growing canopy for much longer periods of time. Subsequently, seedlings are able to maintain health for longer periods before showing signs of mortality when even small amounts of extra water are available. This is presumably due to the ability of the seedlings to quickly establish their root systems to make use of any deeper soil moisture. The root extraction front velocity for these trees was sufficient to allow access to deeper moisture over relatively short periods (Figure 22 and Figure 23).

32
Table 7 Seedling water use, survival and growth measurements at the end of the experimental period. Data include averages of the 2 to 4 replicate plots per treatment. Water use includes both transpiration and evaporation. Treatment Water
Use Survival Plant
Height Stems
Main Stem
Nodes Leaves
Leaf area
(mm) (%) (cm) (/plant) (/plant) (/plant) (cm2/plant)
E. melliodora W1 17.2 25 26.9 1.9 18.7 26.4 31.3 W2 21.4 44 22.5 2.4 18.6 41.4 57.0 W3 34.0 88 33.2 4.5 26.3 94.5 188.8 W4 55.0 100 39.6 6.8 32.5 181.9 345.4 W5 120.2 100 46.6 7.1 35.6 243.5 730.9
Open 236.8† 100 51.7 9.0 38.1 494.3 1448.0 Wet 389.5† 100 61.3 5.3 47.0 568.0 1760.9
E. populnea W1 20.7 66 31.0 1.9 19.1 19.9 141.6 W2 27.9 84 28.2 2.1 19.2 24.0 170.7 W3 54.4 95 32.3 2.6 22.2 27.9 156.8 W4 102.6 100 36.0 4.1 23.8 66.7 519.7 W5 148.5 100 38.9 3.7 25.9 73.6 832.6
Open 223.7† 97 37.5 4.1 25.3 98.7 853.8 Wet 360.9† 100 40.8 2.8 22.9 69.4 1053.7
* Data for these attributes only available for one plot. †May also include drainage and runoff losses
33
Date
Feb Mar Apr May Jun Jul Aug Sep 0.1
0.2
0.3
0.4
0.5
Volu
met
ric S
oil W
ater
(mm
3 /mm
3 )
0.1
0.2
0.3
0.4
0.5
0-15 cm15-30 cm30-60 cm60-90 cm90-120 cm 120-150 cm
a) E. melliodora
b) E. populnea
Figure 19 Changes in observed soil water content (symbols) for each sampling depth over time for the W5 treatment for a) E. melliodora and b) E. populnea.
34
Date
Feb Mar Apr May Jun Jul Aug
Mor
talit
y (%
)
0
20
40
60
80
100
W1 W2 W3 W4 W5 W6
Figure 20 Seedling mortality for E. melliodora across 6 planting soil moisture regimes (W1-W6) for the period from 27/2/06-27/6/06. The driest treatment is represented by W1 (approximately 15cm wet soil) with W2-W5 representing progressively wetter treatments, with the wettest treatment being W6 (with approximately 1.2m wet soil).
35
% o
f See
dlin
gs
0
20
40
60
80
100
Rating 3 Rating 2 Rating 1 Rating 0
% o
f See
dlin
gs
0
20
40
60
80
100
1-Mar 1-Apr 1-May 1-Jun 1-Jul
% o
f See
dlin
gs
0
20
40
60
80
100
a)
b)
c)
Figure 21 Seedling health scores for the three lowest planting soil moisture treatments (corresponding with W1-W3 in Figure 1) for E. melliodora for the period from 27th February to 27th June 2006. Graphs a, b and c represent treatments W1, W2 and W3 respectively.
36
Days After Transplanting0 20 40 60 80 100
Dep
th (m
m)
0
200
400
600
800
1000
1200
1400
EFV = 24.3 mm d-1
Figure 22 Timing of the onset of water extraction at each sampling depth for W5 treatments. There was no apparent difference between species.
DateMar Apr May Jun
Dep
th (c
m)
20
40
60
80
100
120
Mar Apr May Jun
20
40
60
80
100
120
Figure 23 Timing of the appearance of the extraction front for various depths (solid symbol and line) underlain by a plot of soil moisture content through both space and time (contours). Data are for the open (exposed to rainfall) treatments.

37
Summary
These intensive field experiments furnished the project with data useful in describing relationships between seedling establishment in the field and soil moisture levels. The significance of a soil profile full of water at planting in Gungahlin was greater than expected, and its importance for ensuring establishment success was further tested in the Wellcamp experiment. The experiments showed that relatively minor differences in soil moisture stress can influence the health and mortality of eucalypt seedlings. The experimental data collected also describe some of the important factors determining seedling survival under conditions of limiting soil water. These include the ability of seedlings to access and extract deep soil moisture, and the importance of the magnitude of soil surface evaporation rates on the overall water balance. When combined with the seedling allometry data obtained from all treatments, an extensive dataset has been made available for model development and testing, described in the following sections. Soil moisture stress influences seedling growth, biomass and allometry, however it is important to note that the extent of this impact depends upon the species and the parameter being examined. Seedlings of E. melliodora showed a propensity toward early canopy development with leaves and branches being initiated even on the drier treatments. Such canopy expansion would have increased soil moisture use and accelerated the onset and increase the severity of mortality. In contrast, seedlings of E. populnea demonstrated a conservative approach that resulted in lower mortality rates. Even though above-ground growth rates under higher supply conditions were lower than those for E. melliodora, extraction potentials and resultant water use were higher. This would suggest that this species is in fact partitioning a greater proportion of its growth into its root system. To counter some of the negative impacts of this strategy upon above-ground competition, a greater proportion of above-ground growth in E. populnea was partitioned to leaves rather than stems. E. populnea showed very little signs of branching on the main stem with few secondary stems initiating from the lignotuber. The relative merits of these two growth strategies were clearly evident across the treatments. Hence species choice is a fundamentally important determinant of seedling establishment success.
38
9.3 Model development When making planting decisions to minimise the risk of planting failure, land managers can choose planting windows to maximise the likelihood of rainfall after planting and to minimise the evaporation rates experienced by the seedlings. Ground preparation prior to planting can be employed to store moisture during a preceding fallow period to reduce the reliance on rainfall in variable climates. The way in which the seedlings respond to these methods of managing risk may depend on the particular growth characteristics of the species being planted, and so recommendations for planting windows and ground preparation may need to consider these characteristics. Moreover, when climate conditions are variable, testing of such recommendations can be extremely difficult as each season provides a different set of growing conditions during the establishment phase. In commercial agriculture, models are commonly used to describe a production system’s responses to management decisions in a variable climate through the use of long-term climate records (Hammer et al. 1996). For such an approach to be applied to analyses of various revegetation decisions, an appropriate modelling framework would need to be developed and tested for Australian conditions. This section describes development and testing of a proposed model of early seedling growth and survival (based on the field experiment data) which borrows much from the previous work in the agricultural sciences. The model is applied over a range of seasonal conditions to explore the main drivers of seedling mortality and the ways in which the risk of poor seedling establishment can be properly managed.
APSIM seedling module The seedling growth and establishment model was developed using the eucalypt growth modelling framework (Huth et al. 2001) within the Agricultural Production Systems Simulator (Keating et al. 2003). The Agricultural Production Systems Simulator (APSIM) was developed by the Agricultural Production Systems Research Unit to simulate biophysical processes in farming systems. APSIM is able to make predictions of crop production whilst giving consideration to climate, genotype, soil and management factors. APSIM is currently accessed by farmers across Australia, via a web interface called YieldProphet, to aid farm management decisions in light of seasonal climate forecasts. Given its current utility for production-based farm decisions, APSIM provides one avenue for testing incorporation of seasonal climate forecasts into tree planning decisions. APSIM’s component-based design allows individual models to interact via a common communications protocol, usually on a daily time step. In this case, the plant module communicates with existing modules for soil processes such as carbon and nitrogen cycling, surface litter dynamics, water and solute fluxes and soil temperature (Probert et al. 1998). APSIM has previously been used to study the impacts of tree-crop interactions (Huth et al. 2002), effluent irrigation (Snow et al. 1999) and saline water tables (Paydar et al. 2005) on eucalyptus plantations.
Model parameterisation
Measured plant species traits
Several plant parameters had to be specified before the model was employed. Symbols for these are presented in Table 8. - Specific leaf area for each species was calculated from the ratio of leaf area to leaf mass
for each individual destructively sampled seedling. Dead seedlings were excluded from these calculations. Surprisingly, there was no significant difference between the value of σ for E. melliodora (mean = 62.4, n = 95) and E. populnea (mean = 62.3, n = 109).

39
- The leaf partitioning coefficient, ηf was determined by fitting allometric relationships between total plant mass and leaf mass for each species. The derivative of this relationship therefore provides a function describing the changes of ηf with plant size. Analysis of the individual plant data suggested a difference between species with E. populnea partitioning a larger fraction of above-ground growth into foliage than E. melliodora. A quadratic function (R2 = 0.99) fitted for E. melliodora indicated that this species partitioned 70% of above-ground growth into foliage when small but that this decreased linearly to 27% by the time the seedling grew to 100g of above-ground biomass. A linear function (R2 = 0.98) was found to provide an equally effective allometric relationship between leaf and total mass for E. populnea. This suggested that this species partitioned a constant 73% of above-ground growth into leaves at these early stages.
The main model parameters defining the timing and extent of soil water extraction by the plant are extraction front velocity (EFV), volumetric soil water content at the lower limit of extractable soil water (θLL), and the soil water extraction coefficient (kl). - EFV was determined by regression of the date at which extraction was first evident at each
depth interval against that depth (see Figure 22). The W5 treatment was chosen for this analysis as it contained significant levels of water use from all layers and did not have the periodic rewetting of the open or irrigated treatments. The surface layer into which the plants were planted was not included in the regression. No difference in EFV was observed between the two eucalypt species as water use commenced at the same dates for each layer. After the usual initial lag period (Meinke et al. 1993) the extraction front was observed to progress at 24.3 mm d-1. This compares well with a value of 19.6 mm d-1 found for wheat at the same location (Meinke 1996).
- The value of θLL was taken from the observed soil moisture levels at the end of the experiment.
- Once these parameters were known, species specific values of kl for each layer were chosen to best fit the measured decay in plant available soil moisture (Figure 19). It should be noted that W5 treatment for both species showed signs of the effects of water stress when compared to the irrigated treatments and so the assumption of a supply limitation that is implicit in the derivation of the value of kl would appear to hold. There was a difference between the values of kl determined for the two eucalypt species. E. populnea showed higher values of kl for most of the profile (Table 7). Given that the W5 treatment for both species showed significant levels of water stress when compared to the irrigated plots we can assume that the differences in extraction are due to differences rates of soil water supply and not just soil water demand. This suggests that E. populnea had already developed a more effective root system during these early stages of establishment. The kl values for both species were much lower than those measured at this site for wheat (Meinke 1996) and this would reflect the relative sizes of the root systems of small seedlings versus an established wheat crop.
Other model parameters
Most of the remaining model parameters were taken from previous work on modelling eucalypt species. A whole plant light use efficiency (ε) of 1.3 g MJ-1 was adopted from previous studies (Huth et al. 2001; Huth et al. 2002) and we assume that leaves show a spherical leaf angle distribution (i.e. k = 0.5). The fraction of total growth going into above-ground shoots (η) could not be determined from the experimental data as root mass was not measured. However, an estimate was made by taking values used in previous modelling studies and adding increasing these to account for the measured growth in lignotubers. This
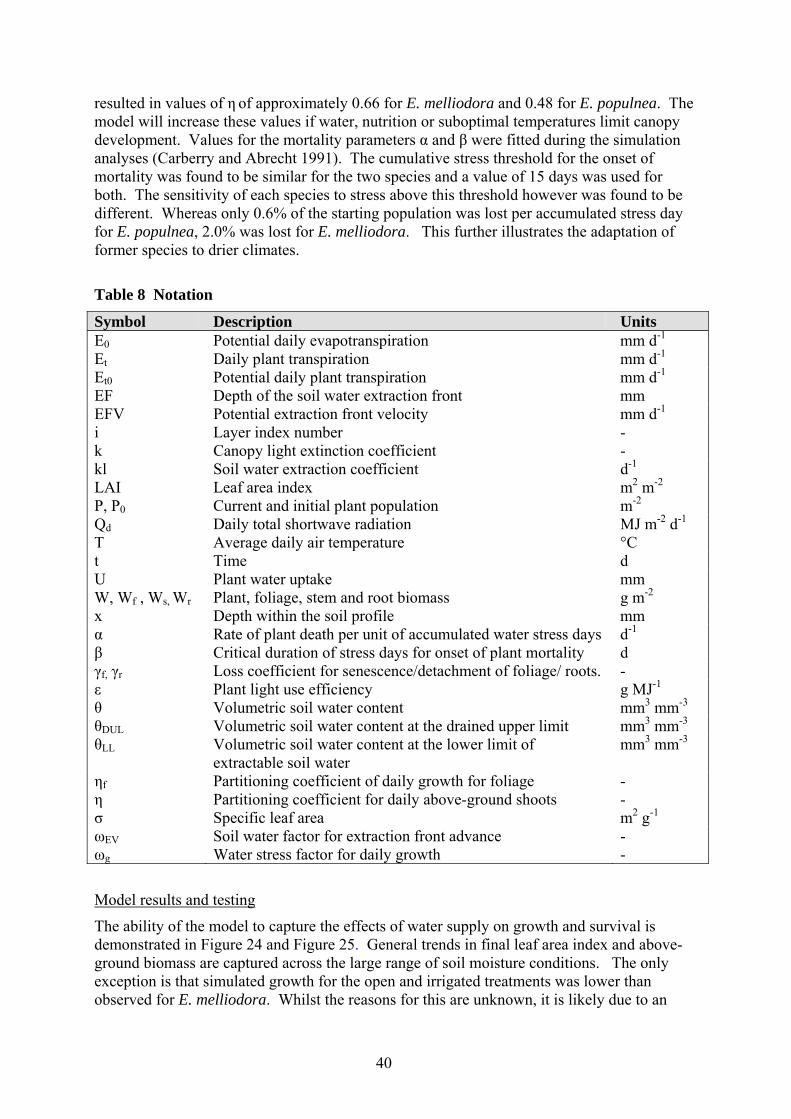
40
resulted in values of η of approximately 0.66 for E. melliodora and 0.48 for E. populnea. The model will increase these values if water, nutrition or suboptimal temperatures limit canopy development. Values for the mortality parameters α and β were fitted during the simulation analyses (Carberry and Abrecht 1991). The cumulative stress threshold for the onset of mortality was found to be similar for the two species and a value of 15 days was used for both. The sensitivity of each species to stress above this threshold however was found to be different. Whereas only 0.6% of the starting population was lost per accumulated stress day for E. populnea, 2.0% was lost for E. melliodora. This further illustrates the adaptation of former species to drier climates.
Table 8 Notation
Symbol Description Units E0 Potential daily evapotranspiration mm d-1 Et Daily plant transpiration mm d-1 Et0 Potential daily plant transpiration mm d-1 EF Depth of the soil water extraction front mm EFV Potential extraction front velocity mm d-1 i Layer index number - k Canopy light extinction coefficient - kl Soil water extraction coefficient d-1 LAI Leaf area index m2 m-2 P, P0 Current and initial plant population m-2 Qd Daily total shortwave radiation MJ m-2 d-1 T Average daily air temperature °C t Time d U Plant water uptake mm W, Wf , Ws, Wr Plant, foliage, stem and root biomass g m-2 x Depth within the soil profile mm α Rate of plant death per unit of accumulated water stress days d-1 β Critical duration of stress days for onset of plant mortality d γf, γr Loss coefficient for senescence/detachment of foliage/ roots. - ε Plant light use efficiency g MJ-1 θ Volumetric soil water content mm3 mm-3 θDUL Volumetric soil water content at the drained upper limit mm3 mm-3 θLL Volumetric soil water content at the lower limit of
extractable soil water mm3 mm-3
ηf Partitioning coefficient of daily growth for foliage - η Partitioning coefficient for daily above-ground shoots - σ Specific leaf area m2 g-1 ωEV Soil water factor for extraction front advance - ωg Water stress factor for daily growth -
Model results and testing
The ability of the model to capture the effects of water supply on growth and survival is demonstrated in Figure 24 and Figure 25. General trends in final leaf area index and above-ground biomass are captured across the large range of soil moisture conditions. The only exception is that simulated growth for the open and irrigated treatments was lower than observed for E. melliodora. Whilst the reasons for this are unknown, it is likely due to an

41
inability of the parameterisation to capture the effects of other growth modifiers, such as temperature, when water supply is no longer limiting. Simple changes in model configuration such as to biomass partitioning and responses to stress can capture emergent trends in seedling growth across supply gradients. Even more encouraging is the ability to capture the resultant time course in mortality including both a response to water supply and demand throughout the experiment. Such a result across a wide range of conditions gives confidence that the main drivers of seedling growth and survival can be captured with the simple model. In order to demonstrate the utility of the developed model, an analysis of the effects of planting soil moisture on long term survival for both species was undertaken for a range of locations in eastern Australia. The climate of this region is heavily influenced by the El Niño and La Niña phases of the ENSO system and so provides a good opportunity for evaluating management strategies for minimising climatic risk. Sites were chosen to provide a wide range in mean annual rainfall and seasonality of both rainfall and evaporation (Table 9). An analysis of the effects of climate variability was developed using the long term weather record (1886-2006) for each site from the SILO database (www.bom.gov.au/silo). To enable a comparison with the experimental results, the specification for soil and planting arrangement from the experimental study was used. In each simulated year, seedlings of each species were planted at the middle of each month and survival was evaluated six months after this date. The experimental study had demonstrated that soil moisture status at planting was a major determinant of the success of seedling establishment. A range of planting moisture conditions (30, 60 and 90 mm of plant available soil water) were simulated for each planting to see if increased moisture at planting could provide a method for minimising the risk of planting failure within such a variable climate.
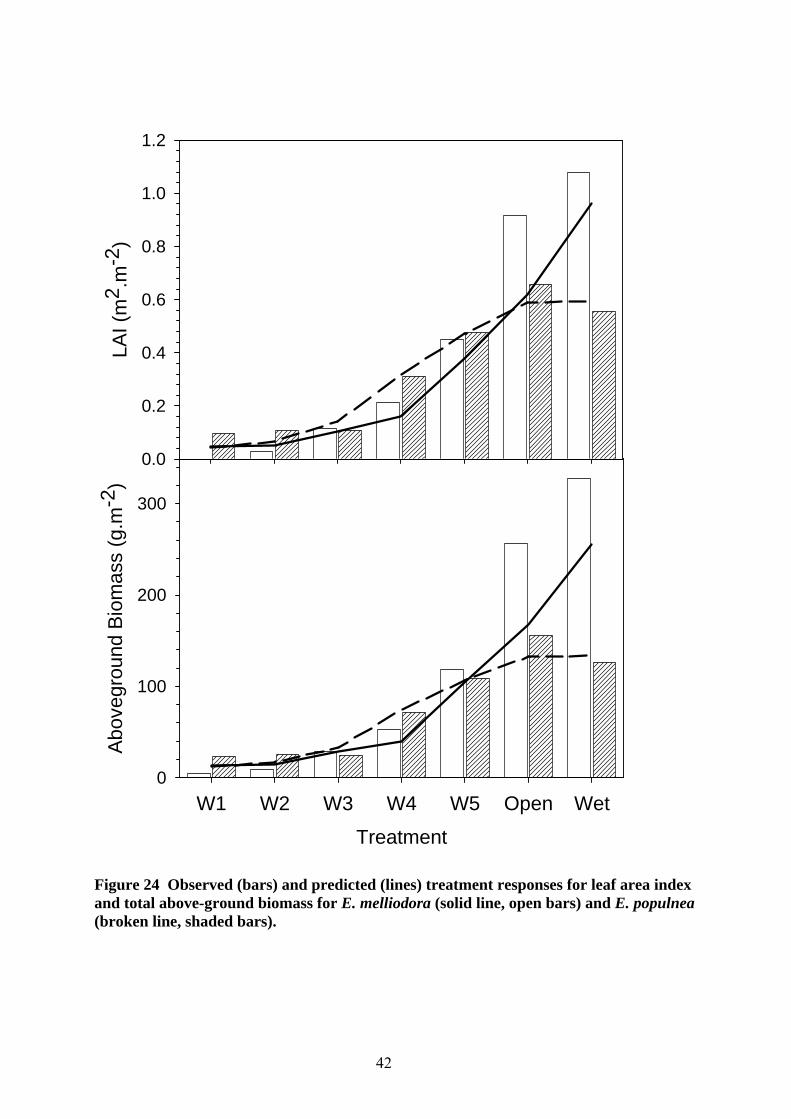
42
Treatment
W1 W2 W3 W4 W5 Open Wet
Abo
vegr
ound
Bio
mas
s (g
.m-2
)
0
100
200
300
LAI (
m2 .
m-2
)
0.0
0.2
0.4
0.6
0.8
1.0
1.2
Figure 24 Observed (bars) and predicted (lines) treatment responses for leaf area index and total above-ground biomass for E. melliodora (solid line, open bars) and E. populnea (broken line, shaded bars).
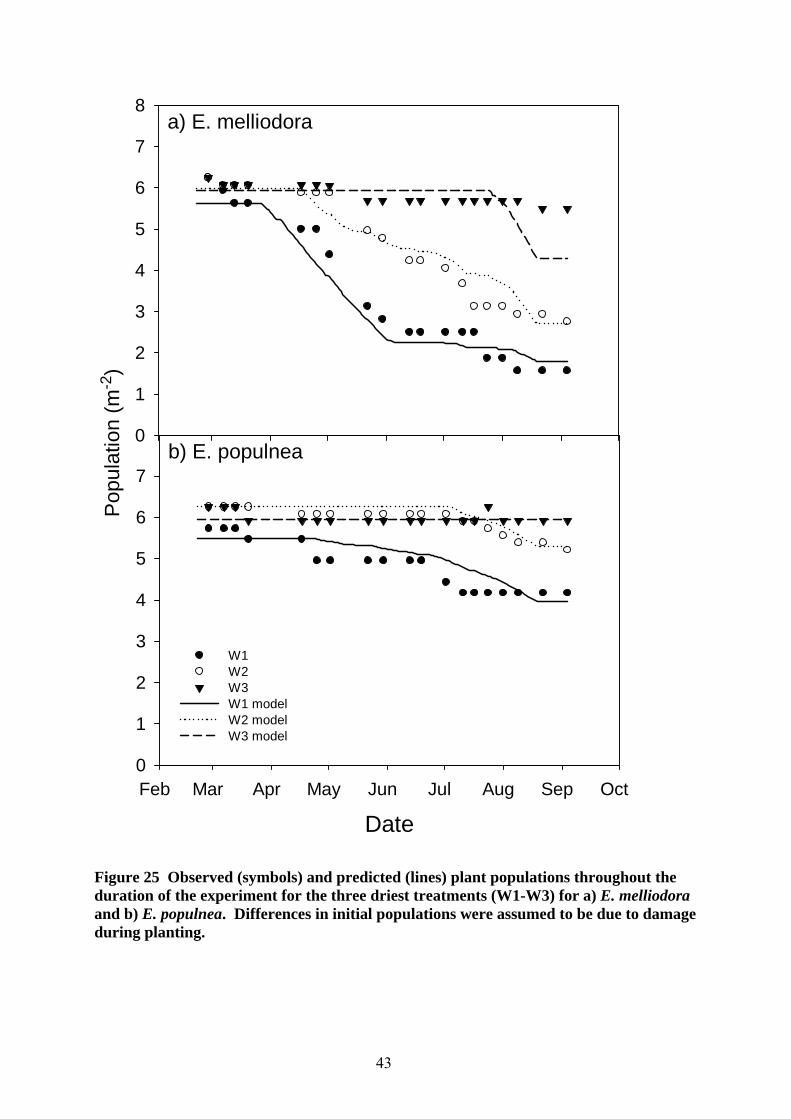
43
DateFeb Mar Apr May Jun Jul Aug Sep Oct
Pop
ulat
ion
(m-2
)
0
1
2
3
4
5
6
7
W1W2W3W1 modelW2 modelW3 model
0
1
2
3
4
5
6
7
8a) E. melliodora
b) E. populnea
Figure 25 Observed (symbols) and predicted (lines) plant populations throughout the duration of the experiment for the three driest treatments (W1-W3) for a) E. melliodora and b) E. populnea. Differences in initial populations were assumed to be due to damage during planting.
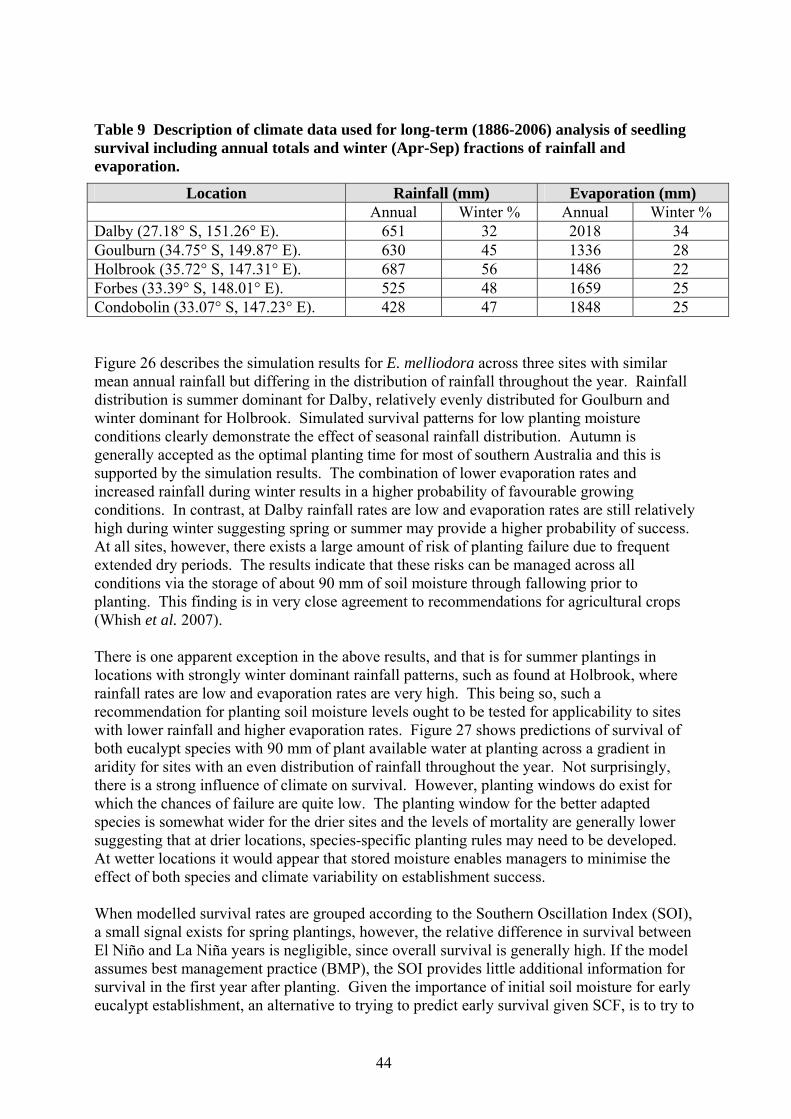
44
Table 9 Description of climate data used for long-term (1886-2006) analysis of seedling survival including annual totals and winter (Apr-Sep) fractions of rainfall and evaporation.
Location Rainfall (mm) Evaporation (mm) Annual Winter % Annual Winter %
Dalby (27.18° S, 151.26° E). 651 32 2018 34 Goulburn (34.75° S, 149.87° E). 630 45 1336 28 Holbrook (35.72° S, 147.31° E). 687 56 1486 22 Forbes (33.39° S, 148.01° E). 525 48 1659 25 Condobolin (33.07° S, 147.23° E). 428 47 1848 25 Figure 26 describes the simulation results for E. melliodora across three sites with similar mean annual rainfall but differing in the distribution of rainfall throughout the year. Rainfall distribution is summer dominant for Dalby, relatively evenly distributed for Goulburn and winter dominant for Holbrook. Simulated survival patterns for low planting moisture conditions clearly demonstrate the effect of seasonal rainfall distribution. Autumn is generally accepted as the optimal planting time for most of southern Australia and this is supported by the simulation results. The combination of lower evaporation rates and increased rainfall during winter results in a higher probability of favourable growing conditions. In contrast, at Dalby rainfall rates are low and evaporation rates are still relatively high during winter suggesting spring or summer may provide a higher probability of success. At all sites, however, there exists a large amount of risk of planting failure due to frequent extended dry periods. The results indicate that these risks can be managed across all conditions via the storage of about 90 mm of soil moisture through fallowing prior to planting. This finding is in very close agreement to recommendations for agricultural crops (Whish et al. 2007). There is one apparent exception in the above results, and that is for summer plantings in locations with strongly winter dominant rainfall patterns, such as found at Holbrook, where rainfall rates are low and evaporation rates are very high. This being so, such a recommendation for planting soil moisture levels ought to be tested for applicability to sites with lower rainfall and higher evaporation rates. Figure 27 shows predictions of survival of both eucalypt species with 90 mm of plant available water at planting across a gradient in aridity for sites with an even distribution of rainfall throughout the year. Not surprisingly, there is a strong influence of climate on survival. However, planting windows do exist for which the chances of failure are quite low. The planting window for the better adapted species is somewhat wider for the drier sites and the levels of mortality are generally lower suggesting that at drier locations, species-specific planting rules may need to be developed. At wetter locations it would appear that stored moisture enables managers to minimise the effect of both species and climate variability on establishment success. When modelled survival rates are grouped according to the Southern Oscillation Index (SOI), a small signal exists for spring plantings, however, the relative difference in survival between El Niño and La Niña years is negligible, since overall survival is generally high. If the model assumes best management practice (BMP), the SOI provides little additional information for survival in the first year after planting. Given the importance of initial soil moisture for early eucalypt establishment, an alternative to trying to predict early survival given SCF, is to try to
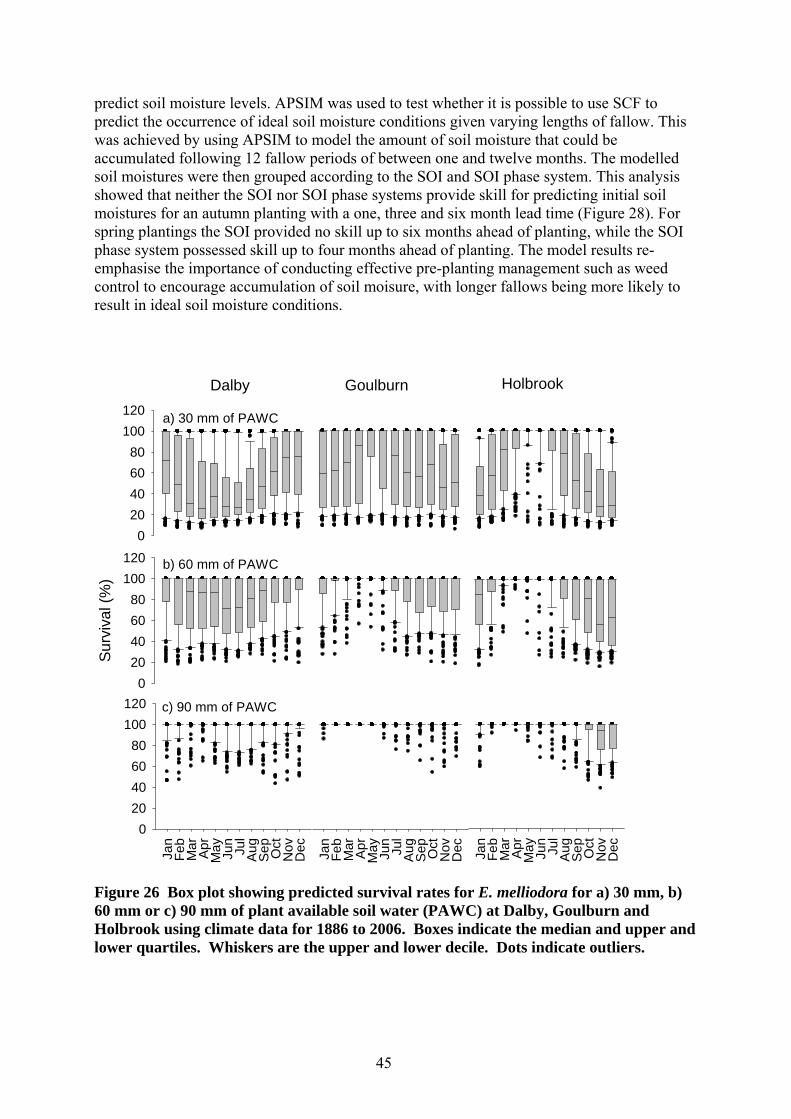
45
predict soil moisture levels. APSIM was used to test whether it is possible to use SCF to predict the occurrence of ideal soil moisture conditions given varying lengths of fallow. This was achieved by using APSIM to model the amount of soil moisture that could be accumulated following 12 fallow periods of between one and twelve months. The modelled soil moistures were then grouped according to the SOI and SOI phase system. This analysis showed that neither the SOI nor SOI phase systems provide skill for predicting initial soil moistures for an autumn planting with a one, three and six month lead time (Figure 28). For spring plantings the SOI provided no skill up to six months ahead of planting, while the SOI phase system possessed skill up to four months ahead of planting. The model results re-emphasise the importance of conducting effective pre-planting management such as weed control to encourage accumulation of soil moisure, with longer fallows being more likely to result in ideal soil moisture conditions.
Jan
Feb
Mar
Apr
May Jun
Jul
Aug
Sep Oct
Nov
Dec
020406080
100120
Surv
ival
(%)
020406080
100120
020406080
100120
Jan
Feb
Mar
Apr
May Jun
Jul
Aug
Sep Oct
Nov
Dec
Dalby Holbrook
Jan
Feb
Mar
Apr
May Jun
Jul
Aug
Sep Oct
Nov
Dec
Goulburn
a) 30 mm of PAWC
b) 60 mm of PAWC
c) 90 mm of PAWC
Figure 26 Box plot showing predicted survival rates for E. melliodora for a) 30 mm, b) 60 mm or c) 90 mm of plant available soil water (PAWC) at Dalby, Goulburn and Holbrook using climate data for 1886 to 2006. Boxes indicate the median and upper and lower quartiles. Whiskers are the upper and lower decile. Dots indicate outliers.
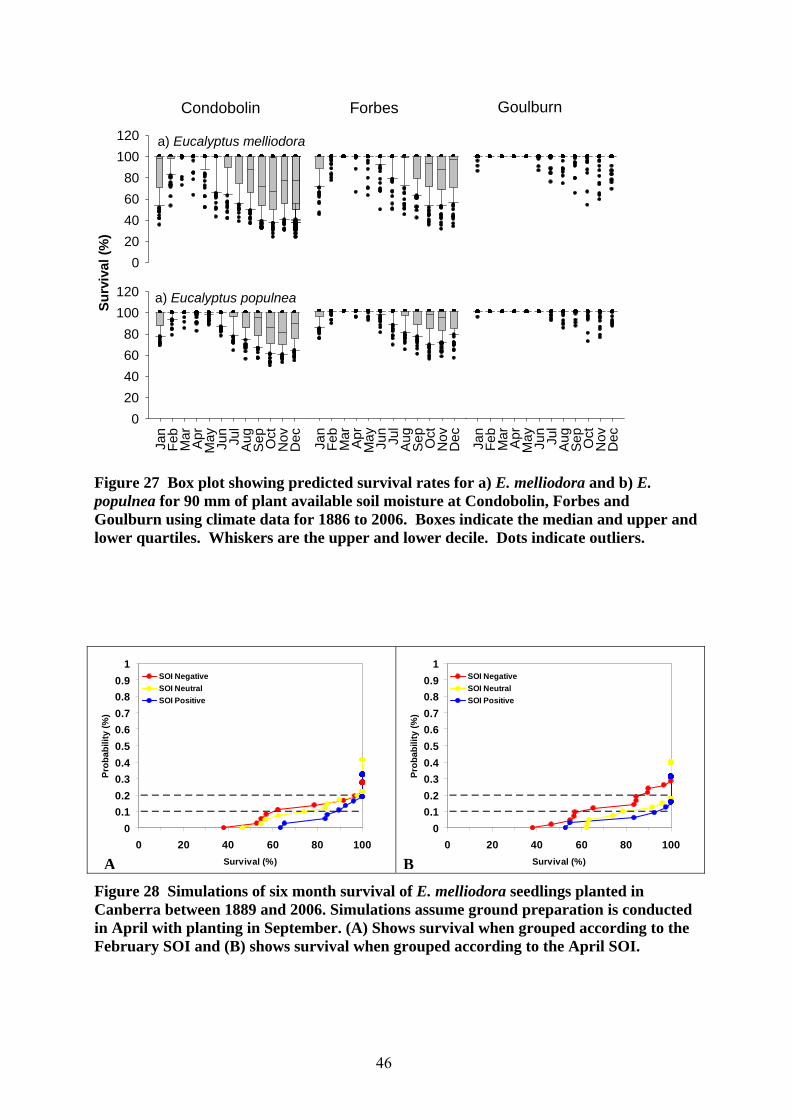
46
Jan
Feb
Mar
Apr
May Jun
Jul
Aug
Sep Oct
Nov
Dec
020406080
100120
020406080
100120
Jan
Feb
Mar
Apr
May Jun
Jul
Aug
Sep Oct
Nov
Dec
Condobolin Goulburn
Jan
Feb
Mar
Apr
May Jun
Jul
Aug
Sep Oct
Nov
Dec
Forbes
a) Eucalyptus melliodora
a) Eucalyptus populneaSurv
ival
(%)
Figure 27 Box plot showing predicted survival rates for a) E. melliodora and b) E. populnea for 90 mm of plant available soil moisture at Condobolin, Forbes and Goulburn using climate data for 1886 to 2006. Boxes indicate the median and upper and lower quartiles. Whiskers are the upper and lower decile. Dots indicate outliers.
Figure 28 Simulations of six month survival of E. melliodora seedlings planted in Canberra between 1889 and 2006. Simulations assume ground preparation is conducted in April with planting in September. (A) Shows survival when grouped according to the February SOI and (B) shows survival when grouped according to the April SOI.
00.10.20.30.40.50.60.70.80.9
1
0 20 40 60 80 100Survival (%)
Prob
abili
ty (%
)
SOI NegativeSOI NeutralSOI Positive
00.10.20.30.40.50.60.70.80.9
1
0 20 40 60 80 100Survival (%)
Prob
abili
ty (%
)
SOI NegativeSOI NeutralSOI Positive
A B

47
Bayesian Belief Network Bayesian Belief Networks are an ideal means of exploring and communicating the utility of SCF in NRM, because they incorporate and present risk, uncertainty and alternative decision pathways using probabilities (Sadoddin et al. 2005). A Bayesian Belief Network (BBN) is a conceptual representation of a system in the form of a cause and effect diagram (Robertson and Wang 2004). There are three main elements of BBN’s (Cain 2001): nodes - representing system variables, each with a finite set of mutually exclusive states; links - representing causal relationships between nodes; and conditional probability tables - one for each node, specifying the belief that a node will be in a particular state given the states of those nodes that directly affect it (its parents). BBN’s allow the use of a combination of observed data and results from model simulations as well as qualitative data, such as expert knowledge (Sadoddin et al. 2005). Their graphical nature makes them ideal for facilitating formal discussion of the system structure with people from a wide variety of backgrounds (Batchelor and Cain 1999). In the context of natural resource management, BBN’s have been useful for integrated modelling of prediction, decision-making, quantitative and qualitative data, addressing both depth of specific processes and breadth of system issues, dealing with uncertainty and probability, and modelling human behaviour (Letcher and Jakeman 2005). A primary advantage of the use of BBN’s is their capability for both forward and backward propagation of probabilities through the network. This allows complex ‘what-if’ analyses to be conducted under various user specified scenarios and conditions (Cain 2001). In addition, BBN’s can be used to analyse the value of additional information – how new information might alter decisions or improve the outcomes of decisions (Hobbs 1997). New information can be valued in terms of economics or in terms of other relevant performance ratings (Hobbs 1997). For these reasons, BBN’s may be useful tools for evaluating the use of seasonal climate forecasts for revegetation practice. This component explores a) The potential utility of SCF for improving revegetation practice and outcomes, based on BBN outputs; and b) The potential utility of BBN’s in revegetation understanding and practice.
Approach
A series of BBN’s were developed representing various aspects of the revegetation industry. These were built drawing on previous work (Graham et al. 2006; Graham 2007; Graham et al. 2007a; Graham et al. 2007b; McGinness et al. 2007), using NETICA software (www.norsys.com). These BBN’s varied in application: some were created using detailed data to describe physical relationships (similar to process-based models); others were created to represent alternative decision pathways. As a result, the range of BBN’s built was also multiscalar: some representing on-site relationships and establishment risk; and others representing industry and economic risk. This report presents a BBN built toward the end of this process, including planting practice and policy-related funding decisions (Figure 29). BBN’s are inherently subjective (Hobbs 1997), and the configuration and outputs of this BBN reflect the authors’ conceptual model of beliefs, assumptions and probabilities derived from expert knowledge. The BBN is a useful tool to develop, test and communicate these ideas and beliefs about the system that it portrays.
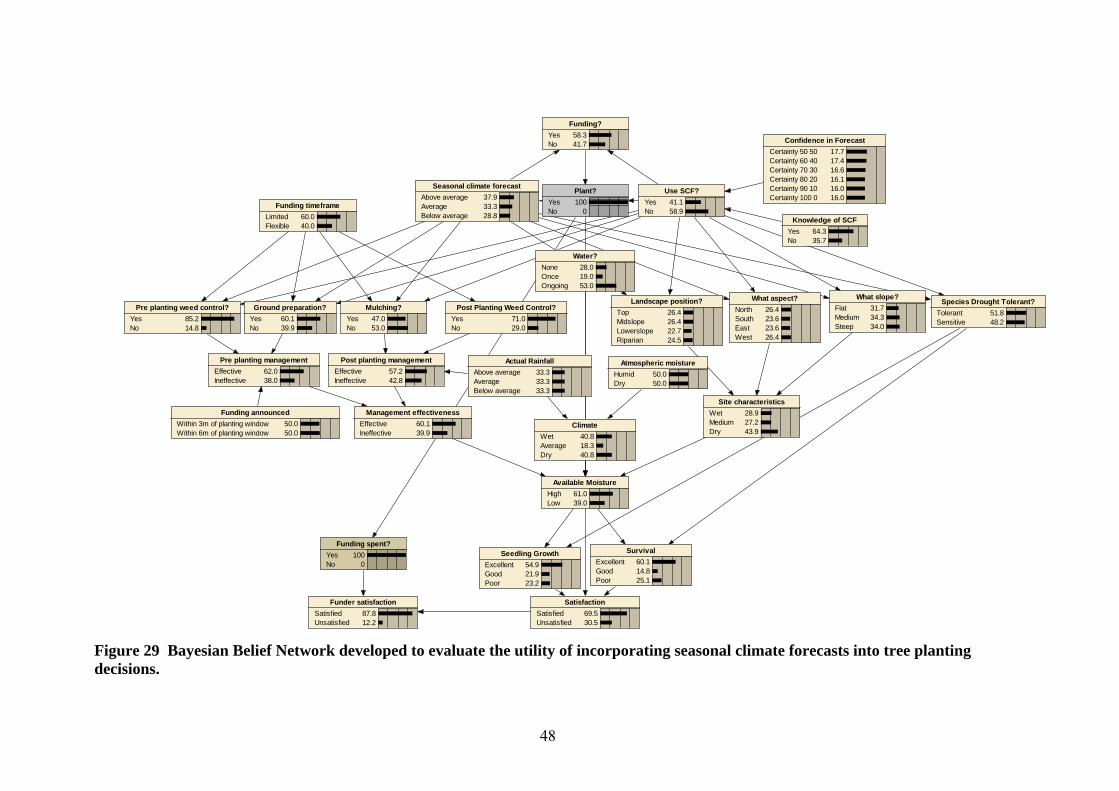
48
Seedling GrowthExcellentGoodPoor
54.921.923.2
SurvivalExcellentGoodPoor
60.114.825.1
SatisfactionSatisfiedUnsatisfied
69.530.5
Plant?YesNo
100 0
Funding?YesNo
58.341.7
Funder satisfactionSatisfiedUnsatisfied
87.812.2
Funding spent?YesNo
100 0
Seasonal climate forecastAbove averageAverageBelow average
37.933.328.8
Use SCF?YesNo
41.158.9
Funding timeframeLimitedFlexible
60.040.0
Available MoistureHighLow
61.039.0
ClimateWetAverageDry
40.818.340.8
Actual RainfallAbove averageAverageBelow average
33.333.333.3
Species Drought Tolerant?TolerantSensitive
51.848.2
Management effectivenessEffectiveIneffective
60.139.9
Funding announcedWithin 3m of planting windowWithin 6m of planting window
50.050.0
Site characteristicsWetMediumDry
28.927.243.9
Atmospheric moistureHumidDry
50.050.0
Pre planting managementEffectiveIneffective
62.038.0
Post planting managementEffectiveIneffective
57.242.8
Pre planting weed control?YesNo
85.214.8
Ground preparation?YesNo
60.139.9
Mulching?YesNo
47.053.0
Post Planting Weed Control?YesNo
71.029.0
Landscape position?TopMidslopeLowerslopeRiparian
26.426.422.724.5
Water?NoneOnceOngoing
28.019.053.0
What aspect?NorthSouthEastWest
26.423.623.626.4
What slope?FlatMediumSteep
31.734.334.0
Confidence in ForecastCertainty 50 50Certainty 60 40Certainty 70 30Certainty 80 20Certainty 90 10Certainty 100 0
17.717.416.616.116.016.0
Knowledge of SCFYesNo
64.335.7
Figure 29 Bayesian Belief Network developed to evaluate the utility of incorporating seasonal climate forecasts into tree planting decisions.

49
One node was created for each variable of interest, with input nodes at the top of the network and output nodes at the bottom. Links and causal relationships were defined manually using a combination of expert knowledge (derived from literature reviews and field experiments) and local knowledge. Node states were also defined manually and sourced from a combination of literature review data, field data and local knowledge data. States were defined in text form, rather than with numerical ranges, to keep the BBN’s generalised. The states were always mutually exclusive, and the number of states kept as low as possible (generally <5). Conditional probability tables for this BBN were produced using three background data sources: Literature reviews (Graham et al. 2007a; McGinness et al. 2007), the Canberra and Wellcamp field experiments (Huth et al. 2007) and local knowledge surveys (Graham et al. 2006; Graham 2007; Graham et al. 2007b).
Scenario evaluation
After compilation of the BBN, evaluation of the effects and importance of various nodes was conducted under different scenarios by altering node states, and observing the changes in other nodes and their states. Firstly, four simple climate-based scenarios were set using the actual and forecast rainfall nodes, with planting constantly set at ‘yes’ (Table 10). These scenarios produced four sets of ‘neutral’ conditions, where other nodes remained unselected/indeterminate. Secondly, a range of ‘what if’ questions were explored within each scenario. Key ‘what if’ questions centred on ‘use of seasonal climate forecasting’; ‘where to plant’; ‘what to plant’; and ‘how to plant’ (site preparation and management effectiveness). The influences of these decisions were evaluated within the BBN in terms of their effect upon the survival and growth of tree seedlings, and hence the satisfaction level of the revegetation practitioner. The network included the effects of climatic variables and allowed comparisons to be made between the outcomes of plantings which do and do not utilise seasonal climate forecasts for planning or decision making. Key policy-related issues centred on the timing of funding announcements relative to planting windows (e.g. within 3 months or 6 months of ideal planting time), and the timeframe within which funding must be spent (e.g. limited vs. flexible). These were compared primarily in terms of their influence upon management effectiveness. Assumptions of the network were that a) soil moisture is the main driver of survival and growth; and b) survival is valued more highly than growth. Thirdly, sensitivity analyses were performed using Netica to test the performance of the network and to evaluate the relative contribution of the use of SCF to the final outcome. These comprised analysis of the sensitivity of ‘satisfaction with planting’ to all other nodes under each scenario, highlighting the relative importance of the use of SCF compared to site management.
Table 10 Forecast and actual rainfall scenarios used in BBN exploration
FORECAST RAINFALL Below average Above average
Below average Scenario 1 Scenario 4
AC
TU
AL
R
AIN
FAL
L
Above average Scenario 3 Scenario 2

50
In this BBN, the primary outcome of interest in terms of planting-related decisions was ‘satisfaction with revegetation’, linked to the key indicators seedling survival and seedling growth. In terms of policy-related funding timeframes, the primary outcome of interest was ‘management effectiveness’. Alteration or selection of node states under the four scenarios allowed evaluation of the results of various decisions, such as whether to use seasonal climate forecasts (SCF); effective site management; drought tolerant species; or wet vs. dry sites. The influence of externally decided factors was also examined, such as the timing of funding announcements, and the funding timeframes within which revegetation must take place. The results of these decisions under each scenario were output as probabilities (%) of management being effective, of survival and growth being excellent or poor, and of overall satisfaction with planting.
Use of seasonal climate forecasts
When below average rainfall conditions are forecast, the use of SCF slightly increases probabilities of satisfaction with planting (and of seedling survival and growth being excellent), however its utility is negligible when above average conditions are forecast, regardless of actual rainfall (Table 11 and Table 12). Indeed, when above average conditions are forecast, the use of SCF is a disadvantage, with slightly lower probabilities of satisfaction, excellent growth and survival (and higher probabilities of poor results). Satisfaction depends partially on maximising planting, however using SCF makes the user slightly less likely to invest in planting. Use of SCF also increases the likelihood of precautionary choices being made, such as the use of drought-tolerant species and more effective management to conserve soil moisture. The influence of these choices is proportionally reduced when soil moisture is abundant (i.e. during above average conditions). Scenario 3 was the only case in which the use of SCF resulted in a probability of excellent survival over the 70% threshold set by practitioners as ‘successful’ (75%). The scenarios with below average actual rainfall (1 and 4) never reached probabilities of excellent survival above this threshold, regardless of the decision or node selection. However selection of effective site management under these scenarios came close to the threshold, reaching 66% and 62% respectively. In contrast, selection of effective site management in scenarios with above average actual rainfall (2 and 3) resulted in probabilities of excellent survival above the 70% threshold (76% and 80%). The sensitivity of ‘satisfaction with planting’ to the use of SCF changes substantially between scenarios (Table 13 and Table 14). The use of SCF has more influence when below average conditions are forecast (Scenarios 1 and 3; ranked 9th and 11th respectively of 25 nodes excluding ‘satisfaction’). When above average conditions are forecast, satisfaction with planting is least sensitive to the use of SCF if above average rainfall actually eventuates (Scenarios 2 and 4; ranked 20th and 15th respectively). In contrast, the sensitivity of the findings to management effectiveness is relatively high (ranked 5th of 25 nodes ‘excluding satisfaction’), but does not change between scenarios.
Management effectiveness
Within each scenario, management effectiveness has the greatest impact upon probabilities relative to all other nodes/states/decisions, with effective management improving the probabilities of planting satisfaction and excellent growth and survival (up to 27% differences), and decreasing the chances of poor survival and growth (up to 20% differences). The influence of site management effectiveness does not substantially change between scenarios (<2% differences).

51
The use of effective site management produces greater probabilities of satisfaction with planting than the use of SCF under all scenarios. For example, under Scenario 1, if SCF is selected as ‘not used’, but management is selected as ‘100% effective’, a similar probability of satisfaction with planting is attainable (73%) to that achieved when SCF was taken into consideration (72%). Selection of these states under Scenarios 2 and 4 produces substantially higher probabilities of satisfaction (84% and 73%) than when SCF was ‘used’ (74% and 60% respectively). Overall, the use of SCF changes the probability of satisfaction with planting (up to 11% differences), however the use of effective management practices has substantially greater influence (up to 23% differences), under all scenarios. This indicates that if effective management techniques are applied as standard practice, the use of SCF may not add any value or certainty to the outcome.
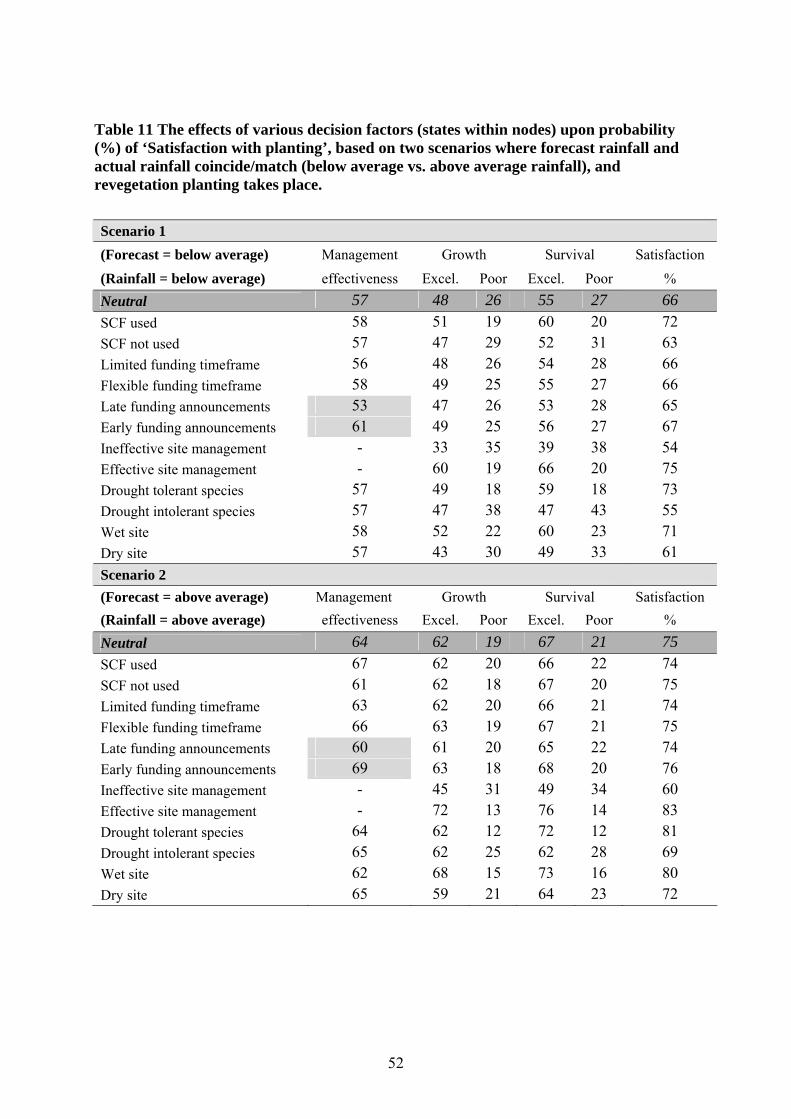
52
Table 11 The effects of various decision factors (states within nodes) upon probability (%) of ‘Satisfaction with planting’, based on two scenarios where forecast rainfall and actual rainfall coincide/match (below average vs. above average rainfall), and revegetation planting takes place. Scenario 1 (Forecast = below average) Management Growth Survival Satisfaction
(Rainfall = below average) effectiveness Excel. Poor Excel. Poor % Neutral 57 48 26 55 27 66 SCF used 58 51 19 60 20 72 SCF not used 57 47 29 52 31 63 Limited funding timeframe 56 48 26 54 28 66 Flexible funding timeframe 58 49 25 55 27 66 Late funding announcements 53 47 26 53 28 65 Early funding announcements 61 49 25 56 27 67 Ineffective site management - 33 35 39 38 54 Effective site management - 60 19 66 20 75 Drought tolerant species 57 49 18 59 18 73 Drought intolerant species 57 47 38 47 43 55 Wet site 58 52 22 60 23 71 Dry site 57 43 30 49 33 61 Scenario 2 (Forecast = above average) Management Growth Survival Satisfaction (Rainfall = above average) effectiveness Excel. Poor Excel. Poor % Neutral 64 62 19 67 21 75 SCF used 67 62 20 66 22 74 SCF not used 61 62 18 67 20 75 Limited funding timeframe 63 62 20 66 21 74 Flexible funding timeframe 66 63 19 67 21 75 Late funding announcements 60 61 20 65 22 74 Early funding announcements 69 63 18 68 20 76 Ineffective site management - 45 31 49 34 60 Effective site management - 72 13 76 14 83 Drought tolerant species 64 62 12 72 12 81 Drought intolerant species 65 62 25 62 28 69 Wet site 62 68 15 73 16 80 Dry site 65 59 21 64 23 72

53
Table 12 The effects of various decision factors (states within nodes) upon probability of ‘Satisfaction with planting’, based on two scenarios where forecast rainfall and actual rainfall do not match, and revegetation planting takes place. Scenario 3 (Forecast = below average) Management Growth Survival Satisfaction
(Rainfall = above average) effectiveness Excel. Poor Excel. Poor % Neutral 62 64 16 70 17 78 SCF used 65 66 12 75 12 83 SCF not used 61 62 18 67 20 75 Limited funding timeframe 62 63 16 70 18 78 Flexible funding timeframe 64 64 16 70 17 78 Late funding announcements 58 63 17 69 18 77 Early funding announcements 67 65 16 71 17 79 Ineffective site management - 47 27 53 29 65 Effective site management - 74 10 80 11 86 Drought tolerant species 63 64 12 74 12 83 Drought intolerant species 62 63 24 63 27 70 Wet site 63 68 13 75 14 82 Dry site 62 59 20 64 22 73 Scenario 4 (Forecast = above average) Management Growth Survival Satisfaction (Rainfall = below average) effectiveness Excel. Poor Excel. Poor % Neutral 59 47 30 51 33 62 SCF used 61 46 31 51 34 60 SCF not used 57 47 29 52 31 63 Limited funding timeframe 58 46 30 51 33 61 Flexible funding timeframe 61 47 30 52 32 62 Late funding announcements 55 45 31 50 33 61 Early funding announcements 63 48 29 52 32 63 Ineffective site management - 31 41 35 44 49 Effective site management - 58 22 62 24 71 Drought tolerant species 59 47 19 57 19 71 Drought intolerant species 59 47 39 47 43 54 Wet site 57 52 25 57 28 67 Dry site 59 44 32 48 35 59
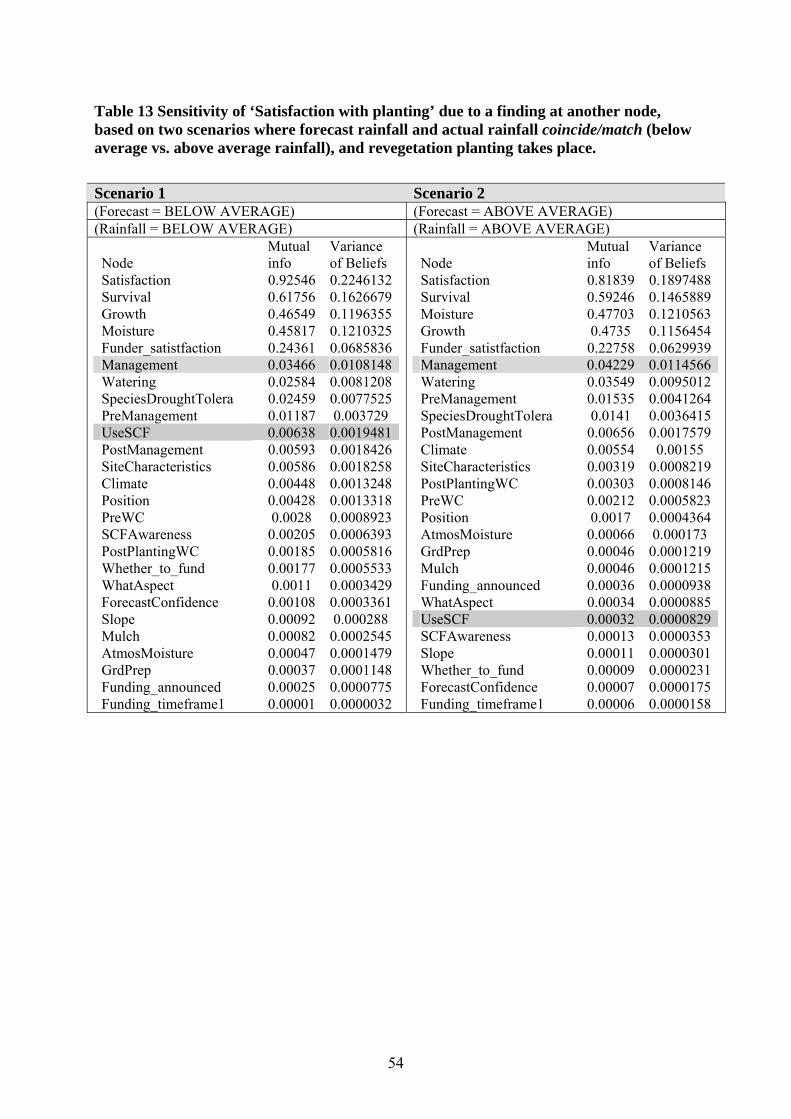
54
Table 13 Sensitivity of ‘Satisfaction with planting’ due to a finding at another node, based on two scenarios where forecast rainfall and actual rainfall coincide/match (below average vs. above average rainfall), and revegetation planting takes place. Scenario 1 Scenario 2 (Forecast = BELOW AVERAGE) (Forecast = ABOVE AVERAGE) (Rainfall = BELOW AVERAGE) (Rainfall = ABOVE AVERAGE)
Node Mutual info
Variance of Beliefs
Satisfaction 0.92546 0.2246132Survival 0.61756 0.1626679Growth 0.46549 0.1196355Moisture 0.45817 0.1210325Funder_satistfaction 0.24361 0.0685836Management 0.03466 0.0108148Watering 0.02584 0.0081208SpeciesDroughtTolera 0.02459 0.0077525PreManagement 0.01187 0.003729 UseSCF 0.00638 0.0019481PostManagement 0.00593 0.0018426SiteCharacteristics 0.00586 0.0018258Climate 0.00448 0.0013248Position 0.00428 0.0013318PreWC 0.0028 0.0008923SCFAwareness 0.00205 0.0006393PostPlantingWC 0.00185 0.0005816Whether_to_fund 0.00177 0.0005533WhatAspect 0.0011 0.0003429ForecastConfidence 0.00108 0.0003361Slope 0.00092 0.000288 Mulch 0.00082 0.0002545AtmosMoisture 0.00047 0.0001479GrdPrep 0.00037 0.0001148Funding_announced 0.00025 0.0000775Funding_timeframe1 0.00001 0.0000032
Node Mutual info
Variance of Beliefs
Satisfaction 0.81839 0.1897488Survival 0.59246 0.1465889Moisture 0.47703 0.1210563Growth 0.4735 0.1156454Funder_satistfaction 0.22758 0.0629939Management 0.04229 0.0114566Watering 0.03549 0.0095012PreManagement 0.01535 0.0041264SpeciesDroughtTolera 0.0141 0.0036415PostManagement 0.00656 0.0017579Climate 0.00554 0.00155 SiteCharacteristics 0.00319 0.0008219PostPlantingWC 0.00303 0.0008146PreWC 0.00212 0.0005823Position 0.0017 0.0004364AtmosMoisture 0.00066 0.000173 GrdPrep 0.00046 0.0001219Mulch 0.00046 0.0001215Funding_announced 0.00036 0.0000938WhatAspect 0.00034 0.0000885UseSCF 0.00032 0.0000829SCFAwareness 0.00013 0.0000353Slope 0.00011 0.0000301Whether_to_fund 0.00009 0.0000231ForecastConfidence 0.00007 0.0000175Funding_timeframe1 0.00006 0.0000158
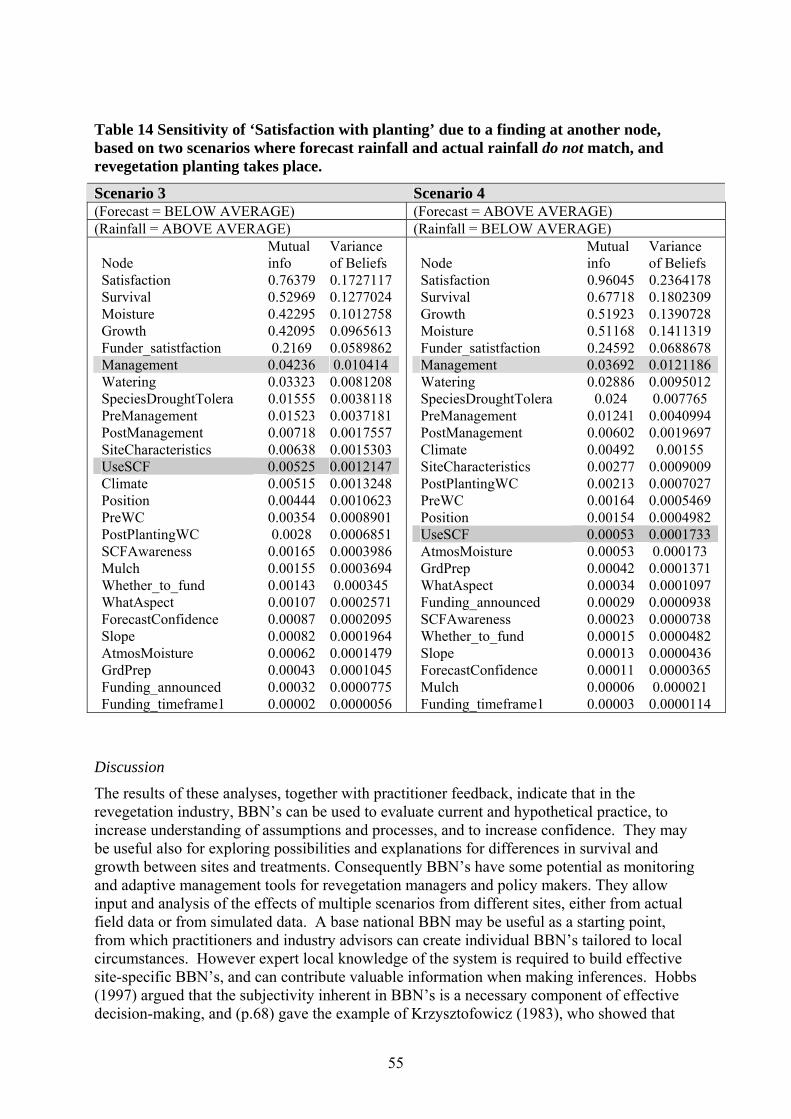
55
Table 14 Sensitivity of ‘Satisfaction with planting’ due to a finding at another node, based on two scenarios where forecast rainfall and actual rainfall do not match, and revegetation planting takes place.
Scenario 3 Scenario 4 (Forecast = BELOW AVERAGE) (Forecast = ABOVE AVERAGE) (Rainfall = ABOVE AVERAGE) (Rainfall = BELOW AVERAGE)
Node Mutual info
Variance of Beliefs
Satisfaction 0.76379 0.1727117Survival 0.52969 0.1277024Moisture 0.42295 0.1012758Growth 0.42095 0.0965613Funder_satistfaction 0.2169 0.0589862Management 0.04236 0.010414 Watering 0.03323 0.0081208SpeciesDroughtTolera 0.01555 0.0038118PreManagement 0.01523 0.0037181PostManagement 0.00718 0.0017557SiteCharacteristics 0.00638 0.0015303UseSCF 0.00525 0.0012147Climate 0.00515 0.0013248Position 0.00444 0.0010623PreWC 0.00354 0.0008901PostPlantingWC 0.0028 0.0006851SCFAwareness 0.00165 0.0003986Mulch 0.00155 0.0003694Whether_to_fund 0.00143 0.000345 WhatAspect 0.00107 0.0002571ForecastConfidence 0.00087 0.0002095Slope 0.00082 0.0001964AtmosMoisture 0.00062 0.0001479GrdPrep 0.00043 0.0001045Funding_announced 0.00032 0.0000775Funding_timeframe1 0.00002 0.0000056
Node Mutual info
Variance of Beliefs
Satisfaction 0.96045 0.2364178Survival 0.67718 0.1802309Growth 0.51923 0.1390728Moisture 0.51168 0.1411319Funder_satistfaction 0.24592 0.0688678Management 0.03692 0.0121186Watering 0.02886 0.0095012SpeciesDroughtTolera 0.024 0.007765 PreManagement 0.01241 0.0040994PostManagement 0.00602 0.0019697Climate 0.00492 0.00155 SiteCharacteristics 0.00277 0.0009009PostPlantingWC 0.00213 0.0007027PreWC 0.00164 0.0005469Position 0.00154 0.0004982UseSCF 0.00053 0.0001733AtmosMoisture 0.00053 0.000173 GrdPrep 0.00042 0.0001371WhatAspect 0.00034 0.0001097Funding_announced 0.00029 0.0000938SCFAwareness 0.00023 0.0000738Whether_to_fund 0.00015 0.0000482Slope 0.00013 0.0000436ForecastConfidence 0.00011 0.0000365Mulch 0.00006 0.000021 Funding_timeframe1 0.00003 0.0000114
Discussion
The results of these analyses, together with practitioner feedback, indicate that in the revegetation industry, BBN’s can be used to evaluate current and hypothetical practice, to increase understanding of assumptions and processes, and to increase confidence. They may be useful also for exploring possibilities and explanations for differences in survival and growth between sites and treatments. Consequently BBN’s have some potential as monitoring and adaptive management tools for revegetation managers and policy makers. They allow input and analysis of the effects of multiple scenarios from different sites, either from actual field data or from simulated data. A base national BBN may be useful as a starting point, from which practitioners and industry advisors can create individual BBN’s tailored to local circumstances. However expert local knowledge of the system is required to build effective site-specific BBN’s, and can contribute valuable information when making inferences. Hobbs (1997) argued that the subjectivity inherent in BBN’s is a necessary component of effective decision-making, and (p.68) gave the example of Krzysztofowicz (1983), who showed that

56
intentionally disregarding such information yields lower expected net benefits for a decision-maker who must use weather forecasts to make decisions about resource allocations. Networks may also be used as communication tools to inform policy, funding bodies, and groups such as Greening Australia and Catchment Management Authorities. If BBN’s are to be used as communication tools, careful explanation is required. It is important to understand and make clear to users the difference between BBN’s and process-based models. Many of the workshop participants consulted as part of this project were accustomed to dealing with process-based models, and it took time for them to comprehend the different way of thinking required to understand the network concept. In particular, workshop participants had some difficulty understanding the baseline or background probabilities displayed by the network, and the concept of back-propagation. These must be clearly explained using actual examples. BBN’s tell a story that is more easily understood by on-ground practitioners and people new to the industry than complex process-based models. They are often less intimidating, and consequently people are more likely to be willing to explore their use. However models in general tend to leave people ‘cold’ – they have slow and arduous uptake, and practitioner feedback indicated that there are many NRM model-based tools available that have not been adopted at all. Adoption requires easily demonstrable value and direct usefulness for on-ground practitioners. In this context, BBN’s can create awareness of the range and importance of different factors, assisting with education and prioritisation. They also make assumptions explicit and testable, revealing personal or organisational biases and knowledge gaps. Importantly, revelation of assumptions, biases and knowledge gaps occurs as part of the BBN construction process, rather than simply through the use of BBN’s as tools. The network builder is constantly challenged, and perspectives are reset throughout the construction process. For example, early preconceived BBN’s developed for this research were complex and detailed, resembling process-based models. This was a natural bias considering the conventional scientific background of the authors. Review and testing of these by both scientists and practitioners revealed that too much complexity and detail entailed a substantial loss of explanatory power, and that it was important to aim for simplicity, identifying and using only key nodes. In addition, BBN’s highlight the dearth of published scientific data describing seemingly simple relationships, while also allowing the user to continue to explore these relationships and their implications in the network without hard data.
Model development summary
The ability of the APSIM module to capture the effects of plant traits such as root to shoot partitioning of growth and resultant potential water demand, leaf to stem partitioning and its effects on canopy development, and finally the effect of cumulative stress on plant mortality is encouraging. Whilst much more could be done to improve and further test the model, the initial investigation suggests that the approaches used in agricultural sciences for studying plant growth, development and mortality have much to offer in the area of eucalypt seedling establishment. Trends in simulated survival rates agree with anecdotal data and support current recommendations for management issues such as planting date and site preparation. Most significantly, the importance of soil moisture storage prior to planting in minimising the risk of failure was evident. Storage of soil moisture before planting can provide an adequate

57
insurance against the risk of failed establishment by removing the reliance on rainfall in a variable climate. The value of planting moisture for cropping within the eastern grain growing regions of Australia is well understood (Freebairn et al. 1991; Whish et al. 2007), and cropping rotations have long been formulated to ensure good planting conditions for high value crops even during drought. The current analysis suggests that traditional good farming practice could also guide best practice for revegetation efforts. The similarity between these findings in a revegetation context, and current farming practice, is likely to assist landholder adoption of best practice management for revegetation. The Bayesian Belief Network presented in this report was built from multiple information sources. These information sources and examination of various scenarios within the BBN indicate that seasonal climate forecasts have limited utility for revegetation practice at present, because they do not add much certainty to decision making relative to other factors (e.g. effective management and site preparation). This becomes apparent when SCF is examined as part of a network within which there are many other controls in place that mitigate the effects of climate. Best practice management techniques are essential and should be a priority, because they are relatively highly ranked, primary determinants of establishment success, and hence strongly influence the satisfaction of revegetation practitioners with planting. In this context, policy flexibility in terms of funding is advantageous, because it improves management effectiveness.
9.4 Workshop A workshop was run on 13 February 2007 with practitioners and researchers. The aims of the workshop were to: • present the results of the project • road-test the APSIM model and Bayesian decision-support tools • explore the “barriers to adoption” of this knowledge and of seasonal climate forecasting • explore pathways forward, documenting gaps between these pathways and our current
knowledge and methods. Fourteen practitioners and researchers attended the workshops. The organisations represented by the participants included: Greening Australia (3), Environment ACT (2), Forests NSW (3), Upper Murrumbidgee Catchment Coordinating Committee (1), CSIRO (1) and ENSIS (1). Three landholders also attended the workshop.
Road-testing APSIM and Bayesian Belief Networks APSIM and BBNs are very different tools, built for distinct purposes. APSIM is a process-based model, whereas BBNs represent people’s beliefs about how a system operates. Perceptions of the usefulness of each model varied according to participant roles in revegetation. Key feedback issues were: • In APSIM it is difficult to see the underlying assumptions – it assumes that soil moisture
is a key factor, rather than looking at its importance relative to other variables (like BBNs, which are bigger-picture)
• Applications such as Yield Prophet (based on APSIM) focus on yields rather than survival, so may be of limited value for tubestock. However by using functional species types, these applications may have value in natural regeneration and direct seeding.
• APSIM may eventually be used to produce background data for BBNs • BBNs are less intimidating than APSIM – people are more likely to be willing to explore
their use

58
• BBNs can be used to confirm good practice, to increase understanding of assumptions and processes, and to increase confidence. They may useful also for exploring possibilities and explanations for differences in survival and growth between sites and treatments
• Models are likely to leave people ‘cold’ – they have slow and arduous uptake. There are many NRM tools available that have not been adopted. Adoption requires easily demonstrable value and direct usefulness for on-ground practitioners.
Barriers and synergies to adoption of seasonal climate forecasting: practitioner feedback Workshop participants indicated that there are a number of factors which inhibit the use of seasonal climate forecasts in tree planting decisions. These include: • Evidence that conducting best management practice reduces climatic risk more than
forecasting – practices such as pre-planting weed control and ground preparation mitigate the effects of extreme seasons
• Forecasts have limited skill in many regions and during some key planting seasons • Forecasts have insufficient lead times for several key revegetation decisions, including
ordering of seedlings, site choice and preparation With regards to opportunities for adoption, seasonal climate forecasting may be useful for decisions relating to: direct seeding; natural regeneration; and nursery expectations for orders. These issues are outside the scope of this project, but may be productive areas for future research.
Feedback summary and pathways forward The aspects that participants like best about the workshop included the quality and relevance of the information; the relaxed, interactive approach and the balanced format; and the many open opportunities for informed discussion from a wide range of diverse people and views. The practical nature of the on-ground research and the discussion of alternative models for planning decisions were valued components of the workshop. The results of the intensive and extensive experiments were well received. Participants were particularly interested in the results of the Wellcamp experiment, where very small differences in initial soil moisture resulted in large differences in seedling growth and mortality. The models were perceived as being currently too general for individual situations and decisions or local circumstances. It was suggested that refined, more locally relevant models may have some application for extension-type staff. However, the key messages of the experiments were thought to be more useful for ensuring successful establishment, and it was requested that they be widely broadcast as part of the final communication phase of this project. Overall, the participants agreed that the workshop met their expectations and that the information was useful and relevant to their current roles. They agreed that the material was presented in a clear and understandable manner, and that there was an appropriate mix of presentations, individual input and group discussions. The information was not thought too technical, and there was enough time to sufficiently cover each topic and ask questions. The workshop booklet was rated as useful, and the workshop as a success.

59
Summary • Early, well-planned site preparation and best practice planting techniques ensure
conservation of soil moisture. Plantings that begin with adequate initial soil moisture have a very high likelihood of achieving excellent establishment success, regardless of subsequent climatic conditions.
• Eucalypt seedlings have multiple strategies to cope with drought, including rapid root extension and leaf ‘shut-down’ mechanisms.
• Seasonal climate forecasting tools currently have very limited usefulness for revegetation practitioners using tubestock, and are unlikely to affect decision-making. This is primarily because of short lead-times, skill and accuracy issues.
• Models may be of use to researchers, followed by agency or extension staff, but are of limited use to on-ground practitioners.
9.5 Conclusions This project has met its overall goal of providing information enabling revegetation providers and commercial forestry operations across Australia to improve on-the-ground establishment outcomes. It has identified key strategies that reduce the risk of establishment failure from adverse climatic conditions, with these dominated by the primary strategy of ensuring adequate initial (at-planting) soil moisture via effective planning and management. Sub-strategies include: • Use best-practice planning and management keys/techniques:
- Ground preparation (e.g. ripping) - Weed control (pre- and post-planting) - Mulching - Watering at planting (if necessary)
• Correct timing of the above is crucial – the further in advance of planting, the greater the effectiveness
• Know your site and soil type, including its water holding capacity and nutrient status • Wise species choice is essential – some species are more sensitive than others.
The utility of seasonal climate forecast information for revegetation tubestock planting is currently limited by short lead times and lack of accuracy. This is because revegetation practitioners typically require lead times of >3 months, ideally >1 year, and prefer accuracy of >80%. In addition, practitioners usually plant in Autumn or Spring. Seasonal climate forecasts currently have lowest accuracy for: a) Autumn; b) the south and west of the continent (where much revegetation currently occurs); and c) >3 month lead times. Climate still matters – but the usefulness of forecasting is outweighed by the usefulness of effective site management for soil moisture conservation, in reducing the impacts of climate variability.

60
10. REFERENCES
Abrecht, D. G. and Carberry, P. S. (1993). The influence of water deficit prior to tassel initiation on maize growth, development and yield. Field Crops Research 31: 55-69. Batchelor, C. and Cain, J. (1999). Application of belief networks to water management studies. Agricultural Water Management 40: 51-57. Cain, J. (2001). Planning improvements in natural resources management: Guidelines for using Bayesian networks to support the planning and management of development programmes in the water sector and beyond. Wallingford UK, Centre for Ecology and Hydrology, Natural Environment Research Council. Carberry, P. S. and Abrecht, D. G. (1991). Tailoring crop models to the semiarid tropics. In: Climatic risk in crop production: Models and management in the semiarid tropics and subtropics. R. C. Muchow and J. A. Bellamy. Wallingford, CAB International: 157-182. Curran, L. M., Caniago, I., Paoli, G. D., Astianti, D., Kusneti, M., Leighton, M., Nirarita, C. E. and Haeruman, H. (1999). Impact of El Nino and logging on canopy tree recruitment in Borneo. Science 286: 2184-2188. Dalgliesh, N. P. and Foale, M. A., Eds. (1998). Soil matters: Monitoring soil water and nutrients in dryland farming. Toowoomba, QLD, Australia, CSIRO Agricultural Production Systems Research Unit. Freebairn, D. M., Littleboy, M., Smith, G. D. and Coughlan, K. J. (1991). Optimising soil surface management in response to climatic risk. In: Climatic risk in crop production: models and management for the semi-arid tropics and subtropics. R. C. Muchow and J. A. Bellamy. Wallingford, UK, CAB International: 283-305. Graham, S. (2007). Local revegetation knowledge: tree planting and direct seeding practices across Australia. Canberra, CSIRO Sustainable Ecosystems. Graham, S., McGinness, H. M. and O’Connell, D. A. (2006). How useful is seasonal climate forecasting for tree planting decisions in south-eastern Australia? Perspectives from local knowledge experts. International Journal of Climatology [submitted]. Graham, S., McGinness, H. M. and O’Connell, D. A. (2007a). Effects of management techniques on eucalypt seedling establishment – a review. Forest Ecology and Management [submitted]. Graham, S., McGinness, H. M. and O’Connell, D. A. (2007b). On-the-ground revegetation practices in Australia – what people do and why [in prep]. Hammer, G. L., Holzworth, D. P. and Stone, R. (1996). The value of skill in seasonal climate forecasting to wheat crop management in a region with high climatic variability. Australian Journal Of Agricultural Research 47(5): 717-737.

61
Harris, P. S., Biggs, A. J. W. and Coutts, A. J., Eds. (1999). Central Darling Downs Land Management Manual, DNRQ990102. Toowoomba, Queensland Department of Natural Resources. Hobbs, B. F. (1997). Bayesian methods for analysing climate change and water resource uncertainties. Journal Of Environmental Management 49: 53-72. Howden, S. M., Crimp, S., Carter, J., O'Connell, D., Carr, D., McIvor, J. and Graham, S. (2004). Enhancing natural resource management by incorporating climate variability into tree establishment decisions. Canberra, Land and Water Australia's Climate Variability in Agriculture Program: 54. Huth, N. I., Carberry, P. S., Cocks, B., Graham, S., McGinness, H. M. and O’Connell, D. A. (2007). Managing drought risk in seedling establishment: an analysis using experiment and model [in prep]. Huth, N. I., Carberry, P. S., Poulton, P. L., Brennan, L. E. and Keating, B. A. (2002). A framework for simulation of agroforestry options for the low rainfall areas of Australia using APSIM. European Journal of Agronomy 18: 171-185. Huth, N. I., Snow, V. and Keating, B. A. (2001). Integrating a forest modelling capability into an agricultural production systems modelling environment - current applications and future possibilities. MODSIM 2001: International Congress on Modelling and Simulation, Australian National University, Canberra, Australia, Modelling and Simulation Society of Australia and New Zealand. Isbell, R. F. (1996). The Australian Soil Classification. In: The Australian Soil and Land Survey Handbook. Melbourne, Victoria, CSIRO Publishing. 4. Keating, B. A., Carberry, P. S., Hammer, G. L., Probert, M. E., Robertson, M. J., Holzworth, D., Huth, N. I., Hargreaves, J. N. G., Meinke, H., Hochman, Z., McLean, G., Verburg, K., Snow, V., Dimes, J. P., Silburn, M., Wang, E., Brown, S., Bristow, K. L., Asseng, S., Chapman, S., McCown, R. L., Freebairn, D. M. and Smith, C. J. (2003). An overview of APSIM, a model designed for farming systems simulation. European Journal of Agronomy 18: 267-288. Letcher, R. and Jakeman, T. (2005). A role for models in integrated assessment. Workshop on Integrated Assessment of Climate Change Impacts. Australian National University, CRES, Australian National University. McGinness, H. M., O’Connell, D. A. and Graham, S. (2007). Eucalypt seedling establishment and the effects of water supply and demand – a review. Forest Ecology and Management [submitted]. Meinke, H. (1996). Improving wheat simulation capabilities in Australia from a cropping systems perspective. PhD. Wageningen Agricultural University, Wageningen. 270. Meinke, H., Hammer, G. L. and Want, P. J. (1993). Potential soil water extraction by sunflower on a range of soils. Field Crops Research 32: 59-81.

62
Menke, N., McKeon, G. M., Hansen, V., Quirk, M. F. and Wilson, B. (1999). Assessing the climatic risk for Stylosanthes establishment in south-east Queensland. People and rangelands: building the future. Proceedings of the 5th International Rangelands Congress, Townsville. Paydar, Z., Huth, N. I. and Snow, V. (2005). Modelling irrigated Eucalyptus for salinity control on shallow watertables. Australian Journal of Soil Research 43: 587-597. Probert, M. E., Dimes, J. P., Keating, B. A., Dalal, R. C. and Strong, W. M. (1998). APSIM's water and nitrogen modules and simulation of the dynamics of water and nitrogen and fallow systems. Agricultural Systems 56(1): 1-28. Robertson, D. and Wang, Q. J. (2004). Bayesian networks for decision analyses - an application to irrigation system selection. Australian Journal of Experimental Agriculture 44: 145-150. Sadoddin, A., Letcher, R. A., Jakeman, A. J. and Newham, L. T. H. (2005). A Bayesian decision network approach for assessing the ecological impacts of salinity management. Mathematics and Computers in Simulation 69: 162-176. Snow, V. O., Smith, C. J., Polglase, P. J. and Probert, M. E. (1999). Nitrogen dynamics in a eucalypt plantation irrigated with sewage effluent or bore water. Australian Journal of Soil Research 37(3): 527-544. Stone, P. J., Wilson, D. R., Jamieson, P. D. and Gillespie, R. N. (2001). Water deficit effects on sweet corn. II. Canopy development. Australian Journal of Agricultural Research 52: 115-126. Whish, J. P. M., Castor, P. and Carberry, P. S. (2007). Managing production constraints to the reliability of chickpea (Cicer arietinium L.) within marginal areas of the northern grains region of Australia. Australian Journal of Agricultural Research 58: 1-10.