Increasing Student Retention - Edith Cowan University › __data › assets › pdf_file › 0004...
10
Centre for Learning and Teaching Centre for Learning and Teaching Tel: +61 8 6304 2554 | Email: [email protected] | Web: intranet.ecu.edu.au/learning 1 CRISCOS IPC 00279B Edith Cowan University This is an example of how you can use the new Blackboard Analytics for Learn reports to increase student retention in your Unit. Blackboard Analytics Increasing Student Retention
Transcript of Increasing Student Retention - Edith Cowan University › __data › assets › pdf_file › 0004...

Centre for Learning and Teaching
Centre for Learning and Teaching Tel: +61 8 6304 2554 | Email: [email protected] | Web: intranet.ecu.edu.au/learning
1 CRISCOS IPC 00279B
Edith Cowan University
This is an example of how you can use the new Blackboard Analytics for Learn reports to increase
student retention in your Unit.
Blackboard Analytics Increasing Student Retention

Centre for Learning and Teaching
Centre for Learning and Teaching Tel: +61 8 6304 2554 | Email: [email protected] | Web: intranet.ecu.edu.au/learning
2 CRISCOS IPC 00279B
Edith Cowan University
Identify students who have not logged in
The Unit at a Glance report
1. Log into the Staff Portal and then click on Blackboard in the Easy Logins section.
2. In the Unit Management menu, under Control Panel, click on the Evaluation menu item to
expand the menu and then select Unit Analytics.
3. On the Unit Analytics page, click on Unit At-a-Glance report link.
Centre for Learning and Teaching
Centre for Learning and Teaching Tel: +61 8 6304 2554 | Email: [email protected] | Web: intranet.ecu.edu.au/learning
3 CRISCOS IPC 00279B
Edith Cowan University
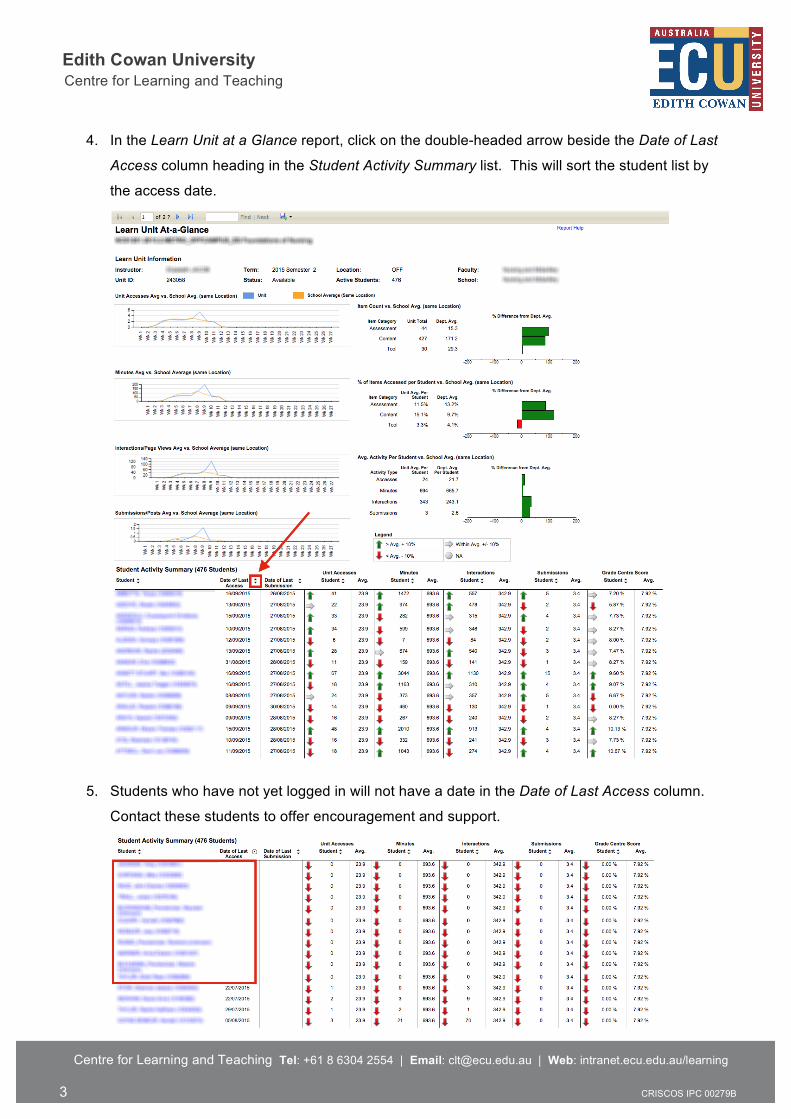
4. In the Learn Unit at a Glance report, click on the double-headed arrow beside the Date of Last
Access column heading in the Student Activity Summary list. This will sort the student list by
the access date.
5. Students who have not yet logged in will not have a date in the Date of Last Access column.
Contact these students to offer encouragement and support.

Centre for Learning and Teaching
Centre for Learning and Teaching Tel: +61 8 6304 2554 | Email: [email protected] | Web: intranet.ecu.edu.au/learning
4 CRISCOS IPC 00279B
Edith Cowan University
Identify students with low interactions
The Activity Matrix report
1. Log into the Staff Portal and then click on Blackboard in the Easy Logins section.
2. In the Unit Management menu, under Control Panel, click on the Evaluation menu item to
expand the menu and then select Unit Analytics.
3. On the Unit Analytics page, click on Activity Matrix report link.
4. To identify students with low interactions, click on the double-headed arrow beside the
Interactions column heading. This will sort the student list by their interaction ranking in the
site.
Centre for Learning and Teaching
Centre for Learning and Teaching Tel: +61 8 6304 2554 | Email: [email protected] | Web: intranet.ecu.edu.au/learning
5 CRISCOS IPC 00279B
Edith Cowan University
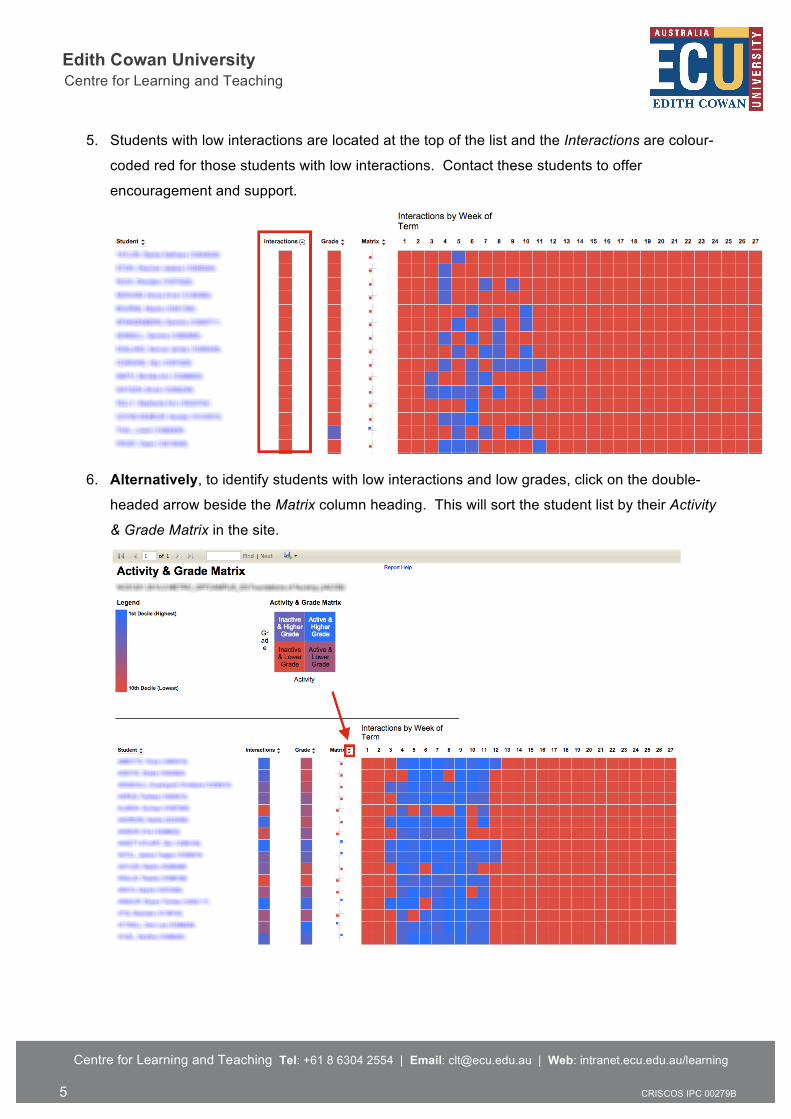
5. Students with low interactions are located at the top of the list and the Interactions are colour-
coded red for those students with low interactions. Contact these students to offer
encouragement and support.
6. Alternatively, to identify students with low interactions and low grades, click on the double-
headed arrow beside the Matrix column heading. This will sort the student list by their Activity
& Grade Matrix in the site.
Centre for Learning and Teaching
Centre for Learning and Teaching Tel: +61 8 6304 2554 | Email: [email protected] | Web: intranet.ecu.edu.au/learning
6 CRISCOS IPC 00279B
Edith Cowan University
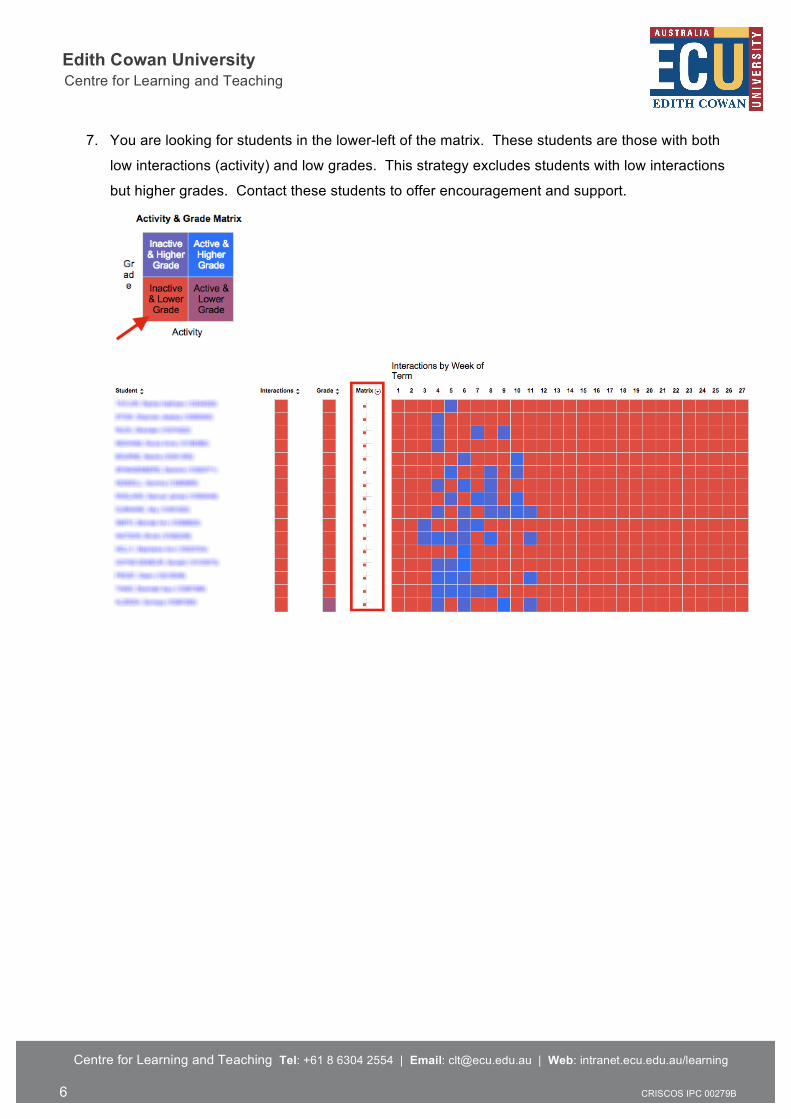
7. You are looking for students in the lower-left of the matrix. These students are those with both
low interactions (activity) and low grades. This strategy excludes students with low interactions
but higher grades. Contact these students to offer encouragement and support.

Centre for Learning and Teaching
Centre for Learning and Teaching Tel: +61 8 6304 2554 | Email: [email protected] | Web: intranet.ecu.edu.au/learning
7 CRISCOS IPC 00279B
Edith Cowan University
Identify students with concerning outcomes
The Activity and Grade Scatter Plot report
1. Log into the Staff Portal and then click on Blackboard in the Easy Logins section.
2. In the Unit Management menu, under Control Panel, click on the Evaluation menu item to
expand the menu and then select Unit Analytics.
3. On the Unit Analytics page, click on Activity and Grade Scatter Plot report link.
4. Students are plotted as blue dots, students with low outcomes will appear at the bottom of the
Y-axis (Grade Centre Score) of the plot.

Centre for Learning and Teaching
Centre for Learning and Teaching Tel: +61 8 6304 2554 | Email: [email protected] | Web: intranet.ecu.edu.au/learning
8 CRISCOS IPC 00279B
Edith Cowan University
5. Hover your mouse over a dot to display their name and student Id. Click on the dot to load the
Student at a Glance report for this student. Contact these students to offer encouragement and
support.
6. You can use the Student at a Glance report to understand where and how the student is falling
short in their interactions and outcomes in the unit.
Student’s Unit Accessed: how many times they have logged into the unit site.
Your Submissions: the number of assignment submissions.
Your interactions: the count of the student’s activity in the unit site.
Student’s Time in Unit: time spent in minutes in your unit site.
Content Access Statistics: the number of times the students has accessed individual content
items in your unit site, as well as the time spent on each item.

Centre for Learning and Teaching
Centre for Learning and Teaching Tel: +61 8 6304 2554 | Email: [email protected] | Web: intranet.ecu.edu.au/learning
9 CRISCOS IPC 00279B
Edith Cowan University
Review learning resource use
The Unit Submission Summary report
1. Log into the Staff Portal and then click on Blackboard in the Easy Logins section.
2. In the Unit Management menu, under Control Panel, click on the Evaluation menu item to
expand the menu and then select Unit Analytics.
3. On the Unit Analytics page, click on Unit Submission Summary report link.

Centre for Learning and Teaching
Centre for Learning and Teaching Tel: +61 8 6304 2554 | Email: [email protected] | Web: intranet.ecu.edu.au/learning
10 CRISCOS IPC 00279B
Edith Cowan University
4. The Unit Submission Summary report shows the individual content items in your site, detailing
the number of students who accessed the item, total number of times the item has been
accessed, dates of access, and the average time per access for each item.
Use this report to debrief yourself and your team on how students actually interacted with your
content and use this information to review unit design and resources used in the unit.
5. You can also export this report for manipulating in Microsoft Excel. Click on the Save icon.
Then select Excel to download this report in an Excel-compatible format. Alternatively, you can
download the report in a CSV format for greater ability to manipulate the data in Excel.