
Increasing Reading Skills in Rural Areas: An Analysis...
19
Correspondence concerning this article should be addressed to Jean Stockard, Director of Research, National Institute for Direct Instruction and Professor Emerita, University of Oregon, P. O. Box 11248, 805 Lincoln Street, Eugene, OR 97440. E-mail: [email protected] and curriculum development. While large districts may have curriculum specialists charged with providing such on- site support to teachers, smaller districts may be less likely to have these resources (McNeil, 2009). In an analysis of the research literature regarding rural education, Arnold and associates noted this concern. They suggested that identifying ways to help rural schools improve teachers’ “pedagogical skills in ways that have the greatest impact on student achievement” should be a priority area of research in rural education (Arnold, Newman, Gaddy, & Dean, 2005, p. 18). This article addresses that priority. I examined changes in reading skills through the primary grades of students in three rural, Midwestern districts that occurred after the implementation of a highly structured and explicit reading curriculum with associated implementation support and guidance. Using a quasi-experimental, cohort control group design I compared reading skills of students who had the curriculum from the beginning of kindergarten with two groups: (a) students who began the curriculum after their kindergarten years and (b) national- and state-level student The majority of school districts in the United States are relatively small. Close to half (47.5%) have fewer than 1000 students, and almost three-quarters (71.5%) have fewer than 2,500 students (NCES, 2008). Like larger districts around the country, these small districts, almost all of which are in rural areas, are required to meet state and national standards regarding increased achievement. Small districts have some characteristics, such as limited bureaucracy and the ability to develop personal relationships among staff, students, and parents, which might help in promoting higher achievement (Barley & Beesley, 2007; Stern, 1995). At the same time, however, small districts may face special challenges in meeting new standards and requirements, especially in areas such as staff training, scheduling for special needs, Reviews of research on rural education suggest that identifying ways to help rural schools improve teachers’ pedagogical skills should be a high priority. This article addresses this issue by examining changes in reading skills through the primary grades of students in three rural, Midwestern districts that occurred after the implementation of a highly structured and explicit reading curriculum (Reading Mastery) with implementation-associated support and guidance. Using a cohort control group design, reading skills of students who had the curriculum from the beginning of kindergarten (full exposure cohorts) were compared with those of students who began the curriculum in later years. By the middle of kindergarten, those in the full exposure cohorts had significantly higher DIBELS scores than students in the other cohorts and scores that were equal to or higher than a national sample. Differences remained strong and significant through grade 3, and effect sizes generally surpassed usual standards of educational significance. Data were available on scores on state reading examinations for fourth graders in one of the districts, and similar results were found. The findings illustrate how rural districts in a sparsely populated state can support teachers’ pedagogical development and how this support can translate into higher student achievement. Citation: Stockard, J. (2011). Increasing reading skills in rural areas: An analysis of three school districts. Journal of Research in Rural Education, 26(8), 1-19. Retrieved from http://jrre.psu.edu/ articles/26-8.pdf Jean Stockard National Institute for Direct Instruction University of Oregon Journal of Research in Rural Education, 2011, 26(8) Increasing Reading Skills in Rural Areas: An Analysis of Three School Districts
Transcript of Increasing Reading Skills in Rural Areas: An Analysis...

Correspondence concerning this article should be addressed to Jean Stockard, Director of Research, National Institute for Direct Instruction and Professor Emerita, University of Oregon, P. O. Box 11248, 805 Lincoln Street, Eugene, OR 97440. E-mail: [email protected]
and curriculum development. While large districts may have curriculum specialists charged with providing such on-site support to teachers, smaller districts may be less likely to have these resources (McNeil, 2009). In an analysis of the research literature regarding rural education, Arnold and associates noted this concern. They suggested that identifying ways to help rural schools improve teachers’ “pedagogical skills in ways that have the greatest impact on student achievement” should be a priority area of research in rural education (Arnold, Newman, Gaddy, & Dean, 2005, p. 18).
This article addresses that priority. I examined changes in reading skills through the primary grades of students in three rural, Midwestern districts that occurred after the implementation of a highly structured and explicit reading curriculum with associated implementation support and guidance. Using a quasi-experimental, cohort control group design I compared reading skills of students who had the curriculum from the beginning of kindergarten with two groups: (a) students who began the curriculum after their kindergarten years and (b) national- and state-level student
The majority of school districts in the United States are relatively small. Close to half (47.5%) have fewer than 1000 students, and almost three-quarters (71.5%) have fewer than 2,500 students (NCES, 2008). Like larger districts around the country, these small districts, almost all of which are in rural areas, are required to meet state and national standards regarding increased achievement. Small districts have some characteristics, such as limited bureaucracy and the ability to develop personal relationships among staff, students, and parents, which might help in promoting higher achievement (Barley & Beesley, 2007; Stern, 1995). At the same time, however, small districts may face special challenges in meeting new standards and requirements, especially in areas such as staff training, scheduling for special needs,
Reviews of research on rural education suggest that identifying ways to help rural schools improve teachers’ pedagogical skills should be a high priority. This article addresses this issue by examining changes in reading skills through the primary grades of students in three rural, Midwestern districts that occurred after the implementation of a highly structured and explicit reading curriculum (Reading Mastery) with implementation-associated support and guidance. Using a cohort control group design, reading skills of students who had the curriculum from the beginning of kindergarten (full exposure cohorts) were compared with those of students who began the curriculum in later years. By the middle of kindergarten, those in the full exposure cohorts had significantly higher DIBELS scores than students in the other cohorts and scores that were equal to or higher than a national sample. Differences remained strong and significant through grade 3, and effect sizes generally surpassed usual standards of educational significance. Data were available on scores on state reading examinations for fourth graders in one of the districts, and similar results were found. The findings illustrate how rural districts in a sparsely populated state can support teachers’ pedagogical development and how this support can translate into higher student achievement.
Citation: Stockard, J. (2011). Increasing reading skills in rural areas: An analysis of three school districts. Journal of Research in Rural Education, 26(8), 1-19. Retrieved from http://jrre.psu.edu/articles/26-8.pdf
Jean StockardNational Institute for Direct Instruction
University of Oregon
Journal of Research in Rural Education, 2011, 26(8)
Increasing Reading Skills in Rural Areas: An Analysis of Three School Districts

2 STOCKARD
The present work shares this philosophical orientation and research aim, focusing on the improvement of reading skills of elementary students in rural settings.
Reading Research
Reading experts stress that early development of reading has a long-term impact on a child’s future. Some (e.g., Stanovich, 1986) have used the term “Matthew effect,” using the Biblical quotation that the “rich get richer and the poor get poorer,” to describe the cumulative effects of good or poor reading skills on later academic success. A large body of empirical evidence demonstrates that children who can read fluently in first grade have much more success throughout their school careers. Early reading fluency results in exposure to much greater volume of material, and thus also produces a strikingly greater accumulation of vocabulary, language skills, and general knowledge (Cunningham & Stanovich, 1998; Gough & Juel, 1991; Juel, 1988; Stanovich, 1986).
An even larger body of research, spanning several decades, has documented the importance of systematic and explicit instruction in promoting reading achievement. In a review of the literature, Arrasmith (2002) defined explicit reading instruction as being unambiguous and clear, leaving a student “no need for inference or difficulty in understanding instruction” (p. 2). Examples of strategies used in such programs include clear instructional targets, modeling, guided and independent practice with corrections, and assessments embedded within the instruction. Arrasmith defines systematic curriculum as a “logical, research-based sequence of educational activities” (p. 4). Systematic curricula include a comprehensive scope and strategic sequence of instruction, and a consistent instructional format. Individual studies as well as extensive meta-analyses show that curricula that embody these elements consistently produce larger achievement gains (e.g., Adams, 1990; Anderson, Hiebert, Scott, & Wilkinson, 1985; Baker, Kameenui, Simmons, & Stahl, 1994; Bond & Dykstra, 1967; Chall, 1967; Foorman, 1995; Fukkink & deGlopper, 1998; Grossen,1997; Institute of Child Health and Human Development [ICHHD], 2000; Juel & Minden-Cupp, 2000; Murphy, 2004; National Reading Panel, 2000; National Institute of Child Health and Human Development [NICHHD], 1996; Pflaum, Walberg, Karigianes, & Rasher, 1980; Smith et al., 2001; Snider, 1990; Snow, Burns, & Griffin, 1998; Stanovich, 1994).
This analysis focuses on the implementation of one well-established systematic and explicit reading program, Reading Mastery (RM), which is part of the Direct Instruction (DI) corpus of curricula. The DI model was first developed about four decades ago based on work
data. The analysis addresses the issues raised by Arnold and colleagues (2005) by providing an example of how rural districts in a sparsely populated state can support teachers’ pedagogical development, and how this support can translate into higher student achievement.
Related Literature
The scholarly literature that underlies my work comes from analyses of research on the needs of rural schools, the most effective curricular approaches for promoting student literacy, and the role of implementation support in helping teachers deliver curricula.
Rural Education Research
Observers of rural education research have termed it “scant,” noting that the area has received much less attention than urban education (e.g., Mulkey, 1993; Stern, 1994; both cited in Sherwood, 2000). The most comprehensive recent review of research on rural education is undoubtedly that of Arnold, Newman, Gaddy, and Dean (2005). Systematically examining studies that appeared over a number of years, Arnold and associates developed a research agenda for rural school improvement including improving students’ “opportunity to learn,” promoting teacher quality and professional development, and strengthening the capacity of rural schools and districts to improve student achievement.
In a rather provocative exchange, commentators challenged this agenda, implying that it ignored the “meaningfulness” of rural life (Howley, Theobald, & Howley, 2005). In a response, one of the original authors and a colleague restated the underlying premise of their review:
[A]ll children and schools, including those in rural settings, deserve access to the very best information about high-quality and effective schooling…. It is no longer adequate, in this day and age of research sophistication, to argue the value and success of rural education based solely on belief in and passion for rural communities. Nor is it adequate to argue that rural education is too unique to be the subject of rigorous research, or that scientific inquiry and sound decision-making are not relevant to rural education and communities. We must move beyond these beliefs and philosophical conjecture toward more rigorous research-based knowledge that gives us the information needed to direct and improve rural educational systems. (Cicchinelli & Dean, 2005, pp. 1, 2)
3READING SKILLS IN RURAL AREAS
studies have found that the gap between students in programs such as RM and those in traditional programs is greater for students when the RM teachers have implemented the program with higher fidelity (Carlson & Francis, 2002; Gersten, Carnine, Zoref, & Cronin, 1986). Similarly, studies that have focused only on students receiving RM and similar programs have found the highest achievers in classrooms or schools that have higher levels of fidelity of implementation (Benner, Nelson, Stage, & Ralston, 2010; Gersten, Carnine, & Williams, 1982; Ross et al., 2004).
However, reflecting the general body of educational research, all but one of these studies occurred in urban settings, and the exception (Benner et al., 2010) combined data from rural and urban schools. As noted above, rural areas may experience unique issues in providing ongoing technical support and assistance. Thus, it is important to examine attempts to improve student achievement and assist teachers in these settings. This study begins to fill that gap by examining changes in student achievement in three rural school districts as they implemented an explicit, structured curriculum with technical assistance from an outside support group. The analysis provides an example of how smaller districts in isolated regions of the country can help their students meet universal standards of achievement. Based on the literature reviewed above, it was expected that students who received the more structured and explicit curriculum would have higher reading achievement than the national norm, but that these differences would be greatest for students who were most fully exposed to the model.
Methodology
The sections below describe the sample used in the study; the procedures, including the curriculum and implementation support provided to the schools; and the measures and analysis techniques that were used.
Sample and Design
The sample included students from three rural districts in a Midwestern state. In 2009, fewer than two million people lived in the state, most of them in rural areas. The largest city had a population of fewer than 500,000, and more than half the state’s residents lived in communities smaller than 30,000 in population. In general, the state was sparsely populated, with a population density of 22.3 people per square mile compared to 79.6 for the nation as a whole.
All the districts served students in a central small community and surrounding towns and rural areas and had more students with an at-risk status than in the state as a whole. District A was based in a community with about 9,000 residents and served approximately 1,700 students in
with preschoolers in an “at-risk” population (Engelmann, 2007). All DI programs seek efficiency and effectiveness of instruction through program design, organization of instruction, and positive student-teacher interaction. The approach attempts to control all the major variables that impact student learning through the placement and grouping of students into instructional groups, the rate and type of examples presented by the teacher, the wording that teachers use to teach specific concepts and skills, the frequency and type of review of material introduced, the assessment of students’ mastery of material covered, and the responses by teachers to students’ attempts to learn the material. The programs are constructed according to a small-step design that teaches isolated skills and concepts in separate tracks that are systematically integrated with skills and concepts in other tracks in increasingly sophisticated applications. For this reason, lessons do not focus on a single skill or topic. Instead, only about 10% of a lesson’s contents are new. The rest of the lesson is devoted to reviewing and applying skills and concepts that were introduced in previous lessons. Placement in the program is a critical factor in the program’s success as appropriate placement allows students to learn new concepts and skills each day (Collins & Carnine, 1988; Engelmann, 2007; Engelman & Carnine, 1982; Gersten, Darch, & Gleason, 1988; Huitt, Monetti, & Hummel, 2009). A number of meta-analytic studies indicate that students who receive reading instruction in this approach have higher levels of reading achievement and stronger growth in reading skills over time than students in other curricula. These results appear with all of the measures typically used to measure reading achievement, including reading fluency, vocabulary, and comprehension (e.g., Adams & Engelmann, 1996; American Federation of Teachers [AFT], 1998; Beck & McCaslin, 1978; Borman, Hewes, Overman, & Brown, 2003; Hattie, 2009; Herman et al., 1999).
Supporting Teachers
Numerous educational researchers have highlighted the importance of technical assistance in promoting teachers’ skills and the fidelity with which they implement curricula. The literature increasingly recognizes that teaching is a highly technical and involved process, and that training and support are crucial for developing and honing excellent instructional skills. Studies also suggest that this assistance should be ongoing and intensive, ideally involving on-site support (Blakeley, 2001; Berends, Bodilly, & Kirby, 2002; Bodilly, 1998; Bodilly, Glennan, Kerr, & Galegher, 2007). Such support may be especially important for systematic and explicit curricula such as RM, which involve a broad array of behaviors and actions for complete implementation (Engelmann & Engelmann, 2004). As would be expected,

4 STOCKARD
risk, with over half receiving free or reduced lunch and/or belonging to a racial-ethnic minority. (See Table 1.)
District B was based in a community of 7,800 people and had about 2,200 students enrolled in the 2008-2009 school year. The district included a preschool, four elementary schools, a junior high school, and a high school. Compared to the state as a whole, the district had slightly more students in poverty (42%) and significantly more minority students, almost all of whom were Hispanic (25%). Over 800 students, taught by 69 different teachers, were in
2008-2009. It included a preschool; two elementary schools, one serving grades K-2 and the other serving grades 2-4; a middle school; and a high school. In 2008-2009 the district had a slightly higher percentage of students receiving free and reduced lunch than the state as a whole (42% vs. 39%) and a percentage of Hispanic students that was twice that of the state (18% vs. 9%). A total of 726 students, taught by 42 different teachers, were in the study. The students in the study (grades K-3) were slightly more likely than those in the district as a whole (grades K-12) to be considered at
Table 1Sample Size Data by Site and Grade
Number of students with dataDistrict A District B District C Total
Kindergarten 470 791 94 1355First grade 275 447 59 781Second grade 456 591 89 1136Third grade 340 440 65 845
At-risk statusDistrict A District B District C Total
Racial-ethnic minority 31% 32% 7% 30%Free/reduced lunch 47% 51% 46% 49%At-risk status 53% 60% 47% 56%
Number of teachersDistrict A District B District C Total
Kindergarten 10 17 4 31First grade 16 16 2 34Second grade 10 21 1 32Third grade 6 15 1 22
Number of schoolsDistrict A District B District C Total
Kindergarten 1 4 1 6First grade 1 4 1 6Second grade 2 4 1 7Third grade 1 4 1 7
Cohort grouping by siteDistrict A District B District C Total
Partial model 577 150 75 802Full model 149 692 46 887Total 726 842 121 1689Note. The number of students reported in the first panel refers to those with any data for a given year. See Tables 2 and 4 for the exact number of students in each cohort group with data for a given testing point. At-risk status is defined as belonging to racial-ethnic minority and/or receiving free or reduced lunch.
5
and making possible only historical controls; and (4) an organization’s archival records can be used for constructing and then comparing cohorts. (Shadish et al., 2002, pp. 148-149, emphasis in original; see also Cook & Campbell, 1979, pp. 126-127, and Campbell & Stanley, 1963, pp. 56-61)
These classic writings on research design stress that a cohort control group design is especially useful in countering “reactive effects,” which are common when employing random assignment in institutional settings (Campbell & Stanley, 1963, p. 57).
The cohorts and settings used in my study met each of the four criteria outlined by Shadish and associates (2002). I compared the at-risk status of students in the cohort groupings for each site, using two standard measures: the proportion of students receiving free or reduced lunch, and the proportion of racial-ethnic minorities. I also combined these indicators, looking at the proportion of students with either of these risk factors. Two-way analyses of variance, with site and cohort (full versus partial exposure) as factors, resulted in no significant interaction effects and no significant differences between the cohort groups on any of the variables, indicating that there were no differences between the cohort groups in their at-risk status. There were, however, significant differences between sites in the proportion of minority students, reflecting the much lower percentage in District C. As an example of the results, for “at risk status” Fsite = 3.01, p = .05; Ffull exposure = .093, p = .760; and Finteraction = .833, p = .44). As noted below, I controlled for site differences in the multivariate analyses. In short, there is no reason to suspect that the two sets of cohorts differed in anything other than the nature of their exposure to the RM curriculum.
Secondary comparative data were available for two larger populations, one national in scope and one state-wide in nature. The first data were from all schools participating in the Dynamic Indicators of Basic Early Literacy Skills (DIBELS) system in the 2001-2002 academic year (Good, Wallin, Simmons, Kame’enui, & Kaminski, 2002). While the participating schools represented all areas of the country, they may not be representative of the nation, and, as noted by Good and associates (2002), may, because of their investment in the measurement system, be more likely than other districts to be committed to the improvement of early reading. The second source of comparative data was the state department of education for the state in which the schools were located. All schools in the state were required to participate in the statewide data gathering procedure, and thus this source provided comparative information for the state as a whole.
the study (see Table 1). Slightly less than two-thirds of the students were considered at risk, according to their free or reduced lunch and/or racial-ethnic minority status.
District C was the smallest district in the analysis, based in a community of 1,000 residents and serving about 300 students in the 2008-2009 year. Students came from three different communities and the surrounding rural areas. They studied in two school sites, one serving students in grades K-3 and the other serving students in grades 4-12. In 2008-2009 over half of the students (54%) qualified for free or reduced lunch, substantially more than in the state as a whole, but there were very few Hispanic students. As shown in Table 1, there were 121 students, taught by eight different teachers, included in the study from this site, and almost half the students were considered at risk.
The districts fully implemented the new curriculum in different years: the fall of 2007 for District A, the fall of 2004 for District B, and the fall of 2006 for District C. In addition, they differed slightly in the years for which data were available. To maximize sample size, I combined data for the three districts and compared results for two cohorts of students: (a) those with full exposure to the curriculum, starting kindergarten in the first year of implementation or later (n=887), and (b) those with less than full exposure, beginning school prior to the first year of implementation (n= 802). Full details on years of implementation and data availability are given in Appendix A. The results did not differ when data were analyzed for each district separately. The results also did not differ when data were analyzed using yearly cohorts rather than grouping the years of data into two discrete groups. These results are available upon request from the author.
The classic research design literature describes this design as a “cohort control group design” (Cook & Campbell, 1979, pp. 126-133; Shadish, Cook, & Campbell, 2002, p. 137) and/or a “recurrent institutional cycle design” (Campbell & Stanley, 1963, pp. 57-60). It is suggested as a valid and useful alternative to randomized control trials in organizational and field settings:
Many institutions experience regular turnover as one group “graduates” to another level and their place is taken by another group. Schools are an obvious example of this, as most children are promoted from one grade to the next each year….The term cohort designates the successive groups that go through processes such as these. Cohorts are particularly useful as control groups if (1) one cohort experiences a given treatment and earlier or later cohorts do not; (2) cohorts differ in only minor ways from their contiguous cohorts; (3) organizations insist that a treatment be given to everybody, thus precluding simultaneous controls
READING SKILLS IN RURAL AREAS

6 STOCKARD
Measures and Analysis
The primary measures of reading skills came from the DIBELS system. DIBELS measures incorporate assessments of various elements of reading development including children’s ability to link sounds and letters. They provide a way for teachers to have regular, systematic, and efficient assessments of children’s skills, with repeated short testing sessions during the school year. All measures result in numeric scores that indicate the number of correct responses given in one minute (DIBELS, 2008; Good, Simmons, & Kame’enui, 2001; Good, Simmons, & Smith, 1998; Hasbrouck & Tindal, 2006; Kaminski & Good, 1996). The districts administered the assessments to all students at the times specified by the DIBELS guidelines—at the beginning, middle, and end of the school year—and made the data available to me. As noted above, the years for which data were available for each student cohort varied slightly from one site to another, and these patterns are summarized in Appendix A.
Two DIBELS measures were used as indicators of children’s reading development and reflect reading skills appropriate for different grade levels. The first measure was Nonsense Word Fluency (NWF), which measures the ability to read phonetic nonsense words and was assessed from the middle of kindergarten through the beginning of second grade as a way to tap development of early reading skills. The second was Oral Reading Fluency (ORF), which measures the rate at which children can correctly read connected text in grade-level materials. It was assessed from the middle of first grade through the end of third grade and thus measures students’ ability to read material typical of their grade level. Although the ORF ostensibly measures decoding and fluency, research indicates that these scores are highly associated with measures of reading comprehension (Fuchs, Fuchs, Hosp, & Jenkins, 2001; Good, et al, 2001). Because the connected text used for the measure of oral reading fluency is taken from grade-level material, comparisons of ORF scores from one year to the next may not provide the most optimal picture of changes in skills over time. To compensate, I transformed the ORF scores into Lexiles (L), a developmental scale of reading that ranges from less than zero for those who are just beginning to read to above 1700L for advanced readers. Thus, it adjusts for the different content used in the ORF at each grade level (MetaMetrics 2009).
I analyzed the DIBELS data in two ways. First, looking at the results for each testing period, I used simple descriptive statistics (means and standard deviations), inferential tests (t-tests and z-scores), and effect sizes (Cohen’s d) to examine the differences between the cohorts with full exposure to
Procedures
As noted above, all the sites implemented Reading Mastery. The schools received support for implementation of the curriculum from the National Institute for Direct Instruction (NIFDI), a non-profit organization. The NIFDI model encompasses the elements found in the implementation research literature to be especially effective and important in technical support, particularly a “high level of involvement by program developers on a continuing basis” (Fixsen, Naoom, Blasé, Friedman, & Wallace, 2005, p. 21). NIFDI is associated with the original developer of DI and prides itself on strong fidelity to the DI model. It is dedicated to providing school districts with training and support throughout the school year and helping schools move to maintaining higher levels of achievement without outside support.
Under the NIFDI model, a staff member, termed an Implementation Manager (IM), is assigned to a school to train teachers, assistants, and coaches. All teachers receive NIFDI pre-service training and coaching until they are able to teach each program to a minimally adequate level of fidelity, and they continue to receive in-service coaching to improve fidelity throughout the school year. The IM is typically at a school about 35 days during the school year, working in classrooms with teachers and presenting in-service sessions. In addition, the IM reviews reports of students’ lesson progress on a weekly basis, following up with conference calls with school administrators and teachers to address any problems a classroom may be experiencing. This system of regular monitoring and consultation is thus focused on promoting continual student progress and learning. During the second year of implementation, teachers who perform well are identified as coaches and deployed to work with other teachers in the school. Beginning in the third year, NIFDI support is gradually phased out so that schools can become self-sufficient.
The NIFDI model was implemented in the rural sites in this study in the same manner in which it is implemented in other, more urban, areas with one exception. In contrast to implementations in larger cities, the pre-service training for teachers was sometimes held in a central location, requiring teachers to travel elsewhere in the state to receive training. However, as with implementations in other settings, the IMs made regular in-person visits to each school, observing classrooms and helping teachers improve their skills, and weekly reports of student progress were reviewed and discussed. In recent years, as technology has become more advanced, the in-person visits have been supplemented with observations and conferences utilizing web-based communication tools such as Skype.

7READING SKILLS IN RURAL AREAS
or exceeded state standards in reading as determined by the state’s testing program. Given the amount of time during which the curriculum had been implemented at this site, I was able to compare the percentage of students who met or exceeded the standards for students in three groups: (a) those with no exposure to Reading Mastery (fourth graders in 2004-2005), (b) those with some exposure (fourth graders from 2005-2006 through 2007-2008), and (c) those who had experienced RM since beginning kindergarten (fourth graders in 2008-2009). I computed an effect size describing the magnitude of the difference between the district performance and that of the state and tested the hypothesis that changes over time in the district were greater than in the state as a whole.
Results
Below are summaries of the analysis of DIBELS reading scores and the state-mandated achievement tests.
Nonsense Word Fluency
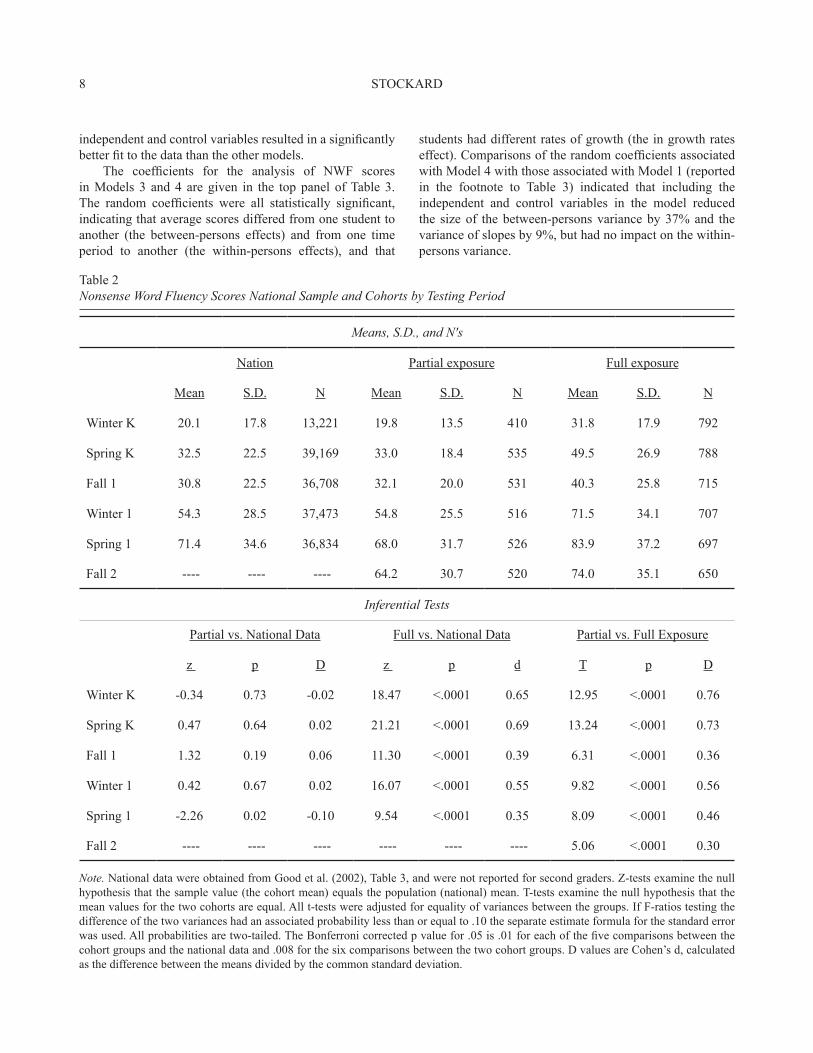
Table 2 reports the average Nonsense Word Fluency scores of students in the national sample and the two cohort groups at each of the testing periods. The first panel gives descriptive statistics for each group and the second panel gives the inferential results and Cohen’s d, a standard measure of effect size, for each pair of comparisons. The cohorts that did not begin the curriculum until after their kindergarten year (partial exposure cohorts) had NWF scores that were very similar to the national sample. In contrast, the full exposure cohorts (who started the program in kindergarten) had NWF scores that were significantly higher than both the national sample and the other set of cohorts at all testing periods, even with the application of the Bonferroni correction for multiple tests of significance. All the associated effect sizes surpassed the .25 mark typically seen as educationally significant, ranging from .30 (at the start of grade 2) to .76 (at the middle of kindergarten).
Table 3 reports the results of the growth curve analysis of NWF scores. Linear growth models provide a more parsimonious examination of the changes in reading skills over time than the comparisons in Table 1 and also can control for students’ at-risk status and differences between the districts. The bottom panel of Table 2 describes the four models that were tested and gives the -2 Log Likelihood (-2LL) statistic, commonly used as a measure of fit. The -2LL can be compared across models, with the difference having a chi-square distribution. These differences and the associated degrees of freedom are also in the bottom panel of Table 3. They indicate that each subsequent model provided a significantly better fit than the previous model. Thus, a model that included interactions between time and the
the curriculum, those with partial exposure, and the national sample. Bonferroni corrections were used to adjust for multiple tests of significance. Second, I used linear growth modeling to examine variations in trends in the growth of reading skills over time for students in the two cohort groups. In these models I compared the pace of growth of students with full and partial exposure to the curriculum, controlling for their at-risk status and school site. Four incrementally more complex models were compared: (a) a model that included only changes over time, (b) a model that added the control variables (at-risk status and site), (c) a model that added the measure of cohort (full versus partial exposure to the curriculum), and (d) a model that added the interaction of time with the control variables and cohort. Comparisons of these models let me assess the extent to which students’ skill growth over time varied by cohort, site, and at-risk status.
Using the symbols common to the mixed model literature, Model 4, the most complex of those tested, can be written as
Yij = βoo + β10(Timeij) + β01(At Risk) + β02(Site B) + β03(Site C) + β04(Cohort) + β11(Time*At Risk) + β12(Time * Site B) + β13(Time * Site C) + β14(Time * Cohort) + uij + u1j(Time)ij + rij(1)
where the dependent variable, Yij, refers to the individual NWF or ORF Lexile scores of students, βij refers to the fixed effect parameters (the intercept, main effects, and interaction effects listed sequentially), uij refers to random effects, and rij refers to the residual variance. As is common with growth models, these analyses included all cases for which data were available for a given time point.
To provide additional controls, I conducted a supplemental analysis that focused only on students who received instruction from teachers who had taught under both the partial and full DI models. This analysis is important in helping to control for the specific impact of a given teacher on the results. Two separate analyses were conducted. One focused on growth in NWF scores and added dummy variables for kindergarten teachers to models 2, 3, and 4 described above. The other focused on growth in ORF Lexiles and added dummy variables for first grade teachers. In both analyses, a fifth model, which examined the interaction of time and teacher, was included. For the analysis of NWF scores, data were available for only Districts A and B, representing 10 teachers and 768 students. For the analysis of ORF Lexiles, data came from all three districts and represented 12 teachers and 714 students.
Finally, in addition to the formative, curriculum-based DIBELS measures, I was able, for one site (District B, which had the longest history with the program), to examine changes in the percentage of fourth grade students who met
8 STOCKARD
students had different rates of growth (the in growth rates effect). Comparisons of the random coefficients associated with Model 4 with those associated with Model 1 (reported in the footnote to Table 3) indicated that including the independent and control variables in the model reduced the size of the between-persons variance by 37% and the variance of slopes by 9%, but had no impact on the within-persons variance.
independent and control variables resulted in a significantly better fit to the data than the other models.
The coefficients for the analysis of NWF scores in Models 3 and 4 are given in the top panel of Table 3. The random coefficients were all statistically significant, indicating that average scores differed from one student to another (the between-persons effects) and from one time period to another (the within-persons effects), and that
Table 2Nonsense Word Fluency Scores National Sample and Cohorts by Testing Period
Means, S.D., and N's
Nation Partial exposure Full exposure
Mean S.D. N Mean S.D. N Mean S.D. N
Winter K 20.1 17.8 13,221 19.8 13.5 410 31.8 17.9 792
Spring K 32.5 22.5 39,169 33.0 18.4 535 49.5 26.9 788
Fall 1 30.8 22.5 36,708 32.1 20.0 531 40.3 25.8 715
Winter 1 54.3 28.5 37,473 54.8 25.5 516 71.5 34.1 707
Spring 1 71.4 34.6 36,834 68.0 31.7 526 83.9 37.2 697
Fall 2 ---- ---- ---- 64.2 30.7 520 74.0 35.1 650
Inferential Tests
Partial vs. National Data Full vs. National Data Partial vs. Full Exposure
z p D z p d T p D
Winter K -0.34 0.73 -0.02 18.47 <.0001 0.65 12.95 <.0001 0.76
Spring K 0.47 0.64 0.02 21.21 <.0001 0.69 13.24 <.0001 0.73
Fall 1 1.32 0.19 0.06 11.30 <.0001 0.39 6.31 <.0001 0.36
Winter 1 0.42 0.67 0.02 16.07 <.0001 0.55 9.82 <.0001 0.56
Spring 1 -2.26 0.02 -0.10 9.54 <.0001 0.35 8.09 <.0001 0.46
Fall 2 ---- ---- ---- ---- ---- ---- 5.06 <.0001 0.30
Note. National data were obtained from Good et al. (2002), Table 3, and were not reported for second graders. Z-tests examine the null hypothesis that the sample value (the cohort mean) equals the population (national) mean. T-tests examine the null hypothesis that the mean values for the two cohorts are equal. All t-tests were adjusted for equality of variances between the groups. If F-ratios testing the difference of the two variances had an associated probability less than or equal to .10 the separate estimate formula for the standard error was used. All probabilities are two-tailed. The Bonferroni corrected p value for .05 is .01 for each of the five comparisons between the cohort groups and the national data and .008 for the six comparisons between the two cohort groups. D values are Cohen’s d, calculated as the difference between the means divided by the common standard deviation.

9READING SKILLS IN RURAL AREAS
Table 3Growth Curve Model Results, Nonsense Word Fluency, Mid-K to Beginning of 2nd, Districts A, B, and C
Parameter estimatesModel 3 Model 4
Fixed effects Est. S.E. Prob. Est. S.E. Prob.Intercept 21.50 0.99 <.0001 20.97 1.00 <.0001Time 9.95 0.17 <.0001 10.95 0.35 <.0001At-risk -9.36 0.94 <.0001 -9.18 0.94 <.0001District B 10.90 1.17 <.0001 11.36 1.18 <.0001District C 3.72 1.91 0.05 3.97 1.92 0.04Full model 8.55 1.12 <.0001 8.51 1.12 <.0001Time * full model ----- ----- ----- 1.42 0.41 0.001Time * District B ----- ----- ----- -2.70 0.42 <.0001Time * District C ----- ----- ----- 0.23 0.68 0.73Time * at-risk ----- ----- ----- -0.57 0.34 0.09Random effectsBetween persons 131.5 11.9 <.0001 132.8 11.9 <.0001Within persons 45.9 3.1 <.0001 46.0 3.1 <.0001In growth rates 18.7 1.5 <.0001 17.2 1.5 <.0001Residual 291.6 6.0 <.0001 291.7 6.0 <.0001
Models and fit statistics1 2 3 4
Intercept X X X XTime X X X XAt-risk ----- X X XDistrict B ----- X X XDistrict C ----- X X XFull model ----- ----- X XTime * full model ----- ----- ----- XTime * District B ----- ----- ----- XTime * District C ----- ----- ----- XTime * at-risk ----- ----- ----- X -2 LL 66550.8 66249.1 66190.1 66141.4Ch. In -2 LL ----- 301.7 59.0 48.7df change ----- 3 1 4prob. ----- <.0001 <.0001 <.0001
Note. Students categorized as having at-risk status were members of a racial-ethnic minority (i.e., not non-Hispanic white) and/or receiving free or reduced lunch. An “X” in a cell in the second panel of the table indicates that a variable was included within the model tested. The last lines of the second panel give the -2 Log Likelihood ratios for each model, the change in these ratios from one model to the next, and the associated probability. Observations were based on 7,387 observations from 1,517 subjects over a maximum of 6 time periods. Analyses were computed using PROC Mixed in SAS and opting for an unstructured covariance structure. Random effects for Model 1 were 211.52 for between persons, 42.67 for within persons, and 18.87 for slopes (growth rates).
10 STOCKARD
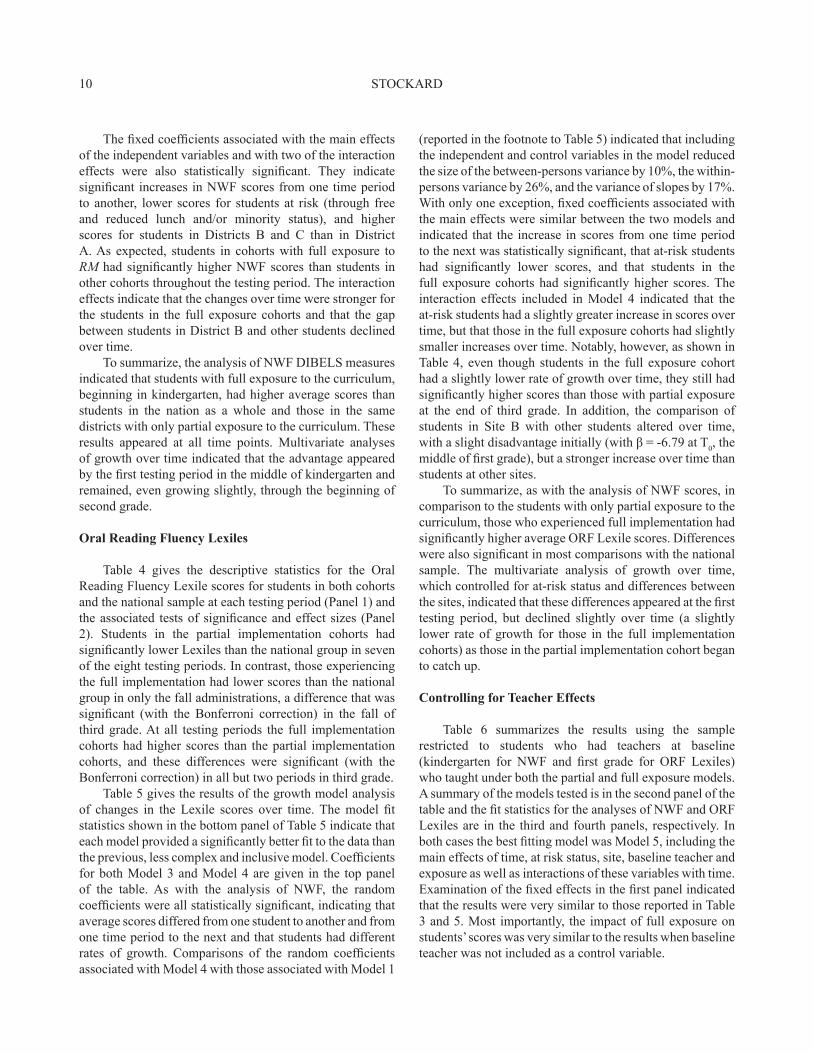
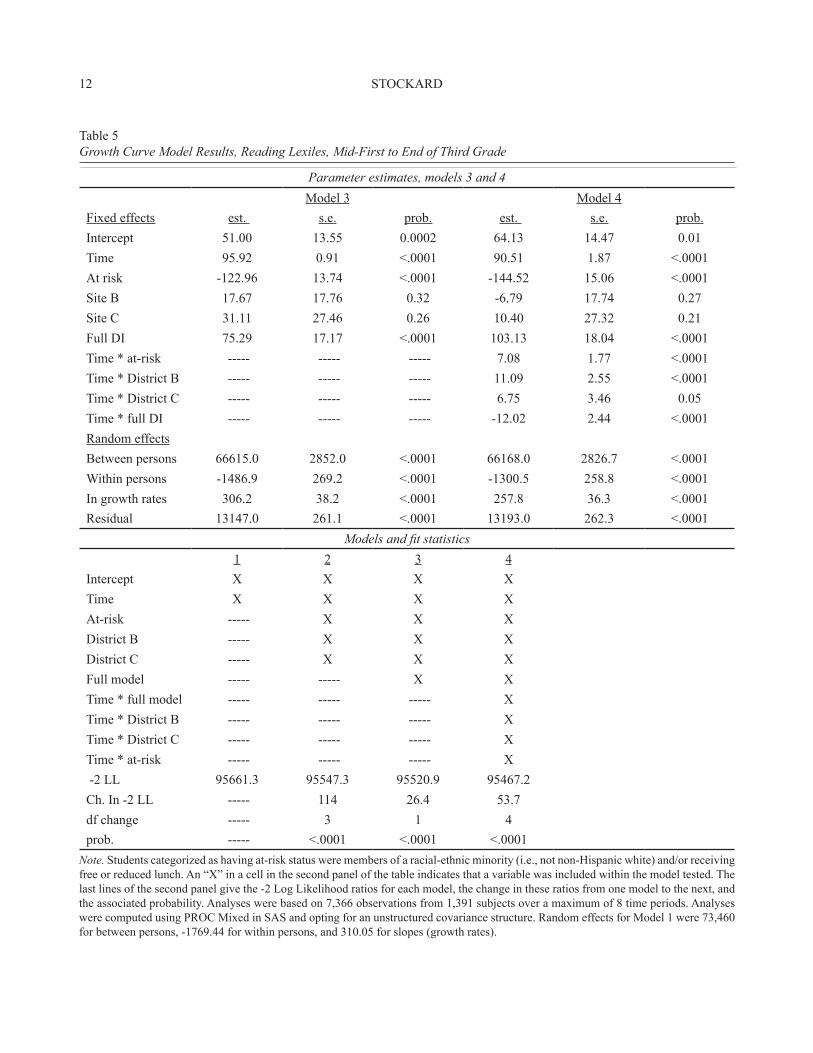
(reported in the footnote to Table 5) indicated that including the independent and control variables in the model reduced the size of the between-persons variance by 10%, the within-persons variance by 26%, and the variance of slopes by 17%. With only one exception, fixed coefficients associated with the main effects were similar between the two models and indicated that the increase in scores from one time period to the next was statistically significant, that at-risk students had significantly lower scores, and that students in the full exposure cohorts had significantly higher scores. The interaction effects included in Model 4 indicated that the at-risk students had a slightly greater increase in scores over time, but that those in the full exposure cohorts had slightly smaller increases over time. Notably, however, as shown in Table 4, even though students in the full exposure cohort had a slightly lower rate of growth over time, they still had significantly higher scores than those with partial exposure at the end of third grade. In addition, the comparison of students in Site B with other students altered over time, with a slight disadvantage initially (with β = -6.79 at T0, the middle of first grade), but a stronger increase over time than students at other sites.
To summarize, as with the analysis of NWF scores, in comparison to the students with only partial exposure to the curriculum, those who experienced full implementation had significantly higher average ORF Lexile scores. Differences were also significant in most comparisons with the national sample. The multivariate analysis of growth over time, which controlled for at-risk status and differences between the sites, indicated that these differences appeared at the first testing period, but declined slightly over time (a slightly lower rate of growth for those in the full implementation cohorts) as those in the partial implementation cohort began to catch up.
Controlling for Teacher Effects
Table 6 summarizes the results using the sample restricted to students who had teachers at baseline (kindergarten for NWF and first grade for ORF Lexiles) who taught under both the partial and full exposure models. A summary of the models tested is in the second panel of the table and the fit statistics for the analyses of NWF and ORF Lexiles are in the third and fourth panels, respectively. In both cases the best fitting model was Model 5, including the main effects of time, at risk status, site, baseline teacher and exposure as well as interactions of these variables with time. Examination of the fixed effects in the first panel indicated that the results were very similar to those reported in Table 3 and 5. Most importantly, the impact of full exposure on students’ scores was very similar to the results when baseline teacher was not included as a control variable.
The fixed coefficients associated with the main effects of the independent variables and with two of the interaction effects were also statistically significant. They indicate significant increases in NWF scores from one time period to another, lower scores for students at risk (through free and reduced lunch and/or minority status), and higher scores for students in Districts B and C than in District A. As expected, students in cohorts with full exposure to RM had significantly higher NWF scores than students in other cohorts throughout the testing period. The interaction effects indicate that the changes over time were stronger for the students in the full exposure cohorts and that the gap between students in District B and other students declined over time.
To summarize, the analysis of NWF DIBELS measures indicated that students with full exposure to the curriculum, beginning in kindergarten, had higher average scores than students in the nation as a whole and those in the same districts with only partial exposure to the curriculum. These results appeared at all time points. Multivariate analyses of growth over time indicated that the advantage appeared by the first testing period in the middle of kindergarten and remained, even growing slightly, through the beginning of second grade.
Oral Reading Fluency Lexiles
Table 4 gives the descriptive statistics for the Oral Reading Fluency Lexile scores for students in both cohorts and the national sample at each testing period (Panel 1) and the associated tests of significance and effect sizes (Panel 2). Students in the partial implementation cohorts had significantly lower Lexiles than the national group in seven of the eight testing periods. In contrast, those experiencing the full implementation had lower scores than the national group in only the fall administrations, a difference that was significant (with the Bonferroni correction) in the fall of third grade. At all testing periods the full implementation cohorts had higher scores than the partial implementation cohorts, and these differences were significant (with the Bonferroni correction) in all but two periods in third grade.
Table 5 gives the results of the growth model analysis of changes in the Lexile scores over time. The model fit statistics shown in the bottom panel of Table 5 indicate that each model provided a significantly better fit to the data than the previous, less complex and inclusive model. Coefficients for both Model 3 and Model 4 are given in the top panel of the table. As with the analysis of NWF, the random coefficients were all statistically significant, indicating that average scores differed from one student to another and from one time period to the next and that students had different rates of growth. Comparisons of the random coefficients associated with Model 4 with those associated with Model 1

11READING SKILLS IN RURAL AREAS
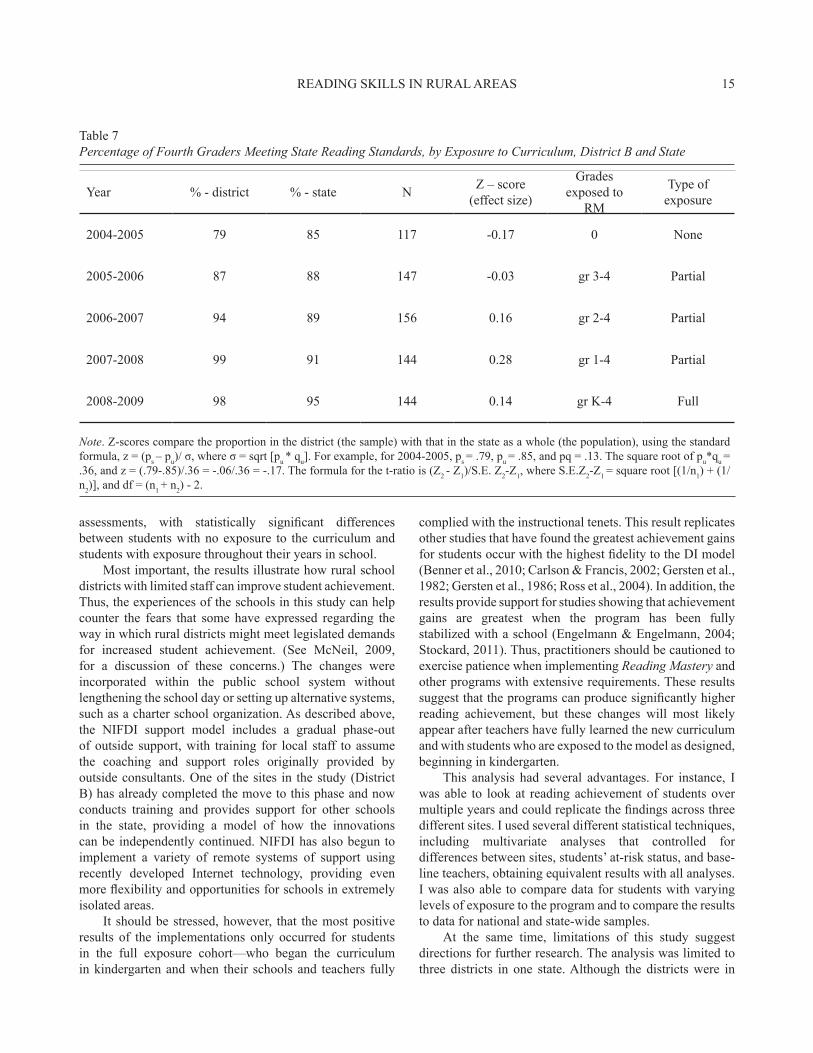
was greater for students in District B than in the state as a whole. Before implementation of the curriculum, the performance of District B’s fourth graders was lower than that of students in the state as a whole, but by 2006-2007, their performance was better than that of students state-wide. The fifth column of Table 7 compares the district values to those of the state using a z-score, or standard deviation unit score. This is equivalent to an effect size (difference in standard deviation terms). It can be seen that the effect sizes were negative for the year with no DI exposure (2004-2005) and the next year (2005-2006), but then became positive, as students had more exposure. I calculated a t-test examining the null hypothesis that the changes in the district over time, relative to the changes in
Performance on Statewide Assessments
Table 7 reports the percentage of fourth graders who met the established state reading standards in District B and the state as a whole from 2004-2005 to 2008-2009. In the earliest year, none of the fourth graders had any exposure to RM, while in the last year, the fourth graders had been exposed to the curriculum since kindergarten. Thus, the data allow comparisons of performance on the statewide test for fourth-grade cohorts before any exposure to the curriculum, with partial exposure during their primary grades, and with full exposure.
Results indicate that students in both the district and the state improved their performance over time, but the increase
Table 4Oral Reading Fluency Lexile Scores, Winter, 1st Grade through Spring, 3rd Grade, National Sample and Cohort Groups
Means, S.D., and T-tests National sample Partial model Full model
Mean S.D. N Mean S.D. N Mean S.D. NWinter 1 -87.6 78.7 37410 -74.6 282.7 512 40.3 299.9 704Spring 1 116.2 72.8 37017 74.3 307.9 524 184.3 289.1 695Fall 2 250.9 157.6 15494 186.7 222.7 520 238.7 233.9 648Winter 2 403.2 212.3 16841 404.8 263.6 505 497.1 274.8 378Spring 2 552.6 235.2 16805 496.5 265.8 514 586.3 277.6 375Fall 3 469.7 214.3 10941 396.3 248.6 490 438.1 258.5 360Winter 3 566.4 225.4 12318 518.4 273.4 363 599.9 261.5 207Spring 3 694.7 236.8 12531 648.9 281.6 367 692.8 248.5 204
Inferential TestsPartial model vs. nation Full model vs. nation Full vs. partial model
z p d z p d t sig. dWinter 1 3.76 0.0002 0.07 43.13 <.0001 0.68 6.82 <.001 0.39Spring 1 -13.17 <.0001 -0.22 24.66 <.0001 0.38 6.39 <.001 0.37Fall 2 -9.29 <.0001 -0.34 -1.98 0.05 -0.06 3.85 <.001 0.23Winter 2 0.16 0.87 0.01 8.60 <.0001 0.39 5.06 <.001 0.34Spring 2 -5.40 <.0001 -0.22 2.78 0.005 0.13 4.88 <.001 0.33Fall 3 -7.58 <.0001 -0.32 -2.79 0.005 -0.13 2.38 0.02 0.16Winter 3 -4.06 <.0001 -0.19 2.14 0.03 0.14 3.48 0.001 0.3Spring 3 -3.71 0.0002 -0.18 -0.12 0.90 -0.01 1.93 0.05 0.17
Note. National data were obtained from Good et al. (2002) and Tables 3 and 4. Z-tests examine the null hypothesis that the sample value (the cohort mean) equals the population (national) mean. T-tests examine the null hypothesis that the mean values for the two cohorts are equal. All t-tests were adjusted for equality of variances between the groups. If F-ratios testing the difference of the two variances had an associated probability less than or equal to .10 the separate estimate formula for the standard error was used. All probabilities are two-tailed. The Bonferroni corrected p value for .05 is .006 for each set of eight comparisons. D values are Cohen’s d, calculated as the difference between the means divided by the common standard deviation.
12 STOCKARD
Table 5Growth Curve Model Results, Reading Lexiles, Mid-First to End of Third Grade
Parameter estimates, models 3 and 4Model 3 Model 4
Fixed effects est. s.e. prob. est. s.e. prob.Intercept 51.00 13.55 0.0002 64.13 14.47 0.01Time 95.92 0.91 <.0001 90.51 1.87 <.0001At risk -122.96 13.74 <.0001 -144.52 15.06 <.0001Site B 17.67 17.76 0.32 -6.79 17.74 0.27Site C 31.11 27.46 0.26 10.40 27.32 0.21Full DI 75.29 17.17 <.0001 103.13 18.04 <.0001Time * at-risk ----- ----- ----- 7.08 1.77 <.0001Time * District B ----- ----- ----- 11.09 2.55 <.0001Time * District C ----- ----- ----- 6.75 3.46 0.05Time * full DI ----- ----- ----- -12.02 2.44 <.0001Random effectsBetween persons 66615.0 2852.0 <.0001 66168.0 2826.7 <.0001Within persons -1486.9 269.2 <.0001 -1300.5 258.8 <.0001In growth rates 306.2 38.2 <.0001 257.8 36.3 <.0001Residual 13147.0 261.1 <.0001 13193.0 262.3 <.0001
Models and fit statistics1 2 3 4
Intercept X X X XTime X X X XAt-risk ----- X X XDistrict B ----- X X XDistrict C ----- X X XFull model ----- ----- X XTime * full model ----- ----- ----- XTime * District B ----- ----- ----- XTime * District C ----- ----- ----- XTime * at-risk ----- ----- ----- X -2 LL 95661.3 95547.3 95520.9 95467.2Ch. In -2 LL ----- 114 26.4 53.7df change ----- 3 1 4prob. ----- <.0001 <.0001 <.0001
Note. Students categorized as having at-risk status were members of a racial-ethnic minority (i.e., not non-Hispanic white) and/or receiving free or reduced lunch. An “X” in a cell in the second panel of the table indicates that a variable was included within the model tested. The last lines of the second panel give the -2 Log Likelihood ratios for each model, the change in these ratios from one model to the next, and the associated probability. Analyses were based on 7,366 observations from 1,391 subjects over a maximum of 8 time periods. Analyses were computed using PROC Mixed in SAS and opting for an unstructured covariance structure. Random effects for Model 1 were 73,460 for between persons, -1769.44 for within persons, and 310.05 for slopes (growth rates).

13READING SKILLS IN RURAL AREAS
Continued
Table 6Growth Curve Model Results, Controlling for Base-Line Teacher, NWF and ORF Lexiles
Parameter estimates
NWF (model 5) ORF Lexiles (model 5)
Fixed effects Est. S.E. Prob. Est. S.E. Prob.
Intercept 20.44 1.94 <.0001 72.20 36.85 0.05
Time 10.66 0.74 <.0001 97.16 5.16 <.0001
At-risk -8.72 1.24 <.0001 -156.64 20.49 <.0001
District B 14.94 2.48 <.0001 14.46 44.85 0.75
District C ------ ------ ------ -11.98 46.82 0.80
Full exposure 9.28 1.32 <.0001 144.47 21.65 <.0001
Time * full model 1.8132 0.5112 0.0004 -17.37 2.42 <.0001
Time * District B -2.9511 0.9547 0.002 7.58 5.99 0.21
Time * District C ------ ------ ------ 2.10 6.23 0.74
Time * at-risk -0.5915 0.481 0.22 5.69 2.17 0.01
Random effects
Between persons 105.7 14.7 <.0001 59983 3586 <.0001
Within persons 43.1 4.1 <.0001 -592.4 291.1 0.04
In growth rates 17.7 2.0 <.0001 132.7 37.3 0.0002
Residual 283.5 7.9 <.0001 14218 364 <.0001
Models tested
1 2 3 4 5
Intercept X X X X X
Time X X X X X
At-risk ----- X X X X
District B ----- X X X X
Teacher in K ----- X X X X
Full exposure ----- ----- X X X
Time * full exposure ----- ----- ----- X X
Time * District B ----- ----- ----- X X
Time * at-risk ----- ----- ----- X X
Time * teacher ----- ----- ----- ----- X

14 STOCKARD
achievement levels and skill growth of students in cohorts that experienced full implementation of the curriculum with those who experienced the curriculum during only part of their primary years. Comparisons were also made with data from national and state-wide samples.
Analyses of the curriculum-based DIBELS measures from kindergarten through third grade indicated that students in cohorts with full exposure to the program had significantly higher scores than those in cohorts with less exposure. In most comparisons, those with full exposure also had significantly greater skills than the national sample. Smaller differences tended to occur in the fall testing, after the summer recess and before the beginning of instruction during the school year. However, the differences grew as instruction continued over the school year. In most cases, the effect sizes comparing students with full exposure to those in the other group surpassed the usual criterion of educational importance. Similar results appeared with a more restricted sample that included controls for teacher at the baseline year. They also occurred with the analysis of fourth grade students’ performance on statewide reading
the state, were equal to zero. The results indicate that these changes were statistically significant (t = 2.50, df = 259, p = .006 [one-tailed]), and the associated effect size of .31 would be considered educationally important. In other words, the change from 2004-2005 to 2008-2009 in the percentage of fourth grade students in District B who passed the state exam was significantly greater than the change in this percentage in the state as a whole.
Summary and Discussion
This article examined changes in reading skills and achievement among elementary students in three rural, K-12 districts in one sparsely populated state as they implemented a highly explicit and structured reading curriculum (Reading Mastery) with extensive technical implementation support. The districts ranged in size from about 200 to over 2,000 students. All the districts had somewhat more students receiving free or reduced lunch, and two had substantially more Hispanic students, than the state as a whole. A cohort control group design was used to compare
Table 6 Continued
Fit statistics NWF
-2 LL 35715.5 35474.5 35424.7 35393.1 35374.3
Ch. in -2 LL ----- 241.0 49.8 31.6 18.8
df change ----- 11 1 3 9
prob. ----- <.0001 <.0001 <.0001 0.0269
Fit statistics ORF Lexiles:
-2 LL 55725.2 55538.8 55508.6 55445.2 55370.8
Ch. in -2 LL ----- 186.4 30.2 63.4 74.4
df change ----- 14 1 4 11
prob. ----- <.0001 <.0001 <.0001 <.0001
Note. Students categorized as having at-risk status were members of a racial-ethnic minority (i.e., not non-Hispanic white) and/or receiving free or reduced lunch. An “X” in a cell in the second panel of the table indicates that a variable was included within the model tested. The third and fourth panels give the -2 Log Likelihood ratios for each model, the change in these ratios from one model to the next, and the associated probability for both dependent variables. Results for NWF were based on 3,984 observations from 768 subjects, with 10 different kindergarten teachers (classrooms) in Districts A and B over a maximum of 6 time periods. Results for ORF Lexiles were based on 4,290 observations, for 714 subjects, over a maximum of eight time periods and representing 12 first-grade teachers (classes) from all three sites. Analyses were computed using PROC Mixed in SAS and opting for an unstructured covariance structure. Coefficients associated with dummy variables for teachers (classroom) were omitted to conserve space. Random effects for Model 1 for NWF were 205.3 for between persons, 41.08 for within persons, and 19.05 for slopes (growth rates). Comparing random effects from Model 1 to Model 4 indicated a reduction of 48% for between persons and 7% for growth rates, but an increase of 5% for within-person variance. Random effects for Model 1 for ORF Lexiles were 72,220 for between persons, -1475.42 for within persons, and 225.34 for slopes (growth rates). Comparing random effects from Model 1 to Model 4 indicated a reduction of 16% for between persons, 60% for within persons, and 41% for growth rates.
15READING SKILLS IN RURAL AREAS
complied with the instructional tenets. This result replicates other studies that have found the greatest achievement gains for students occur with the highest fidelity to the DI model (Benner et al., 2010; Carlson & Francis, 2002; Gersten et al., 1982; Gersten et al., 1986; Ross et al., 2004). In addition, the results provide support for studies showing that achievement gains are greatest when the program has been fully stabilized with a school (Engelmann & Engelmann, 2004; Stockard, 2011). Thus, practitioners should be cautioned to exercise patience when implementing Reading Mastery and other programs with extensive requirements. These results suggest that the programs can produce significantly higher reading achievement, but these changes will most likely appear after teachers have fully learned the new curriculum and with students who are exposed to the model as designed, beginning in kindergarten.
This analysis had several advantages. For instance, I was able to look at reading achievement of students over multiple years and could replicate the findings across three different sites. I used several different statistical techniques, including multivariate analyses that controlled for differences between sites, students’ at-risk status, and base-line teachers, obtaining equivalent results with all analyses. I was also able to compare data for students with varying levels of exposure to the program and to compare the results to data for national and state-wide samples.
At the same time, limitations of this study suggest directions for further research. The analysis was limited to three districts in one state. Although the districts were in
assessments, with statistically significant differences between students with no exposure to the curriculum and students with exposure throughout their years in school.
Most important, the results illustrate how rural school districts with limited staff can improve student achievement. Thus, the experiences of the schools in this study can help counter the fears that some have expressed regarding the way in which rural districts might meet legislated demands for increased student achievement. (See McNeil, 2009, for a discussion of these concerns.) The changes were incorporated within the public school system without lengthening the school day or setting up alternative systems, such as a charter school organization. As described above, the NIFDI support model includes a gradual phase-out of outside support, with training for local staff to assume the coaching and support roles originally provided by outside consultants. One of the sites in the study (District B) has already completed the move to this phase and now conducts training and provides support for other schools in the state, providing a model of how the innovations can be independently continued. NIFDI has also begun to implement a variety of remote systems of support using recently developed Internet technology, providing even more flexibility and opportunities for schools in extremely isolated areas.
It should be stressed, however, that the most positive results of the implementations only occurred for students in the full exposure cohort—who began the curriculum in kindergarten and when their schools and teachers fully
Table 7Percentage of Fourth Graders Meeting State Reading Standards, by Exposure to Curriculum, District B and State
Year % - district % - state N Z – score (effect size)
Grades exposed to
RM
Type of exposure
2004-2005 79 85 117 -0.17 0 None
2005-2006 87 88 147 -0.03 gr 3-4 Partial
2006-2007 94 89 156 0.16 gr 2-4 Partial
2007-2008 99 91 144 0.28 gr 1-4 Partial
2008-2009 98 95 144 0.14 gr K-4 Full
Note. Z-scores compare the proportion in the district (the sample) with that in the state as a whole (the population), using the standard formula, z = (ps – pu)/ σ, where σ = sqrt [pu * qu]. For example, for 2004-2005, ps = .79, pu = .85, and pq = .13. The square root of pu*qu = .36, and z = (.79-.85)/.36 = -.06/.36 = -.17. The formula for the t-ratio is (Z2 - Z1)/S.E. Z2-Z1, where S.E.Z2-Z1 = square root [(1/n1) + (1/n2)], and df = (n1 + n2) - 2.

16 STOCKARD
of Research in Rural Education, 20(6). Retrieved from http://jrre.psu.edu/articles/20-6.pdf
Arrasmith, D. (2002). Definition of explicit instruction and systematic curriculum (White Paper: The Explicit and Systematic Method). Retrieved from http://www.studydog.com/SDsystematic.asp
Baker, S. K., Kameenui, E. J., Simmons, D. C., & Stahl, S. A. (1994). Beginning reading: Educational tools for diverse learners. School Psychology Review, 23, 372-391.
Barley, Z. A., & Beesley, A. D. (2007). Rural school success: What can we learn? Journal of Research in Rural Education, 22(1). Retrieved from http://jrre.psu.edu/articles/22-1.pdf
Beck, I. L., & McCaslin, E. S. (1978). An analysis of dimensions that affect the development of code-breaking ability in eight beginning reading programs (Report No. 1978/6). Pittsburgh, PA: Learning Research and Development Center, University of Pittsburgh.
Benner, G. J., Nelson, J. R., Stage, S. A., & Ralston, N. C. (2010). The influence of fidelity of implementation on the reading outcomes of middle school students experiencing reading difficulties. Remedial and Special Education, 32(January/February), 79-88.
Berends, M., Bodilly, S. J., & Kirby, S. N. (2002). Facing the challenges of whole-school reform: New American schools after a decade. Santa Monica, CA: Rand.
Blakeley, M. R. (2001). A survey of levels of supervisory support and maintenance of effects reported by educators involved in Direct Instruction implementations. Journal of Direct Instruction, 1(2), 73-83.
Bodilly, S. J., Glennan, T. K., Jr., Galegher, J. R., & Kerr, K. A. (2004). Introduction: Framing the problem. In T. K. Glennan, Jr., S. J. Bodilly, J. R. Galegher, & K. A. Kerr (Eds.), Expanding the reach of education reforms: Perspectives from leaders in the scale-up of educational interventions (pp. 1-35). Santa Monica, CA: Rand.
Bodilly, S. J. (1998). Lessons from new American schools’ scale-up phase: Prospects for bringing designs to multiple schools. Santa Monica, CA: Rand.
Bond, G., & Dykstra, R. (1967). The cooperative research program in first-grade reading instruction. Reading Research Quarterly, 2(4), 5-142.
Borman, G. D., Hewes, G. M., Overman, L. T., & Brown, S. (2003). Comprehensive school reform and achievement: A meta-analysis. Review of Educational Research, 73(2), 125-230.
Campbell, D. T., & Stanley, J. C. (1963). Experimental and Quasi-Experimental Designs for Research. Chicago, IL: Rand McNally.
Carlson, C. D., & Francis, D. J. (2002). Increasing the reading achievement of at-risk children through Direct Instruction: Evaluation of the Rodeo Institute for
very different areas of a relatively large state, it would be important to replicate this study in other areas. Other studies should examine other measures of reading achievement. While the analysis of fourth graders’ scores on the state assessment provided encouraging results, even longer-term analyses of students’ performance would be important. In addition, the national sample was limited to schools that participated in the DIBELS system and only dealt with one year of data. A broader national sample would be preferable. Other aspects of the results deserve additional attention. For instance, follow-up studies should examine the elements of the NIFDI model of support that contributed to the positive results. Such studies could try to identify the elements of the model that are most important and develop ways that others could incorporate it. In addition, the lagging performance of those with only partial exposure to the program should be examined to see if there might be ways to enhance their achievement even if they begin the program at later grades.
While these results involved only three districts in one state, they replicated findings that have been reported in numerous other settings regarding the efficacy of Reading Mastery and the ways in which the NIFDI model of implementation support can promote higher student achievement. The results also demonstrated the ways in which three small districts, all in relatively isolated regions of the country, could implement structured and explicit curricula and promote strong achievement gains that persisted through the early elementary years. I suggest that the example of these districts and the dedication and hard work of their teachers and administrators can begin to answer the call of Arnold and colleagues (2008) for ways to help rural schools improve teachers’ “pedagogical skills in ways that have the greatest impact on student achievement” (p. 18).
References
Adams, M. J. (1990). Beginning to read: Thinking and learning about print. Cambridge, MA: MIT Press.
Adams, G. L., & Engelmann, S. (1996). Research on Direct Instruction: 25 years beyond DISTAR. Seattle, WA: Educational Achievement Systems.
American Federation of Teachers. (1998). Building on the best, learning from what works: Seven promising reading and language arts programs. Washington, DC: AFT.
Anderson, R. C., Hiebert, E. H., Scott, J. A., & Wilkinson, I. A. G. (1985). Becoming a nation of readers: The report of the Commission on Reading. Washington, DC: National Institute of Education.
Arnold, M. L., Newman, J. H., Gaddy, B. B., & Dean, C. B. (2005). A look at the condition of rural education research: Setting a direction for future research. Journal
17READING SKILLS IN RURAL AREAS
Gersten, R. M., Carnine, D. W., & Williams, P. B. (1982). Measuring implementation of a structured educational model in an urban school district: An observational approach. Educational Evaluation and Policy Analysis, 4(1), 67-79.
Gersten, R., Carnine, D., Zoref, L., & Cronin, D. (1986). A multifaceted study of change in seven inner-city schools. The Elementary School Journal, 86(3), 257-276.
Gersten, R., Darch, C., & Gleason, M. (1988). Effectiveness of a Direct Instruction academic kindergarten for low-income students. Elementary School Journal, 89(2), 227-40.
Gough, P. B., & Juel, C. (1991). The first stages of word recognition. In L. Rieben & C. A. Perfetti (Eds.), Learning to read: Basic research and its implications (pp. 47-56). Hisllsdale, NJ: Erlbaum.
Good, R. H., Simmons, D. C., & Kame’enui, E. J. (2001). The importance and decision-making utility of a continuum of fluency-based indicators of foundational reading skills for third-grade high-stakes outcomes. Scientific Studies of Reading, 5(3), 257-288.
Good, R. H., Simmons, D. C., & Smith, S. B. (1998). Effective academic interventions in the United States: Evaluating and enhancing the acquisition of early reading skills. Educational and Child Psychology, 15(1), 56-70.
Good, R. H., Wallin, J., Simmons, D. C., Kame’enui, E. J., & Kaminski, R. A. (2002). System-wide percentile ranks for DIBELS benchmark assessment (Technical Report 9). Eugene: University of Oregon.
Grossen, B. (1997). A synthesis of research on reading from the National Institute of Child Health and Human Development. Eugene: University of Oregon.
Hasbrouck, J., & Tindal, G. A. (2006). Oral reading fluency norms: A valuable assessment tool for reading teachers. The Reading Teacher, 59(7), 636-644.
Hattie, J. (2009). Visible learning: A synthesis of over 800 meta-analyses relating to achievement. London and New York, NY: Routledge.
Herman, R., Aladjam, D., McMahon, P., Masem, E., Mulligan, I., Smith, O., O’Malley, A., Quinones, S., Reeve, A., & Woodruff, D. (1999). An educator’s guide to schoolwide reform. Washington, DC: American Institutes for Research.
Howley, C. B., Theobald, P., & Howley, A. A. (2005). What rural education research is of most worth? A reply to Arnold, Newman, Gaddy, and Dean. Journal of Research in Rural Education, 20(18). Retrieved from http://jrre.psu.edu/articles/20-18.pdf
Huitt, W. G., Monetti, D. M., & Hummel, J. H. (2009). Direct approach to instruction. In C. Reigeluth & A. Carr-Chellman (Eds.), Instructional-Design Theories and
Teacher Excellence (RITE). Journal of Education for Students Placed at Risk, 7(2), 141-166.
Chall, J. S. (1967). Learning to read: The great debate. New York, NY: McGraw Hill.
Cicchinelli, L. F., & Dean, C. B. (2005). It’s all about the quality of advice, guidance, and research for rural educators: A rejoinder to Howley, Theobald, and Howley. Journal of Research in Rural Education, 20(19). Retrieved from http://jrre.psu.edu/articles/20-19.pdf
Collins, M., & Carnine, D. (1988). Evaluating the field test revision process by comparing two versions of a reasoning skills CAI program. Journal of Learning Disabilities, 21, 375-379.
Cook, T. D., & Campbell, D. T. (1979). Quasi-experimentation: Design and analysis issues for field settings. Chicago, IL: Rand McNally.
Cunningham, A. E., & Stanovich, K. E. (1998). What reading does for the mind. American Educator, 22(Spring/Summer), 1-8.
DIBELS (2008). DIBELS data system: Using data to improve achievement for each and all. Retrieved from https://dibels.uoregon.edu/
Engelmann, S. (2007). Teaching needy kids in our backward system: 42 Years of trying. Eugene, OR: ADI Press.
Engelmann, S. E., & Carnine, D. (1982). Theory of instruction: Principles and applications. New York, NY: Irvington Publishers.
Engelmann, S. E., & Engelmann, K. E. (2004). Impediments to scaling up effective comprehensive school reform models. In T. K. Glennan, Jr., S. J. Bodilly, J. R. Galegher, K. A. Kerr (Eds.), Expanding the reach of education reforms: Perspectives from leaders in the scale-up of educational interventions (pp. 107-133). Santa Monica, CA: Rand.
Fixsen, D. L., Naoom, S. F., Blasé, K. A., Friedman, R. M., & Wallace, F. (2005). Implementation research: A synthesis of the literature (FMHI Publication #231). Tampa: University of South Florida, Louis de la Parte Florida Mental Health Institute, The National Implementation Research Network.
Foorman, B. R. (1995). Research on “the great debate”: Code-oriented versus whole language approaches to reading instruction. School Psychology Review, 24(3), 376-392.
Fuchs, L. S., Fuchs, D., Hosp, M. K., & Jenkins, J. R. (2001). Oral reading fluency as an indicator of reading competence: A theoretical, empirical, and historical analysis. Scientific Studies of Reading, 5(3), 239-256.
Fukkink, R. G., & deGlopper, K. (1998). Effects of instruction in deriving word meaning from context: A meta-analysis. Review of Educational Research, 68(4), 450-469.

18 STOCKARD
school reform models to improve reading achievement: A longitudinal study of Direct Instruction and Success for All in an urban district. Journal of Education for Students Placed at Risk, 9, 357-368.
Shadish, W. R., Cook, T. D., & Campbell, D. T. (2002). Experimental and quasi-experimental designs for generalized causal inference. Boston, MA: Houghton Mifflin.
Sherwood, T. (2000). Where has all the “rural” gone? Rural education research and current federal reform. Journal of Research in Rural Education, 16(3), 159-167. Retrieved from http://jrre.psu.edu/articles/v16,n3,p159-167,Sherwood.pdf
Smith, S., Simmons, D., Gleason, M., Kameenui, E., Baker, S., Sprick, M., Gunn, B., & Thomas, C. (2001). An analysis of phonological awareness instruction in four kindergarten basal reading programs. Reading and Writing Quarterly, 17, 25-50.
Snider, V. E. (1990). Direct Instruction reading with average first graders. Reading Improvement, 27, 143-148.
Snow, C. E., Burns, M. S., & Griffin, P. (Eds.). (1998). Preventing reading difficulties in young children. Washington, DC: National Academy Press.
Stanovich, K. E. (1986). Matthew effects in reading: Some consequences of individual differences in the acquisition of literacy. Reading Research Quarterly, 21(4), 360-407.
Stanovich, K. E. (1994). Romance and reality. The Reading Teacher, 47, 280-291.
Stern, J. D. (1994). The condition of education in rural schools. Washington, DC: U.S. Department of Education, Office of Educational Research and Improvement.
Stern, J. D. (1995). Reflections of a recently retired federal analyst in rural education. The Rural Education Newsletter. Supplement (Spring), 3-6.
Stockard, J. (2011). Direct Instruction and First Grade Reading Achievement: The Role of Technical Support and Time of Implementation, Journal of Direct Instruction, 11, 31-50.
Models: Volume III, Building a Common Knowledge Base (pp. 73-98). Mahwah, NJ: Lawrence Erlbaum.
Institute of Child Health and Human Development. (2000). Report of the National Reading Panel. Teaching children to read: An evidence-based assessment of the scientific research literature on reading and its implications for reading instruction (NIH Publication No. 00-4769). Washington, DC: U.S. Government Printing Office.
Juel, C. (1988). Learning to read and write: A longitudinal study of 54 children from first through fourth grades. Journal of Educational Psychology, 80(4), 437-447.
Juel, C., & Minden-Cupp, C. (2000). Learning to read words: Linguistic units and instructional strategies. Reading Research Quarterly, 35, 458-492.
Kaminski, R. A., & Good, R. H. (1996). Toward a technology for assessing basic early literacy skills. School Psychology Review, 25, 215-227.
McNeil, M. (2009). Rural Areas Perceive Policy Tilt. Education Week. Retrieved from http:www.edweek.org/ew/articles/2009/09-02/02stim-rural.29.html
MetaMetrics (2009). Linking DIBELS oral reading fluency with the Lexile framework for reading. Durham, NC: MetaMetrics.
Mulkey, D. (1993). Education in the rural south: Policy issues and research needs. Mississippi State, MS: Southern Rural Development Center.
Murphy, J. (2004). Leadership for Literacy: Research-Based Practice, PreK-3. Thousand Oaks, CA: Corwin.
National Institute of Child Health and Human Development. (1996). Thirty years of NICHHD research: What we now know about how children learn to read. Effective School Practices, 15, 33-46.
National Reading Panel. (2000). Teaching children to read: An evidence-based assessment of the scientific research literature on reading and its implications for reading instruction. Washington, DC: National Institute of Child Health and Human Development.
Pflaum, S., Walberg, H. J., Karigianes, M. L., & Rasher, S. P. (1980). Reading instruction: A quantitative analysis. Educational Researcher, 9, 12-18.
Ross, S. M., Nummery, J. A., Goldfeder, E., McDonald, A., Racho, R., Hornbeck, M., & Fleishman, S. (2004). Using

19READING SKILLS IN RURAL AREAS
their teaching formats. Such practice allows the teachers to increase their presentation skills and give full attention to their students during lessons. District A’s administrators did not allow time for this practice until the 2007-2008 year, and thus this time-point is used to signify full implementation in the analysis.) Table A-1 provides details on the grouping assigned to each student cohort, the year they began kindergarten, and their exposure to the full curricular model. As noted in the text, results of the analysis separating data from each site and using yearly cohorts, rather than groups of years, were substantively identical to those reported in the body of the article and are available upon request from the author.
As noted in the text, the three districts described in this report varied in the year in which they began to fully implement Reading Mastery and the NIFDI model, the grades exposed to the curriculum, and the years of DIBELS data that were available. District B began the curriculum under NIFDI’s guidance in 2004-2005 and began gathering DIBELS data in the previous academic year (2003-2004). District C began its implementation in 2006-2007 and began gathering DIBELS data two years earlier, in 2004-2005. District A began using the DI curriculum in 2005-2006 and gathering DIBELS data in 2004-2005. However, this district did not fully comply with the NIFDI model until the 2007-2008 year. (One of the key elements of good implementations is providing time for teachers to practice
Appendix A
Timing of Implementations of Reading Mastery and NIFDI Support for Each District and Details on Sample Composition
Table A-1Study Cohorts, Kindergarten Year, and Grades Exposed to Curriculum by Study Site
District ACohort group Kindergarten year Grades with full exposure nFull DI 2007-2008 K to 1 149Partial DI 2006-2007 1 to 2* 168Partial DI 2005-2006 2 to 3* 193Partial DI 2004-2005 3 to 4** 216
District BCohort group Kindergarten 7ear Grades with full exposure nFull DI 2007-2008 K to 1 183Full DI 2006-2007 K to 2 194Full DI 2005-2006 K to 3 165Full DI 2004-2005 K to 4 150Partial DI 2003-2004 1 to 5 150
District CCohort group Kindergarten year Grades with full 3xposure nFull DI 2007-2008 K to 1 25Full DI 2006-2007 K to 2 21Partial DI 2005-2006 1 to 2 40Partial DI 2004-2005 1 to 3 35
* Students in these groups were exposed to Reading Mastery beginning in kindergarten, but the schools did not fully embrace the curriculum model until they began grade 1 (for those beginning kindergarten in 2006-2007) or grade 2 (for those beginning kindergarten in 2005-2006).** Students in this group were exposed to Reading Mastery beginning in first grade, but the schools did not fully implement the model until their third grade year.