Increasing investment in Botswana’s agriculture …...6. Overview Botswana’s agricultural sector...
24
Increasing investment in Botswana’s agriculture sector 27 March 2019 Agri SA©2019
Transcript of Increasing investment in Botswana’s agriculture …...6. Overview Botswana’s agricultural sector...

Increasing investment in Botswana’s agriculture sector27 March 2019
Agri SA©2019

1. Organisational overview of Agri SA
Agri SA©2019
• South Africa’s leading agricultural organisation
• Value chain strategy
• Focus on agricultural policy advocacy
• Representing approximately 29 000 farmers
• Membership Structure• Provincial Affiliations (9 Provinces)• Commodity Chamber (26 Organisations)• Corporate Chamber (43 Companies)
43 Corporate members

2. Value of organised agriculture for farmers
Focus areas
Market development and access
Research and development
Transformation
Production related information
26
Agri SA©2019

Agri SA©2019

Agri SA©2019

Agri SA©2019

Agri SA©2019

Agri SA©2019Agri SA©2019Agri SA©2019

Agri SA©2019

Agri SA©2019

Agri SA©2019

Agri SA©2019

Botswana
Agri SA©2019
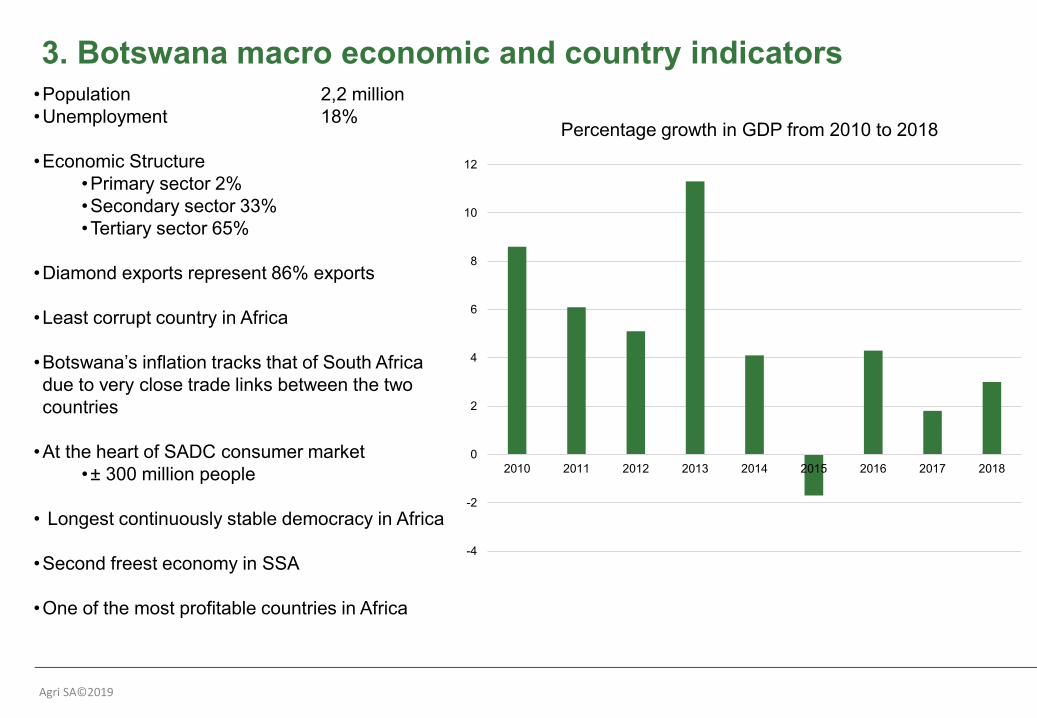
3. Botswana macro economic and country indicators
-4
-2
0
2
4
6
8
10
12
2010 2011 2012 2013 2014 2015 2016 2017 2018
Percentage growth in GDP from 2010 to 2018
•Population 2,2 million •Unemployment 18%
•Economic Structure•Primary sector 2% •Secondary sector 33%•Tertiary sector 65%
•Diamond exports represent 86% exports
•Least corrupt country in Africa
•Botswana’s inflation tracks that of South Africa due to very close trade links between the two countries
•At the heart of SADC consumer market•± 300 million people
• Longest continuously stable democracy in Africa
•Second freest economy in SSA
•One of the most profitable countries in Africa
Agri SA©2019
PartnerCoppe
r & nickel
Diamonds Gold
Hides &
skins
Iron, steel & related
Machinery & electri
cal equipment
Meat PlasticSalt & soda ash
Textiles
Vehicles &
transport
equipment
Other good
sTotal
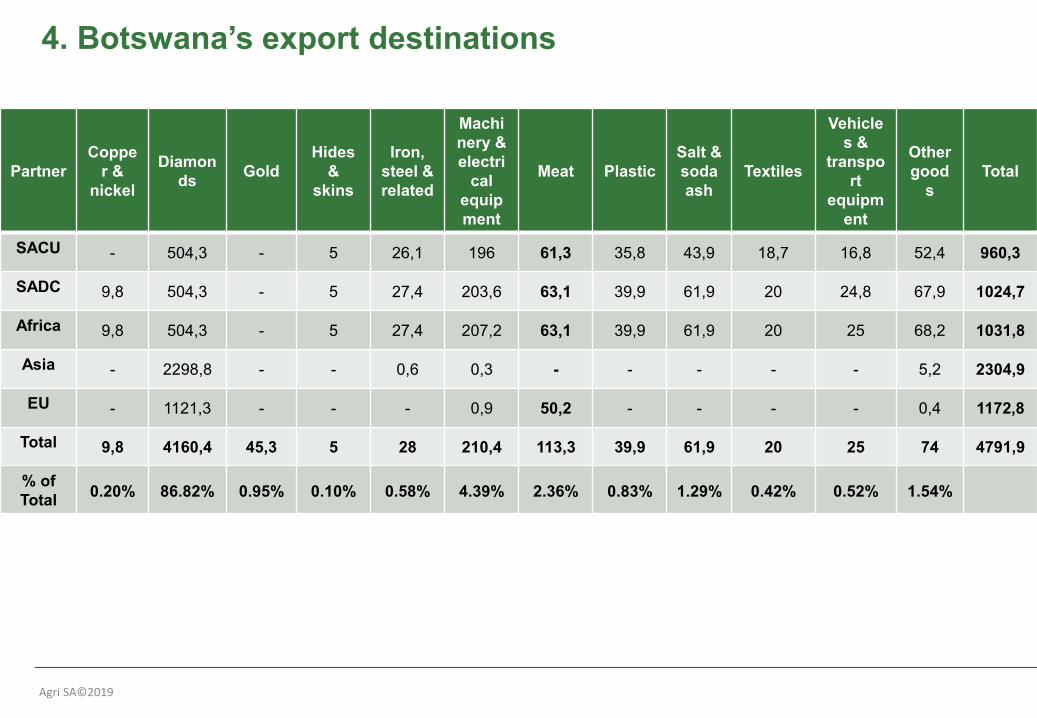
SACU - 504,3 - 5 26,1 196 61,3 35,8 43,9 18,7 16,8 52,4 960,3
SADC 9,8 504,3 - 5 27,4 203,6 63,1 39,9 61,9 20 24,8 67,9 1024,7
Africa 9,8 504,3 - 5 27,4 207,2 63,1 39,9 61,9 20 25 68,2 1031,8
Asia - 2298,8 - - 0,6 0,3 - - - - - 5,2 2304,9
EU - 1121,3 - - - 0,9 50,2 - - - - 0,4 1172,8
Total 9,8 4160,4 45,3 5 28 210,4 113,3 39,9 61,9 20 25 74 4791,9
% of Total 0.20% 86.82% 0.95% 0.10% 0.58% 4.39% 2.36% 0.83% 1.29% 0.42% 0.52% 1.54%
4. Botswana’s export destinations
Agri SA©2019

5. Botswana’s African comparison rankings
Index Rankings
RMB’s Investment Attractiveness Index 13th
Investment Attractiveness (World Ranking) 91
Quality of infrastructure 11th
Africa Infrastructure Development Index 2018 10th
Transport Composition Index 6th
Electricity Composition Index 8th
ICT Development Index 9th
Human Development Index 6th
Healthcare Quality and Access Index 41
Water and Sanitation Composite Index 7th
Source: RMB - Where to invest in Africa, 2019
Agri SA©2019

6. Overview Botswana’s agricultural sector
Country Area 58 173 (1000ha)
Land Area 56 673 (1000ha)
Forest Area 10 737.8 (1000ha)
Agricultural Area 25 861.6 (1000ha)
•Semi arid country
•Agriculture represents only 2,4% of GDP
•±80% of agriculture’s GDP generated by beef cattle industry
•Dualistic landscape• Commercial sector• Traditional sector
• 58, 974 traditional farmers/holders•5.7% aged between 15 and 35 years
•32.9% aged 65 year and more
• Male farmers 62.1%Female farmers 37.9 %
Agri SA©2019

7. The opportunity to change the water landscape
Agri SA©2019

8. Overview of Livestock Production (Beef cattle, goat, sheep)
0
500
1000
1500
2000
2500
2006 2008 2010 2012 2014 2016 2018
Cattle, Goat, Sheep populations from 2017 to 2018 (‘000)
Cattle Population Goat population Sheep population
Agri SA©2019

9. Livestock Production - Birth rate, mortality rate, off-take rate
05
101520253035404550
2007 2008 2009 2010 2011 2012 2013 2014 2015
Traditional Sector: Goats Production Indicators Trends: 2007 -2017
Birth rate Mortality Rate Off-take rate
0
5
10
15
20
25
30
35
40
2006 2008 2010 2012 2014 2016 2018
Traditional Sector: Sheep Production Indicators Trends: 2007 – 2017
Birth rate Mortality Rate Off-take rate
0
10
20
30
40
50
60
70
2006 2008 2010 2012 2014 2016 2018
Traditional Sector: Cattle Production Indicators Trends: 2007 – 2017
Birth rate Mortality Rate Off-take rate
•Consistently low rates shows the lack of quality health care, feed and growth in herds.
• Telling of the scale of farmers and their inability to invest in operations and infrastructure
•Average land area per holding (ha) is 4ha
Agri SA©2019

10. Botswana Meat Commission (BMC)• BMC mandated with the slaughter and marketing of all Botswana beef exports
• Commission plagued by crippling losses• Deficit of P770.12 million during 2016/2017• Deficit of P535.11 million during 2015/16• Income declined by 36% from P1 872.13 million to P1 183.36 million during the
2016/17 financial year
• Apparent inability to pay producers on time discouraging farmers to sell to BMC
• Government upgrading of BMC in Lobatse – P300m – December 2018
• Mentioned intention to explore Chinese market
• Francistown abattoir that was designed to slaughter 380 cattle a day has actually been slaughtering on average between 165 and 167 cattle a day which is 43.9 per cent capacity utilization
• Transportation to Francistown and Lobatse also a challenge
• Busy with privatisation
Agri SA©2019

Indicators 2015 2017
1. Number of land holdings 41043 35173
2. Holdings planted 30150 33399
3. Total land area (ha) 204 965 135 315
4. Total area planted (ha) 123251 126821
5. Total area harvested (ha) 32641 92,942
6. Fallow land Area 81714 8,494
7. % Land area not planted 39,9 6,3
11. Overview of crop production (Maize, sorghum, millet and beans/pulses)
0102030405060708090
2006 2008 2010 2012 2014 2016 2018
Traditional Sector: Land Holdings, Holdings Planted and Harvested Trends: 2007 - 2017
Land Holdings Holdings planted holdigs harvested
0
50
100
150
200
250
300
350
2006 2008 2010 2012 2014 2016 2018
Traditional Sector: Land Area, Area Planted & Harvested Trends: 2007 - 2017
land area area planted area harvested
Agri SA©2019

12. How to attract investment
Skills development
Improvement of BMC
Pandamatenga pipeline
Secure land ownership
Spedu revitalisation
Agri SA©2019

13. Agri SA Team
Jolanda AndragHead: Commodity Chamber
Jolanda previously worked in academia as lecturer and researcher. She holds a Masters Degree in Political Science from NWU.
Omri van ZylExecutive Director, External Strategy
Omri is an admitted attorney with over a decade experience in leading the Africa consulting team at an international consultancy on agricultural strategy, M&A and operations. He holds a MBA from UP.
Agri SA©2019