
Increasing Investment and Capital Flows in Maryland
12
May 2016 Increasing Investment and Capital Flows in Maryland Why Maryland’s Renewable Energy Policy Matters
-
Upload
scott-clausen -
Category
Documents
-
view
50 -
download
1
Transcript of Increasing Investment and Capital Flows in Maryland
May 2016
Increasing Investment and
Capital Flows in Maryland
Why Maryland’s Renewable
Energy Policy Matters

Executive Summary
Renewable energy is the fastest growing new source of power. In 2015, 16.3 gigawatts (GW) of renewable energy was constructed in the U.S. This is more than double the amount of natural gas-fired generation constructed in the same year. Renewables are forecast to grow 9% in 2016 from 2015 levels.1
Maryland’s Renewable Portfolio Standard (RPS) and other policies have helped create a robust market for renewable energy generation. The state’s installed renewable energy capacity now includes 190 megawatts (MW) of wind power and 349 MW of solar power.2, 3 Along with 163 MW of biomass generation, Maryland has an installed capacity of 702 MW of renewable power.
The scale up of renewable energy in Maryland has attracted almost $1.4 billion in asset finance, private equity and venture capital to Maryland since 2008.4 Increasing the RPS to 25% by 2020 could result in approximately $8.22 billion in additional in-state investment and economic activity.
Maryland ranks 13th in the nation for installed solar capacity. Maryland is home to 182 solar-related companies that employ over 4,300 people.2
Maryland ranks 30th in the nation for installed wind capacity. AWEA estimates that over $480,000 in annual lease payments are made to Maryland landowners, providing additional income to rural communities.3
Wind and solar projects now under development in Maryland will drive over $3.62 billion in investment and economic activity.
A large and growing number of corporations are directly purchasing renewable energy and making choices about where to locate new facilities based on where renewable energy is available. GM, McCormick’s, IKEA, Verizon and Staples have all developed renewable energy projects at or near their facilities located in Maryland.
Historically, Maryland supplied approximately 30% of the renewable energy credits (RECs) needed to satisfy its RPS. The remainder of the RECs were obtained from projects in other PJM states.5 Maryland should seek to increase the amount of in-state renewable energy production.
(1) U.S. Energy Information Administration. (2) SEIA, Maryland State Profile, http://www.seia.org/state-solar-policy/maryland. (3) AWEA, Maryland State Profiles, available at http://awea.files.cms-plus.com/FileDownloads/pdfs/Maryland.pdf. (4) Bloomberg New Energy Finance. (5) Maryland Public Service Commission RPS Compliance Reports.

Almost $1.4 Billion Invested in Maryland’s Renewable Energy Sector Since 2008
Total: $1,398
$97.2
$5.2
$273.8
$123.9
$190.0
$22.5
$137.5
$571.3
$0
$200
$400
$600
$800
$1,000
$1,200
$1,400
$1,600
$0
$100
$200
$300
$400
$500
$600
2008 2009 2010 2011 2012 2013 2014 2015
Cu
mu
lati
ve In
vest
men
t ($
US
Mill
ion
s)
An
nu
al In
vest
men
t ($
US
mill
ion
s)
Cumulative Investment ($US millions)
Asset Finance ($US millions)
VC/PE ($US millions)
Source: Bloomberg New Energy Finance (BNEF)
Investment figures do not include investment in small distributed generation. Sectors included are those above 1 MW for solar, wind, marine, small hydro (<50 MW), geothermal, and biomass & waste, and biofuels above 9 mLpa. VC/PE numbers only include companies with sufficient exposure to the sector to be classified as 'new energy' relevant. Results are based on tracked deals only and are not buffered to close gaps with top down statistics.

120
0 0 0
70.0 60
500
0
100
200
300
400
500
600
700
800
0
100
200
300
400
500
600
2011 2012 2013 2014 2015 Planned on-shore
Planned off-shore
Cu
mu
lati
ve C
apac
ity
(MW
)
An
nu
al C
apac
ity
(MW
)
Cumulative Capacity (MW) Annual Capacity (MW) Source: AWEA, BNEF
Historical and Future Wind Builds in Maryland
100% of Maryland’s wind capacity (190 MW) was built following the passage of the state’s RPS.
Wind farms provide more than $480,000 in lease payments to Maryland land owners annually.
The 60 MW Dan’s Mountain project in Western Maryland is under development.1 The development of this project is expected to result in $36.8 million in economic activity.
A lease for a 500 MW off-shore wind project was awarded in 2014. If developed, this project could drive over $540 million in economic activity.1
(1) Bloomberg New Energy Finance PPA Database, accessed May 12, 2016; Maryland Public Utilities Commission.
Economic activity was calculated using the Jobs and Economic Development Impact Model (JEDI) model developed by the National Renewable Energy Laboratory. Dollar values are in 2016 dollars. Model assumes that a total of 60 MW of on-shore wind would be built with an average turbine size of 3.0 MW. Model also assumes that a total of 500 MW of off-shore wind would be built with an average turbine size of 6 MW.
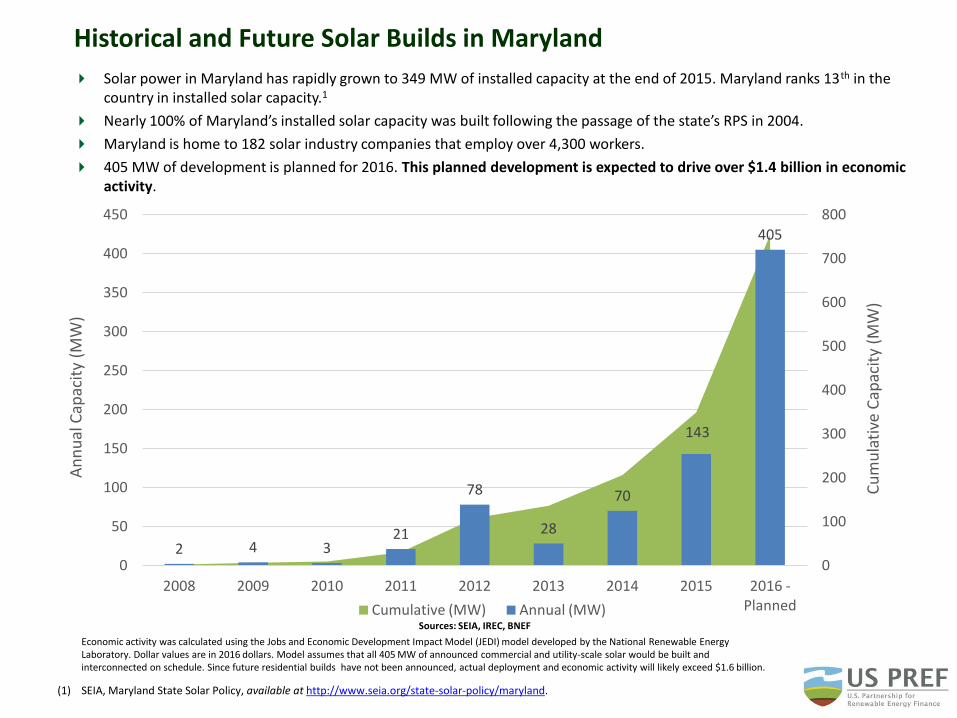
Historical and Future Solar Builds in Maryland
Solar power in Maryland has rapidly grown to 349 MW of installed capacity at the end of 2015. Maryland ranks 13th in the country in installed solar capacity.1
Nearly 100% of Maryland’s installed solar capacity was built following the passage of the state’s RPS in 2004.
Maryland is home to 182 solar industry companies that employ over 4,300 workers.
405 MW of development is planned for 2016. This planned development is expected to drive over $1.4 billion in economic activity.
Sources: SEIA, IREC, BNEF
(1) SEIA, Maryland State Solar Policy, available at http://www.seia.org/state-solar-policy/maryland.
2 4 3 21
78
28
70
143
405
0
100
200
300
400
500
600
700
800
0
50
100
150
200
250
300
350
400
450
2008 2009 2010 2011 2012 2013 2014 2015 2016 - Planned
Cu
mu
lati
ve C
apac
ity
(MW
)
An
nu
al C
apac
ity
(MW
)
Cumulative (MW) Annual (MW)
Economic activity was calculated using the Jobs and Economic Development Impact Model (JEDI) model developed by the National Renewable Energy Laboratory. Dollar values are in 2016 dollars. Model assumes that all 405 MW of announced commercial and utility-scale solar would be built and interconnected on schedule. Since future residential builds have not been announced, actual deployment and economic activity will likely exceed $1.6 billion.
The Future of Energy Development in Maryland
According to the Energy Information Administration (EIA), 1,696 MW of traditional electrical generation capacity located in Maryland is scheduled to be retired by 2020.1
Growing corporate demand for renewable energy has created a robust U.S. market of over 3.4 GW in 2015 alone. Over 80 large corporations recently committed to become powered by renewable energy, and this number will continue to increase.2
EIA projects that U.S. renewable generation will grow by 72% between 2013 and 2040 (base case), with
the overall share of renewables in the energy mix increasing from 13% in 2013 to 18% in 2040.3
Macro trends clearly point to an electrical generating mix that is increasingly renewable. States will
therefore be competing amongst each other for development and investment. In this regard, Maryland, with its location in the PJM interconnection and large population centers, is positioned to reap the benefits of increased development of renewable energy.
The proposed increase in Maryland’s RPS will require an additional 4.45 TWh of renewable power in 2020 over existing law. Meeting this demand with in-state generation would have significant economic benefits through increased investment, jobs and economic growth.
Maryland has an opportunity to position itself as a leader in renewable energy in both the mid-Atlantic region and the country.
(1) Energy Information Administration, Planned U.S. Electric Generating Unit Retirements, available at http://www.eia.gov/electricity/monthly/ (2) American Business Act on Climate Pledge, available at https://www.whitehouse.gov/the-press-office/2015/10/19/fact-sheet-white-house-
announces-commitments-american-business-act (3) Energy Information Administration, Annual Energy Outlook 2015, available at http://www.eia.gov/forecasts/aeo/
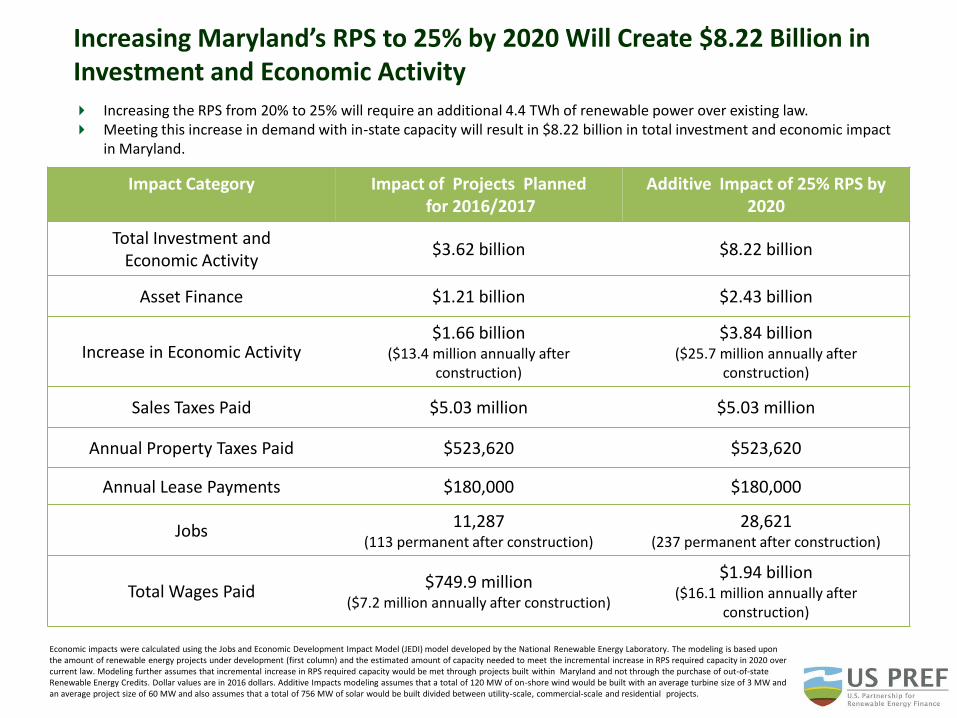
Increasing Maryland’s RPS to 25% by 2020 Will Create $8.22 Billion in Investment and Economic Activity
Impact Category Impact of Projects Planned for 2016/2017
Additive Impact of 25% RPS by 2020
Total Investment and Economic Activity
$3.62 billion $8.22 billion
Asset Finance $1.21 billion $2.43 billion
Increase in Economic Activity $1.66 billion
($13.4 million annually after construction)
$3.84 billion ($25.7 million annually after
construction)
Sales Taxes Paid $5.03 million $5.03 million
Annual Property Taxes Paid $523,620 $523,620
Annual Lease Payments $180,000 $180,000
Jobs 11,287
(113 permanent after construction) 28,621
(237 permanent after construction)
Total Wages Paid $749.9 million
($7.2 million annually after construction)
$1.94 billion ($16.1 million annually after
construction)
Economic impacts were calculated using the Jobs and Economic Development Impact Model (JEDI) model developed by the National Renewable Energy Laboratory. The modeling is based upon the amount of renewable energy projects under development (first column) and the estimated amount of capacity needed to meet the incremental increase in RPS required capacity in 2020 over current law. Modeling further assumes that incremental increase in RPS required capacity would be met through projects built within Maryland and not through the purchase of out-of-state Renewable Energy Credits. Dollar values are in 2016 dollars. Additive Impacts modeling assumes that a total of 120 MW of on-shore wind would be built with an average turbine size of 3 MW and an average project size of 60 MW and also assumes that a total of 756 MW of solar would be built divided between utility-scale, commercial-scale and residential projects.
Increasing the RPS from 20% to 25% will require an additional 4.4 TWh of renewable power over existing law. Meeting this increase in demand with in-state capacity will result in $8.22 billion in total investment and economic impact
in Maryland.
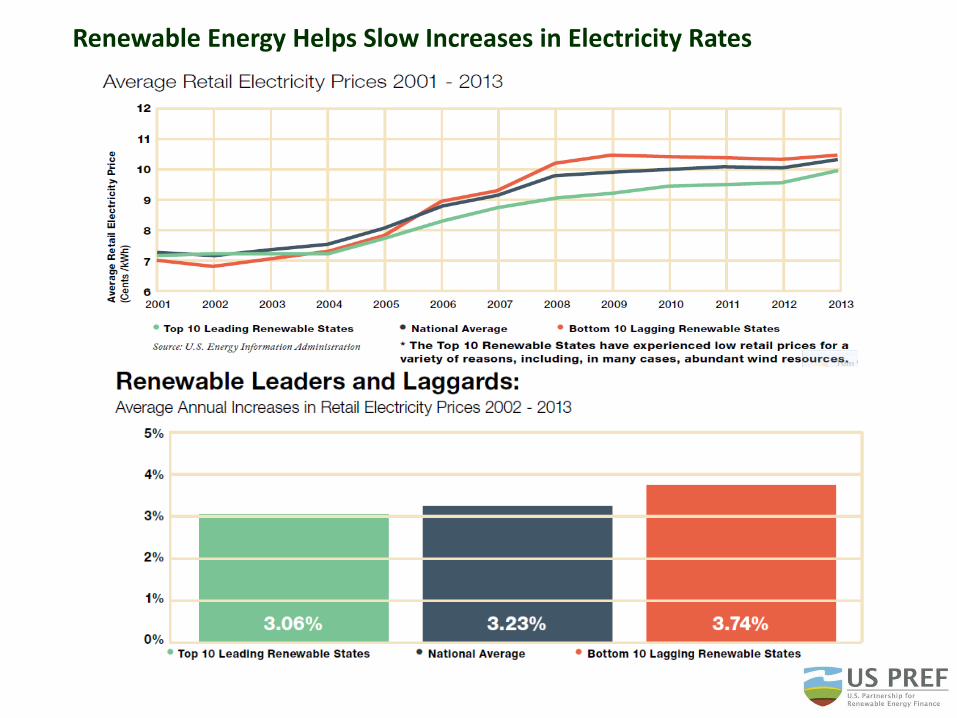
Renewable Energy Helps Slow Increases in Electricity Rates

Renewable Energy Trends: Significant Cost Reductions
Renewable energy costs are falling rapidly. The levelized cost of solar has fallen 82% since 2009 and the levelized cost of wind has fallen 61%.1
The costs of renewable energy will continue to fall as technology improved and the industry continues to increase scale.
(1) Lazard, Lazard‘s Levelized Cost of Energy Analysis – Version 9.0, November 2015.
82% Reduction in Solar LCOE since 2009 61% Reduction in Wind LCOE since 2009
Source: Lazard
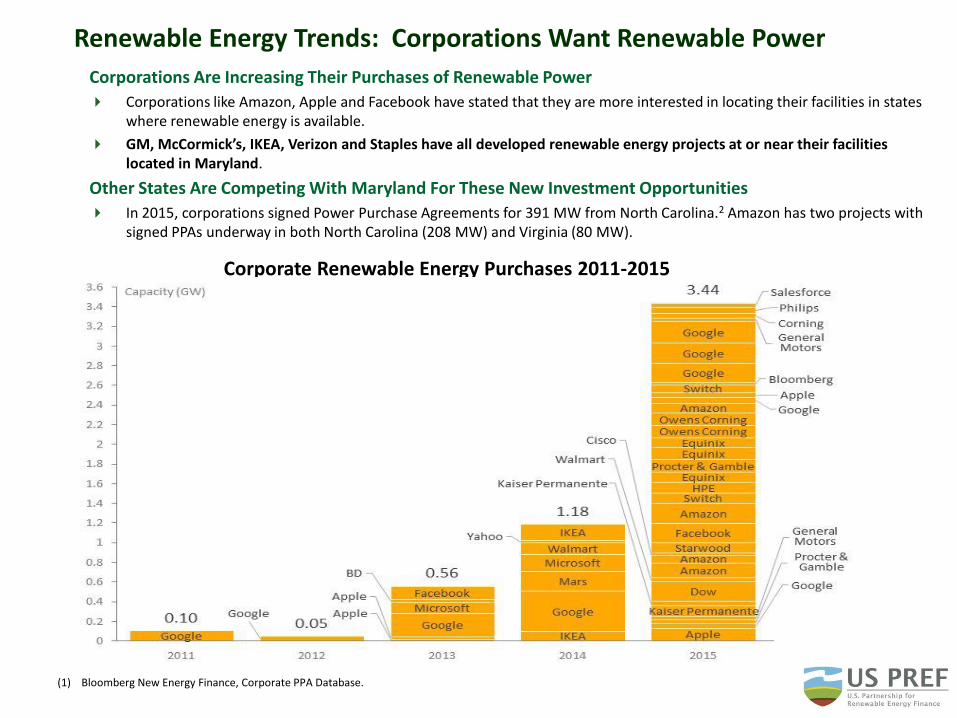
Renewable Energy Trends: Corporations Want Renewable Power
Corporations Are Increasing Their Purchases of Renewable Power
Corporations like Amazon, Apple and Facebook have stated that they are more interested in locating their facilities in states where renewable energy is available.
GM, McCormick’s, IKEA, Verizon and Staples have all developed renewable energy projects at or near their facilities located in Maryland.
Other States Are Competing With Maryland For These New Investment Opportunities
In 2015, corporations signed Power Purchase Agreements for 391 MW from North Carolina.2 Amazon has two projects with signed PPAs underway in both North Carolina (208 MW) and Virginia (80 MW).
(1) Bloomberg New Energy Finance, Corporate PPA Database.
Source: RMI BRC
Corporate Renewable Energy Purchases 2011-2015

Renewable Energy Trends: Massive Capital Investment
The Renewable Energy Sector is Attracting Large Amounts of Private Capital
In 2015 alone, $44 billion was invested in the U.S. renewable energy sector.1
Over $380 billion has been invested in the U.S. renewable energy sector from 2004-2015.
U.S. renewable energy investment is growing at a compound annual growth rate of 21%.1
(1) UNEP and BNEF, Global Trends in Renewable Energy Investment 2016; Bloomberg New Energy Finance Clean Energy, Energy Investment Data.
$6
$12
$28
$34 $36
$24
$35
$53
$40
$36 $38
$44
$0
$50
$100
$150
$200
$250
$300
$350
$400
$450
$0
$10
$20
$30
$40
$50
$60
2004 2005 2006 2007 2008 2009 2010 2011 2012 2013 2014 2015
Total Cumulative Investment Total Annual Investment
Technologies include: all biomass and waste-to-energy, geothermal, and wind projects greater than 1 MW; all hydropower between 1 MW and 50
MW; all wave and tidal projects; all biofuel projects with a capacity of one million liters or greater per year; and all solar projects.
Source: Frankfurt School-UNEP/BNEF
U.S. Total New Renewable Energy Investment ($US billion)
ABOUT US PREF US PREF is a coalition of senior level officials with companies that finance, develop, manufacturer and use renewable energy. US PREF members focus on increasing capital formation and investment in renewable energy and educating the public sector to ensure that policy impacts the market as efficiently and effectively as possible. US PREF is a program of the American Council On Renewable Energy (ACORE), a Washington, DC ‐ based non‐profit organization that unites business, policy and finance to accelerate the transition to a renewable energy economy. For more information please contact Todd Foley, Senior Vice President, Strategy, Policy & Government Relations at [email protected], or Scott Clausen, Policy and Research Manager, at [email protected] or visit www.uspref.org.
ABOUT ACORE ACORE is a national non-profit organization dedicated to advancing the renewable energy sector through market development, policy changes, and financial innovation. With a savvy staff of experts, fifteen years of experience promoting renewable energy and hundreds of member companies, non-profits, and other organizations from across the spectrum of renewable energy technologies, consumers, and investors, ACORE is uniquely well-positioned to strategically promote the policies and financial structures essential to renewable energy growth. The organization’s annual conferences in Washington, D.C., New York and San Francisco set the industry standard in providing important venues for key leaders to meet, discuss recent developments, and hear the latest from senior government officials and seasoned experts. Additional information is available at: www.acore.org.