INCREASING IMPACT The year in review 2006
181
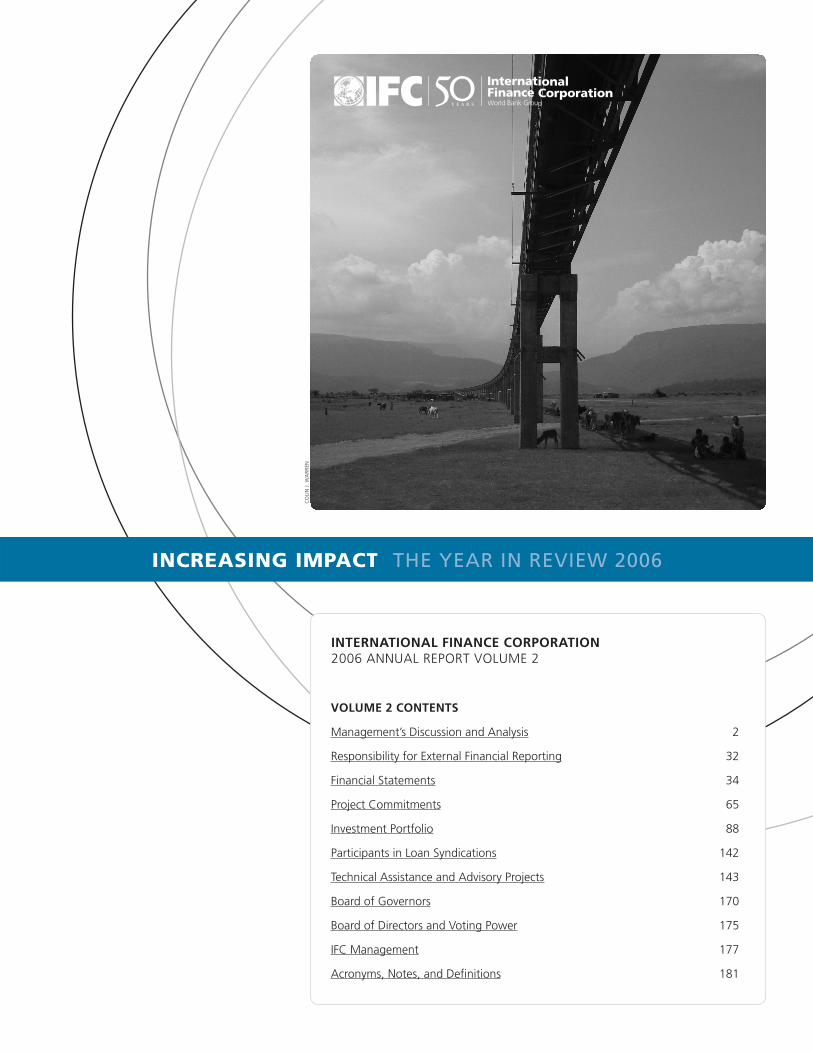
INCREASING IMPACT THE YEAR IN REVIEW 2006 VOLUME 2 CONTENTS Management’s Discussion and Analysis 2 Responsibility for External Financial Reporting 32 Financial Statements 34 Project Commitments 65 Investment Portfolio 88 Participants in Loan Syndications 142 Technical Assistance and Advisory Projects 143 Board of Governors 170 Board of Directors and Voting Power 175 IFC Management 177 Acronyms, Notes, and Definitions 181 INTERNATIONAL FINANCE CORPORATION 2006 ANNUAL REPORT VOLUME 2 COLIN J. WARREN
-
Upload
vuongkhanh -
Category
Documents
-
view
223 -
download
0
Transcript of INCREASING IMPACT The year in review 2006
IncreasIng Impact The year in review 2006
Volume 2 Contents
Management’s Discussion and Analysis 2
Responsibility for External Financial Reporting 32
Financial Statements 34
Project Commitments 65
Investment Portfolio 88
Participants in Loan Syndications 142
Technical Assistance and Advisory Projects 143
Board of Governors 170
Board of Directors and Voting Power 175
IFC Management 177
Acronyms, Notes, and Definitions 181
InternatIonal FInanCe CorporatIon2006 ANNuAL REPoRT VoLuME 2
Co
LIN
J. W
AR
REN
PAGE 2 IFc annual report 2006
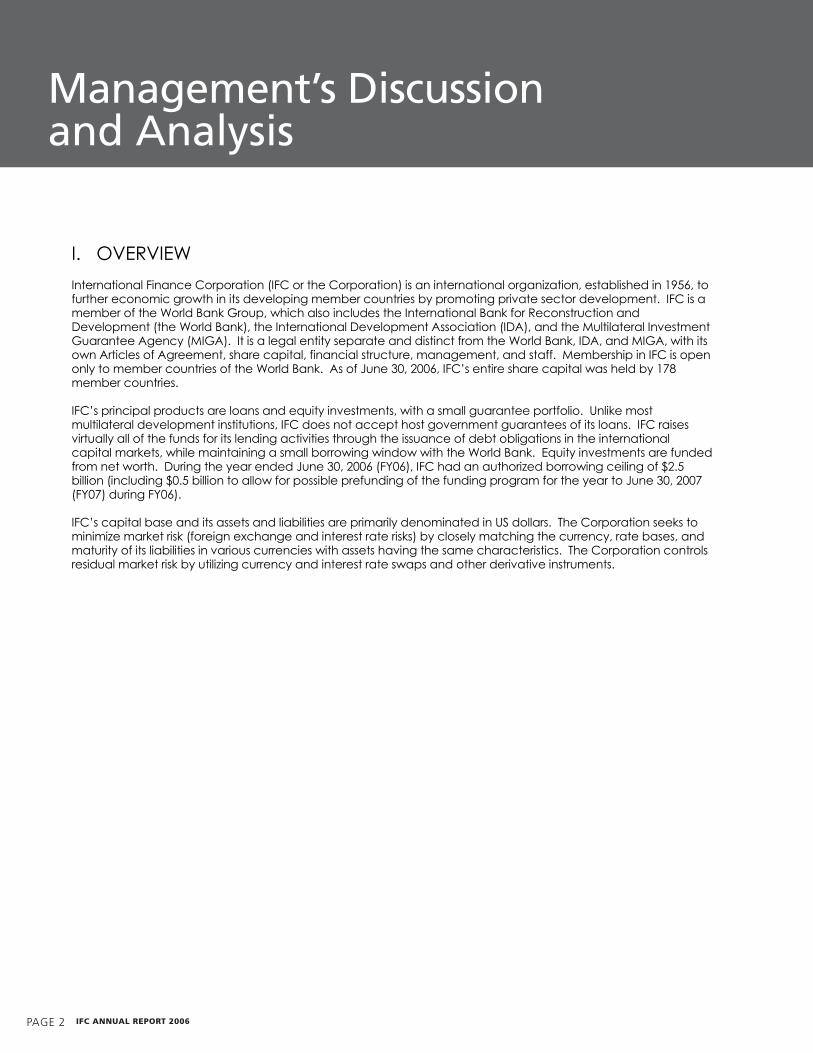
I. OVERVIEW
International Finance Corporation (IFC or the Corporation) is an international organization, established in 1956, to further economic growth in its developing member countries by promoting private sector development. IFC is a member of the World Bank Group, which also includes the International Bank for Reconstruction and Development (the World Bank), the International Development Association (IDA), and the Multilateral Investment Guarantee Agency (MIGA). It is a legal entity separate and distinct from the World Bank, IDA, and MIGA, with its own Articles of Agreement, share capital, financial structure, management, and staff. Membership in IFC is open only to member countries of the World Bank. As of June 30, 2006, IFC’s entire share capital was held by 178 member countries.
IFC’s principal products are loans and equity investments, with a small guarantee portfolio. Unlike most multilateral development institutions, IFC does not accept host government guarantees of its loans. IFC raises virtually all of the funds for its lending activities through the issuance of debt obligations in the international capital markets, while maintaining a small borrowing window with the World Bank. Equity investments are funded from net worth. During the year ended June 30, 2006 (FY06), IFC had an authorized borrowing ceiling of $2.5 billion (including $0.5 billion to allow for possible prefunding of the funding program for the year to June 30, 2007 (FY07) during FY06).
IFC’s capital base and its assets and liabilities are primarily denominated in US dollars. The Corporation seeks to minimize market risk (foreign exchange and interest rate risks) by closely matching the currency, rate bases, and maturity of its liabilities in various currencies with assets having the same characteristics. The Corporation controls residual market risk by utilizing currency and interest rate swaps and other derivative instruments.
Management’s Discussion and analysis

volume 2 PAGE 3
II. FINANCIAL SUMMARY
Basis of preparation of the Corporation’s financial statements
The accounting and reporting policies of the Corporation conform to accounting principles generally accepted in the United States (US GAAP).
The Corporation has traditionally prepared one set of financial statements and footnotes, complying with both US GAAP and International Financial Reporting Standards (IFRS). However, principally due to material differences between US Statement of Financial Accounting Standards (SFAS) No. 133, Accounting for Derivative Instruments and Hedging Activities, as amended by SFAS No. 138, Accounting for Certain Derivatives and Certain Hedging Relationships (collectively SFAS No. 133), and its counterpart in IFRS, IAS No. 39, Financial Instruments Recognition and Measurement, it has not been possible for the Corporation to satisfy the requirements of both US GAAP and IFRS via one set of financial statements since the year ended June 30, 2000.
IFC is actively monitoring developments related to accounting standards and the primary basis for preparation of its financial statements, all with a view to the necessary systems and controls to manage its various lines of business. IFC now plans to resume presentation of its financial statements using IFRS upon completion of the evaluation of an Exposure Draft of Proposed Amendments to IAS 32, Financial Instruments: Presentation and IAS 1, Presentation of Financial Instruments – Financial Instruments Puttable at Fair Value and Obligations Arising on Liquidation, issued in June 2006, and in particular the application of this proposed amendment to IFC’s capital stock.
Unless stated otherwise, discussions of financial performance herein refer to income after expenditures for technical assistance and advisory service (TAAS), and expenditures for performance-based grants (PBG) (operating income). Operating income excludes the effects of net gains (losses) on non-trading financial instruments pursuant to SFAS No. 133. The effects of SFAS No. 133 on net income are discussed in Section VII.
Financial performance summary
From year to year, IFC’s operating income is affected by a number of factors, principally the magnitude of provisions for losses against its loans and guarantees; impairment of equity investments; loans in nonaccrual status and recoveries of interest on loans formerly in nonaccrual status; and income (dividends and capital gains) generated from its equity portfolio. A significant part of IFC’s liquid assets portfolio is invested in fixed income securities, which are also subject to external market factors that affect the value of such securities, adding variability to operating income. Net income also includes net gains and losses on financial instruments other than from trading activities, pursuant to SFAS No. 133.
IFC has been consistently profitable since its inception in 1956, and recorded operating income for FY06 of $1,409 million, as compared with $1,953 million for the year ended June 30, 2005 (FY05), and $982 million for the year ended June 30, 2004 (FY04). The $1,953 million of operating income in FY05 was a record high for the Corporation. FY06 operating income continued to reflect strong contributions across each of IFC’s main product lines: loans, equities and treasury operations. The Corporation reported net income in FY06, including the effects of SFAS No. 133, of $1,278 million, as compared with record net income of $2,015 million for FY05 and $993 million for FY04.
The Corporation’s operating income for the past five fiscal years ended June 30 is presented below:
2002 20030
400
800
1,200
1,600
2,000
2004 2005 2006
Fiscal year ended June 30
U.S
.$ m
illio
ns
I. OVERVIEW
International Finance Corporation (IFC or the Corporation) is an international organization, established in 1956, to further economic growth in its developing member countries by promoting private sector development. IFC is a member of the World Bank Group, which also includes the International Bank for Reconstruction and Development (the World Bank), the International Development Association (IDA), and the Multilateral Investment Guarantee Agency (MIGA). It is a legal entity separate and distinct from the World Bank, IDA, and MIGA, with its own Articles of Agreement, share capital, financial structure, management, and staff. Membership in IFC is open only to member countries of the World Bank. As of June 30, 2006, IFC’s entire share capital was held by 178 member countries.
IFC’s principal products are loans and equity investments, with a small guarantee portfolio. Unlike most multilateral development institutions, IFC does not accept host government guarantees of its loans. IFC raises virtually all of the funds for its lending activities through the issuance of debt obligations in the international capital markets, while maintaining a small borrowing window with the World Bank. Equity investments are funded from net worth. During the year ended June 30, 2006 (FY06), IFC had an authorized borrowing ceiling of $2.5 billion (including $0.5 billion to allow for possible prefunding of the funding program for the year to June 30, 2007 (FY07) during FY06).
IFC’s capital base and its assets and liabilities are primarily denominated in US dollars. The Corporation seeks to minimize market risk (foreign exchange and interest rate risks) by closely matching the currency, rate bases, and maturity of its liabilities in various currencies with assets having the same characteristics. The Corporation controls residual market risk by utilizing currency and interest rate swaps and other derivative instruments.

PAGE 4 IFc annual report 2006
The table below presents selected financial data for the last five fiscal years (in millions of US dollars, except where otherwise stated):
As of and for the years ended June 30
2006 2005 2004 2003 2002
Net income highlights: Interest income and financial fees from loans 807 660 518 477 547
Income from liquid asset trading activities 444 358 177 475 524
Charges on borrowings (603) (309) (141) (226) (438)
Income from equity investments 1,228 1,365 658 145 160
Of which:
Realized capital gains on equity sales 928 723 386 52 288
Dividends and profit participations 327 258 207 147 141
Amortization of UJV conditional asset retirement obligations (8) - - - -
Unrealized income from LLPs and certain LLCs 56 191 - - -
Changes in carrying value of equity investments - 269 69 (50) (268)
Equity investment impairment write-downs (57) (62) - - -
Net losses on equity-related derivatives and custody & other fees (18) (14) (4) (4) (1)
(Provision for) release of provision for losses on loans & guarantees (15) 261 103 (48) (389)
Net other expense (362) (344) (304) (295) (243)
Income before expenditures for TAAS, PBG and net (losses) gains on non-
trading financial instruments
1,499 1,991 1,011 528 161
Expenditures for TAAS (55) (38) (29) - -
Expenditures for PBG (35) - - - -
Income after expenditures for TAAS and PBG (operating income) 1,409 1,953 982 528 161
Net (losses) gains on non-trading financial instruments (131) 62 11 (41) 54
Net income 1,278 2,015 993 487 215
Consolidated balance sheet highlights:
Total assets 38,420 39,560 32,361 31,543 27,739
Liquid assets, net of associated derivatives 12,730 13,325 13,055 12,952 14,532
Loans and equity investments, net 12,731 11,489 10,279 9,377 7,963
Borrowings withdrawn and outstanding 14,967 15,359 16,254 17,315 16,581
Total capital 11,076 9,798 7,782 6,789 6,304
Of which:
Undesignated retained earnings 7,859 6,871 5,193 4,425 3,938
Retained earnings designated for TAAS 487 312 225 - -
Retained earnings designated for PBG 215 250 - - -
Retained earnings designated for grants to IDA 150 - - - -
Capital stock 2,364 2,364 2,361 2,360 2,360
Other 1 1 3 4 6
Key financial ratios: (1)
Return on average assets (2) 3.6% 5.4% 3.1% 1.8% 0.6%
Return on average net worth (3) 13.7% 22.6% 13.7% 8.2% 2.7%
Cash and liquid investments as a percentage of next
three years’ estimated net cash requirements 112% 142% 116% 107% 109%
Debt to equity ratio (4) 1.5:1 1.8:1 2.3:1 2.6:1 2.8:1
Capital adequacy ratio (5) 54% 50% 48% 45% 49%
Total reserve against losses on loans to total disbursed loan portfolio (6) 8.3% 9.9% 14.0% 18.2% 21.9%
1. Key financial ratios are generally calculated excluding the effects of SFAS No. 133. 2. Return on average assets is defined as operating income for the fiscal year as a percentage of the average of total assets at the end of such fiscal year and the
previous fiscal year. 3. Return on average net worth is defined as operating income for the fiscal year as a percentage of the average of total net worth (excluding payments on account of
pending subscriptions) at the end of such fiscal year and the previous fiscal year. 4. Debt to equity ratio is defined as the ratio of outstanding borrowings plus outstanding guarantees to subscribed capital plus retained earnings at the end of the fiscal
year. 5. Capital adequacy ratio is defined as the ratio of capital (including paid-in capital, retained earnings, and general loan loss reserve) to risk-weighted assets, both on- and
off-balance sheet. 6. Total reserves against losses on loans to total disbursed loan portfolio is defined as reserve against losses on loans as a percentage of the total disbursed loan portfolio at
the end of the fiscal year.
volume 2 PAGE 5
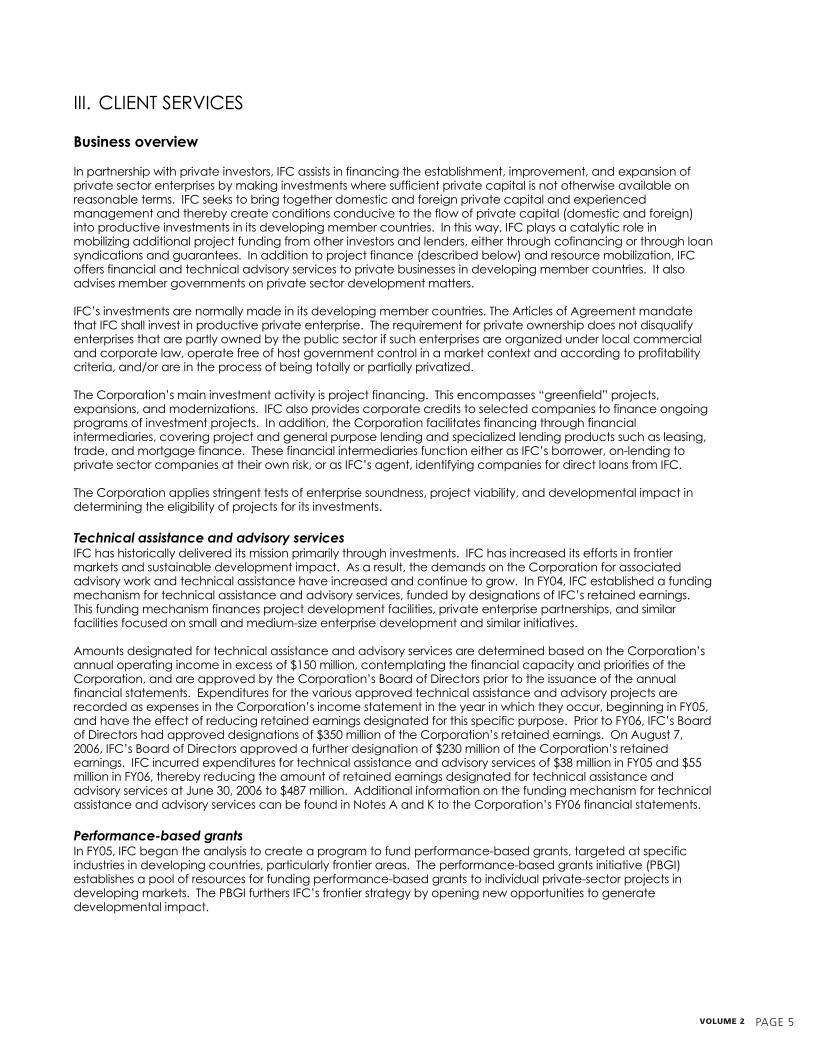
III. CLIENT SERVICES
Business overview
In partnership with private investors, IFC assists in financing the establishment, improvement, and expansion of private sector enterprises by making investments where sufficient private capital is not otherwise available on reasonable terms. IFC seeks to bring together domestic and foreign private capital and experienced management and thereby create conditions conducive to the flow of private capital (domestic and foreign) into productive investments in its developing member countries. In this way, IFC plays a catalytic role in mobilizing additional project funding from other investors and lenders, either through cofinancing or through loan syndications and guarantees. In addition to project finance (described below) and resource mobilization, IFC offers financial and technical advisory services to private businesses in developing member countries. It also advises member governments on private sector development matters.
IFC’s investments are normally made in its developing member countries. The Articles of Agreement mandate that IFC shall invest in productive private enterprise. The requirement for private ownership does not disqualify enterprises that are partly owned by the public sector if such enterprises are organized under local commercial and corporate law, operate free of host government control in a market context and according to profitability criteria, and/or are in the process of being totally or partially privatized.
The Corporation’s main investment activity is project financing. This encompasses “greenfield” projects, expansions, and modernizations. IFC also provides corporate credits to selected companies to finance ongoing programs of investment projects. In addition, the Corporation facilitates financing through financial intermediaries, covering project and general purpose lending and specialized lending products such as leasing, trade, and mortgage finance. These financial intermediaries function either as IFC’s borrower, on-lending to private sector companies at their own risk, or as IFC’s agent, identifying companies for direct loans from IFC.
The Corporation applies stringent tests of enterprise soundness, project viability, and developmental impact in determining the eligibility of projects for its investments.
Technical assistance and advisory services IFC has historically delivered its mission primarily through investments. IFC has increased its efforts in frontier markets and sustainable development impact. As a result, the demands on the Corporation for associated advisory work and technical assistance have increased and continue to grow. In FY04, IFC established a funding mechanism for technical assistance and advisory services, funded by designations of IFC’s retained earnings. This funding mechanism finances project development facilities, private enterprise partnerships, and similar facilities focused on small and medium-size enterprise development and similar initiatives.
Amounts designated for technical assistance and advisory services are determined based on the Corporation’s annual operating income in excess of $150 million, contemplating the financial capacity and priorities of the Corporation, and are approved by the Corporation’s Board of Directors prior to the issuance of the annual financial statements. Expenditures for the various approved technical assistance and advisory projects are recorded as expenses in the Corporation’s income statement in the year in which they occur, beginning in FY05, and have the effect of reducing retained earnings designated for this specific purpose. Prior to FY06, IFC’s Board of Directors had approved designations of $350 million of the Corporation’s retained earnings. On August 7, 2006, IFC’s Board of Directors approved a further designation of $230 million of the Corporation’s retained earnings. IFC incurred expenditures for technical assistance and advisory services of $38 million in FY05 and $55 million in FY06, thereby reducing the amount of retained earnings designated for technical assistance and advisory services at June 30, 2006 to $487 million. Additional information on the funding mechanism for technical assistance and advisory services can be found in Notes A and K to the Corporation’s FY06 financial statements.
Performance-based grants In FY05, IFC began the analysis to create a program to fund performance-based grants, targeted at specific industries in developing countries, particularly frontier areas. The performance-based grants initiative (PBGI) establishes a pool of resources for funding performance-based grants to individual private-sector projects in developing markets. The PBGI furthers IFC’s frontier strategy by opening new opportunities to generate developmental impact.

PAGE 6 IFc annual report 2006
The initiative had been discussed by IFC’s Board of Directors during the second half of FY05 but no decisions on the principles or modalities of the initiative were made at that time. As a result, IFC designated $250 million of retained earnings for the initiative, with further deliberations to occur in FY06 on the principles and specifics of the initiative. On March 30, 2006, IFC’s Board of Directors approved an implementation mechanism for the initiative and an initial pilot phase of $65 million. During FY06, IFC provided $35 million to the World Bank’s Global Partnership on Output Based Aid under the pilot phase; this amount has been recorded as an expense in FY06, thereby reducing the amount of retained earnings designated for performance-based grants at June 30, 2006 to $215 million.
Grants to IDAAs part of the efforts of the members of the World Bank Group to increase their cooperation, and in particular to benefit the poorest countries, IFC and IDA have discussed the possibility of providing resources for the benefit of IDA projects in countries which are members of both IFC and IDA. IFC plans to grant monies to IDA to be applied to IDA grant projects that encourage the growth of productive private enterprise in countries that are members of both IFC and IDA. On August 7, 2006, IFC’s Board of Directors approved the designation of $150 million to IDA for such purposes.
Investment process and portfolio supervision IFC’s investment process can be divided into six main stages:
Prior to May 15, 2006, the initial four stages were carried out under the responsibility of the Vice President, Investment Operations. Beginning on May 15, 2006 they were carried out under the responsibility of the Vice President, Industries. During FY06, the fifth and sixth stages were overseen by the Vice President, Portfolio and Risk Management.
The Corporation carefully supervises its projects to monitor project performance and compliance with contractual obligations and with IFC’s internal policies and procedures. IFC’s Board of Directors is informed of such matters and of recommended courses of action at regular intervals.
Investment program summary
Commitments In FY06, the Corporation entered into new commitments totaling $6.7 billion, compared with $5.4 billion for FY05. Loan and equity investment commitments pending disbursement at June 30, 2006 were $6.9 billion ($5.8 billion at June 30, 2005). Guarantees and client risk management facilities committed but not utilized at June 30, 2006, were $0.8 billion ($0.8 billion at June 30, 2005). FY06 and FY05 commitments comprised the following:
IFCFY06
ParticipantsFY06
0
1,000
2,000
3,000
4,000
5,000
6,000
7,000
IFCFY05
ParticipantsFY05
Fiscal year
U.S
.$ m
illi
ons
Guarantees & otherQuasi-equity
Loans
Equity
Identification and appraisal Board approval Document negotiation Commitment Disbursement Supervision

volume 2 PAGE 7
DisbursementsIFC disbursed $4.4 billion for its own account in FY06 ($3.5 billion in FY05). IFC’s disbursed and outstanding loan portfolio for its own account, including fair value adjustments for loans in qualifying hedging relationships and unamortized net deferred loan origination fees (disbursed loan portfolio) grew 8.5% to $10.8 billion at June 30, 2006 ($10.0 billion at June 30, 2005). IFC’s equity investment portfolio, net of impairment write-downs and including adjustments to investments accounted for under the equity method and unrealized gains on equity investments held by consolidated Variable Interest Entities (VIEs) (disbursed equity portfolio), grew 12.3% to $2.8 billion at June 30, 2006 ($2.5 billion at June 30, 2005).
Approvals In FY06, IFC approved new investments for its own account, including guarantees and client risk management facilities, totaling $7.1 billion, representing 286 projects, compared with $6.6 billion in FY05, representing 252 projects. In addition, IFC approved loan participations (B-loans) arranged to be placed with financial institutions (Participants) for loans approved by the Corporation’s Board of Directors totaling $2.2 billion in FY06, compared with $1.9 billion in FY05. FY06 and FY05 approvals comprised the following:
Approvals pending commitment for IFC’s own account at June 30, 2006, including guarantees and client risk management facilities, were $3.6 billion ($3.5 billion at June 30, 2005).
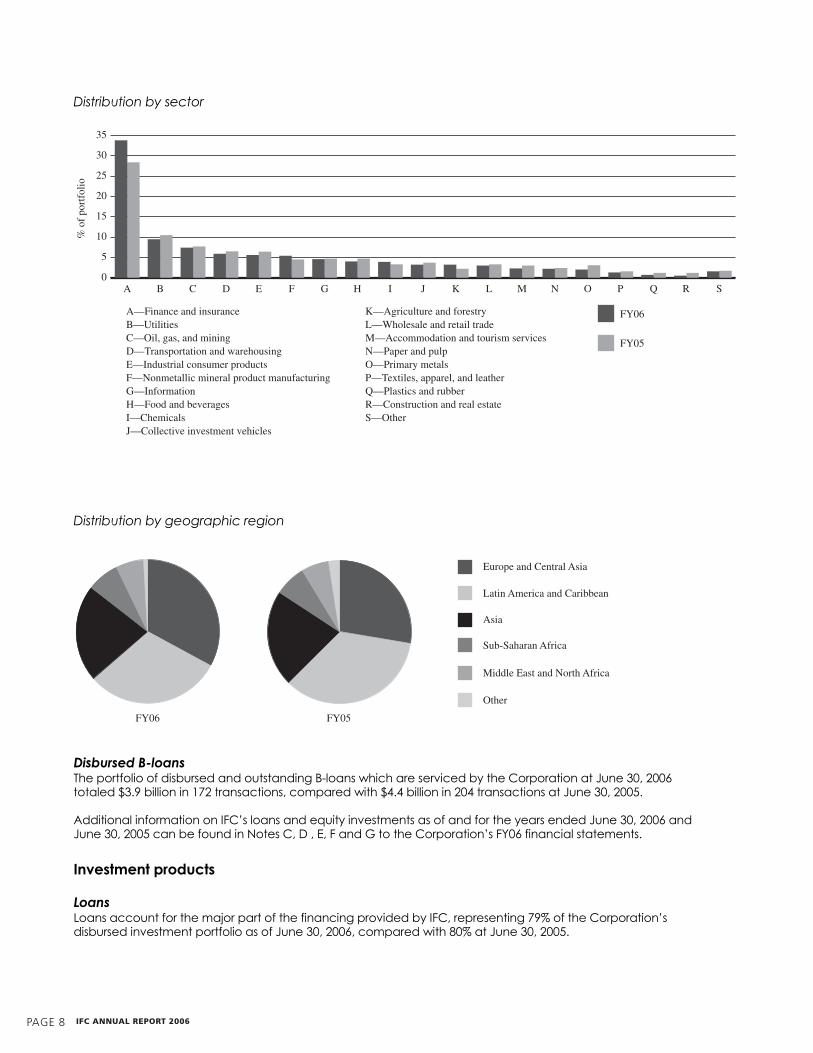
Disbursed investment portfolio The Corporation’s disbursed investment portfolio is widely diversified by sector and geographic region. The following charts show the distribution of the portfolio (before adjustments to investments accounted for under the equity method, unrealized gains on equity investments held by consolidated VIEs, unamortized net deferred loan origination fees and fair value adjustments for loans in qualifying hedge relationships) as of June 30, 2006 and June 30, 2005:
IFCFY06
ParticipantsFY06
0
1,000
2,000
3,000
4,000
5,000
6,000
7,000
IFCFY05
ParticipantsFY05
Fiscal year
U.S
.$ m
illio
ns
Guarantees & otherQuasi-equity
Loans
Equity
PAGE 8 IFc annual report 2006
Distribution by sector
Distribution by geographic region
Disbursed B-loans The portfolio of disbursed and outstanding B-loans which are serviced by the Corporation at June 30, 2006 totaled $3.9 billion in 172 transactions, compared with $4.4 billion in 204 transactions at June 30, 2005.
Additional information on IFC’s loans and equity investments as of and for the years ended June 30, 2006 and June 30, 2005 can be found in Notes C, D , E, F and G to the Corporation’s FY06 financial statements.
Investment products
Loans Loans account for the major part of the financing provided by IFC, representing 79% of the Corporation’s disbursed investment portfolio as of June 30, 2006, compared with 80% at June 30, 2005.
FY06 FY05
Sub-Saharan Africa
Latin America and Caribbean
Asia
Europe and Central Asia
Middle East and North Africa
Other
% o
f po
rtfo
lio
0
5
10
15
20
25
30
35
A F G I J K O P Q R
A—Finance and insuranceB—UtilitiesC—Oil, gas, and miningD—Transportation and warehousingE—Industrial consumer productsF—Nonmetallic mineral product manufacturingG—InformationH—Food and beveragesI—ChemicalsJ—Collective investment vehicles
K—Agriculture and forestryL—Wholesale and retail tradeM—Accommodation and tourism servicesN—Paper and pulpO—Primary metalsP—Textiles, apparel, and leatherQ—Plastics and rubberR—Construction and real estateS—Other
FY06
FY05
B C D E H L M N S

volume 2 PAGE �
Loans will generally have the following characteristics:
IFC offers local currency loan products to certain clients, provided that the Corporation is able to hedge its local currency exposure through mechanisms such as cross-currency swaps or forward contracts. Fixed-rate loans and loans in currencies other than US dollars are normally transformed, using currency and/or interest rate swaps, into US dollar variable rate loans.
On June 30, 2006, IFC’s disbursed loan portfolio was $10.8 billion ($10.0 billion at June 30, 2005). At June 30, 2006, 76% (81% at June 30, 2005) of the Corporation’s disbursed loan portfolio, excluding fair value adjustments for loans in qualifying hedging relationships and unamortized net deferred loan origination fees, was US dollar-denominated.
The currency composition of the disbursed loan portfolio, excluding fair value adjustments for loans in qualifying hedging relationships and unamortized net deferred loan origination fees, at June 30, 2006 and June 30, 2005 is shown on the accompanying diagram:
EquityEquity investments accounted for 21% of the Corporation’s disbursed investment portfolio at June 30, 2006, compared with 20% at June 30, 2005. IFC’s equity investments are typically in the form of common or preferred stock and are usually denominated in the currency of the country in which the investment is made.
Quasi-equity In addition to traditional equity investments, the Corporation provides financing through a variety of quasi-equity instruments, which constitute a growing portion of its investment portfolio. Quasi-equities include subordinated or convertible loans, asset-backed securities, mortgage-backed securities, and certain common or preferred shares with put and/or call features. Depending upon their characteristics, quasi-equities may be classified as either loans or equity investments in the Corporation’s consolidated balance sheet. At June 30, 2006, the Corporation’s disbursed quasi-equity portfolio, before fair value adjustments on loans in qualifying hedging relationships, adjustments to investments accounted for under the equity method, unrealized gains on equity investments held by consolidated VIEs, and unamortized net deferred loan origination fees, totaled $1,935 million ($1,768 million at June 30, 2005), of which $1,808 million was classified as loans ($1,638 million at June 30, 2005) and $127 million was classified as equity investments ($130 million at June 30, 2005) in the Corporation’s consolidated balance sheet.
0
2,000
4,000
6,000
8,000
10,000
12,000
U.S. Dollars
U.S
.$ m
illio
ns
Euro Other currencies Total
FY05
FY06
Term: typically amortizing with final maturities of up to 12 yearsCurrency: primarily in major convertible currencies, principally US dollar, and to a lesser extent, Euro, Swiss franc and Japanese yen Interest rate: fixed or variable Pricing: reflects such factors as market conditions and country and project risks; variable rate loans are generally tied to the 6-month LIBOR index in the relevant currency.

PAGE 10 IFc annual report 2006
Loan participations (B-loans) IFC finances only a portion, usually not more than 25%, of the cost of any project. All IFC-financed projects, therefore, require other financial partners. The principal direct means by which the Corporation mobilizes such private sector finance is through the sale of participations in its loans, known as the B-loan program. Through the B-loan program, IFC has worked primarily with commercial banks but also with nonbank financial institutions in financing projects since the early 1960s. Over 150 commercial banks and nonbank financial institutions currently participate in IFC’s B-loan program.
Whenever it participates a loan, IFC will always make a loan for its own account (an A-loan), thereby sharing the risk alongside its loan participants. IFC acts as the lender of record and is responsible for the administration of the entire loan, including the B-loan. IFC charges fees to the borrower at prevailing market rates to cover the cost of the syndication of the B-loan. Since it began its loan syndication program, IFC has placed participations totaling $26 billion.
Client risk management products IFC provides clients with access to asset and liability management tools such as currency swaps and interest rate swaps, caps and floors by acting as an intermediary between clients and market counterparties. IFC also provides risk-sharing structures and guarantees that allow its clients to transact directly with market counterparties.
Guarantees and partial credit guarantees The Corporation offers partial credit guarantees to clients covering, on a risk-sharing basis, client obligations on bonds and/or loans. The Corporation’s guarantee is available for debt instruments and trade obligations of clients and covers commercial as well as noncommercial risks. IFC will provide local currency guarantees, but when a guarantee is called, the client will generally be obligated to reimburse the Corporation in US dollar terms. Guarantee fees are consistent with IFC’s loan pricing policies. During FY06, the Corporation signed $0.6 billion of guarantees, $0.2 billion in FY05.
Advisory activities The Corporation, on its own or through a department jointly managed with the World Bank, provides three general types of advisory services to member countries and individual enterprises:
The Corporation also assists governments with developing legal frameworks for privatizing their state-owned sectors and selling individual enterprises. Fees are charged for advisory services consistent with market rates charged for comparable services. IFC recorded such fees amounting to $52 million for FY06 ($41 million for FY05 and $41 million for FY04).
Special advisory services on project structuring and financial packaging.Financial advisory services provided to member governments or to private sector clients. Policy advice to governments on capital markets development and private sector development, including privatization and foreign investment.

volume 2 PAGE 11
Technical assistance and advisory services Technical assistance and advisory services (TAAS) involve the provision of advice and capacity building support and services to entities external to the Corporation. TAAS are key to IFC’s development mission and now form a core line of business that is part of IFC’s “branding.” IFC’s TAAS are central to IFC’s mission of improving the private sector in its member countries. IFC’s TAAS operations are often the focal point of IFC’s engagement in many member countries where investment opportunities are nascent. Currently IFC implements TAAS operations in more than 100 countries. Beginning in FY05, the Corporation established a funding mechanism for TAAS, funded by designations of IFC’s retained earnings, in order to address its increased efforts in TAAS. IFC delivers TAAS through mechanisms such as Project Development Facilities and Private Enterprise Partnerships. In FY06, expenditures for TAAS totaled $55 million ($38 million for FY05 and $29 million in FY04). In FY06, such initiatives included:
The Private Enterprise Partnership, which provides focused technical assistance, with the goal of helpingbuild successful private businesses in the former Soviet Union region. The Private Enterprise Partnership for Africa, which enhances support to Small and Medium-Size Enterprises (SMEs) through project development and engaging in improving the investment climate. The Private Enterprise Partnership for the Middle East and North Africa (MENA), which provides technical assistance to support private sector development to all countries in the MENA region. The Latin America SME Facility, which promotes private sector growth through SMEs in selected countries in Latin America with the aim of fostering job creation and reducing poverty in the host countries. The Grassroots Business Initiative, which strengthens and expands support to grassroots business organizations.

PAGE 12 IFc annual report 2006
IV. TREASURY SERVICES
Liquid assets
IFC invests its liquidity in highly rated fixed and floating rate instruments issued by, or unconditionally guaranteed by, governments, government agencies and instrumentalities, multilateral organizations, and AAA-rated corporate issuers; these include mortgage- and asset-backed securities, time deposits and other unconditional obligations of banks and financial institutions.
The Corporation manages the market risk associated with these investments through a variety of hedging techniques including derivatives, principally currency and interest rate swaps and financial futures.
IFC’s liquid assets are invested in five separate portfolios.
PORTFOLIO MARKET VALUE * COMPRISING
MANAGED BY INVESTED IN BENCHMARK
P0 $1.2bn($1.0bn)
Funds awaiting disbursement or reinvestment
IFC’s Treasury Department
Short-term deposits US overnight Fed funds
P1 $5.2bn ($6.7bn)
Proceeds from market borrowings invested pending disbursement of operational loans
IFC’s Treasury Department
Principally global government bonds, asset-backed securities, and other AAA-rated corporate bonds generally swapped into 6-month US dollar LIBOR
Since January 2001, adjusted 3-month US dollar LIBID. ** Prior to January 2001, 6-month US dollar LIBOR
P2 $4.9bn ($4.1bn)
Primarily the Corporation’s paid-in capital and accumulated earnings that have not been invested in equity and quasi-equity investments or fixed-rate loans
IFC’s Treasury Department
US Treasuries and other sovereign and agency issues
Lehman Brothers Intermediate US Treasury Index ***
P3 $1.0bn ($1.1bn)
Proceeds from market borrowings
External managers appointed by IFC
Global government bonds and mortgage-backed securities
Same as for P1
P4 $0.4bn ($0.4bn)
An outsourced portion of the P2 portfolio
External managers appointed by IFC
US Treasuries and other sovereign and agency issues
Same as for P2
Total $12.7bn ($13.3bn)
* at June 30, 2006 (June 30, 2005) ** adjusted 3 month US dollar LIBID=US dollar LIBOR-12.5 basis points. The net duration of the P1 and P3 benchmarks is approximately 0.25 years. *** duration of P2 portfolio plus fixed-rate loans
The P3 portfolio is not permitted to exceed 12% of the total value of liquid assets at any time.
All portfolios are accounted for as trading portfolios.
The Corporation has a flexible approach to managing the liquid assets portfolios by making investments on an aggregate portfolio basis against its benchmark within specified risk parameters. In implementing these portfolio management strategies, the Corporation utilizes derivative instruments, including futures, and options, and takes long or short positions in securities.
All liquid assets are managed according to an investment authority approved by IFC’s Board of Directors and investment guidelines approved by IFC’s Finance and Risk Committee, a subcommittee of the Corporation’s Management Group.

volume 2 PAGE 13
Capitalization
The Corporation’s capitalization as of June 30, 2006 and June 30, 2005 is as follows:
Borrowings The major source of IFC’s borrowings is the international capital markets. Under the Articles of Agreement, the Corporation may borrow in the public markets of a member country only with approvals from that member and also the member in whose currency the borrowing is denominated. The Corporation borrowed $1.8 billion during FY06 ($2.0 billion in FY05 and $3.0 billion in FY04). In addition, IFC’s Board of Directors has authorized the repurchase and redemption of and tender for debt obligations issued by the Corporation. During FY06, the Corporation repurchased and retired $209 million of outstanding debt ($133 million in FY05).
IFC diversifies its borrowings by currency, country, source, and maturity to provide flexibility and cost-effectiveness. Outstanding market borrowings have remaining maturities ranging from less than one year to almost 30 years, with a weighted average remaining maturity of 10.7 years at June 30, 2006 (11.6 years at June 30, 2005).
Market borrowings are generally swapped into floating-rate obligations denominated in US dollars. As of June 30, 2006 the Corporation had gross payables from borrowing-related currency swaps of $8.5 billion ($9.4 billion at June 30, 2005) and from borrowing-related interest rate swaps in the notional principal amount of $6.7 billion ($6.7 billion at June 30, 2005). After the effect of these derivative instruments is taken into consideration, substantially all of the Corporation’s market borrowings at June 30, 2006, and all of the Corporation’s market borrowings at June 30, 2005, were US dollar-denominated.
The weighted average cost of market borrowings after currency and interest rate swap transactions was 4.9% at June 30, 2006 (3.3% at June 30, 2005).
Capital and retained earnings As of June 30, 2006, IFC’s net worth (presented as Total Capital in the Corporation’s consolidated balance sheet) amounted to $11.1 billion, up from the June 30, 2005 level of $9.8 billion. At June 30, 2006, net worth comprised $2.4 billion of paid-in capital, unchanged from June 30, 2005, and $8.7 billion of retained earnings ($7.4 billion at June 30, 2005).
As of June 30, 2006 and 2005, IFC’s authorized capital was $2.45 billion, of which $2.36 billion was subscribed at June 30, 2006, unchanged from June 30, 2005. Over 99% of this was paid in ($2.36 billion at June 30, 2006, and June 30, 2005). The Corporation has agreed to defer the payment dates for certain member countries. Pursuant to these arrangements, $1 million of subscribed shares remained unpaid at June 30, 2006, unchanged from June 30, 2005.
At June 30, 2006, retained earnings comprised $7.8 billion of undesignated retained earnings ($6.9 billion at June 30, 2005), $0.5 billion of retained earnings for TAAS ($0.3 billion at June 30, 2005), $0.2 billion of retained earnings designated for PBG ($0.3 billion at June 30, 2005), and $0.2 billion of retained earnings designated for grants to IDA ($0 at June 30, 2005).
FY06 FY05
Retained Earnings
Borrowings from the World Bank
Paid-in capital
Borrowings from market sources
Other

PAGE 14 IFc annual report 2006
V. ENTERPRISE RISK MANAGEMENT
In executing its sustainable private sector development business, IFC assumes various kinds of risks. The Corporation’s management has defined a comprehensive enterprise risk management framework, within which it recognizes four main risk groupings: strategic risk, credit risk, financial risk, and operational risk.
Operational Risk:People, Systems & Processes
CreditRisk:Client,
Country, &Counterparty
FinancialRisk:
Market,Funding, &Liquidity
Strategic Risk:IFC Development Mission,
Environment & Social, Reputation
IFC’sEnterprise
RiskManagement
Operational Risk:People, Systems, & Processes
Active management of these risks is a key determinant of the Corporation’s success and its ability to maintain a stable capital and earnings base, and is an essential part of its operations. As part of its enterprise risk management framework, the Corporation has adopted several key financial and exposure policies and a number of prudential policies.
FY06 enterprise risk highlights The recently created Project Risk Management function (organized as part of IFC’s Financial Operations Department) has developed and implemented detailed operational risk management controls and procedures and has implemented these across our most important industry groups. These updated procedures will be implemented in FY07 for all new projects. Also in FY07, this group will establish appropriate staff in the regional centers, thus significantly improving the management of investment project administration and compliance monitoring within the regions.
The Corporation initiated policy reviews in two areas: first, of its financial policies, to confirm that these are in line with new business imperatives and best practices in risk management; secondly, of its Safeguard Policies, Policy on Disclosure of Information, and Environmental, Health & Safety (EHS) Guidelines, involving a comprehensive update of its policies and guidelines, subsequent to stakeholder consultation and expert guidance.
The Corporation is committed to ensuring that it has timely, effective and efficient risk management controls at each step of its investment process, and in FY06, made the commitment to increase risk management staffing and to place key credit risk managers in the regional hubs to improve the timeliness and quality of the risk decision process. The sophistication of the risk process at IFC necessitates reviews of economic and social risks, corporate governance standards for clients, and reputation risk reviews in addition to the more traditional credit quality and operational concerns. The Corporation believes that this move to put key decision risk makers in the regions will significantly improve the quality of its enterprise risk management, and will implement this strategy in the first quarter of FY07.
Strategic risk
IFC defines strategic risk as the potential reputational, financial and other consequences of a failure to achieve its strategic mission and, in particular, its sustainable development mandate.
The overall management of strategic risk is effected through the definition and implementation of an annual strategy for meeting the Corporation’s mission and guidelines for its investment operations and advisory services. The strategy is developed with Senior Management by the Operational Strategy Group, and is approved by the Board of Directors. The Independent Evaluation Group (formerly the Operations Evaluation Group) conducts ex post evaluations of the implementation of the Corporation’s investment strategy on an ongoing basis.
volume 2 PAGE 15
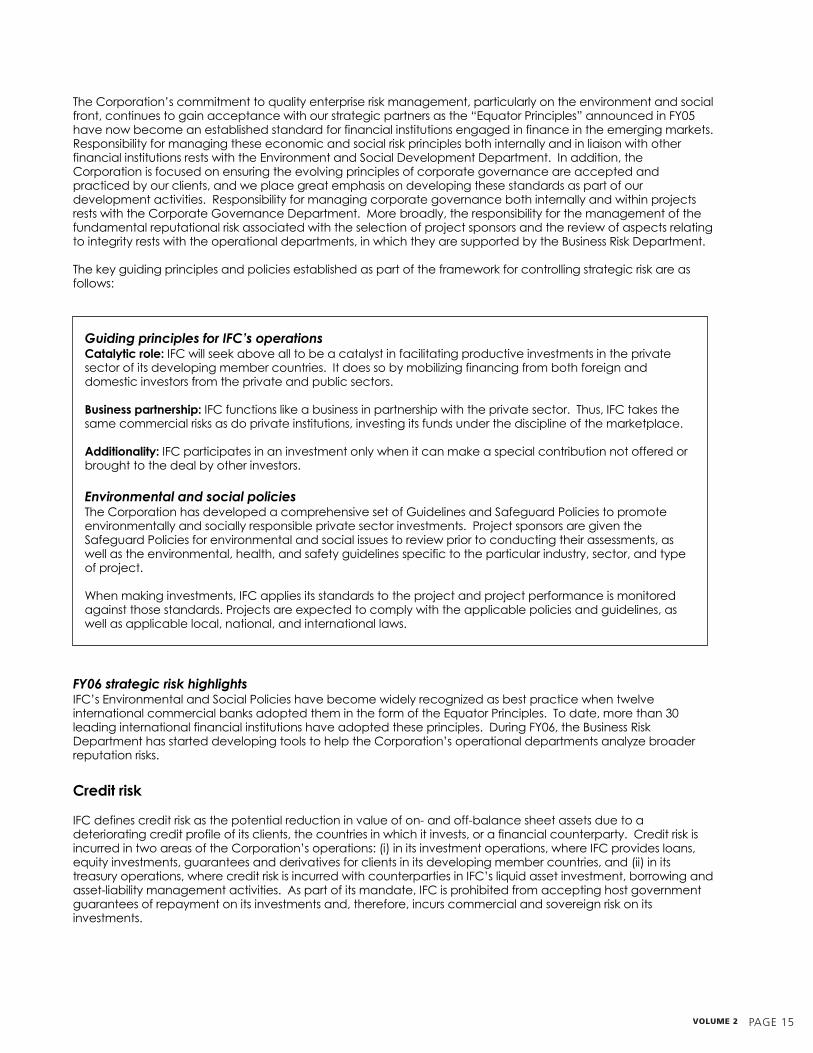
The Corporation’s commitment to quality enterprise risk management, particularly on the environment and social front, continues to gain acceptance with our strategic partners as the “Equator Principles” announced in FY05 have now become an established standard for financial institutions engaged in finance in the emerging markets. Responsibility for managing these economic and social risk principles both internally and in liaison with other financial institutions rests with the Environment and Social Development Department. In addition, the Corporation is focused on ensuring the evolving principles of corporate governance are accepted and practiced by our clients, and we place great emphasis on developing these standards as part of our development activities. Responsibility for managing corporate governance both internally and within projects rests with the Corporate Governance Department. More broadly, the responsibility for the management of the fundamental reputational risk associated with the selection of project sponsors and the review of aspects relating to integrity rests with the operational departments, in which they are supported by the Business Risk Department.
The key guiding principles and policies established as part of the framework for controlling strategic risk are as follows:
FY06 strategic risk highlights IFC’s Environmental and Social Policies have become widely recognized as best practice when twelve international commercial banks adopted them in the form of the Equator Principles. To date, more than 30 leading international financial institutions have adopted these principles. During FY06, the Business Risk Department has started developing tools to help the Corporation’s operational departments analyze broader reputation risks.
Credit risk
IFC defines credit risk as the potential reduction in value of on- and off-balance sheet assets due to a deteriorating credit profile of its clients, the countries in which it invests, or a financial counterparty. Credit risk is incurred in two areas of the Corporation’s operations: (i) in its investment operations, where IFC provides loans, equity investments, guarantees and derivatives for clients in its developing member countries, and (ii) in its treasury operations, where credit risk is incurred with counterparties in IFC’s liquid asset investment, borrowing and asset-liability management activities. As part of its mandate, IFC is prohibited from accepting host government guarantees of repayment on its investments and, therefore, incurs commercial and sovereign risk on its investments.
Guiding principles for IFC’s operations Catalytic role: IFC will seek above all to be a catalyst in facilitating productive investments in the private sector of its developing member countries. It does so by mobilizing financing from both foreign and domestic investors from the private and public sectors.
Business partnership: IFC functions like a business in partnership with the private sector. Thus, IFC takes the same commercial risks as do private institutions, investing its funds under the discipline of the marketplace.
Additionality: IFC participates in an investment only when it can make a special contribution not offered or brought to the deal by other investors.
Environmental and social policies The Corporation has developed a comprehensive set of Guidelines and Safeguard Policies to promote environmentally and socially responsible private sector investments. Project sponsors are given the Safeguard Policies for environmental and social issues to review prior to conducting their assessments, as well as the environmental, health, and safety guidelines specific to the particular industry, sector, and type of project.
When making investments, IFC applies its standards to the project and project performance is monitored against those standards. Projects are expected to comply with the applicable policies and guidelines, as well as applicable local, national, and international laws.

PAGE 16 IFc annual report 2006
The Corporation’s Risk Management and Financial Policy Department has oversight responsibility for overall credit risk management and, in addition, monitors and controls credit risk arising in IFC’s treasury activities. With respect to IFC’s credit risk exposures to clients in developing countries, the Credit Review Department plays a key role. At origination of new investments, the Credit Review Department analyzes information obtained from the investment departments and provides an independent review of the credit risk of the transaction. After commitment, the quality of IFC’s loan and equity investment portfolio is monitored according to supervision principles and procedures defined in the Operational Policies and Procedures. Responsibility for the day-to-day monitoring and management of credit risk in the portfolio rests with the portfolio management units of individual investment departments. Their assessments are subject to quarterly review, on a sample basis, by the Loss Provisioning Division of the Controller’s and Budgeting Department and by the Credit Review Department.
The Corporation’s investment portfolio is subject to a number of operational and prudential limits, including limitations on single project/client exposure, single country exposure, and segment concentration. Similarly, credit policies and guidelines have been formulated covering treasury operations; these are subject to annual revision by the Risk Management and Financial Policy Department, and approval by the Finance and Risk Committee. Specifically, IFC has adopted the following key exposure policies:
Investment operations+
1. IFC does not normally finance for its own account more than 25% of a project’s cost. 2. An equity investment in a company does not normally represent more than 35% of the company’s total
share capital, provided further that IFC is not the single largest shareholder. Until IFC resumes presentation of its financial statements in accordance with IFRS, IFC’s equity investment in a company will not normally represent more than 20% of the company’s total share capital.
3. Investment in a single obligor may not exceed 4% of IFC’s net worth plus general reserves on loans. 4. Equity plus quasi-equity investments in a single obligor may not exceed 3% of the Corporation’s net
worth plus general reserves on loans, and straight equity investments may not exceed 1.5%. Portfolio Management 1. Review trigger levels of between 2.5% and 10% of net worth plus general reserves on loans are set for
each country’s outstanding portfolio, net of specific reserves on loans, based on the size of its economy and its risk rating.
2. IFC lender of record disbursed exposure in a country may not exceed 10% for Heavily Indebted Poor Countries and 5% for all other countries. Exceptions for countries with low levels of external debt may be set by the Finance and Risk Committee. Lower trigger levels are set for certain countries.
3. The Corporation’s total exposure to a single risk sector may not exceed 12% of net worth plus general reserves on loans. Lower review trigger levels are set for single sectors, and individually for the finance and insurance sector, based on IFC’s net worth plus general reserves on loans and the country exposure level.
4. IFC’s held guarantees that are subrogated in local currency are limited to $200 million. Treasury operations 1. Counterparties are subject to conservative eligibility criteria, currently restricted to banks and financial
institutions with a minimum credit rating of A by leading international credit rating agencies. 2. Exposures to individual counterparties are subject to diversification caps. For derivatives, exposure is
measured in terms of “worst case” potential exposure based on simulations of market variables. Institution-specific limits are updated monthly based on changes in counterparty size or credit status.
3. To limit exposure, IFC signs collateral agreements with counterparties that require the posting of collateral when net exposure exceeds certain predetermined thresholds, which decrease as a counterparty’s credit rating deteriorates.
4. Because counterparties can be downgraded during the life of a transaction, the agreements provide an option for IFC to terminate all swaps if the counterparty is downgraded below investment grade or if other early termination events occur that are standard in the market.
5. Limits are also imposed on the volume of over-the-counter derivative transactions with individual counterparties.
6. For exchange-traded instruments, IFC limits credit risk by restricting transactions to a list of authorized exchanges, contracts and dealers, and by placing limits on the Corporation’s open interest rate position in each contract.
volume 2 PAGE 17
FY06 credit risk highlights IFC does not recognize income on loans where collectibility is in doubt or payments of interest or principal are past due more than 60 days unless management anticipates that collection of interest is expected in the near future.
The amount of nonaccruing loans as a percentage of the disbursed loan portfolio, excluding fair value adjustments for loans in qualifying hedging relationships and unamortized net deferred loan origination fees, a key indicator of portfolio performance, decreased to 4.1% at June 30, 2006 (6.4% at June 30, 2005). The principal amount outstanding on nonaccrual loans totaled $447 million at June 30, 2006, a decrease of $187 million (29%) from the June 30, 2005 level of $634 million.
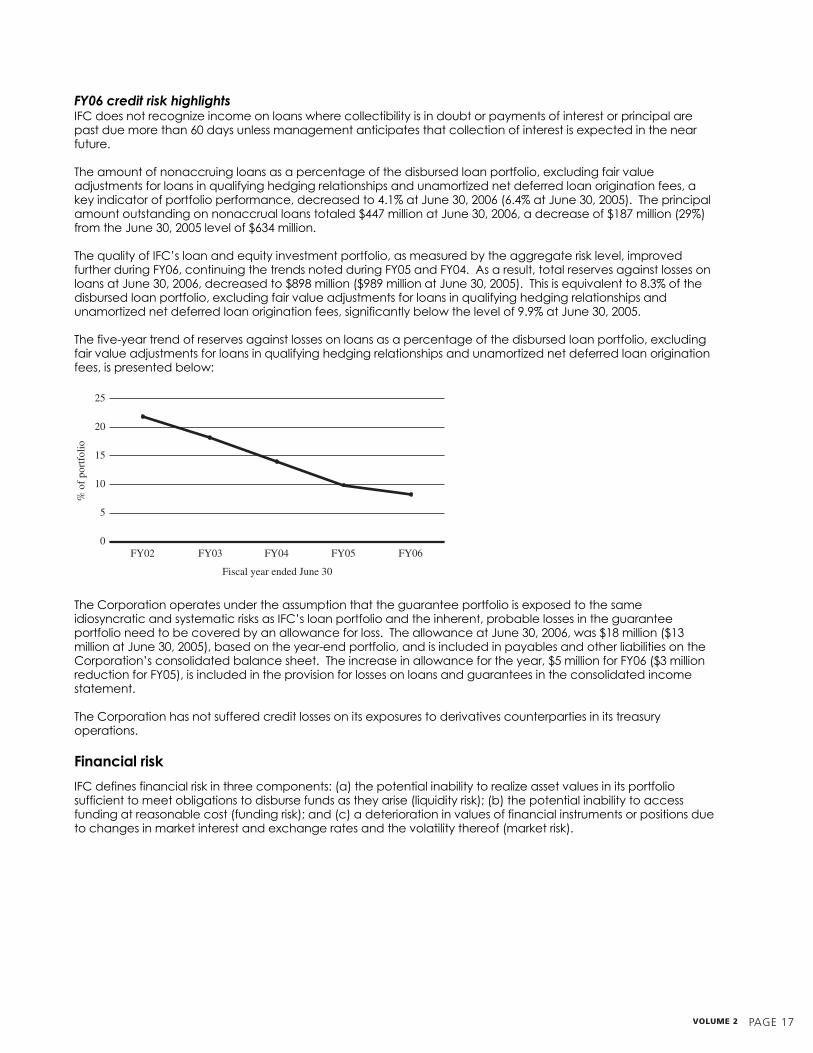
The quality of IFC’s loan and equity investment portfolio, as measured by the aggregate risk level, improved further during FY06, continuing the trends noted during FY05 and FY04. As a result, total reserves against losses on loans at June 30, 2006, decreased to $898 million ($989 million at June 30, 2005). This is equivalent to 8.3% of the disbursed loan portfolio, excluding fair value adjustments for loans in qualifying hedging relationships and unamortized net deferred loan origination fees, significantly below the level of 9.9% at June 30, 2005.
The five-year trend of reserves against losses on loans as a percentage of the disbursed loan portfolio, excluding fair value adjustments for loans in qualifying hedging relationships and unamortized net deferred loan origination fees, is presented below:
The Corporation operates under the assumption that the guarantee portfolio is exposed to the same idiosyncratic and systematic risks as IFC’s loan portfolio and the inherent, probable losses in the guarantee portfolio need to be covered by an allowance for loss. The allowance at June 30, 2006, was $18 million ($13 million at June 30, 2005), based on the year-end portfolio, and is included in payables and other liabilities on the Corporation’s consolidated balance sheet. The increase in allowance for the year, $5 million for FY06 ($3 million reduction for FY05), is included in the provision for losses on loans and guarantees in the consolidated income statement.
The Corporation has not suffered credit losses on its exposures to derivatives counterparties in its treasury operations.
Financial risk
IFC defines financial risk in three components: (a) the potential inability to realize asset values in its portfolio sufficient to meet obligations to disburse funds as they arise (liquidity risk); (b) the potential inability to access funding at reasonable cost (funding risk); and (c) a deterioration in values of financial instruments or positions due to changes in market interest and exchange rates and the volatility thereof (market risk).
FY02 FY03 FY04 FY05 FY060
5
10
15
20
25
Fiscal year ended June 30
% o
f po
rtfo
lio

PAGE 18 IFc annual report 2006
Key financial policies IFC currently operates under a number of key financial policies as detailed below, which have been approved by its Board of Directors:
Liquidity risk
Within the key financial policies described above, in practice the Corporation maintains, as a prudential measure, an operating liquidity target of not less than 70% of three years’ net cash requirements, including projected disbursement and debt service requirements.
The primary instruments for maintaining sufficient liquidity are the Corporation’s liquid asset portfolios. As noted above, IFC distinguishes five such portfolios:
FY06 liquidity risk highlights At June 30, 2006, the Corporation’s liquidity level stood at $12.7 billion, or 112% of its projected net cash requirements for three years ($13.3 billion, and 142% at June 30, 2005).
Funding risk
The Corporation’s primary objective with respect to managing funding risk is, through the adoption of the key financial policies described above, to maintain its AAA credit rating and, thereby, maintain access to funding as needed at the lowest possible cost. Access to funding is maximized, and cost is minimized, by issuing debt securities in various capital markets in a variety of currencies, sometimes using complex structures. These structures include borrowings payable in multiple currencies, or borrowings with principal and/or interest determined by reference to a specified index such as a stock market index, a reference interest rate, a commodity index, or one or more foreign exchange rates.
1. Disbursed equity plus quasi-equity investments (net of impairment write-downs) may not exceed 100% of net worth and disbursed equity (net of write-downs) may not exceed 50% of net worth.
2. Minimum liquidity (liquid assets plus undrawn borrowing commitments from the World Bank) must be sufficient at all times to cover at least 65% of IFC’s estimated net cash requirements for the next three years.
3. The currency, rate basis, and maturity of loan assets must be closely matched to borrowings; trigger levels at which foreign exchange and interest rate exposures are hedged are defined.
4. Capital (paid-in capital plus retained earnings plus general loan loss reserves) must equal at least 30% of risk-weighted assets.
In addition, under IFC’s Articles of Agreement, as long as IFC has outstanding borrowings from the World Bank, IFC’s leverage, as measured by the ratio of IFC’s debt (borrowings plus outstanding guarantees) to IFC’s equity (subscribed capital plus retained earnings), may not exceed 4.0 to 1.
P0, which is generally invested in short-dated deposits, money market funds, and tri-party repos, reflecting its use for short-term funding requirements. P1, which is generally invested in: (a) foreign sovereign, sovereign-guaranteed and supranational fixed income instruments (rated AA- or better); (b) US Treasury or agency instruments; (c) asset-backed securities rated AAA by at least two rating agencies and/or other AAA rated notes issued by Corporations; (d) interest rate futures and swaps to manage currency risk in the portfolio, as well as its duration relative to benchmark; and (e) cash deposits. P2, which is generally invested in US Treasuries and other sovereign and agency issues. P3, which comprises a global fixed income portfolio and a mortgage-backed securities portfolio (managed by external managers). P4, which is an outsourced portion of the P2 portfolio (managed by external managers).

volume 2 PAGE 1�
FY06 funding risk highlights During FY06, the Corporation raised $1.8 billion ($2.0 billion in FY05) of funding at sub-LIBOR rates.
Market risk
The Corporation’s exposure to market risk is minimized by adopting the matched funding policy noted above and by using a variety of derivative instruments to convert assets and liabilities into 6-month floating rate US dollar assets and liabilities.
Investment operations Implementation of the matched funding policy is a two-step process: funds are earmarked at Board approval stage and matched, with respect to interest rate and currency, at disbursement. Interest rate and currency exchange risk associated with fixed rate and/or non-US dollar lending is hedged via currency and interest rate swaps that convert cash flows into variable rate US dollar flows.
Exposures to market risk resulting from derivative transactions with clients, which are intended to facilitate clients’ risk management, are minimized by entering into offsetting positions with highly rated market counterparties.
Liquid asset portfolios Consistent with the matched funding policy, the P0, P1 and P3 portfolios are strictly managed to variable rate US dollar benchmarks, on a portfolio basis. To this end, a variety of derivative instruments are used, including short-term, over-the-counter foreign exchange forwards (covered forwards), interest rate and currency swaps, and exchange-traded interest rate futures and options. The Corporation also takes both long and short positions in securities in the management of these portfolios to their respective benchmarks.
The primary source of market risk in the liquid asset portfolios is the P2 and P4 portfolios, which, in contrast, are managed to a three-year duration US dollar benchmark, with additional flexibility to deviate from the benchmark. P2 represents the portion of IFC’s capital not disbursed as equity investments, and the benchmark reflects the chosen risk profile for this uninvested capital. P4 represents an outsourced portion of the P2 portfolio.
Borrowing activities Market risk associated with fixed rate obligations and structured instruments entered into as part of the Corporation’s funding program is generally mitigated by using derivative instruments to convert them into variable rate US dollar obligations, consistent with the matched-funding policy.
Asset-liability management While IFC’s matched-funding policy provides a significant level of protection against currency and interest rate risk, the Corporation can be exposed to residual market risk in its overall asset and liability management. This residual market risk is monitored by the Asset-Liability Management group within the Treasury Department.
Residual currency risk arises from events such as changes in the level of non-US dollar loan loss reserves. This risk is managed by monitoring the aggregate position in each lending currency and hedging the exposure when the net asset or liability position exceeds $5 million equivalent, through spot sales or purchases.
Residual interest rate risk may arise from two sources:
This residual risk is managed by: first, synchronizing interest rate reset dates on assets and liabilities at a portfolio level; and second, measuring the sensitivity of the present value of assets and liabilities in each currency to each basis point change in interest rates, with an action trigger of $50,000 on this measure.
Assets that are fully match-funded at inception, which can become mismatched over time due to write-downs, prepayments, or rescheduling; and Differing interest rate reset dates on assets and liabilities.
Key financial policies IFC currently operates under a number of key financial policies as detailed below, which have been approved by its Board of Directors:
Liquidity risk
Within the key financial policies described above, in practice the Corporation maintains, as a prudential measure, an operating liquidity target of not less than 70% of three years’ net cash requirements, including projected disbursement and debt service requirements.
The primary instruments for maintaining sufficient liquidity are the Corporation’s liquid asset portfolios. As noted above, IFC distinguishes five such portfolios:
FY06 liquidity risk highlights At June 30, 2006, the Corporation’s liquidity level stood at $12.7 billion, or 112% of its projected net cash requirements for three years ($13.3 billion, and 142% at June 30, 2005).
Funding risk
The Corporation’s primary objective with respect to managing funding risk is, through the adoption of the key financial policies described above, to maintain its AAA credit rating and, thereby, maintain access to funding as needed at the lowest possible cost. Access to funding is maximized, and cost is minimized, by issuing debt securities in various capital markets in a variety of currencies, sometimes using complex structures. These structures include borrowings payable in multiple currencies, or borrowings with principal and/or interest determined by reference to a specified index such as a stock market index, a reference interest rate, a commodity index, or one or more foreign exchange rates.
1. Disbursed equity plus quasi-equity investments (net of impairment write-downs) may not exceed 100% of net worth and disbursed equity (net of write-downs) may not exceed 50% of net worth.
2. Minimum liquidity (liquid assets plus undrawn borrowing commitments from the World Bank) must be sufficient at all times to cover at least 65% of IFC’s estimated net cash requirements for the next three years.
3. The currency, rate basis, and maturity of loan assets must be closely matched to borrowings; trigger levels at which foreign exchange and interest rate exposures are hedged are defined.
4. Capital (paid-in capital plus retained earnings plus general loan loss reserves) must equal at least 30% of risk-weighted assets.
In addition, under IFC’s Articles of Agreement, as long as IFC has outstanding borrowings from the World Bank, IFC’s leverage, as measured by the ratio of IFC’s debt (borrowings plus outstanding guarantees) to IFC’s equity (subscribed capital plus retained earnings), may not exceed 4.0 to 1.
P0, which is generally invested in short-dated deposits, money market funds, and tri-party repos, reflecting its use for short-term funding requirements. P1, which is generally invested in: (a) foreign sovereign, sovereign-guaranteed and supranational fixed income instruments (rated AA- or better); (b) US Treasury or agency instruments; (c) asset-backed securities rated AAA by at least two rating agencies and/or other AAA rated notes issued by Corporations; (d) interest rate futures and swaps to manage currency risk in the portfolio, as well as its duration relative to benchmark; and (e) cash deposits. P2, which is generally invested in US Treasuries and other sovereign and agency issues. P3, which comprises a global fixed income portfolio and a mortgage-backed securities portfolio (managed by external managers). P4, which is an outsourced portion of the P2 portfolio (managed by external managers).

PAGE 20 IFc annual report 2006
FY06 market risk highlights Total liquid asset returns (comprising interest, realized and unrealized gains and losses, and translation adjustments) were $444 million in FY06 ($358 million in FY05 and $177 million in FY04), of which $378 million was attributable to the P0, P1 and P3 portfolios ($212 million in FY05 and $156 million in FY04), and $66 million was attributable to the P2 and P4 portfolios ($146 million in FY05 and $21 million in FY04). Currency translation gains on non-trading activities for FY06 were $6 million ($7 million loss in FY05 and $4 million gain in FY04).
Operational risk
IFC defines operational risk as the potential for loss resulting from events involving people, systems and processes. These include both internal and external events, whether caused by a lack of controls, documentation, or contingency planning, or by breakdowns in information systems, communications, physical safeguards, business continuity, supervision, transaction processing, or in the execution of legal, fiduciary, and agency responsibilities. As such, operational risk covers the risks emanating from the manner in which an entity is operated as opposed to the way it is financed.
Consistent with the Basel II Capital Adequacy guidelines, IFC is developing a matrix framework to analyze operational risk by identifying, for each area (people, systems and processes), which risks IFC will: (i) manage internally, as part of its ongoing business; (ii) alleviate through contingency planning; or (iii) insure externally, whether by subcontracting, outsourcing or hedging, including insurance.
Responsibility for the development of the framework for managing and monitoring operational risk now rests with the Business Risk Department, and for contingency planning for recovery from emergencies with the Controller’s Department. In respect of insurable operational risk, IFC’s Insurance Services Group performs insurance reviews to identify the risks and assess the adequacy of existing insurance policies and limits.
IFC seeks to mitigate the risks it manages internally by maintaining a comprehensive system of internal controls that is designed not only to identify the parameters of various risks but also to monitor and control those areas of particular concern. Key components of this effort are:
Key components of operational risk management The Corporation has adopted the COSO1 control framework and a control self-assessment methodology to evaluate the effectiveness of its internal controls in people, systems and processes, and it has an ongoing program in place to cover all significant business operations. In addition, the COBIT2
methodology is used to supplement the COSO review of the information technology function. The program includes compliance testing of key internal controls assuring the reliability of external financial reporting and has been applied to Donor Funded Operations as well. The Internal Audit Department of the World Bank Group performs ongoing independent review of the effectiveness of IFC’s internal controls in selected key areas and functions. To promote data integrity, the Corporation has formulated a Data Management Policy. The policy is enforced by the Information Quality Group within the Controller’s Department and through a network of Departmental Data Stewards. The Corporation has a New Products/Initiatives Assessment Group, with representation from key business and support functions, to ensure that processes and controls are in place to manage the risks in new products and initiatives before they are executed.
1. COSO refers to the Internal Control - Integrated Framework formulated by the Committee of Sponsoring Organizations of the Treadway Commission, which was convened by the US Congress in response to the well-publicized irregularities that occurred in the financial sector in the United States during the late 1980s. 2 . COBIT refers to Control Objectives for Information and Related Technology, first released in 1996, updated to the 3rd edition released in July 2000, sponsored by the Information Systems Audit and Control Association (ISACA).

volume 2 PAGE 21
FY06 operational risk highlights IFC continues to focus on its preparedness to react to an emergency situation that disrupts its normal operations. During FY06, the Corporation has:
The Corporation is continuing a multiyear effort to analyze and develop enhanced methodologies for measuring, monitoring and managing operational risk in its key activities. During FY06, IFC has:
In FY06, IFC continued with its voluntary practice of conducting an annual assessment of its internal control over external financial reporting based on the criteria for effective internal control over external financial reporting described in COSO. Based upon this assessment, Management believes that IFC maintained effective internal control over external financial reporting presented in conformity with US GAAP, as of June 30, 2006. In light of recent developments concerning changes in auditing standards by which the Corporation’s external auditors have historically provided an attestation to Management’s assertion, Management did not seek an attestation report from the Corporation’s external auditors for FY06.
Management has carried out an evaluation of internal controls over external financial reporting for the purposes of determining if there were any changes made in internal controls during the year ended June 30, 2006, that had materially affected, or would be reasonably likely to materially affect, IFC’s internal control over external financial reporting. As of June 30, 2006, no such significant changes occurred.
Internal controls and procedures are those processes which are designed to ensure that information required to be disclosed is accumulated and communicated to management, as appropriate to allow timely decisions regarding required disclosure by IFC. Management believes that these controls and procedures were effective as of June 30, 2006.
Added applications and capabilities to back-up facilities available for its key strategic financial and support systems and continued extensive testing thereof. As part of the IFC’s avian flu contingency plans, all departments reinforced and extended home computing arrangements for essential staff. Extended the Emergency Management Team (EMT) concept to IBRD. The combined World Bank Group EMT conducted simulation exercises to test the adequacy of the avian flu contingency plan, and reinforced the roles and responsibilities of the EMT. The Corporation plans to extend the EMT structure to all regions during FY07.
Continued a process-mapping exercise to identify potential areas of exposure to operational risk in its investment and advisory services processes and to provide a basis for quantifying potential risks; and Developed a beginning framework for IFC’s strategic and operational risk functions within the newly established Business Risk Department; and Mapped out IFC’s current risk management functions in order to further align these functions with the more regionalized business operations of IFC.
PAGE 22 IFc annual report 2006
VI. CRITICAL ACCOUNTING POLICIES
The Notes to the Corporation’s FY06 financial statements contain a summary of the Corporation’s significant accounting policies, including a discussion of recently issued accounting pronouncements. Certain of these policies are considered to be “critical” to the portrayal of the Corporation’s financial condition, since they require management to make difficult, complex or subjective judgments, some of which may relate to matters that are inherently uncertain. These policies include: (i) determining the level of the allowance for losses in the loan portfolio; (ii) determining the level of impairment of equity investments; and (iii) determining the valuation of certain financial instruments with no quoted market prices. Additional information about these policies can be found in Notes A, C, O and P to the FY06 financial statements.
Reserve against losses on loans
The Corporation considers a loan as impaired when, based on current information and events, it is probable that the Corporation will be unable to collect all amounts due according to the loan’s contractual terms. The reserve against losses for impaired loans reflects management’s judgment of the present value of expected future cash flows discounted at the loan’s effective interest rate. The reserve against losses for loans includes an estimate of probable losses on loans inherent in the portfolio but not specifically identifiable. The reserve is established through periodic charges to income in the form of a provision for losses on loans. Loans written-off, as well as any subsequent recoveries, are recorded through the reserve.
The assessment of the adequacy of total reserves against losses for loans is highly dependent on management’s judgment about factors such as geographical concentration, industry, regional and macroeconomic conditions, and historical trends. Due to the inherent limitation of any particular estimation technique, management utilizes three different and independent methods to provide estimates for the total loan loss reserve balance: (1) a simulation model, (2) country risk ratings and probability of crisis associated with those risks, and (3) a model of the Corporation’s long-term historical loan portfolio experience. Changes in these estimates could have a direct impact on the provision and could result in a change in the reserve balance.
The reserve against losses on loans is separately reported in the consolidated balance sheet as a reduction of the Corporation’s total loans. Increases or decreases in the reserve level are reported in the income statement as provision for losses or release of provision for losses on loans, and guarantees. The reserve against losses on loans relates only to the Client Services segment of the Corporation (see Note R to the FY06 financial statements for further discussion of the Corporation’s business segments).
Equity impairment
The Corporation assesses all equity investments for impairment each quarter. When impairment is identified and is deemed to be other than temporary, the equity investment is written down to its impaired value, which becomes the new cost basis in the equity investment. The Corporation has elected to assume that all impairments shall be deemed to be other than temporary. Impairment losses are not reversed for subsequent recoveries in value of the equity investment until it is sold.
Prior to March 31, 2005, the Corporation had carried reserves against losses on the equity investment portfolio. During the year ended June 30, 2005, the Corporation changed its process of estimating impairment on equity investments to adopt an impairment methodology based largely on fair value estimates. As a result, the Corporation recorded a change in carrying value of the equity investment portfolio. In this regard, the Corporation determined that all impairments and changes in carrying value were deemed to be other than temporary. This change in carrying value of the equity portfolio was reflected in net income from equity investments in the FY05 consolidated income statement and in equity investments in the consolidated balance sheet.

volume 2 PAGE 23
Valuation of financial instruments with no quoted market prices
As part of its compliance with SFAS No. 133, the Corporation reports at fair value all of its derivative instruments and certain borrowings that the Corporation has designated as components of fair value hedges. In addition, certain features in various loan agreements, equity investment agreements, and borrowing contracts contain embedded derivatives that, for accounting purposes, are separately accounted as either derivative assets or liabilities, including puts, caps, floors, and forwards. Few of these instruments have a ready market valuation. Therefore, the fair values of the financial instruments with no quoted market prices are estimated using sophisticated pricing models of the net present value of estimated future cash flows. Management makes numerous assumptions in developing the pricing models, including the appropriate discount rates, interest rates, and related volatility and expected movement in foreign currency exchange rates. Changes in assumptions could have a significant impact on the amounts reported as assets and liabilities and the related gains and losses reported in the income statement. The fair value computations affect both the Client Services and Treasury segments of the Corporation (see Note R to the FY06 financial statements for further discussion of the Corporation’s business segments).
Additional information can be found in Notes A, O and P to the FY06 financial statements.

PAGE 24 IFc annual report 2006
VII. RESULTS OF OPERATIONS
Overview
The main elements of IFC’s net income, and influences on the level and variability of operating and net income from year to year, are:
ELEMENTS SIGNIFICANT INFLUENCES Operating income:
Spread on interest earning assets Nonaccruals and recoveries of interest on loans formerly in nonaccrual status and income from participation notes
Liquid asset income Realized and unrealized gains and losses on the liquid asset portfolios
Income from the equity investment portfolio Performance of the equity portfolio (principally dividends, capital gains)
Provisions for losses on loans and guarantees Level of provisions for losses on loans and guarantees
Equity impairment write-downs Amount of impairment write-downs
Noninterest income and expense Level of technical assistance and advisory services provided by the Corporation to its clients, the level of expense from the staff retirement and other benefits plans, and the approved administrative and other budgets
Net income:
Net (losses) gains on non-trading financial instruments Principally, differences between changes in fair values of derivative instruments and changes in fair value of hedged items in fair value hedging relationships
The following paragraphs detail significant variances between FY06 and FY05, and FY05 and FY04, covering the periods included in the Corporation’s FY06 financial statements. As disclosed in Note A to the Corporation’s FY06 financial statements, certain amounts in FY05 and FY04 have been reclassified to conform to the current year’s presentation. Where applicable, the following paragraphs reflect reclassified prior year comparative information. Such reclassifications had no effect on operating income, net income or total assets.
FY06 versus FY05
Operating income The Corporation’s income before expenditures for TAAS and PBG and net (losses) gains on non-trading financial instruments for FY06 was $1,499 million. Expenditures for TAAS for FY06 were $55 million, and expenditures for PBG for FY06 were $35 million, resulting in operating income for FY06 of $1,409 million. The continued strong operating performance in FY06, following from FY05’s record year, was mainly attributable to continued significant equity income (principally capital gains and dividends) and a continued overall improvement in the quality of the loan and equity investment portfolio, as measured by portfolio impairment and portfolio risk levels, although at a slower pace than in FY05. The aggregate risk level within the portfolio has been reduced principally due to: (i) the successful restructuring or rescheduling of problem projects; (ii) the growth in the outstanding portfolio in new investments with better risk ratings; (iii) the write-off of investments with worse risk ratings than the average risk rating of the portfolio; and (iv) an overall improvement in country risk ratings. This improvement began during the latter stages of FY03 and continued through FY04, FY05 and FY06. The Corporation’s liquid asset portfolios yielded strong positive contributions to the Corporation’s operating income.
A more detailed analysis of the components of IFC’s operating income follows.
Interest and financial fees from loans IFC’s primary interest earning assets is its loan portfolio. Interest and financial fees from loans (including guarantee fees) for FY06 totaled $807 million, compared with $660 million in FY05, an increase of $147 million, or 22%.

volume 2 PAGE 25
Interest income increased from $574 million in FY05 to $743 million in FY06, an increase of $169 million, or 29%. The growth in the loan portfolio and the overall increase in average interest rates during FY06, when compared with FY05, contributed $231 million, including net interest income on lending-related swaps, of the increase in interest income. Recoveries of interest on loans being removed from non-accrual status, net of reversals of income on loans being placed in nonaccrual status, were $20 million lower in FY06, compared to FY05. Income from the Corporation’s participation notes, over and above minimum contractual interest, was $25 million lower in FY06 than in FY05. Interest income from loans serving as collateral under secured borrowing arrangements totaled $6 million in FY06 ($0 in FY05).
Commitment and financial fees fell to $64 million in FY06 from $86 million in FY05, principally reflecting the change in accounting principle concerning the deferral of net loan origination fees which offset the growth attributable to strong commitments and disbursements.
Charges on borrowings The Corporation’s charges on borrowings increased by $294 million, from $309 million in FY05 to $603 million in FY06, largely reflecting the increased US dollar interest rate environment, when comparing FY06 and FY05. Charges on borrowings in FY06 includes $6 million in respect of interest expense on secured borrowings ($0 in FY05). The weighted average cost of the Corporation’s borrowings outstanding from market sources, after the effects of borrowing-related derivatives, rose during the year from 3.3% at June 30, 2005 to 4.9% at June 30, 2006. The borrowings portfolio, net of borrowing-related derivatives and before the effects of SFAS No. 133, decreased by $0.7 billion in FY06 from $16.0 billion at June 30, 2005, to $15.3 billion at June 30, 2006.
Income from liquid asset trading activities Income from liquid asset trading activities comprises interest from time deposits and securities, net gains and losses on trading activities, and a small currency translation effect. The liquid assets portfolio, net of derivatives and securities lending activities, decreased from $13.3 billion at June 30, 2005, to $12.7 billion at June 30, 2006.
Liquid asset income totaled $444 million in FY06 ($358 million in FY05). In a year when interest rates rose, the Corporation has still been able to increase income. In FY06, all of IFC's liquid asset portfolios outperformed their respective benchmarks.
The majority of liquid asset income in FY06 was attributable to the Corporation's P1 portfolio, which is actively managed against a variable rate benchmark. This portfolio generated income of $288 million in FY06, a return of 5.20% ($162 million in FY05, a return of 2.24%). The P3 portfolio, managed against the same variable rate target returned $43 million in FY06, $17 million higher than in FY05.
The P2 and P4 portfolios delivered 156 and 54 basis points of excess return versus their Lehman Brothers Intermediate US Treasury Index. With rates on the rise, the benchmark actually lost 0.19% in FY06. The P2 and P4 portfolios returned $64 million (1.38%) and $2 million (0.35%) in FY06, respectively, as compared to $130 million (3.73%) and $16 million (4.51%) in FY05. The positive performance of the P2 portfolio was achieved due to directional and yield curve strategies designed specifically to take advantage of the tightening of monetary policy in the United States, Europe and Japan.
The Corporation's holdings of US, European and Japanese inflation-indexed securities whose income varies with inflation in the P1and P2 portfolios was a significant contributor to the outperformance relative to benchmark.
Income from equity investments Income from the equity investment portfolio decreased by $137 million from $1,365 million in FY05 to $1,228 million in FY06.
The Corporation generated realized capital gains on equity sales, including recoveries of previously written-off equity investments and net of losses on sales of equity investments, for FY06 of $928 million, as compared with $723 million for FY05, an increase of $205 million. Realized capital gains on equity sales from 14 investments comprised 50% of the FY06 gains (before write-offs and losses on sales), compared to 19 investments comprising 71% of the FY05 gains. IFC continued to take advantage of buoyant markets throughout most of FY06 to sell equities and take some limited gains in investments where IFC’s developmental role was complete, and where pre-determined sales trigger levels had been met.
Dividend income was also significantly higher in FY06 at $327 million, as compared with $258 million in FY05. Consistent with FY05, a significant amount of IFC’s dividend income in FY06 was due to returns on the Corporation’s joint ventures in the oil, gas and mining sectors accounted for under the cost recovery method, which totaled $86 million in FY06, as compared with $106 million in FY05.
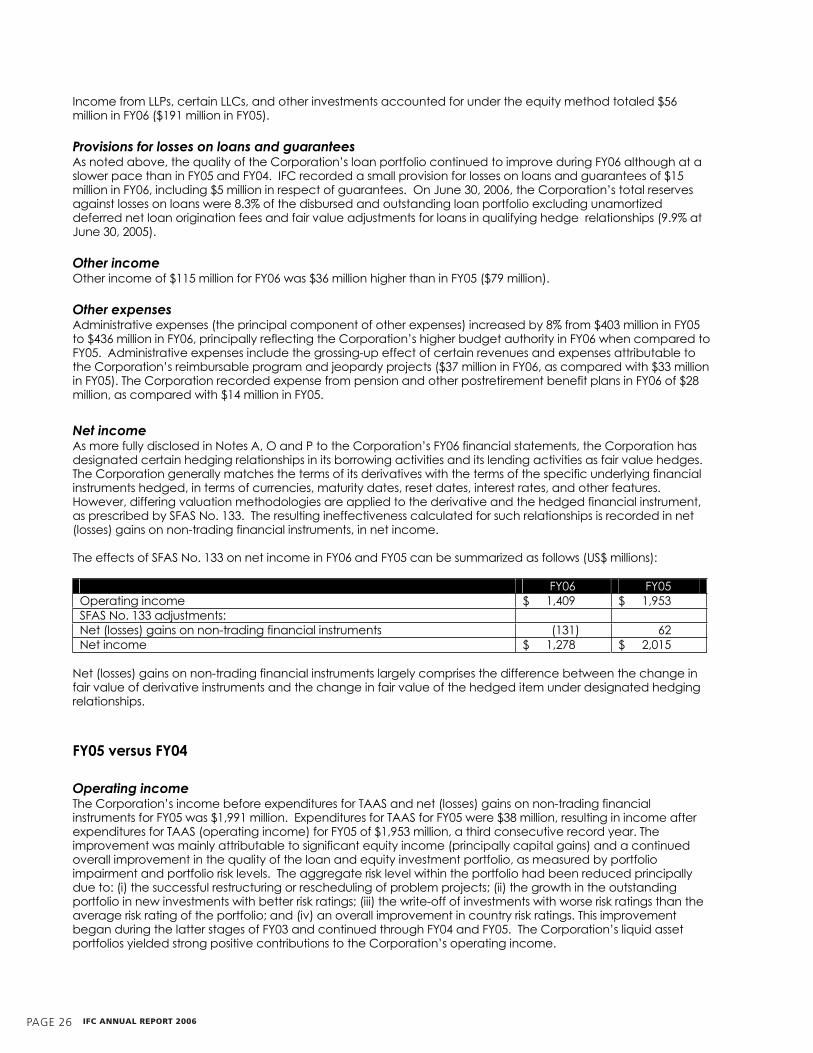
PAGE 26 IFc annual report 2006
Income from LLPs, certain LLCs, and other investments accounted for under the equity method totaled $56 million in FY06 ($191 million in FY05).
Provisions for losses on loans and guarantees As noted above, the quality of the Corporation’s loan portfolio continued to improve during FY06 although at a slower pace than in FY05 and FY04. IFC recorded a small provision for losses on loans and guarantees of $15 million in FY06, including $5 million in respect of guarantees. On June 30, 2006, the Corporation’s total reserves against losses on loans were 8.3% of the disbursed and outstanding loan portfolio excluding unamortized deferred net loan origination fees and fair value adjustments for loans in qualifying hedge relationships (9.9% at June 30, 2005).
Other income Other income of $115 million for FY06 was $36 million higher than in FY05 ($79 million).
Other expenses Administrative expenses (the principal component of other expenses) increased by 8% from $403 million in FY05 to $436 million in FY06, principally reflecting the Corporation’s higher budget authority in FY06 when compared to FY05. Administrative expenses include the grossing-up effect of certain revenues and expenses attributable to the Corporation’s reimbursable program and jeopardy projects ($37 million in FY06, as compared with $33 million in FY05). The Corporation recorded expense from pension and other postretirement benefit plans in FY06 of $28 million, as compared with $14 million in FY05.
Net income As more fully disclosed in Notes A, O and P to the Corporation’s FY06 financial statements, the Corporation has designated certain hedging relationships in its borrowing activities and its lending activities as fair value hedges. The Corporation generally matches the terms of its derivatives with the terms of the specific underlying financial instruments hedged, in terms of currencies, maturity dates, reset dates, interest rates, and other features. However, differing valuation methodologies are applied to the derivative and the hedged financial instrument, as prescribed by SFAS No. 133. The resulting ineffectiveness calculated for such relationships is recorded in net (losses) gains on non-trading financial instruments, in net income.
The effects of SFAS No. 133 on net income in FY06 and FY05 can be summarized as follows (US$ millions):
FY06 FY05 Operating income $ 1,409 $ 1,953 SFAS No. 133 adjustments: Net (losses) gains on non-trading financial instruments (131) 62 Net income $ 1,278 $ 2,015
Net (losses) gains on non-trading financial instruments largely comprises the difference between the change in fair value of derivative instruments and the change in fair value of the hedged item under designated hedging relationships.
FY05 versus FY04
Operating income The Corporation’s income before expenditures for TAAS and net (losses) gains on non-trading financial instruments for FY05 was $1,991 million. Expenditures for TAAS for FY05 were $38 million, resulting in income after expenditures for TAAS (operating income) for FY05 of $1,953 million, a third consecutive record year. The improvement was mainly attributable to significant equity income (principally capital gains) and a continued overall improvement in the quality of the loan and equity investment portfolio, as measured by portfolio impairment and portfolio risk levels. The aggregate risk level within the portfolio had been reduced principally due to: (i) the successful restructuring or rescheduling of problem projects; (ii) the growth in the outstanding portfolio in new investments with better risk ratings; (iii) the write-off of investments with worse risk ratings than the average risk rating of the portfolio; and (iv) an overall improvement in country risk ratings. This improvement began during the latter stages of FY03 and continued through FY04 and FY05. The Corporation’s liquid asset portfolios yielded strong positive contributions to the Corporation’s operating income.

volume 2 PAGE 27
A more detailed analysis of the components of IFC’s operating income follows.
Interest and financial fees from loans Interest and financial fees from loans (including guarantee fees) for FY05 totaled $660 million, compared with $518 million in FY04, an increase of $142 million, or 27%. Interest income increased from $449 million in FY04 to $574 million in FY05. The growth in the loan portfolio and the overall increase in average interest rates during FY05, when compared with FY04, contributed $118 million, net of interest expense on lending-related swaps, of the increase in interest income. Recoveries of interest on loans being removed from non-accrual status, net of reversals of income on loans being placed in nonaccrual status, were $8 million lower in FY05, compared to FY04, at $31 million in FY05 ($39 million in FY04). Income from the Corporation’s participation notes, over and above minimum contractual interest, totaled $55 million in FY05 ($40 million in FY04). Commitment and financial fees also grew to $86 million in FY05 from $69 million in FY04, reflecting strong commitments and disbursements.
Charges on borrowings The Corporation’s charges on borrowings increased by $168 million, from $141 million in FY04 to $309 million in FY05, largely reflecting the increased US dollar interest rate environment, when comparing FY05 and FY04. As the Corporation’s borrowings generally reprice every six months, the effect of the significant rise in the interest rate environment in the fourth quarter of FY04 adversely impacted FY05 charges on borrowings. The weighted average cost of the Corporation’s borrowings outstanding from market sources, after the effects of borrowing-related derivatives, rose during the year from 1.0% at June 30, 2004 to 3.3% at June 30, 2005. The borrowings portfolio, net of borrowing-related derivatives and before the effects of SFAS No. 133, decreased by $0.4 billion in FY05 from $16.4 billion at June 30, 2004, to $16.0 billion at June 30, 2005.
Income from liquid asset trading activities Income from liquid asset trading activities comprises interest from time deposits and securities, net gains and losses on trading activities, and a small currency translation effect. The liquid assets portfolio, net of derivatives and securities lending activities, increased from $13.1 billion at June 30, 2004, to $13.3 billion at June 30, 2005. Liquid asset returns totaled $358 million in FY05.
Income from equity investments Income from the equity investment portfolio increased by $707 million from $658 million in FY04 to $1,365 million in FY05.
The Corporation generated realized capital gains on equity sales for FY05 of $723 million, as compared with $381 million for FY04, an increase of $342 million. Realized capital gains on equity sales from 19 investments comprised 71% of the FY05 gains, compared to seven investments comprising 64% of the FY04 gains. IFC continued to take advantage of buoyant markets to sell equities and take some limited gains in investments where IFC’s developmental role was complete, and where pre-determined sales trigger levels had been met.
Dividend income was also significantly higher in FY05 at $258 million, as compared with $207 million in FY04. Consistent with FY04, a significant amount of IFC’s dividend income in FY05 was due to returns on the Corporation’s joint ventures in the oil, gas and mining sectors, which totaled $106 million in FY05, as compared with $65 million in FY04.
Beginning in FY05, the Corporation’s investments in its LLPs and certain LLCs are accounted for under the equity method. As a result, IFC’s FY05 income from equity investments includes income from its investments in LLPs and certain LLCs in the amount of $191 million ($0 in FY04).
Release of provisions for losses on loans and guarantees As noted above, the quality of the Corporation’s investment portfolio improved during FY05, continuing the trend noted in FY03 and FY04. As a result, IFC recorded a release of provisions for losses on loans and guarantees of $261 million in FY05, including a release of $3 million in respect of guarantees, a significant improvement over FY04 when the Corporation recorded a release of $103 million ($14 million in respect of guarantees). On June 30, 2005, the Corporation’s total reserves against losses on loans were 9.9% of the disbursed and outstanding loan portfolio (14.0% at June 30, 2004).
Other income Other income of $79 million for FY05 was substantially unchanged from FY04.

PAGE 28 IFc annual report 2006
Other expenses Administrative expenses (the principal component of other expenses) increased by 12% from $360 million in FY04 to $403 million in FY05, principally reflecting the Corporation’s higher budget authority in FY05 when compared to FY04. Administrative expenses include the grossing-up effect of certain revenues and expenses attributable to the Corporation’s reimbursable program and jeopardy projects ($33 million in FY05, as compared with $34 million in FY04). The Corporation recorded expense from pension and other postretirement benefit plans in FY05 of $14 million, as compared with $19 million in FY04.
Net income As more fully disclosed in Notes A, O and P to the Corporation’s FY06 financial statements, the Corporation has designated certain hedging relationships in its borrowing activities and its lending activities as fair value hedges. The Corporation generally matches the terms of its derivatives with the terms of the specific underlying financial instruments hedged, in terms of currencies, maturity dates, reset dates, interest rates, and other features. However, differing valuation methodologies are applied to the derivative and the hedged financial instrument, as prescribed by SFAS No. 133. The resulting ineffectiveness calculated for such relationships is recorded in net (losses) gains on non-trading financial instruments, in net income.
The effects of SFAS No. 133 on net income in FY05 and FY04 can be summarized as follows (US$ millions):
FY05 FY04 Operating income $ 1,953 $ 982 SFAS No. 133 adjustments: Net gains on non-trading financial instruments 62 11 Net income $ 2,015 $ 993
Net gains on non-trading financial instruments largely comprises the difference between the change in fair value of derivative instruments and the change in fair value of the hedged item under designated hedging relationships.

volume 2 PAGE 2�
VIII. GOVERNANCE
Management Changes
Mr. Assaad Jabre was Acting Executive Vice President (EVP) since the retirement of the Corporation’s EVP, Mr. Peter Woicke effective January 31, 2005. Effective January 15, 2006, Mr. Lars H. Thunell was appointed EVP of the Corporation.
Mr. Declan Duff was appointed Vice President, Industries effective May 15, 2006. Ms. Farida Khambata was appointed Regional Vice President for Asia and Latin America effective July 1, 2006. Mr. Edward Nassim was appointed Regional Vice President for Europe, Africa, and the Middle East effective July 1,2006.
Board of Directors
In accordance with its Articles of Agreement, members of IFC’s Board are appointed or elected by their member governments. These Directors are neither officers nor staff of IFC. The President is the only management member of the Board, serving as a non-voting member and as Chairman of the Board. The Board has established several Committees including:
Committee on Development Effectiveness Audit Committee Budget Committee Personnel Committee Ethics Committee Committee on Governance and Administrative Matters
The Board and its Committees function in continuous session at the principal offices of the World Bank Group, as business requires. Each Committee’s terms of reference establish its respective roles and responsibilities. As Committees do not vote on issues, their role is primarily to serve the full Board in discharging its responsibilities.
Audit Committee
Membership The Audit Committee consists of eight members of the Board. Membership on the Committee is determined by the Board, based upon nominations by the Chairman of the Board, following informal consultation with the Directors. In addition, membership of the Committee is expected to reflect the economic and geographic diversity of IFC’s member countries. Other relevant selection criteria include seniority, continuity and relevant experience. Some or all of the responsibilities of individual Committee members are performed by their alternates or advisors. Generally, Committee members are appointed for a two-year term; reappointment to a second term, when possible, is desirable for continuity. Audit Committee meetings are generally open to any members of the Board who may wish to attend, and non-Committee members of the Board may participate in the discussion. In addition, the Chairman of the Audit Committee may speak in that capacity at meetings of the Board with respect to discussions held in the Audit Committee.
Key responsibilities The Audit Committee is appointed by the Board to assist it in the oversight and assessment of IFC’s finances and accounting, including the effectiveness of financial policies, the integrity of financial statements, the system of internal controls regarding finance, accounting and ethics (including fraud and corruption), and financial and operational risks. The Audit Committee also has the responsibility for reviewing the performance and recommending to the Board the appointment of the external auditor, as well as monitoring the independence of the external auditor and meeting with it in executive session. The Audit Committee participates in oversight of the internal audit function, including reviewing the responsibilities, staffing and the effectiveness of internal audit. The Committee also reviews the annual internal audit plan and meets with the Auditor General in executive session. In the execution of its role, the Committee discusses with management, the external auditors, and the internal auditors financial issues and policies which have a bearing on the Corporation’s financial position and risk-bearing capacity. The Audit Committee monitors the evolution of developments in corporate governance and the role of audit committees on an ongoing basis and revised its terms of reference in FY04.

PAGE 30 IFc annual report 2006
Communications The Audit Committee communicates regularly with the Board through distribution of the following:
The minutes of its meetings. Reports of the Audit Committee prepared by the Chairman, which document discussions held. These reports are distributed to the Directors, Alternates, World Bank Group Senior Management and Vice Presidents of IFC. “Statement(s) of the Chairman” and statements issued by other members of the Committee. The Annual Report to the Board, which provides an overview of the main issues addressed by the Audit Committee over the year.
The Audit Committee’s communications with the external auditor are described in the Auditor Independence section, below.
Executive sessions Members of the Audit Committee may convene in executive session at any time, without management present. Under the Committee’s terms of reference, it meets separately in executive session with the external and internal auditors.
Access to outside resources and to management Throughout the year, the Audit Committee receives a large volume of information, which supports the preparation of the financial statements. The Audit Committee meets both formally and informally throughout the year to discuss financial and accounting matters. Directors have complete access to the management of the Corporation. The Audit Committee reviews and discusses with management the quarterly and annual financial statements. The Committee also reviews with the external auditor the financial statements prior to their publication and recommends them for approval to the Board of Directors.
The Audit Committee has the capacity, under exceptional circumstances, to obtain advice and assistance from outside legal, accounting or other advisors as deemed appropriate.
Code of Ethics
The World Bank Group strives to foster and maintain a positive work environment that supports the ethical behavior of its staff. To facilitate this effort, the World Bank Group has a Code of Professional Ethics in place. The Code (Code of Professional Ethics – Living our Values) applies to all staff (including managers, consultants, and temporary employees) worldwide.
The Code is available in nine languages on the World Bank Group’s Web site, www.worldbank.org. Staff relations, conflicts of interest, and operational issues, including the accuracy of books and records, are key elements of the Code.
In addition to the Code, an essential element of appropriate conduct is compliance with the obligations embodied in the Principles of Staff Employment, Staff Rules, and Administrative Rules, the violation of which may result in disciplinary action. In accordance with the Staff Rules, senior managers must complete a confidential financial disclosure instrument with the Office of Ethics and Business Conduct.
Guidance for staff is also provided through programs, training materials, and other resources. Managers are responsible for ensuring that internal systems, policies, and procedures are consistently aligned with the World Bank Group’s ethical goals. In support of its efforts on ethics, the World Bank offers a variety of methods for informing staff of these resources. Many of these efforts are headed by the following groups:
The Office of Ethics and Business Conduct provides leadership, management and oversight for the World Bank Group’s ethics infrastructure including the Ethics Help Line, a consolidated conflicts of interest disclosure/ resolution system, financial disclosure, ongoing training to both internal and external audiences, and communication resources. The Department of Institutional Integrity is charged with investigating allegations of fraud and corruption within the World Bank Group. The Department also investigates allegations of misconduct by World Bank Group staff, and trains and educates staff and clients in detecting and reporting fraud and corruption in World Bank Group-funded projects. The Department reports directly to the President and is composed of professionals from a range of disciplines including financial analysts, researchers, investigators, lawyers, prosecutors, forensic accountants, and World Bank Group staff with operational experience.
volume 2 PAGE 31
The World Bank Group has in place procedures for the receipt, retention and treatment of complaints received regarding accounting, internal controls and auditing matters.
The World Bank Group offers both the Ethics Help Line and a Fraud and Corruption hotline run by an outside firm staffed by trained specialists. This third-party service offers numerous methods of communication in addition to a tollfree hotline in countries where access to telecommunications may be limited. In addition, there are other methods by which the Department of Institutional Integrity may receive allegations, including directly by email, anonymously, or through confidential submission through its Web site, as well as the postal service and telephone.
Auditor Independence
In FY03, the Board adopted a set of principles applicable to the appointment of the external auditor for IFC. Key features of those principles include:
Prohibition of the external auditor from the provision of all non audit-related services; All audit-related services must be pre-approved on a case-by-case basis by the Board, upon recommendation of the Audit Committee; Mandatory rebidding of the external audit contract every five years; Prohibition of any firm serving as external auditor for more than two consecutive five-year terms; Mandatory rotation of the senior partner after five years; and An evaluation of the performance of the external auditor at the mid-point of the five year term.
In FY04, IFC’s external auditor, Deloitte and Touche LLP, began a new five-year term and will have served eleven years as external auditor upon completion of that term, pursuant to a one-time grandfathered exemption from the above-referenced ten-year limit. Even within a five-year term the service of the external auditors is subject to recommendation by the Audit Committee for annual reappointment and approval of a resolution by the Board.
As a standard practice, the external auditor is present as an observer at virtually all Audit Committee meetings and is frequently asked to present its perspective on issues. In addition, the Audit Committee meets periodically with the external auditor in private session without management present. Communication between the external auditor and the Audit Committee is ongoing, as frequently as is deemed necessary by either party. IFC’s external auditors follow the communication requirements with audit committees set out under U.S. generally accepted auditing standards. In keeping with these standards, significant formal communications include:
Quarterly and annual financial statement reporting; Annual appointment of the external auditors; Presentation of the external audit plan; Presentation of control recommendations and discussion of the COSO attestation and report; and Presentation of a statement regarding independence.
In addition to Committee meetings, individual members of the Audit Committee have independent access to the external auditor.

Section Start
PAGE 32 IFc annual report 2006
responsibility for external Financial reporting
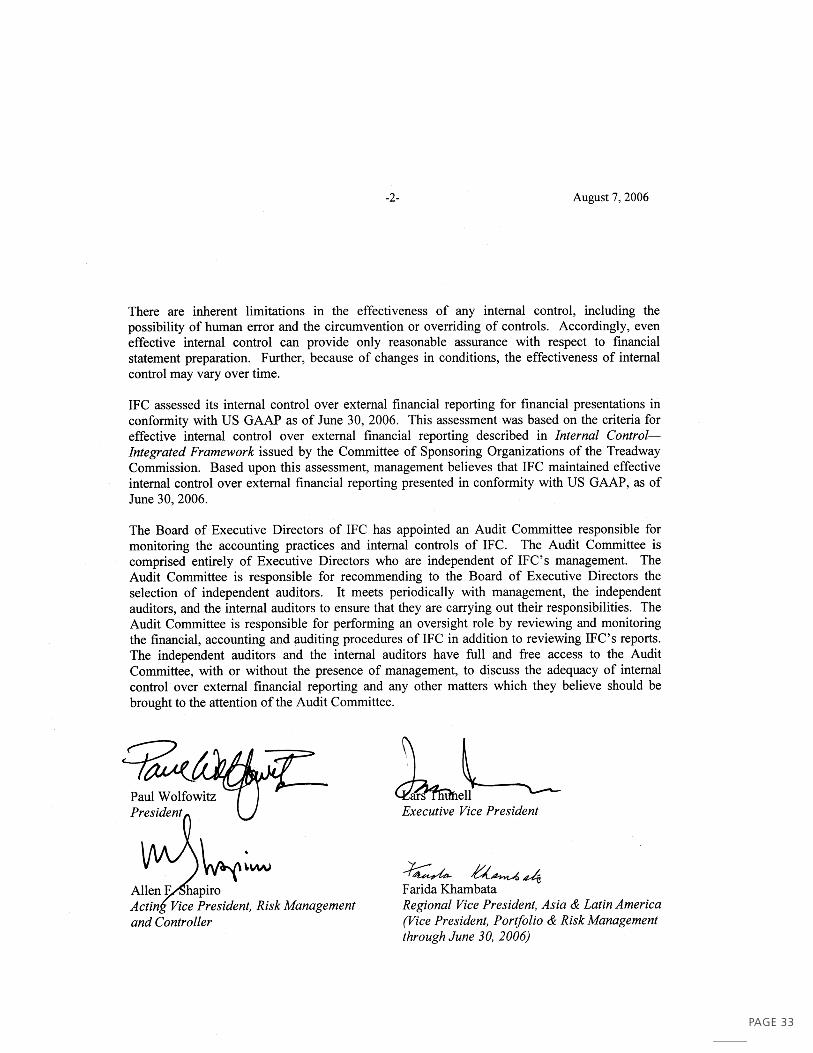
volume 2 PAGE 33

PAGE 34 IFc annual report 2006
Financial Statements

volume 2 PAGE 35
INTERNATIONAL FINANCE CORPORATION
The notes to the consolidated financial statements are an integral part of these statements.
CONSOLIDATED BALANCE SHEET
as of June 30, 2006 and June 30, 2005
(US$ millions)
2006 2005 Assets
Cash and due from banks ........................................................................................................ $ 159 $ 139 Time deposits .............................................................................................................................. 2,959 1,799 Trading securities – Note B ........................................................................................................ 16,286 14,561 Securities purchased under resale agreements ................................................................... 1,190 6,282
Loans … ........................................................................................................................................ 10,817 9,973 Less: Reserve against losses on loans .................................................................................. (898) (989) Net loans.............................................................................................................................. 9,919 8,984
Equity investments ..................................................................................................................... 2,812 2,505
Total loans and equity investments disbursed and outstanding – Note C................... 12,731 11,489 Derivative assets – Note P.......................................................................................................... 1,128 1,516
Receivables and other assets – Note H .................................................................................. 3,967 3,774
Total assets .........................................................................................................................$ 38,420 $ 39,560
Liabilities and capital
Liabilities Securities sold under repurchase agreements and payable for cash collateral received ............................................................................................ $ 8,805 $ 9,321
Borrowings withdrawn and outstanding – Note I From market sources ......................................................................................................... 14,887 15,304 From International Bank for Reconstruction and Development ................................ 80 55 Total borrowings ............................................................................................................ 14,967 15,359 Derivative liabilities – Note P ................................................................................................. 1,288 2,332
Payables and other liabilities – Note J................................................................................. 2,284 2,750
Total liabilities ..................................................................................................................... 27,344 29,762
Capital Capital stock, authorized 2,450,000 shares of $1,000 par value each – Note K Subscribed .......................................................................................................................... 2,365 2,365 Less: Portion not yet paid ................................................................................................ (1) (1) Total capital stock ........................................................................................................ 2,364 2,364
Accumulated other comprehensive income ................................................................... 1 1 Retained earnings ................................................................................................................. 8,711 7,433
Total capital ....................................................................................................................... 11,076 9,798
Total liabilities and capital ............................................................................................... $ 38,420 $ 39,560

PAGE 36 IFc annual report 2006
INTERNATIONAL FINANCE CORPORATION
The notes to the consolidated financial statements are an integral part of these statements.
CONSOLIDATED INCOME STATEMENT
for the three years ended June 30, 2006
(US$ millions)
2006 2005 2004
Interest and financial fees from loans – Note C ....................................................... $ 807 $ 660 $ 518
Income from liquid asset trading activities – Note B .............................................. 444 358 177
Charges on borrowings – Note I ................................................................................ (603) (309) (141)
Income from equity investments – Note E................................................................. 1,228 1,365 658
(Provision for) release of provision for losses on loans and guarantees – Note C (15) 261 103
Income from loans, equity investments and liquid asset trading activities, after (provision for) release of provision for losses on loans and guarantees............................................................................................................. 1,861 2,335 1,315
Other income Service fees ............................................................................................................... 52 41 41 Net translation adjustments on non-trading activities ........................................ 6 (7) 4 Other – Note L ........................................................................................................... 57 45 34 Total other income ............................................................................................... 115 79 79
Other expenses Administrative expenses – Notes T and U ............................................................. 436 403 360 Expense from pension and other postretirement benefit plans – Note S ....... 28 14 19 Other ........................................................................................................................... 13 6 4 Total other expenses ........................................................................................... 477 423 383
Income before expenditures for technical assistance and advisory services, expenditures for performance-based grants and net (losses) gains on non-trading financial instruments........................................................................... 1,499 1,991 1,011
Expenditures for technical assistance and advisory services – Note M ............... (55) (38) (29)
Expenditures for performance-based grants - Note N............................................ (35) - -
Income after expenditures for technical assistance and advisory services, expenditures for performance-based grants and before net (losses) gains on non-trading financial instruments........................................................................... 1,409 1,953 982
Net (losses) gains on non-trading financial instruments – Note O......................... (131) 62 11
Net income.....................................................................................................................$ 1,278 $ 2,015 $ 993

volume 2 PAGE 37
INTERNATIONAL FINANCE CORPORATION
The notes to the consolidated financial statements are an integral part of these statements.
CONSOLIDATED STATEMENT OF COMPREHENSIVE INCOME
for the three years ended June 30, 2006
(US$ millions)
2006 2005 2004
Net income ....................................................................................................................$ 1,278 $ 2,015 $ 993
Other comprehensive loss Reclassification to net income of net interest accruals on swaps in cash flow hedging relationships at June 30, 2000 .......................................... - (1) (2)
Total comprehensive income ............................................................................ $ 1,278 $ 2,014 $ 991
INTERNATIONAL FINANCE CORPORATION
The notes to the consolidated financial statements are an integral part of these statements.
CONSOLIDATED INCOME STATEMENT
for the three years ended June 30, 2006
(US$ millions)
2006 2005 2004
Interest and financial fees from loans – Note C ....................................................... $ 807 $ 660 $ 518
Income from liquid asset trading activities – Note B .............................................. 444 358 177
Charges on borrowings – Note I ................................................................................ (603) (309) (141)
Income from equity investments – Note E................................................................. 1,228 1,365 658
(Provision for) release of provision for losses on loans and guarantees – Note C (15) 261 103
Income from loans, equity investments and liquid asset trading activities, after (provision for) release of provision for losses on loans and guarantees............................................................................................................. 1,861 2,335 1,315
Other income Service fees ............................................................................................................... 52 41 41 Net translation adjustments on non-trading activities ........................................ 6 (7) 4 Other – Note L ........................................................................................................... 57 45 34 Total other income ............................................................................................... 115 79 79
Other expenses Administrative expenses – Notes T and U ............................................................. 436 403 360 Expense from pension and other postretirement benefit plans – Note S ....... 28 14 19 Other ........................................................................................................................... 13 6 4 Total other expenses ........................................................................................... 477 423 383
Income before expenditures for technical assistance and advisory services, expenditures for performance-based grants and net (losses) gains on non-trading financial instruments........................................................................... 1,499 1,991 1,011
Expenditures for technical assistance and advisory services – Note M ............... (55) (38) (29)
Expenditures for performance-based grants - Note N............................................ (35) - -
Income after expenditures for technical assistance and advisory services, expenditures for performance-based grants and before net (losses) gains on non-trading financial instruments........................................................................... 1,409 1,953 982
Net (losses) gains on non-trading financial instruments – Note O......................... (131) 62 11
Net income.....................................................................................................................$ 1,278 $ 2,015 $ 993

PAGE 38 IFc annual report 2006
INTERNATIONAL FINANCE CORPORATION
The notes to the consolidated financial statements are an integral part of these statements.
CONSOLIDATED STATEMENT OF CHANGES IN CAPITAL
for the three years ended June 30, 2006
(US$ millions)
Retained earnings Designated for technical Accumulated assistance Designated for other and advisory performance- Designated for comprehensive Capital Total Undesignated services based grants grants to IDA Total income stock† capital
At July 1, 2003 ………………$ 4,425 $ - $ - $ - $ 4,425 $ 4 $ 2,360 $ 6,789
Year ended June 30, 2004 Net income ……………….. 993 993 993 Other comprehensive income (loss) ………..... (2) (2) Designations for technical assistance and advisory services - Note K……… (225) 225 - - Payments received on account of pending subscriptions………… 1 1 Payments received for capital stock subscribed……………….. 1 1
At June 30, 2004 ……………. 5,193 225 - - 5,418 2 2,362 7,782
Year ended June 30, 2005 Net income ……………… 2,015 2,015 2,015
Expenditures for technical assistance and advisory services - Note M……… 38 (38) - - Other comprehensive income (loss) … (1) (1) Designations for technical assistance and advisory services - Note K……… (125) 125 - - Designations for performance-based grants - Note K………. (250) 250 - Payments received for capital stock subscribed………………. 2 2
At June 30, 2005 …………… 6,871 312 250 - 7,433 1 2,364 9,798
Year ended June 30, 2006 Net income ……………….. 1,278 1,278 1,278Expenditures for technical
assistance and advisory services - Note M………. 55 (55) - - Expenditures for performance-based grants – Note N ……….. 35 (35) - - Designated for technical
assistance and advisory services – Note K………. (230) 230 - - Designated for grants to IDA – Note K………. (150) 150 - - -
At June 30, 2006 ……………$ 7,859 $ 487 $ 215 $ 150 $ 8,711 $ 1 $ 2,364 $ 11,076
† Capital stock includes payments received on account of pending subscriptions.

volume 2 PAGE 3�
INTERNATIONAL FINANCE CORPORATION
The notes to the consolidated financial statements are an integral part of these statements.
CONSOLIDATED STATEMENT OF CASH FLOWS
for the three years ended June 30, 2006
(US$ millions)
2006 2005 2004 Cash flows from loans and equity investment activities Loan disbursements ................................................................................................. $ (3,717) $ (2,868) $ (2,684) Equity disbursements ............................................................................................... (711) (588) (468) Loan repayments ..................................................................................................... 2,752 2,283 1,935 Equity redemptions .................................................................................................. 2 29 4 Sales of loans and equity investments .................................................................. 1,456 1,338 975
Net cash (used in) provided by investing activities ....................................... (218) 194 (238)
Cash flows from financing activities Drawdown of borrowings ....................................................................................... 1,816 1,989 3,047 Repayment of borrowings ...................................................................................... (2,611) (2,497) (3,136) Capital subscriptions................................................................................................. - 2 1
Net cash used in financing activities ............................................................... (795) (506) (88)
Cash flows from operating activities Net income ............................................................................................................... 1,278 2,015 993 Adjustments to reconcile net income to net cash provided by operating activities: ................................................................................................ Realized capital gains on equity sales ............................................................. (928) (723) (386) Income from LLPs, certain LLCs and other investments accounted for under the equity method ..................................................... (56) (191) - Equity investment impairment write-downs ..................................................... 57 62 - Provision for (release of provision for) losses on loans and guarantees....... 15 (261) (103) Changes in carrying value of equity investments ........................................... - (269) (69) Translation adjustments, net .............................................................................. (6) 7 (4) Net losses (gains) on non-trading financial instruments ................................ 131 (62) (11) Change in accrued income on loans, time deposits and securities .......... (150) (470) (228) Change in payables and other liabilities ......................................................... (431) 459 (733) Change in receivables and other assets.......................................................... (168) (797) 1,023 Change in trading securities and securities purchased and sold under resale and repurchase agreements ............................................................. 2,416 51 (69)
Net cash provided by (used in) operating activities ..................................... 2,158 (179) 413
Change in cash and cash equivalents .................................................................... 1,145 (491) 87
Effect of exchange rate changes on cash and cash equivalents ...................... 35 (32) (12)Net change in cash and cash equivalents ............................................................. 1,180 (523) 75 Beginning cash and cash equivalents ..................................................................... 1,938 2,461 2,386
Ending cash and cash equivalents ........................................................................... $ 3,118 $ 1,938 $ 2,461
Composition of cash and cash equivalents Due from banks ........................................................................................................ $ 159 $ 139 $ 74 Time deposits ............................................................................................................ 2,959 1,799 2,387
Total cash and cash equivalents ...................................................................... $ 3,118 $ 1,938 $ 2,461
Supplemental disclosure Change in ending balances resulting from exchange rate fluctuations: Loans outstanding ............................................................................................... $ (49) $ (9) $ 83 Borrowings ............................................................................................................. (355) (24) (765) Currency swaps .................................................................................................... (1) - -
INTERNATIONAL FINANCE CORPORATION
The notes to the consolidated financial statements are an integral part of these statements.
CONSOLIDATED STATEMENT OF CHANGES IN CAPITAL
for the three years ended June 30, 2006
(US$ millions)
Retained earnings Designated for technical Accumulated assistance Designated for other and advisory performance- Designated for comprehensive Capital Total Undesignated services based grants grants to IDA Total income stock† capital
At July 1, 2003 ………………$ 4,425 $ - $ - $ - $ 4,425 $ 4 $ 2,360 $ 6,789
Year ended June 30, 2004 Net income ……………….. 993 993 993 Other comprehensive income (loss) ………..... (2) (2) Designations for technical assistance and advisory services - Note K……… (225) 225 - - Payments received on account of pending subscriptions………… 1 1 Payments received for capital stock subscribed……………….. 1 1
At June 30, 2004 ……………. 5,193 225 - - 5,418 2 2,362 7,782
Year ended June 30, 2005 Net income ……………… 2,015 2,015 2,015
Expenditures for technical assistance and advisory services - Note M……… 38 (38) - - Other comprehensive income (loss) … (1) (1) Designations for technical assistance and advisory services - Note K……… (125) 125 - - Designations for performance-based grants - Note K………. (250) 250 - Payments received for capital stock subscribed………………. 2 2
At June 30, 2005 …………… 6,871 312 250 - 7,433 1 2,364 9,798
Year ended June 30, 2006 Net income ……………….. 1,278 1,278 1,278Expenditures for technical
assistance and advisory services - Note M………. 55 (55) - - Expenditures for performance-based grants – Note N ……….. 35 (35) - - Designated for technical
assistance and advisory services – Note K………. (230) 230 - - Designated for grants to IDA – Note K………. (150) 150 - - -
At June 30, 2006 ……………$ 7,859 $ 487 $ 215 $ 150 $ 8,711 $ 1 $ 2,364 $ 11,076
† Capital stock includes payments received on account of pending subscriptions.

PAGE 40 IFc annual report 2006
INTERNATIONAL FINANCE CORPORATION
The notes to the consolidated financial statements are an integral part of these statements.
STATEMENT OF CAPITAL STOCK AND VOTING POWER as of June 30, 2006
(US$ thousands)
Capital stock Voting power Amount Percent Number Percent
Members paid of total of votes of total Afghanistan ...................... $ 111 * 361 0.02 Albania ............................. 1,302 0.06 1,552 0.06 Algeria ............................... 5,621 0.24 5,871 0.24 Angola .............................. 1,481 0.06 1,731 0.07 Antigua and Barbuda .... 13 * 263 0.01 Argentina ......................... 38,129 1.61 38,379 1.59 Armenia ............................ 992 0.04 1,242 0.05 Australia ............................ 47,329 2.00 47,579 1.98 Austria ............................... 19,741 0.84 19,991 0.83 Azerbaijan ........................ 2,367 0.10 2,617 0.11 Bahamas, The .................. 335 0.01 585 0.02 Bahrain .............................. 1,746 0.07 1,996 0.08 Bangladesh ...................... 9,037 0.38 9,287 0.39 Barbados .......................... 361 0.02 611 0.03 Belarus ............................... 5,162 0.22 5,412 0.22 Belgium ............................. 50,610 2.14 50,860 2.11 Belize ................................. 101 * 351 0.01 Benin .................................. 119 0.01 369 0.02 Bhutan................................ 720 0.03 970 0.04 Bolivia ................................ 1,902 0.08 2,152 0.09 Bosnia and Herzegovina 620 0.03 870 0.04 Botswana .......................... 113 * 363 0.02 Brazil ................................... 39,479 1.67 39,729 1.65 Bulgaria ............................. 4,867 0.21 5,117 0.21 Burkina Faso ..................... 836 0.04 1,086 0.05 Burundi .............................. 100 * 350 0.01 Cambodia ........................ 339 0.01 589 0.02 Cameroon ........................ 885 0.04 1,135 0.05 Canada ............................ 81,342 3.44 81,592 3.39 Cape Verde ..................... 15 * 265 0.01 Central African Republic 119 0.01 369 0.02 Chad .................................. 1,364 0.06 1,614 0.07 Chile .................................. 11,710 0.50 11,960 0.50 China ................................. 24,500 1.04 24,750 1.03 Colombia ......................... 12,606 0.53 12,856 0.53 Comoros ........................... 14 * 264 0.01 Congo, Dem. Rep. of . 2,159 0.09 2,409 0.10 Congo, Republic of ........ 131 0.01 381 0.02 Costa Rica ........................ 952 0.04 1,202 0.05 Côte d'Ivoire .................... 3,544 0.15 3,794 0.16 Croatia .............................. 2,882 0.12 3,132 0.13 Cyprus ............................... 2,139 0.09 2,389 0.10 Czech Republic ............... 8,913 0.38 9,163 0.38 Denmark ........................... 18,554 0.78 18,804 0.78 Djibouti .............................. 21 * 271 0.01 Dominica .......................... 42 * 292 0.01 Dominican Republic ....... 1,187 0.05 1,437 0.06 Ecuador ............................ 2,161 0.09 2,411 0.10 Egypt, Arab Republic of 12,360 0.52 12,610 0.52 El Salvador ........................ 29 * 279 0.01 Equatorial Guinea ........... 43 * 293 0.01 Eritrea ................................ 935 0.04 1,185 0.05 Estonia ............................... 1,434 0.06 1,684 0.07 Ethiopia ............................. 127 0.01 377 0.02 Fiji ....................................... 287 0.01 537 0.02 Finland .............................. 15,697 0.66 15,947 0.66 France .............................. 121,015 5.12 121,265 5.04 Gabon .............................. 1,268 0.05 1,518 0.06 Gambia, The .................... 94 * 344 0.01 Georgia ............................ 861 0.04 1,111 0.05 Germany ......................... 128,908 5.45 129,158 5.36 Ghana ............................... 5,071 0.21 5,321 0.22 Greece ............................. 6,898 0.29 7,148 0.30 Grenada ........................... 74 * 324 0.01 Guatemala ...................... 1,084 0.05 1,334 0.06 Guinea .............................. 339 0.01 589 0.02 Guinea-Bissau .................. 18 * 268 0.01 Guyana ............................. 1,392 0.06 1,642 0.07 Haiti .................................... 822 0.03 1,072 0.04 Honduras .......................... 495 0.02 745 0.03 Hungary ............................ 10,932 0.46 11,182 0.46 Iceland .............................. 42 * 292 0.01 India .................................. 81,342 3.44 81,592 3.39 Indonesia .......................... 28,539 1.21 28,789 1.20 Iran, Islamic Republic of . 1,444 0.06 1,694 0.07 Iraq .................................... 147 0.01 397 0.02 Ireland ............................... 1,290 0.05 1,540 0.06 Israel .................................. 2,135 0.09 2,385 0.10 Italy .................................... 81,342 3.44 81,592 3.39 Jamaica ........................... 4,282 0.18 4,532 0.19 Japan ............................... 141,174 5.97 141,424 5.87 Jordan ............................... 941 0.04 1,191 0.05 Kazakhstan ....................... 4,637 0.20 4,887 0.20 Kenya ................................ 4,041 0.17 4,291 0.18 Kiribati ................................ 12 * 262 0.01 Korea, Republic of .......... 15,946 0.67 16,196 0.67 Kuwait ............................... 9,947 0.42 10,197 0.42 Kyrgyz Republic ............... 1,720 0.07 1,970 0.08 Lao People's Dem. Rep. . 278 0.01 528 0.02
Capital stock Voting power Amount Percent Number Percent Members paid of total of votes of total Latvia ................................. $ 2,150 0.09 2,400 0.10 Lebanon ........................... 135 0.01 385 0.02 Lesotho ............................. 71 * 321 0.01 Liberia ................................ 83 * 333 0.01 Libya .................................. 55 * 305 0.01 Lithuania ........................... 2,341 0.10 2,591 0.11 Luxembourg ..................... 2,139 0.09 2,389 0.10 Macedonia, FYR of ......... 536 0.02 786 0.03 Madagascar .................... 432 0.02 682 0.03 Malawi .............................. 1,822 0.08 2,072 0.09 Malaysia ........................... 15,222 0.64 15,472 0.64 Maldives ........................... 16 * 266 0.01 Mali .................................... 451 0.02 701 0.03 Malta ................................. 1,615 0.07 1,865 0.08 Marshall Islands ................ 663 0.03 913 0.04 Mauritania ........................ 214 0.01 464 0.02 Mauritius ............................ 1,665 0.07 1,915 0.08 Mexico .............................. 27,589 1.17 27,839 1.16 Micronesia, Fed. States of 744 0.03 994 0.04 Moldova ........................... 784 0.03 1,034 0.04 Mongolia .......................... 144 0.01 394 0.02 Morocco ........................... 9,037 0.38 9,287 0.39 Mozambique ................... 322 0.01 572 0.02 Myanmar .......................... 666 0.03 916 0.04 Namibia ............................ 404 0.02 654 0.03 Nepal ................................ 822 0.03 1,072 0.04 Netherlands ...................... 56,131 2.37 56,381 2.34 New Zealand ................... 3,583 0.15 3,833 0.16 Nicaragua ........................ 715 0.03 965 0.04 Niger .................................. 147 0.01 397 0.02 Nigeria ............................... 21,643 0.92 21,893 0.91 Norway ............................. 17,599 0.74 17,849 0.74 Oman ................................ 1,187 0.05 1,437 0.06 Pakistan ............................. 19,380 0.82 19,630 0.82 Palau ................................. 25 * 275 0.01 Panama ............................ 1,007 0.04 1,257 0.05 Papua New Guinea ....... 1,147 0.05 1,397 0.06 Paraguay .......................... 436 0.02 686 0.03 Peru ................................... 6,898 0.29 7,148 0.30 Philippines ......................... 12,606 0.53 12,856 0.53 Poland ............................... 7,236 0.31 7,486 0.31 Portugal ............................ 8,324 0.35 8,574 0.36 Romania ........................... 2,661 0.11 2,911 0.12 Russian Federation .......... 81,342 3.44 81,592 3.39 Rwanda ............................ 306 0.01 556 0.02 Saint Kitts and Nevis ........ 638 0.03 888 0.04 St. Lucia ............................. 74 * 324 0.01 Samoa ............................... 35 * 285 0.01 Saudi Arabia .................... 30,062 1.27 30,312 1.26 Senegal ............................. 2,299 0.10 2,549 0.11 Serbia and Montenegro . 1,803 0.08 2,053 0.09 Seychelles ......................... 27 * 277 0.01 Sierra Leone ..................... 223 0.01 473 0.02 Singapore ......................... 177 0.01 427 0.02 Slovak Republic ............... 4,457 0.19 4,707 0.20 Slovenia ............................ 1,585 0.07 1,835 0.08 Solomon Islands ............... 37 * 287 0.01 Somalia ............................. 83 * 333 0.01 South Africa ...................... 15,948 0.67 16,198 0.67 Spain ................................. 37,026 1.57 37,276 1.55 Sri Lanka ............................ 7,135 0.30 7,385 0.31 Sudan ................................ 111 * 361 0.02 Swaziland ......................... 684 0.03 934 0.04 Sweden ............................. 26,876 1.14 27,126 1.13 Switzerland ....................... 41,580 1.76 41,830 1.74 Syrian Arab Republic ...... 194 0.01 444 0.02 Tajikistan ............................ 1,212 0.05 1,462 0.06 Tanzania ........................... 1,003 0.04 1,253 0.05 Thailand ............................ 10,941 0.46 11,191 0.46 Timor-Leste ........................ 777 0.03 1,027 0.04 Togo .................................. 808 0.03 1,058 0.04 Tonga ................................ 34 * 284 0.01 Trinidad and Tobago ...... 4,112 0.17 4,362 0.18 Tunisia ................................ 3,566 0.15 3,816 0.16 Turkey ................................ 14,545 0.62 14,795 0.61 Turkmenistan .................... 810 0.03 1,060 0.04 Uganda ............................. 735 0.03 985 0.04 Ukraine .............................. 9,505 0.40 9,755 0.41 United Arab Emirates ...... 4,033 0.17 4,283 0.18 United Kingdom .............. 121,015 5.12 121,265 5.04 United States .................... 569,379 24.09 569,629 23.65 Uruguay ............................ 3,569 0.15 3,819 0.16 Uzbekistan ........................ 3,873 0.16 4,123 0.17 Vanuatu ............................ 55 * 305 0.01 Venezuela, Rep. Boliv. de 27,588 1.17 27,838 1.16 Vietnam ............................ 446 0.02 696 0.03 Yemen, Republic of ........ 715 0.03 965 0.04 Zambia .............................. 1,286 0.05 1,536 0.06 Zimbabwe ........................ 2,120 0.09 2,370 0.10
Total June 30, 2006 $ 2,363,891 100.00+ 2,408,391 100.00+
Total June 30, 2005 $ 2,363,891 100.00+ 2,408,391 100.00+* Less than .005 percent. + May differ from the sum of the individual percentages shown because of rounding.

volume 2 PAGE 41
INTERNATIONAL FINANCE CORPORATION
NOTES TO CONSOLIDATED FINANCIAL STATEMENTS
PURPOSE
The International Finance Corporation (IFC or the Corporation), an international organization, was established in 1956 to furthereconomic development in its member countries by encouraging the growth of private enterprise. The Corporation is a member of the World Bank Group, which also includes the International Bank for Reconstruction and Development (IBRD), the International Development Association (IDA), and the Multilateral Investment Guarantee Agency (MIGA). The Corporation’s activities are closelycoordinated with and complement the overall development objectives of the other World Bank Group institutions. The Corporation, together with private investors, assists in financing the establishment, improvement, and expansion of private sector enterprises by making loans and equity investments where sufficient private capital is not otherwise available on reasonable terms. The Corporation’s share capital is provided by its member countries. It raises most of the funds for its investment activities through the issuance of notes, bonds, and other debt securities in the international capital markets. The Corporation also plays a catalytic role in mobilizing additional project funding from other investors and lenders, either through cofinancing or through loan participations, underwritings, and guarantees. In addition to project finance and resource mobilization, the Corporation offers an array of financial and technical advisory services to private businesses in the developing world to increase their chances of success. It also advises governments on how to create an environment hospitable to the growth of private enterprise and foreign investment.
NOTE A – SUMMARY OF SIGNIFICANT ACCOUNTING AND RELATED POLICIES
The consolidated financial statements include the financial statements of the Corporation and four Variable Interest Entities (VIEs) (see Note W). The accounting and reporting policies of the Corporation conform with accounting principles generally accepted inthe United States of America (US GAAP). On August 7, 2006, the Board of Directors of the Corporation (the Board) approved theseconsolidated financial statements for issue.
Consolidated financial statements presentation - Certain amounts in the prior years have been reclassified to conform to the current year’s presentation.
Use of estimates - The preparation of the consolidated financial statements requires management to make estimates and assumptions that affect the reported amounts of assets and liabilities and disclosure of contingent assets and liabilities at the date of the consolidated financial statements and the reported amounts of income and expense during the reporting periods. Actual results could differ from these estimates. A significant degree of judgment has been used in the determination of: the adequacy of the reserve against losses on loans and impairment of equity investments; estimated fair values of all derivative instruments and related financial instruments in qualifying hedging relationships; and net periodic pension income. There are inherent risks and uncertainties related to the Corporation’s operations. The possibility exists that changing economic conditions could have an adverse effect on the financial position of the Corporation.
The Corporation uses internal models to determine the fair values of derivative and other financial instruments and the aggregatelevel of the reserve against losses on loans and impairment of equity investments. The Corporation undertakes continuous reviewand respecification of these models with the objective of refining its estimates, consistent with evolving best market practices.Changes in estimates resulting from refinements in the assumptions and methodologies incorporated in the models are reflected innet income in the period in which the enhanced models are first applied.
Translation of currencies - Assets and liabilities not denominated in United States dollars (US dollars or $), other than disbursed equity investments, are expressed in US dollars at the exchange rates prevailing at June 30, 2006 and June 30, 2005. Disbursed equity investments are expressed in US dollars at the prevailing exchange rates at the time of disbursement. Income and expenses are translated at the rates of exchange prevailing at the time of the transaction. Translation gains and losses are credited or charged to income.
Loans - The Corporation originates loans to facilitate project finance, restructuring, refinancing, corporate finance, and/or developmental impact. Loans are recorded as assets when disbursed. Loans are carried at the principal amounts outstanding. Where loans are part of a designated hedging relationship employing derivative instruments, the carrying value is adjusted for changes in fair value attributable to the risk being hedged. These adjustments are reported in net gains and losses on non-trading financial instruments in the consolidated income statement. It is the Corporation’s practice to obtain collateral security such as, but not limited to, mortgages and third-party guarantees.
Revenue recognition on loans - Interest income and commitment fees on loans are recorded as income on an accrual basis. Beginning in the year ended June 30, 2006, the Corporation began amortizing net loan origination costs and fees over the estimated life of the originated loan to which the fees relate. Prior to the year ended June 30, 2006, loan origination costs wereexpensed as incurred, and loan origination fees were recognized in income when received. The net of loan origination fees and loan origination costs was considered insignificant. All other fees are recorded as income when received in freely convertible currencies.

PAGE 42 IFc annual report 2006
INTERNATIONAL FINANCE CORPORATION
NOTES TO CONSOLIDATED FINANCIAL STATEMENTS
The Corporation does not recognize income on loans where collectibility is in doubt or payments of interest or principal are past due more than 60 days unless management anticipates that collection of interest will occur in the near future. Any interest accrued on a loan placed in nonaccrual status is reversed out of income and is thereafter recognized as income only when the actual payment is received. Interest not previously recognized but capitalized as part of a debt restructuring is recorded as deferredincome, included in the consolidated balance sheet in payables and other liabilities, and credited to income only when the related principal is received. Such capitalized interest is considered in the computation of the reserve against losses on loans and equity investments in the consolidated balance sheet.
Reserve against losses on loans - The Corporation recognizes portfolio impairment on loans in the consolidated balance sheet through the reserve against losses on loans, recording a provision or release of provision for losses on loans in net income on a quarterly basis, which increases or decreases the reserve against losses on loans.
Management determines the aggregate level of the reserve against losses on loans, taking into account established guidelines andits assessment of recent portfolio quality trends. The guidelines comprise simulation techniques, internal country risk ratings and the impairment potential of the loan portfolio based on the Corporation’s historical portfolio write-off and loss reserve experience on mature investments.
The reserve against losses on loans reflects estimates of both probable losses already identified and probable losses inherent in the portfolio but not specifically identifiable. The determination of identified probable losses represents management’s judgment of the creditworthiness of the borrower and is established through review of individual loans undertaken on a quarterly basis. The Corporation considers a loan as impaired when, based on current information and events, it is probable that the Corporation willbe unable to collect all amounts due according to the loan’s contractual terms. Unidentified probable losses are the aggregate probable losses over a one-year risk horizon, in excess of identified probable losses. The risks inherent in the portfolio that are considered in determining unidentified probable losses are those proven to exist by past experience and include: country systemicrisk; the risk of correlation or contagion of losses between markets; uninsured and uninsurable risks; nonperformance under guarantees and support agreements; and opacity of, or misrepresentation in, financial statements.
Loans are written-off when the Corporation has exhausted all possible means of recovery, by reducing the reserve against losses on loans. Such reductions in the reserve are offset by recoveries associated with previously written-off loans.
Equity investments - The Corporation invests for current income, capital appreciation, developmental impact, or all three; the Corporation does not seek to take operational, controlling, or strategic equity positions within its investees. Equity investments are acquired through direct ownership of equity instruments of investees, as a limited partner in limited liability partnerships (LLPs) and limited liability companies (LLCs), and/or as an investor in a private equity fund.
Revenue recognition on equity investments - Direct equity investments in which the Corporation does not have significant influence and certain investments in investment companies are carried at cost less impairment. The Corporation’s investments in companieswhere it has significant influence and certain investments in LLPs and LLCs that maintain specific ownership accounts are accounted for under the equity method. The Corporation’s investments in certain private equity funds in which IFC is deemed tobe the Primary Beneficiary of a VIE as the presumption of control by the fund manager or the general partner has been overcome are fully consolidated into the Corporation’s books. Certain equity investments, for which recovery of invested capital is uncertain, are accounted for under the cost recovery method, such that receipts of freely convertible currencies are first applied to recovery of invested capital and then to capital gains. The cost recovery method is principally applied to the Corporation's investment in its oil and gas unincorporated joint ventures (UJVs). Conditional asset retirement obligations related to investments in UJVs are recorded when the fair value of the obligations can be reasonably estimated. The obligations are capitalized and systemically amortized over the estimated economic useful lives.
Dividends and profit participations received on cost method equity investments are generally recorded as income when received in freely convertible currencies. Realized capital gains on the sale or redemption of equity investments are measured against theaverage cost of the investments sold and are generally recorded as income when received in freely convertible currencies or securities, which are readily convertible into freely convertible currencies. Capital losses are recognized when incurred.
The Corporation enters into put and call option agreements in connection with equity investments; these are accounted for in accordance with Statement of Financial Accounting Standards (SFAS) No. 133.
Impairment of equity investments - Equity investments are assessed for impairment each quarter. When an impairment is identified and is deemed to be other than temporary, the equity investment is written down to the impaired value, which becomes the new cost basis in the equity investment. Impairment losses are not reversed for subsequent recoveries in value of the equity investment until it is sold.

volume 2 PAGE 43
INTERNATIONAL FINANCE CORPORATION
NOTES TO CONSOLIDATED FINANCIAL STATEMENTS
Guarantees - The Corporation extends financial guarantee facilities to its clients to provide credit enhancement for their debt securities and trade obligations. Beginning in the year ended June 30, 2001, the Corporation began offering partial credit guarantees to clients covering, on a risk-sharing basis, client obligations on bonds and/or loans. Under the terms of the Corporation's guarantees, the Corporation agrees to assume responsibility for the client’s financial obligations in the event of default by the client (i.e., failure to pay when payment is due). Guarantees are regarded as issued when the Corporation commits to the guarantee. Guarantees are regarded as outstanding when the underlying financial obligation of the client is incurred, and this date is considered to be the “inception” of the guarantee. Guarantees are regarded as called when the Corporation’s obligation under the guarantee has been invoked. There are two liabilities associated with the guarantees: (1) the stand-ready obligation to perform and (2) the contingent liability. The stand-ready obligation to perform is recognized at the outstanding date unless a contingent liability exists at that time or is expected to exist in the near term. The contingent liability associated with the financial guarantees is recognized when it is probable the guarantee will be called and when the amount of guarantee called can be reasonably estimated. All liabilities associated with guarantees are included in payables and other liabilities, and the receivables are included in other assets on the consolidated balance sheet. When the guarantees are called, the amount disbursed is recorded as a new loan, and specific reserves are established, based on the estimated probable loss. These reserves are included in the reserve against losses on loans on the consolidated balance sheet. Guarantee fees are recorded in income as the stand-ready obligation to perform is fulfilled. Commitment fees on guarantees are recorded as income on an accrual basis.
Designations of retained earnings - In the year ended June 30, 2004, IFC established a funding mechanism for technical assistance and advisory services (TAAS) through a designation of retained earnings. In the year ended June 30, 2005, the Corporation established a funding mechanism for performance-based grants (PBG) through a designation of retained earnings. Further, in the year ended June 30, 2006, the Corporation also designated retained earnings for grants to IDA for use by IDA in the provision ofgrants to further IFC’s mandates in certain IDA member countries. Total designations of retained earnings for TAAS, PBG, and grants to IDA are determined based on the Corporation’s annual income before expenditures for TAAS, expenditures for PBG, and net (losses) gains on non-trading financial instruments in excess of $150 million, and contemplating the financial capacity andpriorities of the Corporation. Expenditures for TAAS, PBG, and grants to IDA are recorded as expenses in the Corporation’s consolidated income statement in the year in which they occur, also having the effect of reducing the respective designated retained earnings for such purposes.
Expenditures are deemed to have occurred when IFC has ceded control of the funds to the recipient. If the recipient organizationis deemed, in accordance with US GAAP, to be controlled by IFC, the expenditure is deemed to have occurred only when the recipient organization expends the funds to a non-related party. On occasion, recipient organizations which are deemed to be controlled by the Corporation will acquire certain investment assets other than cash. These investments have had no material impact on the Corporation’s financial position, results of operations, or cash flows. In such cases, the Corporation includes those assets on its consolidated balance sheet, where they remain until the recipient organization disposes of or transfers the asset or the Corporation is deemed to no longer be in control of the recipient organization.
Liquid asset portfolio - The Corporation’s liquid funds are invested in government and agency obligations, time deposits and asset-backed securities. Government and agency obligations include long and short positions in highly rated fixed rate bonds, notes,bills, and other obligations issued or unconditionally guaranteed by governments of countries or other official entities includinggovernment agencies and instrumentalities or by multilateral organizations. The liquid asset portfolio, as defined by the Corporation, consists of: time deposits and securities; related derivative instruments; securities purchased under resale agreements, securities sold under repurchase agreements and payable for cash collateral received; receivables from sales of securities and payables for purchases of securities; and related accrued income and charges.
Trading securities are carried at fair value with any changes in fair value reported in income from liquid asset trading activities. Interest on securities and amortization of premiums and accretion of discounts are also reported in income from liquid asset trading activities.
The Corporation classifies due from banks and time deposits (collectively, cash and cash equivalents) as an element of liquidity in the statement of consolidated cash flows because they are readily convertible to known amounts of cash within 90 days.
Repurchase and resale agreements - Repurchase agreements are contracts under which a party sells securities and simultaneously agrees to repurchase the same securities at a specified future date at a fixed price. Resale agreements are contracts under which a party purchases securities and simultaneously agrees to resell the same securities at a specified future date at a fixed price.
It is the Corporation’s policy to take possession of securities purchased under resale agreements, which are primarily liquid government securities. The market value of these securities is monitored and, within parameters defined in the agreements, additional collateral is obtained when their value declines. The Corporation also monitors its exposure with respect to securities sold under repurchase agreements and, in accordance with the terms of the agreements, requests the return of excess securities held by the counterparty when their value increases.
Repurchase and resale agreements are accounted for as collateralized financing transactions and recorded at the amount at which the securities were acquired or sold plus accrued interest. Securities purchased under resale agreements, securities soldunder agreements to repurchase and securities payable for cash collateral received are recorded at fair value.
PAGE 44 IFc annual report 2006
INTERNATIONAL FINANCE CORPORATION
NOTES TO CONSOLIDATED FINANCIAL STATEMENTS
Borrowings - To diversify its access to funding and reduce its borrowing costs, the Corporation borrows in a variety of currencies and uses a number of borrowing structures, including foreign exchange rate-linked, inverse floating rate and zero coupon notes. Generally, the Corporation simultaneously converts such borrowings into variable rate US dollar borrowings through the use of currency and interest rate swap transactions. Under certain outstanding borrowing agreements, the Corporation is not permitted to mortgage or allow a lien to be placed on its assets (other than purchase money security interests) without extending equivalentsecurity to the holders of such borrowings.
Borrowings are recorded at the amount repayable at maturity, adjusted for unamortized premium and unaccreted discount. Where borrowings are part of a designated hedging relationship employing derivative instruments, the carrying amount is adjustedfor changes in fair value attributable to the risk being hedged. Adjustments for changes in fair value attributable to hedged risks are reported in net gains and losses on non-trading financial instruments in the consolidated income statement. Interest on borrowings and amortization of premiums and accretion of discounts are reported in charges on borrowings.
Risk management, derivative instruments, and hedge accounting - The Corporation enters into transactions in various derivative instruments for financial risk management purposes in connection with its principal business activities, including lending, client risk management, borrowing, liquid asset portfolio management and asset and liability management. The Corporation does not use derivatives for speculative, marketing or merchandising purposes.
All derivative instruments are recorded on the consolidated balance sheet at fair value as derivative assets or derivative liabilities. Where they are not clearly and closely related to the host contract, certain derivative instruments embedded in loans, equity investments, and market borrowing transactions entered into on or after January 1, 1999, are bifurcated from the host contract and recorded at fair value as derivative assets and liabilities. The value at inception of such embedded derivatives is excluded from the carrying value of the host contracts on the consolidated balance sheet. Changes in fair values of derivative instruments used in liquid asset portfolio management activities are recorded in income from liquid asset trading activities. Changes in fairvalues of derivative instruments other than those used in liquid asset portfolio management activities are recorded in net (losses) gains on non-trading financial instruments.
Subject to certain specific qualifying conditions in SFAS No. 133, a derivative instrument may be designated either as a hedge of the fair value of an asset or liability (fair value hedge), or as a hedge of the variability of cash flows of an asset or liability or forecasted transaction (cash flow hedge). For a derivative instrument qualifying as a fair value hedge, fair value gains or losses on thederivative instrument are reported in net income, together with offsetting fair value gains or losses on the hedged item that are attributable to the risk being hedged. For a derivative instrument qualifying as a cash flow hedge, fair value gains or lossesassociated with the risk being hedged are reported in other comprehensive income and released to net income in the period(s) inwhich the effect on net income of the hedged item is recorded. Fair value gains and losses on a derivative instrument not qualifying as a hedge are reported in net gains and losses on non-trading financial instruments.
The Corporation has designated certain hedging relationships in its borrowing and lending activities as fair value hedges. TheCorporation generally matches the terms of its derivatives with the terms of the specific underlying financial instruments hedged, in terms of currencies, maturity dates, reset dates, interest rates, and other features. However, the valuation methodologies applied to the derivative and the hedged financial instrument, as prescribed by SFAS No. 133, may differ. The resulting ineffectiveness calculated for such relationships is recorded in net gains and losses on non-trading financial instruments in the consolidated income statement.
The Corporation has not designated any hedging relationships as cash flow hedges.
The risk management policy for each of the Corporation’s principal business activities and the accounting policies particular tothem are described below.
Lending activities The Corporation’s policy is to closely match the currency, rate basis, and maturity of its loans and borrowings. Derivative instruments are used to convert the cash flows from fixed rate US dollar or non-US dollar loans into variable rate US dollars. The impact on net income of changes in fair value of interest rate swaps qualifying for the shortcut method under SFAS No. 133 is exactly offset by a corresponding adjustment to the fair value of the related loans. The Corporation has elected not to designatehedging relationships for all other lending-related derivatives that do not qualify for the shortcut method.
Client risk management activities The Corporation enters into derivatives transactions with its clients to help them hedge their own currency, interest rate, or commodity risk, which, in turn, improves the overall quality of the Corporation’s loan portfolio. To hedge the market risks that arise from these transactions with clients, the Corporation enters into offsetting derivative transactions with matching terms with authorized market counterparties. Changes in fair value of all derivatives associated with these activities are reflected currently in net income. Though hedge accounting is not applicable to these activities, the matching of terms betweenthe offsetting transactions minimizes the impact on net income. Fees and spreads charged on these transactions are recorded asincome on an accrual basis.
volume 2 PAGE 45
INTERNATIONAL FINANCE CORPORATION
NOTES TO CONSOLIDATED FINANCIAL STATEMENTS
Borrowing activities The Corporation issues debt securities in various capital markets with the objectives of minimizing its borrowing costs, diversifying funding sources, and developing member countries’ capital markets, sometimes using complex structures. Thesestructures include borrowings payable in multiple currencies, or borrowings with principal and/or interest determined by reference to a specified index such as a stock market index, a reference interest rate, a commodity index, or one or more foreign exchangerates. The Corporation uses derivative instruments with matching terms, primarily currency and interest rate swaps, to convert such borrowings into variable rate US dollar obligations, consistent with the Corporation’s matched funding policy. The Corporation has designated the majority of derivatives associated with borrowing activities as fair value hedges of the underlying borrowings. There are a small number of cash flow-like hedging transactions for which no hedge relationship has been designated.
Liquid asset portfolio management activities The Corporation manages the interest rate, currency and other market risks associated with certain of the time deposits and securities in its liquid asset portfolio by entering into derivative transactions to convert the cash flows from those instruments into variable rate US dollars, consistent with the Corporation’s matched funding policy. The derivative instruments used include short-term, over-the-counter foreign exchange forwards (covered forwards), interest rate and currency swaps, and exchange-traded interest rate futures and options. As the entire liquid asset portfolio is classified as a trading portfolio, all securities (including derivatives) are carried at fair value, and no hedging relationships have been designated.
Asset and liability management In addition to the risk managed in the context of its business activities detailed above, the Corporation faces residual market risk in its overall asset and liability management. Residual currency risk is managed by monitoring the aggregate position in each lending currency and eliminating the net excess asset or liability position through spot sales orpurchases. Interest rate risk due to reset date mismatches is reduced by synchronizing the reset dates on assets and liabilities and managing overall interest rate risk on an aggregate basis. Interest rate risk arising from mismatches due to writedowns, prepayments and reschedulings, and residual reset date mismatches, is monitored by measuring the sensitivity of the present valueof assets and liabilities in each currency to each basis point change in interest rates. The Corporation monitors the credit risk associated with these activities by careful assessment and monitoring of prospective andactual clients and counterparties. In respect of liquid assets and derivatives transactions, credit risk is managed by establishing exposure limits based on the credit rating and size of the individual counterparty. In addition, the Corporation has entered into master agreements governing derivative transactions that contain close-out and netting provisions and collateral arrangements. Under these agreements, if the Corporation’s credit exposure to a counterparty, on a mark-to-market basis, exceeds a specified level, the counterparty must post collateral to cover the excess, generally in the form of liquid government securities.
Resource mobilization - The Corporation mobilizes funds from commercial banks and other financial institutions (Participants) by facilitating loan participations, without recourse. These loan participations are administered and serviced by the Corporation on behalf of the Participants. Loan participations serving as collateral under secured borrowing arrangements are included in loans on the Corporation’s consolidated balance sheet with the related secured borrowing included in liabilities on the Corporation’s consolidated balance sheet. The disbursed and outstanding balances of the loan participations that are considered sales are notincluded in the Corporation’s consolidated balance sheet.
Pension and other postretirement benefits - IBRD has a defined benefit Staff Retirement Plan (SRP), a Retired Staff Benefits Plan (RSBP) and a Post-Employment Benefits Plan (PEBP) that cover substantially all of its staff members as well as the staff of theCorporation and of MIGA.
The SRP provides regular pension benefits and includes a cash balance plan. The RSBP provides certain health and life insurancebenefits to eligible retirees. The PEBP provides pension benefits administered outside the SRP. All costs associated with these plans are allocated between IBRD, the Corporation, and MIGA based upon their employees’ respective participation in the plans. In addition, the Corporation and MIGA reimburse IBRD for their share of any contributions made to these plans by IBRD.
The net periodic pension and other postretirement benefit income or expense allocated to the Corporation is included in expensefrom pension and other postretirement benefits in the consolidated income statement. The Corporation includes a receivable from IBRD in receivables and other assets, representing prepaid pension and other postretirement benefit costs.
Variable Interest Entities - In January 2003, the Financial Accounting Standards Board (FASB) issued FASB Interpretation No. 46, Consolidation of Variable Interest Entities - an interpretation of ARB No. 51 (FIN 46). During December 2003, FASB replaced FIN 46 with FASB Interpretation No. 46, Consolidation of Variable Interest Entities - an interpretation of ARB No. 51 (FIN 46R). FIN 46 and FIN 46R define certain VIEs and require parties to such entities to assess and measure variable interests in the VIEs for the purpose of determining possible consolidation of the VIEs. Variable interests can arise from financial instruments, service contracts, guarantees, leases or other arrangements with VIE. An entity that will absorb a majority of VIE’s expected losses or expected residual returns is deemed to be the primary beneficiary of the VIE and must include the assets, liabilities, and results of operations of the VIE in its consolidated financial statements.
The Corporation has a number of investments in VIEs which it manages and supervises in a manner consistent with other portfolioinvestments. Note W provides further details regarding the Corporation’s variable interests in VIEs.

PAGE 46 IFc annual report 2006
INTERNATIONAL FINANCE CORPORATION
NOTES TO CONSOLIDATED FINANCIAL STATEMENTS
Accounting and financial reporting developments - During the year ended June 30, 2006, the Corporation changed its accounting principle with respect to the amortization of loan origination fees and loan origination costs. Prior to the year ended June 30, 2006, the net of loan origination fees and costs was considered to be insignificant. Beginning in year ended June 30, 2006, the Corporation began amortizing loan origination fees and costs on an effective yield basis.
The FASB issued SFAS No. 154, Accounting Changes and Error Corrections, a replacement of APB Opinion No. 20 and FASB Statement No. 3. The Corporation early adopted SFAS No. 154 as of July 1, 2005. The adoption had no material impact on the Corporation’s financial position, results of operations or cash flows.
The FASB issued FASB Interpretation No. 47, Accounting for Conditional Asset Retirement Obligations - an interpretation of FASB Statement No. 143 (FIN 47). The Corporation adopted FIN 47 as of June 30, 2006 and has accrued a liability for its estimated conditional asset retirement obligations in four oil and gas UJVs.
The US Accounting Standards Executive Committee issued, and the FASB ratified, Statement of Position (SOP) 03-3, Accounting for Certain Loans or Debt Securities Acquired in a Transfer (SOP 03-3). The Corporation adopted SOP 03-3 as of July 1, 2005, and the adoption had no material impact on the Corporation’s financial position, results of operations or cash flows.
During the year ended June 30, 2006, the FASB issued SFAS No. 155, Accounting for Certain Hybrid Instruments - an amendment of FASB Statements Nos. 133 and 140 (SFAS No. 155) and SFAS No. 156, Accounting for Servicing of Financial Assets - an amendment of FASB Statement No. 140 (SFAS No. 156). Both SFAS No. 155 and SFAS No. 156 are effective for fiscal years beginning after September 15, 2006, which would be the year ending June 30, 2008 for IFC. The Corporation is presently assessing the possible impact of SFAS No. 155 and SFAS No. 156.
In addition, during the year ended June 30, 2006, the FASB issued and/or approved various FASB Staff Positions, EITF Issues Notes, and other interpretative guidance related to Statements of Financial Accounting Standards and APB Opinions. The Corporation analyzed and implemented the new guidance, as appropriate, with no material impact on either the financial position, results ofoperations or cash flows of the Corporation.

volume 2 PAGE 47
INTERNATIONAL FINANCE CORPORATION
NOTES TO CONSOLIDATED FINANCIAL STATEMENTS
NOTE B – LIQUID ASSET PORTFOLIO
The composition of the Corporation’s liquid asset portfolio is included in the consolidated balance sheet captions as follows (US$ millions):
June 30, 2006 June 30, 2005Assets Cash and due from banks $ - $ 56 Time deposits 2,911 1,720 Trading securities 16,286 14,561 Securities purchased under resale agreements 1,190 6,282 Receivables and other assets: Receivables from sales of securities 1,466 1,330 Accrued interest income on time deposits and securities 1,226 1,116 Accrued income on derivative instruments 37 42 Derivative assets 189 151 Total assets 23,305 25,258
LiabilitiesPayables and other liabilities: Due to banks 12 - Payables for purchases of securities 1,352 1,769 Accrued charges on derivative instruments 62 110 Securities sold under repurchase agreements and payable for cash collateral received 8,805 9,321 Derivative liabilities 344 733 Total liabilities 10,575 11,933
Total net liquid asset portfolio $ 12,730 $ 13,325
The liquid asset portfolio is denominated primarily in US dollars; investments in other currencies, net of the effect of associated derivative instruments that convert non-US dollar securities into US dollar securities, represent less than 1% of the portfolio at June 30, 2006 (less than 1% - June 30, 2005). The annualized rate of return on the trading portfolio during the year ended June 30, 2006, was 3.6% (2.6% - year ended June 30, 2005; 1.4% - year ended June 30, 2004). After the effect of associated derivative instruments, the liquid asset portfolio generally reprices within one year.
Trading securities
The composition of trading securities is as follows: Year ended June 30, 2006 At June 30, 2006 Fair value average Average
daily balance Fair value maturity Average (US$ millions) (US$ millions) (years) yield (%) Government and agency obligations $ 9,604 $ 10,182 4.8 3.9Asset-backed securities 4,554 4,467 27.0 5.6 Corporate securities 1,819 1,318 2.7 4.8 Money market funds 307 319 - 5.2
Total trading securities $ 16,284 $ 16,286
Year ended June 30, 2005 At June 30, 2005 Fair value average Average
daily balance Fair value maturity Average (US$ millions) (US$ millions) (years) yield (%) Government and agency obligations $ 7,716 $ 7,923 3.4 3.9Asset-backed securities 3,518 4,220 24.2 3.9 Corporate securities 2,756 2,300 3.9 4.4 Money market funds 367 118 - 2.6
Total trading securities $ 14,357 $ 14,561
The expected maturity of the asset-backed securities will differ from the contractual maturity, as reported above, due to prepayment features.

PAGE 48 IFc annual report 2006
INTERNATIONAL FINANCE CORPORATION
NOTES TO CONSOLIDATED FINANCIAL STATEMENTS
Income from liquid asset trading activities
Income from liquid asset trading activities for the years ended June 30, 2006, June 30, 2005, and June 30, 2004 comprises (US$ millions):
2006 2005 2004 Interest income $ 673 $ 533 $ 278 Net (losses) gains on trading activities: Realized 72 (80) (38) Unrealized (302) (95) (66) Net (losses) gains on trading activities (230) (175) (104) Translation adjustments 1 - 3Total income from liquid asset trading activities $ 444 $ 358 $ 177
Collateral
The estimated fair value of securities held by the Corporation at June 30, 2006 as collateral, in connection with derivatives transactions and purchase and resale agreements, that may be sold or repledged was $1,313 million ($6,740 million - June 30, 2005).
NOTE C – LOANS AND EQUITY INVESTMENTS AND RESERVE AGAINST LOSSES ON LOANS
The distribution of the disbursed portfolio by sector is as follows (US$ millions):
June 30, 2006 June 30, 2005 Equity Equity Loans investments Total Loans investments TotalFinance and insurance $ 3,511 $ 1,018 $ 4,529 $ 2,637 $ 845 $ 3,482 Utilities 1,013 255 1,268 1,085 198 1,283 Oil, gas and mining 815 173 988 775 167 942 Transportation and warehousing 758 32 790 757 40 797 Industrial and consumer products 671 83 754 723 66 789 Nonmetallic mineral product manufacturing 703 23 726 529 24 553 Information 463 148 611 460 119 579 Food and beverages 478 63 541 512 62 574 Chemicals 465 63 528 337 73 410 Collective investment vehicles 48 383 431 56 402 458 Agriculture and forestry 367 60 427 207 60 267 Wholesale and retail trade 348 48 396 336 63 399 Accommodation and tourism services 277 30 307 322 43 365 Paper and pulp 237 55 292 266 27 293 Primary metals 233 30 263 350 27 377 Textiles, apparel and leather 152 19 171 181 21 202 Plastics and rubber 52 44 96 93 52 145 Construction and real estate 69 1 70 142 7 149 Other 197 23 220 194 18 212 Total disbursed portfolio 10,857 2,551 13,408 9,962 2,314 12,276 Adjustments to investments accounted for under the equity method - 255 255 - 191 191 Unrealized gains on equity investments held by consolidated VIEs - 6 6 - - - Unamortized deferred loan origination fees, net (46) - (46) - - - Fair value adjustments for loans in qualifying hedge relationships 6 - 6 11 - 11
Carrying value of loans and equity investments $ 10,817 $ 2,812 $ 13,629 $ 9,973 $ 2,505 $ 12,478

volume 2 PAGE 4�
INTERNATIONAL FINANCE CORPORATION
NOTES TO CONSOLIDATED FINANCIAL STATEMENTS
The distribution of the disbursed loan and equity investment portfolio by geographical region is as follows (US$ millions):
June 30, 2006 June 30, 2005 Equity Equity Loans investments Total Loans investments TotalEurope and Central Asia $ 3,786 $ 628 $ 4,414 $ 2,847 $ 540 $ 3,387 Latin America and Caribbean 3,475 651 4,126 3,681 618 4,299 Asia 2,055 866 2,921 1,922 737 2,659 Sub-Saharan Africa 792 188 980 677 186 863 Middle East and North Africa 726 125 851 672 107 779 Other 23 93 116 163 126 289 Total disbursed portfolio 10,857 2,551 13,408 9,962 2,314 12,276 Adjustments to investments accounted for under the equity method - 255 255 - 191 191 Unrealized gains on equity investments held by consolidated VIEs - 6 6 - - - Unamortized deferred loan origination fees, net (46) - (46) - - - Fair value adjustments for loans in qualifying hedge relationships 6 - 6 11 - 11
Carrying value of loans and equity investments $ 10,817 $ 2,812 $ 13,629 $ 9,973 $ 2,505 $ 12,478
At June 30, 2006, 20% of the disbursed loan portfolio consisted of fixed rate loans (16% - June 30, 2005), while the remainder was at variable rates. At June 30, 2006, the disbursed loan portfolio included $88 million of loans serving as collateral under securedborrowing arrangements.
Loan portfolio
The currency composition and average yield of the disbursed loan portfolio are summarized below:
June 30, 2006 June 30, 2005 Amount Average Amount Average (US $ millions) yield (%) (US $ million) yield (%) US dollar $ 8,300 8.1 $ 8,074 6.6 Euro 1,498 5.3 1,193 4.8 Other currencies 1,059 8.1 695 8.8
Total disbursed loan portfolio 10,857 7.7 9,962 6.5Unamortized deferred loan origination fees, net (46) - Fair value adjustments for loans in qualifying hedge relationships 6 11
Carrying value of loans $ 10,817 $ 9,973
After the effect of interest rate and currency swaps, the Corporation’s loans are principally denominated in US dollars.
Disbursed loans in all currencies are repayable during the years ending June 30, 2007 through June 30, 2011 and thereafter, as follows (US$ millions):
2007 2008 2009 2010 2011 Thereafter Total Fixed rate loans $ 380 $ 336 $ 338 $ 247 $ 226 $ 676 $ 2,203 Variable rate loans 1,200 1,266 1,364 1,153 1,056 2,615 8,654
Total disbursed loan portfolio $ 1,580 $ 1,602 $ 1,702 $ 1,400 $ 1,282 $ 3,291 10,857 Unamortized deferred loan origination fees, net (46) Fair value adjustments for loans in qualifying hedge relationships 6
Carrying value of loans $ 10,817
The Corporation’s disbursed variable rate loans generally reprice within one year.
Loans on which the accrual of interest has been discontinued amounted to $447 million at June 30, 2006 ($634 million - June 30,2005). Interest income not recognized on nonaccruing loans during the year ended June 30, 2006 totaled $68 million ($58 million - year ended June 30, 2005; $82 million - year ended June 30, 2004). Interest income recognized on loans in nonaccrual status, related to current and prior years, during the year ended June 30, 2006 was $21 million ($36 million - year ended June 30, 2005; $54 million - year ended June 30, 2004). The average recorded investment in impaired loans during the year ended June 30, 2006, was$931 million ($1,486 million - year ended June 30, 2005). The recorded investment in impaired loans at June 30, 2006 was $671million ($1,191 million - June 30, 2005).

PAGE 50 IFc annual report 2006
INTERNATIONAL FINANCE CORPORATION
NOTES TO CONSOLIDATED FINANCIAL STATEMENTS
Reserve against losses on loans
Changes in the reserve against losses, on loans for the year ended June 30, 2006, June 30, 2005, and June 30, 2004, are summarized below (US$ millions):
June 30, 2006 June 30, 2005 June 30,2004 Beginning balance $ 989 $ 1,367 $ 1,684 Provision for (release of provision for) losses on loans 10 (259) (89) Write-offs (111) (136) (246) Recoveries of previously written-off investments 9 16 2 Translation adjustments on loans 4 4 15 Other adjustments (3) (3) 1 Ending balance $ 898 $ 989 $ 1,367
The provision for losses on loans and guarantees in the consolidated income statement for the year ended June 30, 2006 includes$5 million provision in respect of guarantees ($3 million release - year ended June 30, 2005; $14 million release - year ended June 30, 2004). At June 30, 2006 the accumulated reserve for losses on guarantees, included in the consolidated balance sheet in payables and other liabilities, was $18 million ($13 million - June 30, 2005).
Interest and financial fees from loans
Interest and financial fees from loans for the years ended June 30, 2006, June 30, 2005, and June 30, 2004 comprise the following (US$ millions):
2006 2005 2004 Interest income $ 743 $ 574 $ 449 Commitment fees 21 17 15 Other financial fees 43 69 54 Total interest and financial fees from loans $ 807 $ 660 $ 518
NOTE D – GUARANTEES
Under the terms of the Corporation’s guarantees, the Corporation agrees to assume responsibility for the client’s financial obligations in the event of default by the client, where default is defined as failure to pay when payment is due. Guarantees entered into by the Corporation generally have maturities consistent with those of the loan portfolio. Guarantees signed at June 30, 2006 totaled $1,150 million ($978 million - June 30, 2005). Guarantees of $494 million that were outstanding at June 30, 2006 ($291 million - June 30, 2005) were not included in loans on the Corporation’s consolidated balance sheet. The outstanding amount represents the maximum amount of undiscounted future payments that the Corporation could be required to make under these guarantees.
NOTE E – INCOME FROM EQUITY INVESTMENTS
Income from equity investments for the years ended June 30, 2006, June 30, 2005, and June 30, 2004 comprise the following
(US$ millions):
2006 2005 2004 Realized capital gains on equity sales $ 928 $ 723 $ 386 Dividends and profit participations 327 258 207 Amortization of UJVs conditional asset retirement obligations (8) - - Income from LLPs, certain LLCs and other investments accounted for under the equity method 56 191 - Changes in carrying value of equity investments - 269 69 Equity investment impairment write-downs (57) (62) - Net losses on equity-related derivatives (15) (12) (2) Custody and other fees (3) (2) (2) Total income from equity investments $ 1,228 $ 1,365 $ 658
Realized capital gains include recoveries and are net of losses on sales of equity investments.
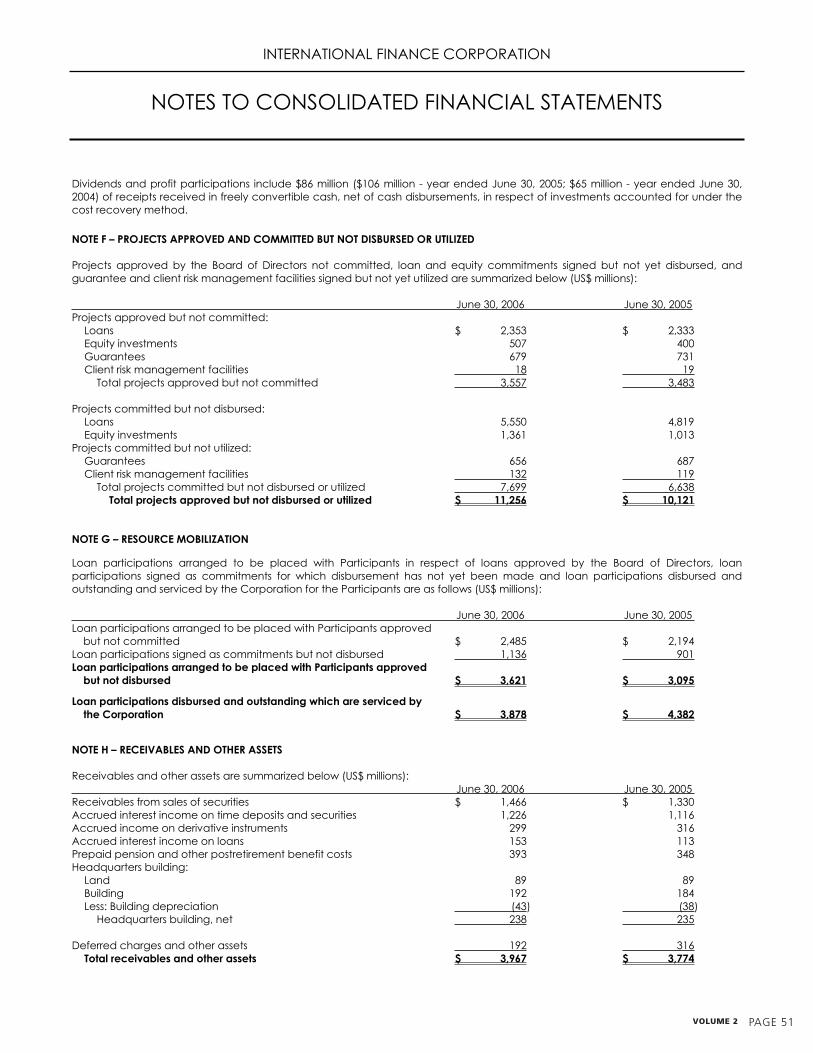
volume 2 PAGE 51
INTERNATIONAL FINANCE CORPORATION
NOTES TO CONSOLIDATED FINANCIAL STATEMENTS
Dividends and profit participations include $86 million ($106 million - year ended June 30, 2005; $65 million - year ended June 30, 2004) of receipts received in freely convertible cash, net of cash disbursements, in respect of investments accounted for under the cost recovery method.
NOTE F – PROJECTS APPROVED AND COMMITTED BUT NOT DISBURSED OR UTILIZED
Projects approved by the Board of Directors not committed, loan and equity commitments signed but not yet disbursed, and guarantee and client risk management facilities signed but not yet utilized are summarized below (US$ millions):
June 30, 2006 June 30, 2005Projects approved but not committed: Loans $ 2,353 $ 2,333 Equity investments 507 400 Guarantees 679 731 Client risk management facilities 18 19 Total projects approved but not committed 3,557 3,483
Projects committed but not disbursed: Loans 5,550 4,819 Equity investments 1,361 1,013 Projects committed but not utilized: Guarantees 656 687 Client risk management facilities 132 119 Total projects committed but not disbursed or utilized 7,699 6,638
Total projects approved but not disbursed or utilized $ 11,256 $ 10,121
NOTE G – RESOURCE MOBILIZATION
Loan participations arranged to be placed with Participants in respect of loans approved by the Board of Directors, loan participations signed as commitments for which disbursement has not yet been made and loan participations disbursed and outstanding and serviced by the Corporation for the Participants are as follows (US$ millions):
June 30, 2006 June 30, 2005 Loan participations arranged to be placed with Participants approved but not committed $ 2,485 $ 2,194 Loan participations signed as commitments but not disbursed 1,136 901Loan participations arranged to be placed with Participants approved but not disbursed $ 3,621 $ 3,095
Loan participations disbursed and outstanding which are serviced by the Corporation $ 3,878 $ 4,382
NOTE H – RECEIVABLES AND OTHER ASSETS
Receivables and other assets are summarized below (US$ millions): June 30, 2006 June 30, 2005
Receivables from sales of securities $ 1,466 $ 1,330 Accrued interest income on time deposits and securities 1,226 1,116 Accrued income on derivative instruments 299 316 Accrued interest income on loans 153 113 Prepaid pension and other postretirement benefit costs 393 348 Headquarters building: Land 89 89 Building 192 184 Less: Building depreciation (43) (38) Headquarters building, net 238 235
Deferred charges and other assets 192 316Total receivables and other assets $ 3,967 $ 3,774

PAGE 52 IFc annual report 2006
INTERNATIONAL FINANCE CORPORATION
NOTES TO CONSOLIDATED FINANCIAL STATEMENTS
NOTE I – BORROWINGS
Market borrowings and associated derivatives
The Corporation's borrowings outstanding from market sources and currency and interest rate swaps, net of unamortized issue premiums and discounts, are summarized below: June 30, 2006 Interest rate swaps Currency swaps notional principal Market borrowings payable (receivable) payable (receivable) Net currency obligation Weighted Weighted Notional Weighted Weighted Amount (US average Amount (US average amount (US average Amount (US average $ millions) cost (%) $ millions) cost (%) $ millions) cost (%) $ millions) cost (%) US dollar $ 6,980 3.9 $ 8,078 4.6 $ 6,334 5.1 $ 14,725 4.9 (6,667) (3.8) - - Japanese yen 4,174 4.2 (4,174) (4.2) - - - - Pound sterling 1,712 5.4 (1,712) (5.4) - - - - South African rand 589 7.2 (589) (7.2) - - - - Hong Kong dollar 552 6.1 (552) (6.1) - - - - Euro 475 6.4 (475) (6.4) - - - - Australian dollar 397 4.7 (397) (4.7) - - - - Canadian dollar 276 1.0 (276) (1.0) - - - - New Zealand dollar 242 6.0 (242) (6.0) - - - - Colombian peso 235 12.5 (235) (12.5) - - - - Chinese renminbi 141 3.4 - - - - 141 3.4 Malaysian ringgit 136 2.9 (136) (2.9) - - - - Moroccon dirham 114 4.5 (114) (4.5) - - - - Swiss francs 91 1.9 (91) (1.3) 80 1.3 - - (80) (2.0) - - Peruvian soles nuevos 46 6.6 (46) (6.6) - - - - Principal at face value 16,160 $ (961) $ (333) $ 14,866Less: Unamortized discounts, net (605)Total market borrowings 15,555 Fair value adjustments (668)Carrying value of market borrowings $ 14,887
June 30, 2005 Interest rate swaps Currency swaps notional principal Market borrowings payable (receivable) payable (receivable) Net currency obligation Weighted Weighted Notional Weighted Weighted Amount (US average Amount (US average amount (US average Amount (US average $ millions) cost (%) $ millions) cost (%) $ millions) cost (%) $ millions) cost (%) US dollar $ 7,029 3.9 $ 8,872 2.7 $ 6,350 3.2 $ 15,641 3.3 (6,610) (3.8) - - Japanese yen 5,008 3.8 (5,008) (3.8) - - - - Pound sterling 1,713 5.4 (1,713) (5.4) - - - - Hong Kong dollar 745 6.0 (745) (6.0) - - - - South African rand 662 7.5 (662) (7.5) - - - - Euro 514 6.3 (514) (6.3) - - - - Australian dollar 497 4.7 (497) (4.7) - - - - Canadian dollar 284 1.0 (284) (1.0) - - - - Colombian peso 265 12.5 (265) (12.5) - - - - New Zealand dollar 216 5.6 (216) (5.6) - - - - Malaysian ringgit 132 2.9 (132) (2.9) - - - - Moroccon dirham 110 4.5 (110) (4.5) - - - - Swiss francs 78 2.7 (78) (0.4) 78 0.4 - - (78) (2.7) - - Hungarian forints 49 9.0 (49) (9.0) - - - - Peruvian soles nuevos 46 6.6 (46) (6.6) - - - - Principal at face value 17,348 $ (1,447) $ (260) $ 15,641Less: Unamortized discounts, net (593)Total market borrowings 16,755 Fair value adjustments (1,451)Carrying value of market borrowings $ 15,304
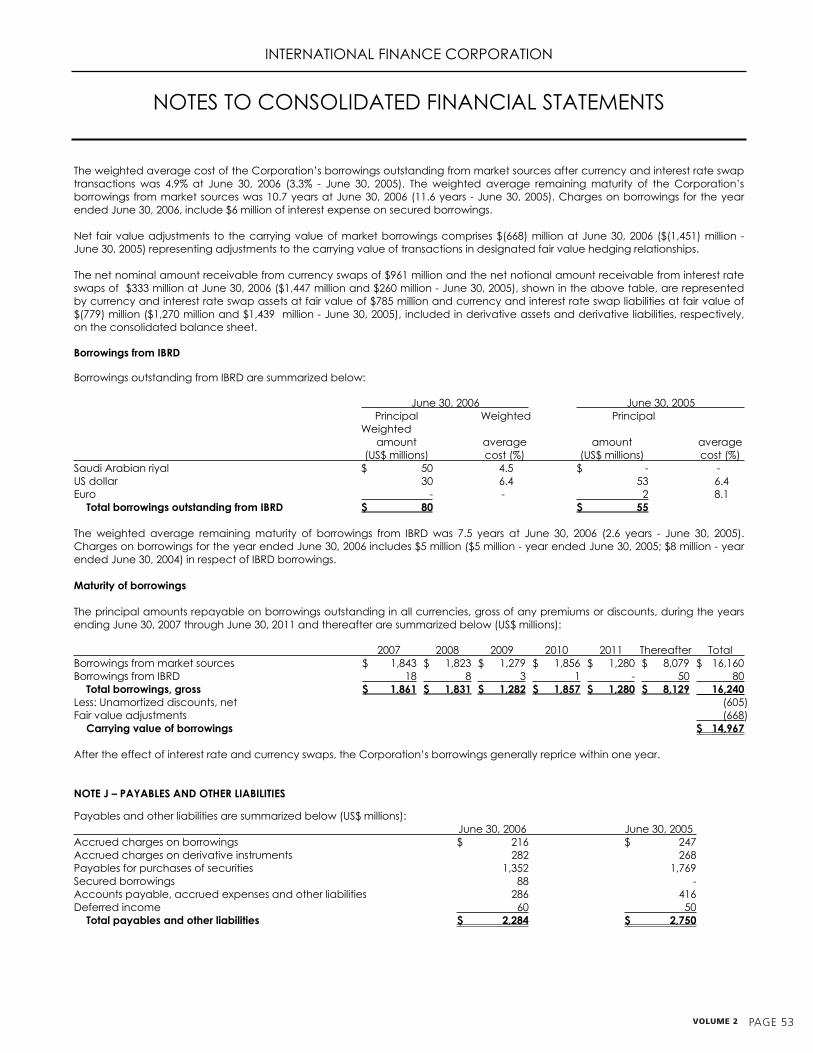
volume 2 PAGE 53
INTERNATIONAL FINANCE CORPORATION
NOTES TO CONSOLIDATED FINANCIAL STATEMENTS
The weighted average cost of the Corporation’s borrowings outstanding from market sources after currency and interest rate swaptransactions was 4.9% at June 30, 2006 (3.3% - June 30, 2005). The weighted average remaining maturity of the Corporation’s borrowings from market sources was 10.7 years at June 30, 2006 (11.6 years - June 30, 2005). Charges on borrowings for the yearended June 30, 2006, include $6 million of interest expense on secured borrowings.
Net fair value adjustments to the carrying value of market borrowings comprises $(668) million at June 30, 2006 ($(1,451) million - June 30, 2005) representing adjustments to the carrying value of transactions in designated fair value hedging relationships.
The net nominal amount receivable from currency swaps of $961 million and the net notional amount receivable from interest rateswaps of $333 million at June 30, 2006 ($1,447 million and $260 million - June 30, 2005), shown in the above table, are represented by currency and interest rate swap assets at fair value of $785 million and currency and interest rate swap liabilities at fair value of $(779) million ($1,270 million and $1,439 million - June 30, 2005), included in derivative assets and derivative liabilities, respectively, on the consolidated balance sheet.
Borrowings from IBRD
Borrowings outstanding from IBRD are summarized below:
June 30, 2006 June 30, 2005 Principal Weighted Principal Weighted amount average amount average (US$ millions) cost (%) (US$ millions) cost (%) Saudi Arabian riyal $ 50 4.5 $ - - US dollar 30 6.4 53 6.4 Euro - - 2 8.1 Total borrowings outstanding from IBRD $ 80 $ 55
The weighted average remaining maturity of borrowings from IBRD was 7.5 years at June 30, 2006 (2.6 years - June 30, 2005). Charges on borrowings for the year ended June 30, 2006 includes $5 million ($5 million - year ended June 30, 2005; $8 million - year ended June 30, 2004) in respect of IBRD borrowings.
Maturity of borrowings
The principal amounts repayable on borrowings outstanding in all currencies, gross of any premiums or discounts, during the yearsending June 30, 2007 through June 30, 2011 and thereafter are summarized below (US$ millions):
2007 2008 2009 2010 2011 Thereafter Total Borrowings from market sources $ 1,843 $ 1,823 $ 1,279 $ 1,856 $ 1,280 $ 8,079 $ 16,160 Borrowings from IBRD 18 8 3 1 - 50 80 Total borrowings, gross $ 1,861 $ 1,831 $ 1,282 $ 1,857 $ 1,280 $ 8,129 16,240Less: Unamortized discounts, net (605) Fair value adjustments (668) Carrying value of borrowings $ 14,967
After the effect of interest rate and currency swaps, the Corporation’s borrowings generally reprice within one year.
NOTE J – PAYABLES AND OTHER LIABILITIES
Payables and other liabilities are summarized below (US$ millions): June 30, 2006 June 30, 2005
Accrued charges on borrowings $ 216 $ 247 Accrued charges on derivative instruments 282 268 Payables for purchases of securities 1,352 1,769 Secured borrowings 88 - Accounts payable, accrued expenses and other liabilities 286 416 Deferred income 60 50 Total payables and other liabilities $ 2,284 $ 2,750
PAGE 54 IFc annual report 2006
INTERNATIONAL FINANCE CORPORATION
NOTES TO CONSOLIDATED FINANCIAL STATEMENTS
NOTE K – CAPITAL TRANSACTIONS
The Corporation's authorized share capital was increased to $2,450 million through two capital increases in 1992. The subscriptionand payment period for shares then allocated ended on August 1, 1999, but the Corporation has agreed to defer the payment date for certain member countries beyond this date. Pursuant to these arrangements, $1 million of subscribed shares remained unpaid at June 30, 2006 ($1 million - June 30, 2005).
During the year ended June 30, 2006, no shares were subscribed and paid by member countries at a par value of $1,000 each (1,615 - year ended June 30, 2005; 720 - year ended June 30, 2004).
Under IFC’s Articles of Agreement, in the event a member withdraws from IFC, the Corporation and the member may agree on the repurchase of the member’s capital stock on such terms as may be appropriate under the circumstances. Such agreement may provide, among other things, for a final settlement of all obligations of the member to IFC. If such an agreement is not made within six months after the member withdraws or such other time as the Corporation and the member may agree, the repurchase price of the member’s capital stock shall be the value thereof shown by the books of IFC on the day when the member withdraws. The repurchase of capital stock is subject to certain conditions, including payments in installments, at such times and in such available currency or currencies as the Corporation reasonably determines, taking into account the financial position of the Corporation. IFC’s Articles of Agreement also provide for the withdrawing member to repay losses on loans and equity investments in excess of reserves provided on the date of withdrawal.
On August 7, 2006, the Board of Directors approved the designation of $230 million of the Corporation's retained earnings for thepurposes of the funding mechanism for technical assistance and advisory services.
On August 7, 2006, the Board of Directors approved the designation of $150 million of the Corporation's retained earnings for thepurposes of grants to IDA.
NOTE L – OTHER INCOME
Other income for the year ended June 30, 2006, predominantly comprises $20 million of fees collected from clients for expenses incurred by the Corporation, included in administrative expenses ($16 million - year ended June 30, 2005; $16 million - year endedJune 30, 2004), $17 million of income from consolidated entities ($5 million - year ended June 30, 2005; $0 million - year ended June 30, 2004) and income under other reimbursable arrangements of $10 million ($13 million - year ended June 30, 2005; $10 million -year ended June 30, 2004).
NOTE M – TECHNICAL ASSISTANCE AND ADVISORY SERVICES
As of June 30, 2005, the Corporation had designated retained earnings in the amount of $350 million for TAAS. As of June 30, 2006, the Board of Directors has approved $280 million of proposed expenditures beginning in the year ended June 30, 2005 through the year ending June 30, 2011. Of the amount approved by the Board of Directors as of June 30, 2006, the Corporation has recognized expenditures of $55 million in the year ended June 30, 2006 and $38 million in the year ended June 30, 2005.
Prior to the year ended June 30, 2005, from time to time, the Board of Directors approved recommendations under which the Corporation contributed to special programs, comprising the Corporation’s Global Small and Medium Enterprise Capacity Building Facility, Technical Assistance Fund and Foreign Investment Advisory Service and other donor-funded operations. During the year ended June 30, 2004, the Corporation contributed a total of $29 million to these facilities.
NOTE N – PERFORMANCE-BASED GRANTS
During the year ended June 30, 2006, the Corporation provided $35 million to IBRD's Global Partnership for Output Based Aid undera pilot phase approved by IFC's Board of Directors in March 2006, which has been recorded as an expense in the year ended June 30, 2006. Also under the pilot phase, IFC's Board of Directors has approved a further $30 million for a future performance-basedsmall and medium-size enterprise initiative for Sub-Saharan Africa. No amounts have been expensed under this initiative in the year ended June 30, 2006.

volume 2 PAGE 55
INTERNATIONAL FINANCE CORPORATION
NOTES TO CONSOLIDATED FINANCIAL STATEMENTS
NOTE O – NET (LOSSES) GAINS ON NON-TRADING FINANCIAL INSTRUMENTS
Net (losses) gains on non-trading financial instruments for the year ended June 30, 2006, June 30, 2005, and June 30, 2004, comprise (US$ millions):
2006 2005 2004 Difference between changes in fair value of derivative instruments designated as a fair value hedge and change in fair value of hedged items attributable to risks being hedged $ (63) $ (48) $ 65 Change in fair value of non-trading derivative instruments not designated as a hedge (65) 112 (54) Amortization of difference between fair value and carrying value of hedged items at July 1, 2000 not designated for hedge accounting under SFAS No. 133 (3) (3) (2) Release from accumulated other comprehensive income of transition gain on cash flow-like hedges - 1 2 Net (losses) gains on non-trading financial instruments $ (131) $ 62 $ 11
Of the total net (losses) gains on non-trading financial instruments, unrealized losses of $182 million (gains of $44 million - year ended June 30, 2005; losses $26 million - year ended June 30, 2004) are attributable to borrowings and related derivatives transactions, unrealized gains of $51 million (gains $15 million - year ended June 30, 2005; gains $36 million - year ended June 30, 2004) areattributable to loans and related derivatives transactions, and unrealized gains of $0 million (gains $3 million - year ended June 30, 2005; gains $1 million - year ended June 30, 2004) are attributable to client risk management activities.
Upon the adoption of SFAS No. 133 on July 1, 2000, the Corporation recorded a gain of $14 million to accumulated other comprehensive income to adjust the book value to fair value of cross-currency interest rate swaps in cash flow-like hedges. TheCorporation elected not to seek hedge accounting for these transactions under SFAS No. 133 and, accordingly, records the cross-currency interest rate swaps at fair value, with the change in fair value included in earnings. The gain recorded in accumulatedother comprehensive income upon adoption of SFAS No. 133 is released into earnings over the remaining original hedge term. Theamounts released for the years ended June 30, 2006 and June 30, 2005 are shown above; the expected release for the year ending June 30, 2007 is $0 million.
NOTE P – DERIVATIVE AND OTHER FINANCIAL INSTRUMENTS
Many of the Corporation’s financial instruments are not actively traded in any market. Accordingly, estimates and present valuecalculations of future cash flows are used to estimate the fair values. Determining future cash flows for fair value estimation is subjective and imprecise, and minor changes in assumptions or methodologies may materially affect the estimated values. The excess or deficit resulting from the difference between the carrying amounts and the fair values presented does not necessarilyreflect the realizable values, since the Corporation generally holds loans, borrowings and other financial instruments to maturity with the aim of realizing their recorded values.
The estimated fair values reflect the interest rate environments as of June 30, 2006 and June 30, 2005. In different interest rate environments, the fair value of the Corporation’s financial assets and liabilities could differ significantly, especially the fair value of certain fixed rate financial instruments. Reasonable comparability of fair values among financial institutions is not likely, because of the wide range of permitted valuation techniques and numerous estimates that must be made in the absence of secondary market prices. This lack of objective pricing standards introduces a greater degree of subjectivity and volatility to these derived or estimated fair values. Therefore, while disclosure of estimated fair values of financial instruments is required, readers are cautioned in using these data for purposes of evaluating the financial condition of the Corporation. The fair values of the individual financial instruments do not represent the fair value of the Corporation taken as a whole.
The methodologies used and key assumptions made to estimate fair values as of June 30, 2006 and June 30, 2005 are summarized below.
Liquid assets - The estimated fair value of time deposits and the trading securities portfolio are based on quoted market prices and the present value of estimated future cash flows using appropriate discount rates.
Derivative instruments - Fair values for covered forwards were derived by using quoted market forward exchange rates. Fair values for other derivative instruments were derived by determining the present value of estimated future cash flows using appropriatediscount rates.
Loans and loan commitments - The Corporation generally has not sold its loans from the portfolio, and there is no comparable secondary market. Fair values for fixed rate loans and loan commitments were determined using a discounted cash flow model based on a discount rate comprising the fixed rate loan spread plus the year-end estimated cost of funds. Since rates on variable

PAGE 56 IFc annual report 2006
INTERNATIONAL FINANCE CORPORATION
NOTES TO CONSOLIDATED FINANCIAL STATEMENTS
rate loans and loan commitments are generally reset on a quarterly or semiannual basis, the carrying value adjusted for credit risk was determined to be the best estimate of fair value. The Corporation also holds options to convert loans into equity of certain of its investee companies. Fair values of these conversion options are based on quoted market prices or other calculated values of theunderlying equity investment.
Equity investments - Fair values of equity investments accounted for at cost less impairment were determined using market prices where available, put option prices, book values or cost, certain of which were discounted based upon management’s estimate of net realizable value. Where market prices were not available or alternate valuation techniques were not practical, cost was determined to be the best estimate of fair value. Fair values of investments in LLPs and certain LLCs, other equity method investments and equity investments held by consolidated VIEs are not included.
Borrowings - Fair values were derived by determining the present value of estimated future cash flows using appropriate discount rates.
Estimated fair values of the Corporation’s financial assets and liabilities and off-balance sheet financial instruments are summarizedbelow (US$ millions). The Corporation’s credit exposure is represented by the estimated fair values of its financial assets.
June 30, 2006 June 30, 2005 Carrying Fair value amount adjustments Fair value Fair value Financial assets Due from banks, time deposits, securities and securities purchased under resale agreements $ 20,594 $ - $ 20,594 $ 22,781
Loans 10,817 441 11,258 10,396 Reserve against losses on loans (898) - (898) (989) Net loans 9,919 441 10,360 9,407
Cost method equity investments 2,325 4,232 6,557 4,749
Derivative assets: Liquid asset portfolio-related 189 - 189 151 Loans-related 123 - 123 72 Borrowings-related 785 - 785 1,270 Client risk management-related 29 - 29 23 Equity-related 2 - 2 - Total derivative assets 1,128 - 1,128 1,516
Nonfinancial assets, including equity method and consolidated investments 4,454 - 4,454 4,184 Total assets $ 38,420 $ 4,673 $ 43,093 $ 42,637
Financial liabilities Securities sold under repurchase agreements and payable for cash collateral received $ 8,805 $ - $ 8,805 $ 9,321 Market and IBRD borrowings outstanding 14,967 - 14,967 15,361
Derivative liabilities: Liquid asset portfolio-related 344 - 344 733 Loans-related 135 - 135 139 Borrowings-related 779 - 779 1,439 Client risk management-related 28 - 28 21 Equity-related 2 - 2 - Total derivative liabilities 1,288 - 1,288 2,332
Nonfinancial liabilities 2,284 - 2,284 2,750 Total liabilities $ 27,344 $ - $ 27,334 $ 29,764
June 30, 2006 June 30, 2005 Carrying Fair value amount adjustments Fair value Fair value Off-balance sheet financial instruments Loan commitments $ 5,550 $ 14 $ 5,564 $ 4,831
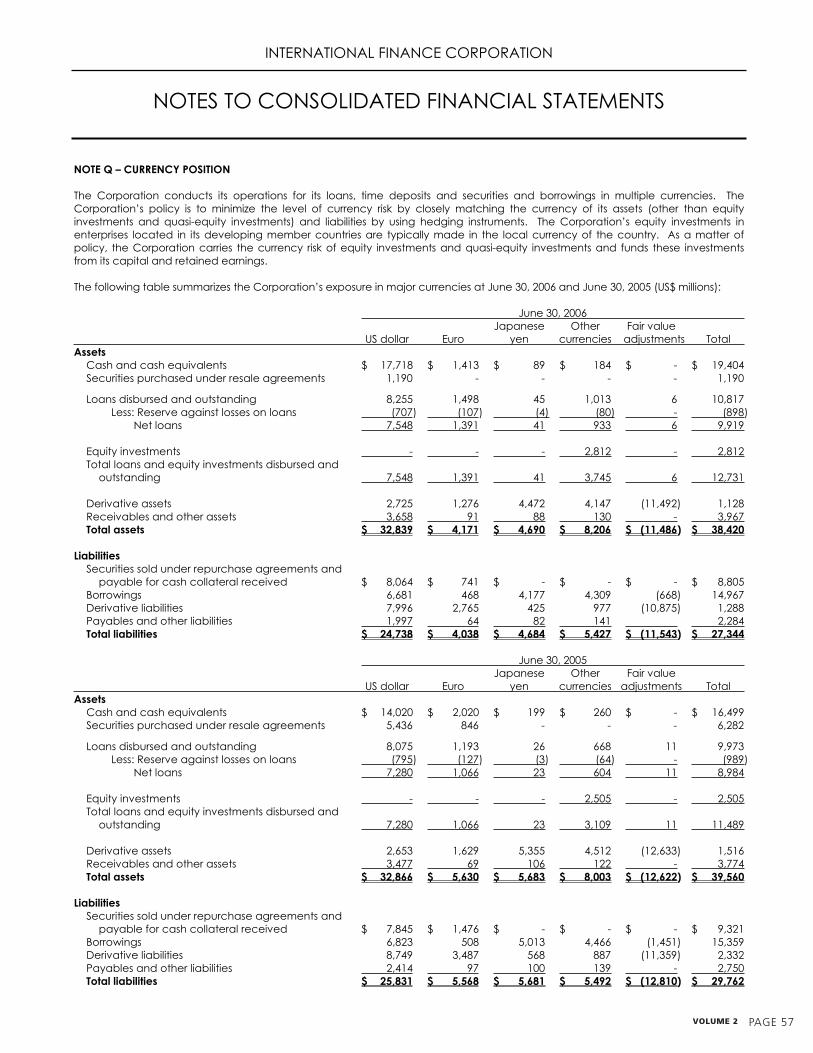
volume 2 PAGE 57
INTERNATIONAL FINANCE CORPORATION
NOTES TO CONSOLIDATED FINANCIAL STATEMENTS
NOTE Q – CURRENCY POSITION
The Corporation conducts its operations for its loans, time deposits and securities and borrowings in multiple currencies. TheCorporation’s policy is to minimize the level of currency risk by closely matching the currency of its assets (other than equityinvestments and quasi-equity investments) and liabilities by using hedging instruments. The Corporation’s equity investments inenterprises located in its developing member countries are typically made in the local currency of the country. As a matter ofpolicy, the Corporation carries the currency risk of equity investments and quasi-equity investments and funds these investmentsfrom its capital and retained earnings.
The following table summarizes the Corporation’s exposure in major currencies at June 30, 2006 and June 30, 2005 (US$ millions):
June 30, 2006 Japanese Other Fair value US dollar Euro yen currencies adjustments Total Assets Cash and cash equivalents $ 17,718 $ 1,413 $ 89 $ 184 $ - $ 19,404 Securities purchased under resale agreements 1,190 - - - - 1,190
Loans disbursed and outstanding 8,255 1,498 45 1,013 6 10,817 Less: Reserve against losses on loans (707) (107) (4) (80) - (898)
Net loans 7,548 1,391 41 933 6 9,919
Equity investments - - - 2,812 - 2,812 Total loans and equity investments disbursed and outstanding 7,548 1,391 41 3,745 6 12,731
Derivative assets 2,725 1,276 4,472 4,147 (11,492) 1,128 Receivables and other assets 3,658 91 88 130 - 3,967 Total assets $ 32,839 $ 4,171 $ 4,690 $ 8,206 $ (11,486) $ 38,420
Liabilities Securities sold under repurchase agreements and payable for cash collateral received $ 8,064 $ 741 $ - $ - $ - $ 8,805 Borrowings 6,681 468 4,177 4,309 (668) 14,967 Derivative liabilities 7,996 2,765 425 977 (10,875) 1,288 Payables and other liabilities 1,997 64 82 141 2,284 Total liabilities $ 24,738 $ 4,038 $ 4,684 $ 5,427 $ (11,543) $ 27,344
June 30, 2005 Japanese Other Fair value US dollar Euro yen currencies adjustments Total Assets Cash and cash equivalents $ 14,020 $ 2,020 $ 199 $ 260 $ - $ 16,499 Securities purchased under resale agreements 5,436 846 - - - 6,282
Loans disbursed and outstanding 8,075 1,193 26 668 11 9,973 Less: Reserve against losses on loans (795) (127) (3) (64) - (989)
Net loans 7,280 1,066 23 604 11 8,984
Equity investments - - - 2,505 - 2,505 Total loans and equity investments disbursed and outstanding 7,280 1,066 23 3,109 11 11,489
Derivative assets 2,653 1,629 5,355 4,512 (12,633) 1,516 Receivables and other assets 3,477 69 106 122 - 3,774 Total assets $ 32,866 $ 5,630 $ 5,683 $ 8,003 $ (12,622) $ 39,560
Liabilities Securities sold under repurchase agreements and payable for cash collateral received $ 7,845 $ 1,476 $ - $ - $ - $ 9,321 Borrowings 6,823 508 5,013 4,466 (1,451) 15,359 Derivative liabilities 8,749 3,487 568 887 (11,359) 2,332 Payables and other liabilities 2,414 97 100 139 - 2,750 Total liabilities $ 25,831 $ 5,568 $ 5,681 $ 5,492 $ (12,810) $ 29,762
INTERNATIONAL FINANCE CORPORATION
NOTES TO CONSOLIDATED FINANCIAL STATEMENTS
rate loans and loan commitments are generally reset on a quarterly or semiannual basis, the carrying value adjusted for credit risk was determined to be the best estimate of fair value. The Corporation also holds options to convert loans into equity of certain of its investee companies. Fair values of these conversion options are based on quoted market prices or other calculated values of theunderlying equity investment.
Equity investments - Fair values of equity investments accounted for at cost less impairment were determined using market prices where available, put option prices, book values or cost, certain of which were discounted based upon management’s estimate of net realizable value. Where market prices were not available or alternate valuation techniques were not practical, cost was determined to be the best estimate of fair value. Fair values of investments in LLPs and certain LLCs, other equity method investments and equity investments held by consolidated VIEs are not included.
Borrowings - Fair values were derived by determining the present value of estimated future cash flows using appropriate discount rates.
Estimated fair values of the Corporation’s financial assets and liabilities and off-balance sheet financial instruments are summarizedbelow (US$ millions). The Corporation’s credit exposure is represented by the estimated fair values of its financial assets.
June 30, 2006 June 30, 2005 Carrying Fair value amount adjustments Fair value Fair value Financial assets Due from banks, time deposits, securities and securities purchased under resale agreements $ 20,594 $ - $ 20,594 $ 22,781
Loans 10,817 441 11,258 10,396 Reserve against losses on loans (898) - (898) (989) Net loans 9,919 441 10,360 9,407
Cost method equity investments 2,325 4,232 6,557 4,749
Derivative assets: Liquid asset portfolio-related 189 - 189 151 Loans-related 123 - 123 72 Borrowings-related 785 - 785 1,270 Client risk management-related 29 - 29 23 Equity-related 2 - 2 - Total derivative assets 1,128 - 1,128 1,516
Nonfinancial assets, including equity method and consolidated investments 4,454 - 4,454 4,184 Total assets $ 38,420 $ 4,673 $ 43,093 $ 42,637
Financial liabilities Securities sold under repurchase agreements and payable for cash collateral received $ 8,805 $ - $ 8,805 $ 9,321 Market and IBRD borrowings outstanding 14,967 - 14,967 15,361
Derivative liabilities: Liquid asset portfolio-related 344 - 344 733 Loans-related 135 - 135 139 Borrowings-related 779 - 779 1,439 Client risk management-related 28 - 28 21 Equity-related 2 - 2 - Total derivative liabilities 1,288 - 1,288 2,332
Nonfinancial liabilities 2,284 - 2,284 2,750 Total liabilities $ 27,344 $ - $ 27,334 $ 29,764
June 30, 2006 June 30, 2005 Carrying Fair value amount adjustments Fair value Fair value Off-balance sheet financial instruments Loan commitments $ 5,550 $ 14 $ 5,564 $ 4,831

PAGE 58 IFc annual report 2006
INTERNATIONAL FINANCE CORPORATION
NOTES TO CONSOLIDATED FINANCIAL STATEMENTS
NOTE R – SEGMENT REPORTING
For management purposes, the Corporation’s business comprises two segments: client services and treasury services. The client services segment consists primarily of lending and equity investment activities. Operationally, the treasury services segment consists of the borrowing, liquid asset management, asset and liability management and client risk management activities. Consistent withinternal reporting, net income (expense) from asset and liability management and client risk management activities in support ofclient services are allocated to client services segment.
The assessment of segment performance by senior management includes net income for each segment, return on assets, and return on capital employed. The Corporation’s management reporting system and policies are used to determine revenues and expenses attributable to each segment. Consistent with internal reporting, administrative expenses are allocated to each segment based largely upon personnel costs and segment head counts. Transactions between segments are immaterial and, thus, are not a factor in reconciling to the consolidated data.
The accounting policies of the Corporation’s segments are, in all material respects, consistent with those described in note A,“Summary of Significant Accounting and Related Policies.”
An analysis of the Corporation’s major components of income and expense by business segment for the years ended June 30, 2006, June 30, 2005, and June 30, 2004 is given below (US$ millions):
2006 2005 2004 Client Treasury Client Treasury Client Treasury services services Total services services Total services services Total Interest and financial fees from loans $ 807 $ - $ 807 $ 660 $ - $ 660 $ 518 $ - $ 518 Income from liquid asset trading activities - 444 444 - 358 358 - 177 177 Charges on borrowings (343) (260) (603) (151) (158) (309) (41) (100) (141) Income from equity investments 1,228 - 1,228 1,365 - 1,365 658 - 658 (Provision for) release of provision for losses on loans and guarantees (15) - (15) 261 - 261 103 - 103 Service fees 52 - 52 41 - 41 41 - 41Administrative expenses (430) (6) (436) (397) (6) (403) (354) (6) (360) Other income (expense) 22 - 22 18 - 18 (14) - (14)Income before expenditures for TAAS, PBG and net (losses) gains on non-trading financial instruments 1,321 178 1,499 1,797 194 1,991 911 71 982Expenditures for TAAS (55) - (55) (38) - (38) - - - Expenditures for PBG (35) - (35) - - - - - - Net (losses) gains on non- trading financial instruments 49 (180) (131) 18 44 62 37 (26) 11Net income $ 1,280 $ (2) $ 1,278 $ 1,777 $ 238 $ 2,015 $ 948 $ 45 $ 993
Geographical segment data in respect of client services are disclosed in Note C, and are not relevant in respect of treasury services.
NOTE S – PENSION AND OTHER POSTRETIREMENT BENEFITS
The Corporation, IBRD, and MIGA participate in a defined benefit SRP, a Retired Staff Benefits Plan (RSBP), and a Post-Employment Benefits Plan (PEBP) that cover substantially all of their staff members.
The SRP provides regular pension benefits and includes a cash balance plan. The RSBP provides certain health and life insurancebenefits to eligible retirees. The PEBP provides certain pension benefits administered outside the SRP.
The Corporation uses a June 30 measurement date for its pension and other postretirement benefit plans.

volume 2 PAGE 5�
INTERNATIONAL FINANCE CORPORATION
NOTES TO CONSOLIDATED FINANCIAL STATEMENTS
The amounts presented below reflect the Corporation’s respective share of the costs, assets, and liabilities of the plans.
All costs, assets, and liabilities associated with these plans are allocated between the Corporation, IBRD, and MIGA based upontheir employees’ respective contributions to the plans. Costs allocated to IBRD are then shared between IBRD and IDA based on an agreed cost-sharing ratio. The Corporation, IDA, and MIGA reimburse IBRD for their proportionate share of any contributions made to these plans by IBRD. Contributions to these plans are calculated as a percentage of salary.
The following table summarizes the benefit costs associated with the SRP, RSBP, and PEBP allocated to the Corporation for the fiscal years ended June 30, 2006, June 30, 2005, and June 30, 2004 (US$ millions):
SRP RSBP PEBP 2006 2005 2004 2006 2005 2004 2006 2005 2004 Benefit cost Service cost $ 59 $ 48 $ 43 $ 9 $ 6 $ 5 $ 2 $ 2 $ 2 Interest cost 101 100 84 8 7 5 2 1 1 Expected return on plan assets (157) (145) (122) (10) (8) (6) - - - Amortization of prior service cost 1 3 3 - - - - - - Amortization of unrecog- nized net loss (gain) 9 - 3 4 2 2 - - -Net periodic pension cost $ 13 $ 6 $ 11 $ 11 $ 7 $ 6 $ 4 $ 3 $ 3
The expenses for the SRP, RSBP, and PEBP are included in expense from pension and other postretirement benefit plans.
For the fiscal years ended June 30, 2006, June 30, 2005, and June 30, 2004, expenses for these plans of $28 million, $16 million and $20 million, respectively, were allocated to IFC. The Corporation’s net expense for these plans reported in the consolidated income statement was $28 million, $14 million, and $19 million for the fiscal years ended June 30, 2006, June 30, 2005, and June 30, 2004, respectively.
The following table summarizes the projected benefit obligations, fair value of plan assets, and funded status associated with the SRP, RSBP, and PEBP for the Corporation for the fiscal years ended June 30, 2006, June 30, 2005, and June 30, 2004 (US$ millions).Since the assets for the PEBP are not held in an irrevocable trust separate from the assets of IBRD, they do not qualify for off-balance sheet accounting and are therefore included in IBRD's investment portfolio. IFC has recognized a receivable (prepaid asset) from IBRD and a payable (liability) to IBRD equal to the amount required to support the plan. The assets of the PEBP are invested in fixed income instruments.
SRP RSBP PEBP 2006 2005 2004 2006 2005 2004 2006 2005 2004 Projected Benefit Obligation Beginning of year $ 1,631 $ 1,392 $ 1,269 $ 162 $ 103 $ 91 $ 23 $ 15 $ 12 Service cost 59 48 43 9 6 5 2 2 2 Interest cost 101 100 84 8 7 5 2 1 1 Employee contributions 15 14 13 1 2 1 - - - Benefits paid (51) (68) (56) (4) (6) (5) (2) (2) (1) Actuarial (gain) loss (403) 145 39 (15) 50 6 9 7 1
End of year 1,352 1,631 1,392 161 162 103 34 23 15
Fair value of plan assets Beginning of year $ 1,670 $ 1,592 $ 1,328 $ 118 $ 99 $ 80 $ - $ - $ - Employee contributions 15 14 13 1 2 1 - - - Actual return on assets 205 88 284 11 15 16 - - - Employer contributions 53 44 23 16 8 7 - - - Benefits paid (51) (68) (56) (4) (6) (5) - - -
End of year 1,892 1,670 1,592 142 118 99 - - -
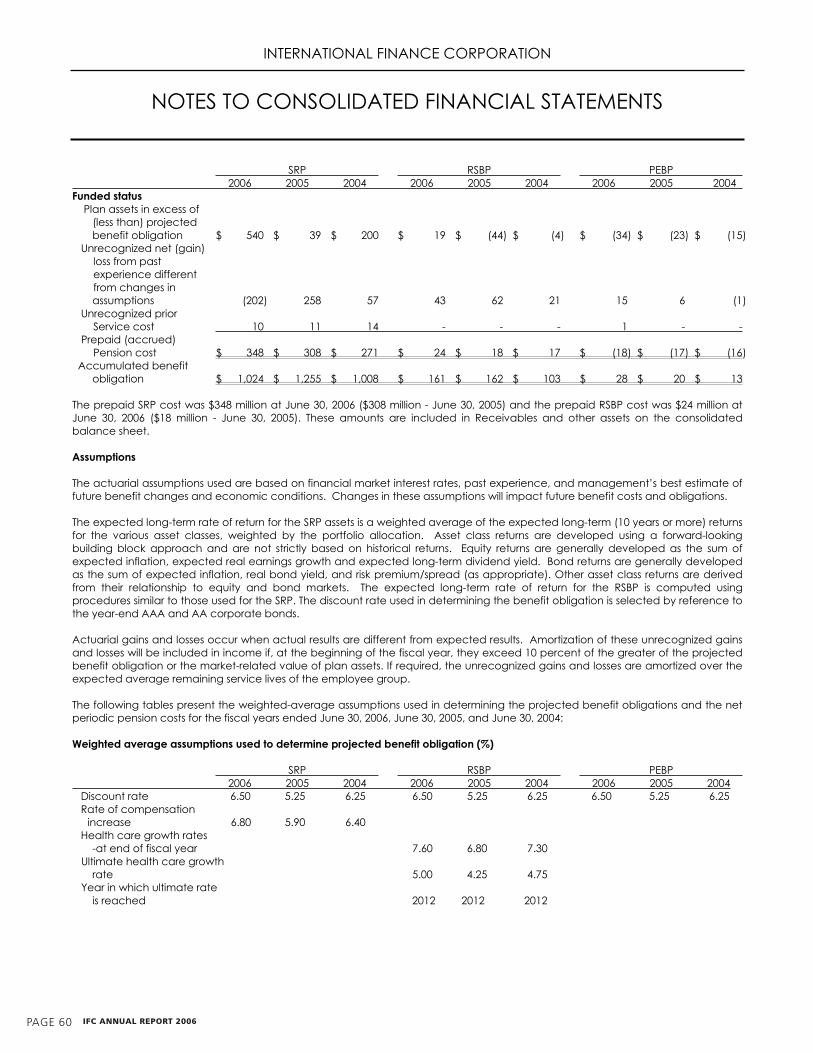
PAGE 60 IFc annual report 2006
INTERNATIONAL FINANCE CORPORATION
NOTES TO CONSOLIDATED FINANCIAL STATEMENTS
SRP RSBP PEBP 2006 2005 2004 2006 2005 2004 2006 2005 2004 Funded status Plan assets in excess of (less than) projected benefit obligation $ 540 $ 39 $ 200 $ 19 $ (44) $ (4) $ (34) $ (23) $ (15) Unrecognized net (gain) loss from past experience different from changes in assumptions (202) 258 57 43 62 21 15 6 (1) Unrecognized prior Service cost 10 11 14 - - - 1 - - Prepaid (accrued) Pension cost $ 348 $ 308 $ 271 $ 24 $ 18 $ 17 $ (18) $ (17) $ (16) Accumulated benefit obligation $ 1,024 $ 1,255 $ 1,008 $ 161 $ 162 $ 103 $ 28 $ 20 $ 13
The prepaid SRP cost was $348 million at June 30, 2006 ($308 million - June 30, 2005) and the prepaid RSBP cost was $24 million at June 30, 2006 ($18 million - June 30, 2005). These amounts are included in Receivables and other assets on the consolidated balance sheet.
Assumptions
The actuarial assumptions used are based on financial market interest rates, past experience, and management’s best estimate offuture benefit changes and economic conditions. Changes in these assumptions will impact future benefit costs and obligations.
The expected long-term rate of return for the SRP assets is a weighted average of the expected long-term (10 years or more) returns for the various asset classes, weighted by the portfolio allocation. Asset class returns are developed using a forward-lookingbuilding block approach and are not strictly based on historical returns. Equity returns are generally developed as the sum ofexpected inflation, expected real earnings growth and expected long-term dividend yield. Bond returns are generally developed as the sum of expected inflation, real bond yield, and risk premium/spread (as appropriate). Other asset class returns are derived from their relationship to equity and bond markets. The expected long-term rate of return for the RSBP is computed using procedures similar to those used for the SRP. The discount rate used in determining the benefit obligation is selected by reference to the year-end AAA and AA corporate bonds.
Actuarial gains and losses occur when actual results are different from expected results. Amortization of these unrecognized gains and losses will be included in income if, at the beginning of the fiscal year, they exceed 10 percent of the greater of the projected benefit obligation or the market-related value of plan assets. If required, the unrecognized gains and losses are amortized over the expected average remaining service lives of the employee group.
The following tables present the weighted-average assumptions used in determining the projected benefit obligations and the netperiodic pension costs for the fiscal years ended June 30, 2006, June 30, 2005, and June 30, 2004:
Weighted average assumptions used to determine projected benefit obligation (%)
SRP RSBP PEBP 2006 2005 2004 2006 2005 2004 2006 2005 2004 Discount rate 6.50 5.25 6.25 6.50 5.25 6.25 6.50 5.25 6.25 Rate of compensation increase 6.80 5.90 6.40 Health care growth rates -at end of fiscal year 7.60 6.80 7.30 Ultimate health care growth rate 5.00 4.25 4.75 Year in which ultimate rate is reached 2012 2012 2012
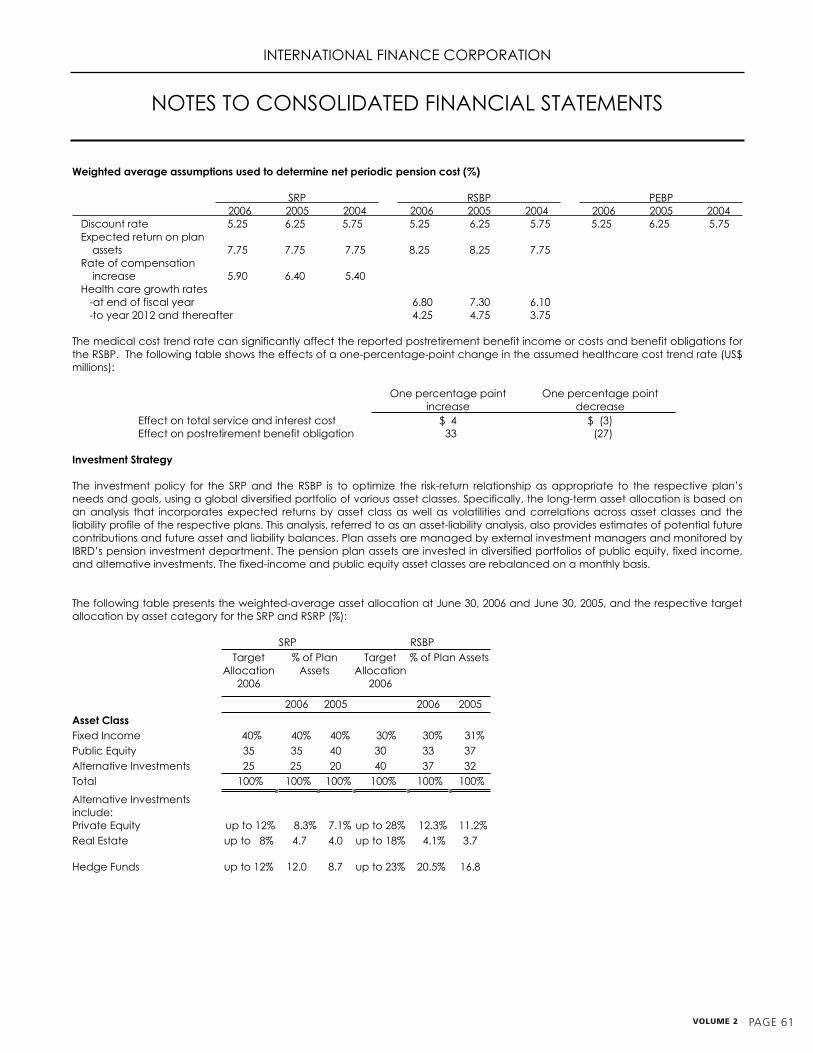
volume 2 PAGE 61
INTERNATIONAL FINANCE CORPORATION
NOTES TO CONSOLIDATED FINANCIAL STATEMENTS
Weighted average assumptions used to determine net periodic pension cost (%)
SRP RSBP PEBP 2006 2005 2004 2006 2005 2004 2006 2005 2004 Discount rate 5.25 6.25 5.75 5.25 6.25 5.75 5.25 6.25 5.75 Expected return on plan assets 7.75 7.75 7.75 8.25 8.25 7.75 Rate of compensation increase 5.90 6.40 5.40 Health care growth rates -at end of fiscal year 6.80 7.30 6.10 -to year 2012 and thereafter 4.25 4.75 3.75
The medical cost trend rate can significantly affect the reported postretirement benefit income or costs and benefit obligations for the RSBP. The following table shows the effects of a one-percentage-point change in the assumed healthcare cost trend rate (US$millions):
One percentage point increase
One percentage point decrease
Effect on total service and interest cost $ 4 $ (3) Effect on postretirement benefit obligation 33 (27)
Investment Strategy
The investment policy for the SRP and the RSBP is to optimize the risk-return relationship as appropriate to the respective plan’sneeds and goals, using a global diversified portfolio of various asset classes. Specifically, the long-term asset allocation is based on an analysis that incorporates expected returns by asset class as well as volatilities and correlations across asset classes and the liability profile of the respective plans. This analysis, referred to as an asset-liability analysis, also provides estimates of potential future contributions and future asset and liability balances. Plan assets are managed by external investment managers and monitored byIBRD’s pension investment department. The pension plan assets are invested in diversified portfolios of public equity, fixed income, and alternative investments. The fixed-income and public equity asset classes are rebalanced on a monthly basis.
The following table presents the weighted-average asset allocation at June 30, 2006 and June 30, 2005, and the respective targetallocation by asset category for the SRP and RSRP (%):
SRP RSBP Target
Allocation2006
% of Plan Assets
Target Allocation
2006
% of Plan Assets
2006 2005 2006 2005
Asset Class Fixed Income 40% 40% 40% 30% 30% 31% Public Equity 35 35 40 30 33 37 Alternative Investments 25 25 20 40 37 32 Total 100% 100% 100% 100% 100% 100%
Alternative Investments include:
Private Equity up to 12% 8.3% 7.1% up to 28% 12.3% 11.2%Real Estate up to 8% 4.7 4.0 up to 18% 4.1% 3.7
Hedge Funds up to 12% 12.0 8.7 up to 23% 20.5% 16.8
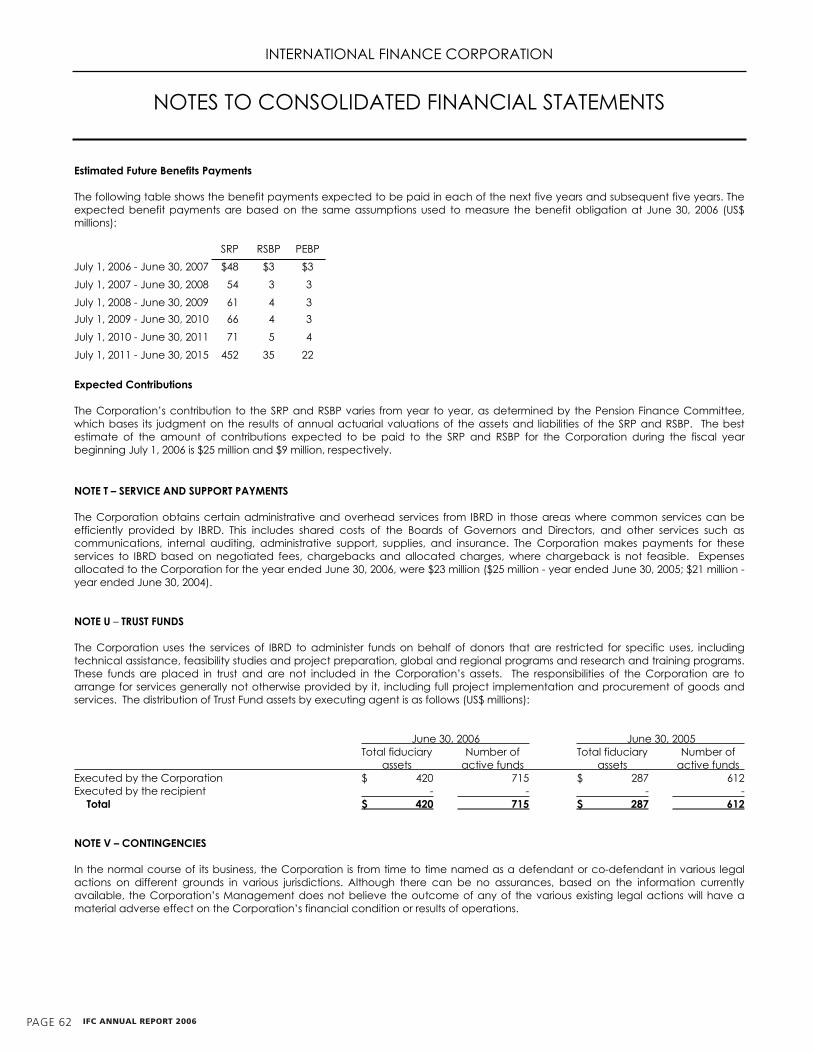
PAGE 62 IFc annual report 2006
INTERNATIONAL FINANCE CORPORATION
NOTES TO CONSOLIDATED FINANCIAL STATEMENTS
Estimated Future Benefits Payments
The following table shows the benefit payments expected to be paid in each of the next five years and subsequent five years. Theexpected benefit payments are based on the same assumptions used to measure the benefit obligation at June 30, 2006 (US$ millions):
SRP RSBP PEBP
July 1, 2006 - June 30, 2007 $48 $3 $3
July 1, 2007 - June 30, 2008 54 3 3
July 1, 2008 - June 30, 2009 61 4 3
July 1, 2009 - June 30, 2010 66 4 3
July 1, 2010 - June 30, 2011 71 5 4
July 1, 2011 - June 30, 2015 452 35 22
Expected Contributions
The Corporation’s contribution to the SRP and RSBP varies from year to year, as determined by the Pension Finance Committee, which bases its judgment on the results of annual actuarial valuations of the assets and liabilities of the SRP and RSBP. The best estimate of the amount of contributions expected to be paid to the SRP and RSBP for the Corporation during the fiscal year beginning July 1, 2006 is $25 million and $9 million, respectively.
NOTE T – SERVICE AND SUPPORT PAYMENTS
The Corporation obtains certain administrative and overhead services from IBRD in those areas where common services can be efficiently provided by IBRD. This includes shared costs of the Boards of Governors and Directors, and other services such as communications, internal auditing, administrative support, supplies, and insurance. The Corporation makes payments for these services to IBRD based on negotiated fees, chargebacks and allocated charges, where chargeback is not feasible. Expenses allocated to the Corporation for the year ended June 30, 2006, were $23 million ($25 million - year ended June 30, 2005; $21 million - year ended June 30, 2004).
NOTE U – TRUST FUNDS
The Corporation uses the services of IBRD to administer funds on behalf of donors that are restricted for specific uses, includingtechnical assistance, feasibility studies and project preparation, global and regional programs and research and training programs. These funds are placed in trust and are not included in the Corporation’s assets. The responsibilities of the Corporation are to arrange for services generally not otherwise provided by it, including full project implementation and procurement of goods andservices. The distribution of Trust Fund assets by executing agent is as follows (US$ millions):
June 30, 2006 June 30, 2005 Total fiduciary Number of Total fiduciary Number of assets active funds assets active funds Executed by the Corporation $ 420 715 $ 287 612 Executed by the recipient - - - - Total $ 420 715 $ 287 612
NOTE V – CONTINGENCIES
In the normal course of its business, the Corporation is from time to time named as a defendant or co-defendant in various legalactions on different grounds in various jurisdictions. Although there can be no assurances, based on the information currently available, the Corporation’s Management does not believe the outcome of any of the various existing legal actions will have a material adverse effect on the Corporation’s financial condition or results of operations.
volume 2 PAGE 63
INTERNATIONAL FINANCE CORPORATION
NOTES TO CONSOLIDATED FINANCIAL STATEMENTS
NOTE W – VARIABLE INTEREST ENTITIES AND OTHER CONSOLIDATED INVESTMENTS
An entity is subject to FIN 46R and is called a variable interest entity (VIE) if it lacks: (1) equity that is sufficient to permit the entity to finance its activities without additional subordinated financial support from other parties; or (2) equity investors who have decision-making rights about the entity’s operations or who do not absorb the expected losses or receive the expected returns of the entity proportionally to their voting rights.
A VIE is consolidated by its primary beneficiary, which is the party involved with the VIE that absorbs a majority of the expected losses or receives a majority of the expected residual returns or both. The primary beneficiary is required to initially measure the assets, liabilities and noncontrolling interests of the VIE at their carrying amounts at the date on which it first became the primarybeneficiary. Because certain VIEs were created prior to the issuance of FIN 46R, it may not be practicable to determine the carrying amounts of the assets, liabilities and noncontrolling interests at the initial date, and in such cases, the primary beneficiary must measure the assets, liabilities and noncontrolling interests at their fair values on the date FIN 46R is first applied. The primary beneficiary is also required to disclose information about the nature, purpose, size, and activities of the VIE, and collateral and recourse creditors may have against the VIE.
An enterprise may hold significant variable interests in VIEs, which are not consolidated because the enterprise is not the primary beneficiary. In such cases, the enterprise is required to disclose information about its involvement with and exposure to the VIE, and about the nature, purpose, size, and activities of the VIE.
An enterprise is not required to apply FIN 46R to certain entities if, after making an exhaustive effort, it is unable to obtain the information necessary to: (1) determine whether the entity is a VIE; (2) determine if the enterprise is the primary beneficiary of the possible VIE; or (3) perform the accounting required to consolidate a possible VIE. In such cases, the enterprise is required to disclose the number of entities to which FIN 46R is not being applied, why the information required to apply FIN 46R is not available, the nature, purpose and activities of the entities to which FIN 46R is not being applied, and the enterprise’s maximum exposure to the entities to which FIN 46R is not being applied.
The Corporation has identified seven VIEs in which the Corporation is deemed to be the primary beneficiary at June 30, 2006.
Four of the VIEs have been consolidated into IFC’s financial statements as of June 30, 2006. One consolidated VIE is in the Finance and Insurance sector in the Latin America and Caribbean region. Three consolidated VIEs are in the Collective Investment Vehicles sector in the Latin America and Caribbean region.
The remaining three VIEs in which the Corporation is deemed to be the primary beneficiary have not been consolidated into IFC’sfinancial statements, as they are significantly impaired and information required to apply the provisions of FIN 46R is not available. IFC’s net investment in these three entities totals $2 million, virtually all in the primary metals sector in the Asia region. Based on the most recent financial data available, total net assets of the three entities is $12 million.
As a result of the consolidation of the four investments described above, IFC’s consolidated balance sheet at June 30, 2006 includes additional assets of $6 million in equity investments ($0 million - June 30, 2005), $3 million in receivables and other assets ($131 million - June 30, 2005), and additional liabilities of $2 million in payables and other liabilities ($131 million - June 30, 2005).
Other income for the year ended June 30, 2006 includes $17 million of income from consolidated entities ($5 million - year endedJune 30, 2005; $0 million - year ended June 30, 2004) and other expense includes $10 million of expenses from consolidated entities ($5 million - year ended June 30, 2005; $0 million - year ended June 30, 2004).

PAGE 64 IFc annual report 2006
INTERNATIONAL FINANCE CORPORATION
NOTES TO CONSOLIDATED FINANCIAL STATEMENTS
The Corporation has identified fourteen investments in VIEs in which the Corporation is not the primary beneficiary but in which it is deemed to hold significant variable interests. The Corporation’s total investment in and maximum exposure to loss to these entities, comprising both disbursed amounts and amounts committed but not yet disbursed balances, was $108 million at June 30, 2006. The regional and sectoral analysis of the Corporation’s investments in these VIEs is as follows (US$ millions): June 30, 2006 Equity Loans investments Total Latin America and Caribbean $ 23 $ 21 $ 44 Asia 10 11 21 Europe and Central Asia 7 3 10 Sub-Saharan Africa - 5 5 Middle East and North Africa 2 - 2 Other - 26 26 Total VIE investments $ 42 $ 66 $ 108
June 30, 2006 Equity Loans investments Total Collective investment vehicles $ - $ 51 $ 51 Finance and insurance 15 12 27 Agriculture and forestry 10 - 10 Food and beverages 8 - 8 Accommodation and tourism services 7 - 7 Oil, gas and mining - 3 3 Textiles, apparel and leather 2 - 2
Total VIE investments $ 42 $ 66 $ 108
Based on the most recent available data from these VIEs, the assets of these VIEs totaled $602 million.
NOTE X – MATERIAL TRANSACTION
On December 21, 2005, the Corporation entered into an agreement to sell its shares in Banca Comerciala Romana S.A. (BCR). The agreement includes provisions that may result in the termination of the agreement prior to closing. In addition, IFC has enteredinto an agreement which includes certain payment covenants and potential indemnifications with respect to certain conditions and valuations in case such conditions and valuations become applicable. The transaction did not close by June 30, 2006. Shouldthe transaction close in accordance with the agreement, IFC would expect to recognize a significant capital gain in the year ending June 30, 2007, in the range of $669 million to $841 million (based on June 30, 2006 exchange rates).

Section Start
Table of Contents xx
Table of Contents xx
Table of Contents xx
Table of Contents xx
Table of Contents xx
Table of Contents xx
Table of Contents xx
volume 2 PAGE 65
Project Commitments
project Description (all amounts in U.S. dollars)
environmental and social Category
IFC
loan
IFC
equity
IFC
Guarantee
Global trade Finance program
risk management
products
syndications
total
structured Finance
mobilization
Sub-Saharan afriCa
REGIoNALCapital alliance private equity II, limited will invest in businesses in West Africa by partnering with strong management teams and international investors.
FI — �.62 — — — — 9.62
Coca-Cola sabco pty., ltd. will expand and upgrade its bottling operations in East Africa.
B 20.00 — — — — — 20.00
la Fayette Investissements* will provide equity, loans, and technical assistance to microfinance institutions in frontier countries in the region.
FI — 2.18 — — — — 2.18
pan african Investment partners/pan Commonwealth african partners, a private equity fund, will target regionally expanding companies with proven management and established revenue streams.
FI — 5.00 — — — — 5.00
standard Bank Group limited will expand its operations in the region to enhance its competitive position and bring best practices and better access to high quality banking services and products.
FI 75.00 — — — — — 75.00
Veolia Water amI* will operate and maintain water treatment plants and water distribution services in the region.
B — 31.34 44.68 — — — 76.02
Sub-Saharan africa 65
East asia and the Pacific 68
South asia 72
Europe and Central asia 74
Latin america and the Caribbean 79
Middle East and north africa 85
Global 87
This table includes projects signed and processed during Fy06. all amounts are given in U.S. dollars, regardless of the currency of the transaction.
For the purposes of the table, “iFC Loan” includes loan-type quasi-equity investments; “iFC equity” includes equity-type quasi-equity investments.
Under the Global Trade Finance Program, iFC provides guarantee coverage of bank risk in emerging markets, where confirming banks need risk mitigation to support their export clients because of limited capacity for country and bank exposure.
Structured finance mobilization is a feature of selected guarantee, loan, and equity transactions, but it is not included in the total committed for these projects. The mobilization number covers the full amount at the project commitment date.
Projects marked with an asterisk(*) have been committed and/or have the option to disburse in a non–U.S. dollar currency.
note on environmental and social Category:Projects are assigned a category of a, B, or C, in descending order of environmental and social sensitivity, or Fi, in the case of financial institutions that on-lend to clients who may present environmental and social concerns.Category a: Projects expected to have significant adverse social and/or environmental impacts that are diverse, irreversible,
or unprecedented.Category B: Projects expected to have limited adverse social and/or environmental impacts that can be readily addressed
through mitigation measures.Category C: Projects expected to have minimal or no adverse impacts, including certain financial intermediary projects.Category FI: investments in financial intermediaries that themselves have no adverse social and/or environmental impacts but
may finance subprojects with potential impacts.
INTERNATIONAL FINANCE CORPORATION
NOTES TO CONSOLIDATED FINANCIAL STATEMENTS
The Corporation has identified fourteen investments in VIEs in which the Corporation is not the primary beneficiary but in which it is deemed to hold significant variable interests. The Corporation’s total investment in and maximum exposure to loss to these entities, comprising both disbursed amounts and amounts committed but not yet disbursed balances, was $108 million at June 30, 2006. The regional and sectoral analysis of the Corporation’s investments in these VIEs is as follows (US$ millions): June 30, 2006 Equity Loans investments Total Latin America and Caribbean $ 23 $ 21 $ 44 Asia 10 11 21 Europe and Central Asia 7 3 10 Sub-Saharan Africa - 5 5 Middle East and North Africa 2 - 2 Other - 26 26 Total VIE investments $ 42 $ 66 $ 108
June 30, 2006 Equity Loans investments Total Collective investment vehicles $ - $ 51 $ 51 Finance and insurance 15 12 27 Agriculture and forestry 10 - 10 Food and beverages 8 - 8 Accommodation and tourism services 7 - 7 Oil, gas and mining - 3 3 Textiles, apparel and leather 2 - 2
Total VIE investments $ 42 $ 66 $ 108
Based on the most recent available data from these VIEs, the assets of these VIEs totaled $602 million.
NOTE X – MATERIAL TRANSACTION
On December 21, 2005, the Corporation entered into an agreement to sell its shares in Banca Comerciala Romana S.A. (BCR). The agreement includes provisions that may result in the termination of the agreement prior to closing. In addition, IFC has enteredinto an agreement which includes certain payment covenants and potential indemnifications with respect to certain conditions and valuations in case such conditions and valuations become applicable. The transaction did not close by June 30, 2006. Shouldthe transaction close in accordance with the agreement, IFC would expect to recognize a significant capital gain in the year ending June 30, 2007, in the range of $669 million to $841 million (based on June 30, 2006 exchange rates).
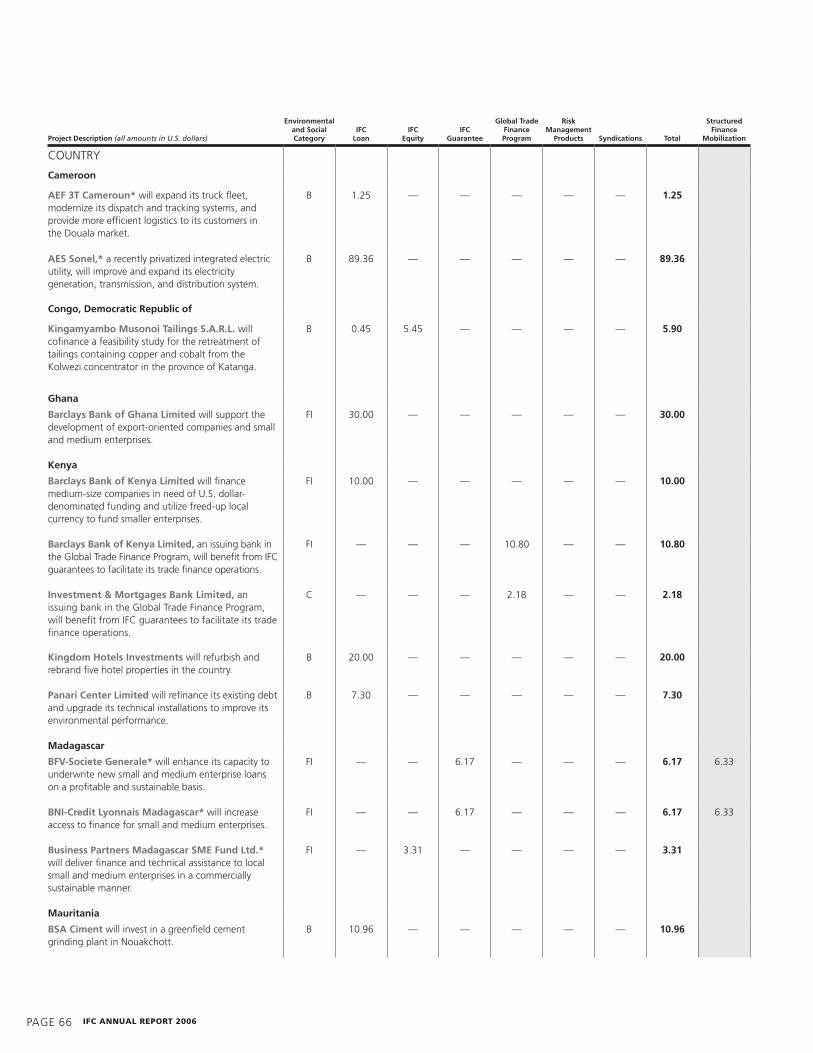
PAGE 66 IFc annual report 2006
project Description (all amounts in U.S. dollars)
environmental and social Category
IFC
loan
IFC
equity
IFC
Guarantee
Global trade Finance program
risk management
products
syndications
total
structured Finance
mobilization
CouNTRy
Cameroon
aeF 3t Cameroun* will expand its truck fleet, modernize its dispatch and tracking systems, and provide more efficient logistics to its customers in the Douala market.
B 1.25 — — — — — 1.25
aes sonel,* a recently privatized integrated electric utility, will improve and expand its electricity generation, transmission, and distribution system.
B 8�.36 — — — — — 89.36
Congo, Democratic republic of
Kingamyambo musonoi tailings s.a.r.l. will cofinance a feasibility study for the retreatment of tailings containing copper and cobalt from the Kolwezi concentrator in the province of Katanga.
B 0.45 5.45 — — — — 5.90
Ghana
Barclays Bank of Ghana limited will support the development of export-oriented companies and small and medium enterprises.
FI 30.00 — — — — — 30.00
Kenya
Barclays Bank of Kenya limited will finance medium-size companies in need of u.S. dollar-denominated funding and utilize freed-up local currency to fund smaller enterprises.
FI 10.00 — — — — — 10.00
Barclays Bank of Kenya limited, an issuing bank in the Global Trade Finance Program, will benefit from IFC guarantees to facilitate its trade finance operations.
FI — — — 10.80 — — 10.80
Investment & mortgages Bank limited, an issuing bank in the Global Trade Finance Program, will benefit from IFC guarantees to facilitate its trade finance operations.
C — — — 2.18 — — 2.18
Kingdom Hotels Investments will refurbish and rebrand five hotel properties in the country.
B 20.00 — — — — — 20.00
panari Center limited will refinance its existing debt and upgrade its technical installations to improve its environmental performance.
B 7.30 — — — — — 7.30
madagascar
BFV-societe Generale* will enhance its capacity to underwrite new small and medium enterprise loans on a profitable and sustainable basis.
FI — — 6.17 — — — 6.17 6.33
BnI-Credit lyonnais madagascar* will increase access to finance for small and medium enterprises.
FI — — 6.17 — — — 6.17 6.33
Business partners madagascar sme Fund ltd.* will deliver finance and technical assistance to local small and medium enterprises in a commercially sustainable manner.
FI — 3.31 — — — — 3.31
mauritania
Bsa Ciment will invest in a greenfield cement grinding plant in Nouakchott.
B 10.�6 — — — — — 10.96
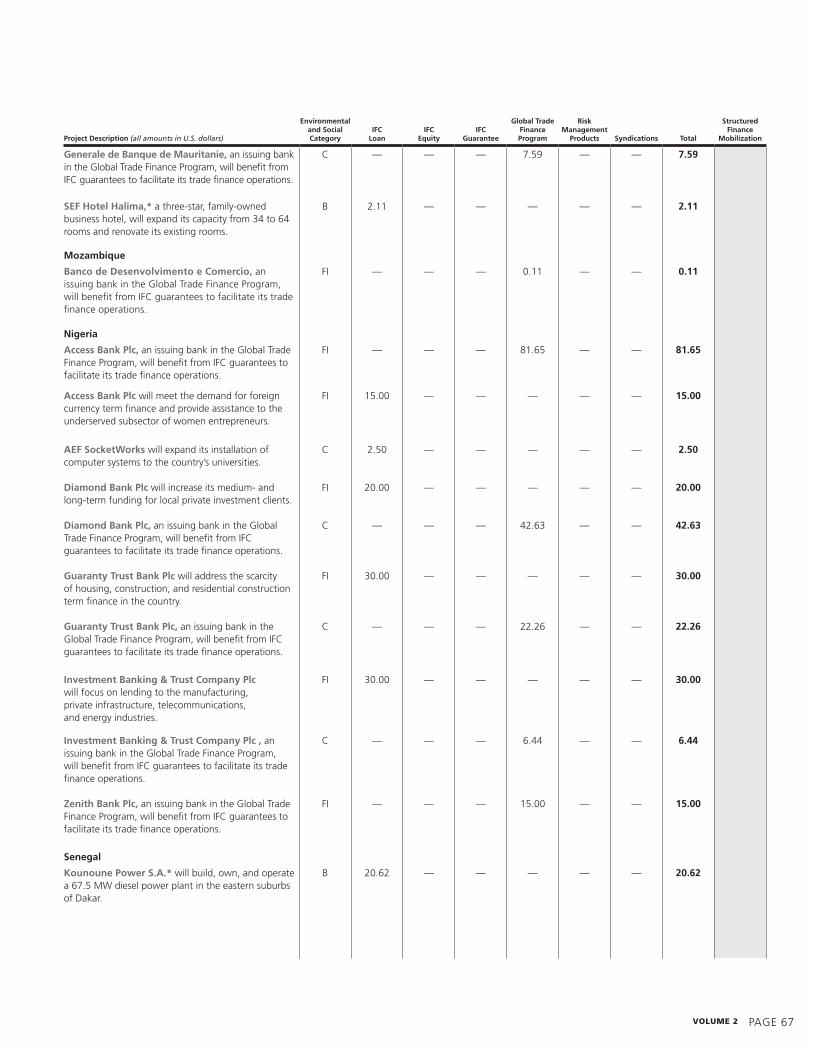
volume 2 PAGE 67
project Description (all amounts in U.S. dollars)
environmental and social Category
IFC
loan
IFC
equity
IFC
Guarantee
Global trade Finance program
risk management
products
syndications
total
structured Finance
mobilization
Generale de Banque de mauritanie, an issuing bank in the Global Trade Finance Program, will benefit from IFC guarantees to facilitate its trade finance operations.
C — — — 7.5� — — 7.59
seF Hotel Halima,* a three-star, family-owned business hotel, will expand its capacity from 34 to 64 rooms and renovate its existing rooms.
B 2.11 — — — — — 2.11
mozambique
Banco de Desenvolvimento e Comercio, an issuing bank in the Global Trade Finance Program, will benefit from IFC guarantees to facilitate its trade finance operations.
FI — — — 0.11 — — 0.11
nigeria
access Bank plc, an issuing bank in the Global Trade Finance Program, will benefit from IFC guarantees to facilitate its trade finance operations.
FI — — — 81.65 — — 81.65
access Bank plc will meet the demand for foreign currency term finance and provide assistance to the underserved subsector of women entrepreneurs.
FI 15.00 — — — — — 15.00
aeF socketWorks will expand its installation of computer systems to the country’s universities.
C 2.50 — — — — — 2.50
Diamond Bank plc will increase its medium- and long-term funding for local private investment clients.
FI 20.00 — — — — — 20.00
Diamond Bank plc, an issuing bank in the Global Trade Finance Program, will benefit from IFC guarantees to facilitate its trade finance operations.
C — — — 42.63 — — 42.63
Guaranty trust Bank plc will address the scarcity of housing, construction, and residential construction term finance in the country.
FI 30.00 — — — — — 30.00
Guaranty trust Bank plc, an issuing bank in the Global Trade Finance Program, will benefit from IFC guarantees to facilitate its trade finance operations.
C — — — 22.26 — — 22.26
Investment Banking & trust Company plc will focus on lending to the manufacturing, private infrastructure, telecommunications, and energy industries.
FI 30.00 — — — — — 30.00
Investment Banking & trust Company plc , an issuing bank in the Global Trade Finance Program, will benefit from IFC guarantees to facilitate its trade finance operations.
C — — — 6.44 — — 6.44
Zenith Bank plc, an issuing bank in the Global Trade Finance Program, will benefit from IFC guarantees to facilitate its trade finance operations.
FI — — — 15.00 — — 15.00
senegal
Kounoune power s.a.* will build, own, and operate a 67.5 MW diesel power plant in the eastern suburbs of Dakar.
B 20.62 — — — — — 20.62
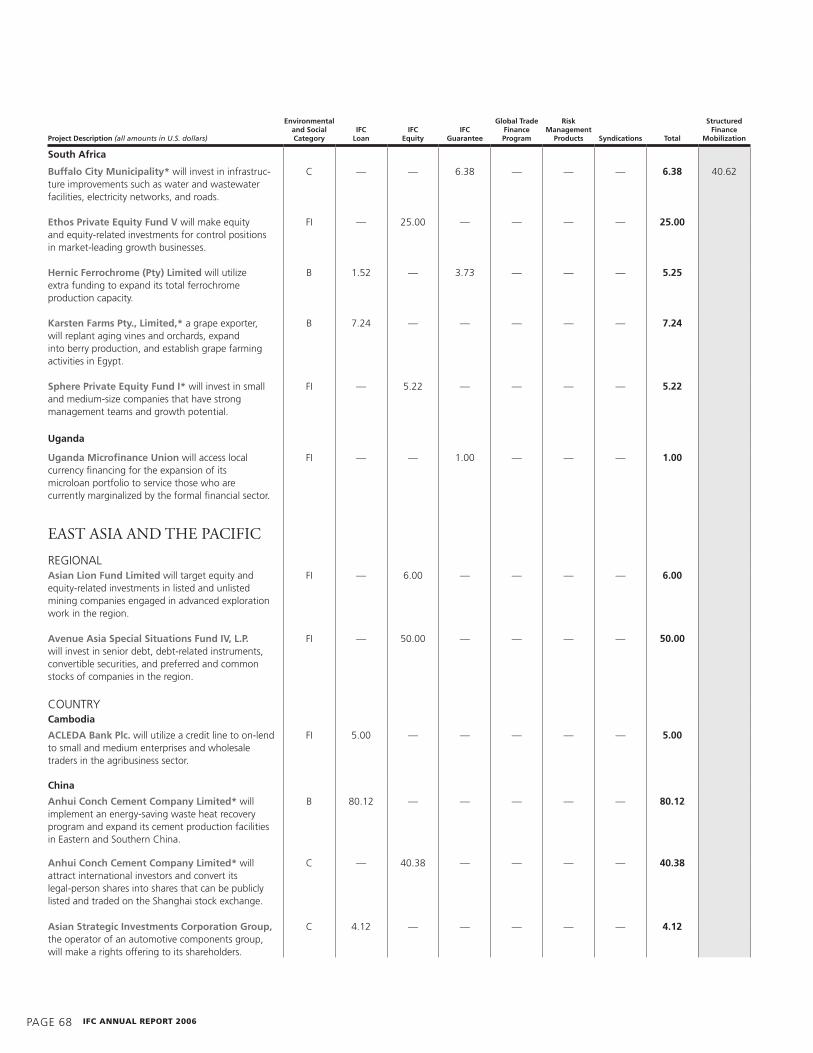
PAGE 68 IFc annual report 2006
project Description (all amounts in U.S. dollars)
environmental and social Category
IFC
loan
IFC
equity
IFC
Guarantee
Global trade Finance program
risk management
products
syndications
total
structured Finance
mobilization
south africa
Buffalo City municipality* will invest in infrastruc-ture improvements such as water and wastewater facilities, electricity networks, and roads.
C — — 6.38 — — — 6.38 40.62
ethos private equity Fund V will make equity and equity-related investments for control positions in market-leading growth businesses.
FI — 25.00 — — — — 25.00
Hernic Ferrochrome (pty) limited will utilize extra funding to expand its total ferrochrome production capacity.
B 1.52 — 3.73 — — — 5.25
Karsten Farms pty., limited,* a grape exporter, will replant aging vines and orchards, expand into berry production, and establish grape farming activities in Egypt.
B 7.24 — — — — — 7.24
sphere private equity Fund I* will invest in small and medium-size companies that have strong management teams and growth potential.
FI — 5.22 — — — — 5.22
uganda
uganda microfinance union will access local currency financing for the expansion of its microloan portfolio to service those who are currently marginalized by the formal financial sector.
FI — — 1.00 — — — 1.00
EaST aSia and ThE PaCifiC
REGIoNALasian lion Fund limited will target equity and equity-related investments in listed and unlisted mining companies engaged in advanced exploration work in the region.
FI — 6.00 — — — — 6.00
avenue asia special situations Fund IV, l.p. will invest in senior debt, debt-related instruments, convertible securities, and preferred and common stocks of companies in the region.
FI — 50.00 — — — — 50.00
CouNTRyCambodia
aCleDa Bank plc. will utilize a credit line to on-lend to small and medium enterprises and wholesale traders in the agribusiness sector.
FI 5.00 — — — — — 5.00
China
anhui Conch Cement Company limited* will implement an energy-saving waste heat recovery program and expand its cement production facilities in Eastern and Southern China.
B 80.12 — — — — — 80.12
anhui Conch Cement Company limited* will attract international investors and convert its legal-person shares into shares that can be publicly listed and traded on the Shanghai stock exchange.
C — 40.38 — — — — 40.38
asian strategic Investments Corporation Group, the operator of an automotive components group, will make a rights offering to its shareholders.
C 4.12 — — — — — 4.12

volume 2 PAGE 6�
project Description (all amounts in U.S. dollars)
environmental and social Category
IFC
loan
IFC
equity
IFC
Guarantee
Global trade Finance program
risk management
products
syndications
total
structured Finance
mobilization
Babei Group Co., ltd. will expand and relocate its existing facilities for production of silk ties and fabrics.
B — — — — — 6.00 6.00
Beijing Deqingyuan agriculture technology Co., ltd.* will build additional layer sheds to increase production capacity of high-quality eggs.
B — 2.82 — — — — 2.82
Capital today China Growth Fund, l.p. will invest in small and medium-size companies focusing on consumer-driven sectors such as retail, education, manufacturing, and logistics.
FI — 25.00 — — — — 25.00
CDH Venture partners, l.p. will invest in early-stage small and medium enterprises, enhance their operating efficiencies, and maximize their growth potential on a sustainable basis.
FI — 20.00 — — — — 20.00
Changchun tBK shili auto parts Co., ltd.* will construct a new plant to produce non-asbestos brake linings for commercial vehicles.
B 4.00 — — — — — 4.00
Chenming paper Co. ltd. will construct a pulp and paper mill and associated facilities in Jiangxi Province to produce high-quality lightweight coated paper.
A — — — — — 40.00 40.00
China shanshui Cement Group Company, ltd.,* a cement producer in Shandong Province, will restructure its debt, expand its capacity, and install energy-efficient technology.
B 2.20 5.50 — — — — 7.70
China shanshui Cement Group Company, ltd., a cement producer in Shandong Province, will restructure its debt, expand its capacity, and install energy-efficient technology.
B 50.00 — — — — — 50.00
China utility-Based energy efficiency Finance program* will support commercial banks making loans to small and medium enterprises for the purchase of energy-efficient equipment.
FI — — 24.�6 — — — 24.96 32.54
Chinasoft International limited, an e-government software company, will grow its business to undertake larger scale projects with larger capital requirements and invest in research and development.
C — 15.00 — — — — 15.00
Guangxi Baise Fenglin Fiberboard Corporation ltd. will construct, equip, and operate a fiberboard manufacturing facility in Baise, Guangxi Province.
B — — — — — 4.00 4.00
Guangzhou Development Industry Holdings Co., ltd. will invest in new power projects, including the installation of gas desulfurization facilities in the Pearl River power plant.
B 50.11 — — — — — 50.11
Hisoft technology International limited will expand its software research and development facilities.
C — 4.34 — — — — 4.34
launch tech Company limited will merge its Shenzhen production facilities into a single new complex, expand its lift equipment facility in Shanghai, and purchase new manufacturing equipment.
B — 8.35 — — — — 8.35

PAGE 70 IFc annual report 2006
project Description (all amounts in U.S. dollars)
environmental and social Category
IFC
loan
IFC
equity
IFC
Guarantee
Global trade Finance program
risk management
products
syndications
total
structured Finance
mobilization
neophotonics Corporation will develop and grow its operations in the optical component industry.
B — 10.00 — — — — 10.00
renaissance* will restructure and inject new capital into its operations and introduce securities industry international best practices.
C — 1�.77 — — — — 19.77
rongde asset management Co. will act as a joint venture asset management company to purchase and resolve nonperforming loans.
FI — 35.00 — — — — 35.00
sBCVC Fund II, l.p. will make equity and equity-related investments in both early- and growth- stage companies in the telecom, media, and technology sectors.
FI — 20.00 — — — — 20.00
shanghai aerospace Computer system engineering Co., ltd. will expand its long- distance medical education and training to working medical staff.
C 3.00 1.60 — — — — 4.60
shanghai International Banking & Finance Institute will provide training to Chinese finance professionals to promote international best practices in banking and finance.
C — — 0.14 — — — 0.14
sinospring utility Co., ltd. will develop two seawater desalination projects, four wastewater treatment plants, and one water purification project.
B — 20.00 — — — — 20.00
stora enso oyj, a paper and board producer, will utilize a loan facility to develop its timber plantation.
B 50.00 — — — — 175.00 225.00
tianjin Dagang newspring Co. ltd. will develop, operate, and maintain a seawater desalination plant in the Municipality of Tianjin.
B 25.00 — — — — — 25.00
united Family Hospitals* will expand and upgrade its operations in Beijing and Shanghai.
B 8.02 — — — — — 8.02
united rural Cooperative Bank will introduce international best practices in many key areas of its financial operations.
FI — 10.85 — — — — 10.85
Verisilicon Holdings Co., ltd., a u.S./China-based silicon chip design foundry, will expand its research and development activities and make acquisitions in the design sector.
C — 1.00 — — — — 1.00
Yantai Changyu Group Company limited* will diversify its ownership, improve corporate gover-nance, and adopt international management practices to prepare itself for increased competition in the domestic wine market.
B — 0.04 — — — — 0.04
Yunnan Zhongda Yanjin power Generation Co., ltd.* will build, own, and operate three run-of-the-river power stations in yunnan Province.
A 21.�2 — — — — — 21.92
Zhejiang Glass Company, limited,* a float glass manufacturer, will refinance part of its short-term debt.
B 50.00 25.02 — — — 18.00 93.02
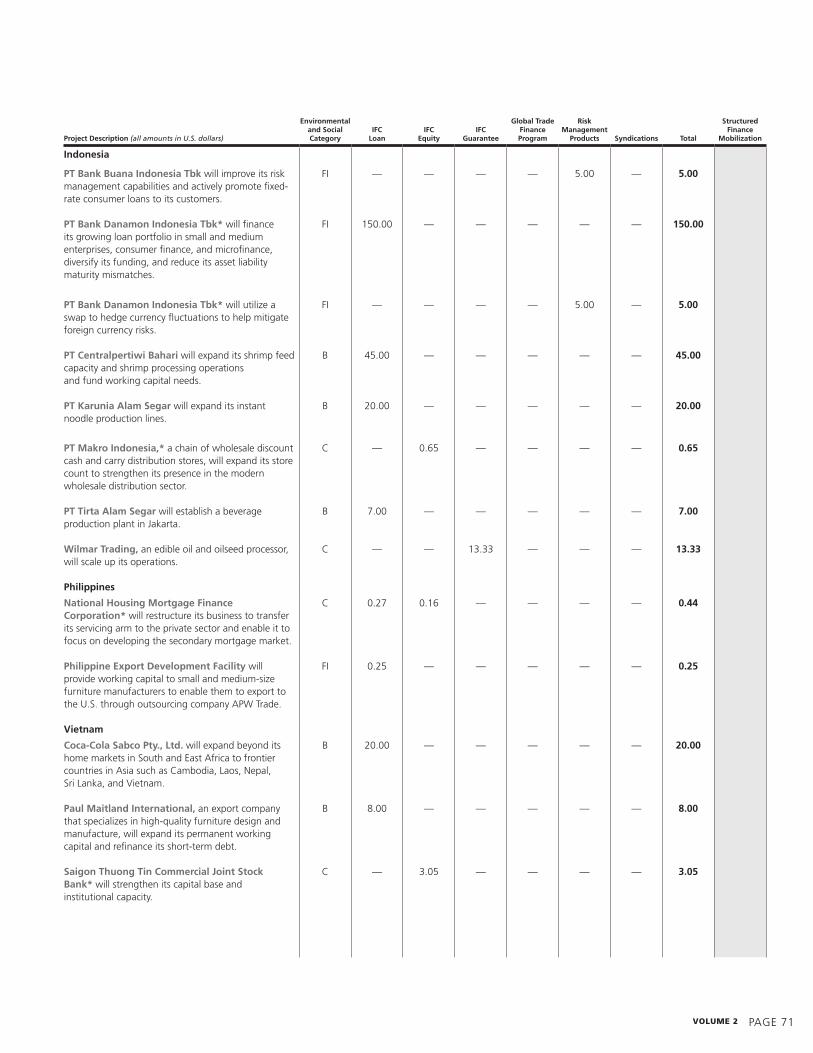
volume 2 PAGE 71
project Description (all amounts in U.S. dollars)
environmental and social Category
IFC
loan
IFC
equity
IFC
Guarantee
Global trade Finance program
risk management
products
syndications
total
structured Finance
mobilization
Indonesia
pt Bank Buana Indonesia tbk will improve its risk management capabilities and actively promote fixed-rate consumer loans to its customers.
FI — — — — 5.00 — 5.00
pt Bank Danamon Indonesia tbk* will finance its growing loan portfolio in small and medium enterprises, consumer finance, and microfinance, diversify its funding, and reduce its asset liability maturity mismatches.
FI 150.00 — — — — — 150.00
pt Bank Danamon Indonesia tbk* will utilize a swap to hedge currency fluctuations to help mitigate foreign currency risks.
FI — — — — 5.00 — 5.00
pt Centralpertiwi Bahari will expand its shrimp feed capacity and shrimp processing operations and fund working capital needs.
B 45.00 — — — — — 45.00
pt Karunia alam segar will expand its instant noodle production lines.
B 20.00 — — — — — 20.00
pt makro Indonesia,* a chain of wholesale discount cash and carry distribution stores, will expand its store count to strengthen its presence in the modern wholesale distribution sector.
C — 0.65 — — — — 0.65
pt tirta alam segar will establish a beverage production plant in Jakarta.
B 7.00 — — — — — 7.00
Wilmar trading, an edible oil and oilseed processor, will scale up its operations.
C — — 13.33 — — — 13.33
philippines
national Housing mortgage Finance Corporation* will restructure its business to transfer its servicing arm to the private sector and enable it to focus on developing the secondary mortgage market.
C 0.27 0.16 — — — — 0.44
philippine export Development Facility will provide working capital to small and medium-size furniture manufacturers to enable them to export to the u.S. through outsourcing company APW Trade.
FI 0.25 — — — — — 0.25
Vietnam
Coca-Cola sabco pty., ltd. will expand beyond its home markets in South and East Africa to frontier countries in Asia such as Cambodia, Laos, Nepal, Sri Lanka, and Vietnam.
B 20.00 — — — — — 20.00
paul maitland International, an export company that specializes in high-quality furniture design and manufacture, will expand its permanent working capital and refinance its short-term debt.
B 8.00 — — — — — 8.00
saigon thuong tin Commercial Joint stock Bank* will strengthen its capital base and institutional capacity.
C — 3.05 — — — — 3.05

PAGE 72 IFc annual report 2006
project Description (all amounts in U.S. dollars)
environmental and social Category
IFC
loan
IFC
equity
IFC
Guarantee
Global trade Finance program
risk management
products
syndications
total
structured Finance
mobilization
SouTh aSia
REGIoNALCairn energy plc will utilize a credit facility to continue the appraisal and development of its oil and gas discoveries in Bangladesh and India.
B 150.00 — — — — — 150.00
CouNTRyBangladesh
Dhaka Bank limited, an issuing bank in the Global Trade Finance Program, will benefit from IFC guarantees to facilitate its trade finance operations.
FI — — — 7.1� — — 7.19
eastern Bank limited, an issuing bank in the Global Trade Finance Program, will benefit from IFC guarantees to facilitate its trade finance operations.
FI — — — 2.5� — — 2.59
India
apollo Hospitals enterprise limited will improve and expand provision of health care services in the domestic market and internationally.
B — 5.08 — — — — 5.08
atul limited,* a chemicals manufacturer, will develop new fungicide and herbicide products and expand capacity of export products with high growth potential.
B 16.�5 — — — — — 16.95
Chennai Water Desalination limited will design, construct, operate, and maintain a seawater desalination plant.
B 25.05 — — — — — 25.05
Continental Carbon India limited* will construct and operate a 15 MW power co-generation facility and improve the environmental quality of its existing plant through the replacement of key equipment.
B 7.00 2.00 — — — — 9.00
DCm shriram Consolidated limited will expand one of its existing sugar mills and build two new sugar mills in the State of uttar Pradesh.
B 15.00 — — — — — 15.00
Federal Bank limited will provide funding for on-lending to small and medium enterprises.
FI — 31.50 — — — — 31.50
Global trade Finance limited* will expand its provision of export and domestic factoring services aimed primarily at small and medium enterprise clients.
C — 1.00 — — — — 1.00
ilabs Investment Fund II, llC will make investments in early-stage, expansion-stage, and restructuring/ buyout opportunities in a diverse range of sectors.
FI — 20.00 — — — — 20.00
Indecomm Global services will open two new facilities in Mysore and Chennai, expand existing and prospective client relationships, and fund organic and inorganic growth.
C — 2.57 — — — — 2.57
India Hydropower Development Company* will acquire the Bhandardara hydroelectric power facility and complete refurbishments to improve its performance.
B 8.00 — — — — — 8.00

volume 2 PAGE 73
project Description (all amounts in U.S. dollars)
environmental and social Category
IFC
loan
IFC
equity
IFC
Guarantee
Global trade Finance program
risk management
products
syndications
total
structured Finance
mobilization
India Hydropower Development Company* will construct three greenfield mini-hydroelectric generation facilities and complete the construction of another.
B 7.03 — — — — — 7.03
Infrastructure Development Finance Company limited will meet its growing need for financing of infrastructure projects, as well as diversify its borrowing sources.
FI — — — — — 100.00 100.00
International auto limited,* an automotive components group, will fund the expansion of its operations.
B — �.�6 — — — — 9.96
JK paper limited will expand into fast-growing and high-margin segments of the domestic paper market and further enhance its environmental management systems.
B 15.00 11.50 — — — — 26.50
KpIt Cummins Infosystems limited will utilize extra funds for strategic acquisitions, expand its sales initiatives, and build new software development facilities.
C — 2.50 — — — — 2.50
l.G. Balakrishnan & Bros., limited,* an automotive and industrial products manufacturer, will increase its production capacity to respond to the growing volume and quality demands of its clients.
B 14.67 5.00 — — — — 19.67
lok Investments will provide social impact capital in the form of equity and debt to qualifying microfinance institutions.
FI — 2.00 — — — — 2.00
nevis networks Inc., a development-stage semiconductor company focused on network security, will offer better hardware solutions to the endpoint security market.
C — 4.00 — — — — 4.00
psl limited* will expand and upgrade its pipe mill facilities.
B 15.00 5.00 — — — — 20.00
ramky enviro engineers ltd.* will establish a number of waste management facilities throughout the country.
B 4.00 — — — — — 4.00
ruchi soya Industries limited will increase its crushing and refining capacity to meet growing domestic demand for edible oil.
B 10.00 10.00 — — — — 20.00
tata Iron & steel Company limited will modernize and expand its businesses, including a capacity increase in its plant in Jamshedpur.
B — — — — — 100.00 100.00
maldives
Wataniya telecom maldives private limited will build a nationwide cellular telecommunications network and purchase bandwidth and facilities for a fiber-optic submarine cable connecting the Maldives with other international major fiber routes.
C 20.00 — — — — — 20.00

PAGE 74 IFc annual report 2006
project Description (all amounts in U.S. dollars)
environmental and social Category
IFC
loan
IFC
equity
IFC
Guarantee
Global trade Finance program
risk management
products
syndications
total
structured Finance
mobilization
EuroPE and CEnTraL aSia
REGIoNALemerging europe Convergence Fund II, l.p.,* a private equity fund, will focus on infrastructure and related industries in Central and Eastern Europe.
FI — 25.84 — — — — 25.84
marbleton property Fund l.p. will invest in a diversified portfolio of real estate projects in Russia, ukraine, and other countries in the region.
FI — 20.00 — — — — 20.00
SouThERN EuRoPE REGIoN
european Fund for southeast europe* will attract investments from multilateral, bilateral, and private institutional investors to make investments in microfinance institutions in the region.
FI — 36.�0 — — — — 36.90
CouNTRyarmenia
Inecobank will on-lend to small and medium enterprise clients and develop its housing finance business.
FI 3.00 — — — — — 3.00
narek llC, a wholesale and retail trade company, will refurbish and expand the Airarat shopping and entertainment center in downtown yerevan.
B 5.20 — — — — — 5.20
azerbaijan
azerigazbank will expand its lending and leasing activities in the small and medium enterprise sector.
FI 3.00 — — — — — 3.00
azerigazbank will expand its on-lending and leasing operations to small and medium enterprises, local entrepreneurs, and individuals.
FI — 2.30 — — — — 2.30
microfinance Bank of azerbaijan will utilize a credit line to grow its portfolio to benefit entrepreneurs and small and medium enterprises.
FI 3.00 — — — — — 3.00
uniBank Commercial Bank oJsC will meet the financing needs of smaller enterprises and establish itself as one of the country’s leading players in the leasing market.
FI 5.00 — — — — — 5.00
Belarus
CJsC Brewing Company will acquire modern bottling lines, upgrade the malting processes and boiler house, and improve overall product quality.
B 2.00 — — — — — 2.00
Detroit Belarus Brewing Company will benefit from a rights issuance.
B — 0.52 — — — — 0.52
Bosnia and Herzegovina
mI-Bospo* will expand its microfinance lending operations.
FI 2.55 — — — — — 2.55
nova Banka a.D.* will utilize extra funding to on-lend to small and medium enterprises and the consumer retail housing sector.
FI 12.41 — — — — — 12.41
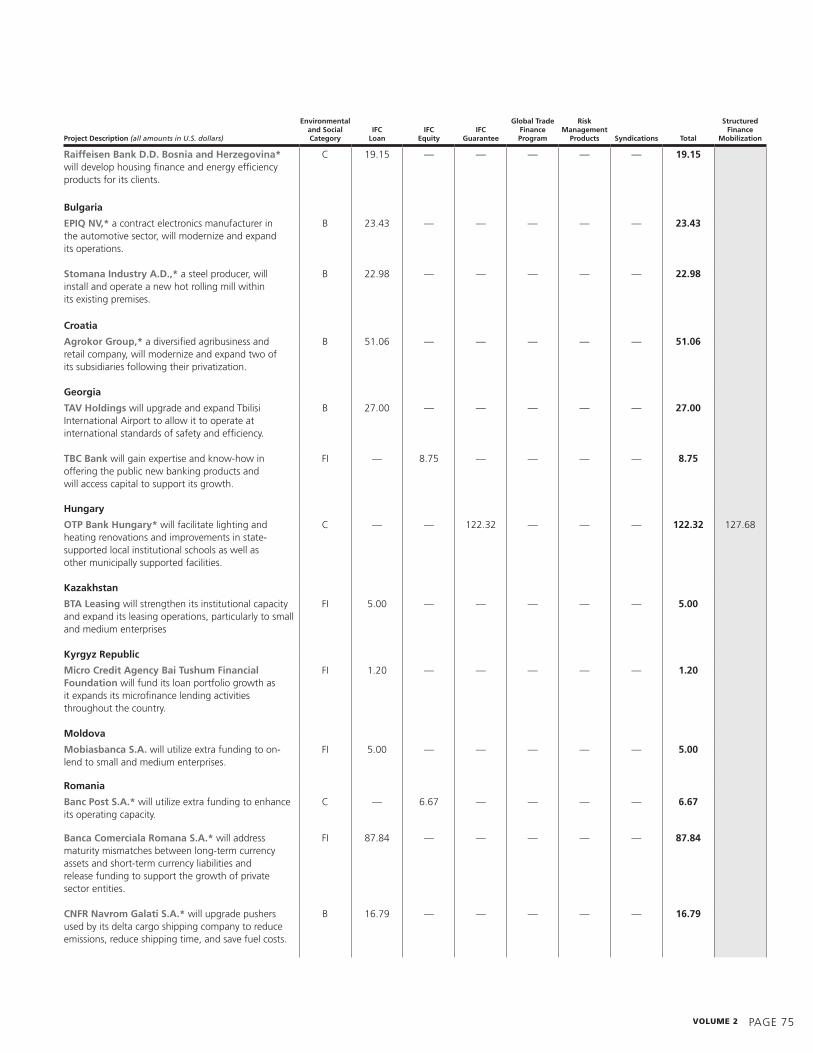
volume 2 PAGE 75
project Description (all amounts in U.S. dollars)
environmental and social Category
IFC
loan
IFC
equity
IFC
Guarantee
Global trade Finance program
risk management
products
syndications
total
structured Finance
mobilization
raiffeisen Bank D.D. Bosnia and Herzegovina* will develop housing finance and energy efficiency products for its clients.
C 1�.15 — — — — — 19.15
Bulgaria
epIQ nV,* a contract electronics manufacturer in the automotive sector, will modernize and expand its operations.
B 23.43 — — — — — 23.43
stomana Industry a.D.,* a steel producer, will install and operate a new hot rolling mill within its existing premises.
B 22.�8 — — — — — 22.98
Croatia
agrokor Group,* a diversified agribusiness and retail company, will modernize and expand two of its subsidiaries following their privatization.
B 51.06 — — — — — 51.06
Georgia
taV Holdings will upgrade and expand Tbilisi International Airport to allow it to operate at international standards of safety and efficiency.
B 27.00 — — — — — 27.00
tBC Bank will gain expertise and know-how in offering the public new banking products and will access capital to support its growth.
FI — 8.75 — — — — 8.75
Hungary
otp Bank Hungary* will facilitate lighting and heating renovations and improvements in state-supported local institutional schools as well as other municipally supported facilities.
C — — 122.32 — — — 122.32 127.68
Kazakhstan
Bta leasing will strengthen its institutional capacity and expand its leasing operations, particularly to small and medium enterprises
FI 5.00 — — — — — 5.00
Kyrgyz republic
micro Credit agency Bai tushum Financial Foundation will fund its loan portfolio growth as it expands its microfinance lending activities throughout the country.
FI 1.20 — — — — — 1.20
moldova
mobiasbanca s.a. will utilize extra funding to on-lend to small and medium enterprises.
FI 5.00 — — — — — 5.00
romania
Banc post s.a.* will utilize extra funding to enhance its operating capacity.
C — 6.67 — — — — 6.67
Banca Comerciala romana s.a.* will address maturity mismatches between long-term currency assets and short-term currency liabilities and release funding to support the growth of private sector entities.
FI 87.84 — — — — — 87.84
CnFr navrom Galati s.a.* will upgrade pushers used by its delta cargo shipping company to reduce emissions, reduce shipping time, and save fuel costs.
B 16.7� — — — — — 16.79

PAGE 76 IFc annual report 2006
project Description (all amounts in U.S. dollars)
environmental and social Category
IFC
loan
IFC
equity
IFC
Guarantee
Global trade Finance program
risk management
products
syndications
total
structured Finance
mobilization
s.C. petrotel-lukoil s.a. will modernize and revamp its refinery to provide high-quality petroleum products.
B 35.00 — — — — 47.00 82.00
russian Federation
absolut Bank will expand its operations in Moscow and St. Petersburg, and grow its residential mortgage lending program throughout the country.
FI 15.00 10.00 — — — — 25.00
absolut Bank will expand its operations in Moscow and St. Petersburg and grow its residential mortgage lending program throughout the country.
FI — 3.27 — — — — 3.27
absolut Bank, an issuing bank in the Global Trade Finance Program, will benefit from IFC guarantees to facilitate its trade finance operations.
FI — — — 10.00 — — 10.00
air taxi will acquire and operate a fleet of smaller aircraft to provide air transport to underserved regions of the country.
B 15.00 — — — — — 15.00
alliance oil Company will expand its retail network and logistics infrastructure, modernize its refineries, and increase its geological exploration activities.
B 25.00 — — — — — 25.00
Bema Gold Corporation will construct and operate facilities to mine and mill gold and silver ore deposits in the eastern part of the country.
A 3�.00 — — — — — 39.00
Brunswick rail leasing will acquire railcars and lease them to large industrial or transport companies on a long-term operating lease basis.
B 37.50 7.50 — — — — 45.00
CenterInvest Bank will on-lend to energy efficiency and renewable energy projects.
FI 4.00 — — — — — 4.00
Chuvash republic* will utilize long-term financing for essential infrastructure investments in water supply, housing, and road construction projects.
FI — — 8.40 — — — 8.40 23.60
Cinema park will expand its operations to develop a nationwide chain of multiscreen movie theaters and a film distribution network.
B 20.00 — — — — — 20.00
Credit Bank of moscow will expand its small and medium enterprise lending activities.
FI 5.00 — — — — — 5.00
Credit Bank of moscow, an issuing bank in the Global Trade Finance Program, will benefit from IFC guarantees to facilitate its trade finance operations.
FI — — — 1.86 — — 1.86
Delta leasing* will expand its leasing activity in Siberia and the eastern part of the country, with a focus on small and medium enterprises.
FI 6.21 — — — — — 6.21
DeltaCredit Bank* will increase its mortgage capacity and expand its branch network throughout the country.
C 24.00 — — — — — 24.00
DeltaCredit Bank will expand its residential mortgages business.
FI — 6.00 — — — — 6.00
eurosib, a rail and logistics operator, will construct and operate six inland logistics terminals to be located throughout the country.
B 48.00 — — — — 71.50 119.50
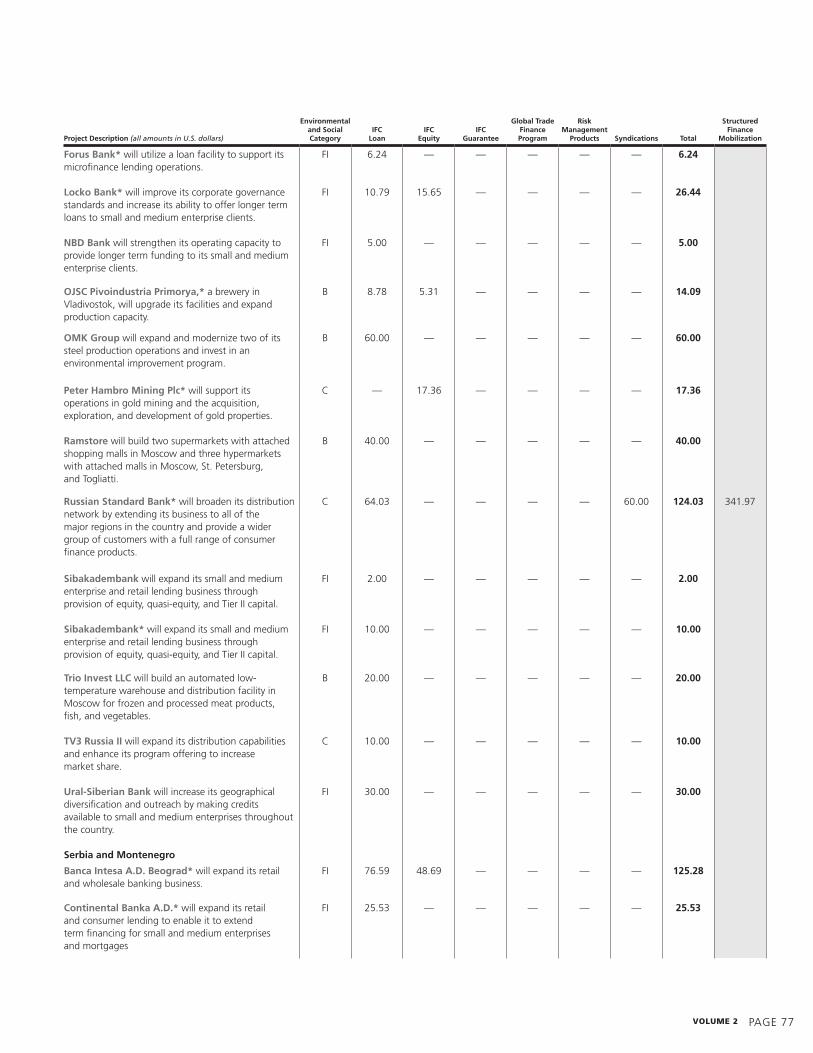
volume 2 PAGE 77
project Description (all amounts in U.S. dollars)
environmental and social Category
IFC
loan
IFC
equity
IFC
Guarantee
Global trade Finance program
risk management
products
syndications
total
structured Finance
mobilization
Forus Bank* will utilize a loan facility to support its microfinance lending operations.
FI 6.24 — — — — — 6.24
locko Bank* will improve its corporate governance standards and increase its ability to offer longer term loans to small and medium enterprise clients.
FI 10.7� 15.65 — — — — 26.44
nBD Bank will strengthen its operating capacity to provide longer term funding to its small and medium enterprise clients.
FI 5.00 — — — — — 5.00
oJsC pivoindustria primorya,* a brewery in Vladivostok, will upgrade its facilities and expand production capacity.
B 8.78 5.31 — — — — 14.09
omK Group will expand and modernize two of its steel production operations and invest in an environmental improvement program.
B 60.00 — — — — — 60.00
peter Hambro mining plc* will support its operations in gold mining and the acquisition, exploration, and development of gold properties.
C — 17.36 — — — — 17.36
ramstore will build two supermarkets with attached shopping malls in Moscow and three hypermarkets with attached malls in Moscow, St. Petersburg, and Togliatti.
B 40.00 — — — — — 40.00
russian standard Bank* will broaden its distribution network by extending its business to all of the major regions in the country and provide a wider group of customers with a full range of consumer finance products.
C 64.03 — — — — 60.00 124.03 341.�7
sibakadembank will expand its small and medium enterprise and retail lending business through provision of equity, quasi-equity, and Tier II capital.
FI 2.00 — — — — — 2.00
sibakadembank* will expand its small and medium enterprise and retail lending business through provision of equity, quasi-equity, and Tier II capital.
FI 10.00 — — — — — 10.00
trio Invest llC will build an automated low- temperature warehouse and distribution facility in Moscow for frozen and processed meat products, fish, and vegetables.
B 20.00 — — — — — 20.00
tV3 russia II will expand its distribution capabilities and enhance its program offering to increase market share.
C 10.00 — — — — — 10.00
ural-siberian Bank will increase its geographical diversification and outreach by making credits available to small and medium enterprises throughout the country.
FI 30.00 — — — — — 30.00
serbia and montenegro
Banca Intesa a.D. Beograd* will expand its retail and wholesale banking business.
FI 76.5� 48.6� — — — — 125.28
Continental Banka a.D.* will expand its retail and consumer lending to enable it to extend term financing for small and medium enterprises and mortgages
FI 25.53 — — — — — 25.53

PAGE 78 IFc annual report 2006
project Description (all amounts in U.S. dollars)
environmental and social Category
IFC
loan
IFC
equity
IFC
Guarantee
Global trade Finance program
risk management
products
syndications
total
structured Finance
mobilization
raiffeisen Bank Kosovo J.s.C.* will develop housing finance and energy efficiency products for its clients.
C 12.77 — — — — — 12.77
raiffeisen Bank Yugoslavia a.D.* will provide long-term funding to corporate and retail customers.
C — 2.46 — — — — 2.46
Raiffeisen Bank Yugoslavia a.D.* will provide long-term funding to corporate and retail customers.
C — 2.�3 — — — — 2.93
raiffeisen Bank Yugoslavia a.D.* will develop housing finance and energy efficiency products for its clients.
C 12.67 — — — — — 12.67
tajikistan
First microfinance Bank tajikistan* will provide microcredit and microenterprise services to entrepreneurs throughout the country.
C — 0.18 — — — — 0.18
turkey
acibadem saglik Hizmetleri Ve ticaret a.s.* will expand its health care operations in major cities, acquire existing hospitals, and construct new hospitals and outpatient clinics.
B 40.00 — — — — — 40.00
assan Demir Ve sac sanayii, a.s., a producer of aluminum flat-rolled products and steel galvanizing industries, will restructure its short-term obligations and implement an ongoing modernization of its operations.
B — — — — — 30.00 30.00
avea Iletisim Hizmetleri a.s. will meet working capital requirements related to the integration, expansion of capacity, and maintenance of its combined cellular phone network.
B 120.00 — — — — — 120.00
ekim turizm ticaret ve sanayi a.s.* will diversify its funding base by accessing more competitive and sustainable term funding both in the domestic and international capital markets.
C 44.68 — — — — — 44.68
Finans lease a.s.* will utilize extra funding to finance small and medium enterprises.
FI 25.53 — — — — — 25.53
Istanbul Bilgi university will establish a business school and develop its e-learning programs.
B 15.00 — — — — — 15.00
milli reasurans t.a.s. will strengthen and expand its domestic private reinsurance operations.
C 50.00 — — — — — 50.00
modern Karton sanayi ve ticaret a.s. will invest in a new paper machine to increase its corrugated paper manufacturing capacity.
B 40.00 — — — — 20.00 60.00
sanko Group will acquire an existing cement plant and construct another facility to expand its operations in the country.
B 75.00 — — — — — 75.00
standard profil otomotiv sanayi ve ticaret anonim sirketi,* a manufacturer of automotive sealing systems, will expand its business under new management.
B 1�.15 3.57 — — — — 22.72

volume 2 PAGE 7�
project Description (all amounts in U.S. dollars)
environmental and social Category
IFC
loan
IFC
equity
IFC
Guarantee
Global trade Finance program
risk management
products
syndications
total
structured Finance
mobilization
turk Demir Dokum Fabrikalari a.s.,* a manufac-turer and distributor of heating appliances, will finance its investment program on expansion, modernization, and new product development.
B 2�.75 — — — — — 29.75
ukraine
aval Bank will continue to expand its corporate sector lending and develop its retail business.
FI 50.00 — — — — — 50.00
CJsC sofia Kiev will complete a 234-room hotel in Kiev, to be operated by hyatt International.
B 16.50 — — — — 13.00 29.50
CJsC Zeus Ceramica, a ceramic tile manufacturer, will expand its production capacity at its plant in Slavyansk.
B �.00 — — — — — 9.00
Closed Joint stock Company rise will distribute seeds, fertilizers, crop protection products, and agricultural machinery to farms.
B 10.00 — — — — — 10.00
euroventures ukraine Fund II l.p. will invest in midsize private companies in the country and in cross-border transactions involving neighboring countries.
FI — 7.50 — — — — 7.50
Industrial union of Donbass will improve its environmental performance and modernize and streamline its operations to increase competitiveness.
B 100.00 — — — — — 100.00
llC “CpC” Biocon will expand its existing pharmaceutical wholesale, distribution, and retail business.
C 3.50 — — — — — 3.50
llC savservice Center will construct a warehouse and customs terminal, acquire and renovate a warehousing center near Kyiv, and invest in new vehicles and a management information system.
B 8.00 — — — — — 8.00
nova liniya, a do-it-yourself store chain, will expand its operations by opening four new stores in some of the country’s largest cities.
B 10.00 — — — — — 10.00
oJsC Concern Galnaftogas, a network of service stations selling petroleum products and related services in the western part of the country, will expand its network to other regions.
B 25.00 — — — — — 25.00
sandora llC will modernize and expand its existing juice factory in Mykolayiv and refinance a portion of its existing short-term debt.
B 10.00 — — — — — 10.00
Velyka Kyshenya Group will expand its chain of supermarkets to major cities outside of Kyiv.
B 45.00 — — — — — 45.00
LaTin aMEriCa and ThE CaribbEanREGIoNALadvent latin american private equity Fund III l.p. will invest in companies in the region, adding value through active investment management.
FI — 20.00 — — — — 20.00
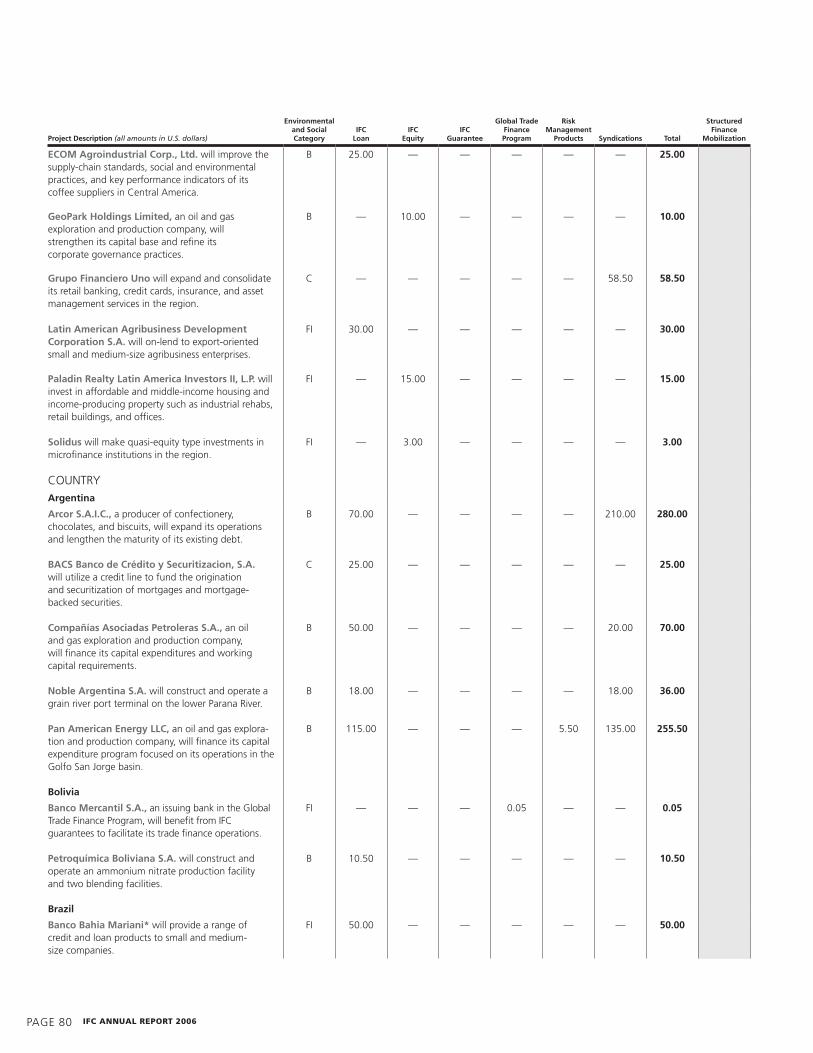
PAGE 80 IFc annual report 2006
project Description (all amounts in U.S. dollars)
environmental and social Category
IFC
loan
IFC
equity
IFC
Guarantee
Global trade Finance program
risk management
products
syndications
total
structured Finance
mobilization
eCom agroindustrial Corp., ltd. will improve the supply-chain standards, social and environmental practices, and key performance indicators of its coffee suppliers in Central America.
B 25.00 — — — — — 25.00
Geopark Holdings limited, an oil and gas exploration and production company, will strengthen its capital base and refine its corporate governance practices.
B — 10.00 — — — — 10.00
Grupo Financiero uno will expand and consolidate its retail banking, credit cards, insurance, and asset management services in the region.
C — — — — — 58.50 58.50
latin american agribusiness Development Corporation s.a. will on-lend to export-oriented small and medium-size agribusiness enterprises.
FI 30.00 — — — — — 30.00
paladin realty latin america Investors II, l.p. will invest in affordable and middle-income housing and income-producing property such as industrial rehabs, retail buildings, and offices.
FI — 15.00 — — — — 15.00
solidus will make quasi-equity type investments in microfinance institutions in the region.
FI — 3.00 — — — — 3.00
CouNTRy
argentina
arcor s.a.I.C., a producer of confectionery, chocolates, and biscuits, will expand its operations and lengthen the maturity of its existing debt.
B 70.00 — — — — 210.00 280.00
BaCs Banco de Crédito y securitizacion, s.a. will utilize a credit line to fund the origination and securitization of mortgages and mortgage- backed securities.
C 25.00 — — — — — 25.00
Compañías asociadas petroleras s.a., an oil and gas exploration and production company, will finance its capital expenditures and working capital requirements.
B 50.00 — — — — 20.00 70.00
noble argentina s.a. will construct and operate a grain river port terminal on the lower Parana River.
B 18.00 — — — — 18.00 36.00
pan american energy llC, an oil and gas explora-tion and production company, will finance its capital expenditure program focused on its operations in the Golfo San Jorge basin.
B 115.00 — — — 5.50 135.00 255.50
Bolivia
Banco mercantil s.a., an issuing bank in the Global Trade Finance Program, will benefit from IFC guarantees to facilitate its trade finance operations.
FI — — — 0.05 — — 0.05
petroquímica Boliviana s.a. will construct and operate an ammonium nitrate production facility and two blending facilities.
B 10.50 — — — — — 10.50
Brazil
Banco Bahia mariani* will provide a range of credit and loan products to small and medium- size companies.
FI 50.00 — — — — — 50.00

volume 2 PAGE 81
project Description (all amounts in U.S. dollars)
environmental and social Category
IFC
loan
IFC
equity
IFC
Guarantee
Global trade Finance program
risk management
products
syndications
total
structured Finance
mobilization
Banco Industrial e Comercial s.a., an issuing bank in the Global Trade Finance Program, will benefit from IFC guarantees to facilitate its trade finance operations.
FI — — — 40.77 — — 40.77
Banco mercantil do Brasil s.a., an issuing bank in the Global Trade Finance Program, will benefit from IFC guarantees to facilitate its trade finance operations.
FI — — — 4.20 — — 4.20
Central Geradora termelectrica Fortaleza, s.a. will finance, own, and operate a thermal power plant near the Port of Pecém, in the State of Ceara.
A 62.50 — — — — 67.50 130.00
endesa Brasil s.a. will increase its electricity generation capacity and expand loss reduction programs at its distribution subsidiaries.
B — 50.00 — — — — 50.00
energias renovaveis do Brasil ltda. will construct, operate, and maintain a 4� MW wind park in the State of Rio Grande do Norte.
B — 5.50 — — — — 5.50
Fundo de educacao para o Brasil will build and operate a network of private universities in the interior cities of the State of São Paulo.
B 12.00 — — — — — 12.00
Ipiranga petroquimica s.a., a producer of polyethylene and polypropylene, will enhance its market competitiveness and attract long- term financing in order to take advantage of growth opportunities.
B 50.00 — — — — — 50.00
Itambe will expand its milk processing capacity and exploit opportunities in the international market.
B 15.00 — — — — — 15.00
mrs logística s.a. will expand its freight capacity and improve the efficiency and safety of its rail network.
B 50.00 — — — — 50.00 100.00
rio Bravo securitizadora* will expand its residential real estate origination, securitization, and housing finance-related securities placement activities.
C — 1.4� — — — — 1.49
rio Bravo securitizadora* will expand its residential real estate origination, securitization, and housing finance-related securities placement activities.
C — — 22.33 — — — 22.33
suzano petroquímica s.a., a thermoplastic resins and polypropylene producer, will implement a corporate restructuring aimed at simplifying its group structure.
B 60.00 — — — — 140.00 200.00
tam airlines will utilize funding for the predelivery purchase of Airbus 320 family aircraft and for ongoing operational requirements.
B 50.00 — — — — — 50.00
tecon suape s.a. will upgrade and operate two dedicated container terminal berths at the Port of Suape in Recife.
B 6.00 — — — — — 6.00
triBanco Brazil* will develop new products designed to upgrade or expand the sales outlets of micro and small entrepreneurs.
C — — — — 0.33 — 0.33

PAGE 82 IFc annual report 2006
project Description (all amounts in U.S. dollars)
environmental and social Category
IFC
loan
IFC
equity
IFC
Guarantee
Global trade Finance program
risk management
products
syndications
total
structured Finance
mobilization
Chile
Fondo de Inversion Forestal lignum will monetize standing forests and deforested land owned by small land owners and farmers.
B — 6.50 — — — — 6.50
Hidroelectrica la Higuera will build, own, and operate a 155 MW hydropower plant in the Tinguiririca Valley.
A 45.00 — — — — 115.00 160.00
ColombiaBanco Caja social s.a.* will increase the availability and safety of savings products for the poor and increase the availability of formal productive credit to low-income borrowers.
C — 12.70 — — — — 12.70
Banco Davivienda s.a.* will expand its retail business while maintaining a strong presence in the mortgage industry.
C — 10.00 0.73 — — — 10.73
Banco Davivienda s.a.* will expand its retail business while maintaining a strong presence in the mortgage industry.
FI 35.00 15.00 — — — — 50.00
Carvajal s.a. will benefit from an investment in its paper subsidiary to help the company achieve international competitiveness.
B — 20.00 — — — — 20.00
Carvajal s.a.,* a paper manufacturing, printing, and packaging business, will modernize its information systems.
B 50.00 — — — — — 50.00
Colombian Home mortgage Corp.* will acquire and securitize high-quality residential mortgage loans to develop the country’s secondary mortgage market.
C — — 3.34 — — — 3.34 1�2.80
Colombian Home mortgage Corp.* will acquire and securitize high-quality residential mortgage loans to develop the country’s secondary mortgage market.
C — — 0.�1 — — — 0.91 21.50
Fundacion social* will invest in socially responsible projects and target lower income households as its core clientele.
FI 50.00 — — — — — 50.00
Fundacion WWB Colombia* will expand its working capital loans and other essential financial services to microentrepreneurs.
FI �.20 — — — — — 9.20
Interbolsa s.a.* will issue a local currency medium-term bond to support its asset management, retail brokerage, and investment banking businesses.
C — — 14.01 — — — 14.01 7�.32
petrotesting Colombia s.a., an oil and gas exploration and production company, will strengthen its financial position and adopt best practice corporate systems.
B — 15.00 — — — — 15.00
promigas s.a. will undertake investments in additional gas transmission and distribution assets in the country and throughout Latin America.
B 50.00 — — — — — 50.00
WWB-popayan* will expand its business of lending to microentrepreneurs.
FI 5.60 — — — — — 5.60
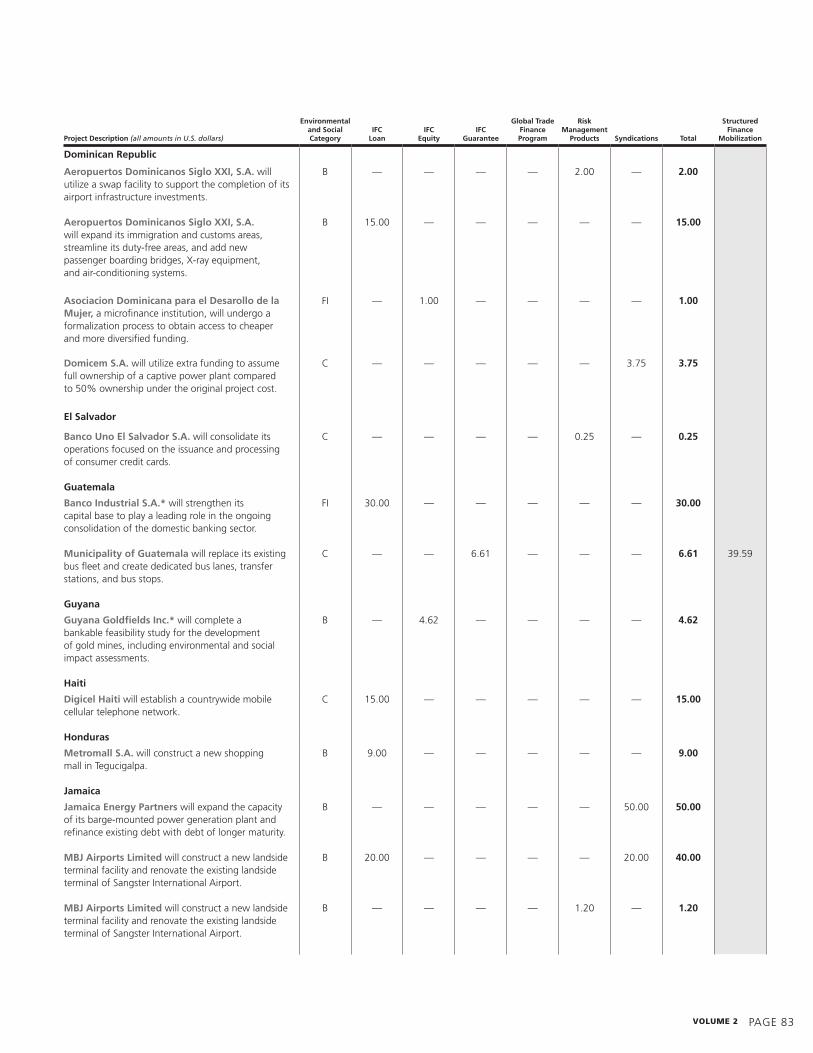
volume 2 PAGE 83
project Description (all amounts in U.S. dollars)
environmental and social Category
IFC
loan
IFC
equity
IFC
Guarantee
Global trade Finance program
risk management
products
syndications
total
structured Finance
mobilization
Dominican republic
aeropuertos Dominicanos siglo XXI, s.a. will utilize a swap facility to support the completion of its airport infrastructure investments.
B — — — — 2.00 — 2.00
aeropuertos Dominicanos siglo XXI, s.a. will expand its immigration and customs areas, streamline its duty-free areas, and add new passenger boarding bridges, X-ray equipment, and air-conditioning systems.
B 15.00 — — — — — 15.00
asociacion Dominicana para el Desarollo de la mujer, a microfinance institution, will undergo a formalization process to obtain access to cheaper and more diversified funding.
FI — 1.00 — — — — 1.00
Domicem s.a. will utilize extra funding to assume full ownership of a captive power plant compared to 50% ownership under the original project cost.
C — — — — — 3.75 3.75
el salvador
Banco uno el salvador s.a. will consolidate its operations focused on the issuance and processing of consumer credit cards.
C — — — — 0.25 — 0.25
Guatemala
Banco Industrial s.a.* will strengthen its capital base to play a leading role in the ongoing consolidation of the domestic banking sector.
FI 30.00 — — — — — 30.00
municipality of Guatemala will replace its existing bus fleet and create dedicated bus lanes, transfer stations, and bus stops.
C — — 6.61 — — — 6.61 3�.5�
Guyana
Guyana Goldfields Inc.* will complete a bankable feasibility study for the development of gold mines, including environmental and social impact assessments.
B — 4.62 — — — — 4.62
Haiti
Digicel Haiti will establish a countrywide mobile cellular telephone network.
C 15.00 — — — — — 15.00
Honduras
metromall s.a. will construct a new shopping mall in Tegucigalpa.
B �.00 — — — — — 9.00
Jamaica
Jamaica energy partners will expand the capacity of its barge-mounted power generation plant and refinance existing debt with debt of longer maturity.
B — — — — — 50.00 50.00
mBJ airports limited will construct a new landside terminal facility and renovate the existing landside terminal of Sangster International Airport.
B 20.00 — — — — 20.00 40.00
mBJ airports limited will construct a new landside terminal facility and renovate the existing landside terminal of Sangster International Airport.
B — — — — 1.20 — 1.20
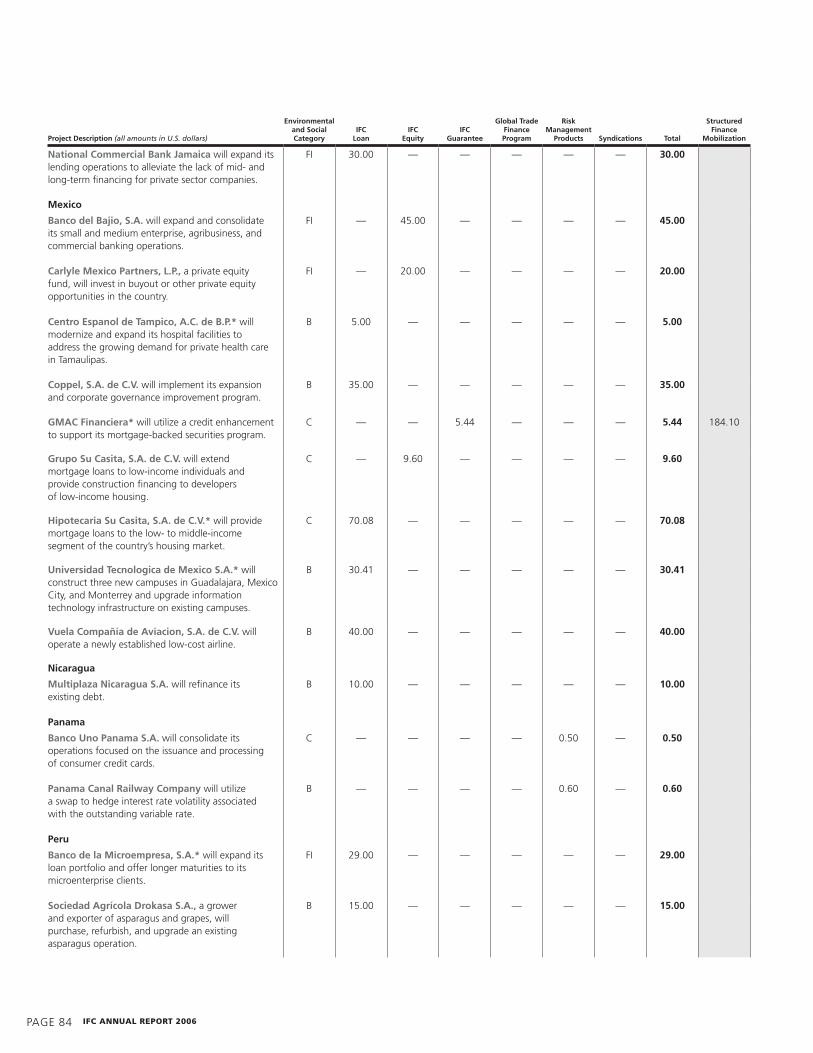
PAGE 84 IFc annual report 2006
project Description (all amounts in U.S. dollars)
environmental and social Category
IFC
loan
IFC
equity
IFC
Guarantee
Global trade Finance program
risk management
products
syndications
total
structured Finance
mobilization
national Commercial Bank Jamaica will expand its lending operations to alleviate the lack of mid- and long-term financing for private sector companies.
FI 30.00 — — — — — 30.00
mexico
Banco del Bajio, s.a. will expand and consolidate its small and medium enterprise, agribusiness, and commercial banking operations.
FI — 45.00 — — — — 45.00
Carlyle mexico partners, l.p., a private equity fund, will invest in buyout or other private equity opportunities in the country.
FI — 20.00 — — — — 20.00
Centro espanol de tampico, a.C. de B.p.* will modernize and expand its hospital facilities to address the growing demand for private health care in Tamaulipas.
B 5.00 — — — — — 5.00
Coppel, s.a. de C.V. will implement its expansion and corporate governance improvement program.
B 35.00 — — — — — 35.00
GmaC Financiera* will utilize a credit enhancement to support its mortgage-backed securities program.
C — — 5.44 — — — 5.44 184.10
Grupo su Casita, s.a. de C.V. will extend mortgage loans to low-income individuals and provide construction financing to developers of low-income housing.
C — �.60 — — — — 9.60
Hipotecaria su Casita, s.a. de C.V.* will provide mortgage loans to the low- to middle-income segment of the country’s housing market.
C 70.08 — — — — — 70.08
universidad tecnologica de mexico s.a.* will construct three new campuses in Guadalajara, Mexico City, and Monterrey and upgrade information technology infrastructure on existing campuses.
B 30.41 — — — — — 30.41
Vuela Compañía de aviacion, s.a. de C.V. will operate a newly established low-cost airline.
B 40.00 — — — — — 40.00
nicaragua
multiplaza nicaragua s.a. will refinance its existing debt.
B 10.00 — — — — — 10.00
panama
Banco uno panama s.a. will consolidate its operations focused on the issuance and processing of consumer credit cards.
C — — — — 0.50 — 0.50
panama Canal railway Company will utilize a swap to hedge interest rate volatility associated with the outstanding variable rate.
B — — — — 0.60 — 0.60
peru
Banco de la microempresa, s.a.* will expand its loan portfolio and offer longer maturities to its microenterprise clients.
FI 2�.00 — — — — — 29.00
sociedad agrícola Drokasa s.a., a grower and exporter of asparagus and grapes, will purchase, refurbish, and upgrade an existing asparagus operation.
B 15.00 — — — — — 15.00
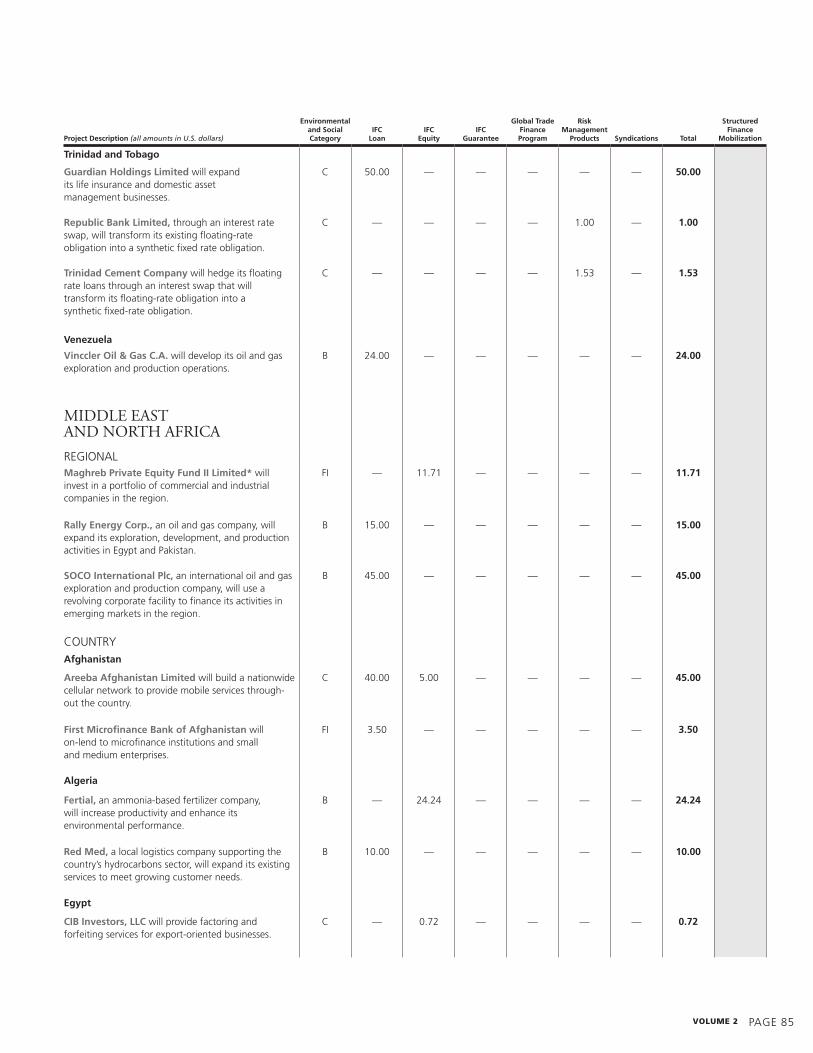
volume 2 PAGE 85
project Description (all amounts in U.S. dollars)
environmental and social Category
IFC
loan
IFC
equity
IFC
Guarantee
Global trade Finance program
risk management
products
syndications
total
structured Finance
mobilization
trinidad and tobago
Guardian Holdings limited will expand its life insurance and domestic asset management businesses.
C 50.00 — — — — — 50.00
republic Bank limited, through an interest rate swap, will transform its existing floating-rate obligation into a synthetic fixed rate obligation.
C — — — — 1.00 — 1.00
trinidad Cement Company will hedge its floating rate loans through an interest swap that will transform its floating-rate obligation into a synthetic fixed-rate obligation.
C — — — — 1.53 — 1.53
Venezuela
Vinccler oil & Gas C.a. will develop its oil and gas exploration and production operations.
B 24.00 — — — — — 24.00
MiddLE EaST and norTh afriCa
REGIoNALmaghreb private equity Fund II limited* will invest in a portfolio of commercial and industrial companies in the region.
FI — 11.71 — — — — 11.71
rally energy Corp., an oil and gas company, will expand its exploration, development, and production activities in Egypt and Pakistan.
B 15.00 — — — — — 15.00
soCo International plc, an international oil and gas exploration and production company, will use a revolving corporate facility to finance its activities in emerging markets in the region.
B 45.00 — — — — — 45.00
CouNTRyafghanistan
areeba afghanistan limited will build a nationwide cellular network to provide mobile services through-out the country.
C 40.00 5.00 — — — — 45.00
First microfinance Bank of afghanistan will on-lend to microfinance institutions and small and medium enterprises.
FI 3.50 — — — — — 3.50
algeria
Fertial, an ammonia-based fertilizer company, will increase productivity and enhance its environmental performance.
B — 24.24 — — — — 24.24
red med, a local logistics company supporting the country’s hydrocarbons sector, will expand its existing services to meet growing customer needs.
B 10.00 — — — — — 10.00
egypt
CIB Investors, llC will provide factoring and forfeiting services for export-oriented businesses.
C — 0.72 — — — — 0.72
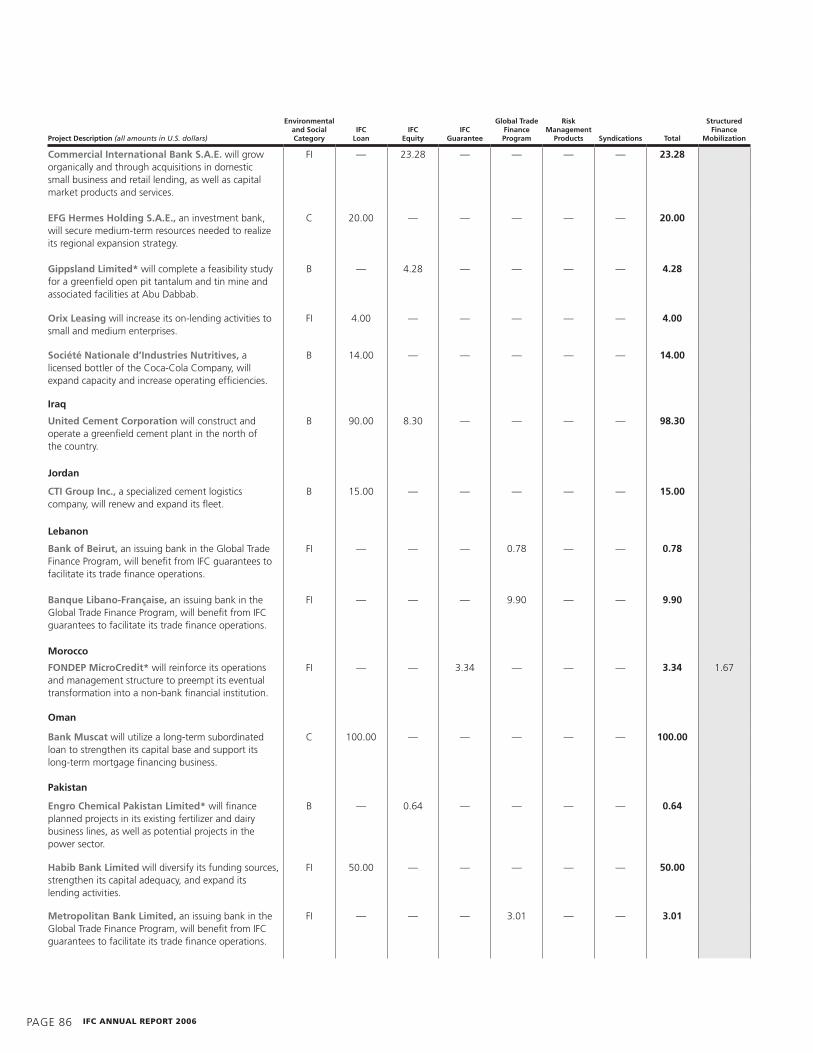
PAGE 86 IFc annual report 2006
project Description (all amounts in U.S. dollars)
environmental and social Category
IFC
loan
IFC
equity
IFC
Guarantee
Global trade Finance program
risk management
products
syndications
total
structured Finance
mobilization
Commercial International Bank s.a.e. will grow organically and through acquisitions in domestic small business and retail lending, as well as capital market products and services.
FI — 23.28 — — — — 23.28
eFG Hermes Holding s.a.e., an investment bank, will secure medium-term resources needed to realize its regional expansion strategy.
C 20.00 — — — — — 20.00
Gippsland limited* will complete a feasibility study for a greenfield open pit tantalum and tin mine and associated facilities at Abu Dabbab.
B — 4.28 — — — — 4.28
orix leasing will increase its on-lending activities to small and medium enterprises.
FI 4.00 — — — — — 4.00
société nationale d’Industries nutritives, a licensed bottler of the Coca-Cola Company, will expand capacity and increase operating efficiencies.
B 14.00 — — — — — 14.00
Iraq
united Cement Corporation will construct and operate a greenfield cement plant in the north of the country.
B �0.00 8.30 — — — — 98.30
Jordan
CtI Group Inc., a specialized cement logistics company, will renew and expand its fleet.
B 15.00 — — — — — 15.00
lebanon
Bank of Beirut, an issuing bank in the Global Trade Finance Program, will benefit from IFC guarantees to facilitate its trade finance operations.
FI — — — 0.78 — — 0.78
Banque libano-Française, an issuing bank in the Global Trade Finance Program, will benefit from IFC guarantees to facilitate its trade finance operations.
FI — — — �.�0 — — 9.90
morocco
FonDep microCredit* will reinforce its operations and management structure to preempt its eventual transformation into a non-bank financial institution.
FI — — 3.34 — — — 3.34 1.67
oman
Bank muscat will utilize a long-term subordinated loan to strengthen its capital base and support its long-term mortgage financing business.
C 100.00 — — — — — 100.00
pakistan
engro Chemical pakistan limited* will finance planned projects in its existing fertilizer and dairy business lines, as well as potential projects in the power sector.
B — 0.64 — — — — 0.64
Habib Bank limited will diversify its funding sources, strengthen its capital adequacy, and expand its lending activities.
FI 50.00 — — — — — 50.00
metropolitan Bank limited, an issuing bank in the Global Trade Finance Program, will benefit from IFC guarantees to facilitate its trade finance operations.
FI — — — 3.01 — — 3.01

volume 2 PAGE 87
project Description (all amounts in U.S. dollars)
environmental and social Category
IFC
loan
IFC
equity
IFC
Guarantee
Global trade Finance program
risk management
products
syndications
total
structured Finance
mobilization
orix Investment Bank pakistan limited will utilize a revolving facility to support its lending to medium-size enterprises.
FI 5.00 — — — — — 5.00
orix leasing pakistan will on-lend to small and medium enterprises in their respective markets in the form of leases or medium-term loans.
FI 17.00 — — — — — 17.00
packages limited, a producer of paper, paperboard and packaging material, will upgrade, expand, and relocate its operations.
B — 5.00 — — — — 5.00
pakistan International Container terminal will increase its container handling capacity and undertake civil works to increase its capacity to accommodate expected traffic levels.
B 8.00 — — — — — 8.00
paktel limited will expand its existing cellular phone operations by extending coverage and enhancing network capacity and by increasing resources on marketing and distribution.
C 35.00 — — — — — 35.00
tameer microfinance Bank* will focus its microfinance lending operations on urban self-employed small businesses.
FI — 1.01 — — — — 1.01
saudi arabia
Kingdom Installment Company will grow its housing finance operations and establish a market-based housing finance program.
C — — 25.00 — — — 25.00 TBD**
saudi orix leasing Company will utilize extra funding for on-lending to small and medium enterprises.
FI 17.00 — — — — — 17.00
syrian arab republic
Bank of syria and overseas* will provide modern commercial banking products and enhance competi-tion in the banking system by creating a model of international best practices.
C — 0.03 — — — — 0.03
Yemen, republic of
national Cement Company will design, construct, and operate a greenfield, integrated cement plant.
B 35.00 — — — — — 35.00
GLobaL
planet Finance* will provide microfinance institu-tions worldwide with funding and services such as IT support, training, and capacity building.
FI — 2.7� — — — — 2.79
proCredit Holding* will increase the scale of its credit and financial services to individual entre-preneurs, microenterprises, and small businesses.
C — 13.0� — — — — 13.09
**Mobilizationamounttobedetermined—thisprojecthadnotgonetomarketasofJune30,2006andwillbereportedinFY07.

PAGE 88 IFc annual report 2006
Sub-Saharan africa 90
East asia and the Pacific 101
South asia 109
Europe and Central asia 113
Latin america and the Caribbean 124
Middle East and north africa 136
Global 141investment Portfolio
Cumulative Commitments1 (uS$ thousands)
Cumulative Commitments1 (uS$ thousands)
STaTEMEnT of CuMuLaTivE GroSS CoMMiTMEnTS (at June 30, 2006)
Afghanistan 4 56,822 — 56,822
Albania 10 127,38� 8,�17 136,306
Algeria 11 146,418 5,557 151,�75
Angola 5 13,810 — 13,810
Argentina 173 3,228,604 2,75�,464 5,�88,068
Armenia 5 17,287 — 17,287
Australia 2 �75 — �75
Azerbaijan 17 180,875 72,�30 253,805
Bangladesh 21 270,872 52,745 323,617
Barbados 3 8,625 — 8,625
Belarus 5 33,767 — 33,767
Belize 3 21,500 11,000 32,500
Benin 8 2,�3� — 2,�3�
Bhutan 1 10,000 — 10,000
Bolivia 28 336,705 140,500 477,205
Bosnia and herzegovina
24 200,135 10,578 210,713
Botswana 5 8,6�3 — 8,6�3
Brazil 181 4,725,677 3,504,2�2 8,22�,�68
Bulgaria 20 345,515 86,�11 432,426
Burkina Faso 7 5,648 — 5,648
Burundi 3 6,626 — 6,626
Cambodia 5 2�,243 — 2�,243
Cameroon 2� 3�2,761 471,500 864,261
Cape Verde 5 10,00� — 10,00�
Chad 3 15,172 13,�00 2�,072
Chile 44 1,014,�2� 611,733 1,626,662
China 125 2,141,427 657,554 2,7�8,�81
Colombia 73 1,244,135 487,631 1,731,766
Congo Republic 6 115,005 25,000 140,005
Congo, Democratic Republic of
13 81,273 — 81,273
Costa Rica 16 210,504 ��,70� 310,213
Côte d’Ivoire 40 265,016 70,�64 335,�80
Croatia 12 355,5�6 �7,657 453,253
Cyprus 6 1�,681 645 20,327
Czech Republic 16 3�6,808 245,588 642,3�6
Dominica 1 700 — 700
Dominican Republic 23 3�1,8�� 216,850 608,74�
Ecuador 17 156,506 16,240 172,746
Egypt 5� 1,08�,241 504,871 1,5�4,113
El Salvador 15 247,368 113,500 360,868
Eritrea 1 �4� — �4�
Estonia 11 137,806 11,855 14�,661
Ethiopia 4 21,848 1,71� 23,567
Fiji 7 25,05� 2,500 27,55�
Finland 4 1,233 1,�15 3,148
Gabon 5 145,588 110,000 255,588
Gambia, The 8 6,�43 — 6,�43
Georgia � �4,212 — �4,212
Ghana 43 363,661 272,000 635,661
Greece 7 26,2�2 41,107 67,400
Grenada 2 8,000 — 8,000
Guatemala 1� 287,685 110,000 3�7,685
Guinea � 33,684 — 33,684
Guinea-Bissau 4 7,246 — 7,246
Guyana 5 �,530 — �,530
haiti 3 16,�11 — 16,�11
honduras 8 63,832 7�,401 143,233
hungary 30 437,555 70,335 507,8�0
India 1�� 3,511,4�2 �25,057 4,436,54�
Indonesia �1 1,83�,875 1,1�5,871 3,035,746
Iran, Islamic Republic of
11 63,343 8,1�� 71,542
Iraq 3 108,212 — 108,212
Israel 1 10,500 — 10,500
Italy 1 �60 — �60
Jamaica 17 264,882 14�,6�4 414,576
Jordan 30 265,848 70,250 336,0�8
Kazakhstan 22 372,253 172,�17 545,170
Kenya 66 364,442 5�,2�5 423,736
Korea, Republic of 50 866,44� 1�5,700 1,062,14�
Kyrgyz Republic 10 53,761 — 53,761
Lao People’s Democratic Republic
5 7,247 — 7,247
Latvia 6 80,�67 35,000 115,�67
Lebanon 27 336,522 230,430 566,�52
Lesotho 2 454 — 454
Country, region or other area
number of enterprises IFC
syndications & Guarantee participants total
Country, region or other area
number of enterprises IFC
syndications & Guarantee participants total
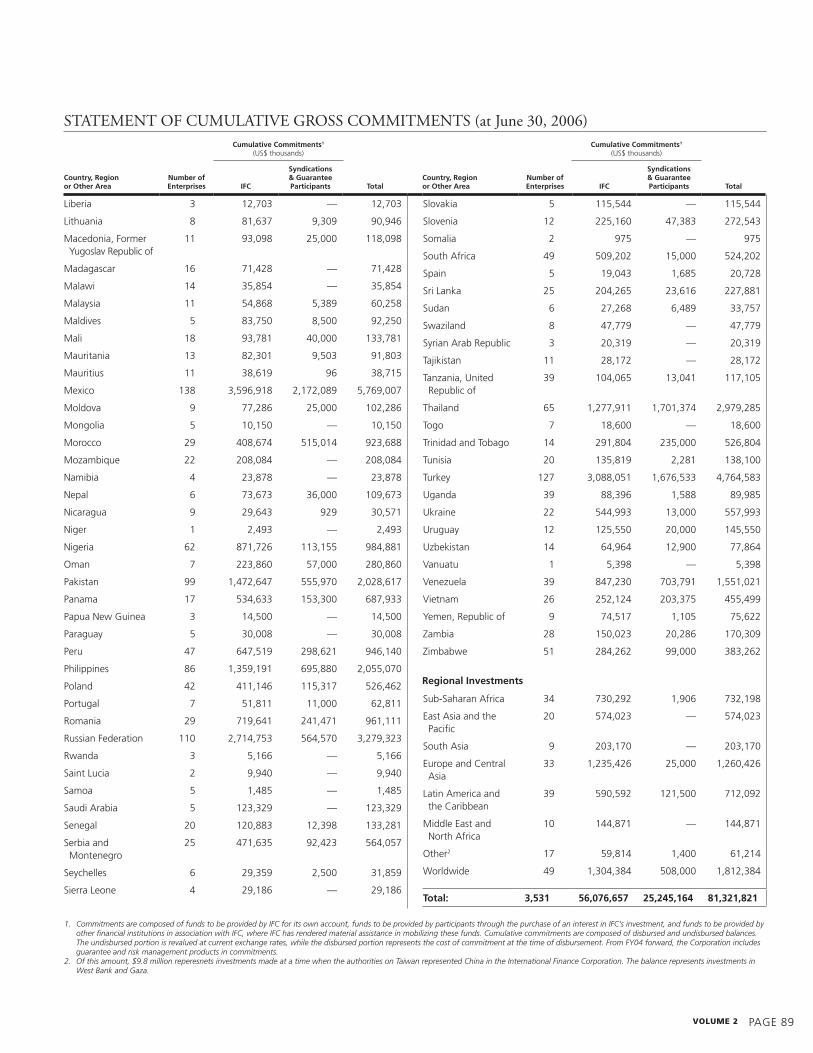
volume 2 PAGE 8�
Cumulative Commitments1 (uS$ thousands)
Cumulative Commitments1 (uS$ thousands)
STaTEMEnT of CuMuLaTivE GroSS CoMMiTMEnTS (at June 30, 2006)
Liberia 3 12,703 — 12,703
Lithuania 8 81,637 �,30� �0,�46
Macedonia, Former yugoslav Republic of
11 �3,0�8 25,000 118,0�8
Madagascar 16 71,428 — 71,428
Malawi 14 35,854 — 35,854
Malaysia 11 54,868 5,38� 60,258
Maldives 5 83,750 8,500 �2,250
Mali 18 �3,781 40,000 133,781
Mauritania 13 82,301 �,503 �1,803
Mauritius 11 38,61� �6 38,715
Mexico 138 3,5�6,�18 2,172,08� 5,76�,007
Moldova � 77,286 25,000 102,286
Mongolia 5 10,150 — 10,150
Morocco 2� 408,674 515,014 �23,688
Mozambique 22 208,084 — 208,084
Namibia 4 23,878 — 23,878
Nepal 6 73,673 36,000 10�,673
Nicaragua � 2�,643 �2� 30,571
Niger 1 2,4�3 — 2,4�3
Nigeria 62 871,726 113,155 �84,881
oman 7 223,860 57,000 280,860
Pakistan �� 1,472,647 555,�70 2,028,617
Panama 17 534,633 153,300 687,�33
Papua New Guinea 3 14,500 — 14,500
Paraguay 5 30,008 — 30,008
Peru 47 647,51� 2�8,621 �46,140
Philippines 86 1,35�,1�1 6�5,880 2,055,070
Poland 42 411,146 115,317 526,462
Portugal 7 51,811 11,000 62,811
Romania 2� 71�,641 241,471 �61,111
Russian Federation 110 2,714,753 564,570 3,27�,323
Rwanda 3 5,166 — 5,166
Saint Lucia 2 �,�40 — �,�40
Samoa 5 1,485 — 1,485
Saudi Arabia 5 123,32� — 123,32�
Senegal 20 120,883 12,3�8 133,281
Serbia and Montenegro
25 471,635 �2,423 564,057
Seychelles 6 2�,35� 2,500 31,85�
Sierra Leone 4 2�,186 — 2�,186
Slovakia 5 115,544 — 115,544
Slovenia 12 225,160 47,383 272,543
Somalia 2 �75 — �75
South Africa 4� 50�,202 15,000 524,202
Spain 5 1�,043 1,685 20,728
Sri Lanka 25 204,265 23,616 227,881
Sudan 6 27,268 6,48� 33,757
Swaziland 8 47,77� — 47,77�
Syrian Arab Republic 3 20,31� — 20,31�
Tajikistan 11 28,172 — 28,172
Tanzania, united Republic of
3� 104,065 13,041 117,105
Thailand 65 1,277,�11 1,701,374 2,�7�,285
Togo 7 18,600 — 18,600
Trinidad and Tobago 14 2�1,804 235,000 526,804
Tunisia 20 135,81� 2,281 138,100
Turkey 127 3,088,051 1,676,533 4,764,583
uganda 3� 88,3�6 1,588 8�,�85
ukraine 22 544,��3 13,000 557,��3
uruguay 12 125,550 20,000 145,550
uzbekistan 14 64,�64 12,�00 77,864
Vanuatu 1 5,3�8 — 5,3�8
Venezuela 3� 847,230 703,7�1 1,551,021
Vietnam 26 252,124 203,375 455,4��
yemen, Republic of � 74,517 1,105 75,622
Zambia 28 150,023 20,286 170,30�
Zimbabwe 51 284,262 ��,000 383,262
Sub-Saharan Africa 34 730,2�2 1,�06 732,1�8
East Asia and the Pacific
20 574,023 — 574,023
South Asia � 203,170 — 203,170
Europe and Central Asia
33 1,235,426 25,000 1,260,426
Latin America and the Caribbean
3� 5�0,5�2 121,500 712,0�2
Middle East and North Africa
10 144,871 — 144,871
other2 17 5�,814 1,400 61,214
Worldwide 4� 1,304,384 508,000 1,812,384
total: 3,531 56,076,657 25,245,164 81,321,821
Country, region or other area
number of enterprises IFC
syndications & Guarantee participants total
Country, region or other area
number of enterprises IFC
syndications & Guarantee participants total
regional Investments
1. CommitmentsarecomposedoffundstobeprovidedbyIFCforitsownaccount,fundstobeprovidedbyparticipantsthroughthepurchaseofaninterestinIFC’sinvestment,andfundstobeprovidedbyotherfinancialinstitutionsinassociationwithIFC,whereIFChasrenderedmaterialassistanceinmobilizingthesefunds.Cumulativecommitmentsarecomposedofdisbursedandundisbursedbalances.Theundisbursedportionisrevaluedatcurrentexchangerates,whilethedisbursedportionrepresentsthecostofcommitmentatthetimeofdisbursement.FromFY04forward,theCorporationincludesguaranteeandriskmanagementproductsincommitments.
2. Ofthisamount,$9.8millionreperesnetsinvestmentsmadeatatimewhentheauthoritiesonTaiwanrepresentedChinaintheInternationalFinanceCorporation.ThebalancerepresentsinvestmentsinWestBankandGaza.

PAGE �0 IFc annual report 2006
original Commitments1
(uS$ millions)Investments Held for IFC2
(uS$ millions)
Country, region or other area, and obligor sectorFiscal Year in Which Commitments Were made
total IFC
total syndications
loan
equity
total loans and equity
angola
Enterprise Bank of Angola Finance & Insurance Fy04 0.7 — — 0.7 0.7
Fabrica de Bleach Corasol Limitada Chemicals Fy�� 0.6 — 0.6 — 0.6
Nossa Seguros Finance & Insurance Fy05 1.0 — — 1.0 1.0
oSEL Construction & Real Estate Fy05 10.0 — 10.0 — 10.0
10.6 1.7 12.3
Benin
Finadev Microfinance Finance & Insurance Fy01 0.3 — — 0.3 0.3
— 0.3 0.3
Botswana
Micro Provident Botswana Limited Finance & Insurance Fy05 3.� — — 4.0 4.0
— 4.0 4.0
Burkina Faso
SBPh S.A. Accommodation & Tourism Services
Fy05 2.6 — 2.5 — 2.5
Societe Voltaique de Plastique Sarl (SoVoLPLAS)
Chemicals Fy7� 0.5 — — 0.1 0.1
2.5 0.1 2.7
Burundi
Verreries du Burundi, S.A.R.L. Nonmetallic Mineral Product Manufacturing
Fy81, 87 5.7 — — 1.0 1.0
— 1.0 1.0
Cameroon
3T Cameroun Transportation & Warehousing Fy06 1.3 — 1.3 — 1.3
AES Sonel S. A. utilities Fy06 8�.4 — 88.0 — 88.0
Banque Internationale du Cameroun Pour L’Epargne et le Credit
Finance & Insurance Fy01 0.6 — — 0.� 0.�
Bata Societe Anonyme Camerounaise Textiles, Apparel, & Leather Fy75 0.4 — — 0.1 0.1
Cameroon oil Transportation Company oil, Gas, & Mining Fy01 86.1 86.1 53.6 — 53.6
Complexe Avicole de Mvog-Betsi Agriculture & Forestry Fy�6 0.4 — 0.1 — 0.1
FME-GAZ Chemicals Fy02 0.3 — 0.1 — 0.1
horizon Bilingual Education Complex Education Services Fy01 0.3 — 0.5 — 0.5
Nosa Sarl Chemicals Fy05 1.0 — 1.0 — 1.0
Notacam S.A. Textiles, Apparel, & Leather Fy�7 0.� — 0.� — 0.�
Pecten Cameroon Company oil, Gas, & Mining Fy�2, �6, �7, �8, 03 115.0 235.1 44.0 — 44.0
Prestige Bottling Company Food & Beverages Fy88 3.4 — — 0.3 0.3
Societe Agro-Industrielle et Commerciale du Cameroun
Agriculture & Forestry Fy00 0.4 — 0.1 — 0.1
Societe Industrielle Laitiere du Cameroun “SILAC”
Food & Beverages Fy87 2.7 — — 0.6 0.6
18�.6 1.� 1�1.5
Sub-Saharan afriCa

volume 2 PAGE �1
original Commitments1
(uS$ millions)Investments Held for IFC2
(uS$ millions)
Country, region or other area, and obligor sectorFiscal Year in Which Commitments Were made
total IFC
total syndications
loan
equity
total loans and equity
Cape Verde
Caixa Economica de Cabo Verde, S.A. Finance & Insurance Fy04 6.1 — 5.7 — 5.7
Growela Cabo Verde, Lda Textiles, Apparel, & Leather Fy�4 1.0 — 0.2 — 0.2
5.8 — 5.8
Chad
Finadev Tchad Finance & Insurance Fy03 0.2 — — 0.2 0.2
Tchad oil Transportation Company S.A. (ToTCo)
oil, Gas, & Mining Fy01 13.� 13.� 8.7 — 8.7
8.7 0.2 8.8
Congo republic
Congolaise des Bois Impregnes, S.A. Industrial & Consumer Products Fy87 1.8 — 2.1 0.3 2.4
Societe d’Etude de la Cellulose du Congo
Pulp & Paper Fy82 0.2 — — 0.2 0.2
2.1 0.4 2.6
Congo, Democratic republic of
Adastra Minerals Inc oil, Gas, & Mining Fy06 — — — 0.1 0.1
Celtel Congo (RDC) s.p.r.l. Information Fy00, 03 27.0 — 8.6 — 8.6
Kingamyambo Musonoi Tailings SARL oil, Gas, & Mining Fy06 5.� — 0.5 4.8 5.3
Pro Credit Bank SARL Finance & Insurance Fy05 0.5 — — 0.5 0.5
Societe Financiere de Development Finance & Insurance Fy70 1.3 — — 1.3 1.3
Societe Textile de Kisangani S.Z.A.R.L. Textiles, Apparel, & Leather Fy85 6.6 — 10.5 0.4 10.�
1�.5 7.0 26.6
Côte d’Ivoire
Bank of Africa (Côte d’Ivoire) Finance & Insurance Fy��, 03 0.2 — — 0.2 0.2
Banque Ivoirienne de Development Industriel, S.A.
Finance & Insurance Fy65, 78 0.4 — — 0.4 0.4
Cinergy, S.A. utilities Fy�� 40.5 30.3 22.4 — 22.4
Devon Côte d’Ivoire Ltd. oil, Gas, & Mining Fy�3, �5, �6, �8 63.7 20.0 — 48.7* 48.7
Drop Ivoire Food & Beverages Fy�� 1.3 — 1.4 — 1.4
Etablissements R. Gonfreville, S.A. Textiles, Apparel, & Leather Fy77, 87 10.7 — — 1.7 1.7
Filature et Tissage Gonfreville Textiles, Apparel, & Leather Fy�6 — — 0.2 — 0.2
Industrial Promotion Services (Côte d’Ivoire) S.A.
Industrial & Consumer Products Fy88 0.� — — 0.8 0.8
Ivoir-Cafe S.A. Professional, Scientific, & Technical Services
Fy�3 0.1 — — + +
Moulin du Sud-ouest Food & Beverages Fy80 3.3 — — 0.4 0.4
Multi Produits S.A. Wholesale & Retail Trade Fy�4, �7 0.8 — 0.2 0.4 0.6
omnium Chimique et Cosmetique (CoSMIVoIRE) S.A.
Food & Beverages Fy87, �4, �7 �.1 — — 2.4 2.4
Petro Ivoire S.A. utilities Fy�6, 00 2.0 — 1.2 — 1.2
S.G.I. Africaine de Bourse S.A. Finance & Insurance Fy00 0.0 — — + +
Societe Ivoirenne d’Engrais (SIVENG) Chemicals Fy80 6.4 — — 1.3 1.3
Societe des Industries Alimentaires et Laitieres “SIALIM”
Food & Beverages Fy88, �0 4.� — 3.7 0.� 4.5
Sub-Saharan afriCa
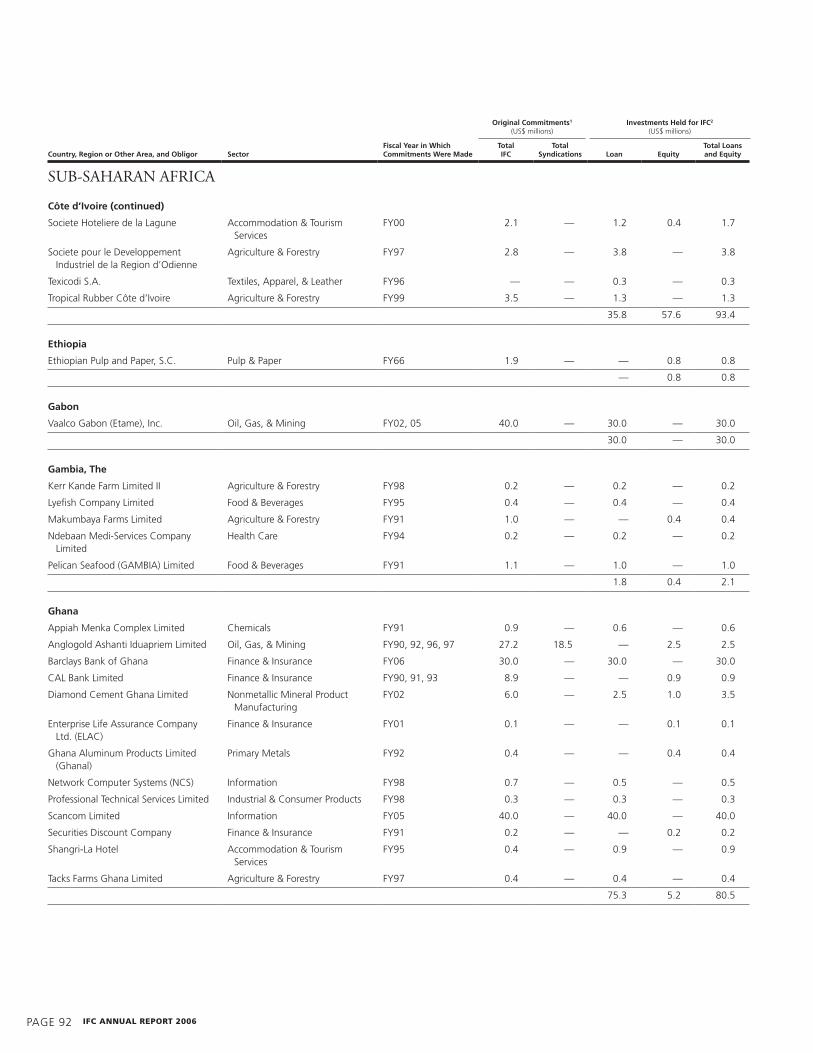
PAGE �2 IFc annual report 2006
original Commitments1
(uS$ millions)Investments Held for IFC2
(uS$ millions)
Country, region or other area, and obligor sectorFiscal Year in Which Commitments Were made
total IFC
total syndications
loan
equity
total loans and equity
Côte d’Ivoire (continued)
Societe hoteliere de la Lagune Accommodation & Tourism Services
Fy00 2.1 — 1.2 0.4 1.7
Societe pour le Developpement Industriel de la Region d’odienne
Agriculture & Forestry Fy�7 2.8 — 3.8 — 3.8
Texicodi S.A. Textiles, Apparel, & Leather Fy�6 — — 0.3 — 0.3
Tropical Rubber Côte d’Ivoire Agriculture & Forestry Fy�� 3.5 — 1.3 — 1.3
35.8 57.6 �3.4
ethiopia
Ethiopian Pulp and Paper, S.C. Pulp & Paper Fy66 1.� — — 0.8 0.8
— 0.8 0.8
Gabon
Vaalco Gabon (Etame), Inc. oil, Gas, & Mining Fy02, 05 40.0 — 30.0 — 30.0
30.0 — 30.0
Gambia, the
Kerr Kande Farm Limited II Agriculture & Forestry Fy�8 0.2 — 0.2 — 0.2
Lyefish Company Limited Food & Beverages Fy�5 0.4 — 0.4 — 0.4
Makumbaya Farms Limited Agriculture & Forestry Fy�1 1.0 — — 0.4 0.4
Ndebaan Medi-Services Company Limited
health Care Fy�4 0.2 — 0.2 — 0.2
Pelican Seafood (GAMBIA) Limited Food & Beverages Fy�1 1.1 — 1.0 — 1.0
1.8 0.4 2.1
Ghana
Appiah Menka Complex Limited Chemicals Fy�1 0.� — 0.6 — 0.6
Anglogold Ashanti Iduapriem Limited oil, Gas, & Mining Fy�0, �2, �6, �7 27.2 18.5 — 2.5 2.5
Barclays Bank of Ghana Finance & Insurance Fy06 30.0 — 30.0 — 30.0
CAL Bank Limited Finance & Insurance Fy�0, �1, �3 8.� — — 0.� 0.�
Diamond Cement Ghana Limited Nonmetallic Mineral Product Manufacturing
Fy02 6.0 — 2.5 1.0 3.5
Enterprise Life Assurance Company Ltd. (ELAC)
Finance & Insurance Fy01 0.1 — — 0.1 0.1
Ghana Aluminum Products Limited (Ghanal)
Primary Metals Fy�2 0.4 — — 0.4 0.4
Network Computer Systems (NCS) Information Fy�8 0.7 — 0.5 — 0.5
Professional Technical Services Limited Industrial & Consumer Products Fy�8 0.3 — 0.3 — 0.3
Scancom Limited Information Fy05 40.0 — 40.0 — 40.0
Securities Discount Company Finance & Insurance Fy�1 0.2 — — 0.2 0.2
Shangri-La hotel Accommodation & Tourism Services
Fy�5 0.4 — 0.� — 0.�
Tacks Farms Ghana Limited Agriculture & Forestry Fy�7 0.4 — 0.4 — 0.4
75.3 5.2 80.5
Sub-Saharan afriCa

volume 2 PAGE �3
original Commitments1
(uS$ millions)Investments Held for IFC2
(uS$ millions)
Country, region or other area, and obligor sectorFiscal Year in Which Commitments Were made
total IFC
total syndications
loan
equity
total loans and equity
Guinea
Societe Aurifere de Guinee S.A. oil, Gas, & Mining Fy88 8.3 — + — +
Societe Guineenne d’hotellerie et d’Investissements (SGhI)
Accommodation & Tourism Services
Fy�5, �� 4.7 — 1.� 0.6 2.4
1.� 0.6 2.4
Guinea-Bissau
Agribissau SARL Agriculture & Forestry Fy�5 0.� — — 0.1 0.1
Banco de Africa ocidental, S.A.R.L. Finance & Insurance Fy00 0.3 — — 0.3 0.3
— 0.4 0.4
Kenya
AAA Growers Agriculture & Forestry Fy00 0.5 — 0.2 — 0.2
Allpack Industries Limited Pulp & Paper Fy87 0.4 — — 0.4 0.4
Barclays BK KEN Finance & Insurance Fy06 10.0 — 10.0 — 10.0
Ceres Estates Limited Food & Beverages Fy�7 0.� — 0.� — 0.�
Deras Limited Textiles, Apparel, & Leather Fy�� 1.0 — 1.0 — 1.0
Diamond Trust of Kenya Limited Finance & Insurance Fy82 1.0 — — 0.8 0.8
Gapco Kenya Transportation & Warehousing Fy02 15.0 — 12.8 — 12.8
Industrial Promotion Service (Kenya) Ltd.—Premiere Food Industries Ltd.
Food & Beverages Fy�2 0.1 — — 0.1 0.1
Industrial Promotion Services (Kenya) Ltd.—Novaskins Tannery Ltd.
Textiles, Apparel, & Leather Fy�2 0.1 — — 0.1 0.1
Industrial Promotion Services (Kenya) Ltd.—Frigoken Ltd.
Transportation & Warehousing Fy�2 0.1 — — 0.1 0.1
International hotels (Kenya) Limited Accommodation & Tourism Services
Fy�5 6.0 — 0.� — 0.�
Investment & Mortgages Bank (Kenya) Ltd.
Finance & Insurance Fy05 3.0 — 3.0 — 3.0
K-Rep Bank Limited Finance & Insurance Fy�7, �� 1.4 — — 1.4 1.4
Kongoni River Farm Limited Agriculture & Forestry Fy05 2.0 — 1.� — 1.�
Lesiolo Grain handlers Limited Transportation & Warehousing Fy01 2.5 — 2.5 — 2.5
Locland Limited Agriculture & Forestry Fy�8 0.6 — 0.1 — 0.1
Mabati Rolling Mills Limited Industrial & Consumer Products Fy00 11.5 — 7.0 — 7.0
Magadi Soda Company Ltd. Chemicals Fy�6, 04, 05 35.0 — 26.0 — 26.0
Magana Flowers (K) Limited Agriculture & Forestry Fy00 1.2 — 0.7 — 0.7
oil Crop Development Limited Agriculture & Forestry Fy86 2.2 — — 0.7 0.7
Panafrican Paper Mills (E.A.) Limited Pulp & Paper Fy70, 74, 77, 7�, 81, 88, �0, �4, �6
67.0 3.� 25.8 — 25.8
Panari Center Limited Construction & Real Estate Fy06 7.3 — 7.3 — 7.3
Redhill Flowers (Kenya) Limited Agriculture & Forestry Fy�7 0.3 — 0.3 — 0.3
Rift Valley Textiles Limited Textiles, Apparel, & Leather Fy76 �.6 1.3 — 2.5 2.5
TPS Eastern Africa Limited Accommodation & Tourism Services
Fy72 1.6 0.8 — 2.2 2.2
Tsavo Power Company Ltd. utilities Fy00, 01 17.6 23.5 �.8 0.8 10.6
110.1 �.3 11�.4
Sub-Saharan afriCa
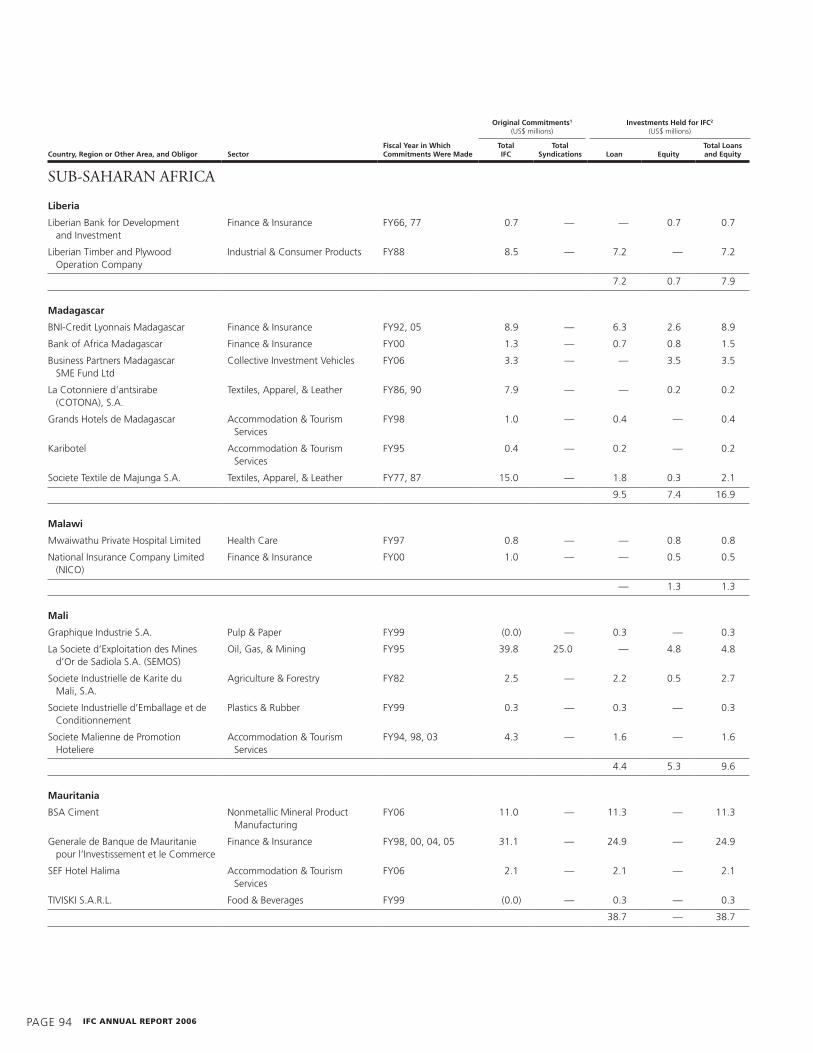
PAGE �4 IFc annual report 2006
original Commitments1
(uS$ millions)Investments Held for IFC2
(uS$ millions)
Country, region or other area, and obligor sectorFiscal Year in Which Commitments Were made
total IFC
total syndications
loan
equity
total loans and equity
liberia
Liberian Bank for Development and Investment
Finance & Insurance Fy66, 77 0.7 — — 0.7 0.7
Liberian Timber and Plywood operation Company
Industrial & Consumer Products Fy88 8.5 — 7.2 — 7.2
7.2 0.7 7.�
madagascar
BNI-Credit Lyonnais Madagascar Finance & Insurance Fy�2, 05 8.� — 6.3 2.6 8.�
Bank of Africa Madagascar Finance & Insurance Fy00 1.3 — 0.7 0.8 1.5
Business Partners Madagascar SME Fund Ltd
Collective Investment Vehicles Fy06 3.3 — — 3.5 3.5
La Cotonniere d’antsirabe (CoToNA), S.A.
Textiles, Apparel, & Leather Fy86, �0 7.� — — 0.2 0.2
Grands hotels de Madagascar Accommodation & Tourism Services
Fy�8 1.0 — 0.4 — 0.4
Karibotel Accommodation & Tourism Services
Fy�5 0.4 — 0.2 — 0.2
Societe Textile de Majunga S.A. Textiles, Apparel, & Leather Fy77, 87 15.0 — 1.8 0.3 2.1
�.5 7.4 16.�
malawi
Mwaiwathu Private hospital Limited health Care Fy�7 0.8 — — 0.8 0.8
National Insurance Company Limited (NICo)
Finance & Insurance Fy00 1.0 — — 0.5 0.5
— 1.3 1.3
mali
Graphique Industrie S.A. Pulp & Paper Fy�� (0.0) — 0.3 — 0.3
La Societe d’Exploitation des Mines d’or de Sadiola S.A. (SEMoS)
oil, Gas, & Mining Fy�5 3�.8 25.0 — 4.8 4.8
Societe Industrielle de Karite du Mali, S.A.
Agriculture & Forestry Fy82 2.5 — 2.2 0.5 2.7
Societe Industrielle d’Emballage et de Conditionnement
Plastics & Rubber Fy�� 0.3 — 0.3 — 0.3
Societe Malienne de Promotion hoteliere
Accommodation & Tourism Services
Fy�4, �8, 03 4.3 — 1.6 — 1.6
4.4 5.3 �.6
mauritania
BSA Ciment Nonmetallic Mineral Product Manufacturing
Fy06 11.0 — 11.3 — 11.3
Generale de Banque de Mauritanie pour l’Investissement et le Commerce
Finance & Insurance Fy�8, 00, 04, 05 31.1 — 24.� — 24.�
SEF hotel halima Accommodation & Tourism Services
Fy06 2.1 — 2.1 — 2.1
TIVISKI S.A.R.L. Food & Beverages Fy�� (0.0) — 0.3 — 0.3
38.7 — 38.7
Sub-Saharan afriCa

volume 2 PAGE �5
original Commitments1
(uS$ millions)Investments Held for IFC2
(uS$ millions)
Country, region or other area, and obligor sectorFiscal Year in Which Commitments Were made
total IFC
total syndications
loan
equity
total loans and equity
mauritius
Mauritius Venture Capital Fund Limited Collective Investment Vehicles Fy�6 1.6 — — + +
Saxon Management Limited and Saxon Properties Limited
Accommodation & Tourism Services
Fy�0 3.0 — — 1.0 1.0
Socota Textile Mills Limited Textiles, Apparel, & Leather Fy87 6.0 — — 1.0 1.0
— 2.0 2.0
mozambique
Ausmoz Farm holdings, Lda. Agriculture & Forestry Fy01 0.7 — 0.7 — 0.7
Auto Body Grand Prix Lda Industrial & Consumer Products Fy03 0.3 — 0.3 — 0.3
Cabo Caju, Lda. Food & Beverages Fy00 0.6 — 0.6 — 0.6
Companhia de Pescas da Zambezia Lda
Food & Beverages Fy�8 1.0 — 1.0 — 1.0
Empresa Nacional de hidrocarbonetos de Mocambique
oil, Gas, & Mining Fy04 18.5 — — 18.5* 18.5
Mozambique Aluminum S.A.R.L. (MoZAL)
Primary Metals Fy�8, 01 121.3 — �8.3 — �8.3
100.� 18.5 11�.4
namibia
Life office of Namibia Limited Finance & Insurance Fy�8, 01 1.6 — — 1.6 1.6
Novanam Limited Agriculture & Forestry Fy�5, �7, �8, 03 1�.4 — 8.0 — 8.0
8.0 1.6 �.6
niger
Les Moulines du Sahel, S.A. Food & Beverages Fy82 1.� — — 0.2 0.2
— 0.2 0.2
nigeria
Abuja International Diagnostic and Medical Center
health Care Fy�7 2.5 — 1.8 0.7 2.5
Access Bank Plc Finance & Insurance Fy06 15.0 — 15.0 — 15.0
Accion Nigeria Finance & Insurance Fy05 1.� — — 1.� 1.�
Adamac Industries Limited oil, Gas, & Mining Fy03 25.0 15.0 25.0 — 25.0
African Reinsurance Corporation Finance & Insurance Fy05 10.4 — — 10.4 10.4
Arewa Textiles, Ltd. Textiles, Apparel, & Leather Fy64, 67, 70, �2 6.6 0.7 — 0.6 0.6
Capital Alliance Private Equity (Mauritius), Ltd.
Collective Investment Vehicles Fy00 7.5 — — 7.2 7.2
Capital Alliance Private Equity II, Limited
Collective Investment Vehicles Fy06 �.6 — — �.6 �.6
Diamond Bank Plc Finance & Insurance Fy01, 05, 06 70.0 — 52.0 — 52.0
Fidelity Bank (previously FSB International Bank)
Finance & Insurance Fy01 18.0 — �.0 — �.0
First Securities Discount house Finance & Insurance Fy�3 0.� — — 0.� 0.�
Global Fabrics Manufacturers Limited Textiles, Apparel, & Leather Fy00 0.3 — 0.3 — 0.3
Guaranty Trust Bank Plc. Finance & Insurance Fy01, 04, 05, 06 �0.0 — 76.0 — 76.0
hercules Tyres Manufacturing Nigeria Limited
Plastics & Rubber Fy00 1.3 — 1.3 — 1.3
Sub-Saharan afriCa

PAGE �6 IFc annual report 2006
original Commitments1
(uS$ millions)Investments Held for IFC2
(uS$ millions)
Country, region or other area, and obligor sectorFiscal Year in Which Commitments Were made
total IFC
total syndications
loan
equity
total loans and equity
nigeria (continued)
IBTC Chartered Bank Plc (previously Investment Banking & Trust Company Plc)
Finance & Insurance Fy01, 06 50.0 — 50.0 — 50.0
Ikeja hotel Limited Accommodation & Tourism Services
Fy81, 85, 88 12.6 — — 1.5 1.5
Mid-East Nigeria Limited Nonmetallic Mineral Product Manufacturing
Fy�6 0.1 — 0.1 — 0.1
Niger Delta Contractor Revolving Credit Facility
Finance & Insurance Fy02 15.0 — 15.0 — 15.0
obajana Cement PLC Construction & Real Estate Fy05 75.0 — 75.0 — 75.0
oha Motors (Nigeria) Limited Transportation & Warehousing Fy01 0.� — 0.8 — 0.8
Safety Center International Limited Education Services Fy01 0.6 — 0.4 0.1 0.5
SocketWorks Ltd. Education Services Fy06 2.5 — 2.5 — 2.5
uPDC hotels Ltd Accommodation & Tourism Services
Fy04 11.0 — 10.6 — 10.6
Vinfessen Industries Limited Plastics & Rubber Fy�6 1.0 — 1.0 — 1.0
335.� 32.8 368.6
rwanda
Societe Rwandaise des Allumettes (SoRWAL), S.A.R.L.
Industrial & Consumer Products Fy88 1.2 — 1.0 0.2 1.2
1.0 0.2 1.2
senegal
African Seafood, S.A. Food & Beverages Fy86 3.0 — — 0.7 0.7
Banque de L’habitat du Senegal S.A. Finance & Insurance Fy80 0.4 — — 0.5 0.5
Bud Senegal, S.A. Agriculture & Forestry Fy72, 74, 76 0.� — — 0.8 0.8
Ciments du Sahel S.A. Nonmetallic Mineral Product Manufacturing
Fy00 17.5 — 13.1 2.3 15.4
GTi Dakar LLC utilities Fy�8 12.3 11.6 7.4 1.7 �.1
Kounoune Power S.A. utilities Fy06 20.6 — 21.4 — 21.4
Royal Saly S.A. Accommodation & Tourism Services
Fy02 1.0 — 1.4 — 1.4
Societe Financiere Senegalaise Pour le Developpement de L’Industrie Tourisme
Finance & Insurance Fy74, 85 0.3 — — 0.3 0.3
43.3 6.3 4�.5
somalia
Somali Bad Company Limited Plastics & Rubber Fy85 0.6 — 1.2 — 1.2
Somali Molasses Company Limited Transportation & Warehousing Fy81 0.4 — + — +
1.3 — 1.3
south africa
AEF Bulwer Timber Ltd. Industrial & Consumer Products Fy�� — — — 0.2 0.2
African Bank Limited Finance & Insurance Fy02, 04 16.6 — 2.3 — 2.3
The Biotech Venture Partners Fund Collective Investment Vehicles Fy02 1.8 — — 2.5 2.5
Carosa Farm (PTy) Limited Agriculture & Forestry Fy�7 0.6 — — 0.1 0.1
Sub-Saharan afriCa

volume 2 PAGE �7
original Commitments1
(uS$ millions)Investments Held for IFC2
(uS$ millions)
Country, region or other area, and obligor sectorFiscal Year in Which Commitments Were made
total IFC
total syndications
loan
equity
total loans and equity
south africa (continued)
Cheiron health Technologies (Pty) Ltd Professional, Scientific, & Technical Services
Fy00 1.3 — — 0.3 0.3
Dargle Timber (Pty) Limited/Bulwer Timber (Pty) Limited
Industrial & Consumer Products Fy�� 0.6 — 0.4 — 0.4
Decentralised Banking Solutions Consult (Pty) Limited
Information Fy00 0.8 — — 0.8 0.8
Edu-Loan (Pty) Ltd. Finance & Insurance Fy02 1.� — 1.1 — 1.1
Ethos Private Equity Fund V Collective Investment Vehicles Fy06 25.0 — — 25.0 25.0
FirstRand Limited Finance & Insurance Fy05 27.2 — 25.3 — 25.3
Formeset Printers Cape (Pty) Limited Pulp & Paper Fy01 — — 1.2 — 1.2
Foxtrot Meat Processors CC Food & Beverages Fy�� 0.5 — 0.3 — 0.3
hernic Ferrochrome Pty Limited oil, Gas, & Mining Fy04, 06 32.3 — 25.3 4.7 30.0
Kalahari Diamond Resources PLC oil, Gas, & Mining Fy03 2.0 — — 2.0 2.0
Karsten Farms (Pty) Limited Agriculture & Forestry Fy06 7.2 — 6.3 — 6.3
Midrand Days Inn Accommodation & Tourism Services
Fy�8 1.4 — — 0.4 0.4
Mvelaphanda Gold (Pty) Limited oil, Gas, & Mining Fy04 27.7 — 35.0 — 35.0
New Africa Mining Fund Collective Investment Vehicles Fy03 5.0 — — 4.0 4.0
Rubico holding SA (Pty) Ltd. Information Fy01, 02 6.3 — 1.3 5.0 6.3
SPV—Micawber 325 (Proprietary) Limited
oil, Gas, & Mining Fy04 — — — + +
South Africa Capital Growth Fund, Ltd. Collective Investment Vehicles Fy�6 20.0 — — + +
South Africa Franchise Equity Fund Limited
Collective Investment Vehicles Fy�5 2.8 — — 0.2 0.2
South Africa home Loans Finance & Insurance Fy00, 01, 02, 03, 04, 05
12.6 — 1.2 7.0 8.3
South Africa Private Equity Fund III, L.P. Collective Investment Vehicles Fy�� 35.0 — — �.6 �.6
Sphere Private Equity Fund I Collective Investment Vehicles Fy06 5.2 — — 4.4 4.4
Spier Estate hotel Accommodation & Tourism Services
Fy02 12.0 — 11.8 1.� 13.7
Standard Bank Group Limited (South Africa)
Finance & Insurance Fy06 75.0 — 75.0 — 75.0
Tusk Project Management (Pty) Ltd Professional, Scientific, & Technical Services
Fy01 1.8 — 1.5 0.1 1.6
188.0 68.2 256.1
sudan
Cotton Textile Mills, LTD. Textiles, Apparel, & Leather Fy76 10.0 — 8.1 1.3 �.3
Gezira Managil Textile Company Limited
Textiles, Apparel, & Leather Fy78 8.4 — 6.7 1.4 8.1
Khartoum Spinning and Weaving Company, Ltd.
Textiles, Apparel, & Leather Fy64, 72 0.7 1.5 — 0.3 0.3
River Nile Petroleum Company Limited Transportation & Warehousing Fy82 0.3 — — 0.3 0.3
Sudan Eagle Cement Company Ltd. Nonmetallic Mineral Product Manufacturing
Fy80 0.3 — — 0.2 0.2
14.8 3.5 18.2
Sub-Saharan afriCa

PAGE �8 IFc annual report 2006
original Commitments1
(uS$ millions)Investments Held for IFC2
(uS$ millions)
Sub-Saharan afriCa
Country, region or other area, and obligor sectorFiscal Year in Which Commitments Were made
total IFC
total syndications
loan
equity
total loans and equity
swaziland
Mbabane Concerte Centre (Pty) Limited
oil, Gas, & Mining Fy�2 0.7 — — 0.3 0.3
The Royal Swaziland Sugar Corporation Limited
Food & Beverages Fy78, 86 �.7 — — 0.5 0.5
Swazi Paper Mills Ltd. Pulp & Paper Fy�5, 02 8.8 — 4.1 — 4.1
Swaziland Industrial Development Company Limited
Finance & Insurance Fy87, �3 3.6 — — 1.0 1.0
Swazi Wattle Industries (Pty) Ltd Chemicals Fy01 1.1 — 0.8 0.2 1.0
4.� 2.0 6.�
tanzania, united republic of
Bonite Bottlers Limited Food & Beverages Fy05 10.0 — 10.0 — 10.0
Boundary hill Lodge Limited Accommodation & Tourism Services
Fy01 0.2 — 0.2 — 0.2
Exim Bank of Tanzania Finance & Insurance Fy02, 05 6.5 — 4.8 — 4.8
highland Soap and Allied Products Limited
Chemicals Fy78 1.8 — — 0.4 0.4
Indian ocean hotel Limited Accommodation & Tourism Services
Fy00 2.5 — 2.1 — 2.1
National Bank of Commerce (NBC) Finance & Insurance Fy01 10.0 — — 10.0 10.0
Tanzania Breweries Limited Food & Beverages Fy�5 6.0 — — 3.4 3.4
17.1 13.8 30.�
togo
Societe Togolaise de Products Marins (STPM)
Food & Beverages Fy�2, �5 0.3 — — 0.1 0.1
West African Cement Nonmetallic Mineral Product Manufacturing
Fy00 5.� — 0.2 — 0.2
0.2 0.1 0.3
uganda
Agro Management Limited Chemicals Fy�6 1.0 — 0.3 0.4 0.7
Clovergem Fish and Foods Limited Food & Beverages Fy�3 1.0 — 0.8 — 0.8
Development Finance Company of uganda Limited
Finance & Insurance Fy85, �3, �5, 05 11.0 — 10.0 — 10.0
Gomba Fishing Industries Limited Agriculture & Forestry Fy�� 1.4 — 0.4 — 0.4
Tilda (uganda) Limited Agriculture & Forestry Fy�� 1.� — 0.5 — 0.5
White Nile Dairies (uganda) Limited Food & Beverages Fy�� 0.3 — 0.1 — 0.1
12.2 0.4 12.6
Zambia
Celtel Zambia Limited Information Fy��, 00, 04 �.1 — 0.8 1.3 2.1
Chingola hotel Accommodation & Tourism Services
Fy02 1.0 — 0.4 — 0.4
Development Bank of Zambia Finance & Insurance Fy76 0.5 — — 0.5 0.5
Drilltech Engineering Limited oil, Gas, & Mining Fy�� 0.2 — 0.1 — 0.1
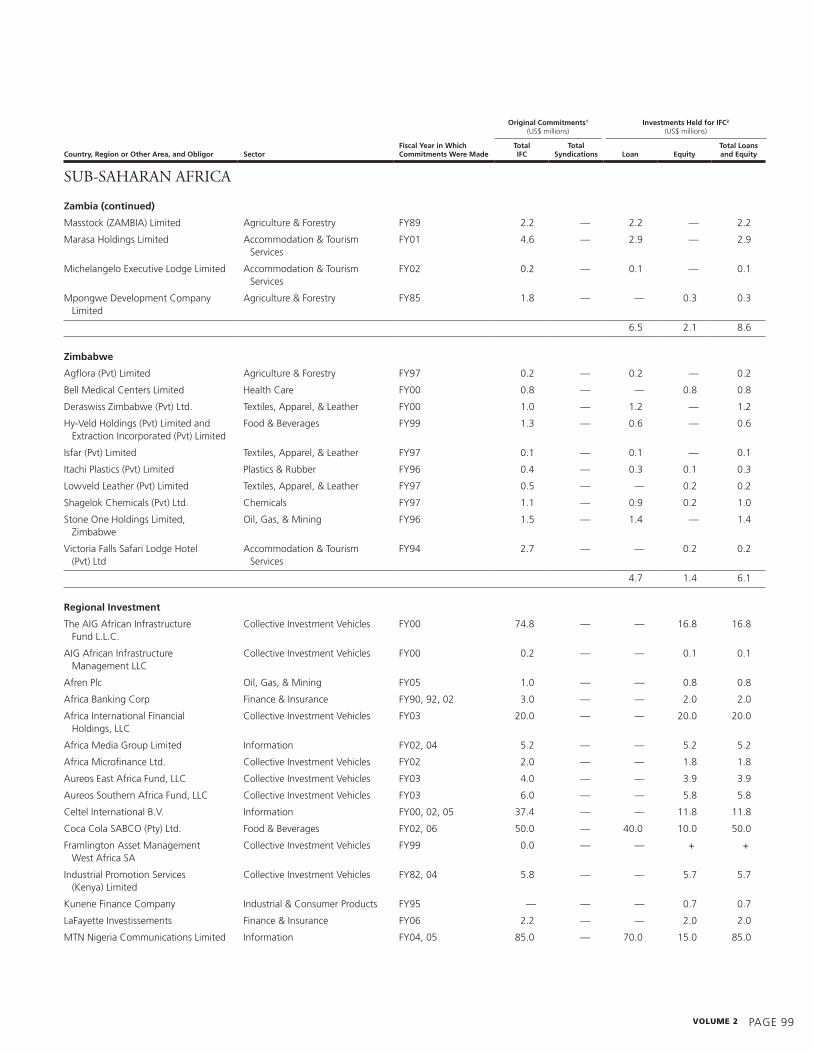
volume 2 PAGE ��
original Commitments1
(uS$ millions)Investments Held for IFC2
(uS$ millions)
Sub-Saharan afriCa
Country, region or other area, and obligor sectorFiscal Year in Which Commitments Were made
total IFC
total syndications
loan
equity
total loans and equity
Zambia (continued)
Masstock (ZAMBIA) Limited Agriculture & Forestry Fy8� 2.2 — 2.2 — 2.2
Marasa holdings Limited Accommodation & Tourism Services
Fy01 4.6 — 2.� — 2.�
Michelangelo Executive Lodge Limited Accommodation & Tourism Services
Fy02 0.2 — 0.1 — 0.1
Mpongwe Development Company Limited
Agriculture & Forestry Fy85 1.8 — — 0.3 0.3
6.5 2.1 8.6
Zimbabwe
Agflora (Pvt) Limited Agriculture & Forestry Fy�7 0.2 — 0.2 — 0.2
Bell Medical Centers Limited health Care Fy00 0.8 — — 0.8 0.8
Deraswiss Zimbabwe (Pvt) Ltd. Textiles, Apparel, & Leather Fy00 1.0 — 1.2 — 1.2
hy-Veld holdings (Pvt) Limited and Extraction Incorporated (Pvt) Limited
Food & Beverages Fy�� 1.3 — 0.6 — 0.6
Isfar (Pvt) Limited Textiles, Apparel, & Leather Fy�7 0.1 — 0.1 — 0.1
Itachi Plastics (Pvt) Limited Plastics & Rubber Fy�6 0.4 — 0.3 0.1 0.3
Lowveld Leather (Pvt) Limited Textiles, Apparel, & Leather Fy�7 0.5 — — 0.2 0.2
Shagelok Chemicals (Pvt) Ltd. Chemicals Fy�7 1.1 — 0.� 0.2 1.0
Stone one holdings Limited, Zimbabwe
oil, Gas, & Mining Fy�6 1.5 — 1.4 — 1.4
Victoria Falls Safari Lodge hotel (Pvt) Ltd
Accommodation & Tourism Services
Fy�4 2.7 — — 0.2 0.2
4.7 1.4 6.1
regional Investment
The AIG African Infrastructure Fund L.L.C.
Collective Investment Vehicles Fy00 74.8 — — 16.8 16.8
AIG African Infrastructure Management LLC
Collective Investment Vehicles Fy00 0.2 — — 0.1 0.1
Afren Plc oil, Gas, & Mining Fy05 1.0 — — 0.8 0.8
Africa Banking Corp Finance & Insurance Fy�0, �2, 02 3.0 — — 2.0 2.0
Africa International Financial holdings, LLC
Collective Investment Vehicles Fy03 20.0 — — 20.0 20.0
Africa Media Group Limited Information Fy02, 04 5.2 — — 5.2 5.2
Africa Microfinance Ltd. Collective Investment Vehicles Fy02 2.0 — — 1.8 1.8
Aureos East Africa Fund, LLC Collective Investment Vehicles Fy03 4.0 — — 3.� 3.�
Aureos Southern Africa Fund, LLC Collective Investment Vehicles Fy03 6.0 — — 5.8 5.8
Celtel International B.V. Information Fy00, 02, 05 37.4 — — 11.8 11.8
Coca Cola SABCo (Pty) Ltd. Food & Beverages Fy02, 06 50.0 — 40.0 10.0 50.0
Framlington Asset Management West Africa SA
Collective Investment Vehicles Fy�� 0.0 — — + +
Industrial Promotion Services (Kenya) Limited
Collective Investment Vehicles Fy82, 04 5.8 — — 5.7 5.7
Kunene Finance Company Industrial & Consumer Products Fy�5 — — — 0.7 0.7
LaFayette Investissements Finance & Insurance Fy06 2.2 — — 2.0 2.0
MTN Nigeria Communications Limited Information Fy04, 05 85.0 — 70.0 15.0 85.0

PAGE 100 IFc annual report 2006
original Commitments1
(uS$ millions)Investments Held for IFC2
(uS$ millions)
Sub-Saharan afriCa
Country, region or other area, and obligor sectorFiscal Year in Which Commitments Were made
total IFC
total syndications
loan
equity
total loans and equity
regional Investment (continued)
osprey oil and Gas Limited oil, Gas, & Mining Fy03 0.3 — — 0.3 0.3
Pan African Investment Partners Ltd. Collective Investment Vehicles Fy04 30.5 — — 27.5 27.5
Tullow oil Plc oil, Gas, & Mining Fy04 — — — 14.4 14.4
Veolia Water Africa Middle East India utilities Fy06 31.3 — — 31.4 31.4
West Africa Growth Fund Collective Investment Vehicles Fy�7 6.4 — — 1.8 1.8
110.0 177.0 287.0
total equity and loans 1,402.1 435.7 1,837.8
258.2
2,096.0
total guarantees and risk management products
total IFC portfolio for sub-saharan africa

volume 2 PAGE 101
original Commitments1
(uS$ millions)Investments Held for IFC2
(uS$ millions)
EaST aSia and ThE PaCifiC
Country, region or other area, and obligor sectorFiscal Year in Which Commitments Were made
total IFC
total syndications
loan
equity
total loans and equity
Cambodia
ACLEDA Finance & Insurance Fy00, 04, 06 12.6 — 10.3 1.6 11.8
Canadia Bank Limited Finance & Insurance Fy05 2.5 — 2.5 — 2.5
SEF hagar Soya Food & Beverages Fy03 0.5 — — 0.5 0.5
Societe Concessionaire de l’Aeroport Transportation & Warehousing Fy04 10.0 — �.2 — �.2
22.0 2.0 24.0
China
ASIMCo International Casting (Shanxi) Co., Ltd
Industrial & Consumer Products Fy00 16.5 — 12.6 — 12.6
Advantage China holdings Limited Finance & Insurance Fy02, 03 0.7 — — 0.7 0.7
Anhui Conch Cement Company Limited
Nonmetallic Mineral Product Manufacturing
Fy06 120.5 — 81.3 40.8 122.1
Anjia Group holdings Finance & Insurance Fy04 2.0 — — 2.0 2.0
Asian Strategic Investments Corporation Group
Industrial & Consumer Products Fy04, 06 14.1 — 4.1 10.0 14.1
Babei Group Co., Ltd. Textiles, Apparel, & Leather Fy05 16.0 6.0 — 5.0 5.0
Bank of Beijing (formerly BCCB) Finance & Insurance Fy05 57.� — — 5�.2 5�.2
Bank of Shanghai Finance & Insurance Fy00, 02 50.3 — — 50.3 50.3
Beijing Deqingyuan Agriculture Technology Co. Ltd
Agriculture & Forestry Fy06 2.8 — — 2.� 2.�
Beijing united Family hospital health Care Fy06 8.0 — 8.1 — 8.1
BioVeda China Fund L.P. Collective Investment Vehicles Fy05 3.0 — — 3.0 3.0
CDh China Capital Growth Fund II, L.P. Collective Investment Vehicles Fy05 18.0 — — 18.0 18.0
CDh China Fund, L.P. Collective Investment Vehicles Fy02 20.0 — — 2.0 2.0
CDh Venture Partners, L.P. Collective Investment Vehicles Fy06 20.0 — — 20.0 20.0
CSMC Technologies Corporation Industrial & Consumer Products Fy04 11.5 — — 11.5 11.5
CSRC China Corporation Chemicals Fy02, 05 23.0 — 16.3 3.0 1�.3
CT holdings Group Co. Ltd. utilities Fy05 40.0 — 40.0 — 40.0
CuNA Mutual Group Finance & Insurance Fy04 12.0 — — 12.0 12.0
Capital Today China Growth Fund, L.P. Collective Investment Vehicles Fy06 25.0 — — 25.0 25.0
Changchun TBK Shili Auto Parts Co., Ltd.
Industrial & Consumer Products Fy06 4.0 — 4.0 — 4.0
Changjiang BNP Paribas Peregrine Securities Co., Ltd.
Finance & Insurance Fy03 11.6 — — 12.0 12.0
Chengdu huarong Chemical Company Limited
Chemicals Fy�� 10.6 8.6 3.4 3.2 6.6
China Dynamic Growth Fund, L.P. Collective Investment Vehicles Fy�4 10.� — — 5.2 5.2
China Green Energy Limited utilities Fy04 20.0 — 20.0 — 20.0
China Medicine and Education International holding Co. Ltd.
Education Services Fy06 — — — 1.6 1.6
China Minsheng Banking Corp., Ltd. Finance & Insurance Fy03, 05 26.3 — — 26.3 26.3
China Re Life Finance & Insurance Fy04 15.3 — — 15.4 15.4
China Walden Management Limited Collective Investment Vehicles Fy�4 0.0 — — + +
China Walden Ventures Investment Limited
Collective Investment Vehicles Fy�4 7.5 — — + +
Chinasoft International Limited Information Fy06 15.0 — — 15.0 15.0
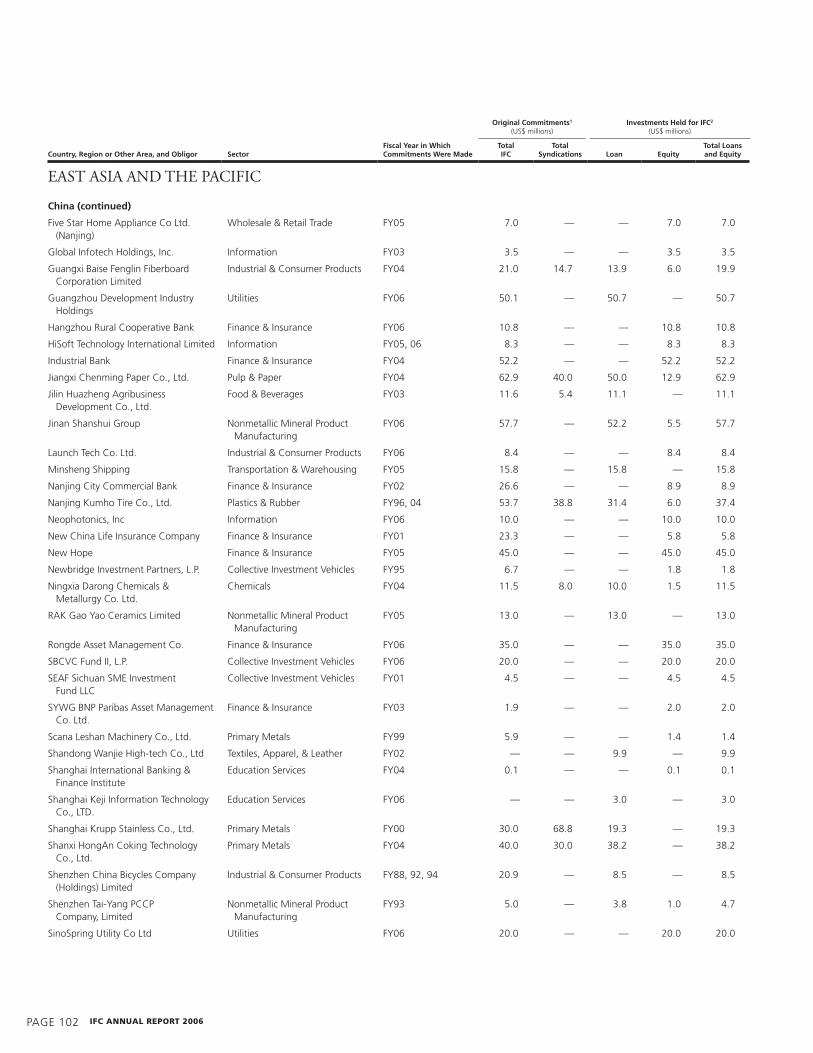
PAGE 102 IFc annual report 2006
original Commitments1
(uS$ millions)Investments Held for IFC2
(uS$ millions)
EaST aSia and ThE PaCifiC
Country, region or other area, and obligor sectorFiscal Year in Which Commitments Were made
total IFC
total syndications
loan
equity
total loans and equity
China (continued)
Five Star home Appliance Co Ltd. (Nanjing)
Wholesale & Retail Trade Fy05 7.0 — — 7.0 7.0
Global Infotech holdings, Inc. Information Fy03 3.5 — — 3.5 3.5
Guangxi Baise Fenglin Fiberboard Corporation Limited
Industrial & Consumer Products Fy04 21.0 14.7 13.� 6.0 1�.�
Guangzhou Development Industry holdings
utilities Fy06 50.1 — 50.7 — 50.7
hangzhou Rural Cooperative Bank Finance & Insurance Fy06 10.8 — — 10.8 10.8
hiSoft Technology International Limited Information Fy05, 06 8.3 — — 8.3 8.3
Industrial Bank Finance & Insurance Fy04 52.2 — — 52.2 52.2
Jiangxi Chenming Paper Co., Ltd. Pulp & Paper Fy04 62.� 40.0 50.0 12.� 62.�
Jilin huazheng Agribusiness Development Co., Ltd.
Food & Beverages Fy03 11.6 5.4 11.1 — 11.1
Jinan Shanshui Group Nonmetallic Mineral Product Manufacturing
Fy06 57.7 — 52.2 5.5 57.7
Launch Tech Co. Ltd. Industrial & Consumer Products Fy06 8.4 — — 8.4 8.4
Minsheng Shipping Transportation & Warehousing Fy05 15.8 — 15.8 — 15.8
Nanjing City Commercial Bank Finance & Insurance Fy02 26.6 — — 8.� 8.�
Nanjing Kumho Tire Co., Ltd. Plastics & Rubber Fy�6, 04 53.7 38.8 31.4 6.0 37.4
Neophotonics, Inc Information Fy06 10.0 — — 10.0 10.0
New China Life Insurance Company Finance & Insurance Fy01 23.3 — — 5.8 5.8
New hope Finance & Insurance Fy05 45.0 — — 45.0 45.0
Newbridge Investment Partners, L.P. Collective Investment Vehicles Fy�5 6.7 — — 1.8 1.8
Ningxia Darong Chemicals & Metallurgy Co. Ltd.
Chemicals Fy04 11.5 8.0 10.0 1.5 11.5
RAK Gao yao Ceramics Limited Nonmetallic Mineral Product Manufacturing
Fy05 13.0 — 13.0 — 13.0
Rongde Asset Management Co. Finance & Insurance Fy06 35.0 — — 35.0 35.0
SBCVC Fund II, L.P. Collective Investment Vehicles Fy06 20.0 — — 20.0 20.0
SEAF Sichuan SME Investment Fund LLC
Collective Investment Vehicles Fy01 4.5 — — 4.5 4.5
SyWG BNP Paribas Asset Management Co. Ltd.
Finance & Insurance Fy03 1.� — — 2.0 2.0
Scana Leshan Machinery Co., Ltd. Primary Metals Fy�� 5.� — — 1.4 1.4
Shandong Wanjie high-tech Co., Ltd Textiles, Apparel, & Leather Fy02 — — �.� — �.�
Shanghai International Banking & Finance Institute
Education Services Fy04 0.1 — — 0.1 0.1
Shanghai Keji Information Technology Co., LTD.
Education Services Fy06 — — 3.0 — 3.0
Shanghai Krupp Stainless Co., Ltd. Primary Metals Fy00 30.0 68.8 1�.3 — 1�.3
Shanxi hongAn Coking Technology Co., Ltd.
Primary Metals Fy04 40.0 30.0 38.2 — 38.2
Shenzhen China Bicycles Company (holdings) Limited
Industrial & Consumer Products Fy88, �2, �4 20.� — 8.5 — 8.5
Shenzhen Tai-yang PCCP Company, Limited
Nonmetallic Mineral Product Manufacturing
Fy�3 5.0 — 3.8 1.0 4.7
SinoSpring utility Co Ltd utilities Fy06 20.0 — — 20.0 20.0

volume 2 PAGE 103
original Commitments1
(uS$ millions)Investments Held for IFC2
(uS$ millions)
EaST aSia and ThE PaCifiC
Country, region or other area, and obligor sectorFiscal Year in Which Commitments Were made
total IFC
total syndications
loan
equity
total loans and equity
China (continued)
Southern Aluminum Industry (China) Co., Ltd.
Primary Metals Fy04 12.0 — 12.0 — 12.0
TianJin Dagang Newspring Co. Ltd. utilities Fy06 25.0 — 25.0 — 25.0
uBS Securities, Co, Ltd Finance & Insurance Fy06 1�.8 — — 20.0 20.0
VeriSilicon holdings Co., Ltd. Professional, Scientific, & Technical Services
Fy06 1.0 — — 1.0 1.0
Wumart Stores, Inc Wholesale & Retail Trade Fy04 6.5 — — 1.6 1.6
Xi’an City Commercial Bank Finance & Insurance Fy03 1�.� — — 20.5 20.5
Xinao Gas holdings Limited utilities Fy04 35.0 — 25.0 10.0 35.0
yangtze Special Situations Fund L.P. Collective Investment Vehicles Fy04 0.8 — — 0.8 0.8
yangtze Special Situations Fund, L.P. Collective Investment Vehicles Fy04 16.1 — — 16.1 16.1
yantai Changyu Group Company Limited
Food & Beverages Fy05 17.7 — — 18.1 18.1
yantai North Andre Juice Co., Ltd. Food & Beverages Fy05 15.0 — 8.0 7.0 15.0
Zhejiang Babei Necktie Co. Ltd. Textiles, Apparel, & Leather Fy05 — — 11.0 — 11.0
Zhejiang Glass Company Nonmetallic Mineral Product Manufacturing
Fy06 75.0 18.0 50.0 25.0 75.0
Zhong Chen Energy Storage Co. Ltd. Transportation & Warehousing Fy04 5.0 — — 5.0 5.0
Zhongda yanjin Power Generation Co. Ltd
utilities Fy06 21.� — 21.6 — 21.6
672.� 746.8 1,41�.7
Indonesia
P.T. Agro Muko Food & Beverages Fy�1 12.7 — — 2.2 2.2
P.T. Astra otoparts Tbk. Industrial & Consumer Products Fy�3, 05 24.0 — 24.0 1.� 25.�
P.T. Berlian Laju Tanker Transportation & Warehousing Fy�8 28.2 25.2 — 3.3 3.3
P.T. Daralon Textile Manufacturing Corporation
Textiles, Apparel, & Leather Fy72, 77, 7� 5.5 1.7 — 1.1 1.1
P.T. Gawi Makmur Kalimantan Food & Beverages Fy03 11.5 4.7 11.1 — 11.1
P.T. Indorama Synthetics Tbk. Textiles, Apparel, & Leather Fy�0, �1, �5, ��, 01, 03, 05
146.8 67.5 48.0 11.8 5�.8
P.T. Kabel Indonesia—KABELINDo Industrial & Consumer Products Fy71 2.2 1.0 — 0.4 0.4
P.T. Kia Keramik Mas Nonmetallic Mineral Product Manufacturing
Fy�2, �4, �6 31.1 63.5 18.8 �.0 27.8
P.T. Nusantara Tropical Fruit Agriculture & Forestry Fy�3 8.6 6.7 10.2 — 10.2
P.T. South Pacific Viscose Chemicals Fy�3, �6, 04 54.5 60.0 17.3 — 17.3
PT Alumindo Light Metal Industry Tbk. Primary Metals Fy�7 15.0 20.0 2.7 — 2.7
PT Astra International Tbk. Industrial & Consumer Products Fy�0, �1, �4, 03 36.� — — 0.5 0.5
PT Bank Buana Indonesia Tbk Finance & Insurance Fy03, 06 15.4 — — — —
PT Bank Danamon Indonesia TBK Finance & Insurance Fy06 150.0 — 150.0 — 150.0
PT Ecogreen oleochemicals Chemicals Fy04, 05 55.0 — 55.0 — 55.0
PT Grahawita Santika Accommodation & Tourism Services
Fy�6 11.8 — 3.8 — 3.8
PT KIA Serpih Mas Nonmetallic Mineral Product Manufacturing
Fy�5 21.2 55.0 15.0 6.2 21.2

PAGE 104 IFc annual report 2006
original Commitments1
(uS$ millions)Investments Held for IFC2
(uS$ millions)
EaST aSia and ThE PaCifiC
Country, region or other area, and obligor sectorFiscal Year in Which Commitments Were made
total IFC
total syndications
loan
equity
total loans and equity
Indonesia (continued)
PT Kalimantan Sanggar Pusaka (KSP) and Subsidiaries
Food & Beverages Fy�7 35.0 6.0 �.4 — �.4
PT Karunia Alam Segar Food & Beverages Fy04, 06 20.0 — 38.1 — 38.1
PT Megaplast Jayacitra Industrial & Consumer Products Fy�� 11.3 — — 2.5 2.5
PT Prakarsa Alam Segar Food & Beverages Fy04 35.0 10.0 16.� — 16.�
PT Sayap Mas utama Chemicals Fy�8 10.0 20.0 0.8 — 0.8
PT Sigma Cipta Caraka Information Fy01 3.0 — — 3.0 3.0
PT Sunson Textile Manufacturer Tbk. Textiles, Apparel, & Leather Fy02 12.4 8.2 11.6 — 11.6
PT Tirta Alam Segar Food & Beverages Fy06 7.0 — 7.0 — 7.0
PT Wings Surya Chemicals Fy�8 8.7 21.3 0.7 — 0.7
PT. Bank NISP Tbk. Finance & Insurance Fy�8, 01, 02, 04 53.6 — 35.0 7.7 42.7
PT. Buana Finance Tbk. Finance & Insurance Fy�3, �6 20.0 35.0 2.6 — 2.6
PT. Centralpertiwi Bahari Agriculture & Forestry Fy06 45.0 — 45.0 — 45.0
PT. Makro Indonesia Wholesale & Retail Trade Fy�3, 00, 06 2.0 — — 20.1 20.1
Wahana ottomitra Multiartha Finance & Insurance Fy05 20.0 — — 15.8 15.8
yayasan Pendidikan Asian Pasifik Education Services Fy04 1.0 — 1.0 — 1.0
yayasan Pendidikan Singapura Indonesia
Education Services Fy04 1.8 — 1.8 — 1.8
525.8 85.6 611.3
Korea, republic of
Asset Korea Capital Management Co. Ltd.
Collective Investment Vehicles Fy��, 02 0.� — — 0.� 0.�
CJ Development Co. Ltd. Finance & Insurance Fy01 — — 7.8 — 7.8
Dae Chang Industrial Company Limited Primary Metals Fy�� 22.3 �.8 4.8 7.1 11.�
halim & Co., Ltd. Food & Beverages Fy��, 05 21.5 — 14.0 — 14.0
hana Financial holding Co. Finance & Insurance Fy�8 — — — 14.6 14.6
Korea Development Investment Corp.—Dae Boo Battery Company Ltd.
Industrial & Consumer Products Fy�2 0.2 — — 0.2 0.2
Korea Development Investment Corp.—Daemyung Industrial Co., Ltd.
Textiles, Apparel, & Leather Fy�2 0.2 — — 0.2 0.2
Korea Development Investment Corp.—Seoshin Electronics Co., Ltd.
Industrial & Consumer Products Fy�2 0.3 — — 0.3 0.3
Korea Development Investment Corp.—Seoul Cad Mold & Tool Co.
Industrial & Consumer Products Fy�2 0.1 — — 0.1 0.1
Korea Development Investment Corp.—Sewon Electro-Mechanics Co. Ltd.
Industrial & Consumer Products Fy�2 0.3 — — 0.3 0.3
Korea Development Investment Corp.—Shin Chang Precision Co., Ltd.
Industrial & Consumer Products Fy�2 0.2 — — 0.2 0.2
Korea Development Investment Corp.—Sung Kwang Lighting Co., Ltd.
Industrial & Consumer Products Fy�2 0.1 — — 0.1 0.1
Korea Growth and Restructuring Fund, L.P.
Collective Investment Vehicles Fy00 35.0 — — 33.3 33.3
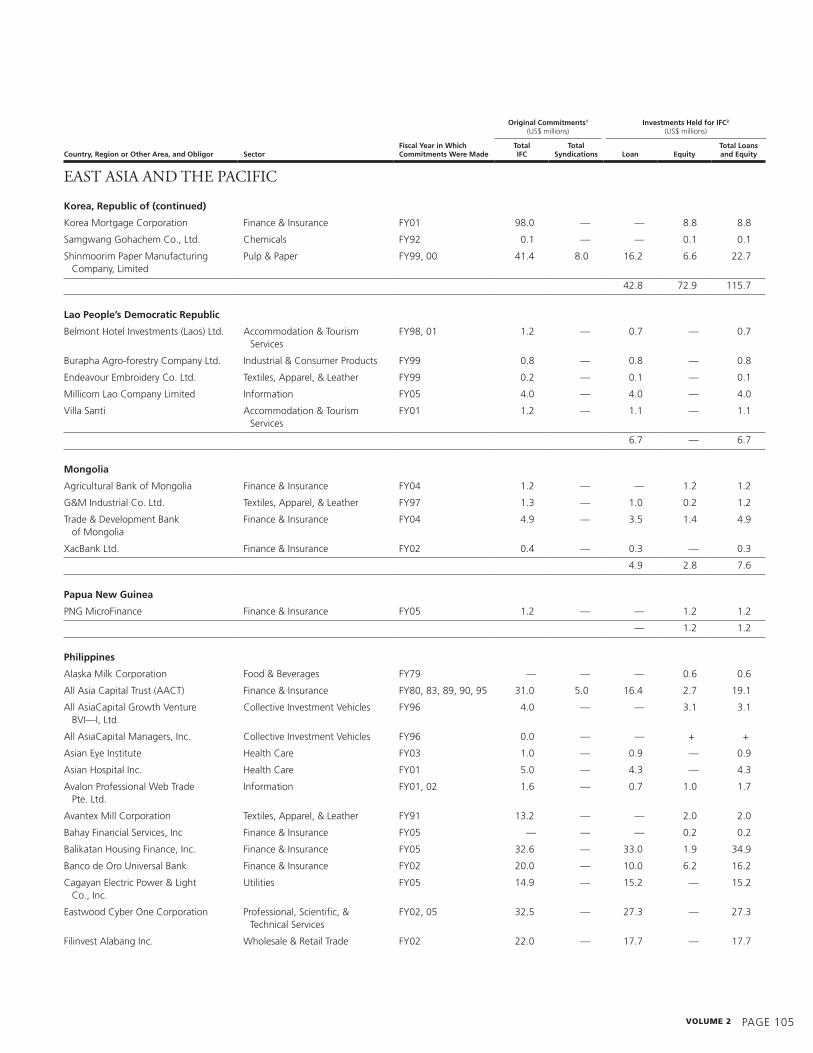
volume 2 PAGE 105
original Commitments1
(uS$ millions)Investments Held for IFC2
(uS$ millions)
EaST aSia and ThE PaCifiC
Country, region or other area, and obligor sectorFiscal Year in Which Commitments Were made
total IFC
total syndications
loan
equity
total loans and equity
Korea, republic of (continued)
Korea Mortgage Corporation Finance & Insurance Fy01 �8.0 — — 8.8 8.8
Samgwang Gohachem Co., Ltd. Chemicals Fy�2 0.1 — — 0.1 0.1
Shinmoorim Paper Manufacturing Company, Limited
Pulp & Paper Fy��, 00 41.4 8.0 16.2 6.6 22.7
42.8 72.� 115.7
lao people’s Democratic republic
Belmont hotel Investments (Laos) Ltd. Accommodation & Tourism Services
Fy�8, 01 1.2 — 0.7 — 0.7
Burapha Agro-forestry Company Ltd. Industrial & Consumer Products Fy�� 0.8 — 0.8 — 0.8
Endeavour Embroidery Co. Ltd. Textiles, Apparel, & Leather Fy�� 0.2 — 0.1 — 0.1
Millicom Lao Company Limited Information Fy05 4.0 — 4.0 — 4.0
Villa Santi Accommodation & Tourism Services
Fy01 1.2 — 1.1 — 1.1
6.7 — 6.7
mongolia
Agricultural Bank of Mongolia Finance & Insurance Fy04 1.2 — — 1.2 1.2
G&M Industrial Co. Ltd. Textiles, Apparel, & Leather Fy�7 1.3 — 1.0 0.2 1.2
Trade & Development Bank of Mongolia
Finance & Insurance Fy04 4.� — 3.5 1.4 4.�
XacBank Ltd. Finance & Insurance Fy02 0.4 — 0.3 — 0.3
4.� 2.8 7.6
papua new Guinea
PNG MicroFinance Finance & Insurance Fy05 1.2 — — 1.2 1.2
— 1.2 1.2
philippines
Alaska Milk Corporation Food & Beverages Fy7� — — — 0.6 0.6
All Asia Capital Trust (AACT) Finance & Insurance Fy80, 83, 8�, �0, �5 31.0 5.0 16.4 2.7 1�.1
All AsiaCapital Growth Venture BVI—I, Ltd.
Collective Investment Vehicles Fy�6 4.0 — — 3.1 3.1
All AsiaCapital Managers, Inc. Collective Investment Vehicles Fy�6 0.0 — — + +
Asian Eye Institute health Care Fy03 1.0 — 0.� — 0.�
Asian hospital Inc. health Care Fy01 5.0 — 4.3 — 4.3
Avalon Professional Web Trade Pte. Ltd.
Information Fy01, 02 1.6 — 0.7 1.0 1.7
Avantex Mill Corporation Textiles, Apparel, & Leather Fy�1 13.2 — — 2.0 2.0
Bahay Financial Services, Inc Finance & Insurance Fy05 — — — 0.2 0.2
Balikatan housing Finance, Inc. Finance & Insurance Fy05 32.6 — 33.0 1.� 34.�
Banco de oro universal Bank Finance & Insurance Fy02 20.0 — 10.0 6.2 16.2
Cagayan Electric Power & Light Co., Inc.
utilities Fy05 14.� — 15.2 — 15.2
Eastwood Cyber one Corporation Professional, Scientific, & Technical Services
Fy02, 05 32.5 — 27.3 — 27.3
Filinvest Alabang Inc. Wholesale & Retail Trade Fy02 22.0 — 17.7 — 17.7
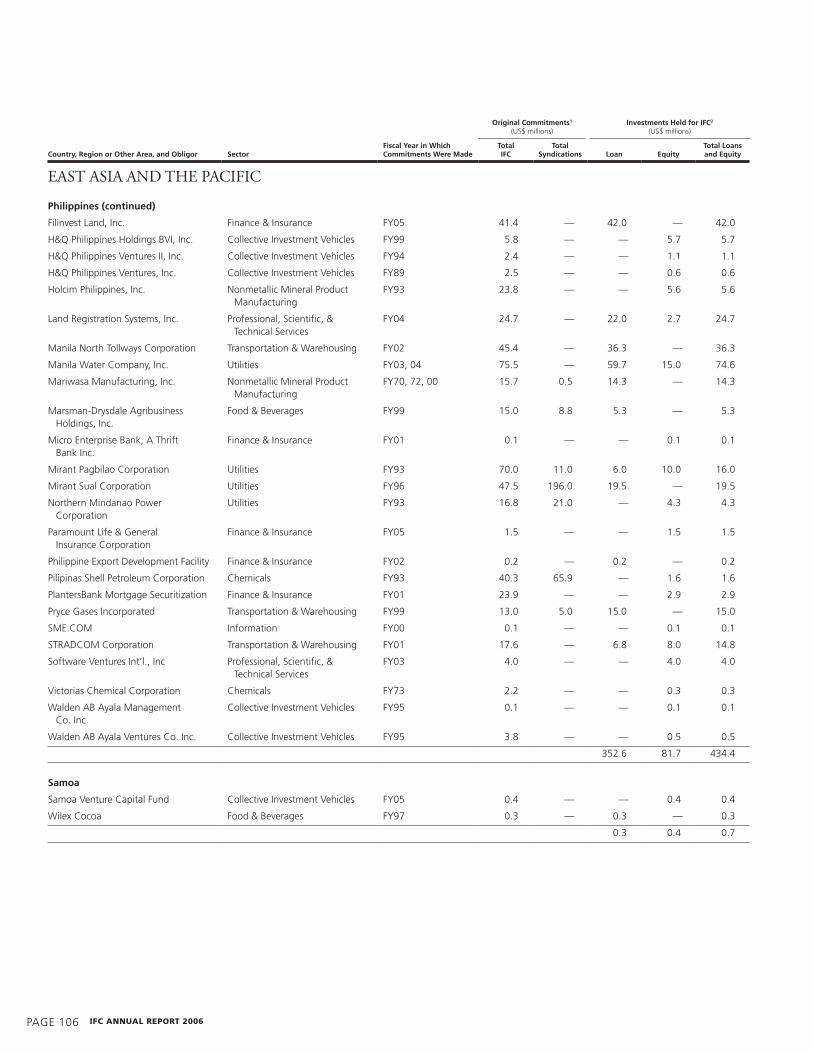
PAGE 106 IFc annual report 2006
original Commitments1
(uS$ millions)Investments Held for IFC2
(uS$ millions)
EaST aSia and ThE PaCifiC
Country, region or other area, and obligor sectorFiscal Year in Which Commitments Were made
total IFC
total syndications
loan
equity
total loans and equity
philippines (continued)
Filinvest Land, Inc. Finance & Insurance Fy05 41.4 — 42.0 — 42.0
h&Q Philippines holdings BVI, Inc. Collective Investment Vehicles Fy�� 5.8 — — 5.7 5.7
h&Q Philippines Ventures II, Inc. Collective Investment Vehicles Fy�4 2.4 — — 1.1 1.1
h&Q Philippines Ventures, Inc. Collective Investment Vehicles Fy8� 2.5 — — 0.6 0.6
holcim Philippines, Inc. Nonmetallic Mineral Product Manufacturing
Fy�3 23.8 — — 5.6 5.6
Land Registration Systems, Inc. Professional, Scientific, & Technical Services
Fy04 24.7 — 22.0 2.7 24.7
Manila North Tollways Corporation Transportation & Warehousing Fy02 45.4 — 36.3 — 36.3
Manila Water Company, Inc. utilities Fy03, 04 75.5 — 5�.7 15.0 74.6
Mariwasa Manufacturing, Inc. Nonmetallic Mineral Product Manufacturing
Fy70, 72, 00 15.7 0.5 14.3 — 14.3
Marsman-Drysdale Agribusiness holdings, Inc.
Food & Beverages Fy�� 15.0 8.8 5.3 — 5.3
Micro Enterprise Bank, A Thrift Bank Inc.
Finance & Insurance Fy01 0.1 — — 0.1 0.1
Mirant Pagbilao Corporation utilities Fy�3 70.0 11.0 6.0 10.0 16.0
Mirant Sual Corporation utilities Fy�6 47.5 1�6.0 1�.5 — 1�.5
Northern Mindanao Power Corporation
utilities Fy�3 16.8 21.0 — 4.3 4.3
Paramount Life & General Insurance Corporation
Finance & Insurance Fy05 1.5 — — 1.5 1.5
Philippine Export Development Facility Finance & Insurance Fy02 0.2 — 0.2 — 0.2
Pilipinas Shell Petroleum Corporation Chemicals Fy�3 40.3 65.� — 1.6 1.6
PlantersBank Mortgage Securitization Finance & Insurance Fy01 23.� — — 2.� 2.�
Pryce Gases Incorporated Transportation & Warehousing Fy�� 13.0 5.0 15.0 — 15.0
SME.CoM Information Fy00 0.1 — — 0.1 0.1
STRADCoM Corporation Transportation & Warehousing Fy01 17.6 — 6.8 8.0 14.8
Software Ventures Int’l., Inc Professional, Scientific, & Technical Services
Fy03 4.0 — — 4.0 4.0
Victorias Chemical Corporation Chemicals Fy73 2.2 — — 0.3 0.3
Walden AB Ayala Management Co. Inc.
Collective Investment Vehicles Fy�5 0.1 — — 0.1 0.1
Walden AB Ayala Ventures Co. Inc. Collective Investment Vehicles Fy�5 3.8 — — 0.5 0.5
352.6 81.7 434.4
samoa
Samoa Venture Capital Fund Collective Investment Vehicles Fy05 0.4 — — 0.4 0.4
Wilex Cocoa Food & Beverages Fy�7 0.3 — 0.3 — 0.3
0.3 0.4 0.7

volume 2 PAGE 107
original Commitments1
(uS$ millions)Investments Held for IFC2
(uS$ millions)
EaST aSia and ThE PaCifiC
Country, region or other area, and obligor sectorFiscal Year in Which Commitments Were made
total IFC
total syndications
loan
equity
total loans and equity
thailand
Bangkok Mass Transit System Public Company Limited
Transportation & Warehousing Fy�7, �� ��.7 — �.8 �.8 1�.7
Bumrungrad hospital Public Company Limited—BhPC
health Care Fy�4 — — — 0.2 0.2
Fabrinet Industrial & Consumer Products Fy04 3.0 — 1.2 — 1.2
Finance one publice company LTD credit line
Finance & Insurance Fy�5 30.0 147.� 17.5 — 17.5
hMC Polymers Company Limited Chemicals Fy88, �6 1�.0 11.0 — 3.� 3.�
Krung Thai IBJ Leasing Company, Ltd. (KILC)
Finance & Insurance Fy�2 0.4 — — 0.4 0.4
Lombard Thailand Intermediate Fund, LLC.
Collective Investment Vehicles Fy02 37.5 — — 33.8 33.8
Siam Asahi Technoglass Co. Ltd. Industrial & Consumer Products Fy�0 7.0 — — 6.4 6.4
Siam Industrial Credit Public Co Ltd Finance & Insurance Fy05 34.6 — 36.4 — 36.4
Thai Farmers Bank—Ladprao General hospital Co. Ltd.
health Care Fy�2 0.3 — — 0.3 0.3
Thai Petrochemical Industry Public Company Limited
Chemicals Fy�7, 02 �8.2 383.3 25.6 — 25.6
True Corporation Public Company Limited
Information Fy02 26.5 — 2�.3 — 2�.3
True Move Company Ltd. Information Fy05 33.0 — 36.3 — 36.3
Tuntex Petrochemicals (Thailand) Public Co. Ltd.
Chemicals Fy�4 24.� 137.5 — 4.� 4.�
united Palm oil Industry Public Company Limited
Food & Beverages Fy88 — — — 1.1 1.1
156.1 60.� 216.�
Vietnam
Asia Commercial Bank Finance & Insurance Fy03 5.0 — — 5.0 5.0
Dragon Capital Limited Collective Investment Vehicles Fy03 2.0 — — 1.8 1.8
Franco-Vietnamese hospital health Care Fy02 8.0 — 8.0 — 8.0
Global CyberSoft, Inc. Information Fy02 1.3 — — 1.3 1.3
Khai Vy Corporation and Duyen hai Corporation
Industrial & Consumer Products Fy05 6.0 — 6.0 — 6.0
Nghi Son Cement Corporation Nonmetallic Mineral Product Manufacturing
Fy�� (8.8) (7.7) 10.1 — 10.1
Paul Maitland International Industrial & Consumer Products Fy06 8.0 — 7.2 — 7.2
RMIT International university Vietnam (RIuV)
Education Services Fy02 7.3 — 7.3 — 7.3
Saigon Thuong Tin Commercial Joint Stock Bank
Finance & Insurance Fy03, 04, 05, 06 10.2 — — 10.2 10.2
Vietnam Enterprise Investment Limited Collective Investment Vehicles Fy02, 03 20.0 — 2.0 7.4 �.4
Vinh Phat Company Limited Textiles, Apparel, & Leather Fy�� 0.2 — 0.1 — 0.1
40.7 25.7 66.4
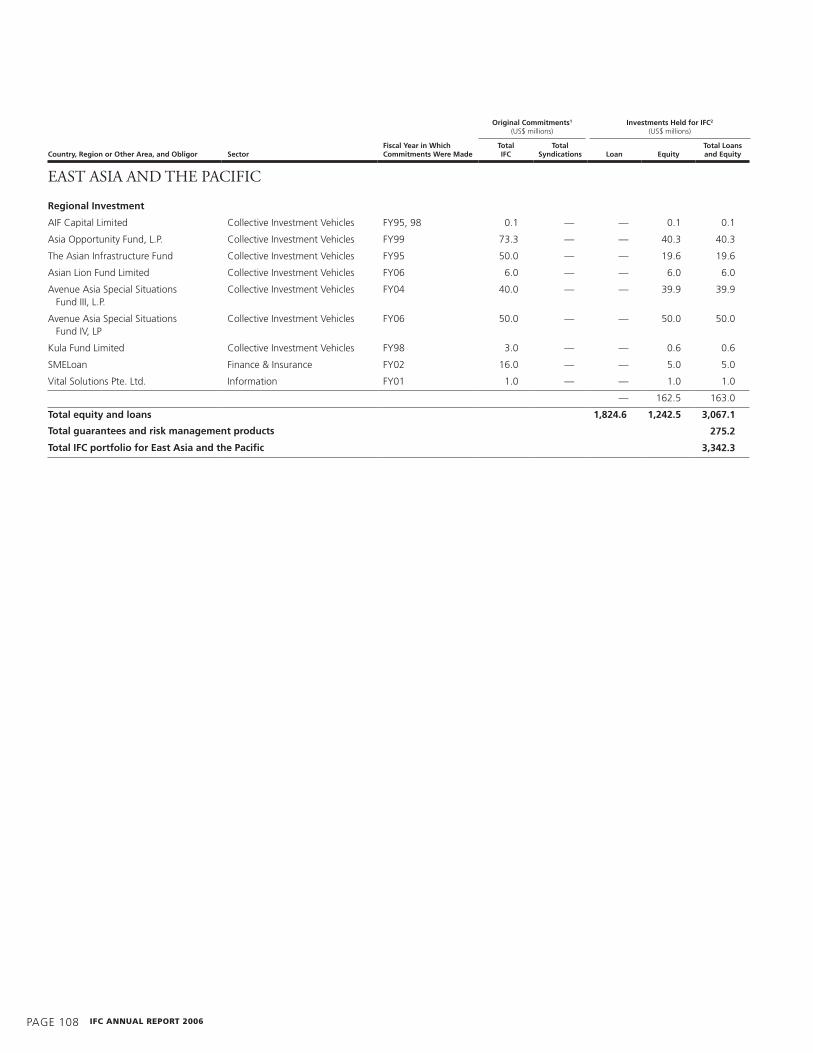
PAGE 108 IFc annual report 2006
original Commitments1
(uS$ millions)Investments Held for IFC2
(uS$ millions)
EaST aSia and ThE PaCifiC
Country, region or other area, and obligor sectorFiscal Year in Which Commitments Were made
total IFC
total syndications
loan
equity
total loans and equity
regional Investment
AIF Capital Limited Collective Investment Vehicles Fy�5, �8 0.1 — — 0.1 0.1
Asia opportunity Fund, L.P. Collective Investment Vehicles Fy�� 73.3 — — 40.3 40.3
The Asian Infrastructure Fund Collective Investment Vehicles Fy�5 50.0 — — 1�.6 1�.6
Asian Lion Fund Limited Collective Investment Vehicles Fy06 6.0 — — 6.0 6.0
Avenue Asia Special Situations Fund III, L.P.
Collective Investment Vehicles Fy04 40.0 — — 3�.� 3�.�
Avenue Asia Special Situations Fund IV, LP
Collective Investment Vehicles Fy06 50.0 — — 50.0 50.0
Kula Fund Limited Collective Investment Vehicles Fy�8 3.0 — — 0.6 0.6
SMELoan Finance & Insurance Fy02 16.0 — — 5.0 5.0
Vital Solutions Pte. Ltd. Information Fy01 1.0 — — 1.0 1.0
— 162.5 163.0
total equity and loans 1,824.6 1,242.5 3,067.1
275.2
3,342.3
total guarantees and risk management products
total IFC portfolio for east asia and the pacific

volume 2 PAGE 10�
original Commitments1
(uS$ millions)Investments Held for IFC2
(uS$ millions)
SouTh aSia
Country, region or other area, and obligor sectorFiscal Year in Which Commitments Were made
total IFC
total syndications
loan
equity
total loans and equity
Bangladesh
BRAC Bank Finance & Insurance Fy04 1.6 — — 1.6 1.6
DeltaBRAC housing Finance Corporation
Finance & Insurance Fy�8 3.0 — 1.� 0.7 2.6
Dynamic Textile Industries Limited Textiles, Apparel, & Leather Fy�2 2.5 2.0 1.� — 1.�
GrameenPhone Limited Information Fy04, 06 8�.0 — 83.0 — 83.0
Industrial Promotion and Development Company of Bangladesh Limited
Finance & Insurance Fy80, �� 11.1 — 3.1 — 3.1
Khulna Power Company Limited utilities Fy�� 22.5 21.6 10.4 — 10.4
Lafarge Surma Cement Limited Nonmetallic Mineral Product Manufacturing
Fy02 45.0 15.0 35.0 10.0 45.0
R.A.K. Ceramics (Bangladesh) Pvt. Ltd. Nonmetallic Mineral Product Manufacturing
Fy03 12.0 — 7.2 — 7.2
World Communications, Inc. Information Fy�8 0.0 — — + +
142.5 12.3 154.8
Bhutan
Bhutan Resorts Corporation Limited Accommodation & Tourism Services
Fy04 10.0 — �.4 — �.4
�.4 — �.4
India
AD hydro Power Limited utilities Fy05 4�.1 — 3�.7 7.0 46.7
APIDC Biotechnology Venture Fund Collective Investment Vehicles Fy05 4.0 — — 4.0 4.0
Andhra Pradesh Paper Mills Limited Pulp & Paper Fy05 40.0 — 35.0 5.0 40.0
Apollo hospitals Enterprise Limited health Care Fy06 5.1 — — 5.1 5.1
Apollo Tyres Limited Plastics & Rubber Fy03, 05 2�.4 15.0 23.3 — 23.3
Atul Limited Chemicals Fy06 17.0 — 16.� — 16.�
BhW-Birla home Finance Limited Finance & Insurance Fy04 21.2 — 20.7 — 20.7
Ballarpur Industries Limited Pulp & Paper Fy01, 04 15.0 — 15.0 — 15.0
Balrampur Chini Mills Ltd. Food & Beverages Fy03 14.� — 12.1 — 12.1
Bharat Biotech International Limited Chemicals Fy05 4.5 — — 4.5 4.5
Bharti Tele-Ventures Limited (BTVL) Information Fy01 20.0 — — 4.0 4.0
Bhartiya Samruddhi Finance Limited Finance & Insurance Fy01 1.0 — — 1.0 1.0
Bihar Sponge Iron Limited Primary Metals Fy85, �1 �.6 — 5.� — 5.�
CESC Limited utilities Fy�1, �3 51.5 67.0 11.1 — 11.1
CMS Computers Ltd Information Fy04 22.5 — — 12.5 12.5
Cairn Energy PLC oil, Gas, & Mining Fy04, 06 164.8 — 150.0 — 150.0
Chennai Water Desalination Limited utilities Fy06 25.1 — 24.� — 24.�
Continental Carbon India Limited Chemicals Fy01, 04, 06 18.0 11.5 13.0 2.0 15.0
Cosmo Films Limited Plastics & Rubber Fy03, 05 14.1 — 3.8 4.2 7.�
Crompton Greaves Ltd. Industrial & Consumer Products Fy04 15.0 — 14.4 — 14.4
DCM Shriram Consolidated Limited Chemicals Fy05, 06 45.0 — 45.0 — 45.0
DQ Entertainment Limited Information Fy03 3.0 — 1.5 1.5 3.0
Dabur Pharma Limited Chemicals Fy05 15.1 — — 15.1 15.1
Dewan housing Finance Corporation Ltd.
Finance & Insurance Fy03 12.0 — 10.5 — 10.5

PAGE 110 IFc annual report 2006
original Commitments1
(uS$ millions)Investments Held for IFC2
(uS$ millions)
SouTh aSia
Country, region or other area, and obligor sectorFiscal Year in Which Commitments Were made
total IFC
total syndications
loan
equity
total loans and equity
India (continued)
Eurolight Electricals Pvt. Ltd. Industrial & Consumer Products Fy�8 0.0 — — + +
The Federal Bank Limited Finance & Insurance Fy06 31.5 — — 31.5 31.5
GVK Industries Limited utilities Fy�6 37.5 45.5 — 7.5 7.5
Global Trade Finance (Pvt.) Limited Finance & Insurance Fy01, 06 3.5 — — 2.2 2.2
Global Trust Bank Limited Finance & Insurance Fy�4, �8, 00, 01 16.0 — — 1.4 1.4
hole-in-the-Wall Education Limited Education Services Fy02 1.6 — — 0.4 0.4
housing Development Finance Corporation Limited
Finance & Insurance Fy78, 87, �1, �3, 01, 03
147.8 100.0 100.0 — 100.0
ING Vysya Bank Finance & Insurance Fy01, 05 10.8 — — 7.2 7.2
Indecomm Global Services Information Fy06 2.6 — — 2.6 2.6
India Auto Ancillary Fund Collective Investment Vehicles Fy�� 2.3 — — 0.6 0.6
The India Direct Fund, L.P. Collective Investment Vehicles Fy�6 7.5 — — 6.2 6.2
Indian hydropower Development Company
utilities Fy06 15.0 — 14.� — 14.�
Indian Seamless Metal Tubes Limited Primary Metals Fy01 6.0 — 6.0 — 6.0
Indus Investments Mauritius Limited Collective Investment Vehicles Fy�6 0.0 — — + +
Indus Venture Investments Limited Collective Investment Vehicles Fy�6 5.0 — — 1.3 1.3
Indus Venture Management Limited Collective Investment Vehicles Fy�2 — — — + +
Infrastructure Development Finance Company Limited
Finance & Insurance Fy�8, 05 65.5 100.0 50.0 10.8 60.8
iLabs Investment Fund II, LLC Collective Investment Vehicles Fy06 20.0 — — 20.0 20.0
International Auto Limited Industrial & Consumer Products Fy06 10.0 — — �.8 �.8
JK Paper Ltd. Pulp & Paper Fy06 26.5 — 15.0 11.5 26.5
KPIT Cummins Infosystems Limited Professional, Scientific, & Technical Services
Fy05 13.5 — 11.0 2.5 13.5
Kotak Mahindra Bank Limited Finance & Insurance Fy05 22.0 — 22.0 — 22.0
L G Balakrishnan & Bros Industrial & Consumer Products Fy06 1�.7 — 14.3 4.8 1�.1
Larsen & Toubro Construction & Real Estate Fy03 50.0 — 50.0 — 50.0
Lok Capital LLC Finance & Insurance Fy06 2.0 — — 2.0 2.0
Mahindra & Mahindra Financial Services Limited
Finance & Insurance Fy02 17.2 — 16.0 — 16.0
Mahindra Infrastructure Developers Limited
utilities Fy01 10.0 — — 10.0 10.0
Mahindra Shubhlabh Services Limited Agriculture & Forestry Fy03 2.2 — — 2.3 2.3
Montalvo Systems Inc. Professional, Scientific, & Technical Services
Fy06 3.0 — — 3.0 3.0
Moser Baer India Limited Industrial & Consumer Products Fy�6, ��, 00 71.3 — 12.6 20.1 32.7
Nagarjuna Coated Tubes Limited Primary Metals Fy81 1.8 — — 0.2 0.2
Nevis Networks Inc. Information Fy06 4.0 — — 4.0 4.0
NewPath Ventures LLC Professional, Scientific, & Technical Services
Fy03, 04 13.0 — — 13.0 13.0
Nicco-uco Financial Services Limited Finance & Insurance Fy�3, �6, �7, �8 6.5 — 1.� — 1.�
Niko Resources Ltd. oil, Gas, & Mining Fy03 40.0 — 24.4 — 24.4
orchid Chemicals & Pharmaceuticals Limited
Chemicals Fy01 20.0 — — 0.7 0.7

volume 2 PAGE 111
original Commitments1
(uS$ millions)Investments Held for IFC2
(uS$ millions)
SouTh aSia
Country, region or other area, and obligor sectorFiscal Year in Which Commitments Were made
total IFC
total syndications
loan
equity
total loans and equity
India (continued)
owens Corning (India) Limited Nonmetallic Mineral Product Manufacturing
Fy�7 25.0 — 5.� — 5.�
PSL Limited Primary Metals Fy06 20.0 — 15.0 5.2 20.2
Powerlinks Transmission Limited utilities Fy04 74.6 — 73.4 — 73.4
RAK Ceramics India Pvt. Ltd. Nonmetallic Mineral Product Manufacturing
Fy04 20.0 — 20.0 — 20.0
Rain Calcining Limited Chemicals Fy�6, 05 34.7 — 10.0 2.3 12.3
Ramky Infrastructure Ltd. utilities Fy05 15.0 — 3.8 10.3 14.1
Ruchi Soya Industries Limited Food & Beverages Fy06 10.0 — — 10.0 10.0
SREI International Finance Limited Finance & Insurance Fy�8, 00 33.0 — �.7 — �.7
Sealion Sparkle Port & Terminal Services Limited
Transportation & Warehousing Fy05 4.� — 4.4 — 4.4
South Asian Regional Apex Fund Collective Investment Vehicles Fy�6 7.3 — — 5.7 5.7
Spryance, Inc. Information Fy01, 03 3.0 — — 3.0 3.0
Steuerung Anlage Pvt. Ltd. Industrial & Consumer Products Fy�8 0.1 — — 0.1 0.1
Sundaram Finance Limited Finance & Insurance Fy86, �3, �4, �5, 04 47.5 — 43.1 — 43.1
Sundaram home Finance Limited Finance & Insurance Fy00, 02 12.5 — 7.2 2.2 �.4
TAN India Limited Chemicals Fy8� — — + — +
TCW/ICICI Private Equity Fund, L.L.C. Collective Investment Vehicles Fy�8 10.0 — — 3.0 3.0
The Tata Iron and Steel Company Limited
Primary Metals Fy81, 86, �3, �4, 05 1�5.0 216.7 100.0 — 100.0
The Technology Development and Information Company of India Limited
Collective Investment Vehicles Fy�1 2.8 — — + +
united Phosphorus Limited Chemicals Fy04 17.5 — 15.5 — 15.5
united Riceland Limited Food & Beverages Fy�6, 05 18.5 — 14.1 — 14.1
usha Martin Limited Primary Metals Fy03 24.6 — — 0.7 0.7
Walden Nikko India Management Co. Ltd.
Collective Investment Vehicles Fy�8 0.0 — — + +
Walden-Nikko India Ventures Co., L.D.C.
Collective Investment Vehicles Fy�8 2.4 — — 1.7 1.7
1,102.� 285.6 1,388.5
maldives
Maldives Finance Leasing Company Limited
Finance & Insurance Fy02 4.3 — 2.7 1.3 3.�
Taj Maldives (Pvt.) Ltd Accommodation & Tourism Services
Fy04 8.5 8.5 7.6 — 7.6
universal Enterprises Pvt. Limited Accommodation & Tourism Services
Fy05 30.0 — 30.0 — 30.0
Villa Shipping and Trading Company Private Limited
Accommodation & Tourism Services
Fy�6, 03 21.0 — �.0 — �.0
Wataniya Telecom Maldives Pvt. Ltd. Information Fy06 20.0 — 20.0 — 20.0
6�.3 1.3 70.5
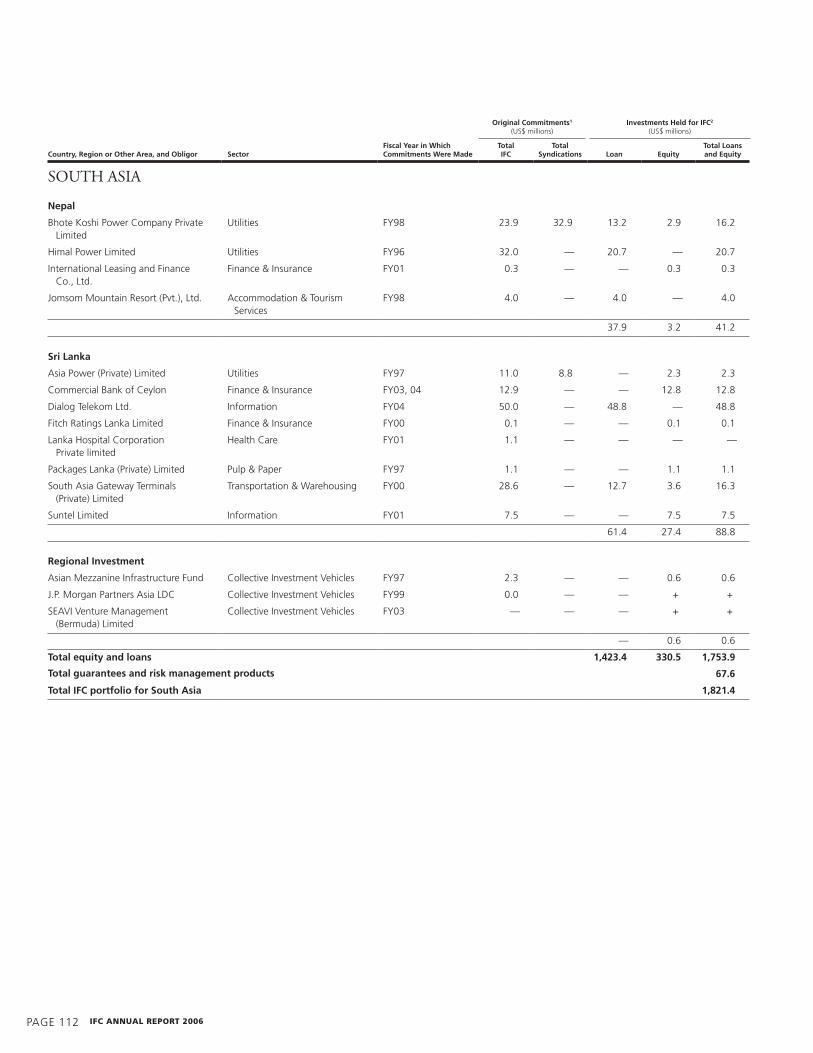
PAGE 112 IFc annual report 2006
original Commitments1
(uS$ millions)Investments Held for IFC2
(uS$ millions)
SouTh aSia
Country, region or other area, and obligor sectorFiscal Year in Which Commitments Were made
total IFC
total syndications
loan
equity
total loans and equity
nepal
Bhote Koshi Power Company Private Limited
utilities Fy�8 23.� 32.� 13.2 2.� 16.2
himal Power Limited utilities Fy�6 32.0 — 20.7 — 20.7
International Leasing and Finance Co., Ltd.
Finance & Insurance Fy01 0.3 — — 0.3 0.3
Jomsom Mountain Resort (Pvt.), Ltd. Accommodation & Tourism Services
Fy�8 4.0 — 4.0 — 4.0
37.� 3.2 41.2
sri lanka
Asia Power (Private) Limited utilities Fy�7 11.0 8.8 — 2.3 2.3
Commercial Bank of Ceylon Finance & Insurance Fy03, 04 12.� — — 12.8 12.8
Dialog Telekom Ltd. Information Fy04 50.0 — 48.8 — 48.8
Fitch Ratings Lanka Limited Finance & Insurance Fy00 0.1 — — 0.1 0.1
Lanka hospital Corporation Private limited
health Care Fy01 1.1 — — — —
Packages Lanka (Private) Limited Pulp & Paper Fy�7 1.1 — — 1.1 1.1
South Asia Gateway Terminals (Private) Limited
Transportation & Warehousing Fy00 28.6 — 12.7 3.6 16.3
Suntel Limited Information Fy01 7.5 — — 7.5 7.5
61.4 27.4 88.8
regional Investment
Asian Mezzanine Infrastructure Fund Collective Investment Vehicles Fy�7 2.3 — — 0.6 0.6
J.P. Morgan Partners Asia LDC Collective Investment Vehicles Fy�� 0.0 — — + +
SEAVI Venture Management (Bermuda) Limited
Collective Investment Vehicles Fy03 — — — + +
— 0.6 0.6
total equity and loans 1,423.4 330.5 1,753.9
67.6
total IFC portfolio for south asia 1,821.4
total guarantees and risk management products

volume 2 PAGE 113
original Commitments1
(uS$ millions)Investments Held for IFC2
(uS$ millions)
EuroPE and CEnTraL aSia
Country, region or other area, and obligor sectorFiscal Year in Which Commitments Were made
total IFC
total syndications
loan
equity
total loans and equity
albania
Fushe-Kruja Cement Factory Nonmetallic Mineral Product Manufacturing
Fy05 30.0 — 30.0 — 30.0
Insurance Institute of Albania Finance & Insurance Fy04 5.5 — — 6.2 6.2
National Commercial Bank Sh.A. Finance & Insurance Fy00 2.0 — — 2.0 2.0
ProCredit Bank Albania Finance & Insurance Fy00 1.1 — — 1.0 1.0
Vodafone Albania Sh.A Information Fy04 28.1 6.1 31.0 — 31.0
61.0 �.2 70.3
armenia
ACBA Leasing Finance & Insurance Fy03 2.3 — 2.0 0.3 2.3
Armeconombank Finance & Insurance Fy04 2.0 — 2.0 — 2.0
Armenia hotel Closed Joint Stock Company
Accommodation & Tourism Services
Fy01, 04 4.8 — — 4.8 4.8
Inecobank Finance & Insurance Fy06 3.0 — 3.0 — 3.0
NAREK LLC Construction & Real Estate Fy06 5.2 — 5.2 — 5.2
12.2 5.1 17.3
azerbaijan
AzeriGazbank Finance & Insurance Fy�8, 03, 06 6.� — 3.� 2.3 6.2
Baku hotel Company Accommodation & Tourism Services
Fy00 17.5 — 1.5 — 1.5
Microfinance Bank Azerbaijan Finance & Insurance Fy02, 04, 06 4.8 — 3.0 1.8 4.8
Rabitabank Finance & Insurance Fy�8, 03 1.6 — 0.� — 0.�
uniBank Finance & Insurance Fy06 5.0 — 5.0 — 5.0
14.3 4.1 18.3
Belarus
Detroit Belarus Brewing Company Food & Beverages Fy04, 06 10.5 — �.0 3.5 12.5
JSC Belgazprombank Finance & Insurance Fy05 5.0 — 5.0 — 5.0
Priorbank Joint Stock Company Finance & Insurance Fy03, 05 14.0 — 4�.3 — 4�.3
63.3 3.5 66.8
Bosnia and Herzegovina
Akova Impex, d.o.o. Food & Beverages Fy�� 2.1 — 0.2 — 0.2
Bosnalijek, d.d. Sarajevo Chemicals Fy��, 01, 05 13.� — �.6 1.8 11.5
Fabrika Cementa Lukavac Nonmetallic Mineral Product Manufacturing
Fy03 �.8 2.4 10.� — 10.�
hVB Central Profit Banka d.d. Finance & Insurance Fy02, 04, 05 23.2 — 11.1 15.6 26.6
horizonte Bosnia and herzegovina Enterprise Fund
Collective Investment Vehicles Fy�8 1.� — — 1.� 1.�
Konjuh d.d. Industrial & Consumer Products Fy�8 — — 1.7 — 1.7
Kozara d.d. Industrial & Consumer Products Fy�8 — — 1.7 — 1.7
Lijanovici d.o.o. Food & Beverages Fy�� 2.5 — 0.� — 0.�
MDD Lignosper Industrial & Consumer Products Fy�8 2.0 — 2.3 — 2.3
MI-BoSPo Finance & Insurance Fy06 2.6 — 2.5 — 2.5
Nova banka a.d., Bijeljina Finance & Insurance Fy06 12.4 — 12.6 — 12.6

PAGE 114 IFc annual report 2006
original Commitments1
(uS$ millions)Investments Held for IFC2
(uS$ millions)
EuroPE and CEnTraL aSia
Country, region or other area, and obligor sectorFiscal Year in Which Commitments Were made
total IFC
total syndications
loan
equity
total loans and equity
Bosnia and Herzegovina (continued)
Podgradci d.d. Industrial & Consumer Products Fy�8 — — 1.1 — 1.1
ProCredit Bank d.d. Finance & Insurance Fy�8, ��, 01, 03 4.2 — 2.8 — 2.8
Raiffeisen Bank d.d. Bosnia and herzegovina
Finance & Insurance Fy03, 05, 06 51.3 — 46.� — 46.�
Sarajevo Privatization Venture Ltd. Collective Investment Vehicles Fy02, 03 11.5 — — + +
Sour Energoinvest Industrial & Consumer Products Fy85 11.7 — �.8 — �.8
Tvornica Kartona I Ambalaze Cazin Pulp & Paper Fy77 8.0 7.1 4.3 — 4.3
118.4 1�.3 137.7
Bulgaria
Bulbank AD Finance & Insurance Fy01 17.3 — — 17.5 17.5
Drujba A.D. Nonmetallic Mineral Product Manufacturing
Fy04 24.3 — 22.6 — 22.6
EPIQ NV Industrial & Consumer Products Fy06 23.4 — 25.1 — 25.1
Epiq Electronic Assembly EooD Industrial & Consumer Products Fy01 5.5 — 4.1 — 4.1
Euromerchant Balkan Fund SICAV Collective Investment Vehicles Fy�5 5.0 — — 0.3 0.3
Kronospan Bulgaria EooD Industrial & Consumer Products Fy00, 01 1�.7 12.3 18.0 — 18.0
Paper Factory Stambolijski Pulp & Paper Fy02 25.5 — 5.5 — 5.5
ProCredit Bank (Bulgaria) AD Finance & Insurance Fy01, 03, 04 15.7 — 10.5 — 10.5
Sofia hilton Accommodation & Tourism Services
Fy�8 12.8 �.5 10.4 — 10.4
Stomana Industry A.D. Primary Metals Fy04, 06 44.2 — 43.1 — 43.1
Trakya Glass Bulgaria EAD Nonmetallic Mineral Product Manufacturing
Fy04 42.7 65.1 36.5 7.5 44.0
unionbank AD Finance & Insurance Fy03, 05 11.3 — 10.0 — 10.0
185.7 25.2 211.0
Croatia
Alpe Jadran Banka d.d. Finance & Insurance Fy�8 3.1 — 3.2 — 3.2
Belisce d.d. Pulp & Paper Fy73, 81, �8, 03 60.7 64.1 16.0 6.0 22.0
Belje d.d. Agriculture & Forestry Fy06 51.1 — 50.3 — 50.3
Brodogradiliste Industrial & Consumer Products Fy00 12.1 �.0 0.1 0.5 0.6
The CC Partnership L.P. Collective Investment Vehicles Fy�� 5.0 — — 4.� 4.�
Erste & Steiermarkische Bank d.d. Finance & Insurance Fy00, 03 36.4 — 21.� — 21.�
Privredna banka Zagreb d.d. Finance & Insurance Fy05 ��.4 — �4.2 — �4.2
185.7 11.4 1�7.1
Czech republic
CDV-1 holding Company, L.P. Finance & Insurance Fy01, 03 17.3 — — 1.3 1.3
The Czech and Slovak Private Equity Fund, L.P.
Collective Investment Vehicles Fy�5 2.5 — — 0.8 0.8
Duff & Phelps CZ, a.s. Finance & Insurance Fy�� 0.0 — — + +
hayes Wheels Autokola Nova hut, a.s. Industrial & Consumer Products Fy�4 16.1 21.5 3.2 — 3.2
3.2 2.1 5.3

volume 2 PAGE 115
original Commitments1
(uS$ millions)Investments Held for IFC2
(uS$ millions)
EuroPE and CEnTraL aSia
Country, region or other area, and obligor sectorFiscal Year in Which Commitments Were made
total IFC
total syndications
loan
equity
total loans and equity
estonia
horizon Tselluloosi Ja Paberi Aktsiaselts Pulp & Paper Fy�8, 00 13.1 — 4.6 1.1 5.7
4.6 1.1 5.7
Georgia
Bank of Georgia Finance & Insurance Fy00, 03 7.2 — 4.7 — 4.7
JSC Saatksio Szagadoeba MINA Nonmetallic Mineral Product Manufacturing
Fy�� 8.8 — 4.2 2.5 6.7
ProCredit Bank Finance & Insurance Fy��, 00, 01, 02, 04 12.1 — 6.4 2.2 8.6
TBC Bank Finance & Insurance Fy�8, 00, 02, 04, 05, 06
1�.6 — 5.6 �.6 15.2
TBC Leasing Finance & Insurance Fy05 3.0 — 3.0 — 3.0
TbilComBank Finance & Insurance Fy�� 1.0 — 0.5 — 0.5
24.5 14.3 38.8
Greece
Asbestos Mines of Northern Greece, Mining S.A.
oil, Gas, & Mining Fy80 11.1 — — 2.8 2.8
— 2.8 2.8
Hungary
First hungary Fund Limited Collective Investment Vehicles Fy�0 7.5 — — 2.1 2.1
honeywell ESCo hungary utilities Fy00 0.4 — — 0.4 0.4
Mirelite Budapest Frozen Food Company INC. (Mirelite)
Food & Beverages Fy�4 3.0 — — 3.0 3.0
— 5.5 5.5
Kazakhstan
ABN-AMRo Bank Kazakhstan Finance & Insurance Fy�4, �6, �8, 03 15.3 1.0 10.0 4.6 14.6
BTA Leasing Finance & Insurance Fy05 6.1 — 5.0 1.1 6.1
Bank CenterCredit Finance & Insurance Fy05 10.0 — 10.0 — 10.0
CASPI Limited Accommodation & Tourism Services
Fy01 2.5 — 1.3 — 1.3
Ispat Karmet SME Resource Too Collective Investment Vehicles Fy02 3.4 — 3.3 0.1 3.4
Joint Stock Company Ispat Karmet Primary Metals Fy�8, �� 30.7 — 2.3 — 2.3
Kazgermunai oil, Gas, & Mining Fy�8 41.0 — 18.0 0.7 18.7
Kazkommertsbank Finance & Insurance Fy�7, 00, 03 12.5 — — 1.0 1.0
Lukoil overseas Karachaganak B.V. oil, Gas, & Mining Fy03 75.0 75.0 58.3 — 58.3
oJSC NefteBank Finance & Insurance Fy01 2.5 — 2.5 — 2.5
Rambutya Limited Liability Partnership Wholesale & Retail Trade Fy00, 02 12.� — 5.1 — 5.1
TuranAlem Bank Finance & Insurance Fy00, 03 15.0 — — 4.� 4.�
115.8 12.4 128.1
Kyrgyz republic
Akun Ltd. Food & Beverages Fy02 2.4 — 2.1 — 2.1
Demirbank Kyrgyz International Bank Finance & Insurance Fy�7, 03 0.6 — — 0.6 0.6
FINCA Microfinance Resource Finance & Insurance Fy02 1.0 — — 1.0 1.0

PAGE 116 IFc annual report 2006
original Commitments1
(uS$ millions)Investments Held for IFC2
(uS$ millions)
EuroPE and CEnTraL aSia
Country, region or other area, and obligor sectorFiscal Year in Which Commitments Were made
total IFC
total syndications
loan
equity
total loans and equity
Kyrgyz republic (continued)
Joint Stock Commercial Bank Kyrgyzstan
Finance & Insurance Fy04 1.5 — 1.5 — 1.5
Joint-Stock Company Investment Export-Import Bank (Inexim)
Finance & Insurance Fy04 1.5 — 1.5 — 1.5
Kazkommertsbank Kyrgyzstan Finance & Insurance Fy03 — — 2.0 — 2.0
Kyrgyz Investment & Credit Bank Finance & Insurance Fy01, 05 3.� — 2.5 1.4 3.�
Kyrgyz-Chinese Joint Venture Altyn-Ajydar
Pulp & Paper Fy00, 05 1.7 — 1.4 — 1.4
Microcredit Agency Bai Tushum Financial Fund
Finance & Insurance Fy06 1.2 — 1.2 — 1.2
12.2 3.0 15.2
latvia
Baltic-American Enterprise Fund Finance & Insurance Fy05 7.1 — 2.2 — 2.2
2.2 — 2.2
lithuania
AB Drobe Wool Textiles, Apparel, & Leather Fy00 6.6 — 2.3 — 2.3
2.3 — 2.3
macedonia, Former Yugoslav republic of
Komercijalna Banka A.D. Skopje Finance & Insurance Fy01 3.1 — 0.7 — 0.7
Makedonski Telekomunikacii AD Skopje
Information Fy�8 25.0 25.0 — 11.3 11.3
ProCredit Bank Macedonia Finance & Insurance Fy03 1.0 — — 1.1 1.1
Small Enterprise Assistance Fund-Macedonia Fund L.L.C.
Collective Investment Vehicles Fy00 1.8 — — 0.5 0.5
Stopanska Banka a.d. Skopje Finance & Insurance Fy�8, 00, 01, 03 12.4 — — 10.5 10.5
Teteks A.D. Tetovo Textiles, Apparel, & Leather Fy�8, 02 6.8 — 3.1 — 3.1
3.8 23.5 27.3
moldova
FinComBank S.A. Finance & Insurance Fy03, 04 3.0 — 1.8 — 1.8
INCoN JSC, Cupchin JSC, ungheni JSC, and Floresti JSC
Food & Beverages Fy�7 7.4 — 2.4 2.0 4.4
Mobiasbanca S.A. Finance & Insurance Fy01, 06 5.0 — 5.0 — 5.0
Moldinconbank S.A. Finance & Insurance Fy01, 04 7.0 — 3.6 — 3.6
ProCredit Bank Moldova Finance & Insurance Fy00 1.0 — 0.� — 0.�
RED Chisinau, RED Centru & RED Sud utilities Fy02 25.0 — 20.0 — 20.0
Victoriabank Finance & Insurance Fy02, 04 �.0 — 5.6 — 5.6
Voxtel S.A. Information Fy��, 00, 01 15.3 21.8 — 1.6 1.6
3�.1 3.6 42.8

volume 2 PAGE 117
original Commitments1
(uS$ millions)Investments Held for IFC2
(uS$ millions)
EuroPE and CEnTraL aSia
Country, region or other area, and obligor sectorFiscal Year in Which Commitments Were made
total IFC
total syndications
loan
equity
total loans and equity
poland
Baltic Malt Sp. z o.o. Food & Beverages Fy�7 8.6 — — 2.0 2.0
Central Poland Fund, L.L.C. Collective Investment Vehicles Fy�8 1.6 — — 1.5 1.5
Global hotels Development Group Poland S.A.
Accommodation & Tourism Services
Fy�� 10.4 — �.4 3.2 12.6
honeywell ESCo Polska utilities Fy00 0.2 — — + +
Intercell S.A. Pulp & Paper Fy�5, �7, �8, 01, 04 �.5 — — + +
Peters Fleischindustrie und handel Aktiengesellschaft
Food & Beverages Fy�4 6.5 — 4.4 0.� 5.2
The Poland Investment Fund L.P. Collective Investment Vehicles Fy�5 2.5 — — 0.7 0.7
13.8 8.2 22.0
romania
Banc Post S.A. Finance & Insurance Fy��, 02, 06 26.7 — — 14.8 14.8
Banca Comerciala Romana S. A. Finance & Insurance Fy03, 04, 06 273.8 — 156.7 111.0 267.7
Banca Pentru Mica Industrie si Libera Initiativa
Finance & Insurance Fy05 7.0 — 7.0 — 7.0
Banca Transilvania Finance & Insurance Fy04, 05 6�.4 — 6�.6 — 6�.6
Danube Fund Limited Collective Investment Vehicles Fy�7 2.0 — — + +
Domenia Credit S.A. Finance & Insurance Fy04 5.0 — 4.5 — 4.5
ICME Primary Metals Fy02 8.7 — 6.� — 6.�
ProCredit Bank S.A. Finance & Insurance Fy02, 03, 04 7.6 — 5.0 2.6 7.6
Raiffeisen Bank S.A. Finance & Insurance Fy05 — — 40.0 — 40.0
Romania Gas holding utilities Fy05 54.4 — — 48.8 48.8
Romanian-American Enterprise Fund Finance & Insurance Fy04 3.0 — 3.0 — 3.0
S.C. Petrotel-Lukoil S.A. Chemicals Fy06 35.0 47.0 35.0 — 35.0
Transport Trade Services S.A. Transportation & Warehousing Fy06 16.8 — 17.6 — 17.6
unicredit Leasing Romania S.A. Finance & Insurance Fy�5, �8, 01 �.8 — 0.4 — 0.4
unicredit Leasing S.A. Finance & Insurance Fy05 �.4 — �.4 — �.4
355.2 177.1 532.3
russian Federation
A.o. Mosenergo utilities Fy�8 20.0 — 7.� — 7.�
Absolut Bank Finance & Insurance Fy06 28.3 — 15.0 13.3 28.3
Agro-Industrial Finance Company Finance & Insurance Fy03 5.5 10.0 5.0 0.5 5.5
BCEN Eurobank Finance & Insurance Fy03 100.0 — 62.5 — 62.5
BSGV Leasing Finance & Insurance Fy04 1�.5 — 70.� — 70.�
Banque Societe Generale Vostok Finance & Insurance Fy04 75.0 — 25.0 — 25.0
Baring Vostok Private Equity Fund III Collective Investment Vehicles Fy05 12.5 — — 12.5 12.5
Baring Vostok Private Equity Fund, L.P. 2
Collective Investment Vehicles Fy01 15.0 — — 2.1 2.1
Bauxite Timana (SuAL) Primary Metals Fy05 15.0 10.0 15.0 — 15.0
Brunswick Capital Transportation & Warehousing Fy06 45.0 — 37.5 7.5 45.0
Chukotka Mining and Geological Company
oil, Gas, & Mining Fy06 — — 3�.0 — 3�.0
Cinema Park Wholesale & Retail Trade Fy06 20.0 — 20.0 — 20.0
Commercial Bank DeltaCredit Finance & Insurance Fy02, 03 74.0 — 68.1 — 68.1

PAGE 118 IFc annual report 2006
original Commitments1
(uS$ millions)Investments Held for IFC2
(uS$ millions)
EuroPE and CEnTraL aSia
Country, region or other area, and obligor sectorFiscal Year in Which Commitments Were made
total IFC
total syndications
loan
equity
total loans and equity
russian Federation (continued)
Egar Technology Professional, Scientific, & Technical Services
Fy02 1.5 — — 1.5 1.5
Eurosib Group (Valory Corporation NV and subsidiaries)
Transportation & Warehousing Fy05, 06 78.0 71.5 78.0 — 78.0
First Russia-NIS Fund Collective Investment Vehicles Fy�5 15.0 — — + +
Forus Bank Finance & Insurance Fy06 6.2 — 6.7 — 6.7
IBS Group holdings Limited Information Fy03 8.0 — — 8.0 8.0
Independent Network Television holdings, Ltd.
Information Fy04, 06 20.5 — 16.1 3.5 1�.6
Industrial Investors Transportation & Warehousing Fy06 15.0 — 15.0 — 15.0
JSC Lebedyansky Food & Beverages Fy04 35.0 — 35.0 — 35.0
JSC SFAT Transportation & Warehousing Fy04, 05 60.0 55.0 53.7 — 53.7
JSC Volga-Dnepr Airlines Transportation & Warehousing Fy02 16.� 13.0 15.7 — 15.7
Kronospan Russia Industrial & Consumer Products Fy04, 05 87.3 — 88.0 — 88.0
KuibyshevAzot JSC Chemicals Fy05 15.0 — 13.5 — 13.5
Limited Liability Company Esanna holdings
Accommodation & Tourism Services
Fy05 15.0 50.0 14.3 — 14.3
Moscow Credit Bank Finance & Insurance Fy05, 06 15.0 — 15.0 — 15.0
NBD Bank Finance & Insurance Fy02, 03, 06 14.5 — 10.8 — 10.8
New Medical Center health Care Fy01 2.1 — 1.7 — 1.7
North-Western Shipping Company Transportation & Warehousing Fy05 23.0 23.5 23.0 — 23.0
oAo Novatek oil, Gas, & Mining Fy05 35.0 — — 11.5 11.5
oAo TogliattiAzot Chemicals Fy05 30.0 45.0 30.0 — 30.0
oAo ural-Siberian Bank Finance & Insurance Fy06 30.0 — 30.0 — 30.0
ooo Kronostar Industrial & Consumer Products Fy04, 05 �4.3 4�.3 �1.7 — �1.7
ooo Raiffeisen Leasing Finance & Insurance Fy05 — — 18.4 — 18.4
ooo Ruscam Nonmetallic Mineral Product Manufacturing
Fy02, 03, 04 40.5 — 31.� — 31.�
ooo Stora Enso Packaging BB Pulp & Paper Fy00, 02 14.5 — 3.5 — 3.5
ooo Swedwood Tichvin Industrial & Consumer Products Fy02 5.6 — 4.8 — 4.8
ooo Vladpivo Ltd Food & Beverages Fy06 14.1 — �.6 5.3 14.�
open Joint Stock Company “Alliance oil Company”
Chemicals Fy06 25.0 — 25.0 — 25.0
open Joint Stock Company Commercial Bank “Center-invest”
Finance & Insurance Fy02, 05, 06 12.0 — 14.2 — 14.2
Peter hambro Mining Plc oil, Gas, & Mining Fy05, 06 32.4 — — 28.8 28.8
Pilkington Float Glass Russia Nonmetallic Mineral Product Manufacturing
Fy04 53.7 — 53.4 — 53.4
Probusiness Bank Finance & Insurance Fy02 5.0 — 5.0 — 5.0
Promek Bank Finance & Insurance Fy05 — — 158.7 — 158.7
Quadriga Capital Russia Fund Collective Investment Vehicles Fy05 17.7 — — 17.7 17.7
Ramenka Ltd. Wholesale & Retail Trade Fy��, 01, 03, 06 140.5 30.0 �0.6 — �0.6
ruNet holdings Limited Professional, Scientific & Technical Services
Fy03 6.0 — 1.0 5.0 6.0
Russia Partners II, LP Collective Investment Vehicles Fy05 10.0 — — �.8 �.8
Russia Womens’ Microfinance Network Finance & Insurance Fy05 1.0 — 1.1 — 1.1

volume 2 PAGE 11�
original Commitments1
(uS$ millions)Investments Held for IFC2
(uS$ millions)
Country, region or other area, and obligor sectorFiscal Year in Which Commitments Were made
total IFC
total syndications
loan
equity
total loans and equity
russian Federation (continued)
Russian Standard Bank Finance & Insurance Fy02, 04, 06 134.0 60.0 130.1 10.0 140.1
The Russian Technology Fund, L.P. Collective Investment Vehicles Fy�6 1.0 — — 0.� 0.�
Sector Investment holding Company Limited
Collective Investment Vehicles Fy�6 — — — + +
Severstaltrans; Balttranservis; Sevtekhnotrans
Transportation & Warehousing Fy04 40.0 — 34.3 — 34.3
Sibakadembank Finance & Insurance Fy05, 06 1�.0 — 1�.0 — 1�.0
Small Business Credit Bank (KMB Bank) Finance & Insurance Fy02 7.0 — 3.� — 3.�
Stavropolsky Broiler Agriculture & Forestry Fy03 15.0 — 13.5 — 13.5
Trio Invest LLC Transportation & Warehousing Fy06 20.0 — 20.0 — 20.0
uralTransBank Finance & Insurance Fy03 7.5 — 5.8 — 5.8
Volga Shipping Company Transportation & Warehousing Fy05 25.2 17.3 24.5 — 24.5
Vyksa Steel Works Primary Metals Fy06 60.0 — 60.0 — 60.0
ZAo DeltaLeasing Finance & Insurance Fy04, 06 10.2 — 8.7 — 8.7
ZAo Europlan Finance & Insurance Fy02 10.0 — 2.� — 2.�
ZAo Locko Bank Finance & Insurance Fy06 26.4 — 11.1 16.4 27.5
ZAo Raiffeisenbank Austria Finance & Insurance Fy03, 05 20.0 — 140.0 — 140.0
ZAo Sonic Duo Information Fy02 30.0 10.0 6.0 — 6.0
1,800.7 154.3 1,�55.0
serbia and montenegro
Banca Intesa Spa Finance & Insurance Fy06 125.3 — 75.4 51.1 126.4
Continental Banka A.D. Finance & Insurance Fy04, 06 25.5 — 28.1 — 28.1
Government of Montenegro other (For Non-Investment Projects)
Fy80 — — 1.4 — 1.4
hVB Serbia and Montenegro A.D. Finance & Insurance Fy05 37.6 — 37.7 — 37.7
Institut Za Fizikalnu Medicinu I Rehabilitaciju (“Dr. Simo Milosevic”) Igalo
health Care Fy82, 88 22.0 — 10.4 — 10.4
Jugobanka—udruzena Banka Beograd Finance & Insurance Fy86 23.0 �.8 5.5 — 5.5
Loan to Eight Banks for Small- Scale Enterprises
Finance & Insurance Fy80 26.0 5.7 0.� — 0.�
opportunity Bank Montenegro Finance & Insurance Fy05 5.2 — 4.1 — 4.1
Panonska Banka A.D. Finance & Insurance Fy04 — — 4.7 — 4.7
Podgoricka banka a.d. Finance & Insurance Fy05 8.5 — 6.3 — 6.3
Privredna Banka A.D. Pancevo Finance & Insurance Fy04 — — 1.4 — 1.4
ProCredit Bank Kosovo Finance & Insurance Fy02 1.1 — — 1.1 1.1
ProCredit Bank Serbia Finance & Insurance Fy02, 03 14.0 — 7.4 — 7.4
Raiffeisen Bank Kosovo J.S.C. Finance & Insurance Fy06 12.8 — 12.6 — 12.6
Raiffeisenbank yugoslavija a.d. Finance & Insurance Fy02, 05, 06 23.1 — 12.5 10.5 23.0
Tigar M.h. Plastics & Rubber Fy02, 05 21.7 — — 8.0 8.0
Vojvodjanska Banka—udruzena Banka Finance & Insurance Fy87, 8�, 04 54.6 2�.5 7.4 — 7.4
215.7 70.7 286.4
EuroPE and CEnTraL aSia

PAGE 120 IFc annual report 2006
original Commitments1
(uS$ millions)Investments Held for IFC2
(uS$ millions)
EuroPE and CEnTraL aSia
Country, region or other area, and obligor sectorFiscal Year in Which Commitments Were made
total IFC
total syndications
loan
equity
total loans and equity
slovenia
Poteza Adriatic Fund B.V. Collective Investment Vehicles Fy04 13.7 — — 14.0 14.0
— 14.0 14.0
tajikistan
First Microfinance Bank Tajikistan Finance & Insurance Fy05, 06 0.8 — — 0.8 0.8
Giavoni Textiles, Apparel, & Leather Fy03 3.0 — — 3.0 3.0
open Joint Stock Company “Bank Eskhata”
Finance & Insurance Fy03 — — 1.0 — 1.0
open Joint Stock Company “Pamir Energy Company”
utilities Fy03 8.0 — 4.5 3.5 8.0
SugdAgroServ Agriculture & Forestry Fy02, 04 0.8 — 0.7 — 0.7
Telecom Technology Ltd. Information Fy02 0.4 — 0.1 — 0.1
6.3 7.3 13.7
turkey
Acibadem Saglik hizmetleri ve Ticaret A.S.
health Care Fy05, 06 60.0 — 60.0 — 60.0
Arcelik, A.S. Industrial & Consumer Products Fy�6, 01, 03, 05 1�8.0 1�3.1 104.0 — 104.0
Arcelik-LG Klima Sanayi ve Ticaret A.S. Industrial & Consumer Products Fy00 15.3 10.2 2.8 — 2.8
Assan Demir ve Sac Sanayii A.S. Primary Metals Fy�4, �7, 02, 05 85.3 40.0 47.5 — 47.5
Atilim university Education Services Fy02 6.5 — 4.4 — 4.4
Avea Iletisim hizmetleri A.S Information Fy06 120.0 — 120.0 — 120.0
Banvit Bandirma Vitaminli yem Sanayi A.S.
Agriculture & Forestry Fy01 25.0 — 6.7 5.0 11.7
Beko Elektronik A.S. Industrial & Consumer Products Fy03 25.0 25.1 27.4 — 27.4
Borcelik Celik Sanayii ve Ticaret A.S. Primary Metals Fy�5, �6, �7 47.1 — 6.4 �.7 16.0
CBS holding A.S. Chemicals Fy�4 15.5 — 3.5 — 3.5
Eczacibasi Karo Seramik Construction & Real Estate Fy02 �.� — 8.0 — 8.0
Ekim Turizm Ticaret ve Sanayi A.S. Finance & Insurance Fy05, 06 64.7 27.8 5�.0 5.0 64.0
Entek Elektrik uretimi A.S. utilities Fy�8 25.0 26.5 16.0 — 16.0
Finans Finansal Kiralama A.S. Finance & Insurance Fy�7, �8, 06 36.5 — 25.1 — 25.1
Gunkol/TEBA Industrial & Consumer Products Fy02 10.2 — 4.4 6.2 10.7
Indorama Iplik Sanayi ve Ticaret A.S. Textiles, Apparel, & Leather Fy�� 10.7 — 3.8 — 3.8
Ipek Kagit Sanayii ve Ticaret A.S. Pulp & Paper Fy�8, 00, 02 45.0 33.0 11.2 — 11.2
Istanbul Bilgi university Education Services Fy01, 06 27.0 — 21.0 — 21.0
Kiris otelcilik ve Turizm A.S. Accommodation & Tourism Services
Fy8�, �0 13.4 — 27.0 — 27.0
Koc Finansal Kiralama A.S. Finance & Insurance Fy�7, 04 45.0 — 30.0 — 30.0
Kula Mensucat Fabrikasi A.S. Textiles, Apparel, & Leather Fy�1 1�.8 — 5.1 — 5.1
Medya holding A.S. Information Fy�3, �6 28.6 — 5.0 — 5.0
Meteksan Sistem ve Bilgisayar Teknolojileri A.S.
Professional, Scientific, & Technical Services
Fy04 8.5 — 7.6 — 7.6
Milli Reasurans T.A.S. Finance & Insurance Fy02, 06 100.0 — 100.0 — 100.0
Modern Karton Sanayii ve Ticaret A.S. Pulp & Paper Fy�8, 02, 06 70.0 30.0 46.8 — 46.8
Nasco Nasreddin holding A.S. Textiles, Apparel, & Leather Fy�2 17.5 5.0 — — —
opet Petrolculuk A.S. Chemicals Fy04 25.0 40.0 25.0 — 25.0

volume 2 PAGE 121
original Commitments1
(uS$ millions)Investments Held for IFC2
(uS$ millions)
EuroPE and CEnTraL aSia
Country, region or other area, and obligor sectorFiscal Year in Which Commitments Were made
total IFC
total syndications
loan
equity
total loans and equity
turkey (continued)
oyak Bank A.S. Finance & Insurance Fy�8, 04 65.0 25.0 38.� — 38.�
PALEN Enerji Dogal Gaz Dagitim Endustri
utilities Fy05 2.0 — 2.0 — 2.0
PALGAZ Dogal Gaz Dagitim Sanayi utilities Fy05 10.0 — 10.0 — 10.0
Pinar Entegre et ve yem Sanayii A.S. Food & Beverages Fy84, �4, �8 21.� — 1.6 — 1.6
Pinar Sut Mamulleri Sanayii A.S. Food & Beverages Fy�4, 00 22.5 — 8.5 — 8.5
Sakosa Sabanci-Kosa Endnstriyel Iplik ve Kord Bezi Sanayi ve Ticaret A.S.
Textiles, Apparel, & Leather Fy�� 24.8 24.3 12.2 — 12.2
Sanko Group Nonmetallic Mineral Product Manufacturing
Fy06 75.0 — 75.0 — 75.0
Silkar Turizm yatirim ve Isletmeleri A.S. Accommodation & Tourism Services
Fy86, �0 18.6 �.5 0.7 — 0.7
Soktas Pamuk ve Tarim urunlerini Degerlendirme Ticaret ve Sanayi A.S.
Textiles, Apparel, & Leather Fy�8, 02 17.0 — 1.0 — 1.0
Standard Profil otomotiv Sanayi ve Ticaret Anonim Sirketi
Industrial & Consumer Products Fy06 22.7 — 18.8 3.8 22.6
Turkiye Sinai Kalkinma Bankasi, A.S.
Finance & Insurance Fy64, 67, 6�, 72, 73, 75, 76, 80, 83, �2, 05
70.1 45.0 50.0 — 50.0
Trakya Cam Sanayii A.S. Nonmetallic Mineral Product Manufacturing
Fy7�, 83, 84, 8�, �1, �6, ��
67.7 31.0 — 0.1 0.1
Turk Demir Dokum Fabriklari A.S. Industrial & Consumer Products Fy�6, 06 31.8 — 31.4 — 31.4
Turk Ekonomi Bankasi A.S. Finance & Insurance Fy�5, ��, 03, 05 112.5 32.5 71.7 — 71.7
Turkish Private Equity Fund I L.P. Collective Investment Vehicles Fy02 10.0 — — 10.0 10.0
Turkiye Sise ve Cam Fabrikalari, A.S. Nonmetallic Mineral Product Manufacturing
Fy�3, �7, 02, 03 137.0 88.5 48.7 — 48.7
uzel Makina Sanayii A.S. Industrial & Consumer Products Fy�� 11.4 8.5 6.� — 6.�
Viking Kagit ve Seluloz, A.S. Pulp & Paper Fy70, 71, 82, 83, �8 15.3 — 5.4 — 5.4
yeditepe Beynelmilel otelcilik Turizm ve Ticaret A.S. (Conrad Istanbul hotel)
Accommodation & Tourism Services
Fy�0, �4, 02 31.8 27.5 5.3 — 5.3
yuce ozel Egitim ve Kulturel hizmetler A.S.
Education Services Fy05 4.5 — 3.8 — 3.8
1,16�.4 3�.7 1,20�.1
ukraine
AvalBank Finance & Insurance Fy05 85.0 — 81.3 — 81.3
CJSC AES Kyivoblenergo utilities Fy05 30.0 — 2�.5 — 2�.5
CJSC AES RivneEnergo utilities Fy05 15.0 — 14.� — 14.�
CJSC Myronivsky Khliboprodukt Agriculture & Forestry Fy04, 05 110.0 — 87.5 — 87.5
CJSC Sofia Kiev Accommodation & Tourism Services
Fy06 16.5 13.0 16.5 — 16.5
Closed Joint Stock Company Rise Agriculture & Forestry Fy06 10.0 — 10.0 — 10.0
Euroventures ukraine Fund II Collective Investment Vehicles Fy05 7.5 — — 7.5 7.5
First Lease Finance & Insurance Fy04, 05 2.0 — 1.1 — 1.1
Industrial union of Donbass Primary Metals Fy06 100.0 — 100.0 — 100.0
Joint Stock Commercial Bank hVB Bank ukraine
Finance & Insurance Fy�8, 03, 04 2.8 — — — —
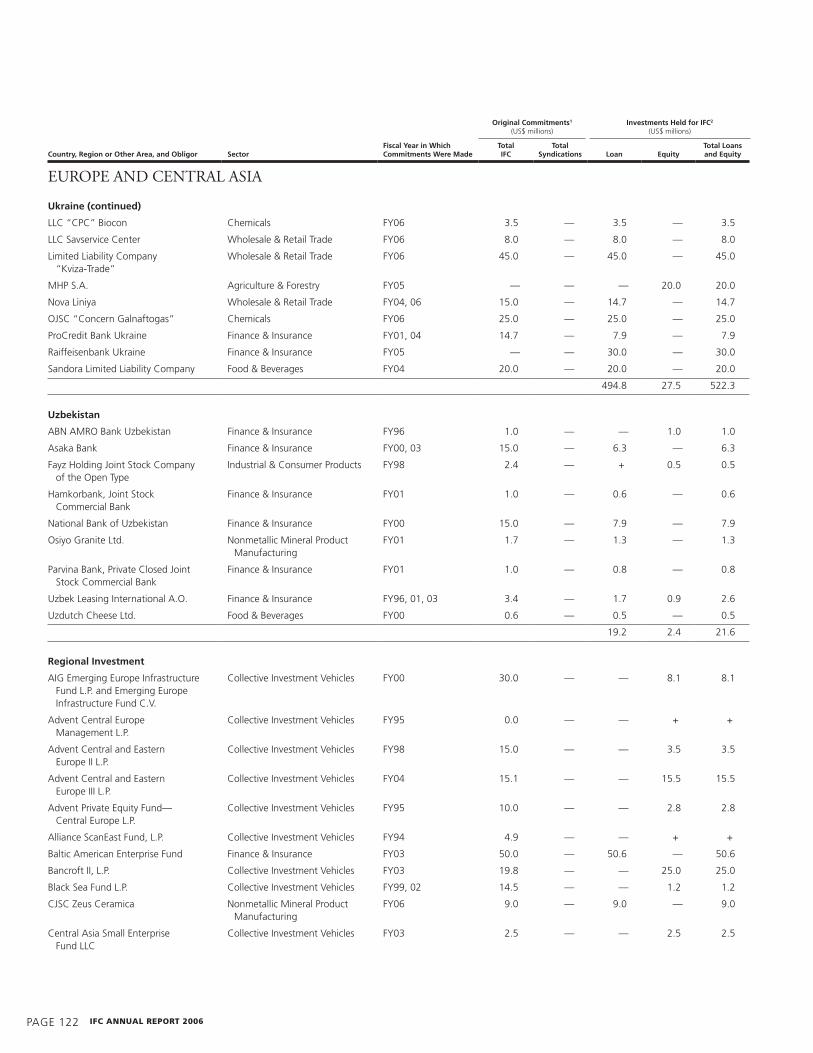
PAGE 122 IFc annual report 2006
original Commitments1
(uS$ millions)Investments Held for IFC2
(uS$ millions)
EuroPE and CEnTraL aSia
Country, region or other area, and obligor sectorFiscal Year in Which Commitments Were made
total IFC
total syndications
loan
equity
total loans and equity
ukraine (continued)
LLC “CPC” Biocon Chemicals Fy06 3.5 — 3.5 — 3.5
LLC Savservice Center Wholesale & Retail Trade Fy06 8.0 — 8.0 — 8.0
Limited Liability Company “Kviza-Trade”
Wholesale & Retail Trade Fy06 45.0 — 45.0 — 45.0
MhP S.A. Agriculture & Forestry Fy05 — — — 20.0 20.0
Nova Liniya Wholesale & Retail Trade Fy04, 06 15.0 — 14.7 — 14.7
oJSC “Concern Galnaftogas” Chemicals Fy06 25.0 — 25.0 — 25.0
ProCredit Bank ukraine Finance & Insurance Fy01, 04 14.7 — 7.� — 7.�
Raiffeisenbank ukraine Finance & Insurance Fy05 — — 30.0 — 30.0
Sandora Limited Liability Company Food & Beverages Fy04 20.0 — 20.0 — 20.0
4�4.8 27.5 522.3
uzbekistan
ABN AMRo Bank uzbekistan Finance & Insurance Fy�6 1.0 — — 1.0 1.0
Asaka Bank Finance & Insurance Fy00, 03 15.0 — 6.3 — 6.3
Fayz holding Joint Stock Company of the open Type
Industrial & Consumer Products Fy�8 2.4 — + 0.5 0.5
hamkorbank, Joint Stock Commercial Bank
Finance & Insurance Fy01 1.0 — 0.6 — 0.6
National Bank of uzbekistan Finance & Insurance Fy00 15.0 — 7.� — 7.�
osiyo Granite Ltd. Nonmetallic Mineral Product Manufacturing
Fy01 1.7 — 1.3 — 1.3
Parvina Bank, Private Closed Joint Stock Commercial Bank
Finance & Insurance Fy01 1.0 — 0.8 — 0.8
uzbek Leasing International A.o. Finance & Insurance Fy�6, 01, 03 3.4 — 1.7 0.� 2.6
uzdutch Cheese Ltd. Food & Beverages Fy00 0.6 — 0.5 — 0.5
1�.2 2.4 21.6
regional Investment
AIG Emerging Europe Infrastructure Fund L.P. and Emerging Europe Infrastructure Fund C.V.
Collective Investment Vehicles Fy00 30.0 — — 8.1 8.1
Advent Central Europe Management L.P.
Collective Investment Vehicles Fy�5 0.0 — — + +
Advent Central and Eastern Europe II L.P.
Collective Investment Vehicles Fy�8 15.0 — — 3.5 3.5
Advent Central and Eastern Europe III L.P.
Collective Investment Vehicles Fy04 15.1 — — 15.5 15.5
Advent Private Equity Fund— Central Europe L.P.
Collective Investment Vehicles Fy�5 10.0 — — 2.8 2.8
Alliance ScanEast Fund, L.P. Collective Investment Vehicles Fy�4 4.� — — + +
Baltic American Enterprise Fund Finance & Insurance Fy03 50.0 — 50.6 — 50.6
Bancroft II, L.P. Collective Investment Vehicles Fy03 1�.8 — — 25.0 25.0
Black Sea Fund L.P. Collective Investment Vehicles Fy��, 02 14.5 — — 1.2 1.2
CJSC Zeus Ceramica Nonmetallic Mineral Product Manufacturing
Fy06 �.0 — �.0 — �.0
Central Asia Small Enterprise Fund LLC
Collective Investment Vehicles Fy03 2.5 — — 2.5 2.5

volume 2 PAGE 123
original Commitments1
(uS$ millions)Investments Held for IFC2
(uS$ millions)
EuroPE and CEnTraL aSia
Country, region or other area, and obligor sectorFiscal Year in Which Commitments Were made
total IFC
total syndications
loan
equity
total loans and equity
regional Investment (continued)
Emerging Europe Convergence Fund II, L.P.
Collective Investment Vehicles Fy06 25.8 — — 24.� 24.�
European Fund for Southeast Europe Finance & Insurance Fy06 36.� — — 37.3 37.3
hanseatic Capital, LLC Finance & Insurance Fy03 7.4 — �.4 — �.4
MFI Facility—Central Asia Finance & Insurance Fy03 45.0 — 42.0 — 42.0
Marbleton Property Fund LP Collective Investment Vehicles Fy06 20.0 — — 20.0 20.0
NIS Restructuring Facility, L. P. Collective Investment Vehicles Fy00 10.0 — — 1.7 1.7
Raiffeisen International Bank— holding AG
Finance & Insurance Fy04, 05 241.6 — — 80.6 80.6
Raiffeisen International Banking Finance & Insurance Fy05 200.1 — 50.3 — 50.3
The Romania & Moldova Direct Fund, L.P.
Collective Investment Vehicles Fy�� 4.0 — — 1.1 1.1
SEAF Central and Eastern Europe Growth Fund LLC
Collective Investment Vehicles Fy01, 04 3.7 — — 2.4 2.4
SEAF Trans-Balkan Fund LLC Collective Investment Vehicles Fy01 4.8 — — 1.8 1.8
Societe Generale, S.A. Finance & Insurance Fy05 265.0 — 110.0 — 110.0
271.3 228.3 4��.6
total equity and loans 5,194.7 875.7 6,070.4
221.8
6,292.2
total guarantees and risk management products
total IFC portfolio for europe and Central asia

PAGE 124 IFc annual report 2006
original Commitments1
(uS$ millions)Investments Held for IFC2
(uS$ millions)
LaTin aMEriCa and ThE CaribbEan
Country, region or other area, and obligor sectorFiscal Year in Which Commitments Were made
total IFC
total syndications
loan
equity
total loans and equity
argentina
ARCoR S.A.I.C. Food & Beverages Fy88, 06 82.0 210.0 70.0 — 70.0
Aceitera General Deheza S.A. Food & Beverages Fy�5, 02, 04 125.0 60.0 70.0 — 70.0
Aguas Argentinas S.A. utilities Fy�5, �6 85.0 307.5 — 7.0 7.0
Aguas Provinciales de Santa Fe S.A. utilities Fy01 20.0 20.5 3.8 — 3.8
Asociacion union Tamberos Cooperativa Limitada (AuTCL)
Food & Beverages Fy�� 6.0 — 3.� — 3.�
BACS Banco de Credito y Securitizacion, S.A.
Finance & Insurance Fy00, 05, 06 10�.1 — 50.0 12.5 62.5
Banco General de Negocios S.A. Finance & Insurance Fy�4, �� 48.0 — 33.0 — 33.0
Banco de Galicia y Buenos Aires, S.A. Finance & Insurance Fy�7, ��, 00, 04, 05 120.0 245.0 101.8 — 101.8
Banco del Suquia Finance & Insurance Fy�8, ��, 03 45.0 25.0 10.5 — 10.5
Bunge Argentina S.A. Food & Beverages Fy�7 20.0 — 5.0 — 5.0
Ceramica Zanon S.A.C.I.y M. Nonmetallic Mineral Product Manufacturing
Fy�6 20.0 — 17.7 — 17.7
Chevron San Jorge SRL (Neuquen Basin, huantraico)
oil, Gas, & Mining Fy�2, �3 73.4 35.0 — 58.4* 58.4
Compania Elaboradora de Productos Alimenticios S.A. (CEPA)
Food & Beverages Fy�5 15.0 6.0 �.7 — �.7
Companias Asociadas Petroleras S.A. oil, Gas, & Mining Fy�7, 06 67.0 53.0 50.0 — 50.0
Concesiones y Construcciones de Infraestructura S.A.
Transportation & Warehousing Fy00 26.0 — 6.0 20.0 26.0
Editorial Codex Sociedad Anonima Information Fy6� 6.6 0.4 — 1.6 1.6
FV S.A. Industrial & Consumer Products Fy�� 16.0 — 5.5 — 5.5
Grupo Financiero Galicia S.A. Finance & Insurance Fy�� — — — 3.1 3.1
hospital Privado Centro Medico de Cordoba S.A.
health Care Fy�� �.6 — 8.4 — 8.4
Jumbo Argentina S.A. Wholesale & Retail Trade Fy04 40.0 — — 40.0 40.0
Louis Dreyfus Manufacturing S.A. Industrial & Consumer Products Fy00 — — 5.0 — 5.0
Milkaut S.A. Food & Beverages Fy�7, �8 20.0 5.0 14.8 5.0 1�.8
Molinos Rio de la Plata S.A. Food & Beverages Fy�3, �4, 03 22.3 20.0 — 3.6 3.6
Noble Argentina S.A. Transportation & Warehousing Fy06 18.0 18.0 18.0 — 18.0
Nuevo Central Argentino S.A. Transportation & Warehousing Fy�3 13.0 15.0 — + +
Pan American Energy LLC oil, Gas, & Mining Fy�3, �6, 06 1�5.0 235.0 115.0 — 115.0
Patagonia Fund, L.P. Collective Investment Vehicles Fy�8 20.0 — — 14.1 14.1
Patagonia Mint S.A. Food & Beverages Fy�8 6.0 — 2.8 — 2.8
Roberts Participaciones S.A. Collective Investment Vehicles Fy86 0.1 — — 0.1 0.1
S.A. San Miguel A.G.I.C.I. y F. Agriculture & Forestry Fy��, 05 32.2 10.0 24.1 — 24.1
SanCor Cooperativas unidas Ltda. Food & Beverages Fy�5 40.0 30.0 28.5 — 28.5
Sideco Americana S.A. Transportation & Warehousing Fy�5 — — — 15.0 15.0
Socma Americana S.A. Transportation & Warehousing Fy�5, �� 40.0 60.0 13.3 — 13.3
T6 Industrial S.A. Food & Beverages Fy�8 15.0 30.0 8.3 — 8.3
Terminal 6, S.A. Transportation & Warehousing Fy87, �0, �1, �6, �8 33.0 1�.5 3.3 — 3.3
Terminales Portuarias Argentinas S.A. Transportation & Warehousing Fy�6 12.0 — 0.5 — 0.5
The Tower Investment Management Company
Collective Investment Vehicles Fy�5 0.2 — — + +
The Tower Fund, L.P. Collective Investment Vehicles Fy�5 25.0 — — 14.3 14.3

volume 2 PAGE 125
original Commitments1
(uS$ millions)Investments Held for IFC2
(uS$ millions)
Country, region or other area, and obligor sectorFiscal Year in Which Commitments Were made
total IFC
total syndications
loan
equity
total loans and equity
argentina (continued)
Transportadora de Gas del Norte S.A. Transportation & Warehousing Fy�7 45.0 210.0 38.2 — 38.2
universidad del Salvador Education Services Fy01 10.0 — �.3 — �.3
Vicentin S.A.I.C. Food & Beverages Fy�7, 03, 05 �0.0 40.0 35.0 — 35.0
yacylec S.A. utilities Fy�4 20.0 45.0 — 5.0 5.0
761.2 1��.8 �61.0
Belize
Nova Companies (Belize) Ltd. and Ambergris Aquactulture Ltd.
Agriculture & Forestry Fy�8 5.5 — 4.3 — 4.3
4.3 — 4.3
Bolivia
Aguas del Illimani S.A. utilities Fy00 7.1 — 3.8 1.0 4.8
Banco Bisa S.A. Finance & Insurance Fy76, 88, �1, �2, �5, �8
28.7 — — 3.2 3.2
Banco Los Andes ProCredit Finance & Insurance Fy��, 01, 03 10.0 — 6.6 — 6.6
Banco Sol Finance & Insurance Fy04 6.0 — 4.0 — 4.0
CB Transporte e Infraestructura S.A. (CBTI)
Transportation & Warehousing Fy�� 2.0 — 0.� — 0.�
Central Aguirre Portuaria, S.A. Transportation & Warehousing Fy�2, 02 4.7 — 1.7 0.2 1.�
Compania Boliviana de Gas Natural Comprimido S.A. (GENEX)
Chemicals Fy�3 2.3 — 0.1 — 0.1
Electropaz S.A. utilities Fy00 25.0 — 18.0 — 18.0
Fondo Financiero Privado F.I.E. S.A. Finance & Insurance Fy03 2.5 — 1.3 — 1.3
Minera S.A. oil, Gas, & Mining Fy87, �0 — — — 3.4 3.4
Minproc Bolivia S.A. oil, Gas, & Mining Fy�2 1.0 — — 0.6 0.6
PRoDEM Finance & Insurance Fy04 3.0 — 2.4 — 2.4
Petroquimica Boliviana S.A. Chemicals Fy06 10.5 — 10.5 — 10.5
Sinchi Wayra S.A. oil, Gas, & Mining Fy�0, �4, �6, 00 40.6 5.0 1.3 — 1.3
Telefonica Celular de Bolivia S.A. Information Fy�7, 01 26.7 23.3 8.3 — 8.3
Transierra S.A. Transportation & Warehousing Fy05 50.0 100.0 45.4 — 45.4
Transportadora de Electricidad S.A. utilities Fy03 30.0 — 27.7 — 27.7
Transportes Ferroviarios S.A. Transportation & Warehousing Fy�� — — — 4.4 4.4
Trenes Continentales S.A. Transportation & Warehousing Fy�� — — — 2.� 2.�
132.0 15.7 147.8
Brazil
ABN AMRo REAL S.A. Finance & Insurance Fy05 125.0 — 125.0 — 125.0
AgCert International, LLC Agriculture & Forestry Fy05 15.0 — — 10.� 10.�
Amaggi Exportacao e Importacao Limitada
Food & Beverages Fy03, 05 60.0 — 51.4 — 51.4
Andrade Gutierrez Concessoes S.A. utilities Fy02 30.0 — — 30.0 30.0
Andrade Gutierrez S.A. Construction & Real Estate Fy03 40.0 20.0 32.0 — 32.0
Apolo Produtos de Aco SA Primary Metals Fy02 8.0 — 6.4 — 6.4
Banco Bahia Mariani Finance & Insurance Fy06 50.0 — 50.0 — 50.0
Banco Itau-BBA S.A. Finance & Insurance Fy01, 02, 03 130.0 60.0 6�.8 — 6�.8
LaTin aMEriCa and ThE CaribbEan
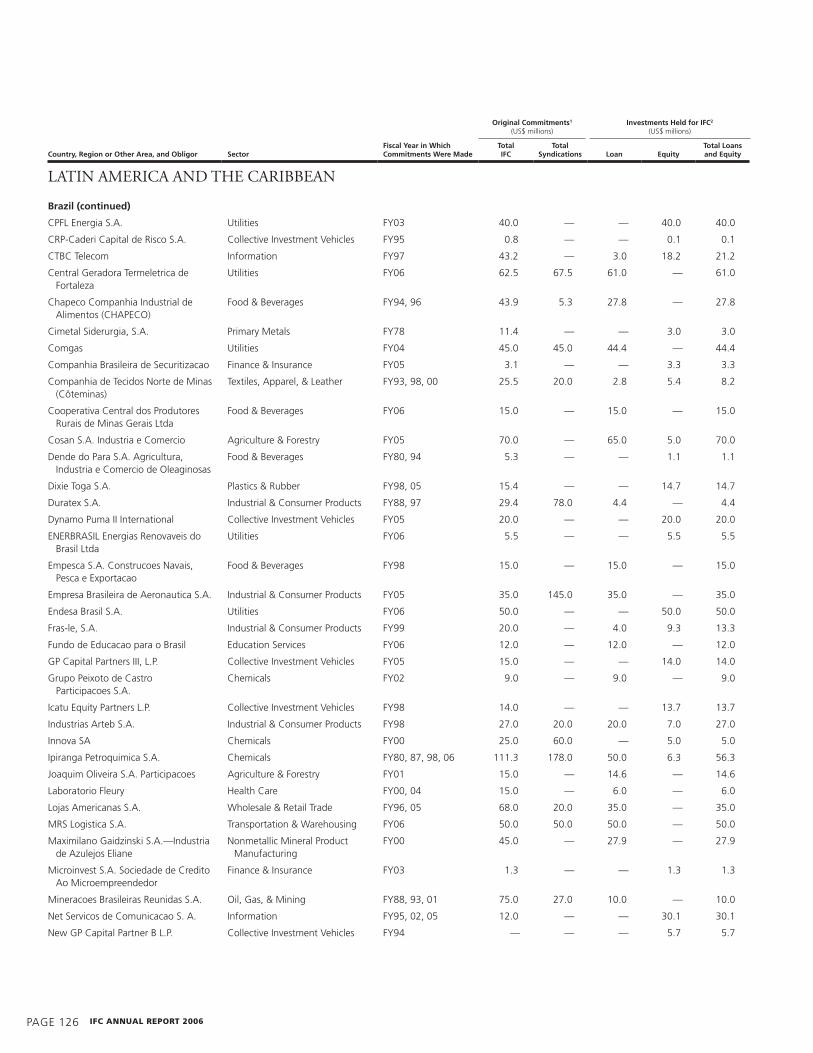
PAGE 126 IFc annual report 2006
original Commitments1
(uS$ millions)Investments Held for IFC2
(uS$ millions)
LaTin aMEriCa and ThE CaribbEan
Country, region or other area, and obligor sectorFiscal Year in Which Commitments Were made
total IFC
total syndications
loan
equity
total loans and equity
Brazil (continued)
CPFL Energia S.A. utilities Fy03 40.0 — — 40.0 40.0
CRP-Caderi Capital de Risco S.A. Collective Investment Vehicles Fy�5 0.8 — — 0.1 0.1
CTBC Telecom Information Fy�7 43.2 — 3.0 18.2 21.2
Central Geradora Termeletrica de Fortaleza
utilities Fy06 62.5 67.5 61.0 — 61.0
Chapeco Companhia Industrial de Alimentos (ChAPECo)
Food & Beverages Fy�4, �6 43.� 5.3 27.8 — 27.8
Cimetal Siderurgia, S.A. Primary Metals Fy78 11.4 — — 3.0 3.0
Comgas utilities Fy04 45.0 45.0 44.4 — 44.4
Companhia Brasileira de Securitizacao Finance & Insurance Fy05 3.1 — — 3.3 3.3
Companhia de Tecidos Norte de Minas (Côteminas)
Textiles, Apparel, & Leather Fy�3, �8, 00 25.5 20.0 2.8 5.4 8.2
Cooperativa Central dos Produtores Rurais de Minas Gerais Ltda
Food & Beverages Fy06 15.0 — 15.0 — 15.0
Cosan S.A. Industria e Comercio Agriculture & Forestry Fy05 70.0 — 65.0 5.0 70.0
Dende do Para S.A. Agricultura, Industria e Comercio de oleaginosas
Food & Beverages Fy80, �4 5.3 — — 1.1 1.1
Dixie Toga S.A. Plastics & Rubber Fy�8, 05 15.4 — — 14.7 14.7
Duratex S.A. Industrial & Consumer Products Fy88, �7 2�.4 78.0 4.4 — 4.4
Dynamo Puma II International Collective Investment Vehicles Fy05 20.0 — — 20.0 20.0
ENERBRASIL Energias Renovaveis do Brasil Ltda
utilities Fy06 5.5 — — 5.5 5.5
Empesca S.A. Construcoes Navais, Pesca e Exportacao
Food & Beverages Fy�8 15.0 — 15.0 — 15.0
Empresa Brasileira de Aeronautica S.A. Industrial & Consumer Products Fy05 35.0 145.0 35.0 — 35.0
Endesa Brasil S.A. utilities Fy06 50.0 — — 50.0 50.0
Fras-le, S.A. Industrial & Consumer Products Fy�� 20.0 — 4.0 �.3 13.3
Fundo de Educacao para o Brasil Education Services Fy06 12.0 — 12.0 — 12.0
GP Capital Partners III, L.P. Collective Investment Vehicles Fy05 15.0 — — 14.0 14.0
Grupo Peixoto de Castro Participacoes S.A.
Chemicals Fy02 �.0 — �.0 — �.0
Icatu Equity Partners L.P. Collective Investment Vehicles Fy�8 14.0 — — 13.7 13.7
Industrias Arteb S.A. Industrial & Consumer Products Fy�8 27.0 20.0 20.0 7.0 27.0
Innova SA Chemicals Fy00 25.0 60.0 — 5.0 5.0
Ipiranga Petroquimica S.A. Chemicals Fy80, 87, �8, 06 111.3 178.0 50.0 6.3 56.3
Joaquim oliveira S.A. Participacoes Agriculture & Forestry Fy01 15.0 — 14.6 — 14.6
Laboratorio Fleury health Care Fy00, 04 15.0 — 6.0 — 6.0
Lojas Americanas S.A. Wholesale & Retail Trade Fy�6, 05 68.0 20.0 35.0 — 35.0
MRS Logistica S.A. Transportation & Warehousing Fy06 50.0 50.0 50.0 — 50.0
Maximilano Gaidzinski S.A.—Industria de Azulejos Eliane
Nonmetallic Mineral Product Manufacturing
Fy00 45.0 — 27.� — 27.�
Microinvest S.A. Sociedade de Credito Ao Microempreendedor
Finance & Insurance Fy03 1.3 — — 1.3 1.3
Mineracoes Brasileiras Reunidas S.A. oil, Gas, & Mining Fy88, �3, 01 75.0 27.0 10.0 — 10.0
Net Servicos de Comunicacao S. A. Information Fy�5, 02, 05 12.0 — — 30.1 30.1
New GP Capital Partner B L.P. Collective Investment Vehicles Fy�4 — — — 5.7 5.7

volume 2 PAGE 127
original Commitments1
(uS$ millions)Investments Held for IFC2
(uS$ millions)
LaTin aMEriCa and ThE CaribbEan
Country, region or other area, and obligor sectorFiscal Year in Which Commitments Were made
total IFC
total syndications
loan
equity
total loans and equity
Brazil (continued)
Para Pigmentos S.A. oil, Gas, & Mining Fy�5 3�.0 33.5 2.2 �.0 11.2
Portobello S.A. Nonmetallic Mineral Product Manufacturing
Fy�5, 00, 02 38.4 — 11.4 4.8 16.2
Puras do Brasil S.A. Accommodation & Tourism Services
Fy00 5.0 — 1.0 — 1.0
Queiroz Galvao Perfuracoes S.A. oil, Gas, & Mining Fy03, 04 40.0 — 36.7 — 36.7
Randon S.A. Implementos e Participacoes
Industrial & Consumer Products Fy�� — — 5.3 — 5.3
Rio Bravo Securitizadora Finance & Insurance Fy06 1.5 — — 1.5 1.5
Sadia Concordia S.A. Industria e Comercio
Food & Beverages Fy�4, �5, �7 80.0 222.0 8.7 — 8.7
Salutia health Care Fy02, 04 2.� — — 2.� 2.�
Samarco Mineracao S.A. oil, Gas, & Mining Fy�7 18.0 16.0 3.6 — 3.6
Sao Paulo Alpargatas S.A. Textiles, Apparel, & Leather Fy87, �7, 03 �0.0 — 15.0 — 15.0
Saraiva S.A. Livreiros Editores Wholesale & Retail Trade Fy�8 18.0 — — 1.5 1.5
Satipel Industrial S.A. Industrial & Consumer Products Fy03 25.0 — 10.0 — 10.0
Sepetiba Terminal de Conteineres S.A. Transportation & Warehousing Fy02 32.0 8.0 31.2 — 31.2
Sotave Amazonia Quimica e Mineral S/A
Chemicals Fy80, 83 18.2 — 14.2 4.0 18.2
Sudamerica en Fiesta, S.A. de C.V. Accommodation & Tourism Services
Fy00 15.0 — — 15.0 15.0
Suzano Petroquimica S.A. Chemicals Fy06 60.0 140.0 60.0 — 60.0
Synteko Produtos Quimicos S.A. Chemicals Fy02 18.0 — 12.� — 12.�
TAM S.A. Transportation & Warehousing Fy06 50.0 — 50.0 — 50.0
Tecon Rio Grande S.A. Transportation & Warehousing Fy��, 04 20.2 24.1 16.� — 16.�
Tecon Salvador S.A. Transportation & Warehousing Fy01, 03 5.0 5.0 3.0 1.5 4.5
Tecon Suape S.A. Transportation & Warehousing Fy06 6.0 — 6.0 — 6.0
TriBanco Brazil Finance & Insurance Fy05, 06 10.0 — 10.0 — 10.0
uP offshore Apoio Maritimo Ltda.— uP offshore (Bahamas) Ltd.
Transportation & Warehousing Fy03 1�.0 23.3 �.0 10.0 1�.0
unibanco—uniao de Bancos Brasileiros S.A.
Finance & Insurance Fy88, �6, 02, 03, 04 144.8 250.0 16.� — 16.�
usina hidreletrica Guilman- Amorim S.A.
utilities Fy�8 30.0 �1.0 1�.1 — 1�.1
Wiest S.A. Industrial & Consumer Products Fy�� 8.0 — 8.0 — 8.0
1,1�7.7 34�.� 1,547.6
Chile
Bosques y Maderas S.A. (BoMASA) Industrial & Consumer Products Fy�2, �4 10.3 6.0 — 4.8 4.8
Certifica.com Information Fy01 1.5 — — 1.5 1.5
Factorline S.A Finance & Insurance Fy05 5.0 — 5.0 — 5.0
Ferrocarril del Pacifico S.A. Transportation & Warehousing Fy�7 20.5 6.0 — 5.6 5.6
hQI Transelec Chile S.A. utilities Fy03 60.0 — — 54.2 54.2
hidroelectrica Aconcagua S.A. utilities Fy�2, �3 14.5 6.0 — 6.5 6.5
hidroelectrica la higuera utilities Fy06 45.0 115.0 45.0 — 45.0
Lan Chile S.A. Transportation & Warehousing Fy03 30.0 — 30.0 — 30.0
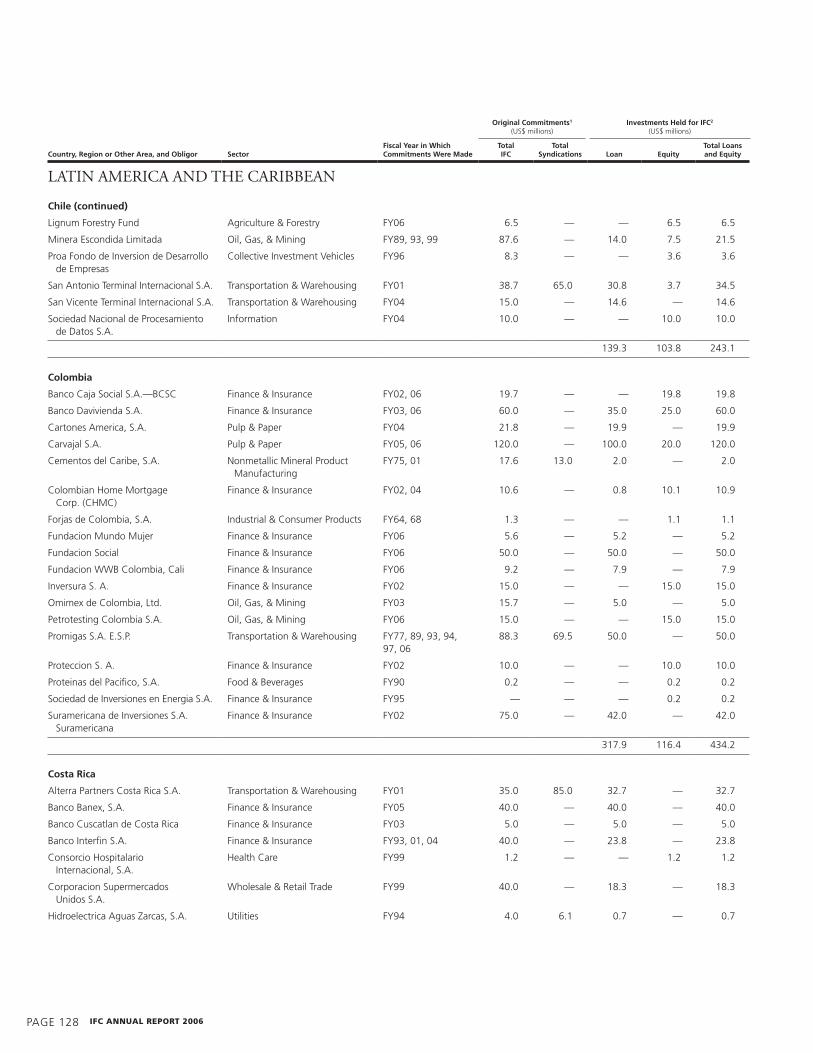
PAGE 128 IFc annual report 2006
original Commitments1
(uS$ millions)Investments Held for IFC2
(uS$ millions)
LaTin aMEriCa and ThE CaribbEan
Country, region or other area, and obligor sectorFiscal Year in Which Commitments Were made
total IFC
total syndications
loan
equity
total loans and equity
Chile (continued)
Lignum Forestry Fund Agriculture & Forestry Fy06 6.5 — — 6.5 6.5
Minera Escondida Limitada oil, Gas, & Mining Fy8�, �3, �� 87.6 — 14.0 7.5 21.5
Proa Fondo de Inversion de Desarrollo de Empresas
Collective Investment Vehicles Fy�6 8.3 — — 3.6 3.6
San Antonio Terminal Internacional S.A. Transportation & Warehousing Fy01 38.7 65.0 30.8 3.7 34.5
San Vicente Terminal Internacional S.A. Transportation & Warehousing Fy04 15.0 — 14.6 — 14.6
Sociedad Nacional de Procesamiento de Datos S.A.
Information Fy04 10.0 — — 10.0 10.0
13�.3 103.8 243.1
Colombia
Banco Caja Social S.A.—BCSC Finance & Insurance Fy02, 06 1�.7 — — 1�.8 1�.8
Banco Davivienda S.A. Finance & Insurance Fy03, 06 60.0 — 35.0 25.0 60.0
Cartones America, S.A. Pulp & Paper Fy04 21.8 — 1�.� — 1�.�
Carvajal S.A. Pulp & Paper Fy05, 06 120.0 — 100.0 20.0 120.0
Cementos del Caribe, S.A. Nonmetallic Mineral Product Manufacturing
Fy75, 01 17.6 13.0 2.0 — 2.0
Colombian home Mortgage Corp. (ChMC)
Finance & Insurance Fy02, 04 10.6 — 0.8 10.1 10.�
Forjas de Colombia, S.A. Industrial & Consumer Products Fy64, 68 1.3 — — 1.1 1.1
Fundacion Mundo Mujer Finance & Insurance Fy06 5.6 — 5.2 — 5.2
Fundacion Social Finance & Insurance Fy06 50.0 — 50.0 — 50.0
Fundacion WWB Colombia, Cali Finance & Insurance Fy06 �.2 — 7.� — 7.�
Inversura S. A. Finance & Insurance Fy02 15.0 — — 15.0 15.0
omimex de Colombia, Ltd. oil, Gas, & Mining Fy03 15.7 — 5.0 — 5.0
Petrotesting Colombia S.A. oil, Gas, & Mining Fy06 15.0 — — 15.0 15.0
Promigas S.A. E.S.P. Transportation & Warehousing Fy77, 8�, �3, �4, �7, 06
88.3 6�.5 50.0 — 50.0
Proteccion S. A. Finance & Insurance Fy02 10.0 — — 10.0 10.0
Proteinas del Pacifico, S.A. Food & Beverages Fy�0 0.2 — — 0.2 0.2
Sociedad de Inversiones en Energia S.A. Finance & Insurance Fy�5 — — — 0.2 0.2
Suramericana de Inversiones S.A. Suramericana
Finance & Insurance Fy02 75.0 — 42.0 — 42.0
317.� 116.4 434.2
Costa rica
Alterra Partners Costa Rica S.A. Transportation & Warehousing Fy01 35.0 85.0 32.7 — 32.7
Banco Banex, S.A. Finance & Insurance Fy05 40.0 — 40.0 — 40.0
Banco Cuscatlan de Costa Rica Finance & Insurance Fy03 5.0 — 5.0 — 5.0
Banco Interfin S.A. Finance & Insurance Fy�3, 01, 04 40.0 — 23.8 — 23.8
Consorcio hospitalario Internacional, S.A.
health Care Fy�� 1.2 — — 1.2 1.2
Corporacion Supermercados unidos S.A.
Wholesale & Retail Trade Fy�� 40.0 — 18.3 — 18.3
hidroelectrica Aguas Zarcas, S.A. utilities Fy�4 4.0 6.1 0.7 — 0.7
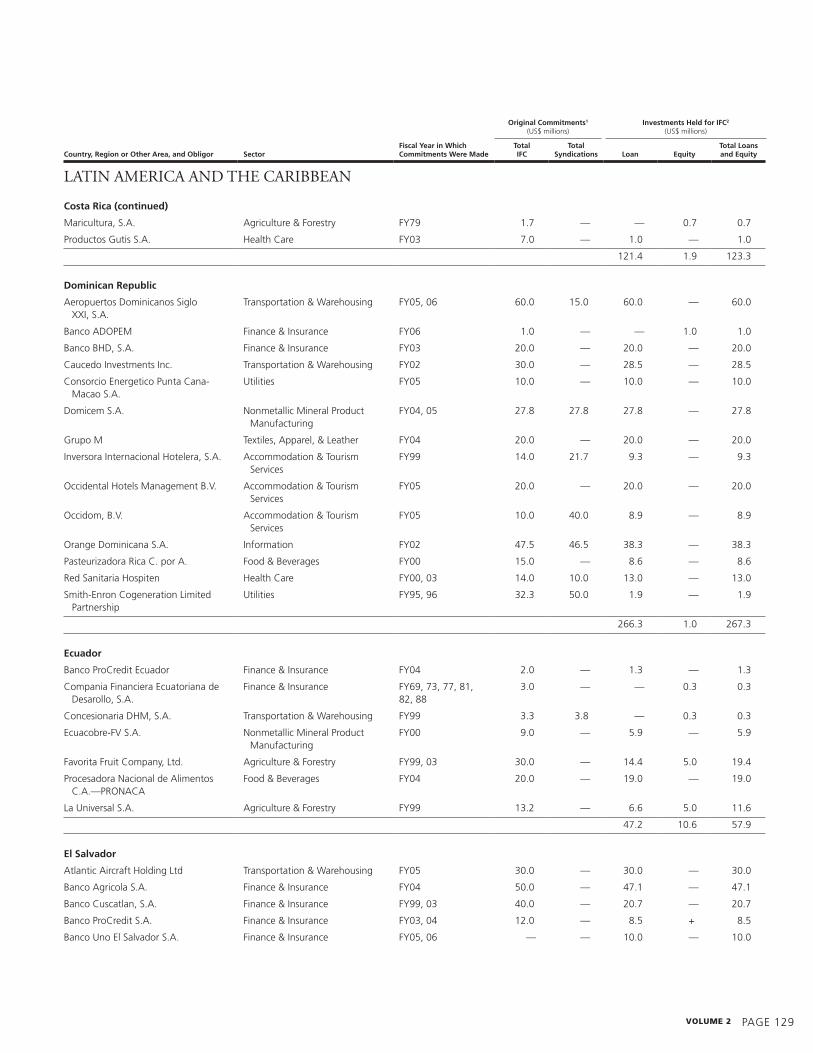
volume 2 PAGE 12�
original Commitments1
(uS$ millions)Investments Held for IFC2
(uS$ millions)
Country, region or other area, and obligor sectorFiscal Year in Which Commitments Were made
total IFC
total syndications
loan
equity
total loans and equity
Costa rica (continued)
Maricultura, S.A. Agriculture & Forestry Fy7� 1.7 — — 0.7 0.7
Productos Gutis S.A. health Care Fy03 7.0 — 1.0 — 1.0
121.4 1.� 123.3
Dominican republic
Aeropuertos Dominicanos Siglo XXI, S.A.
Transportation & Warehousing Fy05, 06 60.0 15.0 60.0 — 60.0
Banco ADoPEM Finance & Insurance Fy06 1.0 — — 1.0 1.0
Banco BhD, S.A. Finance & Insurance Fy03 20.0 — 20.0 — 20.0
Caucedo Investments Inc. Transportation & Warehousing Fy02 30.0 — 28.5 — 28.5
Consorcio Energetico Punta Cana-Macao S.A.
utilities Fy05 10.0 — 10.0 — 10.0
Domicem S.A. Nonmetallic Mineral Product Manufacturing
Fy04, 05 27.8 27.8 27.8 — 27.8
Grupo M Textiles, Apparel, & Leather Fy04 20.0 — 20.0 — 20.0
Inversora Internacional hotelera, S.A. Accommodation & Tourism Services
Fy�� 14.0 21.7 �.3 — �.3
occidental hotels Management B.V. Accommodation & Tourism Services
Fy05 20.0 — 20.0 — 20.0
occidom, B.V. Accommodation & Tourism Services
Fy05 10.0 40.0 8.� — 8.�
orange Dominicana S.A. Information Fy02 47.5 46.5 38.3 — 38.3
Pasteurizadora Rica C. por A. Food & Beverages Fy00 15.0 — 8.6 — 8.6
Red Sanitaria hospiten health Care Fy00, 03 14.0 10.0 13.0 — 13.0
Smith-Enron Cogeneration Limited Partnership
utilities Fy�5, �6 32.3 50.0 1.� — 1.�
266.3 1.0 267.3
ecuador
Banco ProCredit Ecuador Finance & Insurance Fy04 2.0 — 1.3 — 1.3
Compania Financiera Ecuatoriana de Desarollo, S.A.
Finance & Insurance Fy6�, 73, 77, 81, 82, 88
3.0 — — 0.3 0.3
Concesionaria DhM, S.A. Transportation & Warehousing Fy�� 3.3 3.8 — 0.3 0.3
Ecuacobre-FV S.A. Nonmetallic Mineral Product Manufacturing
Fy00 �.0 — 5.� — 5.�
Favorita Fruit Company, Ltd. Agriculture & Forestry Fy��, 03 30.0 — 14.4 5.0 1�.4
Procesadora Nacional de Alimentos C.A.—PRoNACA
Food & Beverages Fy04 20.0 — 1�.0 — 1�.0
La universal S.A. Agriculture & Forestry Fy�� 13.2 — 6.6 5.0 11.6
47.2 10.6 57.�
el salvador
Atlantic Aircraft holding Ltd Transportation & Warehousing Fy05 30.0 — 30.0 — 30.0
Banco Agricola S.A. Finance & Insurance Fy04 50.0 — 47.1 — 47.1
Banco Cuscatlan, S.A. Finance & Insurance Fy��, 03 40.0 — 20.7 — 20.7
Banco ProCredit S.A. Finance & Insurance Fy03, 04 12.0 — 8.5 + 8.5
Banco uno El Salvador S.A. Finance & Insurance Fy05, 06 — — 10.0 — 10.0
LaTin aMEriCa and ThE CaribbEan

PAGE 130 IFc annual report 2006
original Commitments1
(uS$ millions)Investments Held for IFC2
(uS$ millions)
Country, region or other area, and obligor sectorFiscal Year in Which Commitments Were made
total IFC
total syndications
loan
equity
total loans and equity
el salvador (continued)
Confia AFP S.A. Finance & Insurance Fy04 7.5 — — 7.5 7.5
Implementos Agricolas Centroamericanos, S.A.
Industrial & Consumer Products Fy�8, �� 2.2 — — 0.2 0.2
Metrocentro, S.A. de C.V. Wholesale & Retail Trade Fy04 25.0 — 25.0 — 25.0
141.3 7.7 14�.0
Grenada
Bel Air Plantation Limited Accommodation & Tourism Services
Fy02 2.0 — 2.0 — 2.0
2.0 — 2.0
Guatemala
Banco Cuscatlan de Guatemala Finance & Insurance Fy03 10.0 — 10.0 — 10.0
Banco Industrial S.A. (Guatemala) Finance & Insurance Fy06 30.0 — 30.0 — 30.0
Frutera del Pacifico, S.A. Agriculture & Forestry Fy00 7.0 — 1.4 — 1.4
Generadora de occidente Limitada utilities Fy03 15.0 12.0 12.3 — 12.3
Montana Exploradora de Guatemala S.A.
oil, Gas, & Mining Fy04 45.0 — 45.0 — 45.0
operadora de Tiendas, S.A. (La Fragua, S.A.)
Wholesale & Retail Trade Fy�� 20.0 — �.5 — �.5
orzunil I de Electricidad, Limitada utilities Fy�8, 00 14.3 15.0 7.7 1.2 8.�
115.8 1.2 117.0
Guyana
Guyana Americas Merchant Bank Finance & Insurance Fy00 1.0 — — 1.0 1.0
Guyana Goldfields Inc oil, Gas, & Mining Fy06 4.6 — — 4.7 4.7
— 5.7 5.7
Haiti
Micro Credit National S.A. Finance & Insurance Fy00 0.4 — — 0.4 0.4
unigestion holdings S.A. Information Fy06 15.0 — 15.0 — 15.0
15.0 0.4 15.4
Honduras
Compania Pino Celulosa de Centro America, S.A.
Pulp & Paper Fy6�, 70 0.1 — — 0.1 0.1
Grupo Granjas Marinas, S.A. de C.V. Agriculture & Forestry Fy87, �� 6.6 — 2.5 — 2.5
2.5 0.1 2.5
Jamaica
Jamaica Energy Partners utilities Fy05 28.0 50.0 28.0 — 28.0
Jamaica Public Service Company utilities Fy03 45.0 — 45.0 — 45.0
MBJ Airports Limited Transportation & Warehousing Fy02, 06 40.0 45.0 3�.6 — 3�.6
National Commercial Bank Jamaica Finance & Insurance Fy06 30.0 — 30.0 — 30.0
142.6 — 142.6
LaTin aMEriCa and ThE CaribbEan
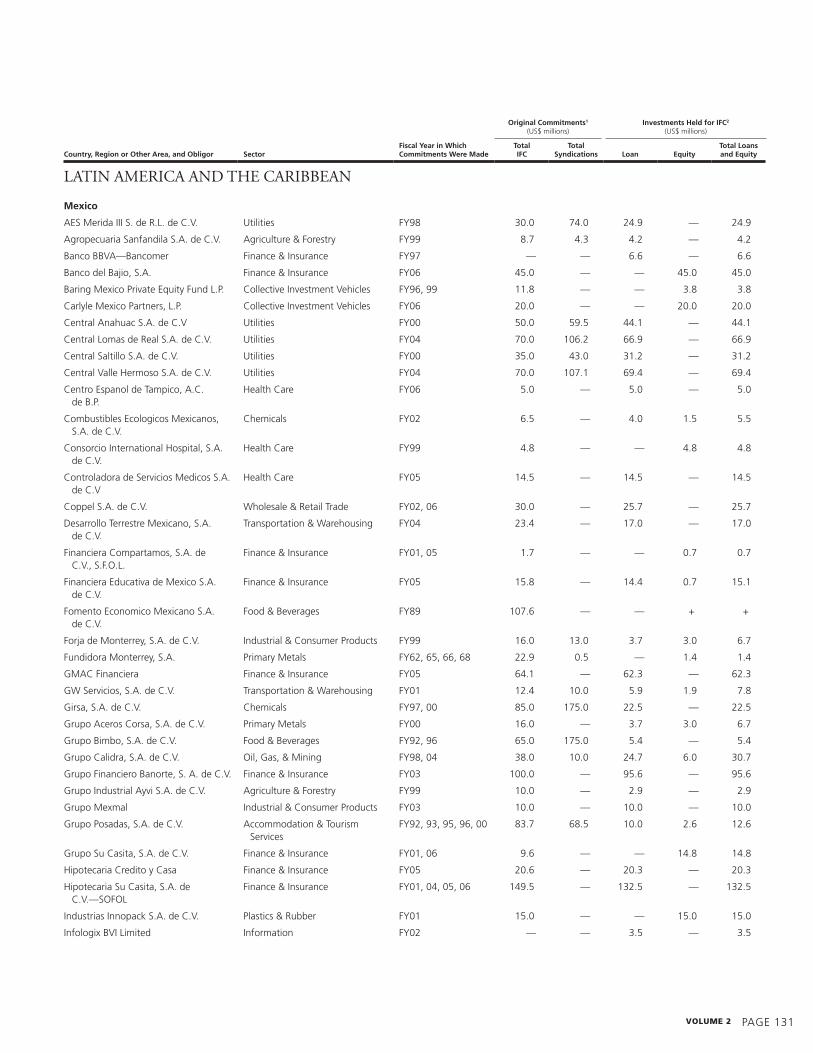
volume 2 PAGE 131
original Commitments1
(uS$ millions)Investments Held for IFC2
(uS$ millions)
LaTin aMEriCa and ThE CaribbEan
Country, region or other area, and obligor sectorFiscal Year in Which Commitments Were made
total IFC
total syndications
loan
equity
total loans and equity
mexico
AES Merida III S. de R.L. de C.V. utilities Fy�8 30.0 74.0 24.� — 24.�
Agropecuaria Sanfandila S.A. de C.V. Agriculture & Forestry Fy�� 8.7 4.3 4.2 — 4.2
Banco BBVA—Bancomer Finance & Insurance Fy�7 — — 6.6 — 6.6
Banco del Bajio, S.A. Finance & Insurance Fy06 45.0 — — 45.0 45.0
Baring Mexico Private Equity Fund L.P. Collective Investment Vehicles Fy�6, �� 11.8 — — 3.8 3.8
Carlyle Mexico Partners, L.P. Collective Investment Vehicles Fy06 20.0 — — 20.0 20.0
Central Anahuac S.A. de C.V utilities Fy00 50.0 5�.5 44.1 — 44.1
Central Lomas de Real S.A. de C.V. utilities Fy04 70.0 106.2 66.� — 66.�
Central Saltillo S.A. de C.V. utilities Fy00 35.0 43.0 31.2 — 31.2
Central Valle hermoso S.A. de C.V. utilities Fy04 70.0 107.1 6�.4 — 6�.4
Centro Espanol de Tampico, A.C. de B.P.
health Care Fy06 5.0 — 5.0 — 5.0
Combustibles Ecologicos Mexicanos, S.A. de C.V.
Chemicals Fy02 6.5 — 4.0 1.5 5.5
Consorcio International hospital, S.A. de C.V.
health Care Fy�� 4.8 — — 4.8 4.8
Controladora de Servicios Medicos S.A. de C.V
health Care Fy05 14.5 — 14.5 — 14.5
Coppel S.A. de C.V. Wholesale & Retail Trade Fy02, 06 30.0 — 25.7 — 25.7
Desarrollo Terrestre Mexicano, S.A. de C.V.
Transportation & Warehousing Fy04 23.4 — 17.0 — 17.0
Financiera Compartamos, S.A. de C.V., S.F.o.L.
Finance & Insurance Fy01, 05 1.7 — — 0.7 0.7
Financiera Educativa de Mexico S.A. de C.V.
Finance & Insurance Fy05 15.8 — 14.4 0.7 15.1
Fomento Economico Mexicano S.A. de C.V.
Food & Beverages Fy8� 107.6 — — + +
Forja de Monterrey, S.A. de C.V. Industrial & Consumer Products Fy�� 16.0 13.0 3.7 3.0 6.7
Fundidora Monterrey, S.A. Primary Metals Fy62, 65, 66, 68 22.� 0.5 — 1.4 1.4
GMAC Financiera Finance & Insurance Fy05 64.1 — 62.3 — 62.3
GW Servicios, S.A. de C.V. Transportation & Warehousing Fy01 12.4 10.0 5.� 1.� 7.8
Girsa, S.A. de C.V. Chemicals Fy�7, 00 85.0 175.0 22.5 — 22.5
Grupo Aceros Corsa, S.A. de C.V. Primary Metals Fy00 16.0 — 3.7 3.0 6.7
Grupo Bimbo, S.A. de C.V. Food & Beverages Fy�2, �6 65.0 175.0 5.4 — 5.4
Grupo Calidra, S.A. de C.V. oil, Gas, & Mining Fy�8, 04 38.0 10.0 24.7 6.0 30.7
Grupo Financiero Banorte, S. A. de C.V. Finance & Insurance Fy03 100.0 — �5.6 — �5.6
Grupo Industrial Ayvi S.A. de C.V. Agriculture & Forestry Fy�� 10.0 — 2.� — 2.�
Grupo Mexmal Industrial & Consumer Products Fy03 10.0 — 10.0 — 10.0
Grupo Posadas, S.A. de C.V. Accommodation & Tourism Services
Fy�2, �3, �5, �6, 00 83.7 68.5 10.0 2.6 12.6
Grupo Su Casita, S.A. de C.V. Finance & Insurance Fy01, 06 �.6 — — 14.8 14.8
hipotecaria Credito y Casa Finance & Insurance Fy05 20.6 — 20.3 — 20.3
hipotecaria Su Casita, S.A. de C.V.—SoFoL
Finance & Insurance Fy01, 04, 05, 06 14�.5 — 132.5 — 132.5
Industrias Innopack S.A. de C.V. Plastics & Rubber Fy01 15.0 — — 15.0 15.0
Infologix BVI Limited Information Fy02 — — 3.5 — 3.5

PAGE 132 IFc annual report 2006
original Commitments1
(uS$ millions)Investments Held for IFC2
(uS$ millions)
LaTin aMEriCa and ThE CaribbEan
Country, region or other area, and obligor sectorFiscal Year in Which Commitments Were made
total IFC
total syndications
loan
equity
total loans and equity
mexico (continued)
Interoyal hotelera, S.L. Accommodation & Tourism Services
Fy03 — — — + +
Medicus, S.A. de C.V. health Care Fy�� 3.5 — 3.3 — 3.3
Mexplus Puertos S.A. de C.V. Transportation & Warehousing Fy�3, �5, �6, �� 4.5 — — 4.5 4.5
occidental hotels Mexico, S.A. de C.V. Accommodation & Tourism Services
Fy03 40.0 40.0 24.� — 24.�
occihold International, S.L. Accommodation & Tourism Services
Fy03 — — — 10.0 10.0
Pan American Silver Corporation oil, Gas, & Mining Fy00, 02 10.� — — 0.� 0.�
Polomex S.A. de C.V. Industrial & Consumer Products Fy03 8.0 — 4.� — 4.�
Promotora de Centros Educativos S.A. de C.V.
Education Services Fy01 4.� — 3.5 — 3.5
Propalma Fondo Chiapas Equity Agency Line Subinvestment
Food & Beverages Fy�8 — — — 1.0 1.0
Proteison, S.A. de C.V. Agriculture & Forestry Fy85 2.8 — — 0.8 0.8
Puertas Finas de Madera Montealban, S.A. de C.V.
Industrial & Consumer Products Fy02 13.0 — 8.� — 8.�
SSA Mexico holdings, S.A. de C.V. Transportation & Warehousing Fy04 45.0 — 44.5 — 44.5
Terminal Maritima de Altamira, S.A. de C.V.
Transportation & Warehousing Fy�7 5.1 10.4 4.3 — 4.3
universidad Tecnologica de Mexico S.A.
Education Services Fy06 30.4 — 28.� — 28.�
Vuela Compania de Aviacion, S.A. de C.V.
Transportation & Warehousing Fy06 40.0 — 40.0 — 40.0
ZN Mexico Capital Growth Fund Ltd. Collective Investment Vehicles Fy�� 15.3 — — 1.7 1.7
ZN Mexico II, LP Collective Investment Vehicles Fy�� 10.0 — — 7.6 7.6
8�4.1 150.6 1,044.7
nicaragua
Banco Procredit S.A. (Nicaragua) Finance & Insurance Fy04 5.0 — 3.5 — 3.5
Distribuidora Cesar Guerrero S.A. Wholesale & Retail Trade Fy�� 1.0 — 0.1 — 0.1
3.6 — 3.6
panama
Aguas de Panama S.A. utilities Fy03 6.0 10.0 4.6 — 4.6
Banco Continental de Panama, S.A. Finance & Insurance Fy�3, 04 41.7 — 35.0 — 35.0
Banco del Istmo, S.A. (Banistmo) Finance & Insurance Fy00 20.0 38.0 �.4 — �.4
Banco General S.A. Finance & Insurance Fy�8, 00 40.0 — 2�.1 — 2�.1
Banco uno Panama S.A. Finance & Insurance Fy05, 06 — — 20.0 — 20.0
Compania Panamena de Aviacion, S.A. Transportation & Warehousing Fy05 15.0 — 15.0 — 15.0
Corporacion uBC Internacional, S.A. Finance & Insurance Fy03, 04 10.3 — — 10.3 10.3
International Shopping Centers holdings, Inc—ISC
Wholesale & Retail Trade Fy06 1�.0 — 1�.0 — 1�.0
La hipotecaria Finance & Insurance Fy04, 05 35.0 — 20.0 — 20.0
Manzanillo International Terminal—Panama, S.A.
Transportation & Warehousing Fy�5, 00, 05 �0.0 35.0 62.0 — 62.0

volume 2 PAGE 133
original Commitments1
(uS$ millions)Investments Held for IFC2
(uS$ millions)
LaTin aMEriCa and ThE CaribbEan
Country, region or other area, and obligor sectorFiscal Year in Which Commitments Were made
total IFC
total syndications
loan
equity
total loans and equity
panama (continued)
Panama Canal Railway Company Transportation & Warehousing Fy00, 06 20.0 30.0 11.1 — 11.1
Suleasing Internacional S.A. Finance & Insurance Fy00 2.5 — 0.8 — 0.8
226.1 10.3 236.4
paraguay
Telefonica Celular del Paraguay SA Information Fy05 15.0 — 15.0 — 15.0
15.0 — 15.0
peru
Agraria El Escoria S.A. Food & Beverages Fy00 7.0 — 7.0 — 7.0
Agro Industrial Paramonga S.A. Food & Beverages Fy�8 14.2 14.8 11.1 — 11.1
Alicorp S.A. Food & Beverages Fy00 40.0 20.0 20.0 — 20.0
Banco Internacional del Peru Finance & Insurance Fy�8, 04 60.0 100.0 40.0 — 40.0
Edpyme Edyficar S.A. Finance & Insurance Fy04 4.0 — 2.� — 2.�
Empresa Agroindustrial Laredo S.A.A. Food & Beverages Fy00, 05 15.0 — �.3 — �.3
Ferrocarril Transandino S.A. Transportation & Warehousing Fy02 �.0 — 7.4 — 7.4
Global Microcredit Facility Finance & Insurance Fy04 4.0 — 4.0 — 4.0
Gloria S.A. Food & Beverages Fy04 25.0 — 23.6 — 23.6
Inversiones Malecon de la Reserva S.A.
Accommodation & Tourism Services
Fy05 10.0 — 10.0 — 10.0
Inka Terra, Peru S.A.C. Accommodation & Tourism Services
Fy01 5.0 — 4.7 — 4.7
Interconexion Electrica ISA Peru S.A. utilities Fy02, 03 18.0 8.0 15.3 — 15.3
Interseguro Compania de Seguros de Vida S.A.
Finance & Insurance Fy02, 03, 05 5.2 — — 5.2 5.2
Latino Leasing, S.A. Finance & Insurance Fy�8 12.5 — 3.8 — 3.8
MIBANCo, Banco de la Microempresa, S.A.
Finance & Insurance Fy02, 06 32.0 — 2�.3 — 2�.3
Minera Quellaveco S.A. oil, Gas, & Mining Fy�3, �6, 00, 01 12.� — — 12.� 12.�
Minera yanacocha S.A. oil, Gas, & Mining Fy�4, �5, 00 32.7 5�.0 — 0.3 0.3
Norvial S.A. Transportation & Warehousing Fy03 18.0 — 18.0 — 18.0
Peru orient Express hotel Accommodation & Tourism Services
Fy01 10.0 — 8.8 — 8.8
Peru Privatization Fund L.P. Collective Investment Vehicles Fy�5 13.� — — 1.5 1.5
The Peru Privatization Fund Management Services Company Limited
Collective Investment Vehicles Fy�5 0.0 — — + +
Ransa Comercial S.A. Transportation & Warehousing Fy00, 05 20.0 — 14.4 — 14.4
Sociedad Agricola Drokasa S.A. Agriculture & Forestry Fy00, 06 21.0 — 15.0 — 15.0
Tecnofil S.A. Industrial & Consumer Products Fy02 7.4 — 3.2 2.0 5.2
247.7 21.� 26�.6
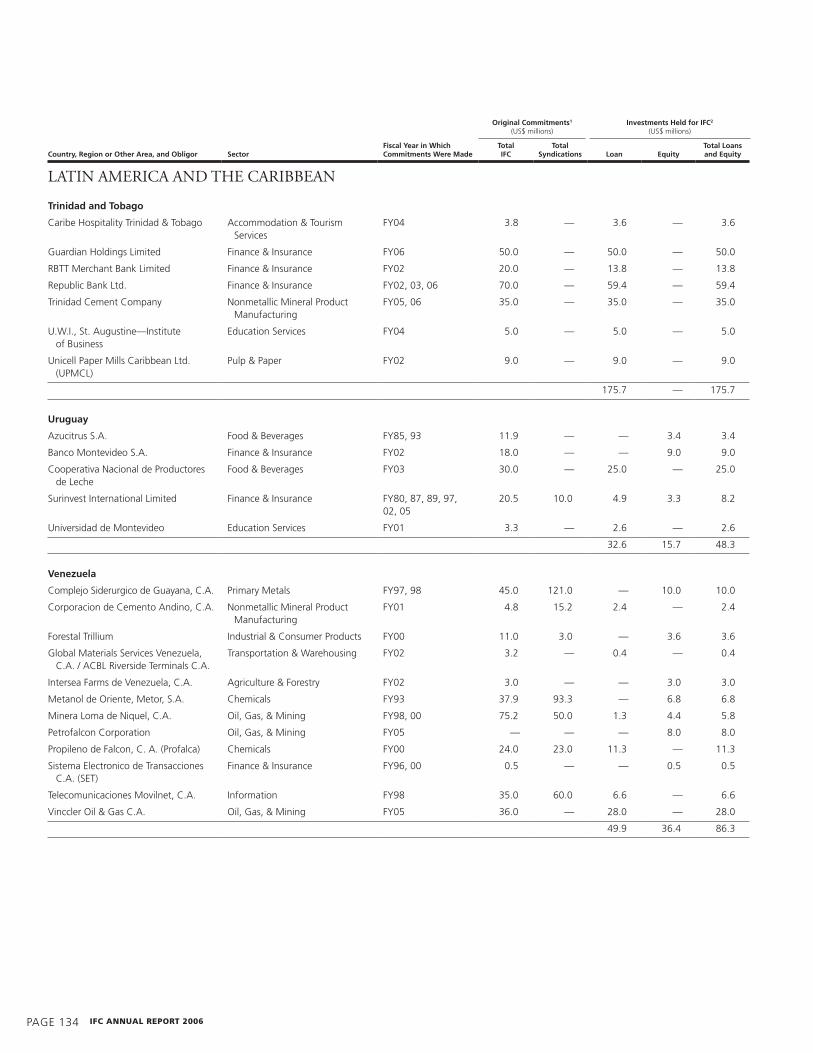
PAGE 134 IFc annual report 2006
original Commitments1
(uS$ millions)Investments Held for IFC2
(uS$ millions)
LaTin aMEriCa and ThE CaribbEan
Country, region or other area, and obligor sectorFiscal Year in Which Commitments Were made
total IFC
total syndications
loan
equity
total loans and equity
trinidad and tobago
Caribe hospitality Trinidad & Tobago Accommodation & Tourism Services
Fy04 3.8 — 3.6 — 3.6
Guardian holdings Limited Finance & Insurance Fy06 50.0 — 50.0 — 50.0
RBTT Merchant Bank Limited Finance & Insurance Fy02 20.0 — 13.8 — 13.8
Republic Bank Ltd. Finance & Insurance Fy02, 03, 06 70.0 — 5�.4 — 5�.4
Trinidad Cement Company Nonmetallic Mineral Product Manufacturing
Fy05, 06 35.0 — 35.0 — 35.0
u.W.I., St. Augustine—Institute of Business
Education Services Fy04 5.0 — 5.0 — 5.0
unicell Paper Mills Caribbean Ltd. (uPMCL)
Pulp & Paper Fy02 �.0 — �.0 — �.0
175.7 — 175.7
uruguay
Azucitrus S.A. Food & Beverages Fy85, �3 11.� — — 3.4 3.4
Banco Montevideo S.A. Finance & Insurance Fy02 18.0 — — �.0 �.0
Cooperativa Nacional de Productores de Leche
Food & Beverages Fy03 30.0 — 25.0 — 25.0
Surinvest International Limited Finance & Insurance Fy80, 87, 8�, �7, 02, 05
20.5 10.0 4.� 3.3 8.2
universidad de Montevideo Education Services Fy01 3.3 — 2.6 — 2.6
32.6 15.7 48.3
Venezuela
Complejo Siderurgico de Guayana, C.A. Primary Metals Fy�7, �8 45.0 121.0 — 10.0 10.0
Corporacion de Cemento Andino, C.A. Nonmetallic Mineral Product Manufacturing
Fy01 4.8 15.2 2.4 — 2.4
Forestal Trillium Industrial & Consumer Products Fy00 11.0 3.0 — 3.6 3.6
Global Materials Services Venezuela, C.A. / ACBL Riverside Terminals C.A.
Transportation & Warehousing Fy02 3.2 — 0.4 — 0.4
Intersea Farms de Venezuela, C.A. Agriculture & Forestry Fy02 3.0 — — 3.0 3.0
Metanol de oriente, Metor, S.A. Chemicals Fy�3 37.� �3.3 — 6.8 6.8
Minera Loma de Niquel, C.A. oil, Gas, & Mining Fy�8, 00 75.2 50.0 1.3 4.4 5.8
Petrofalcon Corporation oil, Gas, & Mining Fy05 — — — 8.0 8.0
Propileno de Falcon, C. A. (Profalca) Chemicals Fy00 24.0 23.0 11.3 — 11.3
Sistema Electronico de Transacciones C.A. (SET)
Finance & Insurance Fy�6, 00 0.5 — — 0.5 0.5
Telecomunicaciones Movilnet, C.A. Information Fy�8 35.0 60.0 6.6 — 6.6
Vinccler oil & Gas C.A. oil, Gas, & Mining Fy05 36.0 — 28.0 — 28.0
4�.� 36.4 86.3

volume 2 PAGE 135
original Commitments1
(uS$ millions)Investments Held for IFC2
(uS$ millions)
LaTin aMEriCa and ThE CaribbEan
Country, region or other area, and obligor sectorFiscal Year in Which Commitments Were made
total IFC
total syndications
loan
equity
total loans and equity
regional Investment
Advent Latin American Private Equity Fund III-E Limited Partnership
Collective Investment Vehicles Fy06 20.0 — — 20.0 20.0
Advent Latin American Private Equity Fund II B Limited Partnership
Collective Investment Vehicles Fy02 15.0 — — 14.3 14.3
Aureos Central America Fund, L.L.C. Collective Investment Vehicles Fy03 8.3 — — 7.3 7.3
Convergence Communications, Inc. Information Fy00, 01, 02 7.1 — — 7.1 7.1
Darby-BBVA Latin America Private Equity Fund, L.P.
Collective Investment Vehicles Fy03 10.0 — — 10.0 10.0
ECoM Agroindustrial Corp. Ltd. Agriculture & Forestry Fy06 25.0 — 25.0 — 25.0
GeoPark holdings Limited oil, Gas, & Mining Fy06 10.0 — — 10.0 10.0
hSBC Private Equity Latin America (Cayman) L.P.
Collective Investment Vehicles Fy01 — — — 0.3 0.3
hSBC Tower II Equity Partners (Cayman) L.P.
Collective Investment Vehicles Fy01 20.0 — — 14.1 14.1
The Latin America Enterprise Fund II, L.P.
Collective Investment Vehicles Fy�8 13.1 — — 11.� 11.�
The Latin America Enterprise Fund, L.P. Collective Investment Vehicles Fy�5 20.0 — — 4.1 4.1
Latin American Agribusiness Development Corporation S.A.
Finance & Insurance Fy02, 06 50.0 — 43.3 — 43.3
Latin Power I L.D.C. Collective Investment Vehicles Fy�3 25.0 — — 10.8 10.8
Latin Power II L.D.C. Collective Investment Vehicles Fy�8 7.0 — — 1.� 1.�
Marcopolo S.A. Industrial & Consumer Products Fy03 30.0 — 28.1 — 28.1
Paladin Realty Latin America Investors II, L.P.
Collective Investment Vehicles Fy06 15.0 — — 15.0 15.0
PriceSmart, Inc. Wholesale & Retail Trade Fy01, 02 42.0 — 17.1 2.8 1�.�
Proa II Fondo de Inversion Collective Investment Vehicles Fy05 11.0 — — 11.0 11.0
Profund Internacional, S.A. Collective Investment Vehicles Fy�6 3.0 — — + +
Scotiabank Multicountry Loan Facility Finance & Insurance Fy01 25.0 25.0 25.0 — 25.0
Solidus Finance & Insurance Fy06 3.0 — — 3.0 3.0
TCW/ Latin America offshore Private Equity Partners I, L.P.
Collective Investment Vehicles Fy00 20.0 — — 18.5 18.5
Terra Capital Investors Ltd. Collective Investment Vehicles Fy�� 5.0 — — 5.0 5.0
Trans union Central America Finance & Insurance Fy03, 04 0.5 — — 0.5 0.5
uABL Limited Transportation & Warehousing Fy03 25.0 10.0 16.6 — 16.6
uPR holdings Transportation & Warehousing Fy03 — — — 5.0 5.0
155.1 172.8 327.8
total equity and loans 5,206.3 1,221.9 6,428.1
286.5
6,714.7
total guarantees and risk management products
total IFC portfolio for latin america and the Caribbean
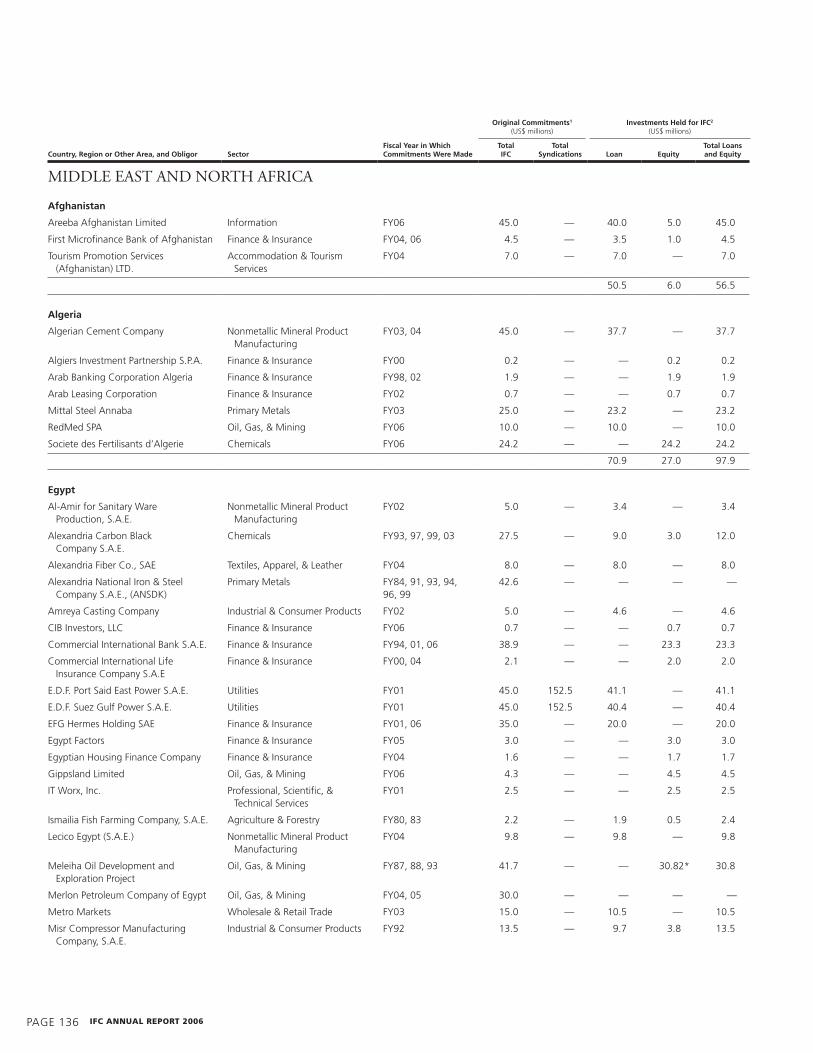
PAGE 136 IFc annual report 2006
original Commitments1
(uS$ millions)Investments Held for IFC2
(uS$ millions)
Country, region or other area, and obligor sectorFiscal Year in Which Commitments Were made
total IFC
total syndications
loan
equity
total loans and equity
afghanistan
Areeba Afghanistan Limited Information Fy06 45.0 — 40.0 5.0 45.0
First Microfinance Bank of Afghanistan Finance & Insurance Fy04, 06 4.5 — 3.5 1.0 4.5
Tourism Promotion Services (Afghanistan) LTD.
Accommodation & Tourism Services
Fy04 7.0 — 7.0 — 7.0
50.5 6.0 56.5
algeria
Algerian Cement Company Nonmetallic Mineral Product Manufacturing
Fy03, 04 45.0 — 37.7 — 37.7
Algiers Investment Partnership S.P.A. Finance & Insurance Fy00 0.2 — — 0.2 0.2
Arab Banking Corporation Algeria Finance & Insurance Fy�8, 02 1.� — — 1.� 1.�
Arab Leasing Corporation Finance & Insurance Fy02 0.7 — — 0.7 0.7
Mittal Steel Annaba Primary Metals Fy03 25.0 — 23.2 — 23.2
RedMed SPA oil, Gas, & Mining Fy06 10.0 — 10.0 — 10.0
Societe des Fertilisants d’Algerie Chemicals Fy06 24.2 — — 24.2 24.2
70.� 27.0 �7.�
egypt
Al-Amir for Sanitary Ware Production, S.A.E.
Nonmetallic Mineral Product Manufacturing
Fy02 5.0 — 3.4 — 3.4
Alexandria Carbon Black Company S.A.E.
Chemicals Fy�3, �7, ��, 03 27.5 — �.0 3.0 12.0
Alexandria Fiber Co., SAE Textiles, Apparel, & Leather Fy04 8.0 — 8.0 — 8.0
Alexandria National Iron & Steel Company S.A.E., (ANSDK)
Primary Metals Fy84, �1, �3, �4, �6, ��
42.6 — — — —
Amreya Casting Company Industrial & Consumer Products Fy02 5.0 — 4.6 — 4.6
CIB Investors, LLC Finance & Insurance Fy06 0.7 — — 0.7 0.7
Commercial International Bank S.A.E. Finance & Insurance Fy�4, 01, 06 38.� — — 23.3 23.3
Commercial International Life Insurance Company S.A.E
Finance & Insurance Fy00, 04 2.1 — — 2.0 2.0
E.D.F. Port Said East Power S.A.E. utilities Fy01 45.0 152.5 41.1 — 41.1
E.D.F. Suez Gulf Power S.A.E. utilities Fy01 45.0 152.5 40.4 — 40.4
EFG hermes holding SAE Finance & Insurance Fy01, 06 35.0 — 20.0 — 20.0
Egypt Factors Finance & Insurance Fy05 3.0 — — 3.0 3.0
Egyptian housing Finance Company Finance & Insurance Fy04 1.6 — — 1.7 1.7
Gippsland Limited oil, Gas, & Mining Fy06 4.3 — — 4.5 4.5
IT Worx, Inc. Professional, Scientific, & Technical Services
Fy01 2.5 — — 2.5 2.5
Ismailia Fish Farming Company, S.A.E. Agriculture & Forestry Fy80, 83 2.2 — 1.� 0.5 2.4
Lecico Egypt (S.A.E.) Nonmetallic Mineral Product Manufacturing
Fy04 �.8 — �.8 — �.8
Meleiha oil Development and Exploration Project
oil, Gas, & Mining Fy87, 88, �3 41.7 — — 30.82* 30.8
Merlon Petroleum Company of Egypt oil, Gas, & Mining Fy04, 05 30.0 — — — —
Metro Markets Wholesale & Retail Trade Fy03 15.0 — 10.5 — 10.5
Misr Compressor Manufacturing Company, S.A.E.
Industrial & Consumer Products Fy�2 13.5 — �.7 3.8 13.5
MiddLE EaST and norTh afriCa

volume 2 PAGE 137
original Commitments1
(uS$ millions)Investments Held for IFC2
(uS$ millions)
MiddLE EaST and norTh afriCa
Country, region or other area, and obligor sectorFiscal Year in Which Commitments Were made
total IFC
total syndications
loan
equity
total loans and equity
egypt (continued)
oRIX Leasing Finance & Insurance Fy�7, 02, 06 7.� — 5.1 0.� 6.0
Sekem holdings Chemicals Fy03 5.0 — 4.2 — 4.2
Societe Nationale d’Industries Nutritive Food & Beverages Fy06 14.0 — 14.0 — 14.0
Sokhna Port Development Company Transportation & Warehousing Fy04 20.0 — 18.4 — 18.4
unipak Nile Limited Pulp & Paper Fy�8, 01 8.0 — 4.1 — 4.1
Wadi holdings Agriculture & Forestry Fy05 15.0 — 15.0 — 15.0
21�.2 76.6 2�5.8
Iran, Islamic republic of
Gorouh Sanaye Kaghas Pars Sherkate Sahami AAM
Pulp & Paper Fy72 12.0 2.0 — 1.8 1.8
Karafarin Bank Finance & Insurance Fy05 10.0 — 10.0 — 10.0
Karafarin Leasing Company Finance & Insurance Fy05 2.0 — — 2.0 2.0
Rak Ceramics Joint Stock Company Nonmetallic Mineral Product Manufacturing
Fy04 7.0 — 7.0 — 7.0
Saman Bank JSC Finance & Insurance Fy05 10.0 — 10.0 — 10.0
27.0 3.8 30.8
Iraq
Iraq National Bank Finance & Insurance Fy05 8.0 — 8.0 — 8.0
National Bank of Kuwait—Iraq Finance & Insurance Fy05 1.� — — 1.� 1.�
united Cement Corporation Nonmetallic Mineral Product Manufacturing
Fy06 �8.3 — �0.0 8.3 �8.3
�8.0 10.2 108.2
Jordan
Business Tourism Company Limited Accommodation & Tourism Services
Fy�8 5.0 — 1.6 — 1.6
CTI Group Inc. Transportation & Warehousing Fy06 15.0 — 15.0 — 15.0
hikma Investment Company Ltd. Chemicals Fy87, �1, �3, �5, 03 24.5 — 10.2 — 10.2
hikma Pharmaceuticals plc Chemicals Fy�1, �5 — — — 0.� 0.�
International Luggage Manufacturing Company
Textiles, Apparel, & Leather Fy01 8.0 — 7.2 — 7.2
Middle East Regional Development Enterprise
Nonmetallic Mineral Product Manufacturing
Fy02 5.0 — 4.4 0.6 5.0
Modern Agricultural Investment Company
Transportation & Warehousing Fy�� 1.0 — — 1.0 1.0
Societe Generale de Banque Jordanie Finance & Insurance Fy01 4.4 — — 2.1 2.1
Zara Investment holding Company Limited
Accommodation & Tourism Services
Fy�7 18.0 — — 3.0 3.0
38.3 7.5 45.�
lebanon
Byblos Bank S.A.L. Finance & Insurance Fy�3, �7, 01, 03 38.8 40.2 �.8 — �.8
SABIS International School—Adma Education Services Fy05 8.0 — 8.0 — 8.0
Societe hoteliere “De Vinci” S.A.L. Accommodation & Tourism Services
Fy�� 3.0 — 0.� — 0.�
18.6 — 18.6

PAGE 138 IFc annual report 2006
original Commitments1
(uS$ millions)Investments Held for IFC2
(uS$ millions)
MiddLE EaST and norTh afriCa
Country, region or other area, and obligor sectorFiscal Year in Which Commitments Were made
total IFC
total syndications
loan
equity
total loans and equity
morocco
Cerame Afrique Industries Nonmetallic Mineral Product Manufacturing
Fy�1 5.2 — — 1.7 1.7
Maghreb Management Limited Collective Investment Vehicles Fy00 0.0 — — + +
Maghreb Private Equity Fund Limited Collective Investment Vehicles Fy00 5.0 — — 3.7 3.7
Settat Filature (SETAFIL) Textiles, Apparel, & Leather Fy88, �3 4.4 — 3.4 1.2 4.6
3.4 6.6 10.0
oman
Alliance housing Bank Finance & Insurance Fy05 45.0 — 45.0 — 45.0
Bank Muscat (S.A.o.G.) Finance & Insurance Fy06 100.0 — 100.0 — 100.0
Mazoon Petrogas SAoC oil, Gas, & Mining Fy05 40.0 — 3�.1 — 3�.1
Taageer Finance Company Finance & Insurance Fy05 10.0 — 10.0 — 10.0
united Power Company S.A.o.G. utilities Fy�5, 00 20.5 57.0 3.1 5.1 8.2
1�7.3 5.1 202.3
pakistan
AES Lal Pir (Private) Limited utilities Fy�5 4�.4 — 14.� �.5 24.4
AES Pak Gen (Private) Company utilities Fy�6 2�.5 48.3 �.2 �.5 18.7
Abamco Composite Fund Collective Investment Vehicles Fy05 5.0 — — 5.0 5.0
Abamco Limited Collective Investment Vehicles Fy�5 0.3 — — 0.3 0.3
BRR International Modaraba Finance & Insurance Fy�2, �4, �6 15.8 — + 0.8 0.8
CSIBL Finance & Insurance Fy05 7.0 — 6.5 — 6.5
Crescent Bahuman Limited Textiles, Apparel, & Leather Fy�4, �7, 02 23.4 11.5 2.5 5.1 7.6
Dewan Investment and Finance Company
Finance & Insurance Fy04 1.0 — — 1.0 1.0
Dewan Salman Fibres Limited Textiles, Apparel, & Leather Fy03, 04 35.0 — 30.0 — 30.0
Engro Chemical Pakistan Limited Chemicals Fy�1, �7, 06 55.3 14.0 — 2.6 2.6
Eni Pakistan Limited oil, Gas, & Mining Fy02 30.0 — 12.0 — 12.0
First International Investment Bank Limited
Finance & Insurance Fy�0, �2, �6 4.7 — — 1.5 1.5
First MicroFinanceBank Limited Finance & Insurance Fy02 2.7 — — 2.7 2.7
First uDL Modaraba Finance & Insurance Fy�6, 04 10.0 — — — —
Gul Ahmed Energy Limited utilities Fy�6 31.1 35.0 8.1 4.1 12.2
habib Bank Limited (hBL) Finance & Insurance Fy06 50.0 — 50.0 — 50.0
Kohinoor Energy Limited utilities Fy�5 31.3 36.6 6.3 6.3 12.6
orix Investment Bank Pakistan Limited Finance & Insurance Fy�6, 06 5.6 — 5.0 — 5.0
orix Leasing Pakistan Finance & Insurance Fy�4, 06 2�.5 3.3 17.0 — 17.0
Packages Limited Pulp & Paper Fy65, 80, 82, 87, 88, �2, �4, �5, 05
50.6 20.1 — 5.8 5.8
Pakistan International Container Terminal
Transportation & Warehousing Fy03 �.3 — 8.0 — 8.0
Pakistan Petroleum Limited oil, Gas, & Mining Fy83, 85, �5, 02 47.6 86.0 — 7.0 7.0
Paktel Limited Information Fy06 35.0 — 35.0 — 35.0
Premier Mercantile Services Limited Transportation & Warehousing Fy05, 06 14.0 — 14.0 — 14.0
Rally Energy Corp. oil, Gas, & Mining Fy06 15.0 — 15.0 — 15.0
Sarah Textiles Textiles, Apparel, & Leather Fy�3, �6, 02 7.8 — 1.1 — 1.1
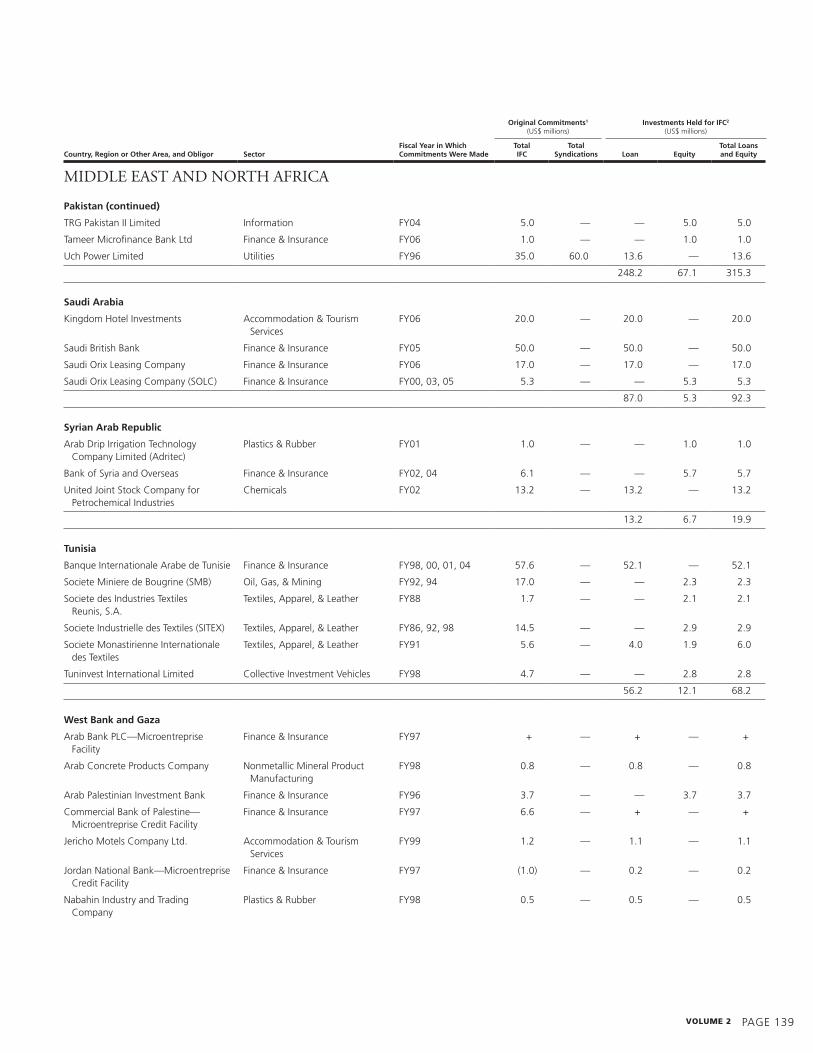
volume 2 PAGE 13�
original Commitments1
(uS$ millions)Investments Held for IFC2
(uS$ millions)
MiddLE EaST and norTh afriCa
Country, region or other area, and obligor sectorFiscal Year in Which Commitments Were made
total IFC
total syndications
loan
equity
total loans and equity
pakistan (continued)
TRG Pakistan II Limited Information Fy04 5.0 — — 5.0 5.0
Tameer Microfinance Bank Ltd Finance & Insurance Fy06 1.0 — — 1.0 1.0
uch Power Limited utilities Fy�6 35.0 60.0 13.6 — 13.6
248.2 67.1 315.3
saudi arabia
Kingdom hotel Investments Accommodation & Tourism Services
Fy06 20.0 — 20.0 — 20.0
Saudi British Bank Finance & Insurance Fy05 50.0 — 50.0 — 50.0
Saudi orix Leasing Company Finance & Insurance Fy06 17.0 — 17.0 — 17.0
Saudi orix Leasing Company (SoLC) Finance & Insurance Fy00, 03, 05 5.3 — — 5.3 5.3
87.0 5.3 �2.3
syrian arab republic
Arab Drip Irrigation Technology Company Limited (Adritec)
Plastics & Rubber Fy01 1.0 — — 1.0 1.0
Bank of Syria and overseas Finance & Insurance Fy02, 04 6.1 — — 5.7 5.7
united Joint Stock Company for Petrochemical Industries
Chemicals Fy02 13.2 — 13.2 — 13.2
13.2 6.7 1�.�
tunisia
Banque Internationale Arabe de Tunisie Finance & Insurance Fy�8, 00, 01, 04 57.6 — 52.1 — 52.1
Societe Miniere de Bougrine (SMB) oil, Gas, & Mining Fy�2, �4 17.0 — — 2.3 2.3
Societe des Industries Textiles Reunis, S.A.
Textiles, Apparel, & Leather Fy88 1.7 — — 2.1 2.1
Societe Industrielle des Textiles (SITEX) Textiles, Apparel, & Leather Fy86, �2, �8 14.5 — — 2.� 2.�
Societe Monastirienne Internationale des Textiles
Textiles, Apparel, & Leather Fy�1 5.6 — 4.0 1.� 6.0
Tuninvest International Limited Collective Investment Vehicles Fy�8 4.7 — — 2.8 2.8
56.2 12.1 68.2
West Bank and Gaza
Arab Bank PLC—Microentreprise Facility
Finance & Insurance Fy�7 + — + — +
Arab Concrete Products Company Nonmetallic Mineral Product Manufacturing
Fy�8 0.8 — 0.8 — 0.8
Arab Palestinian Investment Bank Finance & Insurance Fy�6 3.7 — — 3.7 3.7
Commercial Bank of Palestine—Microentreprise Credit Facility
Finance & Insurance Fy�7 6.6 — + — +
Jericho Motels Company Ltd. Accommodation & Tourism Services
Fy�� 1.2 — 1.1 — 1.1
Jordan National Bank—Microentreprise Credit Facility
Finance & Insurance Fy�7 (1.0) — 0.2 — 0.2
Nabahin Industry and Trading Company
Plastics & Rubber Fy�8 0.5 — 0.5 — 0.5

PAGE 140 IFc annual report 2006
original Commitments1
(uS$ millions)Investments Held for IFC2
(uS$ millions)
Country, region or other area, and obligor sectorFiscal Year in Which Commitments Were made
total IFC
total syndications
loan
equity
total loans and equity
West Bank and Gaza (continued)
Palestine Industrial Estates Development and Management Company
Construction & Real Estate Fy�8 2.0 — 1.0 1.0 2.0
Palestine Mortgage and housing Corporation Limited
Finance & Insurance Fy�� 3.0 — — 3.0 3.0
Palestine Tourism Investment Company Accommodation & Tourism Services
Fy�� �.4 — — 0.5 0.5
Peace Technology Fund Ltd. Collective Investment Vehicles Fy�� 12.6 — — 12.3 12.3
Peace Technology Management Ltd. Collective Investment Vehicles Fy�8 0.2 — — 0.2 0.2
3.6 20.7 24.3
Yemen, republic of
Aden Company for Silos and Mills Food & Beverages Fy�� 8.0 — 6.4 — 6.4
Al-Ahila Mineral Water Company Food & Beverages Fy03 1.5 — 1.4 — 1.4
Marib Agriculture Company, y.S.C. Agriculture & Forestry Fy87 2.8 — 2.4 0.3 2.7
National Cement Company Nonmetallic Mineral Product Manufacturing
Fy06 35.0 — 35.0 — 35.0
yemen Battery Manufacturing Company, y.S.C.
Industrial & Consumer Products Fy84, 85 4.0 0.4 3.3 0.5 3.8
48.4 0.� 4�.2
regional Investment
Arab Insurance Group Finance & Insurance Fy�8 6.2 — — 6.0 6.0
Maghreb Private Equity Fund II Collective Investment Vehicles Fy06 11.7 — — 12.6 12.6
Nuqul Group Pulp & Paper Fy05 25.0 — 25.0 — 25.0
25.0 18.6 43.6
total equity and loans 1,204.7 274.1 1,478.9
89.5
1,568.3
MiddLE EaST and norTh afriCa
total guarantees and risk management products
total IFC portfolio for middle east and north africa

volume 2 PAGE 141
original Commitments1
(uS$ millions)Investments Held for IFC2
(uS$ millions)
Country, region or other area, and obligor sectorFiscal Year in Which Commitments Were made
total IFC
total syndications
loan
equity
total loans and equity
regional Investment
ACCIoN Investments in Microfinance, SPC
Finance & Insurance Fy03 3.0 — — 3.0 3.0
Baku-Tiblisi-Ceyhan Pipeline oil, Gas, & Mining Fy04 125.0 125.0 125.0 — 125.0
Capital International Private Equity Fund IV, L.P.
Collective Investment Vehicles Fy04 30.0 — — 21.1 21.1
Emerging Markets Global Small Capitalization Fund
Collective Investment Vehicles Fy04 10.0 — — 10.0 10.0
First International Merchant Bank plc Finance & Insurance Fy05 10.0 — 6.0 4.0 10.0
GEM VII Targeted Value Income Fund Collective Investment Vehicles Fy05 30.0 — — 25.8 25.8
InfrastructureWorld.com Information Fy01 5.0 — — 5.0 5.0
Microcred S.A Finance & Insurance Fy06 2.8 — — 2.8 2.8
Novica united, Inc. Information Fy03 1.5 — — 1.5 1.5
olam International Agriculture & Forestry Fy04 15.0 — — 11.2 11.2
orient Express hotels Accommodation & Tourism Services
Fy05 25.0 — 25.0 — 25.0
ProCredit holding Finance & Insurance Fy01, 02, 03, 06 1�.8 — — 20.2 20.2
Santiago CDo Ltd. Collective Investment Vehicles Fy05 28.0 — 13.0 13.� 26.�
Schwarz Group Wholesale & Retail Trade Fy04, 05 14�.5 — 147.6 — 147.6
ShoreCap International Finance & Insurance Fy04 2.5 — — 2.5 2.5
Soco International PLC oil, Gas, & Mining Fy06 45.0 — 45.0 — 45.0
State Street Bank and Trust Company IFC Emerging Markets Common Trust Fund
Collective Investment Vehicles Fy�4 10.0 — — �.0 �.0
Stora Enso oyj Agriculture & Forestry Fy05, 06 100.0 200.0 100.0 — 100.0
TCW GEM II, Limited Collective Investment Vehicles Fy�8 10.0 — — + +
Tepe Akfen Vie Investment Construction and operation Co.
Transportation & Warehousing Fy06 27.0 — 27.0 — 27.0
488.6 130.0 618.6
total equity and loans 488.6 130.0 618.6
110.0
total IFC portfolio for Global 728.6
total eQuItY anD loans 16,744.3 4,510.5 21,254.8
16,406.7 3,911.6 20,318.3
1,308.8
21,627.1
total guarantees and risk management products
total eQuItY anD loans For IFC (net oF WrIte-oFF aDJustments)3
total Guarantees anD rIsK manaGement proDuCts
total IFC portFolIo For Its oWn aCCount
* TheCorporation’sinvestmentsinunincorporatedoilandgasjointventures(UJVs)areaccountedforunderthecostrecoverymethod,asmorefullydescribedinNoteAtotheCorporation’sFY06financialstatements.FortheUJVs,investmentsheldforIFCcomprisesthesumoftheinceptiontodatecashdisbursements,netofcashreceipts(untilcostisrecovered)plustheundisbursedbalanceofsignedcommitments,netofcancellations.
+ Lessthan$50,000.
1. CommitmentsincludefundstobeprovidedbyIFCforitsownaccount,fundstobeprovidedbyparticipantsthroughthepurchaseofaninterestinIFC’sinvestment,andfundstobeprovidedbyotherfinancialinstitutionsinassociationwithIFC,whereIFChasrenderedmaterialassistanceinmobilizingthesefunds.Originalcommitmentsarecomposedofdisbursedandundisbursedbalances.Theundisbursedportionisrevaluedatcurrentexchangerate,whilethedisbursedportionrepresentsthecostofthecommitmentatthetimeofdisbursement.LoansheldfortheCorporationarerevaluedatthecurrentexchagerate.AmountsshownareforcommitmentsoutstandingatJune30,2006,netofcancellations.
2. InvestmentsheldforIFCcomprisesthesumofthedisbursedandoutstandingbalancetogetherandtheundisbursedbalanceofsignedcommitments,netofcancellationsandbeforewrite-offadjustments.3. Write-offadjustmentsare$337.626minloansand$598.848minequityforatotalof$936.474m.
Note:Theoperationalinvestmentsarerepresentedbyloansandequity,asstated.Inaddition,incertaininvestments,theCorporationhastherighttoacquiresharesand/orparticipateintheprofitsoftheenterprise.
GLobaL

PAGE 142 IFc annual report 2006
Participants in Loan Syndications
aBn aMrO Bank n.v.
alpha Bank Sa
Banco Bilbao vizcaya argentaria S.a.
Banco Finantia Sa
Banco Latinoamericano de exportaciones Sa
Banco Santander Central hispano, Sa
Bank of america n.a.
Bank of Tokyo-Mitsubishi UFJ Ltd.
Bayerische hypo- und vereinsbank aG
Bayerische Landesbank
BnP Paribas
Caixa Geral de Depositos S.a.
Calyon
Cathay United Bank
Chiao Tung Bank Co Ltd
China Construction Bank Corporation
Citibank n.a.
CLiCO investment Bank Limited
Commerzbank aG
Cooperatieve Centrale raiffeisen-Boerenleenbank B.a. (rabobank nederland)
Cordiant Capital (iFPT)
DBS Bank Ltd
Dexia Sa
DnB nOr Bank aSa
DvB Bank aktiengesellschaft
DZ Bank aG Deutsche Zentral-Genossenschaftsbank
e.Sun Commercial Bank, Ltd.
emirates Bank international PJSC
erste Bank der Oesterreichischen Sparkassen aG
First Citizens Bank Limited
FirstCaribbean international Bank (Cayman) Limited
Fortis Bank n.v.
GarantiBank international nv
hSBC holdings PLC
hSh nordbank aG
inG Bank n.v.
J P Morgan Chase & Co.
Korea Development Bank
Landesbank Baden-württemberg
Malayan Banking Berhad
Mizuho Corporate Bank Ltd
natexis Banques Populaires
national City Bank
nederlandse Financierings-Maatschappij voor Ontwikkelingslanden nv “FMO”
norddeutsche Landesbank Girozentrale “nOrD LB”
nordea Bank aB (publ)
norinchukin Bank
Oversea-Chinese Banking Corp Ltd
raiffeisen Zentralbank Osterreich aG
raiffeisenlandesbank niederoesterreich-wien aG
rBTT Bank Limited
republic Bank Ltd
rhB Bank (L) Ltd
rietumu Banka
Sanpaolo iMi Spa
Shanghai Commercial & Savings Bank Ltd.
Skandinaviska enskilda Banken aB (Publ)
Societe Generale S.a.
Standard Bank Plc
Standard Chartered Bank
State Bank of india
Sumitomo Mitsui Banking Corporation
Sumitomo Trust & Banking Co. Ltd.
westLB aG
AsofJune30,2006

volume 2 PAGE 143
Technical assistance and advisory Projects
Sub-Saharan africa 144
East asia and the Pacific 149
South asia 154
Europe and Central asia 156
Latin america and the Caribbean 161
Middle East and north africa 164
Global 168
This table includes technical assistance and advisory projects approved during Fy06. This work is supported by various donors, including iFC itself.
Many projects in the table are carried out by a network of facilities managed by iFC; some serve a developing region, while others emphasize a specific aspect of development. Many facilities, including most of the regional project development facilities, fund their activities from a pool of core funds raised from a group of donors; other facilities, such as the Private enterprise Partnership, raise donor funds specifically for individual projects and initiatives.
in addition to the facilities, iFC manages trust funds on behalf of many donor governments to support technical assistance work. The Funding Mechanism for Technical assistance and advisory Services uses a portion of the Corporation’s retained earnings to support specific activities.
acronyms and abbreviations in the table include the following:
CBF Capacity Building FacilityCCF Corporate Citizenship FacilityCommDev Oil, Gas, and Mining Sustainable
Community Development FundCPDF China Project Development FacilityDevCo infrastructure Development
Collaboration Partnership FundeDi economic Development instituteeOF environmental Opportunities FacilityFiaS Foreign investment advisory ServiceFMTaaS Funding Mechanism for Technical
assistance and advisory ServicesFy fiscal yearGeF Global environment FacilityGeM Gender entrepreneurship MarketsLaCP Latin america and the Caribbean
Technical assistance FacilityMPDF Mekong Private Sector
Development FacilityMSi Mozambique Small and Medium
enterprise initiative
MSMe micro, small, and medium enterprisenGO nongovernmental organizationPBGi Performance Based Grants initiativePeDF Pacific enterprise Development FacilityPenSa Program for eastern indonesia
SMe assistancePeP Private enterprise PartnershipPeP-aceh Private enterprise Partnership for aceh
and nias PeP africa Private enterprise Partnership for africaPeP-Mena Private enterprise Partnership for the
Middle east and north africaPeP-Se Private enterprise Partnership
Southeast europeSeDF Southasia enterprise Development FacilitySFMF Sustainable Financial Markets FacilitySGBi Strengthening Grassroots Business initiativeSMe small and medium enterpriseTaTF Technical assistance Trust FundsUSTDa United States Trade and
Development agency

PAGE 144 IFc annual report 2006
project
project Description
Donor
program
Sub-Saharan afriCa
REGIoNAL
African National Investment Climate Workshops
To strengthen investment climate reform advisory activities for a small number of African countries highlighted in DoingBusiness.
Core Funds FIAS
Credit Bureau Program To foster the development of private credit bureaus in the region in order to facilitate the extension of credit to previously underserved segments of the population, in particular, consumers and small businesses.
Netherlands TATF
Doing Business Technical Advice To develop quick-response capacity to governments requesting technical advice with expert advisory services in the areas profiled in DoingBusiness.
IFC FIAS
Fundraising Technical Assistance To raise awareness among state and municipal officials about the different mechanisms available for raising funds for investments, including products offered by IFC and other development partners.
IFC FMTAAS
Gender Entrepreneurship Markets To identify and assess legal and administrative constraints facing women business entrepreneurs in Ghana and Tanzania and to develop a prioritized reform agenda.
Netherlands PEP Africa
hIV/AIDS Microfinance Sector Awareness
To raise awareness and develop risk management tools for the microfinance sector in Africa on hIV/AIDS.
Core Funds SFMF
IFC Against AIDS To accelerate the involvement of private enterprises in the fight against hIV/AIDS. IFC FMTAAS
MSME Finance Program To deepen and broaden the African financial sector and to raise the standard of financial services provided to MSMEs.
IFC PBGI
Review of Investment Climate Indicators
To review investment climate databases and evaluate indicators to develop a robust impact monitoring system for the Investment Climate Facility.
Core Funds FIAS
Securities Market Institutional Development
To foster the development of properly functioning securities markets in the region. Sweden PEP Africa
SME Entrepreneurship Development Initiative
To assist African entrepreneurs in developing bankable business plans and raising finance for new project investments, expansions, and modernizations.
Denmark/Japan/ Netherlands/Norway/IFC
PEP Africa
Societe Malienne de Promotion hoteliere
To allow the company to undertake a cleaner production audit and design review of its existing operations in Mali and Burkina Faso.
Core Funds EoF
Submarine Cable System To provide advisory services for structuring and implementing a fiber-optic loop for the Eastern Africa Submarine Cable System project.
IFC/Netherlands/Sweden/united Kingdom
DevCo
Trade Finance Promotion To strengthen the institutional capacity for trade finance operations in frontier market banks in the region.
IFC FMTAAS
CouNTRy
Burkina Faso
Banque Agricole et Commerciale du Burkina Microfinance
To establish a capacity-building program to enable the MFI to efficiently offer microfinance products and services to the small business sector.
Core Funds/Ireland PEP Africa/TATF
Doing Business Better To improve key areas of the investment climate to meet the standards as measured by the Doing Business indicators.
Core Funds/Switzerland FIAS

volume 2 PAGE 145
project
project Description
Donor
program
Grassroots Arts Project To establish capacity-building programs for artisans to increase production capacity and quality and improve their business management skills.
Core Funds SGBI
STEP Burkina Training To train university graduates to provide business advisory services to micro and small business operators.
Core Funds SGBI
Cameroon
AES onchocerciasis Project To design an action plan on onchocerciasis and disease prevention, and control for the company benefiting not only the company’s operations and the immediate environment but also communities beyond.
Netherlands TATF
Comoros
Privatization Study To formulate a detailed strategy and approach for the privatization programs of Comores Telecom and Société des hydrocarbures des Comores.
IFC/Netherlands/Sweden/united Kingdom
DevCo
Congo, Democratic republic of
Stakeholder Capacity Building To increase the capacity of local and provincial stakeholders to benefit from the social and environmental assessment and community development planning processes of the Kolwezi Tailings project.
Core Funds CCF
Ghana
Law on Collateral Security To advise the Ministries of Finance and Judiciary in Ghana and draft a new law and related regulations, rules, and procedures on collateral security.
Switzerland TATF
Leasing Industry Development To develop the country’s leasing industry to increase the financial options available for small and medium-size businesses.
Switzerland PEP Africa
Schools Financing To expand the facilities of private sector primary schools and improve their skills in education management.
Denmark/Netherlands/ Norway/IFC
TATF/CBF/ SME/EDI
Guinea-Bissau
Investment Policy and Legislation Assistance
To provide expert advice to the government on investment policy and legislation as well as technical assistance to finalize investment legislation.
Core Funds FIAS
Refining Investment Legislation To assist the government in refining draft legislation on foreign direct investment. IFC FIAS
Kenya
Business Development Training To sharpen the consulting skills of business development service providers to enhance their advisory and training services to SMEs.
Core Funds PEP Africa
Coca-Cola South Africa Bottling Company
To identify opportunities for building the operating and management capabilities of the company’s manual distribution centers and to develop appropriate training programs.
Core Funds CBF
Kenya Women Entrepreneur Assistance
To identify the main challenges facing women entrepreneurs and facilitate their greater participation in private sector development.
IFC GEM
Licensing Reform To help the government to develop and implement a comprehensive business license reform process and design a regulatory impact assessment tool.
Core Funds/united Kingdom
FIAS
SME Credit Scoring To complete the development of a demand-driven SME credit scoring tool for 54 banks in the region.
Core Funds PEP Africa/CBF
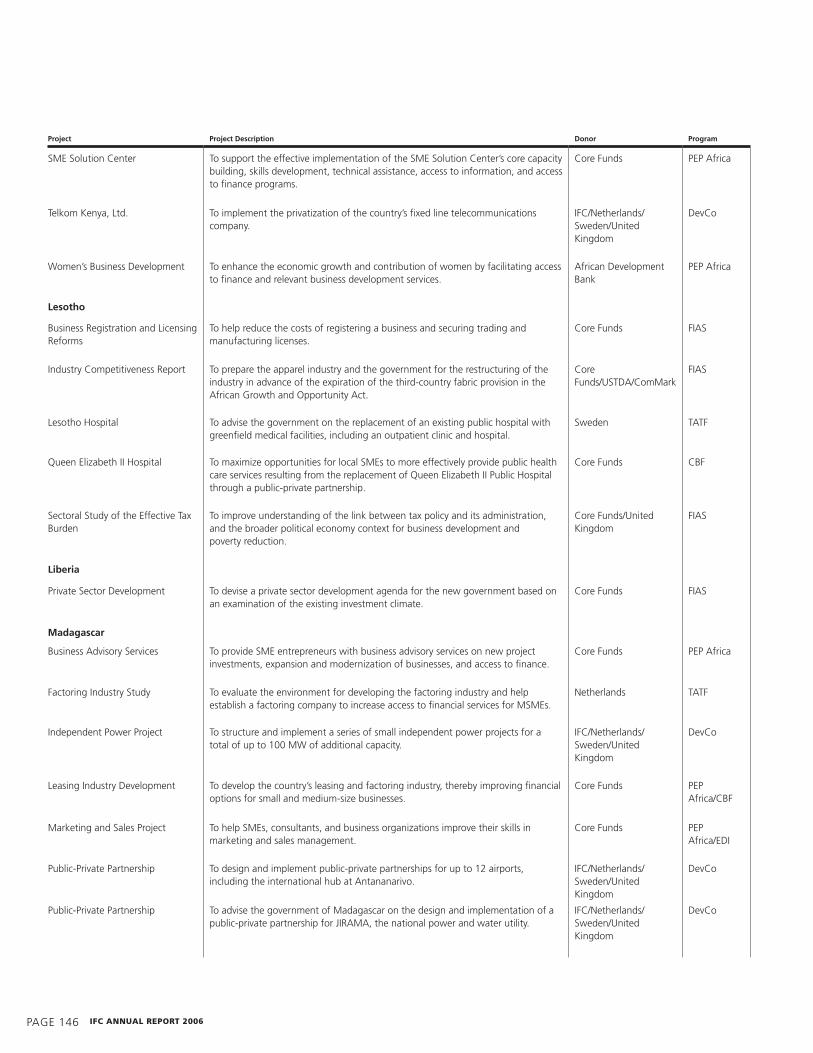
PAGE 146 IFc annual report 2006
project
project Description
Donor
program
SME Solution Center To support the effective implementation of the SME Solution Center’s core capacity building, skills development, technical assistance, access to information, and access to finance programs.
Core Funds PEP Africa
Telkom Kenya, Ltd. To implement the privatization of the country’s fixed line telecommunications company.
IFC/Netherlands/Sweden/united Kingdom
DevCo
Women’s Business Development To enhance the economic growth and contribution of women by facilitating access to finance and relevant business development services.
African Development Bank
PEP Africa
lesotho
Business Registration and Licensing Reforms
To help reduce the costs of registering a business and securing trading and manufacturing licenses.
Core Funds FIAS
Industry Competitiveness Report To prepare the apparel industry and the government for the restructuring of the industry in advance of the expiration of the third-country fabric provision in the African Growth and opportunity Act.
Core Funds/uSTDA/ComMark
FIAS
Lesotho hospital To advise the government on the replacement of an existing public hospital with greenfield medical facilities, including an outpatient clinic and hospital.
Sweden TATF
Queen Elizabeth II hospital To maximize opportunities for local SMEs to more effectively provide public health care services resulting from the replacement of Queen Elizabeth II Public hospital through a public-private partnership.
Core Funds CBF
Sectoral Study of the Effective Tax Burden
To improve understanding of the link between tax policy and its administration, and the broader political economy context for business development and poverty reduction.
Core Funds/united Kingdom
FIAS
liberia
Private Sector Development To devise a private sector development agenda for the new government based on an examination of the existing investment climate.
Core Funds FIAS
madagascar
Business Advisory Services To provide SME entrepreneurs with business advisory services on new project investments, expansion and modernization of businesses, and access to finance.
Core Funds PEP Africa
Factoring Industry Study To evaluate the environment for developing the factoring industry and help establish a factoring company to increase access to financial services for MSMEs.
Netherlands TATF
Independent Power Project To structure and implement a series of small independent power projects for a total of up to 100 MW of additional capacity.
IFC/Netherlands/Sweden/united Kingdom
DevCo
Leasing Industry Development To develop the country’s leasing and factoring industry, thereby improving financial options for small and medium-size businesses.
Core Funds PEP Africa/CBF
Marketing and Sales Project To help SMEs, consultants, and business organizations improve their skills in marketing and sales management.
Core Funds PEP Africa/EDI
Public-Private Partnership To design and implement public-private partnerships for up to 12 airports, including the international hub at Antananarivo.
IFC/Netherlands/Sweden/united Kingdom
DevCo
Public-Private Partnership To advise the government of Madagascar on the design and implementation of a public-private partnership for JIRAMA, the national power and water utility.
IFC/Netherlands/Sweden/united Kingdom
DevCo
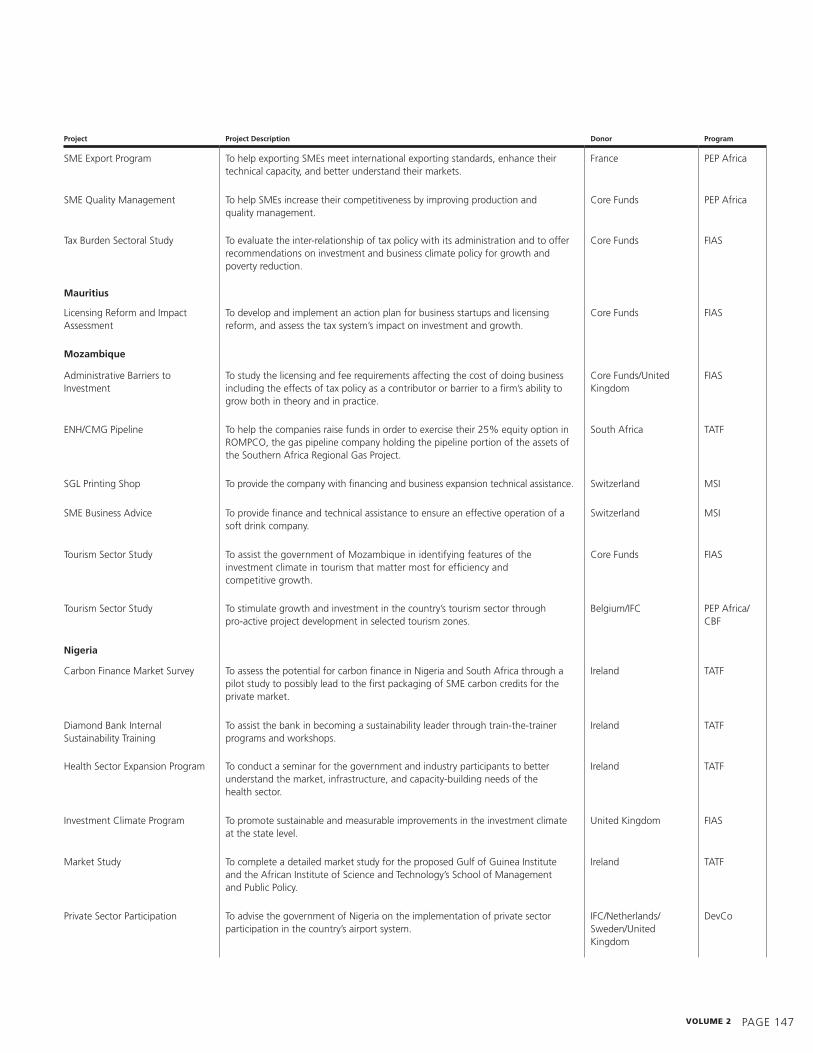
volume 2 PAGE 147
project
project Description
Donor
program
SME Export Program To help exporting SMEs meet international exporting standards, enhance their technical capacity, and better understand their markets.
France PEP Africa
SME Quality Management To help SMEs increase their competitiveness by improving production and quality management.
Core Funds PEP Africa
Tax Burden Sectoral Study To evaluate the inter-relationship of tax policy with its administration and to offer recommendations on investment and business climate policy for growth and poverty reduction.
Core Funds FIAS
mauritius
Licensing Reform and Impact Assessment
To develop and implement an action plan for business startups and licensing reform, and assess the tax system’s impact on investment and growth.
Core Funds FIAS
mozambique
Administrative Barriers to Investment
To study the licensing and fee requirements affecting the cost of doing business including the effects of tax policy as a contributor or barrier to a firm’s ability to grow both in theory and in practice.
Core Funds/united Kingdom
FIAS
ENh/CMG Pipeline To help the companies raise funds in order to exercise their 25% equity option in RoMPCo, the gas pipeline company holding the pipeline portion of the assets of the Southern Africa Regional Gas Project.
South Africa TATF
SGL Printing Shop To provide the company with financing and business expansion technical assistance. Switzerland MSI
SME Business Advice To provide finance and technical assistance to ensure an effective operation of a soft drink company.
Switzerland MSI
Tourism Sector Study To assist the government of Mozambique in identifying features of the investment climate in tourism that matter most for efficiency and competitive growth.
Core Funds FIAS
Tourism Sector Study To stimulate growth and investment in the country’s tourism sector through pro-active project development in selected tourism zones.
Belgium/IFC PEP Africa/ CBF
nigeria
Carbon Finance Market Survey To assess the potential for carbon finance in Nigeria and South Africa through a pilot study to possibly lead to the first packaging of SME carbon credits for the private market.
Ireland TATF
Diamond Bank Internal Sustainability Training
To assist the bank in becoming a sustainability leader through train-the-trainer programs and workshops.
Ireland TATF
health Sector Expansion Program To conduct a seminar for the government and industry participants to better understand the market, infrastructure, and capacity-building needs of the health sector.
Ireland TATF
Investment Climate Program To promote sustainable and measurable improvements in the investment climate at the state level.
united Kingdom FIAS
Market Study To complete a detailed market study for the proposed Gulf of Guinea Institute and the African Institute of Science and Technology’s School of Management and Public Policy.
Ireland TATF
Private Sector Participation To advise the government of Nigeria on the implementation of private sector participation in the country’s airport system.
IFC/Netherlands/Sweden/united Kingdom
DevCo
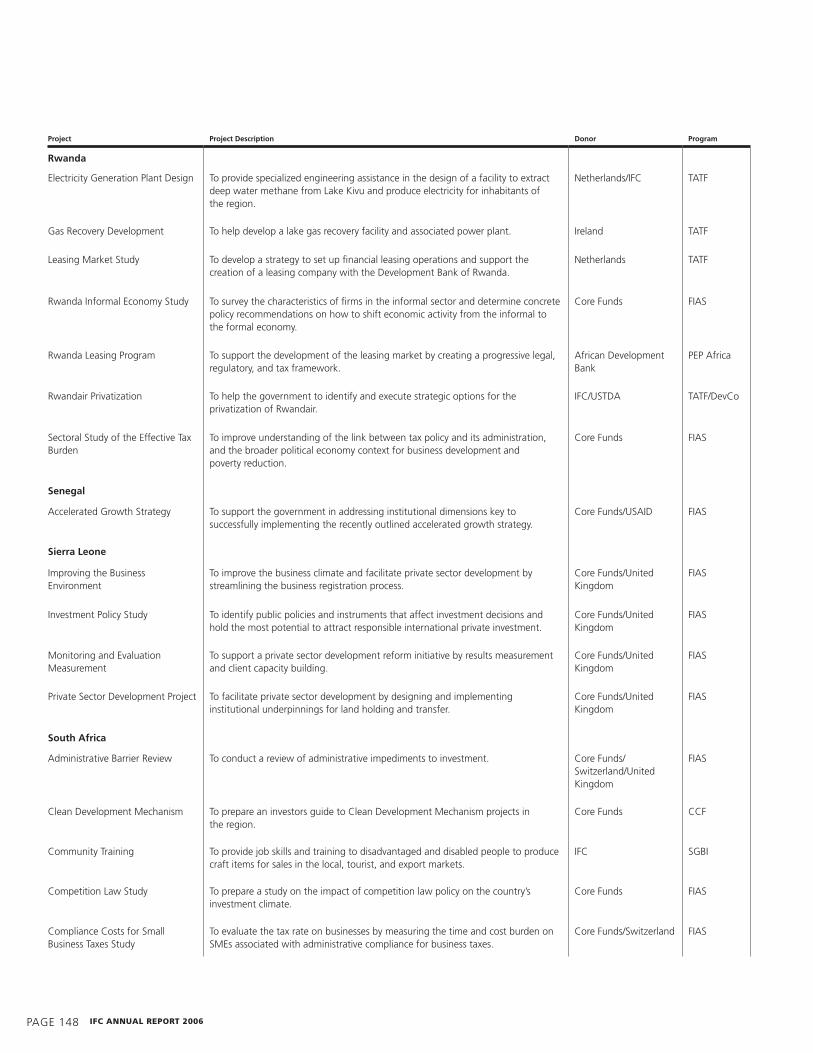
PAGE 148 IFc annual report 2006
project
project Description
Donor
program
rwanda
Electricity Generation Plant Design To provide specialized engineering assistance in the design of a facility to extract deep water methane from Lake Kivu and produce electricity for inhabitants of the region.
Netherlands/IFC TATF
Gas Recovery Development To help develop a lake gas recovery facility and associated power plant. Ireland TATF
Leasing Market Study To develop a strategy to set up financial leasing operations and support the creation of a leasing company with the Development Bank of Rwanda.
Netherlands TATF
Rwanda Informal Economy Study To survey the characteristics of firms in the informal sector and determine concrete policy recommendations on how to shift economic activity from the informal to the formal economy.
Core Funds FIAS
Rwanda Leasing Program To support the development of the leasing market by creating a progressive legal, regulatory, and tax framework.
African Development Bank
PEP Africa
Rwandair Privatization To help the government to identify and execute strategic options for the privatization of Rwandair.
IFC/uSTDA TATF/DevCo
Sectoral Study of the Effective Tax Burden
To improve understanding of the link between tax policy and its administration, and the broader political economy context for business development and poverty reduction.
Core Funds FIAS
senegal
Accelerated Growth Strategy To support the government in addressing institutional dimensions key to successfully implementing the recently outlined accelerated growth strategy.
Core Funds/uSAID FIAS
sierra leone
Improving the Business Environment
To improve the business climate and facilitate private sector development by streamlining the business registration process.
Core Funds/united Kingdom
FIAS
Investment Policy Study To identify public policies and instruments that affect investment decisions and hold the most potential to attract responsible international private investment.
Core Funds/united Kingdom
FIAS
Monitoring and Evaluation Measurement
To support a private sector development reform initiative by results measurement and client capacity building.
Core Funds/united Kingdom
FIAS
Private Sector Development Project To facilitate private sector development by designing and implementing institutional underpinnings for land holding and transfer.
Core Funds/united Kingdom
FIAS
south africa
Administrative Barrier Review To conduct a review of administrative impediments to investment. Core Funds/Switzerland/united Kingdom
FIAS
Clean Development Mechanism To prepare an investors guide to Clean Development Mechanism projects in the region.
Core Funds CCF
Community Training To provide job skills and training to disadvantaged and disabled people to produce craft items for sales in the local, tourist, and export markets.
IFC SGBI
Competition Law Study To prepare a study on the impact of competition law policy on the country’s investment climate.
Core Funds FIAS
Compliance Costs for Small Business Taxes Study
To evaluate the tax rate on businesses by measuring the time and cost burden on SMEs associated with administrative compliance for business taxes.
Core Funds/Switzerland FIAS

volume 2 PAGE 14�
project
project Description
Donor
program
Endeavor Entrepreneurship Institute
To establish a monitoring and evaluation system measuring qualitative and quantitative impact, and to develop a sustainability strategy.
IFC PEP Africa
Tax Burden Study To improve understanding of the link between tax policy and its administration, and the wider political economy context for business development.
Core Funds/united Kingdom
FIAS
Women Entrepreneurs Scheme To provide recommendations to the Department of Trade and Industry to help women entrepreneurs gain better access to financing opportunities.
Core Funds/IFC CCF/TATF
sudan
Review of Administrative Barriers to Investment
To review the investment climate, prepare a draft investor roadmap document, and facilitate a discussion on key findings.
Core Funds FIAS
tanzania, united republic of
Leasing Industry Development To develop the leasing industry in Tanzania, thereby improving financial options for small and medium-size businesses.
Switzerland PEP Africa
Tanzania honey Company Expansion
To improve honey collection standards, increase farmers’ incomes, and contribute to the operating and financial sustainability of the company.
Core Funds SGBI
Tax Policy Study To understand the effects of tax policy on company growth and informality, and determine tax policy best practice to promote growth and investment.
Core Funds/united Kingdom
FIAS
uganda
Economic Analysis of Electricity Project
To provide IFC and other potential lenders and investors with an economic and financial evaluation of a proposed electricity generation project.
IFC FMTAAS
Zambia
Copperbelt SME Supplier Development Program
To improve local SMEs’ ability to meet industry procurement requirements and diversify the SME market through partnerships with other mining companies.
Ireland CBF
EaST aSia and ThE PaCifiC
REGIoNAL
Credit Risk Rating & Management To develop and implement a business loan rating methodology that would enable banks to measure and optimize credit risk.
IFC FMTAAS
Design and Export Promotion Centers
To assist two design and export promotion centers in Cambodia and Indonesia in improving their handicrafts design and quality, increasing production capacity, and reaching export markets.
Core Funds/Italy/Japan MPDF/PENSA/SGBI/TATF
IFC Against AIDS To accelerate the involvement of private enterprises in the fight against hIV/AIDS. IFC FMTAAS
CouNTRy
Cambodia
Advocacy Support to Business Associations
To provide private sector working groups and business associations with research support in order to better advocate for policy change.
Core Funds MPDF
Business Environment Study To identify regulatory and administrative barriers to business growth at the provincial level throughout the country.
Core Funds MPDF/TATF

PAGE 150 IFc annual report 2006
project
project Description
Donor
program
Cambodia Grassroots Facility To create and develop a working capital facility for selected socially minded grassroots business organizations in the country.
IFC SGBI
CraftNetwork To assist handicraft producers in addressing critical constraints and barriers facing them and to facilitate export sales to major international markets.
IFC SGBI
Digital Divide Data Development To strengthen and expand the company’s operations, create more jobs, provide training for more disadvantaged young adults, and promote sustainability.
IFC SGBI
Duty Suspension Scheme To assist the government of Cambodia in the design and construction of a customs duty suspension scheme.
Core Funds FIAS
Garment Sector Assistance Program
To help increase the country’s garment sector export performance through the launch and facilitation of an international buyers’ forum.
Core Funds MPDF
Investment Board Support To support the Cambodia Investment Board in refining an investment promotion strategy, and developing and delivering a detailed action plan.
Core Funds FIAS
Tourism Sector Study To identify the key constraints to the tourism sector’s development and contribution to growth, and provide recommendations to address the problems.
Core Funds FIAS
China
Business Credit Evaluation To expand access to business credit and encourage private sector growth. Core Funds FIAS
China Development Marketplace To support the China Development Marketplace competition of innovative projects by providing grant money for the Corporate Citizenship Awards category.
Core Funds CCF
City Commercial Banks To help raise the banks’ management and operational standards, develop a roster of Chinese financial trainers, and strengthen the capacity of the China Banking Association.
Core Funds CPDF/TATF/ CBF
Energy Efficiency Finance Program To market, develop, and provide equipment financing services to energy users in the commercial, industrial, institutional, and multi-family residential sectors engaged in energy efficiency projects.
Core Funds/GEF/ Finland
CPDF/GEF/ EoF
Financial Sustainability Project To build sustainability capacity within financial institutions and local partner organizations with sustainable finance training and technical assistance.
Core Funds SFMF
health and Safety Seminar To conduct a sustainability and health & safety seminar to improve the overall development prospects of IFC clients.
Core Funds CCF
Investment Agency Development To build the capacity of agencies responsible for the enhancement and promotion of the local investment climate in disadvantaged provinces.
Core Funds FIAS
North Andre Supply Chain Linkages
To introduce traceability in the apple supply chain of the company, improve farm management practices, develop improved marketing opportunities, and build local institutional capacity.
Germany TATF
Nursing Training Program To help united Family hospitals and Clinics develop a formal nurses training program to operate effectively to international medical standards.
Sweden TATF
Power Plants Financing To understand what returns are possible from equity investments in the power sector and identify investment opportunities.
Spain TATF
Private Sector Development Study To analyze the sustainability and quality of private sector development and assist the government in promoting higher standards of corporate behavior.
Denmark TATF
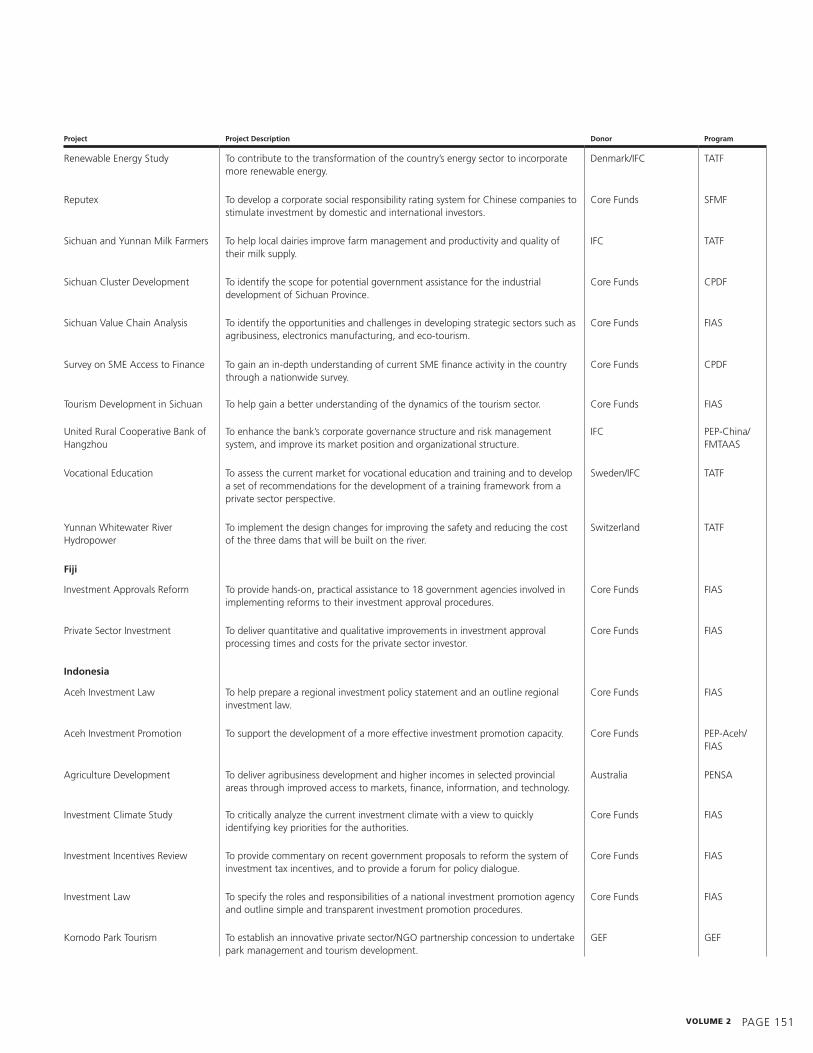
volume 2 PAGE 151
project
project Description
Donor
program
Renewable Energy Study To contribute to the transformation of the country’s energy sector to incorporate more renewable energy.
Denmark/IFC TATF
Reputex To develop a corporate social responsibility rating system for Chinese companies to stimulate investment by domestic and international investors.
Core Funds SFMF
Sichuan and yunnan Milk Farmers To help local dairies improve farm management and productivity and quality of their milk supply.
IFC TATF
Sichuan Cluster Development To identify the scope for potential government assistance for the industrial development of Sichuan Province.
Core Funds CPDF
Sichuan Value Chain Analysis To identify the opportunities and challenges in developing strategic sectors such as agribusiness, electronics manufacturing, and eco-tourism.
Core Funds FIAS
Survey on SME Access to Finance To gain an in-depth understanding of current SME finance activity in the country through a nationwide survey.
Core Funds CPDF
Tourism Development in Sichuan To help gain a better understanding of the dynamics of the tourism sector. Core Funds FIAS
united Rural Cooperative Bank of hangzhou
To enhance the bank’s corporate governance structure and risk management system, and improve its market position and organizational structure.
IFC PEP-China/ FMTAAS
Vocational Education To assess the current market for vocational education and training and to develop a set of recommendations for the development of a training framework from a private sector perspective.
Sweden/IFC TATF
yunnan Whitewater River hydropower
To implement the design changes for improving the safety and reducing the cost of the three dams that will be built on the river.
Switzerland TATF
Fiji
Investment Approvals Reform To provide hands-on, practical assistance to 18 government agencies involved in implementing reforms to their investment approval procedures.
Core Funds FIAS
Private Sector Investment To deliver quantitative and qualitative improvements in investment approval processing times and costs for the private sector investor.
Core Funds FIAS
Indonesia
Aceh Investment Law To help prepare a regional investment policy statement and an outline regional investment law.
Core Funds FIAS
Aceh Investment Promotion To support the development of a more effective investment promotion capacity. Core Funds PEP-Aceh/ FIAS
Agriculture Development To deliver agribusiness development and higher incomes in selected provincial areas through improved access to markets, finance, information, and technology.
Australia PENSA
Investment Climate Study To critically analyze the current investment climate with a view to quickly identifying key priorities for the authorities.
Core Funds FIAS
Investment Incentives Review To provide commentary on recent government proposals to reform the system of investment tax incentives, and to provide a forum for policy dialogue.
Core Funds FIAS
Investment Law To specify the roles and responsibilities of a national investment promotion agency and outline simple and transparent investment promotion procedures.
Core Funds FIAS
Komodo Park Tourism To establish an innovative private sector/NGo partnership concession to undertake park management and tourism development.
GEF GEF

PAGE 152 IFc annual report 2006
project
project Description
Donor
program
Linkages in Mining Communities To identify opportunities for, and impediments to, the development of linkages between the mining sector and the local economy.
Core Funds FIAS/PENSA
Sector Policy Solution Design To identify options for addressing policy and institutional impediments in the investment climate that constrain exports of shrimp and man-made textiles.
Core Funds FIAS
SME Enhanced Lending Framework
To help strengthen banks’ capability to serve the SME market by improving their credit skills and assisting in their institutional development.
Japan TATF
SME Sector Establishment To establish an SME sector to contribute to sustainable employment and economic growth to increase regional social stability in the longer term.
Core Funds PENSA/TATF
Student Financing Pilot To help Sampoerna Foundation develop a pilot student financing facility. Switzerland TATF
Telecommunications Market Study To determine the potential of the country’s telecommunications market and identify options for reaching this market through private investments.
IFC TATF
lao people’s Democratic republic
Bamboo Supply Chain Study To undertake a bamboo market study for the development of sustainable bamboo supply chains to increase the income of local communities.
Core Funds CCF
Financial Institutions Law To support sound financial sector and banking practices by creating an environment where all banks have the same opportunities and abide by the same rules.
Core Funds MPDF
mongolia
Capacity Building Assistance To strengthen the capacity of the newly established unfair Competition Regulatory Authority of Mongolia through training key staff on how to investigate the situation in key markets to determine unfair competition.
Sweden TATF
Gas Sector Study To support a gas sector study and develop and diversify the country’s energy market including natural gas, condensates, liquefied petroleum gas, and liquefied natural gas.
Sweden TATF
Independent Power Project To lay the technical, commercial, and regulatory groundwork for the country’s first independent power producer windmill project.
Core Funds EoF
papua new Guinea
Institution Building To provide technical assistance for institution and capacity building to PNG Microfinance Ltd.
Japan TATF
philippines
Boracay Island Private Sector Investment
To identify private sector investment opportunities for IFC that will help improve the island’s infrastructure and ensure the sustainability of its tourism industry.
IFC TATF
Manila South Commuter Rail Project
To help the Philippine government assess the feasibility of enhancing the entire heavy rail system for southern Luzon.
Spain TATF
Private Sector Participation To mobilize private sector participation to build, maintain, and manage the extension of the existing Light Rail Transit Line 1 system in Manila.
IFC/Netherlands/Sweden/united Kingdom
DevCo
Private Sector Participation To improve the provision of water services through the introduction of private sector involvement throughout the country.
IFC/Netherlands/Sweden/united Kingdom
DevCo

volume 2 PAGE 153
project
project Description
Donor
program
Small Power utilities Group To replicate the success of previous Small Power utilities Group transactions to other areas that are in urgent need of more affordable and reliable power.
IFC/Netherlands/Sweden/united Kingdom
DevCo
samoa
Regulatory Reform Implementation To help identify and remove regulatory and administrative barriers to doing business and increase opportunities for private sector development.
Core Funds FIAS
Venture Capital Fund To build sustainability capacity within local investors in the fund and other participants in the country’s finance sector.
Core Funds PEDF
solomon Islands
Administrative Barriers To prepare a detailed diagnostic review of work permits and residency permits approval procedures.
Core Funds FIAS
Foreign Investment Registry Establishment
To assist in the establishment and operation of the Foreign Investment Registry within the Investment Division of the Ministry of Commerce and Industry.
Core Funds FIAS
thailand
Administrative Barriers to Investment
To undertake an administrative barriers to investment study to identify opportunities to further streamline investment operating procedures.
Core Funds FIAS
timor-leste
Access to Finance Workshop To open up channels and develop products and methodologies to improve financial services availability to MSMEs.
Core Funds PEDF
Electronic Marketplace Appraisal To assess the viability of establishing an electronic marketplace in the country to assist SME hotel operators.
Core Funds PEDF
Private Sector Development To help the government of Timor-Leste and the donor community shape the private sector development strategy.
Netherlands TATF
tonga
Regulatory Reform Implementation To provide hands-on, practical assistance to 18 government agencies involved in implementing reforms to their investment approval procedures.
Core Funds FIAS
Vietnam
Administrative Barriers Evaluation To identify regulatory and administrative barriers to business growth and implement a number of specific improvements to the business environment.
IFC TATF
Composite Panel Investment Evaluation
To determine the feasibility of investing in a composite panel plant to supply the growing furniture manufacturing business in the country.
Sweden TATF
Foreign Investment Agency To provide assistance to the national investment protection agency in developing a medium-term strategic plan.
Core Funds FIAS
Land Program Design To strengthen the legislative framework and administrative structures that regulate business access to land and business land rights.
Core Funds FIAS
Private Credit Bureau To develop a private credit bureau to facilitate the extension of credit to growing yet underserved segments of the population, in particular SMEs.
Core Funds TATF
Private Sector Gender Equality To create awareness of the importance of gender equality as both a business opportunity and a development imperative.
Core Funds MPDF
Private Sector Participation To advise the government of Vietnam on how to mobilize private sector participation in electricity generation.
IFC/Netherlands/Sweden/united Kingdom
DevCo

PAGE 154 IFc annual report 2006
project
project Description
Donor
program
Secured Transactions Assessment To assess the current shortcomings in the legal and institutional framework for movable asset financing.
Core Funds FIAS
Sustainable Tourism Workshop To launch a Web-based sustainability rating scheme to recognize and reward SME accommodation providers with good sustainable practices.
Netherlands/IFC TATF
SouTh aSia
CouNTRy
Bangladesh
Assessing Stakeholder Interests in PSD Reform
To design an appropriate communications strategy to act as an example of how to institutionalize private sector development regulatory reform.
Core Funds FIAS
Business Framework Implementation
To implement a modern business regulatory framework that enables more efficient, effective, and transparent regulation of the private sector.
Core Funds/united Kingdom
FIAS
Economic Zone Development To provide the government with options for developing and implementing an economic zone strategy which reflects international best practice.
Core Funds/united Kingdom
FIAS
Financial Sector Assistance and Training
To increase access to finance and build capacity for SMEs, and raise awareness of best practices on SME finance in the financial markets.
Core Funds SEDF
Independent Power Project To advise the government on the design and implementation of a baseload gas-fired independent power producer project.
IFC/Netherlands/Sweden/united Kingdom
DevCo
Investment Climate Assessment Panel
To track the performance of 250 SMEs over a three-year period to determine the key challenges and constraints they face.
Core Funds SEDF
Private Sector Development To facilitate a private sector development vision for the government of Bangladesh and organize a monitoring and evaluation system.
Core Funds/united Kingdom
FIAS
Private Sector Development Preparation Study
To prepare for the Private Sector Development Support Project and to ensure the successful implementation of six related projects.
Core Funds/united Kingdom/Canada
FIAS
Private Sector Development Reform
To build a consensus and commitment among all stakeholders to achieve necessary regulatory and administrative reform.
Core Funds FIAS
Small Power Plants Program To advise the government in the structuring, tendering, and implementation of the Small Power Plants Program, consisting of ten plants of 10 to 30 MW.
IFC/Netherlands/Sweden/united Kingdom
Devco
Social and Environment Auditing Assistance
To build capacity of local service providers for implementing and auditing social and environmental compliance measures.
Core Funds SEDF
Bhutan
Financial Markets Assistance and Training
To increase access to finance for SMEs both in terms of number of clients reached and range of financial products offered.
Core Funds SEDF
Gender Entrepreneurship Markets To develop the entrepreneurial capacity of women in rural communities through business management and marketing, and alliance building between women’s associations, government, and donor agencies.
Core Funds SEDF
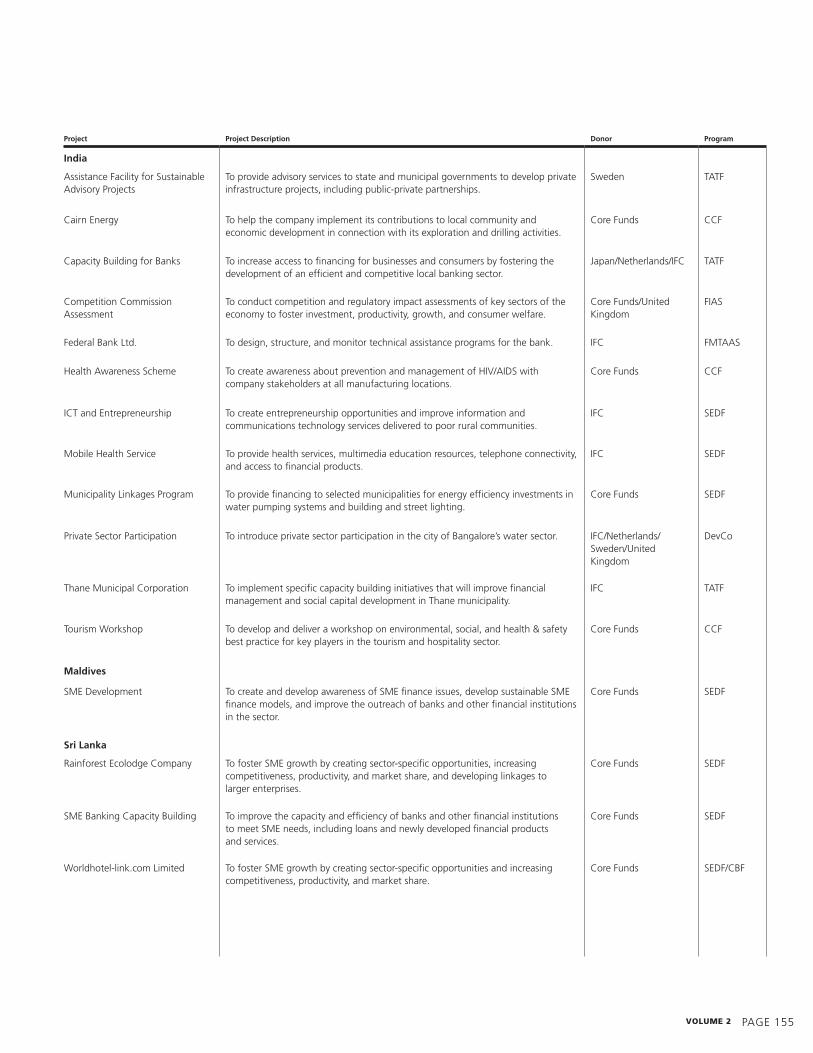
volume 2 PAGE 155
project
project Description
Donor
program
India
Assistance Facility for Sustainable Advisory Projects
To provide advisory services to state and municipal governments to develop private infrastructure projects, including public-private partnerships.
Sweden TATF
Cairn Energy To help the company implement its contributions to local community and economic development in connection with its exploration and drilling activities.
Core Funds CCF
Capacity Building for Banks To increase access to financing for businesses and consumers by fostering the development of an efficient and competitive local banking sector.
Japan/Netherlands/IFC TATF
Competition Commission Assessment
To conduct competition and regulatory impact assessments of key sectors of the economy to foster investment, productivity, growth, and consumer welfare.
Core Funds/united Kingdom
FIAS
Federal Bank Ltd. To design, structure, and monitor technical assistance programs for the bank. IFC FMTAAS
health Awareness Scheme To create awareness about prevention and management of hIV/AIDS with company stakeholders at all manufacturing locations.
Core Funds CCF
ICT and Entrepreneurship To create entrepreneurship opportunities and improve information and communications technology services delivered to poor rural communities.
IFC SEDF
Mobile health Service To provide health services, multimedia education resources, telephone connectivity, and access to financial products.
IFC SEDF
Municipality Linkages Program To provide financing to selected municipalities for energy efficiency investments in water pumping systems and building and street lighting.
Core Funds SEDF
Private Sector Participation To introduce private sector participation in the city of Bangalore’s water sector. IFC/Netherlands/Sweden/united Kingdom
DevCo
Thane Municipal Corporation To implement specific capacity building initiatives that will improve financial management and social capital development in Thane municipality.
IFC TATF
Tourism Workshop To develop and deliver a workshop on environmental, social, and health & safety best practice for key players in the tourism and hospitality sector.
Core Funds CCF
maldives
SME Development To create and develop awareness of SME finance issues, develop sustainable SME finance models, and improve the outreach of banks and other financial institutions in the sector.
Core Funds SEDF
sri lanka
Rainforest Ecolodge Company To foster SME growth by creating sector-specific opportunities, increasing competitiveness, productivity, and market share, and developing linkages to larger enterprises.
Core Funds SEDF
SME Banking Capacity Building To improve the capacity and efficiency of banks and other financial institutions to meet SME needs, including loans and newly developed financial products and services.
Core Funds SEDF
Worldhotel-link.com Limited To foster SME growth by creating sector-specific opportunities and increasing competitiveness, productivity, and market share.
Core Funds SEDF/CBF

PAGE 156 IFc annual report 2006
project
project Description
Donor
program
EuroPE and CEnTraL aSia
REGIoNAL
Capacity Building To map the country’s non-cement building materials industry to help increase capacity.
united Kingdom/IFC TATF
Central Asia Leasing Facility To strengthen the capacity of the financial institutions involved in the Facility and improve their management information systems.
Switzerland/IFC PEP/CBF
Environmental Management To help financial institutions in the Balkan region understand why and how to manage the environmental and social issues associated with their lending and investment operations.
Core Funds SFMF
Financial Services Capacity Building To increase access to financial services for MSMEs and households in the region by building the capacity of local private sector financial institutions to efficiently serve these client segments.
Netherlands TATF
IFC Against AIDS To accelerate the involvement of private enterprises in the fight against hIV/AIDS. IFC FMTAAS
Leasing Industry Development To increase access to finance for small and medium-size businesses through equipment leasing in Kyrgyz Republic, Tajikistan, and uzbekistan.
Switzerland PEP
Mortgage Market Development Project
To assist in the development of primary mortgage markets and easy access to mortgage financing for people with low and medium incomes.
IFC FMTAAS
CouNTRy
albania
Alternative Dispute Mediation To support the establishment of an efficient mediation system of enforcing commercial contracts.
Netherlands PEP-SE
Business Regulation Plan To support the government in reducing regulatory barriers in selected sectors with efforts to build regulatory capacities and institutions.
Core Funds/Switzerland FIAS
Corporate Governance Guidelines To promote the benefits of good corporate governance and build the capacities of key stakeholders to implement best practice.
Switzerland PEP-SE
International Technical Standards To introduce and disseminate international technical standards and regulations among companies in selected sectors.
Norway PEP-SE
Recycling Initiative To deliver sustainable development impacts by supporting profitable and environmentally and socially responsible recycling businesses.
Austria PEP-SE
armenia
Corporate Governance To improve corporate governance best practice in local banks. Netherlands PEP
Secured Transactions Reform To assist in fostering the private sector’s access to credit by addressing shortcomings in its secured transactions regime.
Core Funds FIAS
azerbaijan
Corporate Governance To improve the corporate governance practices of local joint stock companies and banks to help them gain easier access to capital.
Switzerland PEP
Leasing Industry Development To increase financing for small and medium-size businesses through leasing industry development.
Switzerland PEP

volume 2 PAGE 157
project
project Description
Donor
program
Licensing Review To assist the government of Azerbaijan in designing a comprehensive reform strategy to minimize entry controls imposed on business.
Core Funds FIAS
Belarus
Business Association Development To reinforce local economic development by strengthening the competence of business associations and private business.
IFC PEP
Business Enabling Environment To reinforce local economic development, strengthen the role of private business, and improve the private business environment.
Sweden PEP
Bosnia and Herzegovina
Administrative Barriers to Investment
To assist the government in efforts to remove administrative barriers to investment. Core Funds/Switzerland FIAS
Alternative Dispute Mediation To support the establishment of an efficient mediation system for enforcing commercial contracts.
Canada/Netherlands PEP-SE
Corporate Governance To promote the benefits of good corporate governance and build the capacities of key stakeholders to implement best practice.
Switzerland PEP-SE
International Technical Standards To introduce and disseminate international technical standards and regulations among companies of selected sectors in the country.
Norway PEP-SE
Recycling Initiative To deliver sustainable development impacts by supporting profitable and environmentally and socially responsible recycling businesses.
Austria PEP-SE
Bulgaria
Administrative Barriers Reform To provide solution designs for administrative barriers relating to on-site inspections and construction procedures and advice on institutional reform mechanisms.
Core Funds FIAS
Croatia
Biogas and Composting To assess the feasibility of anaerobic digestion of Belje’s animal rearing waste and wastewater to produce biogas and high-quality organic fertilizer from residuals.
Germany/IFC TATF
Improving Regulations for operations
To improve the quality of regulations affecting the start-up and operation of businesses.
Core Funds/Switzerland FIAS
Georgia
Business Association Development To reinforce local economic development by strengthening the competence of business associations and private business.
FMTAAS PEP
Business Banking operations To help strengthen and expand the retail and small business banking operations. Netherlands/IFC TATF
Business Development To increase access to markets for local firms, raise the level of local management skills, improve access to financing, and reduce administrative and legislative barriers to private sector growth.
Canada PEP
Kazakhstan
Corporate Governance To improve the corporate governance practices of local joint stock companies and banks with a view to increasing their ability to attract investment.
IFC PEP
oil and Gas Industry To complement the ongoing efforts of international oil and gas operations to increase sustainable local sourcing.
CBF PEP
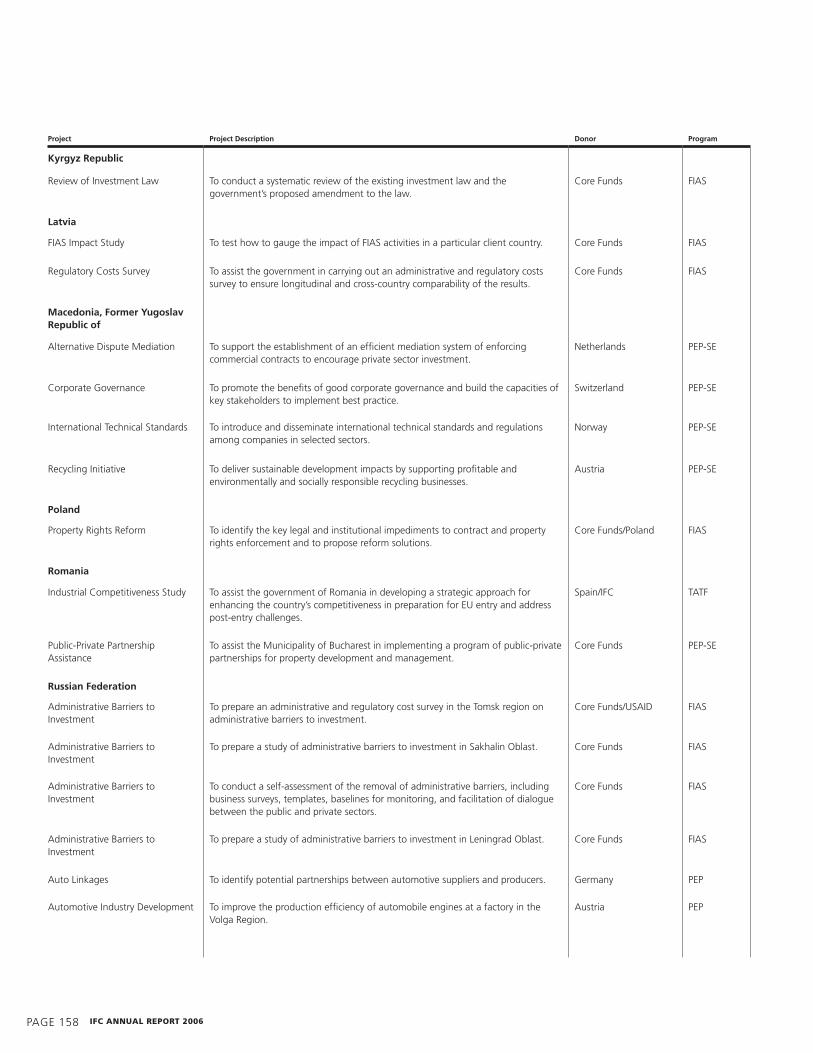
PAGE 158 IFc annual report 2006
project
project Description
Donor
program
Kyrgyz republic
Review of Investment Law To conduct a systematic review of the existing investment law and the government’s proposed amendment to the law.
Core Funds FIAS
latvia
FIAS Impact Study To test how to gauge the impact of FIAS activities in a particular client country. Core Funds FIAS
Regulatory Costs Survey To assist the government in carrying out an administrative and regulatory costs survey to ensure longitudinal and cross-country comparability of the results.
Core Funds FIAS
macedonia, Former Yugoslav republic of
Alternative Dispute Mediation To support the establishment of an efficient mediation system of enforcing commercial contracts to encourage private sector investment.
Netherlands PEP-SE
Corporate Governance To promote the benefits of good corporate governance and build the capacities of key stakeholders to implement best practice.
Switzerland PEP-SE
International Technical Standards To introduce and disseminate international technical standards and regulations among companies in selected sectors.
Norway PEP-SE
Recycling Initiative To deliver sustainable development impacts by supporting profitable and environmentally and socially responsible recycling businesses.
Austria PEP-SE
poland
Property Rights Reform To identify the key legal and institutional impediments to contract and property rights enforcement and to propose reform solutions.
Core Funds/Poland FIAS
romania
Industrial Competitiveness Study To assist the government of Romania in developing a strategic approach for enhancing the country’s competitiveness in preparation for Eu entry and address post-entry challenges.
Spain/IFC TATF
Public-Private Partnership Assistance
To assist the Municipality of Bucharest in implementing a program of public-private partnerships for property development and management.
Core Funds PEP-SE
russian Federation
Administrative Barriers to Investment
To prepare an administrative and regulatory cost survey in the Tomsk region on administrative barriers to investment.
Core Funds/uSAID FIAS
Administrative Barriers to Investment
To prepare a study of administrative barriers to investment in Sakhalin oblast. Core Funds FIAS
Administrative Barriers to Investment
To conduct a self-assessment of the removal of administrative barriers, including business surveys, templates, baselines for monitoring, and facilitation of dialogue between the public and private sectors.
Core Funds FIAS
Administrative Barriers to Investment
To prepare a study of administrative barriers to investment in Leningrad oblast. Core Funds FIAS
Auto Linkages To identify potential partnerships between automotive suppliers and producers. Germany PEP
Automotive Industry Development To improve the production efficiency of automobile engines at a factory in the Volga Region.
Austria PEP
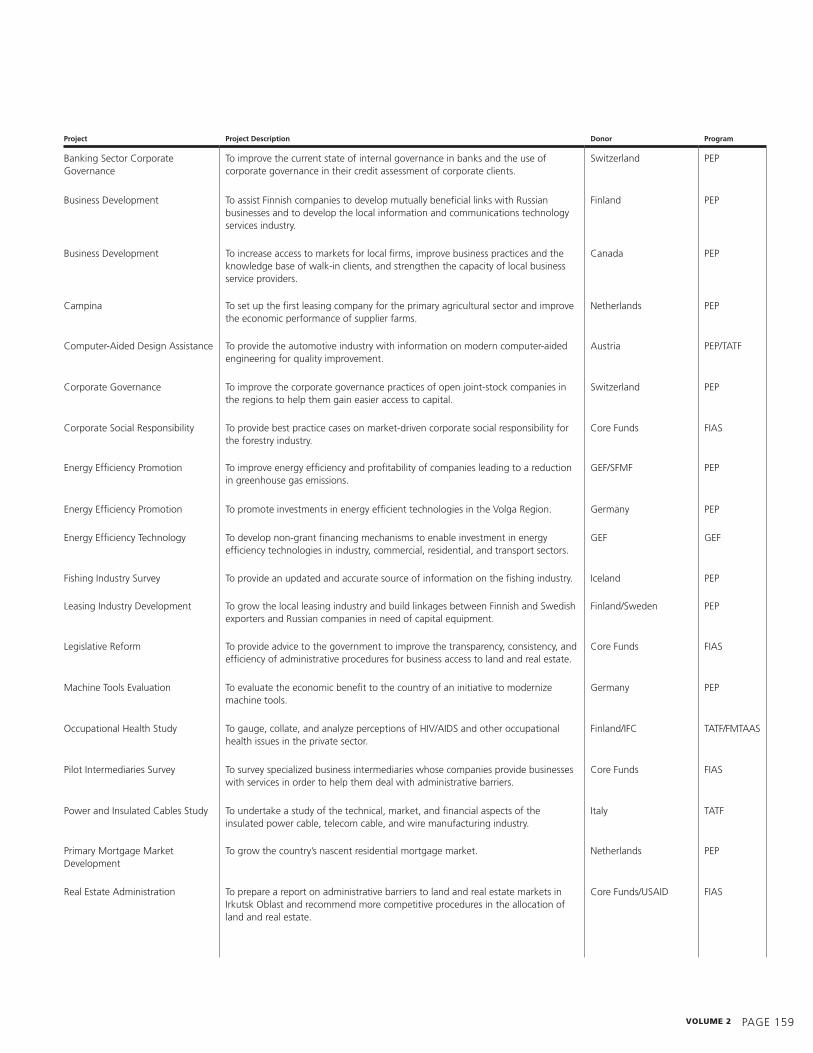
volume 2 PAGE 15�
project
project Description
Donor
program
Banking Sector Corporate Governance
To improve the current state of internal governance in banks and the use of corporate governance in their credit assessment of corporate clients.
Switzerland PEP
Business Development To assist Finnish companies to develop mutually beneficial links with Russian businesses and to develop the local information and communications technology services industry.
Finland PEP
Business Development To increase access to markets for local firms, improve business practices and the knowledge base of walk-in clients, and strengthen the capacity of local business service providers.
Canada PEP
Campina To set up the first leasing company for the primary agricultural sector and improve the economic performance of supplier farms.
Netherlands PEP
Computer-Aided Design Assistance To provide the automotive industry with information on modern computer-aided engineering for quality improvement.
Austria PEP/TATF
Corporate Governance To improve the corporate governance practices of open joint-stock companies in the regions to help them gain easier access to capital.
Switzerland PEP
Corporate Social Responsibility To provide best practice cases on market-driven corporate social responsibility for the forestry industry.
Core Funds FIAS
Energy Efficiency Promotion To improve energy efficiency and profitability of companies leading to a reduction in greenhouse gas emissions.
GEF/SFMF PEP
Energy Efficiency Promotion To promote investments in energy efficient technologies in the Volga Region. Germany PEP
Energy Efficiency Technology To develop non-grant financing mechanisms to enable investment in energy efficiency technologies in industry, commercial, residential, and transport sectors.
GEF GEF
Fishing Industry Survey To provide an updated and accurate source of information on the fishing industry. Iceland PEP
Leasing Industry Development To grow the local leasing industry and build linkages between Finnish and Swedish exporters and Russian companies in need of capital equipment.
Finland/Sweden PEP
Legislative Reform To provide advice to the government to improve the transparency, consistency, and efficiency of administrative procedures for business access to land and real estate.
Core Funds FIAS
Machine Tools Evaluation To evaluate the economic benefit to the country of an initiative to modernize machine tools.
Germany PEP
occupational health Study To gauge, collate, and analyze perceptions of hIV/AIDS and other occupational health issues in the private sector.
Finland/IFC TATF/FMTAAS
Pilot Intermediaries Survey To survey specialized business intermediaries whose companies provide businesses with services in order to help them deal with administrative barriers.
Core Funds FIAS
Power and Insulated Cables Study To undertake a study of the technical, market, and financial aspects of the insulated power cable, telecom cable, and wire manufacturing industry.
Italy TATF
Primary Mortgage Market Development
To grow the country’s nascent residential mortgage market. Netherlands PEP
Real Estate Administration To prepare a report on administrative barriers to land and real estate markets in Irkutsk oblast and recommend more competitive procedures in the allocation of land and real estate.
Core Funds/uSAID FIAS

PAGE 160 IFc annual report 2006
project
project Description
Donor
program
Real Estate Administration To prepare a report on administrative barriers to land and real estate markets in Rostov oblast and recommend more competitive procedures in the allocation of land and real estate.
Core Funds/uSAID FIAS
SME Development To maximize local sourcing opportunities from Komi Republic to support local SME business growth.
CBF PEP
Sustainable Forestry To encourage investors to strive for sustainable forestry in their joint ventures and promote the forest industry as a potential resource for new investments.
Finland PEP
serbia and montenegro
Alternative Dispute Mediation To support the establishment of an efficient mediation system for enforcing commercial contracts.
Canada/Netherlands PEP-SE
Constanza-Pancevo-omisalj-Trieste Pipeline
To create a strategy for the pipeline development company, promote the commercial viability and bankability of the project, and attract the interest and participation of potential private sector investors.
Austria/Italy TATF
Corporate Governance To promote the benefits of good corporate governance and build the capacities of key stakeholders to implement best practice.
Switzerland PEP-SE
International Technical Standards To introduce and disseminate international technical standards and regulations among companies in selected sectors.
Norway PEP-SE
JAT Airways To assist the company, presently burdened with massive debts and operational challenges, in transforming itself into a sustainable enterprise.
Norway PEP-SE
Recycling Initiative To deliver sustainable development impacts by supporting profitable and environmentally and socially responsible recycling businesses.
Austria PEP-SE
Tigar Waste Project To address the company’s waste problem by undertaking a greenfield investment project to recycle worn-out old tires and rubber waste.
Core Funds EoF
tajikistan
Agribusiness Supply Chains Development
To address shortages in the supply of raw materials in farming. Sweden PEP
Farmer ownership Model To increase legal awareness of SMEs through a technical assistance program which supports the formation, development, and sustainability of the agricultural service company SugdAgroServ.
Switzerland PEP
Farmer ownership Model To improve the profitability and sustainability of local farms. Canada PEP
Investment Climate Reform To help the government address shortcomings in the investment climate and assist in building a more effective institutional framework for investment facilitation.
Core Funds FIAS
SME Policy Development To reduce regulatory barriers to business by streamlining the inspections and permits systems at the level of the controlling agencies and the legislature.
Switzerland PEP
ukraine
Agriculture Development To strengthen private agribusiness, improve the enabling environment, and increase public awareness of the agriculture industry.
Canada PEP
Banking Sector Corporate Governance
To improve the current state of internal governance in banks and the use of corporate governance in their credit assessment of corporate clients.
Switzerland PEP

volume 2 PAGE 161
project
project Description
Donor
program
Biogas Production To help utilize organic waste emanating from animal rearing operations and define the feasibility of fermenting the materials to generate biogas for combustion or bioethanol as an additive for motor fuel.
Netherlands TATF
Corporate Governance To improve the environment for private sector development and facilitate access to global financing by improving corporate governance practices.
Canada/Switzerland PEP
Food Safety Implementation and Certification Assistance
To conduct a gap analysis of two cheese manufacturing companies and help them implement hazard Analysis and Critical Control Point procedures and obtain certification.
Core Funds/Switzerland/IFC
TATF/SFMF
Leasing Industry Development To support the development of a sustainable leasing industry by advising leasing companies, government agencies, and businesses and education institutions on leasing issues.
Netherlands PEP
SME Policy Development To improve the business enabling environment for SMEs. European Commission PEP
Vinnitsa Dairy Supply Chain Development
To develop private farm enterprises, improve farm productivity and milk quality, and promote milk safety awareness.
Sweden PEP
Vinnitsa Fruit Supply Chain Development
To develop private farm enterprises and improve farm productivity and agronomy practices.
Austria PEP
uzbekistan
SME Policy Development To support SME development initiatives with factual information through monitoring the sector problems and simplifying select aspects of the regulatory system for SMEs.
Switzerland PEP
SME Policy Development To improve the regulatory climate for entrepreneurship in the key areas of inspections, permits issuance, and tax administration.
Switzerland PEP
LaTin aMEriCa and ThE CaribbEan
REGIoNAL
Microfinance Feasibility Study To assess the market for MSME finance in the region and to determine the feasibility of Republic Bank’s broadening its financial products to address market demand.
Netherlands TATF
oECS Submarine Cable Project To build and operate a broadband network from Guadeloupe to an international gateway in Puerto Rico.
France TATF
SME Toolkit Adaptation To provide management tools to microfinance institutions and business development service providers to improve their performance when advising SMEs.
Switzerland TATF/LAC TA Facility
Sustainable Financial Management Workshop
To build capacity for sustainable lending and investment in the emerging market financial sector.
Core Funds SFMF
Tourism Linkages To help the countries of the organization of Eastern Caribbean States strengthen the backward linkages between the tourism industry and the rest of their economies.
Core Funds FIAS

PAGE 162 IFc annual report 2006
project
project Description
Donor
program
CouNTRy
argentina
Pan American Energy To increase economic opportunities for microentrepreneurs in communities near the company’s Acambuco gas operations.
Core Funds LAC TA Facility
Bolivia
Business Registration Reform To reinforce, consolidate, and extend the simplification reform for registering new firms.
Switzerland LAC TA Facility
Electropaz To improve the company’s engagement with the local indigenous community through targeted contributions to development.
Core Funds CCF
Forestry Industry Development To address the issues affecting the provision of certified wood by forest communities and increase market access for related SMEs.
Netherlands LAC TA Facility
Trickle up Program To reinforce the business activities and capabilities of poor producers and artisans to increase microenterprise profitability and sustainability.
Core Funds SGBI
Brazil
Amaggi To improve the company’s practices in the cultivation and processing of soya through training and awareness-raising at the farm level.
Core Funds CCF
Amazon Paper Project To promote the company’s products in national and international markets, support its supply chain, and advise on business planning and management.
Core Funds SGBI
Business Registration Reform To reduce the transaction costs associated with business registration by decreasing the time and requirements necessary to obtain operation and construction licenses.
united Kingdom LAC TA Facility
Elimination of Administrative Barriers
To eliminate administrative barriers to investment at the subnational level in line with the Doing Business indicators.
uSTDA FIAS
Grassroots Income Project To identify and finance grassroots income-generating projects and assess the outcome of this pilot project for further improvement and replication.
Core Funds SGBI
Tribanco Brazilian Bank To strengthen the bank’s financial intermediation role for family-owned MSME retailers.
IFC CBF
Colombia
Business Regulation Reform To reduce the transaction costs of formalizing a business and improve companies’ perceptions of the Bogota municipal inspection process.
Core Funds LAC TA Facility/CBF
Competitive Business Advantage Workshop
To deliver a workshop to help financial institutions understand why and how to manage the environmental and social issues associated with their lending and investment operations.
Core Funds SFMF
Portal Nacional de Tramites To develop a single technological platform for formalizing a business across the country to allow rapid and efficient online registration.
Core Funds/Canada LAC TA Facility
Costa rica
Implementation of Competition Policy in Investment
To implement a new competition policy to foster a market-friendly investment climate and reduce restrictive business practices.
Core Funds/Canada FIAS
Grenada
Financial Management Project To prepare the municipal government for diversifying its funding sources by enhancing its financial management and risk rating systems.
IFC TATF
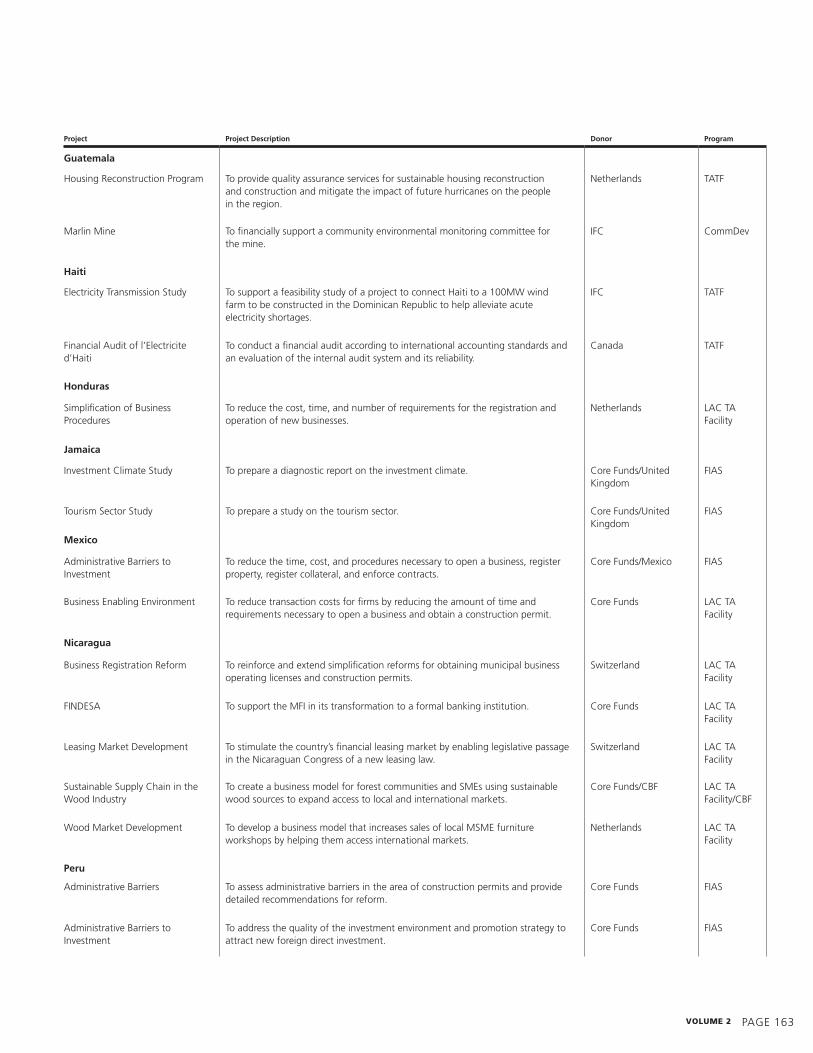
volume 2 PAGE 163
project
project Description
Donor
program
Guatemala
housing Reconstruction Program To provide quality assurance services for sustainable housing reconstruction and construction and mitigate the impact of future hurricanes on the people in the region.
Netherlands TATF
Marlin Mine To financially support a community environmental monitoring committee for the mine.
IFC CommDev
Haiti
Electricity Transmission Study To support a feasibility study of a project to connect haiti to a 100MW wind farm to be constructed in the Dominican Republic to help alleviate acute electricity shortages.
IFC TATF
Financial Audit of l’Electricite d’haiti
To conduct a financial audit according to international accounting standards and an evaluation of the internal audit system and its reliability.
Canada TATF
Honduras
Simplification of Business Procedures
To reduce the cost, time, and number of requirements for the registration and operation of new businesses.
Netherlands LAC TA Facility
Jamaica
Investment Climate Study To prepare a diagnostic report on the investment climate. Core Funds/united Kingdom
FIAS
Tourism Sector Study To prepare a study on the tourism sector. Core Funds/united Kingdom
FIAS
mexico
Administrative Barriers to Investment
To reduce the time, cost, and procedures necessary to open a business, register property, register collateral, and enforce contracts.
Core Funds/Mexico FIAS
Business Enabling Environment To reduce transaction costs for firms by reducing the amount of time and requirements necessary to open a business and obtain a construction permit.
Core Funds LAC TA Facility
nicaragua
Business Registration Reform To reinforce and extend simplification reforms for obtaining municipal business operating licenses and construction permits.
Switzerland LAC TA Facility
FINDESA To support the MFI in its transformation to a formal banking institution. Core Funds LAC TA Facility
Leasing Market Development To stimulate the country’s financial leasing market by enabling legislative passage in the Nicaraguan Congress of a new leasing law.
Switzerland LAC TA Facility
Sustainable Supply Chain in the Wood Industry
To create a business model for forest communities and SMEs using sustainable wood sources to expand access to local and international markets.
Core Funds/CBF LAC TA Facility/CBF
Wood Market Development To develop a business model that increases sales of local MSME furniture workshops by helping them access international markets.
Netherlands LAC TA Facility
peru
Administrative Barriers To assess administrative barriers in the area of construction permits and provide detailed recommendations for reform.
Core Funds FIAS
Administrative Barriers to Investment
To address the quality of the investment environment and promotion strategy to attract new foreign direct investment.
Core Funds FIAS
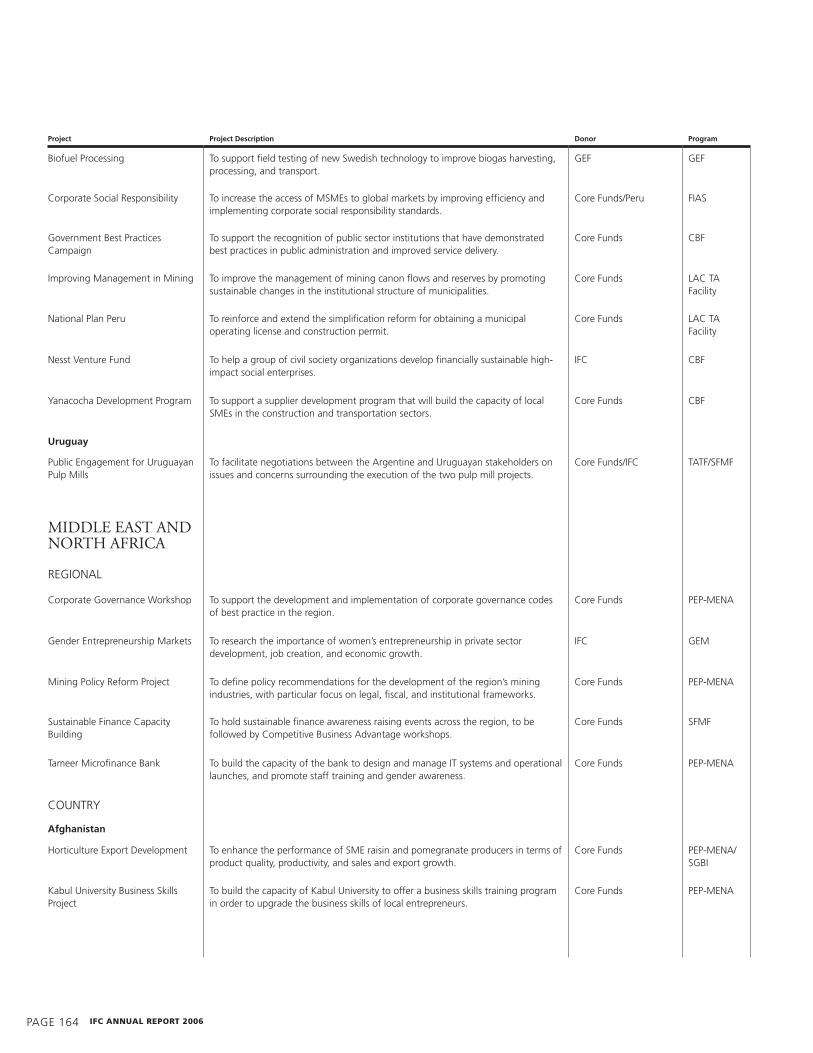
PAGE 164 IFc annual report 2006
project
project Description
Donor
program
Biofuel Processing To support field testing of new Swedish technology to improve biogas harvesting, processing, and transport.
GEF GEF
Corporate Social Responsibility To increase the access of MSMEs to global markets by improving efficiency and implementing corporate social responsibility standards.
Core Funds/Peru FIAS
Government Best Practices Campaign
To support the recognition of public sector institutions that have demonstrated best practices in public administration and improved service delivery.
Core Funds CBF
Improving Management in Mining To improve the management of mining canon flows and reserves by promoting sustainable changes in the institutional structure of municipalities.
Core Funds LAC TA Facility
National Plan Peru To reinforce and extend the simplification reform for obtaining a municipal operating license and construction permit.
Core Funds LAC TA Facility
Nesst Venture Fund To help a group of civil society organizations develop financially sustainable high-impact social enterprises.
IFC CBF
yanacocha Development Program To support a supplier development program that will build the capacity of local SMEs in the construction and transportation sectors.
Core Funds CBF
uruguay
Public Engagement for uruguayan Pulp Mills
To facilitate negotiations between the Argentine and uruguayan stakeholders on issues and concerns surrounding the execution of the two pulp mill projects.
Core Funds/IFC TATF/SFMF
MiddLE EaST and norTh afriCa
REGIoNAL
Corporate Governance Workshop To support the development and implementation of corporate governance codes of best practice in the region.
Core Funds PEP-MENA
Gender Entrepreneurship Markets To research the importance of women’s entrepreneurship in private sector development, job creation, and economic growth.
IFC GEM
Mining Policy Reform Project To define policy recommendations for the development of the region’s mining industries, with particular focus on legal, fiscal, and institutional frameworks.
Core Funds PEP-MENA
Sustainable Finance Capacity Building
To hold sustainable finance awareness raising events across the region, to be followed by Competitive Business Advantage workshops.
Core Funds SFMF
Tameer Microfinance Bank To build the capacity of the bank to design and manage IT systems and operational launches, and promote staff training and gender awareness.
Core Funds PEP-MENA
CouNTRy
afghanistan
horticulture Export Development To enhance the performance of SME raisin and pomegranate producers in terms of product quality, productivity, and sales and export growth.
Core Funds PEP-MENA/ SGBI
Kabul university Business Skills Project
To build the capacity of Kabul university to offer a business skills training program in order to upgrade the business skills of local entrepreneurs.
Core Funds PEP-MENA
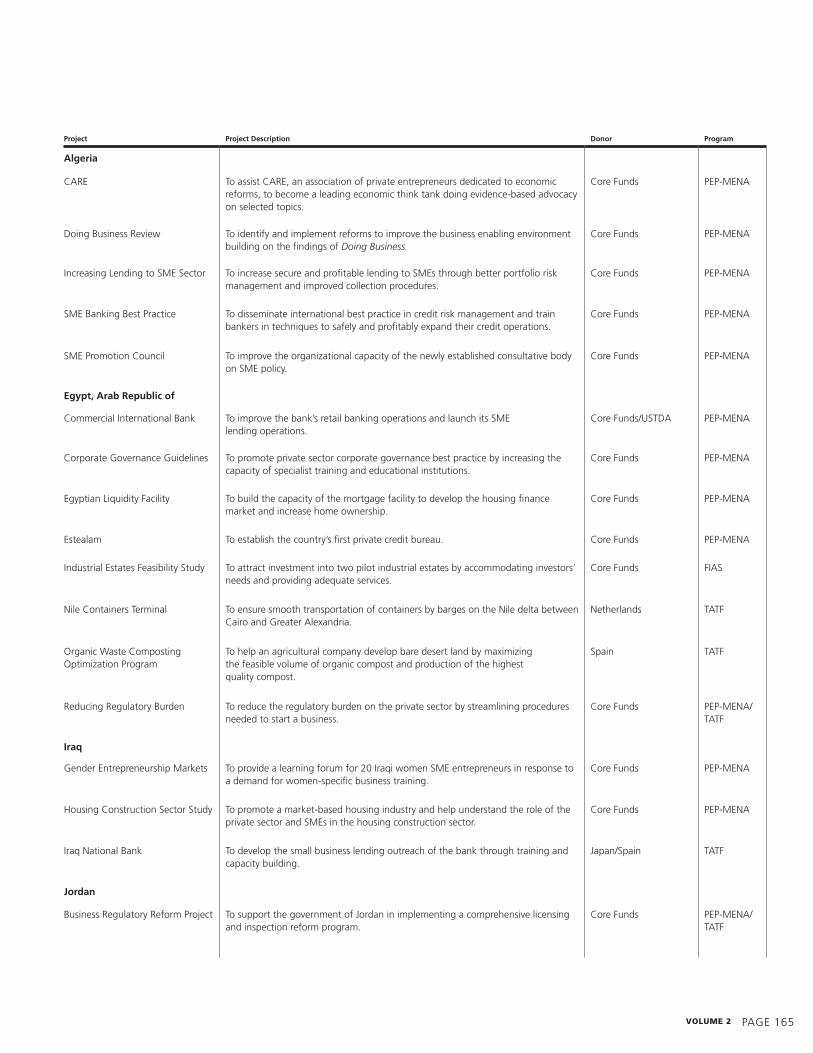
volume 2 PAGE 165
project
project Description
Donor
program
algeria
CARE To assist CARE, an association of private entrepreneurs dedicated to economic reforms, to become a leading economic think tank doing evidence-based advocacy on selected topics.
Core Funds PEP-MENA
Doing Business Review To identify and implement reforms to improve the business enabling environment building on the findings of DoingBusiness.
Core Funds PEP-MENA
Increasing Lending to SME Sector To increase secure and profitable lending to SMEs through better portfolio risk management and improved collection procedures.
Core Funds PEP-MENA
SME Banking Best Practice To disseminate international best practice in credit risk management and train bankers in techniques to safely and profitably expand their credit operations.
Core Funds PEP-MENA
SME Promotion Council To improve the organizational capacity of the newly established consultative body on SME policy.
Core Funds PEP-MENA
egypt, arab republic of
Commercial International Bank To improve the bank’s retail banking operations and launch its SME lending operations.
Core Funds/uSTDA PEP-MENA
Corporate Governance Guidelines To promote private sector corporate governance best practice by increasing the capacity of specialist training and educational institutions.
Core Funds PEP-MENA
Egyptian Liquidity Facility To build the capacity of the mortgage facility to develop the housing finance market and increase home ownership.
Core Funds PEP-MENA
Estealam To establish the country’s first private credit bureau. Core Funds PEP-MENA
Industrial Estates Feasibility Study To attract investment into two pilot industrial estates by accommodating investors’ needs and providing adequate services.
Core Funds FIAS
Nile Containers Terminal To ensure smooth transportation of containers by barges on the Nile delta between Cairo and Greater Alexandria.
Netherlands TATF
organic Waste Composting optimization Program
To help an agricultural company develop bare desert land by maximizing the feasible volume of organic compost and production of the highest quality compost.
Spain TATF
Reducing Regulatory Burden To reduce the regulatory burden on the private sector by streamlining procedures needed to start a business.
Core Funds PEP-MENA/ TATF
Iraq
Gender Entrepreneurship Markets To provide a learning forum for 20 Iraqi women SME entrepreneurs in response to a demand for women-specific business training.
Core Funds PEP-MENA
housing Construction Sector Study To promote a market-based housing industry and help understand the role of the private sector and SMEs in the housing construction sector.
Core Funds PEP-MENA
Iraq National Bank To develop the small business lending outreach of the bank through training and capacity building.
Japan/Spain TATF
Jordan
Business Regulatory Reform Project To support the government of Jordan in implementing a comprehensive licensing and inspection reform program.
Core Funds PEP-MENA/ TATF
PAGE 166 IFc annual report 2006
project
project Description
Donor
program
Cairo Amman Bank To provide the bank with a plan to improve its corporate governance policies and practices.
Core Funds PEP-MENA
Corporate Governance Guidelines To improve the corporate governance practices of the country’s banks by drafting a voluntary bank-level corporate governance code for the sector.
Core Funds PEP-MENA
Leasing Regulatory Review To improve the leasing legislative framework to support the development of the local financial market and improve access to finance for SMEs.
Core Funds PEP-MENA
Queen Alia International Airport Expansion
To expand airport capacity while improving commercial performance, service quality, and self-sustainability.
Core Funds PEP-MENA
Royal Jordanian Airline To assess the overall viability of privatizing the airline company. Core Funds PEP-MENA
lebanon
Reform and Private Sector Growth To raise awareness among key stakeholders on the specific reform activities necessary to promote stronger private sector growth.
Core Funds PEP-MENA
Simplifying Business Registration To reduce the regulatory burden on the private sector through a comprehensive review and restructuring of business registration procedures.
Core Funds PEP-MENA/ TATF
morocco
Banque Centrale Populaire To strengthen the bank’s credit risk management system in line with international best practice.
Core Funds PEP-MENA
Business Enabling Environment To identify and implement reforms to improve the business enabling environment, based on the findings of DoingBusiness.
Core Funds PEP-MENA
Central Bank of Morocco To assist the bank in implementing its decision to outsource its credit registry to a private sector company.
Core Funds PEP-MENA
Ionnovact SME Project To assist a leading business organization in supporting the research and development activities of SMEs.
Core Funds PEP-MENA
Service Provider Development To finalize the transformation of AZIT into a professional service provider to improve the working environment of SMEs in the industrial zone.
Core Funds PEP-MENA
SME Promotion To cooperate with ADIZIA to promote SMEs in the industrial zone of Ait Melloul, Agadir.
Core Funds PEP-MENA
Training Course Development To work with Confederation Generale des Entreprises du Maroc to professionalize business membership organizations by developing standardized training courses for their staff.
Core Funds PEP-MENA
oman
Alliance housing Bank upgrade To help the bank upgrade and automate its loan origination, underwriting, and servicing systems.
Core Funds PEP-MENA
pakistan
Alternative Dispute Mediation To establish a pilot mediation center to help mitigate expensive and lengthy court procedures for the private sector, especially SMEs.
Core Funds PEP-MENA/ TATF
Automotive Parts Sector Development
To promote the development of the country’s automotive parts sector. Core Funds/Denmark PEP-MENA
Beaconhouse To develop a plan for implementing a new information and communications technology initiative.
IFC TATF

volume 2 PAGE 167
project
project Description
Donor
program
DataCheck To help the company expand its product offering to include bureau risk scores, hosted application processing, and antifraud services.
Core Funds PEP-MENA
Earthquake Relief Matching Grant Scheme
To support immediate post-earthquake relief efforts through a matching grants program.
IFC TATF
First Women Bank Limited To write a business plan and clarify the business potential of the bank with the goal of attracting new private strategic investors.
Core Funds PEP-MENA
house Building Finance Corporation Advisory
To assist house Building Finance Corporation in its ongoing corporatization effort to achieve sustainability of operations and future growth.
Core Funds PEP-MENA
ICT Sector Development To promote the development of the country’s information and communication technology sector.
Core Funds/Denmark PEP-MENA
National Bank of Pakistan To help the bank establish a new student loan asset class for private universities. Netherlands TATF
Pakistan Business Council Establishment
To assist in the establishment of a high-quality think tank doing evidence-based advocacy to help strengthen private sector growth.
Core Funds PEP-MENA
Private Sector Participation To introduce the private sector in the provision of water and sanitation services in the district of Lahore through a possible long-term concession.
IFC/Netherlands/Sweden/united Kingdom
DevCo
Value Chain Analysis To complete a value chain analysis with cost information ranging from the sourcing of raw materials to delivery of the final product.
Core Funds/uSTDA FIAS
Wind Power Pre-Feasibility To help the government of Pakistan develop a legal framework on renewable wind energy resources.
Spain TATF
saudi arabia
SIMAh To develop existing credit information infrastructure by supporting SIMAh, a local bank-owned consumer credit bureau.
Core Funds PEP-MENA
syrian arab republic
Foreign Direct Investment Study To provide an overview of the legal, policy, and institutional frameworks for attracting foreign direct investment in the country.
Core Funds FIAS
united arab emirates
Abu Dhabi health Program To implement a new national health insurance program and privatize the government-owned hospitals and clinics.
Core Funds PEP-MENA
Corporate Governance Guidelines To help develop and publish a corporate governance guidelines handbook for the country’s bank directors.
Core Funds PEP-MENA
Corporate Governance Guidelines To help minimize portfolio risk by advising Abu Dhabi Investment Authority appointed directors to promote and implement corporate governance best practice.
Core Funds PEP-MENA
Dana Gas Corporate Social Responsibility
To advise the company on establishing corporate social responsibility policies and processes.
Core Funds CCF/PEP- MENA
West Bank and Gaza
Barriers to Investment To help the Palestinian National Authority and international donors to identify key constraints to private investment in the West Bank and Gaza.
Core Funds FIAS
Corporate Governance Workshop To improve the corporate governance practices of banks and companies and introduce a new corporate governance code.
Core Funds PEP-MENA

PAGE 168 IFc annual report 2006
project
project Description
Donor
program
Rafah Bank Review To conduct a review of the MFI’s current strategy and develop an action plan to guide its launch.
Core Funds PEP-MENA
Yemen, republic of
Leasing Law Review To establish a proper leasing regulatory environment and expand the leasing sector. Core Funds PEP-MENA
Tadamon Islamic Bank To develop the MSME banking business for the bank by leveraging a pilot operation in the city of Taiz and building on key existing strengths.
Core Funds PEP-MENA
GLobaL
Administrative Barriers to Investment
To revise and update the FIAS manual for the identification and removal of administrative barriers to investment, and to create the first of several solution design modules.
Core Funds FIAS
Aureos Private Equity To channel technical and financial assistance to SMEs carrying out environmental and social improvement projects.
Core Funds SFMF
Capacity Building for Public-Private Dialogue
To develop a better environment for SMEs by building capacity among local stakeholders and providing tools and best practice knowledge to practitioners.
Core Funds FIAS
Cleaner Production Allocation To promote Cleaner Production initiatives and accelerate the adoption of Cleaner Production techniques by IFC’s clients.
Core Funds/Bavaria TATF/SFMF
Eco-securities Research and Development
To conduct market research on the potential to use asset-backed securitization to promote sustainable and responsible institutional investment in emerging market forest resources.
Core Funds SFMF
Environmental, health, and Safety Guidelines update
To update Part III of the Pollution Prevention and Abatement handbook and IFC environmental guidelines with broad financial and technical support from international financial institutions.
IFC TATF
FDI Flow Study To improve understanding of south-south foreign direct investment flows by reviewing available resources on the topic.
IFC FIAS
Financial Institution Market Research
To publish a book highlighting sustainability-related products and services of highest priority to emerging market financial institutions.
Core Funds SFMF
Financial Institutions Technical Assistance
To design, structure, and monitor technical assistance programs in target banks. IFC FMTAAS
Fuel Cell Financing To support stationary fuel cell projects in eligible developing countries. GEF GEF
Investment Climate Reform To understand the process of managing investment climate reforms to inform the strategy, design, and implementation of Bank Group operations and projects.
Core Funds FIAS
Regulatory Governance Toolkit To collect, develop, and disseminate insights on regulatory management and reform that will enable staff to diagnose and provide solutions to client governments’ regulatory reform strategies.
Core Funds FIAS
Regulatory Reform Study To understand the political economy and institutional mechanisms of successful regulatory reforms to assist governments in implementing good practices as learned from international experience.
Core Funds FIAS

volume 2 PAGE 16�
project
project Description
Donor
program
Renewable and Sustainable Energy Program
To develop market surveys, general regulatory reviews, and economic analysis of prototype renewable energy projects.
Netherlands TATF
Renewable Energy Efficiency Fund To make debt and equity investments in private sector projects in the renewable energy and energy efficiency sectors.
GEF GEF
Review of Impediments to Competition
To conduct a review of the major barriers to competition and the role that an effective competition law policy could play in alleviating these impediments.
Core Funds/united Kingdom
FIAS
Secured Lending Evaluation To determine common lending evaluation methodologies used by financial institutions to make the process of lending to SMEs more efficient.
Netherlands TATF
SME Benchmarking To develop best practice case studies and industry benchmarks on leading banks involved in SME finance in both developed and emerging markets.
IFC TATF
Study on the Effects of Tax on Business
To increase understanding of the impact of tax administration on the investment and business climate for poverty reduction.
Core Funds/united Kingdom
FIAS
Sustainable Finance Summit 2006 To influence the volume and quality of long-term portfolio investment in sustainable and responsible emerging market companies.
Core Funds SFMF
Sustainable Management Project To host a summit to plan new action within the international investment community on mainstreaming sustainable, responsible investment.
Core Funds SFMF
Trade Facilitation and Logistics Supply Chain
To provide quantitative data to senior policymakers, private sector service providers, and key public sector agencies about trade logistics performance indicators that reflect their trade competitiveness.
Core Funds FIAS
Value Chain Assessment To improve awareness among task managers, researchers, and policymakers about the effectiveness of the value chain framework for research and policy advisory services.
Core Funds/Norway FIAS
VISA Credit Bureau Program To foster the development of private credit bureaus in emerging markets in order to facilitate the extension of credit to previously underserved segments of the population.
VISA International TATF

PAGE 170 IFc annual report 2006
Board of Governors Governors and Alternates
member Governor alternate
a
Afghanistan Anwar ul-haq Ahady Wahidullah Shahrani
Albania Ridvan Bode Fatos Ibrahimi
Algeria Mourad Medelci Abdelhak Bedjaoui
Angola Ana Dias Lourenco Job Graca
Antigua and Barbuda Errol Cort Asot A. Michael
Argentina Felisa Josefina Miceli Martin Redrado
Armenia Vahram Nercissiantz Karen Chshmarityan
Australia Peter Costello Teresa Gambaro
Austria Karl-heinz Grasser Kurt Bayer
Azerbaijan Elman S. Rustamov heydar Babayev
B
Bahamas, The James h. Smith Ruth R. Millar
Bahrain Ahmed Bin Mohammed Al-Khalifa Mahmood hashem Al Kooheji
Bangladesh M. Saifur Rahman Md. Ismail Zabihullah
Barbados Mia A. Mottley Grantley W. Smith
Belarus Andrei V. Kobyakov Anatoly I. Sverzh
Belgium Didier Reynders Guy Quaden
Belize Mark A. Espat Carla Barnett
Benin Pascal I. Koupaki Moudjaidou I. Soumanou
Bhutan Lyonpo Wangdi Norbu (vacant)
Bolivia Carlos Villegas Quiroga Luis Alberto Arce Catacora
Bosnia and herzegovina Adnan Terzic Dragan Doko
Botswana Baledzi Gaolathe Serwalo S.G. Tumelo
Brazil Guido Mantega henrique de Campos Meirelles
Bulgaria Plamen oresharski Dimitar Kostov
Burkina Faso Jean Baptiste Compaore Lene Sebgo
Burundi Dieudonne Ngowembona Leon Nimbona
C
Cambodia Keat Chhon Aun Porn Moniroth
Cameroon Polycarpe Abah Abah Daniel Njankouo Lamere
Canada James Michael Flaherty Robert Greenhill
Cape Verde Joao Pinto Serra Leonesa do Maria Nascimento Lima Fortes
Central African Republic Sylvain Maliko Edmond Gbegouda Gnikpingo
Chad Mahamat Ali hassan Sobdibet hinsalbet
Chile Andres Velasco Branes Alberto Arenas de Mesa
China Jin Renqing Li yong
Colombia Alberto Carrasquilla Santiago Montenegro Trujillo
Comoros Imani younoussa Moindjie Saadi
AsofJune30,2006

volume 2 PAGE 171
member Governor alternate
C (continued)
Congo, Democratic Republic of Marco Banguli Jean-Claude Masangu Mulongo
Congo, Republic of Pierre Moussa Pacifique Issoibeka
Costa Rica Guillermo Zuniga Chaves Francisco de Paula Gutierrez
Côte d’Ivoire Paul Antoine Bohoun Bouabre Charles Koffi Diby
Croatia Ivan Suker Ana hrastovic
Cyprus Michael Sarris Christos Patsalides
Czech Republic Bohuslav Sobotka Miroslav Singer
D
Denmark ulla Toernaes Carsten Staur
Djibouti Ali Farah Assoweh Simon Mibrathu
Dominica Swinburne Lestrade Rosamund Edwards
Dominican Republic hector Manuel Valdez Albizu Juan Temistocles Montas
e
Ecuador Diego Borja Cornejo Ruben Flores
Egypt, Arab Republic of Mahmoud Mohieldin Fayza Abulnaga
El Salvador Eduardo Zablah-Touche William J. handal
Equatorial Guinea Jaime Ela Ndong Jose Ela oyana
Eritrea Berhane Abrehe Martha Woldegiorghis
Estonia Aivar Soerd Renaldo Mandmets
Ethiopia Sufian Ahmed Mekonnen Manyazewal
F
Fiji Jone yavala Kubuabola Tevita Banuve
Finland Eero heinaluoma Paula Lehtomaki
France Thierry Breton Xavier Musca
G
Gabon Casimir oye-Mba Christian Bongo
Gambia, The Mousa G. Bala Gaye Abdou B. Touray
Georgia Aleksi Aleksishvili Irakli Chogovadze
Germany heidemarie Wieczorek-Zeul Thomas Mirow
Ghana Kwadwo Baah-Wiredu Anthony Akoto osei
Greece George Alogoskoufis Plutarchos Sakellaris
Grenada Anthony Boatswain Lennox J. Andrews
Guatemala Maria Antonieta de Bonilla Lizardo Sosa Lopez
Guinea Madikaba Camara Eugene Camara
Guinea-Bissau Issufo Sanha Victor Luis Mandinga
Guyana Bharrat Jagdeo Saisnarine Kowlessar
H
haiti Daniel Dorsainvil Raymond Magloire
honduras hugo Rolando Noe Pino yani Rosenthal hidalgo
hungary Janos Veres Tamas Katona

PAGE 172 IFc annual report 2006
member Governor alternate
I
Iceland Valgerdur Sverrisdottir Arni M. Mathiesen
India P. Chidambaram A. K. Jha
Indonesia Sri Mulyani Indrawati hartadi A. Sarwono
Iran, Islamic Republic of Davoud Danesh Ja’fari Mohammad Khazaee Torshizi
Iraq Baker J. Al-Zubaidy Ali Gh. Baban
Ireland Brian Cowen Tom Considine
Israel Stanley Fischer yossi Bachar
Italy Mario Draghi Ignazio Angeloni
J
Jamaica omar Lloyd Davies Wesley George hughes
Japan Sadakazu Tanigaki Toshihiko Fukui
Jordan Suhair Al-Ali Maher Madadha
K
Kazakhstan Karim Massimov Marat A. Kusainov
Kenya Amos Kimunya Joseph Kanja Kinyua
Kiribati Nabuti Mwemwenikarawa Taneti Maamau
Korea, Republic of Duck-Soo han Seongtae Lee
Kuwait Bader Meshari Al-humaidhi Abdulwahab Ahmed Al-Bader
Kyrgyz Republic Akylbek Japarov Kurmanbek M. ukulov
l
Lao People’s Democratic Republic Chansy Phosikham Phouphet Khamphounvong
Latvia oskars Spurdzins Aigars Stokenbergs
Lebanon Jihad Azour Alain A. Bifani
Lesotho Timothy T. Thahane Moeketsi Majoro
Liberia Antoinette M. Sayeh Toga McIntosh
Libya Ahmed A. Menesi Ali Ramadan Shnebesh
Lithuania Zigmantas Balcytis Ramune Vilija Zabuliene
Luxembourg Luc Frieden Jean Guill
m
Macedonia, former yugoslav Republic of Nikola Popovski Maksud Ali
Madagascar haja Nirina Razafinjatovo henri Bernard Razakariasa
Malawi Goodall E. Gondwe David Faiti
Malaysia Abdullah Ahmad Badawi Izzuddin bin Dali
Maldives Qasim Ibrahim Abdullah Jihad
Mali Abou-Bakar Traore Marimantia Diarra
Malta Tonio Fenech Alfred Camilleri
Marshall Islands Brenson S. Wase Jefferson Barton
Mauritania Mohamed ould El Abed Isselmou ould Sidi El Moctar
Mauritius Rama Krishna Sithanen Krishnanand Guptar
Mexico Francisco Gil Diaz Alonso Pascual Garcia Tames
Micronesia, Federated States of Nick L. Andon Lorin Robert

volume 2 PAGE 173
member Governor alternate
m (continued)
Moldova Mihail Pop Valeriu Lazar
Mongolia Nadmid Bayartsakhan ochirbat Chuluunbat
Morocco Fathallah oualalou Rachid Talbi Alami
Mozambique Aiuba Cuereneia Pedro Conceicao Couto
Myanmar hla Tun Myo Nwe
n
Namibia helmut Angula Carl-hermann G. Schlettwein
Nepal Ram Sharan Mahat Bhoj Raj Ghimire
Netherlands Gerrit Zalm Agnes van Ardenne
New Zealand Michael Cullen John Whitehead
Nicaragua Mario Jose Flores Mario Arana Sevilla
Niger Ali M. Lamine Zeine Ramatou Diamballa
Nigeria Nenadi E. usman olusegun o.o. ogunkua
Norway Erik Solheim Anne Margareth Fagertun Stenhammer
o
oman Ahmed Bin Abdulnabi Macki Mohammed bin Nasser Al-Khasibi
p
Pakistan Salman Shah Khalid Saeed
Palau Casmir E. Remengesau Lawrence Alan Goddard
Panama Carlos A. Vallarino orcila Vega de Constable
Papua New Guinea Bart Philemon Simon Tosali
Paraguay Ernst F. Bergen S. Jorge von horoch
Peru Fernando Zavala Lombardi Waldo Mendoza Bellido
Philippines Margarito B. Teves Amando M. Tetangco, Jr.
Poland Leszek Balcerowicz Jerzy Pruski
Portugal Fernando Teixeira dos Santos Carlos Costa Pina
r
Romania Sebastian Vladescu Cristian Popa
Russian Federation Aleksei Kudrin German o. Gref
Rwanda James Musoni Monique Nsanzabaganwa
s
St. Kitts and Nevis Denzil Douglas Janet harris
St. Lucia Kenny D. Anthony Len Ishmael
Samoa Nickel Lee-hang hinauri Petana
Saudi Arabia Ibrahim A. Al-Assaf hamad Al-Sayari
Senegal Abdoulaye Diop Cheikh hadjibou Soumare
Serbia and Montenegro Igor Luksic Mladjan Dinkic
Seychelles Patrick Pillay Jacquelin Dugasse
Sierra Leone John o. Benjamin Samura Kamara
Singapore Tharman Shanmugaratnam Lim Siong Guan

PAGE 174 IFc annual report 2006
member Governor alternate
s (continued)
Slovak Republic Ivan Miklos Elena Kohutikova
Slovenia Andrej Bajuk Andrej Kavcic
Solomon Islands Bartholomew ulufa’alu Shadrach Fanega
Somalia (vacant) (vacant)
South Africa Trevor Andrew Manuel Elias Lesetja Kganyago
Spain Pedro Solbes M. David Vegara Figueras
Sri Lanka Mahinda Rajapaksa P. B. Jayasundera
Sudan El Zubair Ahmed El hassan Lual A. Deng
Swaziland Absalom M.C. Dlamini Musa D. Fakudze
Sweden Par Nuder Carin Jamtin
Switzerland Joseph Deiss Micheline Calmy-Rey
Syrian Arab Republic Amer hosni Lutfi Mohammad hamandosh
t
Tajikistan Safarali Najmuddinov Abdulaziz Sharipov
Tanzania Juma Alifa Ngasongwa Gray S. Mgonja
Thailand Thanong Bidaya Suparut Kawatkul
Timor-Leste Maria Madalena Brites Boavida Aicha Bassarewan
Togo yandja yentchabre Gilbert Bawara
Tonga Siosiua T.T. ‘utoikamanu ‘Aisake V. Eke
Trinidad and Tobago Conrad Enill Alison Lewis
Tunisia Mohamed Nouri Jouini Abdelhamid Triki
Turkey Ibrahim h. Canakci Memduh Aslan Akcay
Turkmenistan Geldymurad Abilov (vacant)
u
uganda Ezra Suruma C. M. Kassami
ukraine Stanislav Stashevsky Arseniy yatsenyuk
united Arab Emirates hamdan bin Rashid Al-Maktoum Mohammed Khalfan Bin Khirbash
united Kingdom hilary Benn Gordon Brown
united States John W. Snow Josette S. Shiner
uruguay Danilo Astori Carlos Viera
uzbekistan Faizulla M. Mullajanov ulugbek Rozukulov
V
Vanuatu Willie Jimmy Tapangararua Simeon Athy
Venezuela, República Bolivariana de Jorge Giordani Nelson Jose Merentes Diaz
Vietnam Le Duc Thuy Phung Khac Ke
Y
yemen, Republic of Abdulkarim I. Al-Arhabi Mutahar Abdulaziz Al-Abbasi
Z
Zambia N’gandu Peter Magande Chibiliti Evans Chibiliti
Zimbabwe herbert M. Murerwa Gideon Gono

volume 2 PAGE 175
Director alternate Director Casting Votes of total Votes percent of total
appointed
(vacant) Jennifer Dorn united States 56�,62� 23.66
(vacant)a Toshio oya Japan 141,424 5.87
Eckhard Deutscher Walter hermann Germany 12�,158 5.36
Pierre Duquesne Alexis Kohler France 121,265 5.04
Tom Scholar Caroline Sergeant united Kingdom 121,265 5.04
elected
Gino Alzetta(Belgium)
Melih Nemli(Turkey)
Austria, Belarus, Belgium, Czech Republic, hungary, Kazakhstan, Luxembourg, Slovak Republic, Slovenia, Turkey
125,221 5.20
Biagio Bossone(Italy)
Nuno Mota Pinto(Portugal)
Albania, Greece, Italy, Malta, Portugal, Timor-Leste 101,758 4.23
Dhanendra Kumar(India)
Zakir Ahmed Khan(Bangladesh)
Bangladesh, Bhutan, India, Sri Lanka ��,234 4.12
Luis Marti(Spain)
Jorge Familiar(Mexico)
Costa Rica, El Salvador, Guatemala, honduras, Mexico, Nicaragua, Spain, Venezuela (Republica Bolivariana de)
�7,478 4.05
Marcel Masse(Canada)
Gobind Ganga(Guyana)
Antigua and Barbuda, The Bahamas, Barbados, Belize, Canada, Dominica, Grenada, Guyana, Ireland, Jamaica, St. Kitts and Nevis, St. Lucia
�2,�44 3.86
Jan Willem van der Kaaij(Netherlands)
Anca Ciobanub
(Romania)Armenia, Bosnia and herzegovina, Bulgaria, Croatia, Cyprus, Georgia, Israel, Macedonia (former yugoslav Republic of), Moldova, Netherlands, Romania, ukraine
87,113 3.62
Thorsteinn Ingolfssonc
(Iceland)Svein Aassd
(Norway)Denmark, Estonia, Finland, Iceland, Latvia, Lithuania, Norway, Sweden
86,6�3 3.60
Alexey G. Kvasov(Russian Federation)
Eugene Miagkov(Russian Federation)
Russian Federation 81,5�2 3.3�
otaviano Canuto(Brazil)
Jeremias N. Paul, Jr.(Philippines)
Brazil, Colombia, Dominican Republic, Ecuador, haiti, Panama, Philippines, Trinidad and Tobago
75,�80 3.16
Joong-Kyung Choi(Republic of Korea)
Terry o’Brien(Australia)
Australia, Cambodia, Kiribati, Korea (Republic of), Marshall Islands, Micronesia (Federated States of), Mongolia, New Zealand, Palau, Papua New Guinea, Samoa, Solomon Islands, Vanuatu
73,30� 3.04
Jaime Quijandria(Peru)
Alieta Guadagni (Argentina)
Argentina, Bolivia, Chile, Paraguay, Peru, uruguay 64,144 2.66
Pietro Veglio(Switzerland)
Jakub Karnowski(Poland)
Azerbaijan, Kyrgyz Republic, Poland, Serbia and Montenegro, Switzerland, Tajikistan, Turkmenistan, uzbekistan
62,601 2.60
herwidayatmo(Indonesia)
Nursiah Arshad(Malaysia)
Fiji, Indonesia, Lao People’s Democratic Republic, Malaysia, Myanmar, Nepal, Singapore, Thailand, Tonga, Vietnam
5�,�12 2.4�
Mathias Sinamenye(Burundi)
Mulu Ketsela(Ethiopia)
Angola, Botswana, Burundi, Eritrea, Ethiopia, The Gambia, Kenya, Lesotho, Liberia, Malawi, Mozambique, Namibia, Nigeria, Seychelles, Sierra Leone, South Africa, Sudan, Swaziland, Tanzania, uganda, Zambia, Zimbabwe
58,873 2.44
Board of Directors Directors and Alternates and Their Voting Power

PAGE 176 IFc annual report 2006
Director alternate Director Casting Votes of total Votes percent of total
elected (continued)
Sid Ahmed Dib(Algeria)
Shuja Shah(Pakistan)
Afghanistan, Algeria, Ghana, Iran (Islamic Republic of), Morocco, Pakistan, Tunisia
45,�80 1.�1
Mahdy Ismail Aljazzaf(Kuwait)
Mohamed Kamel Amr(Arab Republic of Egypt)
Bahrain, Egypt (Arab Republic of), Iraq, Jordan, Kuwait, Lebanon, Libya, Maldives, oman, Syrian Arab Republic, united Arab Emirates, yemen (Republic of)
34,476 1.43
Abdulrahman M. Almofadhi(Saudi Arabia)
Abdulhamid Alkhalifa (Saudi Arabia)
Saudi Arabia 30,312 1.26
Zou Jiayi(China)
yang Jinlin(China)
China 24,750 1.03
Paulo F. Gomes(Guinea-Bissau)
Louis Philippe ong Seng (Mauritius)
Benin, Burkina Faso, Cameroon, Cape Verde, Central African Republic, Chad, Comoros, Congo (Democratic Republic of), Congo (Republic of), Côte d’Ivoire, Djibouti, Equatorial Guinea, Gabon, Guinea, Guinea-Bissau, Madagascar, Mali, Mauritania, Mauritius, Niger, Rwanda, Senegal, Togo
22,�47 .�5
Note:Somalia(333votes)didnotparticipateinthe2004RegularElectionofDirectors.
a. MakotoHosomi(Japan)appointedeffectiveJuly14,2006.b. TobesucceededbyClaudiuDoltu(Romania)effectiveJuly24,2006.c. TobesucceededbySveinAass(Norway)effectiveJuly1,2006.d. TobesucceededbyPauliKariniemi(Finland)effectiveJuly1,2006.
Director end of period service alternate Director end of period service
yahya Abdullah M. Alyahya (Saudi Arabia)
April 30, 2006 Akbar Ali Khan (Pakistan)
August 2, 2005
John Austin (New Zealand)
August 14, 2005 Anthony Requin (France)
october 11, 2005
Robert holland, III (united States)
August 26, 2006 Tamara Solyanyk (ukraine)
November 30, 2005
Ad Melkert (Netherlands)
February 28, 2006
yoshio okubo (Japan)
June 14, 2006
Chander Mohan Vasudev (India)
November 14, 2005
In addition to the directors and alternates shown in the foregoing list, the following also served after June 30, 2005:
volume 2 PAGE 177
president1 Paul Wolfowitz
executive Vice president Lars Thunell
Vice President and Corporate Secretary1 W. Paatii ofosu-Amaah
Compliance Advisor/ombudsman2 Meg Taylor
Vice President, Asia and Latin America5 Farida Khambata
Vice President, Europe, Africa and the Middle East5
Edward Nassim
Vice President, Finance, and Treasurer Nina Shapiro
Vice President, human Resources and Administration
Dorothy h. Berry
Vice President, Industries5 Declan Duff
Vice President, Risk Management5 Allen Shapiro (Acting)
Vice President, World Bank/IFC Private Sector Development and IFC Chief Economist
Michael Klein
rEGionaL dEParTMEnTSsub-saharan africa
Director (Johannesburg) Thierry Tanoh
General Manager, PEP Africa (Johannesburg) Bernard Chidzero
Country Manager, Central Africa (Douala) Cheikh oumar Seydi
Country Manager, East Africa (Nairobi) Jean Philippe Prosper
Country Manager, Ghana, Benin, Burkina Faso, Côte d’Ivoire, Guinea, Liberia, Niger, Sierra Leone, Togo (Accra)
Imoni Akpofure
Country Manager, Madagascar, Comoros, Mauritius, Seychelles (Antananarivo)
henri Rabarijohn
Country Manager, Mozambique and Angola (Maputo)
Babatunde onitri
Country Manager, Nigeria (Lagos) Solomon Quaynor
Country Manager, Senegal, Cape Verde, The Gambia, Guinea-Bissau, Mali, Mauritania (Dakar)
Aida Der hovanessian
Country Manager, Southern Africa (Johannesburg)
Andrew Alli
Manager, SME Solutions Center (Johannesburg)
Ibrahima Diong
east asia and pacific
Director (hong Kong) Richard Ranken
Associate Director, China and Mongolia (Beijing)
Karin Finkelston
Senior Manager, Business Development (hong Kong)
Timothy Krause
Senior Regional Manager, Technical Asst. and Advisory Services (hong Kong)
Warrick Smith
General Manager, PEP China (Chengdu) Mario Fischel
General Manager, PEP Mekong (Phnom Penh)
Adam Sack
General Manager, PEP Pacific (Sydney) (vacant)
General Manager, PENSA (Jakarta) Chris Richards
Country Manager, Indonesia (Jakarta) German Vegarra
Country Manager, Philippines and Thailand (Manila)
Vipul Bhagat
Country Manager, Vietnam, Cambodia, Laos (hanoi)
Sin Foong Wong
Manager, Strategy and Coordination Amitava Banerjee
south asia
Director (New Delhi) Iyad Malas
Senior Manager (Mumbai) Sujoy Bose
Senior Manager (New Delhi) Vipul Prakash
General Manager, SEDF (Dhaka) Anil Sinha
Manager, Strategy and Coordination Neil Gregory
Central and eastern europe
Director (Moscow) (vacant)
Manager, Strategy and Coordination Kutlay Ebiri
Manager (Moscow) Tania Lozansky
southern europe and Central asia
Director (Istanbul) Shahbaz Mavaddat
General Manager, PEP Southeast Europe (Sarajevo)
(vacant)
General Manager, PEP Southeast Europe—Infrastructure (Sofia)
Angelo Dell’atti
Manager (Istanbul) Snezana Stoiljkovic
TA Coordinator (Istanbul) Antoine Courcelle-Labrousse
latin america and the Caribbean
Director (Rio de Janeiro) Atul Mehta
Associate Director (São Paulo) Saran Kebet-Koulibaly
iFC ManagementAsofJune30,2006
PAGE 178 IFc annual report 2006
Senior Manager (Buenos Aires) yolande Duhem
Senior Manager (Mexico City) Paolo Martelli
General Manager, LAC Facility (Lima) Anita Bhatia
Country Manager, Colombia, Venezuela, and Ecuador (Bogotá)
Roberto Albisetti
Country Manager (Lima) Marcene Broadwater
Manager, New Business Loy Pires
Manager, Strategy and Coordination Eduardo Wallentin
Resident Representative (Santo Domingo) Salem Rohana
Resident Representative (Port of Spain) Kirk Ifill
middle east and north africa
Director (Cairo) Michael Essex
Associate Director (Algiers) Abdelkader h. Allaoua
Senior Manager (Dubai) Azmat Taufique
General Manager, PEP-MENA (Cairo) Jesper Kjaer
Manager Mariko higashi
Manager (Cairo) Michael higgins
Manager (Cairo) Gulrez hoda
induSTry dEParTMEnTSagribusiness
Director Jean-Paul Pinard
Associate Director, Portfolio and Credit Review
Macadou N’Daw
Senior Manager, New Investments oscar Chemerinski
Global Financial markets
Director Jyrki Koskelo
Associate Director, Field and Portfolio Mark Alloway
Portfolio Manager, Central and Eastern Europe (Moscow)
Alireza Zavar
Portfolio Manager, East Asia (hong Kong) William haworth
Portfolio Manager, Latin America and Caribbean (Rio de Janeiro)
Shamsher Singh
Portfolio Manager, South Asia and MENA Region (Dubai)
Jan Van Bilsen
Portfolio Manager, Southern Europe and Central Asia (Istanbul)
Martin Kimmig
Portfolio Manager, Sub-Saharan Africa (Johannesburg)
Dolika Banda
Associate Director, Financial Engineering Shidan Derakhshani
Senior Manager, Institution Building & New Product Development
Georgina Baker
Senior Manager, Microfinance S. Aftab Ahmed
Senior Manager, Nonbank Financial Institution, Regional Coordinator for East Asia
Marcos Brujis
head, Banking Joao Lucas Duchene
head, Financial Infrastructure and Institution Building
Peer Stein
Associate Director, operations Mamta Shah
Manager, Transaction Group Ayaan Adam
head, Regional Coordinator for South Asia and MENA
hans-Jorg Paris
head, Regional Coordinator for Southern Europe and Central Asia
Mengistu Alemayehu
head, Regional Coordinator for Europe and Central Asia
Rosy Khanna
head, Special Projects Jean-Marie Masse
Associate Director, operations, Africa and Latin America and Caribbean Regions
James Scriven
Manager, Regional Coordinator for Latin America
Serge Devieux
head, Regional Coordinator for Africa Atsuko horiguchi
Global Information and Communication technologies3
Director Mohsen Khalil
Manager, New Investments Stephanie von Friedeburg
Manager, Portfolio and Credit Review (vacant)
Global manufacturing and services
Director Dimitris Tsitsiragos
Senior Manager, Portfolio, Sub-Saharan Africa (Johannesburg)
George M. Tiller
Senior Manager Sergio Pimenta
Manager, Global Transaction Group Milton Wanyama
Manager, Portfolio, East Asia (hong Kong) S. Balasubramanian
Manager, Portfolio, South Asia (New Delhi) Colin Warren
Manager, Portfolio, Southern Europe and Central Asia (Istanbul)
Antonio David
Manager Stephanie Freymann
Portfolio head, MENA Carsten Mueller
Health and education
Director Guy Ellena
Manager, Credit Review and Portfolio Sybile Lazar
Manager, New Business Patrick Leahy
volume 2 PAGE 17�
Infrastructure
Director Francisco Tourreilles
Senior Manager, Infrastructure Amnon Mates
Senior Manager, Portfolio and Credit Review Apinya Suebsaeng
Senior Manager, Transport Services Ravinder Bugga
Manager, New Investments Darius Lilaoonwala
Manager, Portfolio Pierre Bouvery
Manager, Public-Private Partnerships and Renewable Energy
Morgan Landy
Manager, utilities usha Rao-Monari
oil, Gas, mining, and Chemicals3
Director Rashad-Rudolf Kaldany
Associate Director, oil and Gas Somit Varma
Senior Manager, Mining Kent E. Lupberger
Senior Manager, Portfolio and Credit Review Kalada harry
Manager, Chemicals Lance Crist
private equity and Investment Funds
Director haydée Celaya
Manager, New Business Maria Kozloski
Manager, Portfolio operations David Wilton
small and medium enterprises
Director Laurence Carter
Senior Manager Max Aitken
Manager, Donor-Funded operations Mariann Kurtz-Weber
Manager, Linkages Sujata Lamba
Manager, Training and Knowledge Management
Sita Ramaswami
trust Funds
Director Mwaghazi Mwachofi
dEParTMEnTSadvisory services
Director Bernard Sheahan
Manager, Privatization Policy and Transactions (Johannesburg)
David Donaldson
Business risk Group
Director udayan Wagle
Controller’s and Budgeting
Director (effective9/1/06) Christian Grossmann
Senior Manager, Budgeting Richard J. Moss
Manager, Financial Reporting and Accounting Policy
Paul B. Bravery
Manager, Internal Controls and Special Projects
Nicholas Pardoe
Senior Adviser, Loss Provisioning Guy A. de Clercq
Corporate Business Informatics
Chief Information officer Guy-Pierre de Poerck
Senior Manager, Development and Informatics
Wajdi Bustani
Manager, Business Informatics Paul Standen
Corporate Governance
Director Teresa Barger
Corporate portfolio management
Director Marc Babin
head, Equity and Portfolio Management Sebastian Thiriez
Corporate relations
Senior Manager Bruce Moats
Credit review
Director Sakdiyiam Kupasrimonkol
Chief Credit officer Paul Baribeau
Chief Credit officer Monish Dutt
Chief Credit officer Robin Glantz
Chief Credit officer Flavio Guimaraes
Chief Credit officer Manuel E. Nunez
Chief Credit officer Vincent Polizatto
Chief Credit officer Richard P. Roulier
Chief Credit officer C. John Wilson
environment and social Development
Director Rachel Kyte
Associate Director, Investment Support Group
William Bulmer
Manager, Environmental Finance Group Shilpa Patel
Manager, Knowledge and Innovation Group Richard Caines
PAGE 180 IFc annual report 2006
Financial operations
Director Avi hofman
Senior Manager, Loan and Equity operations Support
Soon-Wan ooi
Manager, Investment Accounting, Compliance, and Custody
Karen Jones
Manager, Project Risk Management Edward Strawderman
Grassroots Business organizations
Director harold Rosen
Human resources and administration
Vice President Dorothy h. Berry
Associate Director, hR Development Esteban Altschul
Manager, Donor-Funded operations Anne Sahl
Manager, Facilities and Administration Elizabeth Casqueiro
Manager, Leadership Development Eva Mennel
Manager, Recruitment Malte von Putbus
Manager, Staff Development Daniel Tytiun
Independent evaluation Group4
Director Denis Carpio (Acting)
legal Department
General Counsel Jennifer Sullivan
Deputy General Counsel David McLean
Chief Counsel (Istanbul) David harris
Chief Counsel Christian Philip
Manager Sabina Beg
Manager John Coogan
Manager Caroline Kahn
Manager Fady Zeidan
municipal Fund
Director Vincent Gouarne (Acting)
operational strategy
Senior Manager Toshiya Masuoka
private sector Development
Director, Investment Climate Pierre Guislain
Senior Manager, Foreign Investment Advisory Service
Thomas Davenport
Manager, Monitoring and Analysis Group Simeon Djankov
Manager, Development Effectiveness Roland Michelitsch
Lead Economist (Sydney) Russell Muir
resource mobilization
Director Ritva Laukkanen
Manager, B-Loan Management Matthew Bauer
Manager, Syndications Stefania Berla
risk management and Financial policy
Director Lakshmi Shyam-Sunder
special operations
Director Maria Da Graça Domingues
treasury
Deputy Treasurer—head of Funding John Borthwick
Deputy Treasurer—head of Liquid Asset and Cash Management
Mark Spindel
Deputy Treasurer—head of Derivative Products and Asset Liability Management
Shanker Krishnan
Deputy Treasurer—head of Quantitative Analysis
Takehisa Eguchi
Deputy Treasurer—Global head of Structured Finance
Lee Meddin
oThErDirector, Tokyo office hiroshi Arichi
Special Representative in Europe (Paris) Wolfgang Bertelsmeier
Special Representative in Europe (Frankfurt) oltmann G. Siemens
1. TheseofficersholdthesamepositionintheWorldBank.2. ReportsdirectlytoWorldBankGroupPresident.3. ReportstoWorldBankVicePresident,Infrastructure,aswellasIFCVicePresident,Industries.4. ReportstoDirector-General,IndependentEvaluation,WorldBankGroup;toIFCExecutiveVicePresidentforadministrativepurposes.5. AsofJuly1,2006.

volume 2 PAGE 181
aCronYms
CaO Compliance advisor/Ombudsman
Fy fiscal year
GDP gross domestic product
iBrD international Bank for reconstruction
and Development
iCSiD international Centre for Settlement of
investment Disputes
iDa international Development association
ieG independent evaluation Group
iFC international Finance Corporation
iMF international Monetary Fund
MiGa Multilateral investment Guarantee agency
MPDF Mekong Private Sector Development Facility
PenSa Program for eastern indonesia SMe assistance
PeP Private enterprise Partnership
PeP africa Private enterprise Partnership for africa
PeP-Mena Private enterprise Partnership for the
Middle east and north africa
PeP-Se Private enterprise Partnership for
Southeast europe
SeDF Southasia enterprise Development Facility
SMe small and medium enterprise
notes anD DeFInItIons
the fiscal year at IFc runs from July 1 to June 30.
Thus, Fy06 began on July 1, 2005, and ended on
June 30, 2006.
Investment amounts are given in U.S. dollars unless
otherwise specified.
on-lending is the process of lending funds from iFC’s
own sources through intermediaries, such as local banks
and microfinance institutions.
participants and IFc fully share the commercial
credit risks of projects, but because iFC is the lender of
record, participants receive the same tax and country
risk benefits that iFC derives from its special status as a
multilateral financial institution.
Quasi-equity instruments incorporate both loan and
equity features, which are designed to provide varying
degrees of risk/return trade-offs that lie between those
of straight loan and equity investments.
rounding of numbers may cause totals to differ from
the sum of individual figures in some tables.
the World Bank includes both iBrD and iDa.
the World Bank group includes iBrD, iDa, iFC, MiGa,
and iCSiD.
aCronYms, notes, anD DeFInItIons