Balancing Quality with Output: Increasing Proposal Productivity (Iron Mountain)

INCREASING AGRICULTURAL OUTPUT WHILE
AVOIDING DEFORESTATION –
A CASE STUDY FOR MATO GROSSO, BRAZIL
BERNARDO STRASSBURG (COORD.) (IIS)
LAURENT MICOL (ICV)
FABIO RAMOS (AGROSUISSE)
RONALDO SEROA DA MOTTA (IIS)
AGNIESZKA LATAWIEC (IIS)
FABIO LISAUSKAS (ICV)

2
INCREASING AGRICULTURAL OUTPUT WHILE AVOIDING DEFORESTATION –
A CASE STUDY FOR MATO GROSSO, BRAZIL
COORDINATION:
THE INTERNATIONAL INSTITUTE FOR SUSTAINABILITY
IN PARTNERSHIP WITH:
INSTITUTO CENTRO DE VIDA
AGROSUISSE
SUPPORTED BY
PRINCE’S RAINFORESTS PROJECT
PRINCE’S CHARITIES’ INTERNATIONAL SUSTAINABILITY UNIT
CORRESPONDENCE SHOULD BE ADDRESSED TO
INTERNATIONAL INSTITUTE FOR SUSTAINABILITY
ESTRADA DONA CASTORINA, 124 – HORTO
RIO DE JANEIRO – BRAZIL – 22460-320
TEL/FAX: +55-21-38756218

3
CHAPTER 1 - Introduction
Over millennia, agricultural practices have produced food and fodder for human population.
Between 1940 and late 1970s the ‘Green Revolution’ allowed to avoid Malthusian’s gloomy
forecasts that the Earth would not be able to support its growing human population. ‘Green
Revolution’ cased on a range of scientific research and management solutions, such as
development of high-yield varieties of cereal grains or expansion of irrigation infrastructure,
doubled global grain production, greatly reducing food shortages (Tilman et al., 2001) and is
believed to have saved millions of people from starvation. Notwithstanding, food insecurity is
currently a major global problem with millions still hungry throughout the planet (due to both
food accessibility and affordability) and the problem may escalate due to increasing
population.
On the other hand, the conversion of natural environments into managed ones contributed to
major environmental problems, such as pollution, land degradation and biodiversity loss.
Further, land use and land use change combined contribute 31% of anthropogenic greenhouse
gas emissions (IPCC, 2007). Agriculture has historically been the greatest force of land
transformation (Ramankutty et al. 2007), with population growth and per capita consumption
driving global land use change (Tilman et al. 2001). Global cropland area expanded from 3-4
million km2 in 1700 to 15-18 million km2 in 1990, mostly at the expense of forests (Goldewijk
and Ramankutty, 2004). Similarly, Gibbs et al. (2010) showed that throughout the tropics,
between 1980 and 2000 more than 80% of new agricultural land resulted from deforestation
(Gibbs et al. 2010).
According to future projections (Bruinsma, 2009) demand for new agricultural land fuelled by
demand for food, fodder and timber will continue over the next four decades at least, driven
by population and per capita consumption growth. Over the next decades, business as usual,
extensive agriculture therefore has the potential to cause irreversible environmental impacts,
especially in tropical forest-countries.
The sustainable intensification of production in current agricultural lands has been suggested
as a key solution to the conflict between expanding agricultural production and conserving
natural ecosystems (Smith et al., 2010; Phalan et al., 2011). It has been shown (e.g. Smith et
al., 2010; Herrero et al., 2010) that it is possible to increase agricultural efficiency and mitigate
greenhouse gases through resource conservation and improvements in land management,
which lead to increased yields without further deforestation. Importantly, in addition to be
technically feasible, to regenerate degraded lands and improve supply chain efficiency,
sustainable intensification can result in positive returns to landowners, smallholders,
processors, traders and ultimately governments through increased tax returns and multiplier
effects on the economy. On the other hand, it has been demonstrated (Lambin and Meyfroid,
2011) that increased productivity does not necessarily lead to land sparing. In many cases, the

4
opposite is true, with increased deforestation following increases in productivity. This is mainly
due to the ‘rebound-effect’, a classic economic effect where increased productivity makes an
activity more attractive, leading to an increase in demand for its inputs (in this case, land).
Further, some approaches to agricultural intensification by increasing use of on-farm inputs
may increase greenhouse gas emissions from use of fertilizers and machinery, and hence be
may not be sustainable over the long term. Moreover, increasing agricultural productivity
should be associated will all elements of the supply chain and linked to market demand.
Otherwise, sudden increases in productivity could lead to price crashes, reduced production
and generate unemployment.
In order to prevent deforestation a number of stakeholders should be involved, including
private sector, NGOs and government. Also, upfront investment is required to assist changes in
agricultural practice that will lead in the future to productivity increase. However, even if
subsidies are provided, private sector should be provided with risk reduction mechanism.
Unless risk barriers are reduced or eliminated, a shift towards a more productive agriculture
may be heavily constrained.
The purpose of this study is to inform debates associated to Reducing Emissions from
Deforestation and Forest Degradation (REDD+) and sustainable supply chains strategies about
the implementation gap and practical on-the-ground solutions for conciliating agriculture
productivity increase and avoided deforestation. It focuses both at the producer level,
investigating financial requirements, and at a broader implementation level, discussing
possible financing and deliverable mechanisms.

5
Chapter 2 - Context setting
The State of Mato Grosso, located in the Centre-West Region of Brazil, has a total area of 903
thousand square kilometres, composed of three main biomes: the Amazon forest, the Cerrado
(savannah) and the Pantanal wetlands (Figure 2.1). Its population totals 3.0 million people,
with an urbanization rate of 82%.
Figure 2.1- Mato Grosso State, Brazil
Source: IBGE
Current profile of soya and beef production
During the last two decades Mato Grosso became Brazil’s largest producer of grains and
livestock, though with very different profiles in terms of productivity:
Soya production has grown at an average 9.5% per year since 1990 and reached 18.8
million tons in 2010 (27% of Brazil’s production and approximately 7% of the world’s
total production); it occupies 6.2 million hectares, with stabilized average yields of 3.0
tons per hectare, slightly higher than the Brazilian average (Table 4.4). Corn and cotton
crops, most often planted in alternating or in double cropping systems with soya, have
also grown steadily since 1990: Mato Grosso’s corn production has increased at an
average 14% per year and reached 8.2 million tons in 2010 (15% of Brazil’s total), while
cotton production rose from 0 to 0.6 million tons, representing 49% of Brazil’s
production (IBGE, 2011a), and is expected to exceed 1 million tons in 2012 (IMEA,
2012). The total planted area of seasonal crops (including soya, corn, cotton, rice,
sugar cane and sorghum) in Mato Grosso was 9.2 million hectares in 2010 (IBGE,

6
2011a); considering that 30-32% of this area is under double cropping system, the total
area occupied by seasonal crops in the state is approximately 7 million hectares.
Table 2.1 - Mato Grosso and Brazil soya indicators, 2010
Indicator Unit Mato Grosso Brazil Mato Grosso /
Brazil
Planted Area Million ha 6.2 23.3 27%
Production Million tons 18.8 68.8 27%
Productivity Tons.yr-1.ha-1 3.0 2.9
Sources: IBGE (2011a). Prepared by ICV
As for livestock, cattle herd grew by 7.5% annually from 1990 to 2005, when it reached
26 million heads; it remained stable during 2005-2008 but started rising again in 2009
and reached 28.8 million heads in 2010 (IBGE, 2011b). This herd occupies
approximately 25.8 million hectares (IMEA, 2011, from Acrimat/Sinoptica 2008 –
unpublished) in the state, with an average pasture stocking of 1.1 head per hectare.
Slaughter amounts to 4.3 million heads (IMEA, 2011, from INDEA, unpublished) and
production totals 1.1 million tons carcass weight per year, meaning an overall
productivity of 42 kilograms carcass weight per hectare of pasture. Mato Grosso’s
cattle herd, pasture area and production account for 14%, 13% and 12% of Brazil’s,
respectively. Its overall productivity is slightly lower than the national average, due to
a lower average off-take rate and despite a higher pasture stocking and average
carcass weight (Table 2.2). Livestock producers have invested in feedlot in the last few
years and the capacity of the 222 existing units in 2010 adds up to 0.8 million heads,
though still representing a small portion of the total herd (IMEA, 2010a).
Table 2.2 - Mato Grosso and Brazil livestock indicators, 2010
Indicator Unit Mato Grosso Brazil Mato Grosso /
Brazil
Area of pasture Million ha 25.8 205 13%
Cattle herd Million heads 28.8 209 14%
Pasture stocking Head.ha-1 1.1 1.0
Slaughter Million heads 4.3 43.8 10%
Off-take Percent of herd 151 20
Production Million tons cw 1.1 9.2 12%
Carcass weight Kg per head 250 210
Productivity Kg.yr-1.ha-1 42 45
Sources: IBGE (2011b), IMEA (2011) and INDEA, MAPA (2011), Gouvello et al (2010). Prepared by ICV
Besides seasonal crops and livestock, forestry also represents a significant land use category in
Mato Grosso. Log consumption from native forests amounted to 4 million cubic meters in
1 This low average off-take rate is due to the fact that ranchers in the last 4 years have held more
females, with an off-take rate dropping to 8.2%, while it was higher and increasing for males, at 26.5%.

7
2009, 28% of the total consumption in the Brazilian Amazon (Pereira et al, 2010). However,
forest management plans in the state still occupy only 2.3 million hectares in 2010,
approximately 6% of the total area of remaining forests in private properties, where this
activity can be legally carried out. Firewood and charcoal are also produced from native
forests, with a volume of 2.2 million cubic meters in 2010 (IBGE, 2011d). Planted forest, with
an extension of approximately 0.2 million hectares (Arefloresta), supplied a total of 0.6 million
cubic meters of firewood, coal and logs in 2010 (IBGE, 2011e).
Land tenure structure is highly concentrated in both seasonal crops and livestock activities in
Mato Grosso. In farms dedicated to seasonal crops, 87% of the area is concentrated in
approximately 2,200 properties larger than 1,000 hectares, which represent less than 14% of
the total number of this group of farms. In cattle ranches, 78% of the area lies in approximately
8,600 ranches larger than 1,000 hectares that represent less than 8% of the total number of
cattle ranches (IBGE, 2009).
Current profile of soya and beef supply chain to consumption
Most of Brazil’s soya production is for exports, although a growing part of it is processed in the
domestic industry. In 2011, 46% of the production was exported in grain and 52% was
processed in Brazil to produce meal for animal feeding (42%) and oil for the food industry or
biodiesel (10%), while the remaining 7% was stocked or directed to other uses. Approximately
44% of the processed meal and oil were exported and 56% were consumed on the domestic
market (ABIOVE, CONAB).
Since 2010 China became Brazil’s #1 buyer of soya products, with a participation of 46% of the
total value of Brazilian exports of soybean, meal and oil, vs. 33% for the EU. China consumes
above all soybeans, while the EU imports mainly meal (MDIC). The soya trading industry is
highly concentrated and four companies (Amaggi, Cargill, Bunge and ADM) hold most of the
market in Mato Grosso.
As for beef, the domestic market accounts for most of the Brazilian production (79% in 2010),
with an average per capita consumption of 37 Kg cwe (25.2 Kg of meat) per year. Exports in
2010 represented 1.9 million tons cw, being 71% fresh beef, 17% processed and 11% others
(MDIC, ABIEC, ABRAFRIGO). The main buyers of Brazil’s fresh beef are Russia, Iran and Egypt,
while the EU is the main buyer for processed meat (ABIEC).
The beef supply chain is also highly concentrated with only 3 companies (JBS, Marfrig and
Frialto) holding 15 of the 18 major slaughterhouses in Mato Grosso. The total number of
slaughterhouses in the state is 55, with a total industrial capacity of 40.5 heads/ day, which at
full capacity represents 12.1 million heads/year. This capacity was used at only 33% in 2010, as
the industry was starting to recover from a financial crisis it went through during 2008-09.
Agricultural production targets
Both seasonal crops and livestock production are expected to grow significantly during the
next decade:
According to IMEA’s projections (IMEA, 2010a) soya yields will increase by 1.5% per
year and planted area by 2.5% per year by 2020, leading total planted area to increase

8
by 1.7 million hectares and production to increase by 8.9 million tons over the period.
This projected area growth is consistent with MAPA’s projection (MAPA, 2011), which
forecasts an additional 1.8 million hectares of soya in Mato Grosso by 2020. However,
MAPA foresees stable yields during this period. Considering that demand will continue
to be strong, the main limitation to area growth is linked to transports infrastructure
and costs. IMEA considers that if the main infrastructure projects are carried out, area
growth could reach 2.5 million hectares, and if not, it could be limited to 1 million
hectares. The most recent figures and short-term projections indicate that the current
trend of soya area growth is higher than IMEA’s higher scenario, which makes it more
plausible than the lower or even the intermediary one. Area growth in other crops
should be mostly linked to soya expansion, thus we consider that projected growth of
soya area is equivalent to projected growth of seasonal crops area as a whole.
As for livestock, also according to IMEA’s projections (IMEA, 2010a) cattle herd is
expected to grow at an average 2% per year in the next decade, due to improvements
in pasture management resulting in increased stocking capacity. It would then reach
35 million heads in 2020, without change in the total area of pastures. Besides this, the
average off-take rate is expected to grow at an average 4% per year, due to the
increase of feedlots and to the improvement of pasture, reproductive and feeding
management. Thus slaughter and overall production would grow by 6.9% per year,
meaning a 95% percent increase over the period, on the same area of pasture. The
corresponding increase in production would amount to 1 million tons cw, which
represents half of the total increase in beef production projected by MAPA for Brazil
by 2020. The Mato Grosso projections can be considered optimistic, especially
considering that during the last five years stocking increased by 1.5% per year (vs. 2%
in the projection) and take-off rate for males grew at an average 2.9% per year, while
it dropped for females (vs. a 4% average in the projection).
Agriculture (soya crops) expansion should occur onto pasture areas. According to an
estimate by IMEA, approximately 35% of the existing pastures in Mato Grosso,
representing 9.1 million hectares, are located on latosoils and thus are supposed to be
suitable for agriculture (IMEA, 2010b). One third of the total potential areas lie in the
northeast region of the state, where soya expansion depends basically upon already
planned investments in transport infrastructure (road paving and/or railroad). The
potential area for soya expansion on pastures largely exceeds the 1.7-1.8 million
hectares projected expansion of this crop’s planted area in the next decade. However,
this means that cattle ranching will have to grow on less area, not the same area, as it
did during the last few years.
Status of forest and deforestation
Originally, forests in Mato Grosso occupied 526,000 square kilometres while savannahs
occupied 377,000 square kilometres. By 2010, approximately 204,000 square kilometres of
forests and 157,000 square kilometres of savannahs had been deforested, which represents
39% and 42% of their original areas, respectively (

9
Figure 4.4.2).

10
Figure 2.2 – Deforested areas in Mato Grosso
Sources: Prodes/ Inpe, SEMA-MT. Prepared by ICV.
For many years Mato Grosso has been the leading deforester among the Amazon states.
During the peak period of deforestation from 1996 to 2005, the state accounted for 39% of
Amazon deforestation and lost 7,700 square kilometres of forests per year, an annual rate of
1.5% of the original forest area. Deforestation rates reduced since then and went down to 871
square kilometres in 2010, when Mato Grosso accounted for 12% of Amazon deforestation. In
2011 deforestation increased again to 1,126 square kilometres, due to a few large clearings for
soya plantations in the centre-north region of the state (Prodes/INPE).
Mato Grosso was also the leading state in Brazil for deforestation of savannahs during 2002-
2008, representing 21% of the total. During this period it lost 3,000 square kilometres of
savannahs per year, an annual rate of 0.8% of the original area of savannahs. This rate also
reduced strongly since 2005 and went down to 769 square kilometres in 2010 (MMA-IBAMA).
At this time still no data is available for 2011.
Climate change and deforestation reduction targets
The Brazilian Government has developed and successfully implemented since 2004 a Plan to
prevent and control deforestation in the Amazon (PPCDAM). The set of measures taken,
including the creation of 25 million hectares in new reserves and ratification of 10 million
hectares of indigenous lands, the intensification of law enforcement operations, the creation
of a list of critical municipalities and the imposition of economic restrictions and sanctions on
illegal deforesters, are believed to have contributed significantly to the deforestation
reduction that has occurred since 2005.
However, the original plan did not include quantitative targets for deforestation reduction, nor
was it explicitly linked to a climate change mitigation strategy. In 2009-2010 Brazil established
its National Policy on Climate Change (PNMC) and adopted a voluntary goal to reduce GHG
emissions: to reduce total emissions by 36 to 39% by 2020 compared to a business-as-usual
scenario, meaning an overall stabilization at the current levels. This goal encompasses a target
Remaining forests
Remaining savannas
Main roads
Deforested areas

11
to reduce Amazon deforestation rates by 80% by 2020 compared to the 1996-2005 average,
and a target to reduce Cerrado (savannah) deforestation by 40% by 2020 compared to the
1999-2008 average2 (Brasil, 2010), as well as targets for other sectors, including agriculture.
Thus, the PPCDAM and its counterpart for savannahs, the PPCerrado, as well as the ABC Plan
for agriculture, now constitute NAMAs (Nationally Appropriate Mitigation Actions) as to the
international climate change negotiations.
Additionally, Brazil also created in 2008 the Amazon Fund, a financing mechanism for
deforestation reduction projects whose ceiling is related to the country’s results in terms of
deforestation reduction. By February 2012 the Amazon Fund had been granted R$ 860 million
and had approved 26 projects totalling R$ 265 million.
Following the national policies, Mato Grosso launched in November 2009 its own Plan to
prevent and control deforestation and fires and adopted a target to curb deforestation in its
forest area by 89% by 2020 compared to 1996-2005 (Mato Grosso, 2009). The state still has no
target for savannah deforestation reduction.
Mato Grosso’s Plan to prevent and control deforestation and fires is composed of an
integrated set of programs organized in three areas: Land-use planning, Monitoring and
control, and Incentive to sustainable activities and economic instruments. Although many
actions of the Plan were not implemented yet, there has been progress one important aspect:
the environmental registry of rural properties, a necessary step for the environmental
compliance of these properties and a condition for adequate law enforcement. The registry is
now covering 48% of the area of rural properties in the state (ICV analysis, SEMA-MT data).
Figure 2.3 – Deforestation reduction target - Mato Grosso’s forest area, 2006-2020 (km²)
Source: Mato Grosso’s state Plan to prevent and control deforestation and fires (PPCDQ-MT)
Status of REDD+ policy development
While specific and explicit REDD+ policy has not yet had significant developments at the
national level, besides the PNMC, PPCDAM and Amazon Fund mentioned above, a few Amazon
2 The target for cerrado might be revised to a 60% reduction by 2020 vs. the 1999-2008 average.
0
2,000
4,000
6,000
8,000
10,000
12,000
14,000
96 97 98 99 00 01 02 03 04 05 06 07 08 09 10 11 12 13 14 15 16 17 18 19 20
Baseline
Actual (1996-2008)
Target (2009-2020)

12
states – especially Acre, Amazonas and Mato Grosso – have developed their own frameworks
and legislation for REDD+.
REDD+ policy development in Mato Grosso has been led by the State Environmental Agency
(SEMA-MT) and by the Mato Grosso State REDD Working Group (MT REDD WG), a technical,
open working group established in 2010 within the Mato Grosso State Forum on Climate
Change. SEMA-MT has manage the state’s participation to the Governor’s Climate and Forests
Task Force (GCF), where it shares experience with other states in Brazil and abroad on REDD+
development, while the MT REDD WG has worked on the development of a state REDD+ draft
law.
The initial version of the draft law (MT REDD WG, 2010) that creates the State REDD+ System
went through a participatory construction process that included a wide public consultation,
which resulted in many contributions and changes. The MT REDD WG is currently finishing the
final draft of the law project that will then go through the regular State legislative process.
The proposed State REDD+ System intends to create a practical nested approach. It establishes
emissions reference levels, a monitoring system, a registry of emission reductions and a
security reserve at the State level, as well as a state fund for REDD readiness actions and a
public-private financial mechanism for project financing. These instruments are linked to the
project or local level through sector, thematic or regional programs, still to be developed. The
priority sector programs to be developed are for the forestry, agriculture and livestock,
smallholder communities and indigenous people sectors.
Besides the REDD+ draft law, Mato Grosso also has a draft law for an overarching Climate
Change Policy, also developed by the Climate Change Forum, which is expected to go through
the legislative process this year.
Other relevant policies and programmes
Brazil’s Low Carbon Agriculture (ABC) Plan, created in 2010 by the federal government,
intends to reduce agriculture emissions in countrywide by 134-163 million tons of CO2 by 2020
promoting a set of low-carbon techniques (

13
Table 2.3).

14
Table 2.3 - ABC Plan’s targets
Action Area (million hectares) Emissions reduction
target (tCO2-e) Current Additional
1. Expand use of no-till 25 8 16-20
2. Restore degraded
pasturelands
40 15 83-104
3. Promote integrated crop-
livestock-forest systems
2 4 18-22
4. Increase area of
commercial planted forests
6 3 -
5. Promote Biological
Nitrogen Fixation techniques
11 5.5 10
6. Treatment and energy use
of animal manure
- 4.4 million
cubic meters
6.9
Total 133-166
Source: MAPA (2010)
The plan lists a series of actions to be developed in order to achieve these targets,
encompassing research, capacity building and financing, among others. The total estimated
cost for the plan’s implementation is R$ 197 billion, out of which the major part (R$ 157
billion) is for rural credit (Brasil, 2011).
The plan’s main action to date was the creation, in 2010, of a new subsidized financing
program, the ABC Program, that received a R$ 2 billion allocation for the first year and R$ 3.15
billion for the second year3. The program offers loans with low interest rates (5.5% per year)
and extended term (5 to up to 15 years depending on the type of project) for investments in
low carbon agriculture activities. Besides the actions directly linked to the ABC Plan’s targets,
the program also funds the regularization of properties to the environmental legislation,
especially the restoration of legal reserves and areas of permanent preservation (APPs). The
access to this credit was nearly zero in the first year but exceeded R$ 0.5 billion in the second
year – however still representing only 0.7% of the total rural credit.
In order to support the implementation of the ABC Plan, State action plans should be created
in 13 priority states. Among them, by the end of 2011 three states had already established a
Management Committee and developed their action plans, including Mato Grosso. The Mato
Grosso action plan consists in 45 proposed activities, organized around 7 expected results,
directly related to the national plan’s targets. However, these action plans have no budget of
their own, which is a critical limitation to their potential effectiveness.
3 This amount represents 15% of credit for investment allocation and 3% of the total rural credit
allocation for the 2011-2012 crop year.

15
Chapter 3 - Economic analysis for changes
at producer level
3.1) Description and Assumptions
Farm sizes
In order to investigate the effect of scale on cattle ranching economic performance, we
selected three farm sizes of 290, 1406 and 2558 hectares of pasture. All three farm sizes were
modelled adopting an initial stocking rate of 1.05 animal units per hectare, equal to the base
carrying capacity.
Table 3.1 – Farm sizes
Small Medium Large
Total Area (ha) 290 1,406 2,558
Initial Herd 303 1,483 2,817
Systems:
i)Business as Usual (BAU)
Represents the baseline of the farm, keeping the general management based on conventional
production practices. The BAU scenario adopted here can be considered optimistic, as it
assumes farmers will not degrade their pasture areas (by keeping stocking rates at the carrying
capacity of the farm and implementing annual pasture maintenance on 10% of the pasture
area) and are complying with labour laws. In addition, their productivity is higher than the
average productivity of the state. It also includes a timid program for increasing pasture
productivity, following the state baseline rate.
Ii) Improved Scenario – Assumes the adoption of a program that increases pasture
productivity at a faster rate, by implementing EMBRAPA’s good practice guidance (EMBRAPA,
2006). These include a more ambitious program of increasing pastureland productivity by
introducing intensive rotated pasture system (PRI, from “Pastejo Rotacionado Intensivo”). PRI
includes the improvement of pasture condition and the subdivision of pastures with electric
fences. In the scenario modelled here, this leads to a doubling of the base carrying capacity in
three years. The Improved Scenario also includes a minor improvement in fertility rate and

16
weight gains. These gains are on the lower bound of EMBRAPA’s projections, so it is likely that
gains would be higher if the system is properly implemented. We assume the investments lead
to improvements in results for 10 years, after which they are repeated.
Table 3.2 – Selected Productivity Parameters for BAU and Improved Scenarios
Parameter System
BAU Improved
Pasture Productivity
(AU/Ha)
Initial 1,05 1,05
Final 1,33 2,10
Average 1,28 2,00
Birth Rate (% / Year) 85 87
Animal Weight (@ /Head)
Bull 20 20
Pregnant cows 15 15
Non-pregnant cows 12 13
Female Calf 6 6
Heifer 11 12
Male Calf 7 8
Male Heifer 12 13
Fattened Cattle 18 19
Farm Productivity (Kg/Ha/Y) 82 154

17
Figure 3.1. – Beef productivity over time in BAU and Improved Scenarios (Large Farm)
iii)Silvipastoral Systems
Silvipastoral systems involve the joint management of pastoral and silvicultural activities. From
the farmer perspective, they contribute to increase the income per hectare and reduce the risk
of the farm operation by diversifying unrelated income sources. From the macro point of view,
silvipastoral systems contribute to alleviate the demand for additional land by providing more
products from the same unit of area. Silvipastoral systems increase animal wellbeing by
providing shade. There are some evidence this improved animal comfort can increase milk
quality. Some Silvipastoral systems, such as the Intensive Silvipastoral System (SSPi) being
implemented by CIPAV in Colombia can substantially increase pasture productivity. In this
scenario, however, we simulate a simpler silvipastoral system consisting of the planting of 350
eucalyptus trees per hectare. We do not include any productivity gain for the beef production.
Table 3.3 – Silvipastoral System Variables
Variable
Planting
(cost in
R$)
Productivity
(m3/ha/y)
Replanting
(R$)
Labour Costs
(R$/man/day)
Maintenance
Labour
Requirements
(man-days)
Harvesting
Labour
Requirements
(man-days)
Last
year of
pruning
Price of
wood
(R$/m3)
3500 20 350 50 2 6 4 50
iv)Leasing
An increasingly common practice in Mato Grosso is the leasing of part of cattle farms for
soybean plantations. Such practice is constrained by demand for soybean lands, topography,
infrastructure and suitability. For the cattle ranchers such practice is attractive due to higher
0.00
20.00
40.00
60.00
80.00
100.00
120.00
140.00
160.00
180.00
1 2 3 4 5 6 7 8 9 10 11 12 13 14 15 16 17 18 19 20
Kg
/ h
a /
year
Beef Productivity
BAU
Improved

18
income. One hectare can be leased for 20% of the soybean produced in that hectare (we used
a value of R$ 320/ha/y). Cattle ranchers still use the fraction leased during the winter months
for grazing. In this scenario, we assume that the cattle rancher of medium and large farms will
lease half of their farms and adopt the improved system in the remaining area, guaranteeing
that the total beef production will remain at least the same as in the BAU scenario.
We modelled the performance of all three farms sizes in the “Business as Usual”, “Improved”
and “Improved + Silvipastoral” systems. For the medium and large farms we also modelled the
“Improved + Leasing” scenario.
3.2) Results
Our results highlight three important aspects of the economics of cattle ranching. First, the
business as usual system presents negative returns in all three farm sizes. Net Present Values
(calculated for 20 years using a 6.75% annual discount rate) vary between (R$ 1950) and (R$
262) and tend to stay in the negative during all years of the simulated 20 years cycle (Fig 2.1).
Multiple explanations have been presented for the persistence of cattle ranching activities
under apparent negative results. These include i)land speculation, where cattle ranching is a
means to secure land ownership with an aim to sell the land when the cropland frontier
advance; ii)money laundering; iii)non-compliance with labour and environmental legislation,
which could lower costs in reality (e.g. in the BAU system modelled, all farmers collect all
labour taxes, which add to a considerable expense); iv)”irrational” behaviour, where losses in
the cattle ranching operation are masked by high gains in other operations of the same farm
(such as timber extraction) and tolerated for the pleasure or status gained; v)extractivism
model, where stocking rates higher than carrying capacity are used for a short period of time,
followed by degradation and possible abandonment of the land.
The second aspect highlighted is a strong scale factor. Across all scenarios, larger farms lead to
significantly better results. For instance, in the improved scenario the IRR varies from 8%
(small) to 24% (medium) to 31% (large) as the scale of operations is increased. This effect is
due to strong economies of scale in several individual aspects of the operation, and to the
dilution of fixed costs over a larger area.
Thirdly, we have found that the investing in improving productivity leads to very significant
gains in cattle ranching operations. In all farm sizes, the implementation of the Improved
System turns a negative BAU result into a positive one. In large farms, for example,
implementing the improved system transform a negative NPV of R$ 262 per hectare into a
positive NPV of R$ 1336 per hectare, providing 170% ROI.

19
Table 3.4 - Performance Indicators
Farm Size System Constant Price 10 % Meat Price Premium
EBITDA ROI NPV IRR EBITDA ROI NPV IRR
Small
BAU -1580 - -1950 - -1292 -377% -1635 -
Improved 1989 104% 74 8% 2501 139% 704 20%
Improved+Silvipastoral 10474 104% 359 7% 10986 110% 990 9%
Medium
BAU -226 - -572 - 69 20% -278 -
Improved 2778 147% 884 24% 3287 174% 1394 34%
Improved+Silvipastoral 11408 111% 1135 9% 11925 116% 1652 10%
Improved + Lease 1515 192% 727 39% 1783 226% 994 56%
Large
BAU 116 31% -262 - 403 107% 25 9%
Improved 3234 170% 1336 31% 3747 197% 1849 41%
Improved+Silvipastoral 11705 116% 1621 10% 12217 121% 2134 11%
Improved + Lease 1689 215% 902 45% 1949 248% 1162 62%
An important aspect visible in the cash-flow graph (Fig. 3.2) is the need for finance. In order to
make the transition from the BAU to the improved scenario, farmers need to invest a
considerable value upfront. As can be seen clearly for the medium and large farms, results for
the first three years are worse than in the BAU scenario. The same occur over years 11 to 13
when pasture improvement investments need to be repeated.

20
Figure 3.2 – Cash Flow for 20 years cycle
The results also help to explain why the practice of leasing pasturelands for soybean expansion
is becoming more common. Results in the Lease scenario are the most attractive ones,
suggesting cattle farmers would continue to choose this option when available. This option
also presents a practical alternative or at least complement to regular financing, as the income
from soybean can be used to partially finance pasture improvements.
A potential price premium for beef produced from improved systems would represent a strong
incentive for the adoption of this system (Table 3.4). Questions remain if this incentive could
be offered at large scale, but they might be of great importance in the early stages, for
example to finance demonstration projects.
The implementation of Silvipastoral systems greatly increases the NPV per hectare in all cases.
As the investment demanded are considerably high and offer a modest rate of return,
however, the performance of investment related indicators is worse than in systems without
this complement. Silvipastoral systems seem to be of special interest to small farm owners.
The importance of Silvipastoral systems as hedge against price fluctuations will be discussed
below.
Table 3.5 – Silvipastoral Results
Silvipastoral Results
EBITDA ROI NPV IRR
8,470 109% 675 8%

21
Figure 3.3 – Silvipastoral Cash-flow
3.3) Risks Analysis
The potential risks associated with the alternative scenario would be the following ones:
i) Production risk – also called agricultural risks, it is related to variations in the expected
productivity levels and input parameters that are not fully known in practices that are not
widespread yet. So the financial analysis will adopt different parameter levels.
ii)Market risk – (i) Meat: although Brazil is the second major meat producer, it 25% share in the
export market is not enough to set prices in the international market. All projection, including
FAO (2011), consider that despite the high prices the market will continuous to prosper due to
difficulties in several countries, including Brazil, to rebuild herds. However, if OECD economic
crisis end up also affecting emerging economies, demand-driven factors may lead the market
to stagnation; (ii) Soy: Brazil is also the second major soy producer but soy is a commodity
more sensitive to supply and demand fluctuations, resulting in significant movements in prices.
However, according to FAO (2011), oilseeds in general will benefit from the worldwide
expansion of biodiesel; and (iii) Wood: Brazil has only a dominant position in the international
market of the pulp and cellulose. Other wood and wood-related markets the country has no
expressive participation although with a great potential due to climate and land conditions
(SAE, 2011). International wood market is uncertainty considering wood fast substitution.
However, expectations in the domestic are high for with the actual implementation of the
(6,000)
(4,000)
(2,000)
0
2,000
4,000
6,000
8,000
1 2 3 4 5 6 7 8 9 10 11 12 13 14 15 16 17 18 19 20
R$
/ h
a Silvipastoral
22
forest code and biodiesel programs. So the financial analysis will adopt different output price
levels also and a sensitivity analysis for the prices of the major cost items.
iii)Disease risk – One of the major barriers for the export of meat in Brazil is the foot and
mouth disease (FMD). The combat to this disease has been very diligent in the last ten years
with the National Program to Eradicate and Prevent FMD (Programa Nacional de Erradicação e
Prevenção da Febre Aftosa – PNEFA) under the coordination of the Ministry of the Agricuture
(MAPA)4. PNEFA has been already successful to eradicate the disease from most of the
country, including the states of Goiás, Mato Grosso, Mato Grosso do Sul and the south of Pará
that were infected until 2005. The Program seems to have reached its maturity with regular
financial flow of resources, stable extension services and increased farm’s awareness.
However, the disease control effectiveness has showed sensitive to rapid increases in the herd
size; as it happens in 2005 when the disease was reintroduced in Paraná and Mato Grosso do
Sul. It is also recognized that extension services have failed to reach small farmers in remote
areas, as it is the case of the Amazon region that is still remains mostly as a PMD infected area.
This risk should be addressed in the delivery mechanisms by avoiding no free PMD areas and in
free PMD areas enforcing PMD control practices as requisite to financing.
iv)Adoption risk - the adoption of new technologies and practices may generate inertia since it
may require high upfront payments while the return from savings coming over several years. If
so, low-income framers may lack of access to capital to make the investments. Even for major
farmers, adoption costs include the losses of network externalities or qualitative attributes
associated with the substituted technology and costs of learning how to manage the new
practice and changing internal structures, cultures and strategies. (Ekins et al., 2011). This risk
should be addressed in the delivery mechanisms with strong extension incentives.
v)Default risk – Agricultural activities usually face high default on loans and lack of collateral.
Rural insurance mechanisms have been developed elsewhere but in Brazil are still incipient
and the sector is often bailed out. However, the National Program in Rural Insurance that gives
subsidies to farmers in order to contract out insurance at the finance system has attempted to
reserve this trend and has a promising increase in coverage (MAPA, 2011). This risk should be
addressed in the delivery mechanisms that enable insurance subsidies.
vi)Regulatory risks – (i) Forest Code: the current changes in discussion through the National
Congress will certainly reduce land restrictions but they can also increase the enforcement of
the lax ones to be approved. The final outcome of the current revision of the Code is not yet
decided but it is possible to construct potential scenarios for APP and legal reserve restrictions.
So the good practices considered in the scenarios of the financial analysis will consider distinct
scenarios for land restrictions and its implementation scale; (ii) Land law: there are recent
4
http://www.agricultura.gov.br/arq_editor/file/Aniamal/programa%20nacional%20sanidade%20aftosa/evolucao%20geografica.pdf

23
restrictions on foreigners ownership on rural land in Brazil applying also to Brazilian companies
held by foreign investors, such as, previous approval by the Brazilian Agriculture State
Department (INCRA), rural land owned by foreigners in any Brazilian municipality may not
exceed 25% of the municipality’s total rural land area and foreigners of the same nationality
cannot own rural land representing more than 40% of the total rural land area in the
municipality. This risk should be addressed in the delivery mechanisms by considering leasing
procedures whenever is possible; and (iii) The National Policy on Climate Change is not specific
on regulation principles for REDD mechanisms so the country has no clear regulatory
framework for REDD (Seroa da Motta, 2011). Several law bill initiatives are already in
discussion in the National Congress but it seems that the federal government is not willing to
speed up the approval of any framework on REDD before this mechanism is better designed
within the UNFCC. So REDD market in Brazil will have to move in the short-term on voluntary
and bilateral basis what pushes downwards REDD prices. In medium and long term, say, from
2020 on, a well established market regulated by the UNFCC and also restricted control in GHG
emission from global agreements will make REDD more attractive pushing up prices. If so the
carbon price that breaks even the financial analysis should be analyzed in accordance to these
possible temporal outcomes.
Table 3.6 Risk Summary
Risks Expected Level
Production Low-Moderate
Market
Meat Low
Soy Moderate
Wood Low
Disease Low-Moderate
Adoption Moderate-High
Default High
Regulatory
Forest Code Low-Moderate
Land Law High
Climate Law Low-Moderate
24
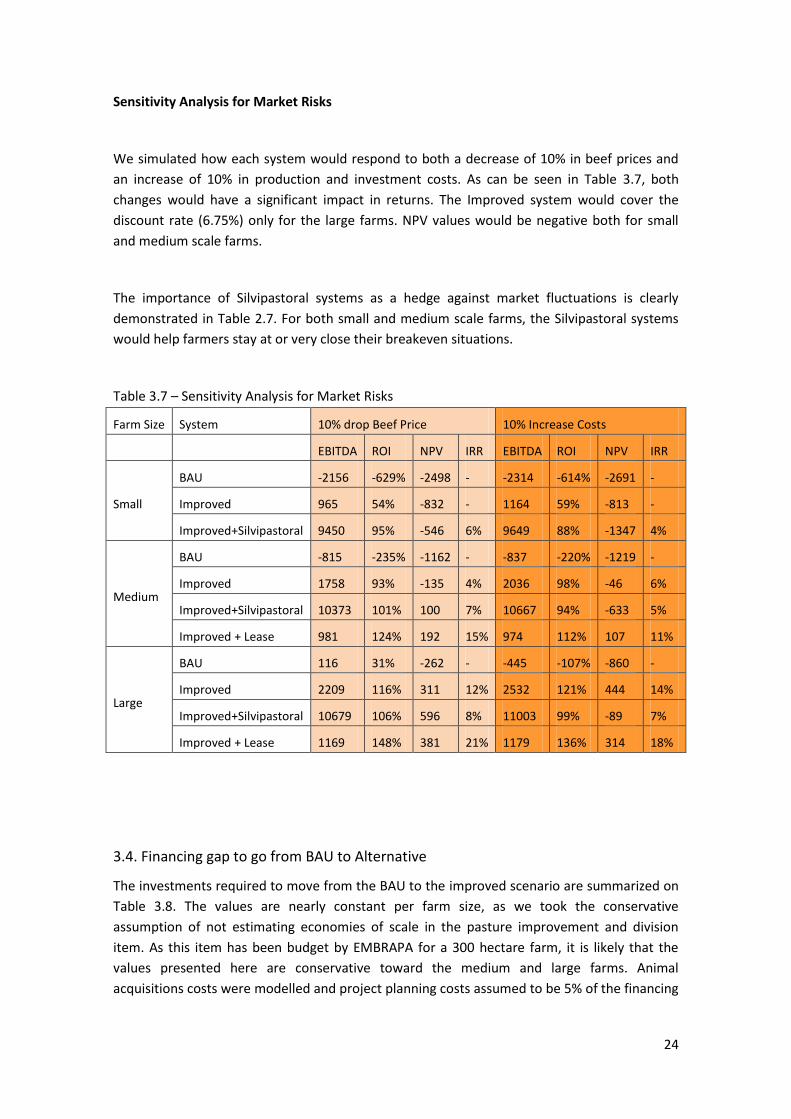
Sensitivity Analysis for Market Risks
We simulated how each system would respond to both a decrease of 10% in beef prices and
an increase of 10% in production and investment costs. As can be seen in Table 3.7, both
changes would have a significant impact in returns. The Improved system would cover the
discount rate (6.75%) only for the large farms. NPV values would be negative both for small
and medium scale farms.
The importance of Silvipastoral systems as a hedge against market fluctuations is clearly
demonstrated in Table 2.7. For both small and medium scale farms, the Silvipastoral systems
would help farmers stay at or very close their breakeven situations.
Table 3.7 – Sensitivity Analysis for Market Risks
Farm Size System 10% drop Beef Price 10% Increase Costs
EBITDA ROI NPV IRR EBITDA ROI NPV IRR
Small
BAU -2156 -629% -2498 - -2314 -614% -2691 -
Improved 965 54% -832 - 1164 59% -813 -
Improved+Silvipastoral 9450 95% -546 6% 9649 88% -1347 4%
Medium
BAU -815 -235% -1162 - -837 -220% -1219 -
Improved 1758 93% -135 4% 2036 98% -46 6%
Improved+Silvipastoral 10373 101% 100 7% 10667 94% -633 5%
Improved + Lease 981 124% 192 15% 974 112% 107 11%
Large
BAU 116 31% -262 - -445 -107% -860 -
Improved 2209 116% 311 12% 2532 121% 444 14%
Improved+Silvipastoral 10679 106% 596 8% 11003 99% -89 7%
Improved + Lease 1169 148% 381 21% 1179 136% 314 18%
3.4. Financing gap to go from BAU to Alternative
The investments required to move from the BAU to the improved scenario are summarized on
Table 3.8. The values are nearly constant per farm size, as we took the conservative
assumption of not estimating economies of scale in the pasture improvement and division
item. As this item has been budget by EMBRAPA for a 300 hectare farm, it is likely that the
values presented here are conservative toward the medium and large farms. Animal
acquisitions costs were modelled and project planning costs assumed to be 5% of the financing
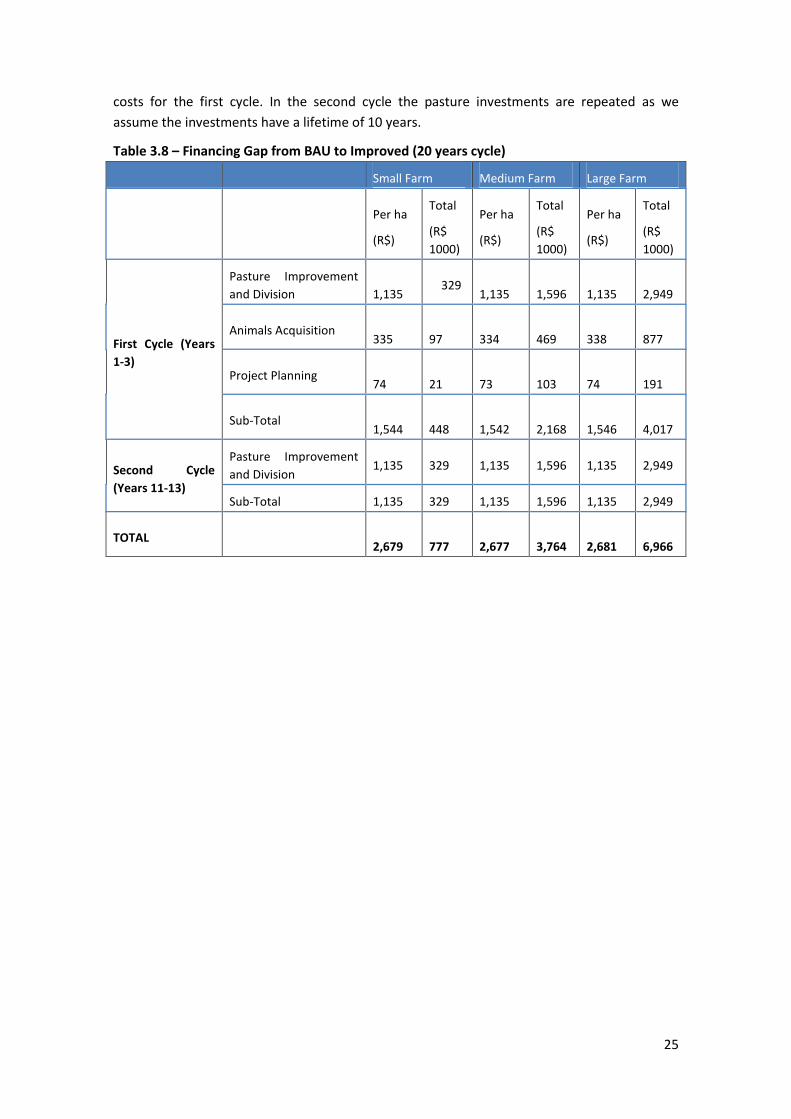
25
costs for the first cycle. In the second cycle the pasture investments are repeated as we
assume the investments have a lifetime of 10 years.
Table 3.8 – Financing Gap from BAU to Improved (20 years cycle)
Small Farm Medium Farm Large Farm
Per ha
(R$)
Total
(R$
1000)
Per ha
(R$)
Total
(R$
1000)
Per ha
(R$)
Total
(R$
1000)
First Cycle (Years
1-3)
Pasture Improvement
and Division
1,135 329
1,135
1,596
1,135
2,949
Animals Acquisition
335
97
334
469
338
877
Project Planning
74
21
73
103
74
191
Sub-Total
1,544
448
1,542
2,168
1,546
4,017
Second Cycle
(Years 11-13)
Pasture Improvement
and Division 1,135 329 1,135 1,596 1,135 2,949
Sub-Total 1,135 329 1,135 1,596 1,135 2,949
TOTAL
2,679
777
2,677
3,764
2,681
6,966

26
Chapter 4 - Delivery Mechanism
Conciliating the expansion of agriculture with the conservation and possibly restoration of
forests in the agricultural frontier is a complex task that requires a host of complementary
activities. In this chapter we present the components that should be part of such initiative at a
statewide level. We then present some initial insights for a mechanism that could address the
core challenge described here (directly linking increase in agricultural productivity to forest
cover). Ideally, this would be part of a concerted statewide effort including the activities
described in the first part. In the absence of those, however, it could be adopted at a project
by project scale.
4.1. Components of a comprehensive REDD+ and agriculture initiative
The land-use challenge that has to be faced – to conserve and augment forest areas while
strongly increasing agricultural output – requires an integrated approach with three basic
components:
1) Conservation of remaining forests, through tackling illegal deforestation, decreasing
the benefits from deforestation and increasing the value of standing forests;
2) Restoration of degraded forests, through promoting the restoration of APPs and Legal
Reserves; and
3) Improved use of already deforested areas, through increasing productivity – with a
focus on cattle ranching, where most potential productivity increases lie, as well as
increasing areas under multiple uses and implementing land-use planning.
In this work we focused on specific strategies related to the third component.

27
Figure 4.4 – Components of a comprehensive REDD+ and agriculture initiative
Source : authors
4.2. Financing mechanism options
The main financing option available for restoration of degraded forests and productivity
increases and implementation of multiple uses in cattle ranching operations is the subsidized
loan of the ABC Program (and other existing programs). However, this mechanism has
limitations due to: i) the lack of capacity of local public extension agents and private service
providers to build adequate projects, both on the technical and financial aspects; ii) the
reimbursement period required by the program, especially for pasture reform, that according
to sector representatives should be extended to 12 years instead of 8 years; iii) the high costs
of inputs, especially for pasture reform in regions that are distant from lime stone-pits, which
lowers potential return on investment; iv) the lack of existing models of improved pasture and
herd management showing positive results to producers ; and v) the risk of default perceived
as high by the producers, especially considering their current financial situation. These
limitations need to be addressed for the financing mechanism to work at the necessary scale
and time.
Conciliate forest
conservation with
agriculture expansion
Conservation of
remaining forests
Restoration of degraded
forests
Improved use of already
deforested areas
Ch
alle
nge
C
om
po
nen
ts
Stra
tegi
es
Tackle illegal deforestation: law
enforcement
Use market pressure against deforestation: moratorium, sectoral
pacts
Create incentives for conservation and
sustainable management of standing forests
Monitor and strengthen forest code
enforcement
Provide technical guidance, financing and
incentives
Increase productivity – focus on cattle ranching, promoting better pasture
& herd management
Increase areas under multiple uses, through
promoting crop-livestock-forest integration, silvopastoral and
agroforestry systems
Implement land-use planning, directing
policies according to each region’s potentialities
Focus of this work

28
The Table 4.4 below discusses the applicability of the different financing mechanism options
available.
Table 4.4 – Financing mechanism options
Option Applicability Discussion
Regular capital Medium Most producers use preferably their own capital for
investment. However, the cattle ranching sector is
composed of family businesses without access to
capital investment from third parties, and the capital
availability of the own businesses to invest in
productivity increases and environmental compliance is
limited.
Grants Low-Medium The scale of the necessary changes in productive
systems greatly exceeds the capacity of grants.
However, these might be important to support pilots.
Loans High The ABC Program and other subsidized credit programs
provide financing for the restoration of degraded
forests for environmental compliance and for
productivity increases and implementation of multiple
uses in cattle ranching operations, although some
limitations have hindered the program’s
implementation.
Provision of
inputs
Medium The direct provision of inputs can be important to
compensate for the high costs of inputs, especially for
pasture reform and management. Preferably, it should
be used in the initial stages of a program, coupled with
the provision of free extension services, following
successful experiences already implemented in other
regions/contexts.
Provision of
free extension
services
Medium The provision of free extension services can be
fundamental at an initial stage, in order to compensate
for the lack of technical capacity on restoration of
degraded forests, on pasture and herd management for
productivity increase and on implementation of
multiple uses in cattle ranching operations. It should be
coupled with the provision of inputs in pilot areas.
Risk guarantees Medium A risk guarantee provision for the loans would be
important for a larger number of producers to embrace
the program, since the risk (both technical and
financial) is considered a major limitation for them to
take the loans of the ABC Program. This risk guarantee
could be in the form of a risk pooling among loan
takers, intermediated by the state or by the
slaughterhouse companies.

29
Guarantees of
purchase
Low Guarantees of purchase do not seem to be an adequate
approach for beef production, since the market is not
so volatile as for other agriculture commodities and
producers can decide when to sell their herds.
Differentiated
pricing
Low The changes necessary in the cattle ranching sector are
for the mainstream production and it seems unlikely
that differentiated pricing could apply to that.
Certification
schemes
Medium Certification is important to encourage investments
and reward the best producers, and could play a major
role. However producers currently consider the return
on investment of certification low.
Link to
companies’
commitments
Medium Buyer companies’ commitments – such as the “legal
beef” commitment already signed by Mato Grosso’s
main slaughterhouse companies – are a fundamental
strategy to minimize deforestation pressure. It is still
unclear if and how they could be applicable to promote
changes in non-compulsory management practices.
In any case, the involvement of the companies in the
program could be decisive, e.g. for the risk guarantee.
Direct
incentives
(payments for
performance)
High Direct payments for performance can be applied in this
case – preferably in a second stage after the pilot
projects with direct provision of inputs and free
extension services are in place. They can be linked to
results in the implementation of given practices, or to
an overall productivity improvement indicator. See
item 3.4 below.
Source: authors
4.3. General elements required to close implementation gap
The main elements necessary to close the implementation gap include shaping, managing and
monitoring the State REDD+ and low carbon agriculture program, implementing a network of
demonstration projects in the major cattle ranching poles throughout the State, providing
facilitated access to the ABC program, strengthening public and private extension services, and
performing strategic research on the program’s themes. The initial cost of this program was
estimated to approximately R$ 22 million during the first five years, not including research
needs, monitoring and verification, and the operational costs of extension services (Table 4.5).
Besides these elements, it will also be necessary to implement the State REDD+ System, since
the proposed program is part of this system. This will require an emissions measurement,
reporting and verification system and a registry of emissions reductions, among other
necessary structures. The corresponding costs were not yet estimated, and will be additional
to the funds already requested by SEMA-MT to the Amazon Fund (R$ 65 million) to support
the implementation of the State Plan to control deforestation.

30
Table 4.5 – Closing the implementation gap: needs, actions and costs
Need Actions Actors Cost estimate
(R$ ‘000)
Financing
options
Shape state
REDD+ and
low carbon
agriculture
program
Define program rules,
design incentives,
develop and monitor
action plan
State
Government,
Farmers
Associations,
NGOs, Research
institutions
600 (y1) +
430/yr (y2-20)
Grants,
State REDD+
fund
Network of
demonstration
projects in 10
cattle ranching
poles
throughout
the State
Set up network of
demonstration projects
of pasture and herd
management and
multiple use systems,
providing: projects
development; inputs for
implementation; and
extension services.
Farmers
Associations,
NGOs, Research
institutions
For each pole (10
projects each):
1,300 (y1-2) +
900 (y3-5)
Grants
Facilitate
access to Low-
Carbon
Agriculture
Finance
Capacity building for
project developers (10
courses in the cattle
ranching poles)
Implementing
financial
institutions,
Farmers
Associations,
Slaughterhouse
companies
200 (y1-2) Own resources
Set up risk management
(risk pooling) mechanism
To be estimated ?
Provide
extension
services
Strengthen public
extension services
State agriculture
agency
Training: 400 (y1-
2)
Operational costs:
aprox. 15,000 /yr
ABC Plan
Public budget
Capacity-building for
private service providers
(10 courses in the cattle
ranching poles)
Farmers
Associations,
Research
institutions,
NGOs
400 (y1-2) + 100
/yr
Grants, ABC
Plan;
Extension costs
supported by
producers
Research
Carry out applied
research on technical,
financial and social
aspects of improved
pasture and herd
management, multiple
use systems, and forest
restoration
Research
institutions,
NGOs
To be estimated Grants, Public
research
finance
Monitoring Implement independent
monitoring and
verification of the
program, exploring
State
Government
(responsibility)
To be estimated

31
collaboration with
existing taxation,
inspection and
traceability systems
Source: interviews, MAPA (2011), authors
4.4. Proposed mechanism of incentives linking agricultural performance more directly to
forest cover
In additional to the general steps outlined above (which should spur significant positive
behaviour change), a complementary system linking direct performance-based changes to
forest cover could be implemented. It could be sub-program under a general REDD+ initiative,
or in the absence of such initiative, an independent program
The “Land-Neutral Agriculture Expansion” (LNAE) mechanism5
In a context of land-scarcity, the expansion of one additional unit of area of a given land-use
can be understood to generate pressure over natural ecosystems proportional to the
production displaced by the expansion. At a jurisdictional level (for example, the State of Mato
Grosso), it is possible to identify the sector or product that demanded additional land and
relate this additional demand to the deforestation that occurred in the same period. In the
state, it has been well documented that most soybean expansion occurred into pasturelands,
whereas most newly deforested areas were occupied by pasturelands. This “indirect
deforestation” has been suggested as the main flaw of the soybean moratorium.
Here we reproduce the concept of “Land-Neutral Agriculture Expansion” (Strassburg, 2012) to
allow farmers to demonstrate that their agricultural expansion has not caused any direct or
indirect impact over natural environments. In a context of incentives related to avoided
deforestation, this mechanism would allow the ones who implement to claim avoided
deforestation credits. In the absence of such mechanism, it can still be used to demonstrate
commitment to sustainability goals, be it in order to gain access to specific markets or to meet
their or their partners’ sustainability commitments.
The LNAE mechanism consists of a series of coordinated steps to link concerted efforts of
expanding agriculture into a certain area and mitigating or compensating the displacement of
the original production in the area. Such efforts can be understood as a closed system with
zero land leakage. This closed system would merit a very robust claim on avoiding
deforestation proportional to the land leakage that would have occurred in its absence.
5 The International Institute for Sustainability retains the intellectual property rights over the Land
Neutral Agricultural Mechanism and associated concepts and processes. IIS welcome further correspondence with colleagues and interested parties about the concept moving forward on research and implementation. For further detail, correspondence with Dr. Bernardo Strassburg is encouraged: [email protected]).

32
The LNAE mechanism could be implemented following three main routes, or a combination of
them. In the first route, the displacement of the original production in the target area for
agricultural expansion is mitigated via the adoption of multiple land use system. In this option,
the original production (e.g. beef) shares the same area with the new production (e.g.
soybean) and no displacement occurs.
In the second route, the farm targeted for the agricultural expansion is divided in two areas. In
one occurs the expansion of the new production (e.g. soybean), whereas in the other occurs
the intensification of the original production (e.g. cattle ranching). If the production in the
second area is equal to the original production of the farm, the displacement is mitigated and
no leakage occurs.
In the third route, a consortium is formed with one or more additional farms capable of
compensating for the production displaced by the expansion in the target farm. If the total
production of the original product (e.g. beef) in the farms of the consortium is the same as
before the expansion of the new product (e.g. soybean), the displacement is mitigated and no
land leakage occurs. Figure 4.2 presents the three routes of LNAE mechanism in a context of
soybean expansion into cattle ranching farms.
Figure 4.2 - The “Land-Neutral Agriculture Expansion” (LNAE) mechanism options
Source: Strassburg (2012)
It is important for the credibility of the mechanism that its implementation is independently
verified. A similar approach could be implemented entirely by the public sector. The LNAE
mechanism can be implemented by a partnership between public, private and NGOs
(Strassburg, 2012). If direct (e.g. REDD+ incentives) or indirect (e.g. access to markets) financial
benefits are associated with such mechanism, it would naturally generate a space for private,
for profit institutions to facilitate the process, possibly including extension services and
financing intermediation to cattle farmers.

33
4.5. Stakeholder map
Many stakeholders with complementary potential contributions should be involved in the
initiative. The stakeholder groups with key potential roles identified include Government
institutions of the Federal, State and local levels, NGOs and research institutions, farmers’
organizations, financial institutions, other private sector stakeholders and donor agencies
(Table ).
Table 4.3 – Key stakeholders and potential role in implementation (preliminary)
Stakeholder
group
Key players Potential role
Federal
Government
MAPA Participate to program/ policy design;
Mobilize funds from the ABC Plan
State
Government
SEMA-MT Participate to program/ policy design, especially on
environmental aspects and questions related to REDD+
SEDRAF-MT
Empaer
Indea
Participate to program/ policy design;
Participate to the strengthening of extension services;
Participate to the monitoring of the program.
Municipal
Government
Municipalities Participate to pilot projects in cattle ranching poles and local
program implementation
NGOs and
Research
institutions
Environmental
NGOs
Participate to program/ policy design;
Manage pilots in cattle ranching poles;
Mobilize grants for program design and implementation of pilots
Embrapa Participate to capacity building;
Lead research
Universities Participate to capacity building and development and
implementation of pilots in livestock poles
Farmers
organizations
Famato, Aprosoja,
CNA and Acrimat
IMEA
SENAR
Participate to program/ policy design;
Mobilize farmers to engage in the program;
Participate to program coordination;
Provide expertise on sector economics;
Monitor program implementation;
Participate to the implementation of capacity-building actions
Local Farmers
Unions
Mobilize farmers to engage in the program; Participate to pilot
projects in cattle ranching poles and local program
implementation
Financial
institutions
ABC program
implementing
banks
Provide capacity-building for farm-level project development;
Adapt financing rules to the conditions of the ranchers sector.
Other private
sector
Slaughterhouse
companies
Develop and implement responsible sourcing policies;
Participate to risk management mechanism.

34
Technical
assistance service
providers
Recipient and multiplier of capacity-building actions, assist
farmers on cattle ranching productivity improvement, multiple
production systems and environmental compliance
Donor agencies Int’al cooperation Fund program design and implementation of pilot projects
Foundations
Source: authors

35
Chapter 5 - Public returns and risks
The figures presented in this chapter represent a preliminary estimate of the environmental
and social impacts of the proposed implementation of the LNAE Mechanism in Mato Grosso. A
proper estimate of these impacts would demand the development of an appropriate
methodology to calculate them.
The key assumptions considered in this estimate relate to i) the area under production for
livestock and soya in a business-as-usual scenario; and ii) the proportion of successful uptake
of alternative production methods:
As for the area under production for livestock, we assume IMEA’s projection that
cattle herd will grow at an average 2% per year in the next decade. We consider that
pasture stocking will grow at an average 2.25% per year, a conservative assumption
that represents a 50% increase over the last 5 years’ average. As a result, the total
pasture area would be slightly reduced in 2020 (Table 4.1). With a plausible 3% annual
growth in off-take rate, this allows beef production to increase by 64% over 2010-
2020. We also assume that the soya planted area will grow according to IMEA’s high
scenario presented above. Consequently, the total area of agriculture and pasture will
grow 0.8 million hectares by 2015 and 1.9 million hectares by 2020, which implies
average deforestation rates of 1.650 Km² per year during 2010-2015 (consistent with
actual rates observed in 2010 and 2011) and 2.100 Km² per year during 2015-2020
(Table 4.1).
As for the proportion of successful uptake of alternative production methods, we
assume that during the first 5 years the proposed mechanism could reach 100,000
hectares of soy expansion and that during the following 5 years it could reach 500,000
hectares of soy expansion. This would represent 24% of the total expansion of soya
area projected for the whole period. Since the alternative production methods in
cattle ranching generate an 88% productivity increase besides what would already
occur in the BAU scenario, they would have to be applied to 114,000 hectares of
pastures during the first 5 years and 568,000 hectares during the next 5 years to
compensate the above mentioned areas of soya expansion. This would represent
approximately 3% of the total area of pastures in the state.
Table 5.6 – Assumptions related to area and production for livestock and soya
Indicator Unit 2010 Annual
growth BAU 2015 BAU 2020
Cattle herd Million heads 28.8 2.0% a 31.8 35.1
Pasture stocking Head.ha-1 1.12 2.25% b 1.25 1.39
Pasture area Million ha 25.8 -0,2% c 25.5 25.2
Soya planted area Million ha 6.2 3.4% a 7.3 8.7

36
Indicator Unit 2010 Annual
growth BAU 2015 BAU 2020
Net Area Increase Million ha NA 0.8 1.9
Sources: IBGE, 2011a e 2011b; a IMEA, 2010 ;
b conservative assumption, 50% above 2005-2010 average;
c calculated, based on cattle herd and pasture stocking
5.1 Climate impacts
Area of avoided deforestation
In the proposed mechanism, we consider that all productivity increases in cattle ranching
compared to the BAU scenario directly generate avoided deforestation, since they are
explicitly linked to areas of soya expansion, which thus become “land-neutral”. The system is
closed and there is no possibility of leakage. Moreover, since the alternative methods require
investment and generate higher income than the conventional ones, the risk of non-
permanence is low, especially when compared to a “payment for no deforestation” approach.
This is why we consider the productivity increases as fully additional.
The implementation of improved, alternative production methods in a given ranch are
expected to increase productivity by 88% above the BAU scenario. For this reason, for each 1
hectare of improved productivity, we consider 0.88 hectare of avoided deforestation.
Inversely, in order to compensate for 1 hectare of soya expansion, 1.14 hectare of cattle
ranching increased productivity is necessary.
Based on these assumptions, the total projected area of avoided deforestation corresponds to
the area of soya expansion made “land-neutral”. We consider here 100,000 hectares in 5 years
and an additional 500,000 hectares in the following 5 years.
Avoided GHG emissions
In order to calculate avoided GHG emissions, we consider the loss of typical stocks of 119 tons
of carbon per hectare in forests located in northern Mato Grosso, compared to carbon stocks
of 8 tons of carbon per hectare in pastures, both extracted from the II National Inventory of
GHG emissions (MCT, 2010). As a result, each hectare of avoided deforestation represents 407
tCO2 and the total projected avoided GHG emissions from this initiative amount to 40.7 million
tCO2 during the first 5 years and 203.5 million tCO2 during the following 5 years.
Hectares of reforestation/afforestation
The proposed approach produces two types of additional areas of reforestation/ afforestation:
i) the restoration of degraded forests in legally protected areas, which is required for
properties to take part to the project; and ii) the implementation of silvipastoral systems in
part of the areas of pastures, which is recommended by Embrapa.
As for the restoration of legally protected areas, the Brazilian Forest Code establishes two
categories of protected areas within private properties: Areas of Permanent Preservation
(APPs), mostly riparian forests, which must be left intact, and Legal Reserves, a percentage of
the total area of each property (80% in the Amazon region) where forests can be managed but
not cleared. However, the Forest Code is currently under discussion and there is a high

37
uncertainty regarding to what extent the restoration of these areas will actually be required
from landowners, and if is, whether the landowners will or not comply with this requirement
independent of their participation to this initiative. In view of this fact, at this stage we do not
consider the potential of restoration of legally protected forest areas.
As for the implementation of silvipastoral systems, we assume that it will represent 20% of the
cattle ranching areas under intervention, which represents 22,800 hectares during the first 5
years and 114,000 hectares during the following 5 years.
Carbon sequestration
For carbon sequestration in native forest restoration, we would consider an annual average
increment of 5.1 tons of carbon per hectare, based on the Brazilian Initial Communication on
carbon storage in aboveground live biomass, corrected with a root-shoot ratio to include
belowground live biomass.
For carbon sequestration in silvipastoral systems, we consider the average carbon stock in an
area managed with 7-year cycles. Considering an annual average increment of 6.58 tons of
carbon (24.12 tons of CO2) per hectare, including above and below ground live biomass, based
the Reference report on commercial forestry of the I National Inventory of GHG emissions, the
average carbon stock is 19.7 tC.ha-1, which corresponds to the sequestration of 72.4 tCO2.ha-1.
Thus the total carbon sequestration in silvipastoral systems is estimated to 54.3 tCO2.ha-1,
which means a total of 1.6 million tCO2 during the first 5 years and 8.3 million tCO2 during the
following 5 years.
Avoided GHG emissions/carbon sequestration of agricultural practices
Improved practices in cattle ranching, especially the restoration of degraded pastures,
generate positive climate benefits in terms of increase of soil carbon stocks and of avoided CH4
emissions from cattle.
In terms of area, we assume that 10% of the pastures under intervention are degraded and will
be recovered through the implementation of improved practices. The corresponding area
represents 11,400 hectares during the first 5 years and 57,000 hectares during the following 5
years.
In terms of climate benefits, the increase in soil carbon stocks is estimated to 9,5 tC.ha-1 (at the
end of 20 years), applying the CDM "Tool for estimation of change in soil organic carbon stocks
due to the implementation of Afforestation and Reforestation CDM project activities" (version
1). As for the reduction in CH4 emissions, it is estimated to 4.67 kg CH4 per year per head of
cattle, based on Gouvello, Soares Filho & Nassar (2010), which represents (in 10 years) 1.2
tCO2e per hectare at the average BAU stocking. Thus the total avoided GHG emissions and
carbon sequestration from improved cattle ranching practices is estimated to 1.1 million tCO2e
during the first 5 years and 5.5 million tCO2 during the following 5 years.
5.2 Other social or environmental impacts
This section examines the environmental impacts of adoption of pastejo rotacionado intensivo (PRI) – intensive rotational pasture - the main approach suggested to increase productivity in Chapter 3.

38
1. Impacts of the alternative production technique on land degradation, soil erosion and
soil fertility.
A transition to intensive rotational systems has been shown to improve a range of environmental and economical aspects of agriculture. Well managed PRI may reduce land degradation and reverse soil erosion (Drewry, 2006). Shifting the livestock systematically at desirable intervals to different subunits of fenced subdivisions enables managed control over the height of fodder, which prevents overgrazing. Moreover, grazed soil is always covered, which diminishes erosion. A number of studies from tropical countries demonstrated advantages of adopting PRI as a more sustainable pasture management (WWF, 2009). Is has been shown that rotational systems increase livestock product yield per unit of land area.
For example, Eaton et al. (2011) showed that in a 17-month study, mean cattle weights and pregnancy rates were 15% and 22% higher, respectively, for the herd using the rotational system in Brazilian Pantanal. The potential stocking rates of the rotational system were 2 to 6 times higher than rates typical of continuously grazed areas. Increasing stocking rates were shown to have a potential for minimizing pressures on natural resources in Pantanal (Eaton et al., 2011).
On the other hand, a number of authors (Martınez and Zinck, 2004; Hamza and Anderson, 2005) highlighted potential impacts of trampling, and consequent soil compaction. Compaction of the topsoil through the pressure exerted by the hooves of increased number of livestock per unit area has been shown to negatively impact soil physical conditions, such as increase of bulk density and penetration resistance, decrease of soil porosity and infiltration rates. This in turn, decreases soil physical fertility through reduced nutrient recycling and mineralisation, decreasing storage and supply of water, reduces activities of micro-organisms, impedes root growth and promotes erosion. For example, studies of Mwendera and Saleem (1997), and Donkor et al. (2002) demonstrated effects of different grazing intensities on surface runoff leading to greater losses of nutrients and sediment, soil loss and infiltration. Notably, finetextured soils (clay rich) were more susceptible to trampling effects than coarse-textured soils. Increased soil bulk density and consequent impedance to root penetration and a reduction in aeration may negatively affect legumes productivity and growth, and thus nitrogen fixation in pasture (see below). Environmental impacts associated with soil compaction tend to be most prominent in areas where animals congregate, for instance around field gateways and along fence lines (McDowell, 2008). Soil moisture is a critical factor determining soil compaction under trampling. A gradual process of the compression of a saturated soil by squeezing out water may lead to adverse consequences of soil consolidation (Drewry, 2006). Therefore, as a component of well managed PRI systems, grazing should be prevented on wet soils, especially widespread in Brazil clay-rich acrisols (argissolos). Along with PRI adopted here, it is assumed that every 10 years a pasture will undergo general reestablishment, which will also include deep sub-surface tillage to combat possible compaction.
2. Pollution impacts and eutrophication
Soil fertility and nutrient availability is fundamental to fodder production in PRI. Provided that PRI systems are seeded with atmospheric nitrogen-fixing legumes, there is no need for additional commercial nitrogen fertilization. In addition, pasture soils are generally well supplied with nitrogen, on account of relatively high concentrations of soil organic matter (McDowell, 2008). A constant input of soil organic matter and recycling of nutrients is provided

39
by dung and urine, in addition to decay of leaves and stems, root exudates and the turnover of root biomass. Therefore, although grazers remove biomass from the pasture system, these losses are compensated by the manure. Such a nutrient recycling can be well managed and controlled within rotational grazing systems. Utilizing legumes avoids the peaks of high concentrations of nitrogen in soil, which normally follows applications of fertilizer, thereby nitrogen leaching to environment from N-fertilized pastures can be avoided. However, various studies demonstrated the importance of nitrogen from urine compared to nitrogen from fertilizers in contributing to NO3 leaching (McDowell, 2008; Eriksen et al., 2010). Leaching from
agricultural soils has a significant contribution to nitrate pollution of ground and surface waters, while urine typically contributes 70-90% of total leached nitrogen (Monaghan et al., 2007). Because urine patches are the main source of nitrate leaching from grazed pastures and losses are related to stocking rate, attention should be paid to diminish possible nitrate leaching from PRI. In PRI this can be achieved by adopting drainage and processing of manure, as well as composting systems. For some edaphoclimatic conditions, an option to mitigate NO3 losses is to reduce the length of the grazing season (Erikson, 2010) yet this would require a high environmental consciousness of farmers.
The adoption of PRI involves application of phosphates fertilizers. Similarly to nitrogen, a plant-growth limiting phosphorus is one of the macronutrients, crucial for the formation of phosphate containing nucleic acids, ATP and membrane lipids. However, possible P leakage from PRI should be carefully controlled and managed, on account of the risk of diffuse pollution of surface waters. Because concentrations of phosphorus in unpolluted waters are generally low, relatively small P discharge can cause eutrophication. Significant loses of P may be due to detachment in compaction-affected soils and incidental loses through run-off after the application of fertilizer, if heavy rain falls soon after (surface or subsurface flow through fissures and drains). Possible loses in PRI systems can be therefore controlled by good pasture management, careful application of relevant gradual-release source of phosphate and by soil analysis for exact concentrations of P in soil, prior to fertilizer application.
With respect to weed control, in general, PRI systems have low weed occurrence due to high competition with well-established forage species (usually multiple species which further contributes to minimize weeds). Also, in PRI, higher stock densities contribute to increased browsing of broadleaf weeds, while weeds that are useless as livestock feed (for example thistles) are exposed to more physical damage by trampling. Therefore, it is assumed that well managed PRI will not receive any pesticide input and thus pesticide-origin pollution is not envisaged. In case extensive weed cover occurs, the system will be managed with mechanical means. In fact, a routine yearly pasture-maintenance of PRI considered here, assumes trimming of the remaining weeds (which may compete with a neighbourhood fodder species), while every ten years it is assumed the pasture will be tilled for both weed and sub-surface compaction control. If extensive uncontrollable weed occurs, the pasture will be re-established with new seeds. A part of weed control is also an appropriate every-day pasture management. For example, overgrazing should be prevented yet undergrazing is also undesirable as animals are likely to graze selectively, allowing less desirable plants to outcompete fodder, which may require more frequent mowing to keep thistle and other undesirable plants from going to seed and spreading further.
If soil acidity occurs, it is assumed that PRI will be supplemented with liming. In addition to a variety of positive effects of increasing soil pH by adding calcario, in tropical countries liming

40
has been reported to significantly reduce aggregate stability, increase clay dispersion, improve soil texture and soil microbial activity, and diminish infiltration rates by increasing water holding capacity (Haynes and Naidu, 1998). In aluminium-rich Brazilian soils, addition of lime has a crucial role in liberating phosphorus from stable forms of aluminium phosphate. An important constraint for a wider access to liming in Brazil is a need for a farmer to travel over large distance to obtain lime. In excess, liming can result is excessive soil cementing, soil cracking and can be harmful to fodder.
3. Impacts of the alternative production technique on water and riparian areas
Theoretically, riparian areas at farms in Brazil are protected by ´Permanent Protection Areas´ (APPs), wherein a strip of land (minimum 30 meter and depends on the river size) should remain with native vegetation. In reality, however, not all farms meet APPs requirements. In PRI suggested here, we assume that riparian areas along with APPs are unavailable to grazing and are separated from the grazing plot by fence. Water pollution from infiltrating N, P, pathogens and urine leaching is prevented by well managed pasture. The consequences of animal grazing on riparian areas may otherwise involve: trampling and overgrazing of stream banks, loss of stream bank stability, reducing resistance by removing protective vegetation and loosening soil and soil runoff, runoff high in nutrients from animal waste and sediment, soil erosion, declining water quality due to siltation and pollution, aquatic and riparian wildlife (Belsky, 1999), with detrimental effects increasing with increasing inclination.
4. Impacts of introduction of silvopastoral systems
Transition of extensive pastoralism to agroforestry may result in a range of socio-economical benefits (Tilman et al., 2002), such as maintaining agricultural productivity and supplementary farm outputs, enhancing the supply of diverse market products, and contributing to risk reduction due to provision with alternative products and higher incomes. Agroforestry has been shown to enhance rural livelihoods by preventing and reversing soil degradation, increase biodiversity and provision of environmental services (German, 2006).
On the other hand, transition to agroforestry when not properly planned and executed may result in possible lower yields thus incomes although large-scale farmers may be able to forego short-term returns. Pinto et al. (2005) showed that on account of diminished light available to crops, and competition for water and nutrients, which increases with proximity to trees of mature eucalyptus, trees negatively affected sugarcane growth and yield. Although shade from trees provides benefits for the cattle reducing the risk of heat stress, animals congregate heavily in the shade which may lead to nutrient loading and runoff, uneven grazing, soil compaction and soil erosion. This can be prevented by planting taller trees. In addition, water-demanding trees may negatively impact the farms, which rely heavily on springs and rivers for drinking and irrigation water (German et al. 2006).

41
5. Social impacts of the alternative production technique
Due to refinement and increase complexity of pasture management when transferring to PRI, is it possible that the system will require more workers, and thus create new jobs in the farms adopting it. It is possible, however, that aggregate jobs per unit of output (e.g. tones of beef) might decrease due to higher efficiency. If we assume a constant total output in both BAU and Alternative scenarios, this would lead to an overall reduction in jobs in the Alternative scenario. Further research should clarify the overall and regional impacts and targeted policies could address any negative consequences.
Successful functioning of PRI is a function of complex and sometimes variable factors, including soil properties, climatic and weather conditions, biological characteristics of the grass species, pasture and cattle rotation. In the PRI systems assumed in this study, the pasture requires to undergo maintenance every year, whereas every ten year the pasture needs to be re-established. Therefore, PRI to work properly requires to be well managed. In fact, some authors (Briske et al., 2011) highlighted social aspects as critical, above all other impacts of the introduction of PRI). The capacity of farmers to detect, learn, and adapt to change within complex PRI is a key component of successfully functioning pasture. Transition to agroforestry also requires additional financial and labour investments from the farmers, providing training, extension, markets, marketing organizations, access to roads and relevant policy.

42
Chapter 6 - Private Returns and Risks In this chapter we briefly discuss the potential returns and risks for the private sector related
to a potential initiative to apply the "Land Neutral Agricultural Expansion" mechanism to the
soybean expansion in the state of Mato Grosso.
6.1 Private returns
Soya producers and supply chain
For the soya producers and associated supply chain, taking part in a LNAE initiative would
reduce the risk of market barriers, especially from the highly and increasingly demanding
European market. There is increasing pressure for the Round Table on Responsible Soy to
adopt indirect deforestation criterion. Also, the commitment from the Netherlands’ market to
buy only RTRS soya by 2015 send a strong signal of potential market barriers. A LNAE initiative
would allow soybean farmers to prove a zero impact on natural environments arising from
future expansion at a relatively low cost. We estimate the costs of fully neutralizing the
expansion of one hectare of soybean at around 2.5% of the value of the soybean produced in
the first five years after expansion.
For the soy supply chain, the benefits include but go beyond the access to markets.
Guaranteeing a future "land-neutral" expansion would bring considerable corporate social
responsibility and reputational benefits in a period where the tensions arising from growing
environmental problems is likely to grow substantially.
Cattle ranchers and beef supply chain
The cattle sector could benefit in diverse ways from both the improved practices at producer
level and a potential LNAE initiative.
For ranchers, the analysis in Chapter 3 has shown that adopting improved practices would
bring substantial positive financial returns. The availability of subsidized credit (in particular
the ABC programme) introduces a key element, making the necessary investments increasingly
attractive. Further, adopting improved practices brings a potential differentiation in the
market, considering that both the major slaughterhouses and supermarket chains are
increasingly demanding deforestation-free and best-practices certified products. This is
particularly true for "first-movers". A LNAE initiative could benefit ranchers from improved
access to credit and extension services, in addition to potential gains related to carbon
mitigation incentives.
For slaughterhouses and supermarket chains, the widespread adoption of improved practices
by ranchers, as could be catalyzed by a LNAE initiative, would bring increased security of
supply of higher quality and potentially traceable and certified products. This would entail the
same reputational benefits as discussed for the soy supply chain.

43
6.2 Private risks
No significant risks were detected for the involvement of soybean traders in a potential
initiative to reduce or eliminate their direct and indirect impact on deforestation. For the cattle
sector, the production, financial, market and regulatory risks and mitigation measures were
discussed in Chapter 3.

44
References Brasil (2011), Plano Setorial de Mitigação e de Adaptação às Mudanças Climáticas para a
Consolidação de uma Economia de Baixa Emissão de Carbono na Agricultura – Plano de
Agricultura de Baixa Emissão de Carbono (Plano ABC), Brasília. Available on:
http://www4.planalto.gov.br/consea/noticias/imagens-1/plano-abc
Brasil (2010), Decreto nº 7.390 de 9 de Dezembro de 2010. Available on: www.planalto.gov.br
Briske, D, Nathan F. Sayre, L. Huntsinger, M. Fernandez-Gimenez, B. Budd, and J. D. Derner (2011) Origin, Persistence, and Resolution of the Rotational Grazing Debate: Integrating Human Dimensions Into Rangeland Research Rangeland Ecol Manage 64:325–334
Bruinsma, J. 2009. The Resource Outlook to 2050. By how much do land, water and crop yields
need to increase by 2050? Expert Meeting on How to Feed the World in 2050. Food and
Agriculture Organization of the United Nations. Economic and Social Development
Department.
CNPC (2010), Balanço da Pecuária Bovídea de Corte. Available on: www.cnpc.org.br
Drewry (2006). Natural recovery of soil physical properties from treading damage of
pastoral soils in New Zealand and Australia: A review Agriculture, Ecosystems and Environment
114 (2006) 159–169
Donkor, N.T., Gedir, J.V., Hudson, R.J., Bork, E.W., Chanasyk, D.S., Naeth, M.A., (2002). Impacts of grazing systems on soil compaction and pasture production in Alberta. Can. J. Soil Sci. 82,1–8.
Eaton, D, SA Santos, Santos M, Lima, J and Keuroghlian A. (2011) Rotational Grazing of Native Pasturelands in the Pantanal: an effective conservation tool. Tropical Conservation Science Vol.4 (1):39-52.
EMBRAPA (2006) Criação de Bobinos de Corte no Estado do Pará. EMBRAPA Amazônia Oriental, Sistemas de Produção 3. Available at
http://sistemasdeproducao.cnptia.embrapa.br/FontesHTML/BovinoCorte/BovinoCortePara/paginas/apresentacao.html
Eriksen, J.; Ledgard, S.; Lou, J.; Schils, R. and Rasmussen, J. (2010) Environmental impacts of grazed pastures. In: Schnyder, H. (Ed.) Grassland Science in Europe 15, pp. 880-890.
German Laura D Berhane Kidane D Riziki Shemdoe (2006). Social and environmental trade-offs in tree species selection: a methodology for identifying niche incompatibilities in agroforestry Envi Devel Sust
Gibbs, H.K., Ruesch, A.S., Achard, M.K., Clayton, M.K., Holmgren, P., Ramankutty, N., Foley, A.
(2010). Tropical forests were the primary sources of new agricultural land in the 1980s and
1990s. Proceedings of National Academy of Sciences 107, no.38, 16732-16737.
Goldewijk, K.K., Ramankutty, N., (2004) Land cover change over the last three centuries due to
human activities: the availability of new global data sets. GeoJournal 61, 335-344.
Gouvello, Soares Filho & Nassar (2010), Estudo de Baixo Carbono para o Brasil - Uso da Terra,
Mudanças do Uso da Terra e Florestas, BIRD/Banco Mundial.
45
GT REDD MT (2010), Anteprojeto de Lei do Sistema Estadual de REDD+ de Mato Grosso.
Available on:
http://www.icv.org.br/quem_somos/noticias/projeto_de_lei_redd_mt_esta_no_processo_de
_reformulacao.icv
Hamzaa,MA, Andersonb WK (2005). Soil compaction in cropping systems A review of the
nature, causes and possible solutions. Soil & Tillage Research 82,121–145
Haynes1 RJ, Naidu R (1998) Influence of lime, fertilizer and manure applications on soil organic matter content and soil physical conditions: a review. Nutrient Cycling in Agroecosystems 51: 123–137, 1998. 123c Herrero, M, P. K. Thornton, A. M. Notenbaert, S. Wood, S. Msangi, H. A. Freeman, D. Bossio, J.
Dixon, M. Peters, J. van de Steeg, J. Lynam, P. Parthasarathy Rao, S. Macmillan, B. Gerard, J.
McDermott, C. Seré, M. Rosegrant 2010. Smart Investments in Sustainable Food Production:
Revisiting Mixed Crop-Livestock Systems. Science Vol. 327 no. 5967 pp. 822-825
IBGE (2011a), Produção Agrícola Municipal 2010. Available on: www.sidra.com.br
IBGE (2011b), Pesquisa Pecuária Municipal 2010. Available on: www.sidra.com.br
IBGE (2011c), Pesquisa Trimestral do Abate de Animais. Available on: www.sidra.com.br
IBGE (2011d), Extrativismo vegetal 2010. Available on: www.sidra.com.br
IBGE (2011e), Silvicultura 2010. Available on: www.sidra.com.br
IBGE (2009), Censo Agropecuário 2006. Available on: www.sidra.com.br
IMEA (2012), Levantamento de Safra de Algodão 2011/2012, Cuiabá. Available on:
www.imea.com.br
IMEA (2011), Caracterização da Bovinocultura no Estado de Mato Grosso, Cuiabá. Available
on: http://imea.com.br/upload/caracterizacaoBovinocultura.pdf
IMEA (2010a), Projeções para a Produção Agropecuária em Mato Grosso, Cuiabá. Avaliable
on: www.imea.com.br
IMEA (2010b), Área de pastagem em latossolo em Mato Grosso, Cuiabá.
IPCC, 2007: Climate Change 2007: Synthesis Report. Contribution of Working Groups I, II and III
to the Fourth Assessment Report of the Intergovernmental Panel on Climate Change [Core
Writing Team, Pachauri, R.K and Reisinger, A. (eds.)]. IPCC, Geneva, Switzerland, 104 pp.
Lambin,E.F., Meyfroidt, P. (2011) Global land use change, economic globalization, and the
looming land scarcity. Proceedings of National Academy of Sciences 108 (9), 3465-3472.
MAPA (2011), Brasil Projeções do Agronegócio 2010/2011 a 2020/2021. Available on: xxx
MAPA (2011), Plano de Ação de Implantação do Plano de Agricultura de Baixo Carbono no
Estado de Mato Grosso – Plano ABC MT, Relatório da Oficina de trabalho, Cuiabá-MT.
Mart´ınez J.A. Zinck (2004)Temporal variation of soil compaction and deterioration of soil
quality in pasture areas of Colombian Amazonia Soil & Tillage Research 75 3–17
McDowell (2008) ENVIRONMENTAL IMPACTS OF PASTURE-BASED FARMING AgResearch
Invermay Agricultural Centre Mosgiel New Zealand

46
Mato Grosso REDD Working Group (2011), Draft REDD+ Law Project: construction process and
highlights, Cuiabá. Available on: www.icv.org.br/w/library/81190mt_redd_wg.pdf
Mato Grosso (2009), Decreto nº 2.943 de 27 de Outubro de 2010. Available on:
www.sema.mt.gov.br
Mato Grosso State (2009), Reference Document for the development of Mato Grosso State’s
REDD Program, Cuiabá. Available on:
www.icv.org.br/w/library/412222011mtreddprogramoutline_dec09.pdf
MMA/IBAMA (2011), Monitoramento do Desmatamento nos Biomas Brasileiros por satélite -
Monitoramento do Bioma Cerrado 2009-2010, Brasilia. Available on:
http://www.mma.gov.br/sitio/index.php?ido=conteudo.monta&idEstrutura=72&idConteudo=
7422&idMenu=7508
Monaghan R.M., Hedley M.J., Di H.J., McDowell R.W., Cameron K.C. and Ledgard S.F. (2007)
Nutrient management in New Zealand pastures – recent developments and future issues. New
Zealand Journal of Agricultural Research 50, 181-201.
Mwendera, E.J., Saleem, M.A.M., (1997). Hydrologic response to cattle grazing in the Ethiopian
highlands. Agric. Ecosyst. Environ. 64, 33–41.
Naeth, M.A., (2002). Impacts of grazing systems on soil compaction and pasture production in Alberta. Can. J. Soil Sci. 82, 1–8.
Pereira et al (2010), Fatos florestais da Amazônia 2010, Belém, PA: Imazon. Avaliable on
www.imazon.org.br
Pinto, FGL, M.S. Bernardes, J.L. Stape, A.R. Pereira Growth, (2005) Yield and system performance simulation of a sugarcane–eucalyptus interface in a sub-tropical region of Brazil. Agriculture, Ecosystems and Environment 105 77–86
Phalan, B; Onial, M ; Balmford, A; Green, RE. 2011. Reconciling Food Production and
Biodiversity Conservation: Land Sharing and Land Sparing Compared. SCIENCE 333,
6047 Pages: 1289-1291 DOI: 10.1126/science.1208742 Published: SEP 2
Ramankutty, N., Gibbs, H.K., Achard, F., Defries, R., Foley, J.A., Houghton, R.A. (2007)
Challenges to estimating carbon emissions from tropical deforestation. Global Change Biology
13, 51-66.
Shimizu et al (2007), Diagnóstico das Plantações Florestais em Mato Grosso 2007, Arefloresta,
Cuiabá. Available on: www.arefloresta.com.br
Smith, P., Gregory, P.J., van Vuuren, D., Obersteiner, M., Havlik, P., Rounsevell, M., Woods, J.,
Stehfest, E., Bellarby, J. (2010). Competition for land. Philosophical Transactions of the Royal
Society B 365, 2941-2957.
Strassburg, B. B. N. (2012) "The "Land Neutral Agricultural Expansion Mechanism",
International Institute for Sustainability Working Paper;
Tilman, D., Cassman, K. G., Matson, P. A., Naylor, R. & Polasky, S. (2002) Agricultural sustainability and intensive production practices. Nature 418, 671-677, doi:10.1038/nature01014.

47
Tilman, D., Fargione, J., Wolff, B., D'Antonio, C., Dobson, A., Howarth, R., Schindler, D., Schlesinger, W.H., Simberloff, D., Swackhamer, D. (2001) Forecasting agriculturally driven global environmental change. Science 292, 281-284.
WWF, 2009 Sistematização de dados sobre Boas Práticas Produtivas na Pecuária Bovina de Corte para o Cerrado, Pantanal e Amazônia