
Increased reaction time variability in attention‐deficit ... Biscaldi,1 Andrea Berger,5 Christian...
13
Increased reaction time variability in attention-deficit hyperactivity disorder as a response-related phenomenon: evidence from single-trial event-related potentials Christopher W. N. Saville, 1,2 Bernd Feige, 3 Christian Kluckert, 1 Stephan Bender, 4 Monica Biscaldi, 1 Andrea Berger, 5 Christian Fleischhaker, 1 Klaus Henighausen, 1 and Christoph Klein 1,2 1 Department of Child and Adolescent Psychiatry, Psychotherapy, and Psychosomatics, University of Freiburg, Freiburg, Germany; 2 School of Psychology, Bangor University, Bangor, UK; 3 Department of Psychiatry and Psychotherapy, University of Freiburg; 4 Department of Child and Adolescent Psychiatry, University of Frankfurt, Frankfurt, Germany; 5 Department of Psychology, Ben Gurion University of the Negev, Negev, Israel Background: Increased intra-subject variability (ISV) in reaction times (RTs) is a promising endophenotype for attention-deficit hyperactivity disorder (ADHD) and among the most robust hallmarks of the disorder. ISV has been assumed to represent an attentional deficit, either reflecting lapses in attention or increased neural noise. Here, we use an innovative single-trial event-related potential approach to assess whether the increased ISV associated with ADHD is indeed attributable to attention, or whether it is related to response-related processing. Methods: We measured electroencephalographic responses to working memory oddball tasks in patients with ADHD (N = 20, aged 11.3 1.1) and healthy controls (N = 25, aged 11.7 1.1), and analysed these data with a recently developed method of single-trial event-related potential analysis. Estimates of component latency variability were computed for the stimulus-locked and response-locked forms of the P3b and the lateralised readiness potential (LRP). Results: ADHD patients showed significantly increased ISV in behavioural ISV. This increased ISV was paralleled by an increase in variability in response-locked event-related potential latencies, while variability in stimulus-locked latencies was equivalent between groups. This result held across the P3b and LRP. Latency of all components predicted RTs on a single-trial basis, confirming that all were relevant for speed of processing. Conclusions: These data suggest that the increased ISV found in ADHD could be associated with response-end, rather than stimulus-end processes, in contrast to prevailing conceptions about the endophenotype. This mental chronometric approach may also be useful for exploring whether the existing lack of specificity of ISV to particular psychiatric conditions can be improved upon. Keywords: ADHD, EEG, reaction time, working memory, event-related potential. Introduction Attention-deficit hyperactivity disorder (ADHD) is a highly prevalent condition of childhood, adolescence, and adulthood, characterised by inattention, hyper- activity and impulsivity. While behavioural genetics suggest ADHD is highly heritable (Faraone et al., 2005), success has been limited in identifying aeti- ological pathways. While overt phenotypes appear too distant from the underlying biology to be traced back, it is hoped that intermediate endophenotypes could provide a bridge between clinical symptoms and pathophysiology (Gottesman & Gould, 2003). One candidate endophenotype has increased in- trasubject variability (ISV) of reaction times (Karal- unas, Geurts, Konrad, Bender, & Nigg, 2014; Klein, Wendling, Huettner, Ruder, & Peper, 2006; Kofler et al., 2013). In line with Gottesman and Gould’s criteria, high ISV is found in unaffected siblings of ADHD patients, but cosegregates with ADHD within families (Bidwell, Willcutt, Defries, & Pennington, 2007). ISV is also reliable (Saville, Pawling, et al., 2011) and heritable (Kuntsi et al., 2006). There is a widespread assumption that increased ISV is an attentional deficit, representing lapses in concentration (Spencer et al., 2009; Vaurio, Sim- monds, & Mostofsky, 2009), or increased neural noise (Gilden & Hancock, 2007; Slifkin & Newell, 1998). Attentional lapses are a popular account for the increased ISV in ADHD. Such lapses are supposed to represent brief periods of inattention, during which reaction times (RTs) are slow or absent. Increased variability reflects a greater proportion of delayed RTs (Leth-Steensen, Elbaz, & Douglas, 2000). Weiss- man, Roberts, Visscher and Woldorff (2006) found that lapses were associated with periods of reduced prefrontal activity, although increased ISV has also been linked to increased prefrontal activity (Bell- grove, Hester, & Garavan, 2004), so this may be task-dependent. Also, ISV appears to have a periodic structure (Di Martino et al., 2008; Feige et al., 2013; Yordanova et al., 2011), and has been argued to represent interference from the default mode net- work (Sonuga-Barke & Castellanos, 2007). Conflict of interest statement: See Acknowledgements for disclosures. © 2014 Association for Child and Adolescent Mental Health. Published by John Wiley & Sons Ltd, 9600 Garsington Road, Oxford OX4 2DQ, UK and 350 Main St, Malden, MA 02148, USA Journal of Child Psychology and Psychiatry 56:7 (2015), pp 801–813 doi:10.1111/jcpp.12348
Transcript of Increased reaction time variability in attention‐deficit ... Biscaldi,1 Andrea Berger,5 Christian...

Increased reaction time variability in attention-deficithyperactivity disorder as a response-related
phenomenon: evidence from single-trial event-relatedpotentials
Christopher W. N. Saville,1,2 Bernd Feige,3 Christian Kluckert,1 Stephan Bender,4
Monica Biscaldi,1 Andrea Berger,5 Christian Fleischhaker,1 Klaus Henighausen,1 andChristoph Klein1,2
1Department of Child and Adolescent Psychiatry, Psychotherapy, and Psychosomatics, University of Freiburg,Freiburg, Germany; 2School of Psychology, Bangor University, Bangor, UK; 3Department of Psychiatry and
Psychotherapy, University of Freiburg; 4Department of Child and Adolescent Psychiatry, University of Frankfurt,Frankfurt, Germany; 5Department of Psychology, Ben Gurion University of the Negev, Negev, Israel
Background: Increased intra-subject variability (ISV) in reaction times (RTs) is a promising endophenotype forattention-deficit hyperactivity disorder (ADHD) and among the most robust hallmarks of the disorder. ISV has beenassumed to represent an attentional deficit, either reflecting lapses in attention or increased neural noise. Here, weuse an innovative single-trial event-related potential approach to assess whether the increased ISV associated withADHD is indeed attributable to attention, or whether it is related to response-related processing. Methods: Wemeasured electroencephalographic responses to working memory oddball tasks in patients with ADHD (N = 20, aged11.3 � 1.1) and healthy controls (N = 25, aged 11.7 � 1.1), and analysed these data with a recently developedmethod of single-trial event-related potential analysis. Estimates of component latency variability were computed forthe stimulus-locked and response-locked forms of the P3b and the lateralised readiness potential (LRP). Results:ADHD patients showed significantly increased ISV in behavioural ISV. This increased ISV was paralleled by anincrease in variability in response-locked event-related potential latencies, while variability in stimulus-lockedlatencies was equivalent between groups. This result held across the P3b and LRP. Latency of all componentspredicted RTs on a single-trial basis, confirming that all were relevant for speed of processing. Conclusions: Thesedata suggest that the increased ISV found in ADHD could be associated with response-end, rather than stimulus-endprocesses, in contrast to prevailing conceptions about the endophenotype. This mental chronometric approach mayalso be useful for exploring whether the existing lack of specificity of ISV to particular psychiatric conditions can beimproved upon. Keywords: ADHD, EEG, reaction time, working memory, event-related potential.
IntroductionAttention-deficit hyperactivity disorder (ADHD) is ahighly prevalent condition of childhood, adolescence,and adulthood, characterised by inattention, hyper-activity and impulsivity. While behavioural geneticssuggest ADHD is highly heritable (Faraone et al.,2005), success has been limited in identifying aeti-ological pathways. While overt phenotypes appeartoo distant from the underlying biology to be tracedback, it is hoped that intermediate endophenotypes
could provide a bridge between clinical symptomsand pathophysiology (Gottesman & Gould, 2003).
One candidate endophenotype has increased in-trasubject variability (ISV) of reaction times (Karal-unas, Geurts, Konrad, Bender, & Nigg, 2014; Klein,Wendling, Huettner, Ruder, & Peper, 2006; Kofleret al., 2013). In line with Gottesman and Gould’scriteria, high ISV is found in unaffected siblings ofADHD patients, but cosegregates with ADHD withinfamilies (Bidwell, Willcutt, Defries, & Pennington,
2007). ISV is also reliable (Saville, Pawling, et al.,2011) and heritable (Kuntsi et al., 2006).
There is a widespread assumption that increasedISV is an attentional deficit, representing lapses inconcentration (Spencer et al., 2009; Vaurio, Sim-monds, & Mostofsky, 2009), or increased neuralnoise (Gilden & Hancock, 2007; Slifkin & Newell,1998).
Attentional lapses are a popular account for theincreased ISV in ADHD. Such lapses are supposed torepresent brief periods of inattention, during whichreaction times (RTs) are slow or absent. Increasedvariability reflects a greater proportion of delayedRTs (Leth-Steensen, Elbaz, & Douglas, 2000). Weiss-man, Roberts, Visscher and Woldorff (2006) foundthat lapses were associated with periods of reducedprefrontal activity, although increased ISV has alsobeen linked to increased prefrontal activity (Bell-grove, Hester, & Garavan, 2004), so this may betask-dependent. Also, ISV appears to have a periodicstructure (Di Martino et al., 2008; Feige et al., 2013;Yordanova et al., 2011), and has been argued torepresent interference from the default mode net-work (Sonuga-Barke & Castellanos, 2007).
Conflict of interest statement: See Acknowledgements for
disclosures.
© 2014 Association for Child and Adolescent Mental Health.Published by John Wiley & Sons Ltd, 9600 Garsington Road, Oxford OX4 2DQ, UK and 350 Main St, Malden, MA 02148, USA
Journal of Child Psychology and Psychiatry 56:7 (2015), pp 801–813 doi:10.1111/jcpp.12348

The idea that ISV indexes neural noise comes fromthe modelling (Li, Lindenberger, & Frensch, 2000)and motor control literature (Slifkin & Newell, 1998),and proposes that increased ISV stems from reducedsignal-to-noise ratio in neurocomputation. Catechol-aminergic neuromodulation helps to determine sig-nal-to-noise ratio (Costa et al., 2012; Nandam et al.,2011), with psychostimulant medication reducingISV in ADHD patients (Spencer et al., 2009), andgenetic polymorphisms linked to catecholamineactivity also being associated with ISV (Saville et al.,2014).
RTs in even simple tasks involve a series ofprocesses, including perception, attentional process-ing, motor planning and execution. ISV’s elevation inADHD is thus ambiguous – does it represent addi-tional variability in attentional processing, response-related processes, or both? Identifying the functionallocus of increased ISV would clarify what ISV tells usabout the disorder (Karalunas et al., 2014). Oneapproach to dissect RTs is to use event-relatedpotentials (ERPs) to measure latencies of covertresponses corresponding to these subprocesses. Byassessing whether groups which differ on ISV alsodiffer on variability in covert subprocesses, we caninfer when increased ISV enters processing.
To identify the source of increased behaviouralvariability in ADHD, we measure markers of thelatency of subcomponents of RT on a single-trialbasis. ERPs traditionally require averaging acrosstrials, but some components are measurable inunaveraged trials, allowing us to compute measuresof trial-to-trial variability, analogous to behaviouralISV. This study examines two components: the P3b –thought to reflect attention allocation and decision-making; and the lateralised readiness potential (LRP)– believed to represent motor planning.
P3b latency has long been known to be sensitive tosome, but not all, of the same factors as RTs – aclassical view is that it is more sensitive to factorsaffecting stimulus evaluation than factors affectingresponse preparation and execution (Kutas, McCar-thy, & Donchin, 1977; McCarthy & Donchin, 1981;although see Verleger, Ja�skowski, & Wascher,2005). Recent evidence suggests that the P3b repre-sents a neural decision signal, or its propagation,(O’Connell, Dockree, & Kelly, 2012; Verleger et al.,2005). P3b-like single-trial components have beenshown to be good predictors of RT (Gerson, Parra, &Sajda, 2005; Philiastides & Sajda, 2006), and indi-vidual differences in behavioural ISV are related toindividual differences in P3b latency variability (Sa-ville, Dean, et al., 2011; Saville et al., 2012). Here,we interpret P3b latency as approximating theduration of perceptual and cognitive aspects of anRT.
The lateralised readiness potential (LRP) is ahemispheric asymmetry over motor cortices, thoughtto index when response planning becomes effector-specific, after response-selection has finished and
as motor planning begins (Masaki, Wild-wall, San-gals, & Sommer, 2004). LRP latency has also beenshown to index the timing of decision-making, albeitlagging behind P3b latency (Kelly & O’Connell,2013).
The P3b and LRP are unusual in that they can bemeasured in both stimulus-locked and response-locked forms (Eimer, 1998; Verleger et al., 2005).This allows identification of the functional locus ofan experimental manipulation by computing bothstimulus-locked and response-locked forms of thecomponents. If manipulation only affects latency instimulus-locked trials, this implies an effect onstimulus processing, if response-locked latency ismodulated, this implies an effect on response-plan-ning and/or execution (Eimer, 1998; Verleger, Sch-roll, & Hamker, 2013).
In this study, we extend this approach to thesingle-trial level, to assess whether the increasedvariability in processing latency seen in ADHD isstimulus-related or response-related. By measuringRT, P3b latency and LRP latency in single-trials, wecan localise the point at which increased ISV entersneural processing. Increased stimulus-lockedlatency variability would imply that the increasedISV enters before decision-making and response-planning. If increased ISV is present in response-locked ERPs, this would imply that increased ISVarises due to increased variability in response-plan-ning and execution. If latency variability wereincreased using both time-locking events, that wouldimply a general increase in variability.
MethodsEthical approval was obtained from the ethics committee of theUniversit€atsklinikum Freiburg. Written consent was obtainedfrom participants’ parents and verbal assent was obtainedfrom participants.
Participants
Participants were outpatients of the Department of Child andAdolescent Psychiatry with a diagnosis of ADHD according toDSM-IV criteria, and healthy controls, recruited throughadvertisements in schools or local newspapers. Diagnoseswere routinely obtained by experienced clinical psychologistsand psychiatrists on the basis of Conner’s parent and teacherrating scales, medical files of the treating psychiatrist, andinterviews with the child and accompanying parent about thechild’s patient history. Diagnostic information was comple-mented by video-taped observations of child behaviourobtained in a standardised group session (e.g. structured play,homework and test taking). ADHD was diagnosed if thesesources yielded converging information. The diagnostic inter-view K-SADS-PL was administered to parents and patientsseparately to confirm diagnosis, accomplish subtype classifi-cation, and screen for comorbid disorders. Parents filled in theGerman version of the Child Behaviour Check List (D€opfneret al., 2008).
Control participants’ parents were interviewed by telephoneto verify that controls had no history of psychiatric or neuro-logical problems. Parents also filled out the Child BehaviourCheck List and all controls scored below clinical cut-offs.
© 2014 Association for Child and Adolescent Mental Health.
802 Christopher W. N. Saville et al. J Child Psychol Psychiatr 2015; 56(7): 801–13

Data from N = 27 patients with an ADHD diagnosis andN = 26 healthy controls (all male) were collected, but partici-pants with <20 acceptable oddball EEG trials on any of the fourtasks (see below) were excluded from analysis, leaving 20ADHD participants and 25 controls.
Four patients were categorised as combined type, ninepredominantly inattentive, two predominantly hyperactive/impulsive, and five not otherwise specified (NOS), according tothe K-SADS-PL algorithm. Of the patients who were excludeddue to insufficient clean data, five of the seven were subtypedas combined or hyperactive/impulsive, but these participantsdid not differ in terms of age from the rest of the sample. Attime of study, all but five participants (3 NOS, 2 inattentive)were taking methylphenidate medication, which was inter-rupted for >24 hr before testing. In three participants, ADHDwas accompanied by oppositional defiant disorder (1 com-bined, 1 inattentive and 1 hyperactive).
Patients and controls did not differ significantly in age,scores on Raven’s Standard Progressive Matrices (Raven,1941) or handedness (see Table 1). Participants were notassessed formally for socioeconomic status, but all familieswere middle-class and living in the Freiburg area.
Apparatus and materials
Direct-current EEG was recorded using 63 Ag/AgCl electrodes(Easycap, Germany) in a 10–10 configuration and two infra-orbital electrodes. Recording reference and ground electrodeswere Cz and FPz, respectively. Impedance was reduced to<10 kΩ at all electrodes prior to data collection using AbralytHiCl gel (Easycap, Germany). Data were differentially amplifiedusing two BrainAmp DC amplifiers (0.1 lV resolution, 1 kHzsampling-rate, 250 Hz low-pass filtered), and recorded usingBrainVision Recorder (both Brain Products, Germany). Testingtookplace in a sound-attenuatedFaraday cage and stimuli weredelivered on a 17” VGA monitor with an electrically shieldedpower source, positioned 60 cm from the participant’s head.
Stimuli and procedure
Participants performed four n-back tasks. Twoworkingmemoryloads – a zero-back task (0BT) and a one-back task (1BT), werecrossedwith two stimulus-onset asynchrony (SOA) conditions –jitteredandunjittered. Participants performed twoblocksof 180trials of each load 9 SOA condition. In unjittered blocks, SOAwas 2500 ms, in jittered blocks SOA varied uniformly between2000 and3000 ms. In all tasks, participantswatched a series ofletters and responded to each letter. Participants respondedwith their left hand to oddballs and with their right hand tostandards. In the 0BT, the letter ‘E’ was the oddball and all otherletterswerestandards. In the1BT, if the letteronscreenmatchedtheprevious letter, itwasanoddball, and if not itwasastandard.Oddball probability was 25% in all tasks and participants wereasked to respond as quickly and accurately as possible. Stimuliwere white Arial letters, with visual angle of ~3°, presented for1000 ms on a black background. Stimuli were delivered usingPresentation (Neurobehavioral Systems, Berkeley, CA). Eachtask was preceded by 20 practice trials and task order wascounterbalanced across participants. While participants per-formed the task, one experimenter remained in theFaradaycagewith them, to ensure they remained on-task.
Data analysis
For behavioural data, we computed three statistics: accuracy,median RT (MnRT) and standard deviation of RT (SDRT).Accuracy was the proportion of trials responded to correctly.MnRT was the median RT of correct RTs between 120 msand 1400 ms. SDRT was the standard deviation (SD) of correctRTs between 120 ms and 1400 ms. These measures wereT
able
1Demogra
phic
inform
ationforboth
groups
Age
IQ(SPM
raw
scores)
Handedness
(left-h
anded)
CBCL
Attention
Withdra
wn
Somatic
Anxiety/
Depression
Social
Thought
problems
Rule
breaking
Aggression
Intern
al
Extern
al
Total
Patients
11.3
�1.1
43.1
�5.4
36.28�
3.64
2.61�
2.59
1.56�
1.92
4.5
�4.25
3.72�
2.16
1.00�
2.24
3.55�
3.20
13.72�
8.28
8.33�
7.57
17.27�
11.19
40.06�
25.86
Controls
11.72�
1.1
44.7
�6.1
12.04�
2.05
1.46�
1.50
0.69�
0.79
1.65�
2.31
0.73�
1.04
0.27�
0.53
1.08�
1.52
4.50�
4.18
3.65�
3.64
5.57�
5.33
13.96�
11.30
Comparison
p=.3015
p=.3641
p=.1976
p=.0002
p=.1000
p=.0849
p=.0161
p<.0001
p=.1927
p=.0058
p=.0002
p=.0229
p=.0004
p=.0006
© 2014 Association for Child and Adolescent Mental Health.
doi:10.1111/jcpp.12348 Increased RT variability in ADHD as a response-locked phenomenon 803

calculated separately for each combination of participant,task, SOA condition and trialtype.
ForEEGdata, direct-current corrections, channel saturation,and large movements were excluded by rejecting data whereamplitude ranged >1500 lV or <0.5 lV in any 200 ms window.Infomax independent components analysis (ICA) was then runon 180 s of data starting 120 s into each task, and factorloadings were applied to the whole dataset. Components repre-sentingoculomotor, cardiacorelectromyographicartefactswereremoved before remaining components were back-projected. IfICA failed to yield components that clearly isolated oculomotorartefacts, basedonvisual inspection, itwasretrainedonanotherperiod until such artefacts were well captured. Bad channelswere removed prior to ICA and data rejection, before beingreinterpolated using spherical splines (splines = 4, Legendrepolynomials = 10) after ICA back-projection.
Data were then average-referenced and zero-phase Butter-worth filtered (high-pass = 0.05 Hz, low-pass = 4.00 Hz,24 dB/octave roll-offs). This is a low cut-off frequency for thelow-pass filter, but single-trial EEG has poor signal-to-noiseratio and the P3b and LRP are mainly supported at lowfrequencies. In the case of the P3b specifically, such filtershave been shown to be optimal for single-trial analysis(Smulders, Kenemans, & Kok, 1994).
Stimulus-locked segments were obtained from oddball trialswith a correct response between 120 and 1400 ms poststimu-lus. These segments ranged from 1300 ms prestimulus until1650 ms poststimulus. Segments were manually inspectedand those showing significant residual artefacts were rejected.The period between 600 and 400 ms prestimulus was used tobaseline-correct data, and average ERPs were computed.
The procedure used in Saville, Dean, et al., 2011; Savilleet al., 2012, 2014 was employed for single-trial analysis, withmodifications described below. Average ERPs were concate-nated along the time-axis, before the ERP-PCA toolkit (Dien,2010) was used to run spatial principal components analysis.Based on parallel Scree test, seven factors were extracted andInfomax-rotated (Bell & Sejnowski, 1995). Factor 1 had a P3btopography (see Figure 1), so was used for the P3b henceforth.
P3b analysis
The factor pattern-matrix from factor 1 was applied to unav-eraged baseline-corrected, stimulus-locked segments fromtarget trials. For stimulus-locked P3bs, peaks were identifiedin each trial as the time-point between 250 and 1000 mspoststimulus with maximal amplitude. For response-locked
P3bs, peaks were identified in unaveraged response-lockedsegments, cut from stimulus-locked data to share a baseline,and running from 1000 ms preresponse until 250 ms postre-sponse. Peaks were identified on each trial as the time-pointbetween 500 ms preresponse and 250 ms postresponse withmaximal amplitude.
Single-trial latencies were aggregated into SDs and mediansof P3b latency, separately for stimulus-locked and response-locked P3bs.
LRP analysis
Single-trial latency informationwas obtained for both response-locked and stimulus-locked LRPs from target trials. It wasimpractical to identify LRP onset times in single-trial data, soweused peak latency to measure component timing. As doublesubtraction approaches to LRP measurement (Eimer, 1998)integrate information across trials, we used a single subtractionapproach to obtain single-trial LRP latency estimates.
For response-locked LRPs, time-courses representing elec-trode C3–C4 were computed for unaveraged response-lockedsegments, cut from stimulus-locked data to share a baseline.These response-locked trials ran from 1000 ms preresponseuntil 250 ms postresponse. Negative peaks were identified oneach trial between 500 ms preresponse and 250 ms postre-sponse.
For stimulus-locked LRPs, C4–C3 time-courses were com-puted for unaveraged stimulus-locked trials. Peaks wereidentified between 250 and 1000 ms poststimulus.
Single-trial LRP latencies were aggregated into separateresponse and stimulus-locked measures of SD and median ofLRP.
Standard trials
While the P3b has much higher amplitude in target trials, theLRP should be equally prominent in target and standard trials.We extracted stimulus and response-locked LRPs from stan-dard trials using the same procedure as for target trials andcomputed SDs and medians of latency.
Inferential statistics
As our rationale assumes that our measures represent sub-components of RT, we first verified that all measures werepredictive of RT in single-trials.
Figure 1 Topographies for the seven factors derived from the PCA-Infomax
© 2014 Association for Child and Adolescent Mental Health.
804 Christopher W. N. Saville et al. J Child Psychol Psychiatr 2015; 56(7): 801–13

A linear mixed effects model (Bates, Maechler, & Bolker,2012), predicting RT, with fixed effects of SL-P3B-L (stimulus-locked P3b latency), RL-P3B-L (response-locked P3b latency),SL-LRP (stimulus-locked LRP latency), and RL-LRP (response-locked LRP latency), as well as random intercepts and slopesfor each fixed-effect for each participant, was fitted to the data.To test the model, identical models dropping the fixed effect ofeach component in turn were fitted to the data, and Aikakeinformation criteria and R’s anova() command were used tocompare fits of reduced models to the full model. The randomeffects structure was identical in each model (Barr, Levy,Scheepers, & Tily, 2013).
Factorial ANOVAs (GROUP [patient/control] 9 LOAD[0BT/1BT] 9 SOA[Jittered/Unjittered] 9 TRIALTYPE[Target/Stand-ard]) were run on accuracy MnRT, and SDRT. FactorialANOVAs (GROUP 9 LOAD 9 SOA 9 LOCKING[stimulus-lock-ed, response-locked] 9 COMPONENT[P3b, LRP]) were run onmedians and SDs of all single-trial peak latencies. Finally,factorial ANOVAs (GROUP 9 LOAD 9 SOA 9 LOCKING) wererun for on medians and SDs of latency for LRPs from standardtrials. (See Figures S1 and S2 for more details).
Effect sizes are reported as generalised eta squared (Bak-eman, 2005), with .02, .13, and .26 corresponding to small,medium and large effects respectively.
ResultsBehavioural data
Behavioural data are illustrated in Figure 2 and fullydetailed in Table 2. The accuracy ANOVA showed asignificant effect of GROUP, with higher accuracy incontrols than patients. LOAD was also significant,with lower accuracy on the 1BT than the 0BT.TRIALTYPE was significant, representing higheraccuracy on standards than oddballs, and accuracywas lower on jittered than unjittered tasks. (See
Table S1 for – Full results of the ANOVAs run onbehavioural data).
There was a significant interaction of LOAD 9 TRI-ALTYPE, showing that the effect of TRIALTYPE wasmore pronounced in the 1BT. All other terms werenonsignificant.
The ANOVA for MnRT found slower responses tothe 1BT. There were no effects of GROUP, TRIAL-TYPE or SOA.
Significant GROUP 9 TRIALTYPE and LOAD 9
TRIALTYPE interactions represented increased effectof LOAD in oddballs than standards; and patientsresponding slower to standards than oddballs, butcontrols responding slower to oddballs than stan-dards. All other terms were nonsignificant.
The ANOVA for SDRT showed significant effects ofGROUP, LOAD and TRIALTYPE, reflecting higherSDRT in patients, 1BTs, and targets respectively.(See Table 2 and also Table S2 for – Results of theANOVAs run on behavioural data).
There was a significant LOAD 9 TRIALTYPE inter-action, representing greater effect of TRIALTYPE inthe 1BT than the 0BT. All other terms were nonsig-nificant.
EEG data
Averaged ERPs for the four components are pre-sented in Figure 3 for illustration purposes. Theflatter amplitude distribution of patients’ response-locked ERPs suggests increased latency jitter,1 Theother components appear comparable betweengroups.
Figure 2 Boxplots of all behavioural parameters for both trial types of both working memory tasks. As the only effect of SOA was a smallreduction in accuracy in jittered tasks, and this did not interact with any other variables, we collapsed across SOA conditions in theboxplots to aid readability
© 2014 Association for Child and Adolescent Mental Health.
doi:10.1111/jcpp.12348 Increased RT variability in ADHD as a response-locked phenomenon 805

Linear mixed effects analysis
Model fits revealed all components predicted RT insingle-trials. (SL-P3B-L: b = .2688, rb = .0364,t = 7.386; RL-P3B-L: b = �.3554, rb = .0306,t = �11.627; SL-LRP: b = .1074, rb = .0233,t = 4.606; RL-LRP b = �.0778, rb = .0231,t = �3.375). Longer latencies predicted longer RTs;prestimulus response-locked latencies are coded asnegative so the extent to which response-lockedLRPs preceded RT was positively associated withthe length of RTs. As both ERP latencies and RTs areexpressed in milliseconds, b-values can be inter-preted similar to R2 values.
The full model (AIC = 13,025.0) outperformed null(AIC = 130,350.4), no SL-P3B-L (AIC = 130,286.7),no RL-P3B-L (AIC = 130,309.4), no SL-LRP:(AIC = 130,264.5), and no RL-LRP (AIC = 130,257.3)models, (ps < .001), confirming all components con-tributed explanatory power.
Target trials
Probability density plots showing distributions ofsingle-trial latencies for stimulus and response-locked P3b and LRP latencies, and RTs, for bothgroups appear below in Figure 4. Stimulus-lockeddistributions for the two groups are almost identi-cal but the ADHD response-locked and RT distri-butions appear broader and flatter than controls(Figure 5).
Results from the ANOVA for SD of latency in target
trials appear in Table 3. It revealed a significantGROUP 9 LOCKING interaction, representing aneffect of GROUP in response-locked (F1,43 = 14.614,p = .0004, g2G = .1063), but not stimulus-lockedlatencies (F1,43 = .644, p = .4265, g2G = .0047). Thiseffect was stronger in unjittered (F1,43 = 20.406,
Figure 3 Average ERPs for stimulus-locked and response-locked P3bs and LRPs. P3b time-courses represent factor 1 of Infomax PCA, LRPtime-courses represent C4–C3 subtraction. As P3b waveform represents a sum of electrodes, weighted by loading on factor 1 of PCA,polarity is arbitrary and magnitude of scale is not in proportion to LRP waveforms
Table 2 Results of the ANOVAs run on behavioural data.Interaction terms with a p > .4 are omitted to save space, butcan be found in Table S1
Factor F1,43 p g2G
AccuracyGROUP 7.655 .0083 .1014LOAD 53.401 <.0001 .0643TRIALTYPE 265.569 <.0001 .4428SOA 5.274 .0266 .0045GROUP 9 LOAD 2.906 .0954 .0037GROUP 9 TRIALTYPE 4.017 .0514 .0119LOAD 9 TRIALTYPE 59.805 <.0001 .0438TRIALTYPE 9 SOA 2.596 .1145 .0012GROUP 9 LOAD 9
TRIALTYPE1.551 .2197 .0012
GROUP 9 LOAD 9 SOA 3.038 .0885 .0046LOAD 9 TRIALTYPE 9 SOA 1.087 .3030 .0007GROUP 9 LOAD 9
TRIALTYPE 9 SOA1.307 .2592 .0008
MnRTGROUP 0.088 .7684 .0017LOAD 7.163 .0105 .0075TRIALTYPE 2.210 .1444 .0021SOA 0.057 .8123 <.0001GROUP 9 LOAD 0.758 .3887 .0008GROUP 9 TRIALTYPE 5.602 .0225 .0053GROUP 9 TRIALTYPE 9
SOA1.281 .2639 .0002
LOAD 9 TRIALTYPE 9
SOA0.823 .3693 .0002
GROUP 9 LOAD 9
TRIALTYPE 9 SOA2.833 .0996 .0007
SDRTGROUP 8.952 .0046 .1197LOAD 14.067 .0005 .0290TRIALTYPE 4.501 .0397 .0067SOA 0.544 .4649 .0006LOAD 9 TRIALTYPE 12.663 .0009 .0110GROUP 9 LOAD 9 SOA 1.938 .1711 .0034GROUP 9 LOAD 9
TRIALTYPE 9 SOA0.823 .3693 .0003
© 2014 Association for Child and Adolescent Mental Health.
806 Christopher W. N. Saville et al. J Child Psychol Psychiatr 2015; 56(7): 801–13

p < .0001, g2G = .0279) than jittered blocks(F1,43 = 6.229, p = .0165, g2G = .0086), representedby a significant GROUP 9 SOA 9 LOCKING interac-tion.
We also observed significantly greater latencyvariability in patients than controls (GROUP), inthe 1BT than the 0BT (LOAD), and in LRP than P3b(COMPONENT). In the 0BT, P3bs were less variable
Figure 4 Probability density plots for RT distributions. Density functions are based on taking group means of 21 evenly spaced quantilesof each latency, and computing a density function with an 80 ms wide Gaussian smoothing kernel from these averaged quantiles
Figure 6 Stimulus and response-locked standard deviations and medians of P3b latency to targets for both groups on both loads
Figure 5 Probability density plots for all single-trial ERP latency distributions. Density functions are based on taking group means of 21evenly spaced quantiles of each latency, and computing a density function with an 80 ms wide Gaussian smoothing kernel from theseaveraged quantiles
© 2014 Association for Child and Adolescent Mental Health.
doi:10.1111/jcpp.12348 Increased RT variability in ADHD as a response-locked phenomenon 807

in response-locked than stimulus-locked trials,while the pattern was reversed for the LRP(F1,43 = 8.800, p = .0049, g2G = .0153), while therewas no such interaction in the 1BT (F1,43 = .063,p = .8034, g2G = .0006), manifesting as aLOAD 9 LOCKING 9 COMPONENT interaction. Allother terms were non-significant.
Results from the ANOVA for median latency intarget trials can be seen in Table 3.2 The significantLOAD 9 LOCKING 9 COMPONENT interaction rep-resented earlier P3b latency than LRP latency instimulus-locked trials (F1,43 = 21.500, p < .0001,g2G = .1299), but similar latencies in response-lockedtrials (F1,43 = 2.202, p = .1451, g2G = .0165), aninteraction present in the 0BT (F1,43 = 26.631,p < .0001, g2G = .0348), but not the 1BT (F1,43 =2.589, p = .1149, g2G = .0068). The associatedlower order effects of LOCKING 9 COMPONENT,LOAD 9 COMPONENT, LOCKING, and COMPO-NENT were also significant, no other effects reachedsignificance (Figures 6 and 7).
Standard trials
Results of the ANOVA on SD of LRP latencies tostandard trials revealed an effect of LOCKING, withhigher variability in response-locked trials(F1,43 = 8.397, p = .0059, g2G = .0289). All otherterms were nonsignificant.
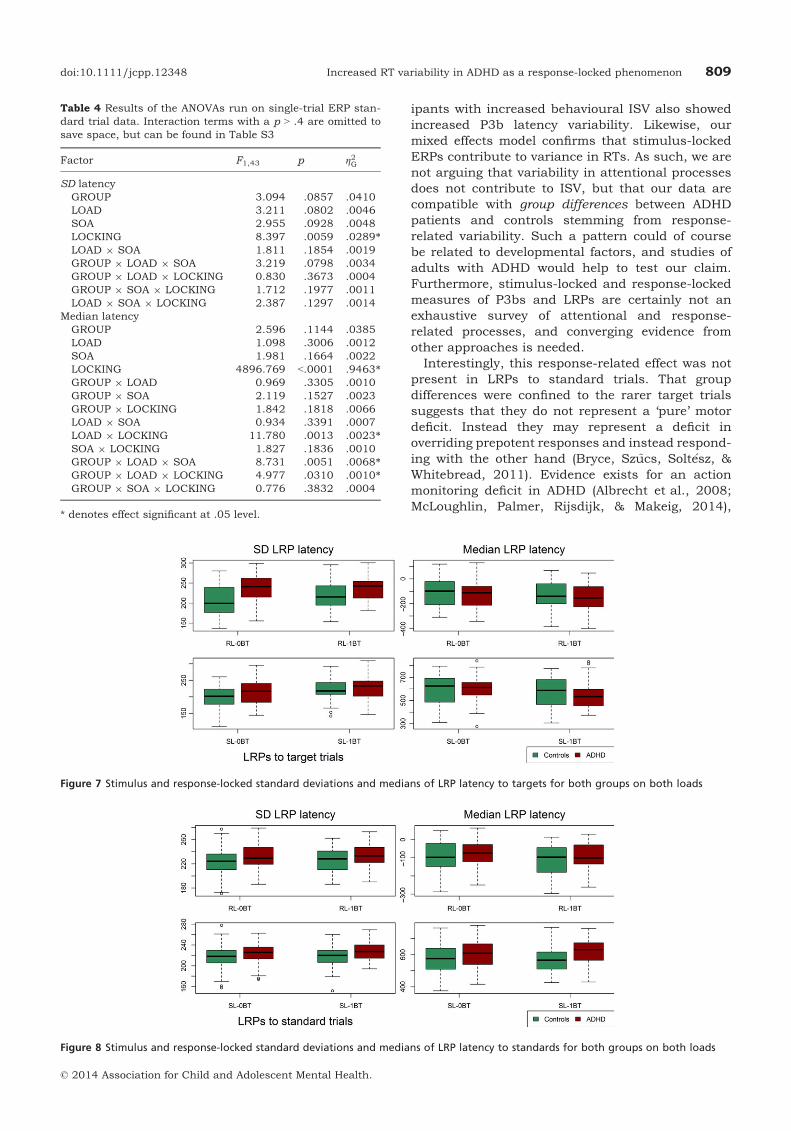
The ANOVA for median latencies of LRPs to stan-dard trials found a GROUP 9 LOAD 9 SOA interac-tion, representing longer latencies in the jitteredblocks, but only in patients (F1,43 = 6.170,p = .0170, g2G = .0154) in the 0BT (F1,43 = 7.579,p = .0126, g2G = .0415), not in the 1BT (F1,43 = .101,p = .7536, g2G = .0003) Table 4 (Figure 8).
DiscussionWe identified increased behavioural ISV in ADHDpatients compared to healthy controls, and func-tionally localised these differences to variability inresponse-locked ERP latencies. Stimulus-lockedERP latency variability was equivalent betweengroups. Our data suggest that increased behaviouralISV in ADHD reflects a deficit in response-process-ing, not an attentional deficit.
Our data appear incompatible with the lapsemodel of increased ISV in ADHD. If attentionallapses underpinned group differences, one wouldexpect stimulus-locked ERP variability to differbetween groups, reflecting delayed attentional pro-cessing, instead we find specific deficits in response-locked processing in patients, similar to recentfindings in Parkinson’s Disease (Verleger et al.,2013). This is supported by our behavioural data,which show no interaction of group with workingmemory load, an effect which would be expected ifattentional factors explained group differences inISV. This result is surprising in the context of lapseand neural noise models of ISV, but neuromotorcontrol has long been known to be abnormal inADHD patients (Moll, Heinrich, & Rothenberger,2002; Rothenberger, 1995; Yordanova, Dumais-Hu-ber, Rothenberger, & Woerner, 1997).
Previous work in healthy adults (Saville, Dean,et al., 2011; Saville et al., 2012) found that partic-
Table 3 Results of the ANOVAs run on single-trial ERP oddballtrial data. Interaction terms with a p > .4 are omitted to savespace, but can be found in Table S2
Factor F1,43 p g2G
SD latencyGROUP 6.167 .0170 .0392*LOAD 28.941 .0000 .0348*SOA 6.181 .0169 .0041*LOCKING 1.815 .1850 .0020COMPONENT 35.525 .0000 .1688*GROUP 9 SOA 0.953 .3343 .0006GROUP 9 LOCKING 15.499 .0003 .0168*LOAD 9 LOCKING 1.217 .2761 .0007SOA 9 LOCKING 1.906 .1745 .0006LOAD 9 COMPONENT 1.885 .1769 .0015SOA 9 COMPONENT 0.807 .3741 .0006LOCKING 9 COMPONENT 2.445 .1253 .0046GROUP 9 LOAD 9 SOA 2.175 .1476 .0024GROUP 9 SOA 9 LOCKING 4.745 .0349 .0014*GROUP 9 LOAD 9
COMPONENT2.183 .1469 .0018
LOAD 9 SOA 9 LOCKING 0.945 .3364 .0005LOAD 9 LOCKING 9
COMPONENT6.404 .0151 .0030*
SOA 9 LOCKING 9
COMPONENT8.518 .0056 .0022*
GROUP 9 LOAD 9
LOCKING 9 COMPONENT1.384 .2459 .0006
GROUP 9 LOAD 9 SOA 9
LOCKING 9 COMPONENT0.992 .3249 .0005
Median latencyGROUP 0.765 .3866 .0041LOAD 0.011 .9151 .0000SOA 3.078 .0865 .0021LOCKING 3162.287 .0000 .9147*COMPONENT 12.108 .0012 .0635*GROUP 9 SOA 1.113 .2974 .0008GROUP 9 COMPONENT 2.060 .1584 .0114LOAD 9 SOA 3.561 .0659 .0033LOAD 9 LOCKING 1.239 .2718 .0005SOA 9 LOCKING 1.457 .2339 .0006LOAD 9 COMPONENT 13.888 .0006 .0146*SOA 9 COMPONENT 2.430 .1264 .0016LOCKING 9 COMPONENT 10.737 .0021 .0175*GROUP 9 LOAD 9 SOA 2.704 .1074 .0025GROUP 9 LOAD 9 LOCKING 0.799 .3765 .0003GROUP 9 LOAD 9
COMPONENT1.225 .2745 .0013
LOAD 9 SOA 9 LOCKING 0.988 .3258 .0004LOAD 9 SOA 9 COMPONENT 1.704 .1987 .0012LOAD 9 LOCKING 9
COMPONENT5.350 .0256 .0022*
GROUP 9 LOAD 9 SOA 9
COMPONENT3.036 .0886 .0022
GROUP 9 LOAD 9
LOCKING 9 COMPONENT2.286 .1378 .0009
LOAD 9 SOA 9 LOCKING 9
COMPONENT2.071 .1574 .0007
* denotes effect significant at .05 level.
© 2014 Association for Child and Adolescent Mental Health.
808 Christopher W. N. Saville et al. J Child Psychol Psychiatr 2015; 56(7): 801–13
ipants with increased behavioural ISV also showedincreased P3b latency variability. Likewise, ourmixed effects model confirms that stimulus-lockedERPs contribute to variance in RTs. As such, we arenot arguing that variability in attentional processesdoes not contribute to ISV, but that our data arecompatible with group differences between ADHDpatients and controls stemming from response-related variability. Such a pattern could of coursebe related to developmental factors, and studies ofadults with ADHD would help to test our claim.Furthermore, stimulus-locked and response-lockedmeasures of P3bs and LRPs are certainly not anexhaustive survey of attentional and response-related processes, and converging evidence fromother approaches is needed.
Interestingly, this response-related effect was notpresent in LRPs to standard trials. That groupdifferences were confined to the rarer target trialssuggests that they do not represent a ‘pure’ motordeficit. Instead they may represent a deficit inoverriding prepotent responses and instead respond-ing with the other hand (Bryce, Sz~ucs, Solt�esz, &Whitebread, 2011). Evidence exists for an actionmonitoring deficit in ADHD (Albrecht et al., 2008;McLoughlin, Palmer, Rijsdijk, & Makeig, 2014),
Table 4 Results of the ANOVAs run on single-trial ERP stan-dard trial data. Interaction terms with a p > .4 are omitted tosave space, but can be found in Table S3
Factor F1,43 p g2G
SD latencyGROUP 3.094 .0857 .0410LOAD 3.211 .0802 .0046SOA 2.955 .0928 .0048LOCKING 8.397 .0059 .0289*LOAD 9 SOA 1.811 .1854 .0019GROUP 9 LOAD 9 SOA 3.219 .0798 .0034GROUP 9 LOAD 9 LOCKING 0.830 .3673 .0004GROUP 9 SOA 9 LOCKING 1.712 .1977 .0011LOAD 9 SOA 9 LOCKING 2.387 .1297 .0014
Median latencyGROUP 2.596 .1144 .0385LOAD 1.098 .3006 .0012SOA 1.981 .1664 .0022LOCKING 4896.769 <.0001 .9463*GROUP 9 LOAD 0.969 .3305 .0010GROUP 9 SOA 2.119 .1527 .0023GROUP 9 LOCKING 1.842 .1818 .0066LOAD 9 SOA 0.934 .3391 .0007LOAD 9 LOCKING 11.780 .0013 .0023*SOA 9 LOCKING 1.827 .1836 .0010GROUP 9 LOAD 9 SOA 8.731 .0051 .0068*GROUP 9 LOAD 9 LOCKING 4.977 .0310 .0010*GROUP 9 SOA 9 LOCKING 0.776 .3832 .0004
* denotes effect significant at .05 level.
Figure 8 Stimulus and response-locked standard deviations and medians of LRP latency to standards for both groups on both loads
Figure 7 Stimulus and response-locked standard deviations and medians of LRP latency to targets for both groups on both loads
© 2014 Association for Child and Adolescent Mental Health.
doi:10.1111/jcpp.12348 Increased RT variability in ADHD as a response-locked phenomenon 809

longer force onset to peak force duration in fingermovements (Steger et al., 2001), differences betweenpatients and controls in motor cortex excitabilityduring response preparation (Heinrich, Hoegl, Moll,& Kratz, 2014), poorer resolution of interhemispher-ic competition between motor cortices (Banaschew-ski et al., 2008; Buchmann et al., 2003; Moll et al.,2002), and differences in brain structures associatedwith motor planning and execution, such as thebasal ganglia (Qiu et al., 2009) and cerebellum(Mulder et al., 2008).
However, while LRP variability was increased inoddball trials but not standards, behavioural ISVwas elevated in both trial types. One possibility isthat that the patients’ elevated ISV in oddball trials isdue to the aforementioned problems with remappingresponses, whereas the behavioural ISV in standardtrials is elevated for reasons unrelated to the pro-cesses reflected in the LRP. It is worth pointing outthat, in the analysis of LRPs to standard trials, whilethe GROUP 9 LOCKING interaction was clearly non-significant (p = .9228), the main effect of GROUPapproached significance (p = .0857), which would bein line with this suggestion. To clarify this issue,further studies which manipulate response proba-bility and response-compatibility are needed. (SeeTable S2 for – Full results of the ANOVAs run onsingle-trial ERP oddball trial data).
The elevation of ISV in many disorders suggeststhat ISV is a sensitive rather than a specific markerof dysfunction. This lack of specificity has been alimitation – ISV is a dog that barks all of the time.The present data, however, offer hope that whileincreased behavioural ISV is shared by severalconditions, the underlying determinants of ISV mayvary, and finer-grained measures, such as single-trial variability in the P3b and LRP, may elucidatethese differences.
Our study had several limitations. Firstly, ourtask was not ideal for separating sources ofresponse-related variability. Future studies couldvary motor complexity, response-conflict, andresponse-probability to better characterise the var-iability increase.
Secondly, a measure of LRP onset would be moreappropriate than LRP peak latency to identify thepoint at which response hand was chosen. However,as measuring onset latency is already difficult inaverage ERP data (Mordkoff & Gianaros, 2000), thiswas impractical in single-trial data. We experi-mented with the use of the first derivative of ampli-tude as a possible means to identify LRP onset, butwhile this showed strong group differences, ourmixed effects analysis suggested that it did notreliably predict RT, which was key for our analysis.We hope further advances in LRP detection will allowthese compromises to be improved upon in futurestudies (Stahl, Gibbons, & Miller, 2010).
Thirdly, our peak-picking windows extended afterRT. While this appears questionable, given that we
assume that these ERPs represent subprocesses ofthe RT, Figure 4 shows that response-locked latencydistributions would be severely truncated by exclud-ing post-RT latencies in response-locked data. Thiswould cause biased estimates of the latency distri-bution parameters. Likewise, excluding postre-sponse stimulus-locked latencies would confoundpeak-picking window with behavioural ISV, leadingto dependencies between our dependent variables.Instead we assume that our component peaks rep-resent proxies of more elusive neural processes thatfor technical or biological reasons are more reliablymeasured than the underlying processes them-selves.
Fourthly, beyond the above issues, it is difficultto identify appropriate windows for peak-picking insingle-trial data. While in averaged ERPs, it is clearhow changing peak-picking windows will changeresults, in single-trial analyses it is less obvious.We believe our latency density plots (Figure 4)suggest that our windows were a good fit for theunderlying latency distributions, but further workis necessary to explore this problem in single-trialresearch.
Finally, it is important to acknowledge that ourresults do not agree with all findings in the literature.Previous studies have identified differences betweenADHD patients and controls in stimulus-lockedmeasures of EEG variability (Lazzaro et al., 1997;McLoughlin et al., 2014; Myatchin, Lemiere, Dan-ckaerts, & Lagae, 2012; Steger, Imhof, Steinhausen,& Brandeis, 2000). These differences may resultfrom the substantial methodological differencesbetween studies, our study being the first explicitlycontrasting stimulus and response-locked measuresof latency variability in ERP components, but clearlythese heterogeneous findings require further inves-tigation.
Despite these limitations, we feel that our resultsare interesting and warrant further investigation.Our study demonstrates the advantages of sin-gle-trial analysis for investigating ISV, and ADHDmore broadly. Future work should use tasks whichmore precisely characterise the response-relatedprocesses which underpin increased behaviouralISV. Work is also needed to reconcile this findingwith the literature on periodic oscillations in RT(Feige et al., 2013; Yordanova et al., 2011), whichhas been hitherto assumed to be attentional innature. Nonwhite temporal RT structure couldreflect fluctuations in motor readiness, in additionto attentional fluctuations, and further work isneeded to assess whether the increased variabilitywe identified in response-related processing is thesame variability measured by studies examiningtemporal RT structure.
To conclude, we replicate increased ISV in ADHD,and show for the first time that this reflects anincrease in response-locked ERP latency variability,but not stimulus-locked ERP latency variability. We
© 2014 Association for Child and Adolescent Mental Health.
810 Christopher W. N. Saville et al. J Child Psychol Psychiatr 2015; 56(7): 801–13

believe this implies that increased behavioural ISV inADHD is due to response-related processes, incontract to the attentional lapse model. We suggestour approach may be helpful for improving specific-ity of ISV-based measures to particular neuropsy-chiatric conditions, while maintaining theirsensitivity.
Supporting informationAdditional Supporting Information may be found in theonline version of this article:
Table S1. Full results of the ANOVAs run on behavio-ural data.Table S2. Full results of the ANOVAs run on single-trialERP oddball trial data.Table S3. Full results of the ANOVAs run on single-trialERP standard trial data.Figure S1. Average ERPs for jittered stimulus-lockedand response-locked P3bs and LRPs.Figure S2. Average ERPs for unjittered stimulus-lockedand response-locked P3bs and LRPs.
AcknowledgementsAuthor C.F. received grants from Novartis, Shire,Pascoe, Bristol-Meyers-Squibb and Otsuka. All otherauthors declare that they have no potential or compet-ing conflicts of interests. Alternative analyses ofbehavioural data presented here were published previ-ously in Feige et al. (2013). The authors thank fouranonymous reviewers for their constructive andinsightful comments on earlier forms of this manu-script.
CorrespondenceChristoph Klein, Department of Child and AdolescentPsychiatry, Psychotherapy, and Psychosomatics, Uni-versity of Freiburg, Hauptstrasse 8, D–79104 Freiburg,Germany; Email: [email protected]
Key points
• Children with a diagnosis of ADHD show increased variability of P3b and LRP latencies compared to healthycontrols, but only relative to responses.
• Stimulus-locked P3b and LRP latency variability is comparable between groups.
• These single-trial ERP latencies predict RTs on a trial-by-trial basis in both groups.
Notes
1. To confirm that this apparent reduction was dueto latency jitter, rather than an amplitude differencebetween groups, we ran a GROUP 9 LOAD 9 SOAANOVA on median amplitude of single-trial LRPs.The nonsignificant effect of GROUP (F1,43 = .387,p = .5371, g2G = .0072) suggested that this appar-ent reduction was indeed an artefact of latency jitter.2. It should be noted that many of the g2G values forthe median latency analyses appear low due to thehigh proportion of the variance explained by LOCK-ING, leading to little residual variance to beexplained by other factors.
ReferencesAlbrecht, B., Brandeis, D., Uebel, H., Heinrich, H., Mueller,
U.C., Hasselhorn, M., . . . & Banaschewski, T. (2008). Actionmonitoring in boys with attention-deficit/hyperactivitydisorder, their nonaffected siblings, and normal controlsubjects: Evidence for an endophenotype. BiologicalPsychiatry, 64, 615–625.
Bakeman, R. (2005). Recommended effect size statistics forrepeated measures designs. Behavior Research Methods, 37,379–384.
Banaschewski, T., Yordanova, J., Kolev, V., Heinrich, H.,Albrecht, B., & Rothenberger, A. (2008). Stimulus context
and motor preparation in attention-deficit/hyperactivitydisorder. Biological Psychology, 77, 53–62.
Barr, D., Levy, R., Scheepers, C., & Tily, H. (2013). Randomeffects structure for confirmatory hypothesis testing: Keep itmaximal. Journal of Memory and Language, 68, 255–278.
Bates, D., Maechler, M., & Bolker, B. (2012). lme4: Mixed-effects modeling with R.
Bell, A.J., & Sejnowski, T.J. (1995). An information-maximization approach to blind separation and blinddeconvolution. Neural Computation, 7, 1129–1159.
Bellgrove, M.A., Hester, R., & Garavan, H. (2004). Thefunctional neuroanatomical correlates of responsevariability: Evidence from a response inhibition task.Neuropsychologia, 42, 1910–1916.
Bidwell, L.C., Willcutt, E.G., Defries, J.C., & Pennington, B.F.(2007). Testing for neuropsychological endophenotypes insiblings discordant for attention-deficit/hyperactivity dis-order. Biological Psychiatry, 62, 991–998.
Bryce, D., Sz~ucs, D., Solt�esz, F., & Whitebread, D. (2011). Thedevelopment of inhibitory control: An averaged and single-trial Lateralized Readiness Potential study. NeuroImage, 57,671–685.
Buchmann, J., Wolters, A., Haessler, F., Bohne, S., Nordbeck,R., & Kunesch, E. (2003). Disturbed transcallosallymediated motor inhibition in children with attention deficithyperactivity disorder (ADHD). Clinical Neurophysiology,114, 2036–2042.
Costa, A., Riedel, M., Pogarell, O., Menzel-Zelnitschek, F.,Schwarz, M., Reiser, M., . . . & Ettinger, U. (2012). Methyl-phenidate effects on neural activity during responseinhibition in healthy humans. Cerebral Cortex, 23, 1179–1189.
© 2014 Association for Child and Adolescent Mental Health.
doi:10.1111/jcpp.12348 Increased RT variability in ADHD as a response-locked phenomenon 811

Di Martino, A., Ghaffari, M., Curchack, J., Reiss, P., Hyde,C., Vannucci, M., . . . & Castellanos, F.X. (2008).Decomposing intra-subject variability in children withattention-deficit/hyperactivity disorder. Biological Psychia-try, 64, 607–614.
Dien, J. (2010). The ERP PCA Toolkit: An open source programfor advanced statistical analysis of event-related potentialdata. Journal of Neuroscience Methods, 187, 138–145.
D€opfner,M.,Plueck,J.,Boelte,S.,Lenz,K.,Melchers,P.,&Heim,K. (2008). CBCL/4-18 Elternfragebogen €uber das Verhaltenvon Kindern und Jugendlichen. K€oln: Arbeitsgruppe Kinder-,judged- und Familiendiagnostik (KJFD).
Eimer, M. (1998). The lateralized readiness potential as an on-line measure of central response activation processes.Behavior Research Methods, Instruments, & Computers, 30,146–156.
Faraone,S.V.,Perlis,R.H.,Doyle,A.E.,Smoller,J.W.,Goralnick,J.J.,Holmgren,M.A.,&Sklar, P. (2005).Molecular genetics ofattention-deficit/hyperactivity disorder. Biological Psychia-try, 57, 1313–1323.
Feige, B., Biscaldi, M., Saville, C.W.N., Kluckert, C., Bender,S., Ebner-Priemer, U., . . . & Klein, C. (2013). On the temporalcharacteristics of performance variability in attention deficithyperactivity disorder (ADHD). PLoS One, 8, e69674.
Gerson, A.D., Parra, L.C., & Sajda, P. (2005). Cortical origins ofresponse time variability during rapid discrimination ofvisual objects. NeuroImage, 28, 342–353.
Gilden, D.L., & Hancock, H. (2007). Response variability inattention-deficit disorders. Psychological Science, 18, 796–802.
Gottesman, I., & Gould, T. (2003). The endophenotype conceptin psychiatry: Etymology and strategic intentions. AmericanJournal of Psychiatry, 160, 636–645.
Heinrich, H., Hoegl, T., Moll, G.H., & Kratz, O. (2014).A bimodal neurophysiological study of motor control inattention-deficit hyperactivity disorder: A step towards coremechanisms? Brain, 137, 1156–1166.
Karalunas, S.L., Geurts, H.M., Konrad, K., Bender, S., & Nigg,J.T. (2014). Annual Research Review: Reaction timevariability in ADHD and autism spectrum disorders:Measurement and mechanisms of a proposed trans-diagnostic phenotype. Journal of Child Psychology andPsychiatry, 66, 685–710.
Kelly, S.P., & O’Connell, R.G. (2013). Internal and externalinfluences on the rate of sensory evidence accumulation inthe human brain. Journal of Neuroscience, 33, 19434–19441.
Klein, C., Wendling, K., Huettner, P., Ruder, H., & Peper, M.(2006). Intra-subject variability in attention-deficit hyper-activity disorder. Biological Psychiatry, 60, 1088–1097.
Kofler, M.J., Rapport, M.D., Sarver, D.E., Raiker, J.S., Orban,S.A., Friedman, L.M., & Kolomeyer, E.G. (2013). Reactiontime variability in ADHD: A meta-analytic review of 319studies. Clinical Psychology Review, 33, 795–811.
Kuntsi, J., Rogers, H., Swinard, G., B€orger, N., van der Meere,J., Rijsdijk, F., & Asherson, P. (2006). Reaction time,inhibition, working memory and “delay aversion”performance: Genetic influences and their interpretation.Psychological Medicine, 36, 1613–1624.
Kutas, M., McCarthy, G., & Donchin, E. (1977). Augmentingmental chronometry: The P300 as a measure of stimulusevaluation time. Science, 197, 792–795.
Lazzaro, I., Anderson, J., Gordon, E., Clarke, S., Leong, J., &Meares, R. (1997). Single trial variability within the P300(250–500 ms) processing window in adolescents withattention deficit hyperactivity disorder. Psychiatry Research,73, 91–101.
Leth-Steensen, C., Elbaz, Z.K., & Douglas, V.I. (2000). Meanresponse times, variability, and skew in the responding ofADHD children: A response time distributional approach.Acta Psychologica, 104, 167–190.
Li, S., Lindenberger, U., & Frensch, P. (2000). Unifyingcognitive aging: From neuromodulation to representationto cognition. Neurocomputing, 33, 879–890.
Masaki, H., Wild-wall, N., Sangals, J., & Sommer, W. (2004).The functional locus of the lateralized readiness potential.Psychophysiology, 41, 220–230.
McCarthy, G., & Donchin, E. (1981). A metric for thought:A comparison of P300 latency and reaction time. Science,211, 77–80.
McLoughlin, G., Palmer, J.A., Rijsdijk, F., & Makeig, S. (2014).Genetic overlap between evoked frontocentral theta-bandphase variability, reaction time variability, and attention-deficit/hyperactivity disorder symptoms in a twin study.Biological Psychiatry, 75, 238–247.
Moll, G., Heinrich, H., & Rothenberger, A. (2002). Transcranialmagnetic stimulation in child psychiatry: Disturbed motorsystem excitability in hypermotoric syndromes. Develop-mental Science, 3, 381–391.
Mordkoff, J.T., & Gianaros, P.J. (2000). Detecting the onset ofthe lateralized readiness potential: A comparison of availablemethods and procedures. Psychophysiology, 37, 347–360.
Mulder, M.J., Baeyens, D., Davidson, M.C., Casey, B.J., vandenBan, E., van Engeland, H., &Durston, S. (2008). Familialvulnerability to ADHD affects activity in the cerebellum inaddition to the prefrontal systems. Journal of the AmericanAcademy of Child and Adolescent Psychiatry, 47, 68–75.
Myatchin, I., Lemiere, J., Danckaerts, M., & Lagae, L. (2012).Within-subject variability during spatial working memory inchildren with ADHD: An event-related potentials study.European Child & Adolescent Psychiatry, 21, 199–210.
Nandam, L.S., Hester, R., Wagner, J., Cummins, T.D.R.,Garner, K., Dean, A.J., . . . & Bellgrove, M.A. (2011).Methylphenidate but not atomoxetine or citaloprammodulates inhibitory control and response time variability.Biological Psychiatry, 69, 902–904.
O’Connell, R.G., Dockree, P.M., & Kelly, S.P. (2012).A supramodal accumulation-to-bound signal thatdetermines perceptual decisions in humans. NatureNeuroscience, 15, 1729–1735.
Philiastides, M.G., & Sajda, P. (2006). Temporalcharacterization of the neural correlates of perceptualdecision making in the human brain. Cerebral Cortex, 16,509–518.
Qiu, A., Crocetti, D., Adler, M., Mahone, M., Denckla, M.B.,Miller, M.I., & Mostofsky, S.H. (2009). Basal gangliavolume and shape in children with attention deficithyperactivity disorder. American Journal of Psychiatry,166, 74–82.
Raven, J.C. (1941). Standardization of progressive matrices.British Journal of Medical Psychology, 19, 137–150.
Rothenberger, A. (1995). Electrical brain activity in childrenwith hyperkinetic hyperkinetic syndrome: Evidence of afrontal cortical dysfunction. In J. Sergeant (Ed.), EuropeanApproaches to Hyperkinetic Disorder (pp. 255–270). Zurich:Trumpi.
Saville, C.W.N., Dean, R.O., Daley, D., Intriligator, J.,Boehm, S., Feige, B., & Klein, C. (2011). Electrocorticalcorrelates of intra-subject variability in reaction times:Average and single-trial analyses. Biological Psychology,87, 74–83.
Saville, C.W.N., Lancaster, T.M., Stefanou, M.E., Salunkhe, G.,Lourmpa, I., Nadkarni, A., . . . & Klein, C. (2014). COMT Val(158)Met genotype is associated with fluctuations in workingmemory performance: Converging evidence frombehavioural and single-trial P3b measures. NeuroImage,100, 489–497.
Saville, C.W.N., Pawling, R., Trullinger, M., Daley, D.,Intriligator, J., & Klein, C. (2011). On the stability ofinstability: Optimising the reliability of intra-subjectvariability of reaction times. Personality and IndividualDifferences, 51, 148–153.
© 2014 Association for Child and Adolescent Mental Health.
812 Christopher W. N. Saville et al. J Child Psychol Psychiatr 2015; 56(7): 801–13

Saville, C.W.N., Shikhare, S., Iyengar, S., Daley, D., Intriligator,J., Boehm, S.G., . . . & Klein, C. (2012). Is reaction timevariability consistent across sensory modalities? Insightsfrom latent variable analysis of single-trial P3b latencies.Biological Psychology, 91, 275–282.
Slifkin, A.B., & Newell, K.M. (1998). Is variability in humanperformance a reflection of system noise? Current Directionsin Psychological Science, 7, 170–177.
Smulders, F.T., Kenemans, J.L.,&Kok, A. (1994). A comparisonof differentmethods for estimating single-trial P300 latencies.Electroencephalography and Clinical Neurophysiology, 92,107–114.
Sonuga-Barke, E.J.S., &Castellanos, F.X. (2007). Spontaneousattentional fluctuations in impaired states and pathologicalconditions: A neurobiological hypothesis. Neuroscience andBiobehavioral Reviews, 31, 977–986.
Spencer, S.V., Hawk, L.W., Richards, J.B., Shiels, K., Pelham,W.E., & Waxmonsky, J.G. (2009). Stimulant treatmentreduces lapses in attention among children with ADHD:The effects of methylphenidate on intra-individual responsetime distributions. Journal of Abnormal Child Psychology,37, 805–816.
Stahl, J., Gibbons, H., & Miller, J. (2010). Modeling single-trialLRP waveforms using gamma functions. Psychophysiology,47, 43–56.
Steger, J., Imhof, K., Coutts, E., Gundelfinger, R.,Steinhausen, H.C., & Brandeis, D. (2001). Attentional andneuromotor deficits in ADHD. Developmental Medicine andChild Neurology, 43, 172–179.
Steger, J., Imhof, K., Steinhausen, H., & Brandeis, D. (2000).Brain mapping of bilateral interactions in attention deficit
hyperactivity disorder and control boys. Clinical Neuro-physiology, 111, 1141–1156.
Vaurio, R.G., Simmonds, D.J., & Mostofsky, S.H. (2009).Increased intra-individual reaction time variability inattention-deficit/hyperactivity disorder across responseinhibition tasks with different cognitive demands.Neuropsychologia, 47, 2389–2396.
Verleger, R., Ja�skowski, P., & Wascher, E. (2005). Evidence foran integrative role of P3b in linking reaction to perception.Journal of Psychophysiology, 20, 165–181.
Verleger, R., Schroll, H., & Hamker, F.H. (2013). Theunstable bridge from stimulus processing to correctresponding in Parkinson’ s disease. Neuropsychologia, 51,2512–2525.
Weissman, D.H., Roberts, K.C., Visscher, K.M., & Woldorff,M.G. (2006). The neural bases of momentary lapses inattention. Nature Neuroscience, 9, 971–978.
Yordanova, J., Albrecht, B., Uebel, H., Kirov, R.,Banaschewski, T., Rothenberger, A., & Kolev, V. (2011).Independent oscillatory patterns determine performancefluctuations in children with attention deficit/hyperactivitydisorder. Brain, 134, 1740–1750.
Yordanova, J., Dumais-Huber, C., Rothenberger, A., &Woerner, W. (1997). Frontocortical activity in childrenwith comorbidity of tic disorder and attention-deficit hyperactivity disorder. Biological Psychiatry, 41,585–594.
Accepted for publication: 8 September 2014Published online: 12 November 2014
© 2014 Association for Child and Adolescent Mental Health.
doi:10.1111/jcpp.12348 Increased RT variability in ADHD as a response-locked phenomenon 813


![WP 02 2013 Biscaldi - SPS...di Angela Biscaldi [DRAFT, PLEASE DO NOT CITE] Il tema delle famiglie migranti o transnazionali è un tema vasto e complesso esplorato oramai, anche per](https://static.fdocuments.in/doc/165x107/5f0a8fef7e708231d42c3e23/wp-02-2013-biscaldi-di-angela-biscaldi-draft-please-do-not-cite-il-tema.jpg)