
Increase the Economic Value of the Jojoba (Simmondsia ...1)-Dr Riad... · Increase the Economic...
21
International Journal of Agricultural Technology 2016 Vol. 12(1):145-165 Available online http://www.ijat-aatsea.com ISSN 2630-0192 (Online) Increase the Economic Value of the Jojoba (Simmondsia Chinensis) Yield Using Evaluation of Distinctive Clones Grown Under the Egyptian Environmental Conditions Esmail, A. E. G. 1 , Amira, K. G. A. 2 and Adss, I. A. A. 3 1 Pomology Department, National Research Center, Giza, Egypt; 2 Horticulture Department, floriculture Division, Agriculture Faculty, Damanhour University, Egypt; 3 Plant Pathology Department, Division of Genetics, Faculty of Agriculture, Damanhour University, Egypt. Esmail, A. E. G., Amira, K. G. A. and Adss, I. A. A. (2016). Increase the economic value of the jojoba (Simmondsia chinensis) yield using evaluation of distinctive clones grown under the Egyptian environmental conditions. International Journal of Agricultural Technology 12(1): 145-165. Abstract Jojoba (Simmondsia chinensis) is an industrial crop being grown in the arid and semiarid regions. Evaluation of ten jojoba clones that were selected from privet jojoba farm was studied to compare their growth parameters such as, tree volume, branch length (cm), branch diameter (mm), number of nodes forming branches, mean length for secondary branches per every branch, leaf area, chlorophyll (A and B), flowering date, flowering percentage, fruit set percentage and seed yield per plant (g). Moreover, seed samples were analyzed for oil content, protein content, minerals content and carbohydrates content. Finally comparing between the studied clones using the different of total protein band and Random Amplified Polymorphic DNA (RAPD) to determine genetic relationships among jojoba genotypes. All these parameters showed significant differences among the studied clones during both seasons except branch diameter (mm) and minerals percentage in the first season as the differences between clones were insignificant. It was observed that the maximum values corresponded to the economic parameters were recorded in clones EAI 1 and EAI 4 compared with the others. The study of the different of total protein bands showed the different of total protein bands in ten jojoba clones. Random amplified polymorphic DNA (RAPD) technique was used to investigate the patterns and distribution of genetic variability in studied clones. Cluster analysis was conducted to generate a dendrogram to elucidate the relationships among jojoba genotypes. The dendrogram data divided the jojoba genotypes into two main clusters. Genotypes EAI 1 and EAI 4 were found in the same sub-cluster using RAPD primers. These genotypes also had almost similar values for most traits such as the maximum values of seed yield per plant and seed oil content. It is concluded that jojoba plants in the natural habitat of Egypt belong to different genotypes. Keywords: Jojoba, Distinctive clones Introduction Jojoba (Simmondsia chinensis) is an industrial crop being grown in the arid and semiarid regions of southwestern US. The plant is a long-lived, dioecious perennial tree native to certain parts of the Sonoran Desert in
Transcript of Increase the Economic Value of the Jojoba (Simmondsia ...1)-Dr Riad... · Increase the Economic...
International Journal of Agricultural Technology 2016 Vol. 12(1):145-165
Available online http://www.ijat-aatsea.com ISSN 2630-0192 (Online)
Increase the Economic Value of the Jojoba (Simmondsia
Chinensis) Yield Using Evaluation of Distinctive Clones Grown
Under the Egyptian Environmental Conditions
Esmail, A. E. G.
1, Amira, K. G. A.
2 and Adss, I. A. A.
3
1Pomology Department, National Research Center, Giza, Egypt;
2 Horticulture Department,
floriculture Division, Agriculture Faculty, Damanhour University, Egypt; 3Plant Pathology
Department, Division of Genetics, Faculty of Agriculture, Damanhour University, Egypt.
Esmail, A. E. G., Amira, K. G. A. and Adss, I. A. A. (2016). Increase the economic value of the
jojoba (Simmondsia chinensis) yield using evaluation of distinctive clones grown under the
Egyptian environmental conditions. International Journal of Agricultural Technology 12(1):
145-165.
Abstract Jojoba (Simmondsia chinensis) is an industrial crop being grown in the arid and
semiarid regions. Evaluation of ten jojoba clones that were selected from privet jojoba farm was
studied to compare their growth parameters such as, tree volume, branch length (cm), branch
diameter (mm), number of nodes forming branches, mean length for secondary branches per
every branch, leaf area, chlorophyll (A and B), flowering date, flowering percentage, fruit set
percentage and seed yield per plant (g). Moreover, seed samples were analyzed for oil content,
protein content, minerals content and carbohydrates content. Finally comparing between the
studied clones using the different of total protein band and Random Amplified Polymorphic
DNA (RAPD) to determine genetic relationships among jojoba genotypes. All these parameters
showed significant differences among the studied clones during both seasons except branch
diameter (mm) and minerals percentage in the first season as the differences between clones
were insignificant. It was observed that the maximum values corresponded to the economic
parameters were recorded in clones EAI 1 and EAI 4 compared with the others. The study of
the different of total protein bands showed the different of total protein bands in ten jojoba
clones. Random amplified polymorphic DNA (RAPD) technique was used to investigate the
patterns and distribution of genetic variability in studied clones. Cluster analysis was conducted
to generate a dendrogram to elucidate the relationships among jojoba genotypes. The
dendrogram data divided the jojoba genotypes into two main clusters. Genotypes EAI 1 and
EAI 4 were found in the same sub-cluster using RAPD primers. These genotypes also had
almost similar values for most traits such as the maximum values of seed yield per plant and
seed oil content. It is concluded that jojoba plants in the natural habitat of Egypt belong to
different genotypes.
Keywords: Jojoba, Distinctive clones
Introduction
Jojoba (Simmondsia chinensis) is an industrial crop being grown in the
arid and semiarid regions of southwestern US. The plant is a long-lived,
dioecious perennial tree native to certain parts of the Sonoran Desert in

146
southern Arizona, southern California and northern Mexico (Nelson and
Watson, 2001). Plantations of jojoba have been established in a number of
desert and semi-desert areas, predominantly in Argentina, Australia, Israel,
Mexico, Peru and the United States. The fruit is an acorn-shaped ovoid, three-
angled capsule 1–2 centimeters (0.39–0.79 in) long, partly enclosed at the base
by the sepals. The mature seed is a hard oval, dark brown in color and contains
oil (liquid wax)(Phillips and Patricia, 2000).The female plants produce seed
from flowers pollinated by the male plants. Jojoba leaves have an aerodynamic
shape, creating a spiral effect, which brings wind-born pollen from the male
flower to the female flower. In the Northern Hemisphere, pollination occurs
during February and March. In the Southern Hemisphere, pollination occurs
during August and September. The haploid number of jojoba is 13. Somatic
cells of jojoba are tetraploid, the number of chromosomes is 2n = 4x = 52
(Hiroshi et al., 1992). The product of primary interest is the seed oil, which is a
unique liquid wax (commonly known as jojoba oil). Most of this oil consists of
esters formed from acids and alcohols with chain lengths of 20 or 22 carbon
atoms (Wisniak, 1987). Jojoba oil is used as a natural base for a wide range of
cosmetic products because of its purity, lack of odor and stability. In addition, it
also possesses heat resistant lubricating properties and is potentially useful in
the chemical industry as a basic feedstock (Nelson and Watson, 2001) such as
pharmaceuticals, lubricants, gear additives, extenders, anti-foaming agents, and
in the wax and polish industries (US National Research Council, 1985 and
Wisniak, 1987).
Selective breeding is developing plants that produce more seeds with
higher oil content (Phillips and Patricia, 2000). Each plant is single-sex, either
male or female, with hermaphrodites being extremely rare. As it occurs in other
crops, the jojoba industry faces the challenge of finding ways to improve
productivity and quality of the products. In addition, the seedlings cannot be
sexed until the first flower buds appear 9 to 24 months after sowing (Dunstone
and Begg, 1983). The pollen of the male trees is scattered for miles by the
wind. Only female trees produce seeds (Gentry, 1958). Although jojoba plants
start producing fruit in 3 years, full maturity takes 10 to 12 years, with the
plant’s life estimated to be 100 years (Verbanic, 1986). Only a small proportion
(less than 1%) of the plant population originating from seeds of native plants
has the potential of yielding economically acceptable yields (Purcell and
Purcell, 1988). This outbreeding has resulted in highly heterogeneous seeds that
provide a wide range of hybrid vigor and fertility. Ironically, the extreme
genetic variation that was a major cause of failure in the seed-planted fields of
the early jojoba pioneers will also be a key step for developing high yields in
the future (Purcell et al., 2000). Moreover, there is a lack of practical methods

International Journal of Agricultural Technology 2016 Vol. 12(1):145-165
147
for cultivar identification. Hence, the best method for jojoba improvement, in
the short term, is the selection of plants with desirable characteristics and
propagating them asexually. DNA-based genetic markers, such as restriction
fragment length polymorphisms (RFLP) and random amplified polymorphic
DNA (RAPD), have become more efficient, reliable and useful (Caetano-
Anolles et al., 1991 and Nybon, 1994). Amarger and Mercie (1996) have
applied random amplified polymorphic DNA for the discrimination between
two jojoba genotypes at the genomic level.
Random amplified polymorphic DNA (RAPD) technique was used to
investigate the patterns and distribution of genetic variability in natural field-
grown cuttings of jojoba plants (Gaber et al., 2007). The objective of this study
was to evaluate jojoba plants for agronomic and yield characters to introduce
jojoba as a commercial crop with the purpose of selecting superior jojoba
genotypes suitable for EL-Behira governorate, Egypt.
Materials and methods
During two successful seasons (2013-2014 and 2014-2015) the
analyzing and comparing between ten jojoba clones selected from superior
female plants were conducted. Individual plants were tagged in the privet farm
and evaluated on the basis of high seed yield. Based on this selection criterion,
ten most promising mother plants from individual plants were propagated by
stem cuttings and planted in the privet farm in EL-Behira governorate, Egypt at
the spring of 2005. On our experiment the evaluation of the best ten jojoba
clones was carried out in two successive harvesting seasons 2013 and 2014.
Plants of genotypes were planted in randomized complete block design
(RCBD) with five replications per genotype. Distances between rows and
within plants in rows were 3 and 2.5 m, respectively. Male plants were repeated
one row every six female rows. Drip irrigation system was applied in the
orchard, weed and pest control, and fertilization conducted following the
standard agro-management practices. All the studied plants were subjected to
the same condition including irrigation, farm practices and etc. The orchard
soil analysis are given in (Table 1) and water irrigation analysis are given in
(Table 2) according to procedures.

148
Table 1. Some physical and chemical analysis of the orchard soil parameters pH EC(dSm-
1)
Ca++ Mg++ Na+ K+ HCO3- Cl- SO4=
values 7.88 2.26 2.14 3.78 19.66 0.31 1.11 21.25 4.56
Table 2. Chemical characteristics of water weal used for the present study parameters pH EC(dSm-
1)
Ca++ Mg++ Na+ K+ HCO3- Cl- SO4=
values 7.45 3.44 5.42 3.64 21.88 3.24 1.98 29.24 3.25
Parameters
Parameters were recorded to achieve the objectives of this experiment
for measuring plant growth and yield characters of jojoba genotypes. These
parameters were measured as follows: For each genotype, five plants for every
clone by randomly chosen (one plant per block from the inner rows) were
tagged.
Vegetative and reproductive measurements
Data were collected from tagged plants of each clone for each block.
1-Tree volume measurements were taken for each plant in August of
every season according to the following equation (Nelson et al., 1997): Plant
volume = [(length x width)/2] x height.
2-Branch characters: Two branches were selected from the mid- level
of the plants and the average of two branches characters were calculated for
detailed analysis. On each branch the following data were collected:
2.1: branch length (cm)
2.2: branch diameter (mm).
2.3: Number of node forming branches nodes
2.4: length of secondary branches per every branch
2.5: leaf area (cm2): This last character was calculated as mentioned
by Koller (1972). One matured leaf was sampled from the second basal node on
the main branch of each plant at each block in each clone. The leaves of each
treatment were weighed. One square was taken from each leaf with a known
area (1cm2). The squares of each treatment were weighed. The total leaf area of
each plant was calculating according to the following equation: Leaf area
(cm2) = (Leaf weights x Square areas) / Square weights
This procedure was repeated again using the leaves of the 4rd
, 5th
, 6th
and
7th
basal nodes on the main branch. The average of leaf area was calculated.

International Journal of Agricultural Technology 2016 Vol. 12(1):145-165
149
3- Chlorophyll A, B were assayed in the commercial harvest stage.
They were determined according to Wintermans and Mats (1965) as follows:
half gram of fresh leaves was extracted by about 15 ml. of 85% acetone with
0.5g. calcium carbonate, the mixture was through a glass funnel and the residue
was washed with a small volume of acetone and completed to 25 ml. The
optical density of a constant volume of filtrate was measured at a wave length
of 622 nm. for chlorophyll A, 644 nm. and for chlorophyll B using
spectrophotometer. The following equation was used:-
Chl. A = 9.784 E.662 - 0.99E.644 = mg/gm.
Chl. B = 21.426 E.644 - 4.65 E. 662 = mg/gm.
4-flowering: three Branches per plant from each clone were tagged in
December 2013 and 2014, and the number of floral buds was recorded. Every
15 days the number of open buds (with a visible stigma) was recorded, and the
flowering percentage was calculated. The number of flowers that reaching
mature fruits were also recorded.
4.1-flowering date: The numbers of days from first January until open the flowers was recorded. When 50% of the flowers were opened, the
flowering date was calculated and recorded.
4.2- Flowering percentage was defined as the ratio of the number
of flower buds to the number of nodes in the shoots of the current and previous
year’s growth (Benzioni et al., 1999).
4.3- Fruit set percentage was calculated as mentioned by
Westwood (1978). The number of flowers that set fruits on the branch related to
the basic number of flowers as given in the following equation:
Percentage of fruit set = (No. of fruitlets x 100)/ Total No. of flowers 5- Seed yield: Seed were harvested from the previous tagged plants by
hand at full maturity. Harvested seeds were cleaned, dried and weighted (g).
Seeds were hand-harvested every year in July and August from five plants per
clone and used for determining seed yield plant-1
(g) and analyzed for main
components.
6- Chemical analyses were performed following the AOAC (1995)
6.1: Oil content: To determine oil content, seeds of each genotype
were randomly selected, weighed, and dried at 50 ºC. The drying process was
continued until the difference between the two successive weights was less than
1 mg. Five replications were used for this characteristic. The oil was extracted
for 16 h with hexane with a Soxhlet apparatus.
6.2: Crude protein: Total organic nitrogen (N) was determined
according to the method of Kjeldahl as indicated by (AOAC, 1995) for dry
material. Crude protein content was obtained by multiplying the nitrogen (N)
value by 6.25. Data represent the means of five replications.
150
6.3: Mineral content: To remove carbon, approximately 5 gm of
each dry sample was ignited in a porcelain container and incinerated in the
muffle furnace at about 550oC. Mineral content was expressed as a percentage
of dry matter.
6.4: Total carbohydrates: Total carbohydrates were estimated by
the difference in the mean values, i.e., 100 - (sum of concentrations of protein,
ash and lipid).
7: RAPD markers
Leaf samples were submitted to RAPD analysis by PCR amplification
in a total volume of 25µl containing 2.5µl 10 x buffer, 2.5 µl 50mM MgCl2,
2.5 µl 4mM dNTPs,7 µl 50pmol primer,1 µl 10 ng of jojoba clones genomic
DNA and 0.2 µl (5 units/ µl) Taq DNA polymerase (Promega Germany). The
PCR program consisted on was applied : an initial denaturation cycle at 95 ºC
for 5 min, 40 cycles at 95oC for 1 min, annealing at 30oC for 1 min and
extension at 72oC for 1 min and finally an extra final extension step at 72oC for
10 min (Istock et al., 2001). Two µl of loading dye were added prior to loading
of 10 µl sample per gel slot. Electrophoresis was performed at 100 volt with 0.5
x TBE as running buffer in 1.5% agarose. Gel was stained in 0.5 µg/cm3 (w/v)
ethidium bromide solution and distained in deionized water. Finally the gel was
visualized and photographed using gel documentation system.
Data obtained by RAPD-PCR DNA band patterns were scored for
cluster analysis and dendrogram was constructed on the basis of the presence
and absence of the amplified bands for each primer. A band present in jojoba
clones was designated (1) and when bands, was used to generate similarity
coefficients according to Jaccard (1980). The similarity coefficients were used
to construct a dendrogram by UPGMA (Unweighted Pair-Group Method with
Arithmetical Averages).
Table 3. List of primers name and their nucleotide sequences employed in the
RAPD-PCR analysis.
Primer number Nucleotide sequence(5′ to 3′)
OPA-02 TG CGAGCTG
OPA-04 AATCGGGCTG
OPC-O5 GATGACCGCC
OPC-09 CTCACCGTCC
OPO-12 CAGTGCTGTG
International Journal of Agricultural Technology 2016 Vol. 12(1):145-165
151
Protein profile by sodium dodecylsulphate polyacrylamide gel electrophoresis
(SDS-PAGE)
SDS-polyacrylamide gel electrophoresis (SDS-PAGE) was performed
for total proteins of the ten jojoba clones was carried out in 12% separating gel
with a 5% stacking gel according to the method of Laemmli, 1970. The proteins
bands were visualized by staining with 0.1% Coomassie brilliant blue R-250.
Afterwards, the gels were distained in a methanol-acetic acid-water (3:1:6)
mixture until protein bands became clearly visible.
Statistical Analysis
Fifty plants per clone were planted in completely randomized block
design with five replications. Analysis of variance with SAS software (SAS
Institute, 1988) was carried out on the test clones data. Clones’ means were
compared using the LSD test at 5% level of probability.
Results and discussion
1-Tree volume: Based on the analysis of variance for growth analysis
characters, the results revealed the presence of highly significant differences
among genotypes on tree volume at ten jojoba genotypes (Table 4). These
indicate that the behavior of the genotypes differed from one to another under
the same culture condition so the genotypes differed in their traits. Data in
Table 4 showed that tree volume ranged from 2.73m3 (EAI7 at first season) to
7.39 m3 (EAI1 at the second season). No significant differences between the
two clones EAI1 and EAI4 were detected for tree volume in both seasons,
respectively.
2-Branch traits: Table 4 reveal significant differences among ten
genotypes in branches vegetative traits (branch length, branch diameter,
number of node forming branches and secondary branches length) except the
differences between the values of branch diameter in the first season were
insignificant.
2.1: Branch length: Genotype EAI 1 showing the highest significant
branch length (60.60 cm) compared with all other studied clones in the first
season. The same situation was observed with genotypes EAI 1 and EAI 4 in
the second season as they recorded the maximum significant branch length too
(64.38 and63.58 cm, respectively). On the contrary, Genotypes EAI 7 and EAI
9 showed the lowest significantly branch length for the first season (49.53 and
152
53.67 cm, respectively) and second season (50.85 and 54.57 cm, respectively).
Insignificant differences between genotypes EAI 8 and EAI 9 were noticed.
Increase in branch length is the result of cell division and elongation.
2.2: For branch diameter (mm), the results in the first season
showed insignificant differences between all studied genotypes. From another
side, the differences between the studied genotypes in the second season were
significant and EAI 1, EAI 3, EAI 4, EAI 6 and EAI 10 had the most thick
branches (3.88, 3.52, 3.65, 3.29 and 3.87 mm, respectively) compared with the
other studied genotypes.
2.3: Number of node forming branches: The results in the Table 4
showed that, genotypes EAI 1 and EAI 4 had the highest number of node
forming branches (4). No significant differences were found between all
studied genotypes except seventh one (EAI 7) which had the lowest value (2.2)
in the first season for this trait and significantly differed with first and fourth
clones. Moreover, genotype EAI 1, EAI 2, EAI 3 and EAI 4 in the second
season gave the highest significant number of branched nodes (5.2, 4.0, 4.4 and
5.0, respectively).While the seventh clone gave the lowest number of branched
node (2.8). These results indicated that each genotype has a different genetic
character and their responses vary with climatic and soil conditions depending
on genotype (Al-Soqeer, 2014).
2.4: Secondary branches length: The longest secondary branches
were observed in the genotypes EAI 1, EAI 3 and EAI 4 (22.80, 21.0 and
21.4cm, respectively) in the first season and EAI 1, EAI 2, EAI 3 and EAI 4
(25.0, 23.0, 23.4 and 24.4 cm, respectively) in the second season. The shortest
secondary branches were found in the genotype EAI 7 (18.2 and 19.6 cm) in
both seasons, respectively (Table 4). These results indicated that each clone has
a different genetic character and their responses vary under the same conditions
depending on its genotype. Genetic differences among genotypes in plant
height, number of branched nodes and plant diameters have previously been
reported (Botti et al., 1998; Benzioni et al., 1999; Tobares et al., 2004; Prat et
al., 2008 and Al-Soqeer 2014).
International Journal of Agricultural Technology 2016 Vol. 12(1):145-165
153
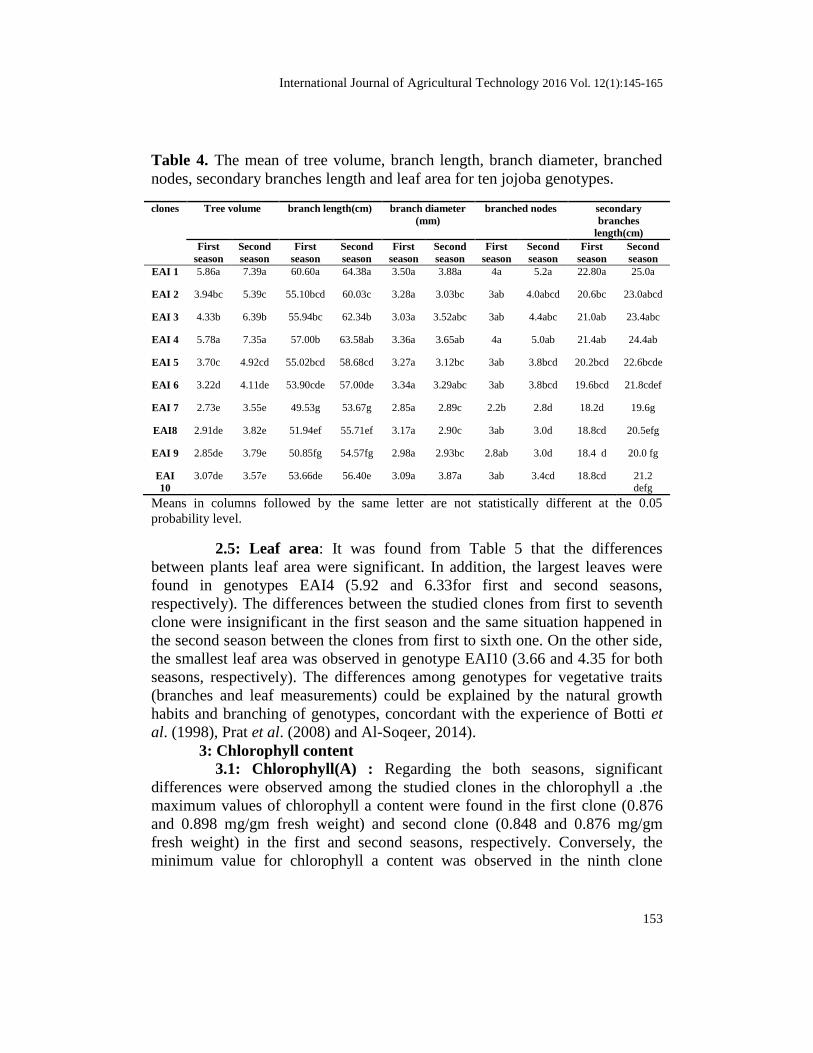
Table 4. The mean of tree volume, branch length, branch diameter, branched
nodes, secondary branches length and leaf area for ten jojoba genotypes.
clones Tree volume branch length(cm) branch diameter
(mm)
branched nodes secondary
branches
length(cm)
First
season
Second
season
First
season
Second
season
First
season
Second
season
First
season
Second
season
First
season
Second
season
EAI 1 5.86a 7.39a 60.60a 64.38a 3.50a 3.88a 4a 5.2a 22.80a 25.0a
EAI 2 3.94bc 5.39c 55.10bcd 60.03c 3.28a 3.03bc 3ab 4.0abcd 20.6bc 23.0abcd
EAI 3 4.33b 6.39b 55.94bc 62.34b 3.03a 3.52abc 3ab 4.4abc 21.0ab 23.4abc
EAI 4 5.78a 7.35a 57.00b 63.58ab 3.36a 3.65ab 4a 5.0ab 21.4ab 24.4ab
EAI 5 3.70c 4.92cd 55.02bcd 58.68cd 3.27a 3.12bc 3ab 3.8bcd 20.2bcd 22.6bcde
EAI 6 3.22d 4.11de 53.90cde 57.00de 3.34a 3.29abc 3ab 3.8bcd 19.6bcd 21.8cdef
EAI 7 2.73e 3.55e 49.53g 53.67g 2.85a 2.89c 2.2b 2.8d 18.2d 19.6g
EAI8 2.91de 3.82e 51.94ef 55.71ef 3.17a 2.90c 3ab 3.0d 18.8cd 20.5efg
EAI 9 2.85de 3.79e 50.85fg 54.57fg 2.98a 2.93bc 2.8ab 3.0d 18.4 d 20.0 fg
EAI
10
3.07de 3.57e 53.66de 56.40e 3.09a 3.87a 3ab 3.4cd 18.8cd 21.2 defg
Means in columns followed by the same letter are not statistically different at the 0.05
probability level.
2.5: Leaf area: It was found from Table 5 that the differences
between plants leaf area were significant. In addition, the largest leaves were
found in genotypes EAI4 (5.92 and 6.33for first and second seasons,
respectively). The differences between the studied clones from first to seventh
clone were insignificant in the first season and the same situation happened in
the second season between the clones from first to sixth one. On the other side,
the smallest leaf area was observed in genotype EAI10 (3.66 and 4.35 for both
seasons, respectively). The differences among genotypes for vegetative traits
(branches and leaf measurements) could be explained by the natural growth
habits and branching of genotypes, concordant with the experience of Botti et
al. (1998), Prat et al. (2008) and Al-Soqeer, 2014).
3: Chlorophyll content
3.1: Chlorophyll(A) : Regarding the both seasons, significant
differences were observed among the studied clones in the chlorophyll a .the
maximum values of chlorophyll a content were found in the first clone (0.876
and 0.898 mg/gm fresh weight) and second clone (0.848 and 0.876 mg/gm
fresh weight) in the first and second seasons, respectively. Conversely, the
minimum value for chlorophyll a content was observed in the ninth clone
154
(0.806 and 0.784 mg/gm fresh weight for first and second season, respectively)
(Table 5).
3.2: Chlorophyll (B): It was observed that the first clone had the
highest values of chlorophyll b (0.450 and 0.464mg/gm fresh weight during the
first and second seasons, respectively) comparing with the other studied clones
(Table 5). While the differences between the clones from first to ninth were
insignificant in the first season. The same situation was observed between the
first, second, third, fourth, sixth and seventh clone in the second one.
The average value for chlorophyll a content of ten clones (0.8321 and
0.8344mg/gm fresh weight for both season, respectively) and those of
chlorophyll b (0.4140 and 0.4142 mg/gm fresh weight) were similar to the
values reported by Ali et al., 2013 (0.800 and 0.400 mg/gm fresh weight for
chlorophyll a and b, respectively.)
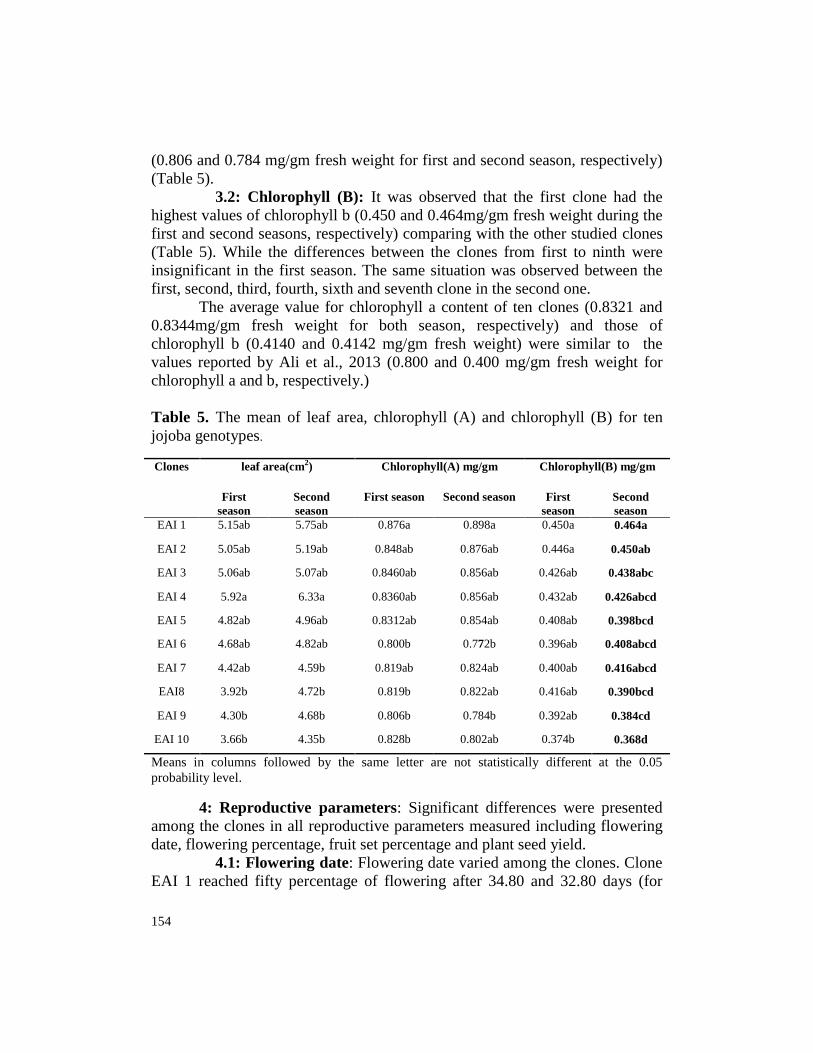
Table 5. The mean of leaf area, chlorophyll (A) and chlorophyll (B) for ten
jojoba genotypes.
Chlorophyll(B) mg/gm Chlorophyll(A) mg/gm leaf area(cm2) Clones
Second
season
First
season
Second season First season Second
season
First
season
0.464a 0.450a 0.898a 0.876a 5.75ab 5.15ab EAI 1
0.450ab 0.446a 0.876ab 0.848ab 5.19ab 5.05ab EAI 2
0.438abc 0.426ab 0.856ab 0.8460ab 5.07ab 5.06ab EAI 3
0.426abcd 0.432ab 0.856ab 0.8360ab 6.33a 5.92a EAI 4
0.398bcd 0.408ab 0.854ab 0.8312ab 4.96ab 4.82ab EAI 5
0.408abcd 0.396ab 0.772b 0.800b 4.82ab 4.68ab EAI 6
0.416abcd 0.400ab 0.824ab 0.819ab 4.59b 4.42ab EAI 7
0.390bcd 0.416ab 0.822ab 0.819b 4.72b 3.92b EAI8
0.384cd 0.392ab 0.784b 0.806b 4.68b 4.30b EAI 9
0.368d 0.374b 0.802ab 0.828b 4.35b 3.66b EAI 10
Means in columns followed by the same letter are not statistically different at the 0.05
probability level.
4: Reproductive parameters: Significant differences were presented
among the clones in all reproductive parameters measured including flowering
date, flowering percentage, fruit set percentage and plant seed yield.
4.1: Flowering date: Flowering date varied among the clones. Clone
EAI 1 reached fifty percentage of flowering after 34.80 and 32.80 days (for

International Journal of Agricultural Technology 2016 Vol. 12(1):145-165
155
both season, respectively) from the beginning of January, following that clone
EAI 4, EAI 3 then EAI 2 do that after 40.00, 44.20 and 47.40 days, respectively
in the first season and the same situation occurred in the second season after
38.80, 42.00 and 44.00, respectively. While the clones EAI 9 had the longest
period to reach fifty percent of flowering (67.40 and 64.40 day for first and
second season, respectively) (Table 6). These results indicated that each
genotype has a different genetic character and their responses vary with
climatic and soil conditions depending on genotype (Al-Soqeer, 2014).
Dormancy of jojoba flower buds is broken by exposure to temperatures
between 5 and 20 o
C (Dunstone, 1980). Clones differ in the duration of low
temperature required to break dormancy. Flower buds release from dormancy
will complete morphogenesis and proceed to anthesis only if water is available
and plants have accumulated a sufficient heat sum (Benzioni and Dunstone,
1985 and Ferriere et al., 1989). Clones vary in their chilling requirement, which
may affect time of anthesis. Environmental conditions known to affect the time
of anthesis include radiation level and availability of nutrients in the soil
(Benzioni and Nerd, 1989 and Dunstone 1988). Jojoba clones differ greatly in
their chilling demands (Ferriere et al., 1989 and Benzioni et al., 1992). From
that the clones such as EAI 1 its chilling requirement was presumably quite
small so flowered earlier than the others. But on the contrary, some clones such
as EAI 9 is needing very high chilling requirement so flowering late. Beside
that, some clone such as EAI 5 had a moderate chilling requirement so that its
flowering date was moderate between first and second mentioned groups and
that was reflected on the other reproductive characters as shown in Table 6.
4.2: Flowering percentage: In the first season, the first and seventh
clone recorded the highest and lowest percents of flowering (45.65 and 36.84
%, respectively) compared with all studied clones but the differences between
the first, third and fourth clones were insignificant. Moreover, the first clones
recorded the highest significant values for flowering percentage (49.24 %) in
the second season. Add to that, clone EAI 7 had the minimum value for
flowering percentage (42.38%) with insignificant differences between it and
EAI 8, EAI 9 and EAI 10 clones (Table 6).
4.3: Fruit set percentage: Maximum fruit set percentages (95.30 and
96.17 %) were observed in the first clone for both seasons, respectively. The
differences among first and fourth clones for fruit set percentage in the first
season and among first, third and fourth clones in the second season were
insignificant (Table 6). There were significant differences between
abovementioned clones on one side and the other clones on the other side in
each season alone. The smallest fruit set percentage values were noticed at
seventh clone (89.74 and 84.11% for both seasons, respectively).

156
4.4: Seed yield plant-1
: The highest significant seed yield plant-
1(2600.40 and 2756.20 gm) was found in the first clone during the first and
second season, respectively. From the other hand, the ninth clone had the
lowest values regarding plant seed yield (1376.60 and 1424.40 gm/ plant for
both seasons, respectively) compared with the other studied clones in both
season, respectively. No significant differences were found among the clones
sixth, seventh, eighth, ninth and tenth in the first season and between seventh,
eighth, ninth and tenth clones in the second one (Table 6).
Table 6. The mean of flowering date, final fruit set, flowering percentage and
seed yield /g/plant for ten jojoba genotypes.
Clones Flowering date Flowering
percentage
Final Fruit Set % Seed yield /g/plant
First
season
second
season
First
season
second
season
First
season
second
season
First
season
second
season
EAI 1 34.80i 32.80h 45.65a 49.24a 95.30 a 96.17a 2600.40
a
2756.20 a
EAI 2 47.40f 44.00e 43.63b 45.92bc 92.35c 94.42bc 1589.20
d
2244.80 c
EAI 3 44.20g 42.00f 44.20ab 46.60bc 93.37b 95.05ab 1771.40
c
2402.00bc
EAI 4 40.00h 38.80g 45.12a 47.50b 94.55a 95.82a 2182.20
b
2492.20 b
EAI 5 50.60e 46.60d 43.33bc 45.60cd 92.05c 94.12bc 1580.40
d
1984.40 d
EAI 6 55.40d 52.20c 42.10cd 44.10de 91.63c 93.98bc 1401.60
e
1747.00 e
EAI 7 65.20b 62.80a 36.84f 42.38f 89.74 e 84.11f 1385.60
e
1425.60 f
EAI8 63.80b 60.00b 39.06e 42.60ef 90.02de 91.91 d 1387.60
e
1474.60 f
EAI 9 67.40a 64.40a 38.46e 42.42f 89.81de 86.23e 1376.60
e
1424.40 f
EAI 10 60.40c 58.40b 40.80d 43.98ef 90.68d 93.43c 1395.60
e
1524.40 f
Means in columns followed by the same letter are not statistically different at the 0.05
probability level.
The best vegetative growth traits which observed in the first and fourth
clones contributed to the increase of the final fruit set, flowering percentage and
the seed yield plant-1
. This results are in harmony with Benzioni et al. (1999)
where they found that some clones exhibited excellent vegetative traits related
to yield potential, such as, rapid growth and extensive branching .In previous
studies, Mckelvie et al., (1994) reported that yields of the new jojoba varieties,
at an average density of 1250 plants per hectare, were yield at least 0.2 tons of
seed per hectare in fourth year, gradually increased to 1.6 tons of seed per
International Journal of Agricultural Technology 2016 Vol. 12(1):145-165
157
hectare by twelfth year. After twelfth year, yields were expected to remain
fairly constant. Ulger et al. (2002) found that seed yield of jojoba plants ranged
from 0.02 to 0.5 kg per plant from the fourth year in Alata, Mersin, Turkey.
Dunstone and Begg (1983) indicated that the first significant harvest was
possible after four years from planting with yields of about 100-200 g per
female plant. Ayerza (1996) and Benzioni et al. (1996) in Argentina and Israel,
respectively, found that yields fluctuated between 705 and 148 g Plant-1
in the
third year of growth. Osman and Abo Hassan (2013) reported that average seed
yield varied from 0.18 to 0.59 kg plant-1
at Hail region in the fourth and fifth
year, respectively. It was noteworthy that seed yield in our results exceeded the
range of seed yield recorded in other studies.
5: Mean seed components (Lipids, Proteins, Minerals and
Carbohydrates): The obtained data indicated that, the studied clones showed
significant differences among them in lipids, proteins, minerals and
carbohydrates, in both seasons except the differences between the percents of
minerals in the first season were insignificant (Table 6).
5.1: Seed oil content: Jojoba is mainly considered a bi-purpose
material and is used for oil extraction. The results in Table 7 revealed the
presence of significant differences among the studied clones considering lipids
and proteins. These variations may be attributed to genetic variability (Ayerza,
2001).The maximum mean value of lipids content was detected at the first
clone (50.77 and 51.02%) during the first and second season, respectively
compared with the other studied clones. Insignificant differences observed
between the first, second, third and fourth clones in the first and second
seasons. From the other hand, the minimum mean value of lipids was noticed in
the tenth clone (48.31 and 47.72%) in both seasons, respectively (Table 7).The
average value for lipids content varied from 48.31% (for genotype EAI 10 in
the first season) to 51.02% ( for genotype EAI 1 in the second season). These
values were in similar with the values reported by Perez-Gil et al. (1989) and
Cappillino et al. (2003) (48.89% and 53.2%, respectively). As previously
mentioned, the interest in jojoba seeds production is focused on the quantity
and quality of their oil. Each clone showed a characteristic chemical
composition depending on its particular genetic. Therefore, it was expected that
different genome expressions were observed in the chemical parameters
analyzed (Gayol et al., 2004).

158
Table 7. The mean of carbohydrates, minerals, lipids and proteins for ten
jojoba genotypes. Carbohydrates% Minerals% Proteins% Lipids% Clones
Second
season
First
season
Second
season
First
season
Second
season
First
season
Second
season
First
season
19.26cd 18.18de 1.63de 1.57a 29.48bc 28.66bc 51.02 a 50.77a EAI 1
20.36abcd 21.80a 1.65d 1.51a 29.20c 28.10bc 49.34abcd 49.95abc EAI 2
20.98abc 19.13cd 1.73b 1.72a 26.66d 26.97c 49.96 abc 50.03ab EAI 3
20.11bcd 20.90ab 1.66cd 1.63a 27.36d 28.01bc 50.22ab 50.11ab EAI 4
19.68bcd 16.11f 1.81a 1.62a 30.26b 29.50b 49.10bcd 49.3 bcd EAI 5
17.80d 19.33cd 1.64d 1.70a 32.88a 31.52a 49.04bcd 48.89 cd EAI 6
22.94a 20.04bc 1.75ab 1.53a 29.58bc 28.29bc 48.34 cd 48.85 cd EAI 7
20.77abc 19.46bcd 1.75ab 1.47a 30.18b 29.40b 48.08 d 48.79 d EAI8
22.12ab 22.36a 1.57e 1.44a 27.39d 27.32c 48.02 d 48.71 d EAI 9
18.00d 17.11ef 1.72bc 1.46a 33.14a 32.47a 47.72 d 48.31 EAI10
Means in columns followed by the same letter are not statistically different at the 0.05
probability level.
5.2: Seed protein content: There were significant differences among
the analyzed clones in protein content. Regarding the first season the maximum
significant values of protein content was observed in the tenth (32.47and 33.14a
%) and sixth (31.52 and 32.88%) clones for both seasons, respectively with
insignificant differences between them. On the other side, the minimum values
were observed in the third clone (26.97 and 26.66%) compared with the other
studied clones in both seasons, respectively. As mentioned above the average
protein content ranged from 26.97 to32.47% in the first season and from 26.66
to 33.14 % in the second one (for the third and tenth clones, respectively) these
values were higher than the values informed by Cappillino et al., 2003 (15,2%)
and by Wisniak, (1987) (14.9%).
5.3: The minerals content was varied from 1.44% (clone EAI 9) to
1.72% (EAI 3) in the first season. While in the second one, varied from 1.57%
(clone EAI 9) to 1.81% (clone EAI 5) (Table 7). Moreover, the mineral content
was similar to the results reported by Al-Soqeer et al. (2012) where they found
that mineral content ranged from (1.61 to 1.93%) in their study.
5.3: Seed carbohydrates content %: During the first season, the
ninth clone had the highest percentage of carbohydrate (22.36%) with
insignificant differences between second, fourth and ninth clones. The same
International Journal of Agricultural Technology 2016 Vol. 12(1):145-165
159
situation was noticed at the seventh clone which recorded the maximum value of
carbohydrate content (22.94%) in the second season and no significant
differences were detected between second, third, seventh, eighth and ninth
clones in the same season too. From the other hand, the lowest value of
carbohydrate percent was found in the fifth and sixth clones (16.11 and 17.8%
during first and second seasons, respectively) (Table 7). These differences in
carbohydrate percent value due to the differences between clones are in
agreement with Al-Soqeer et al. (2012).
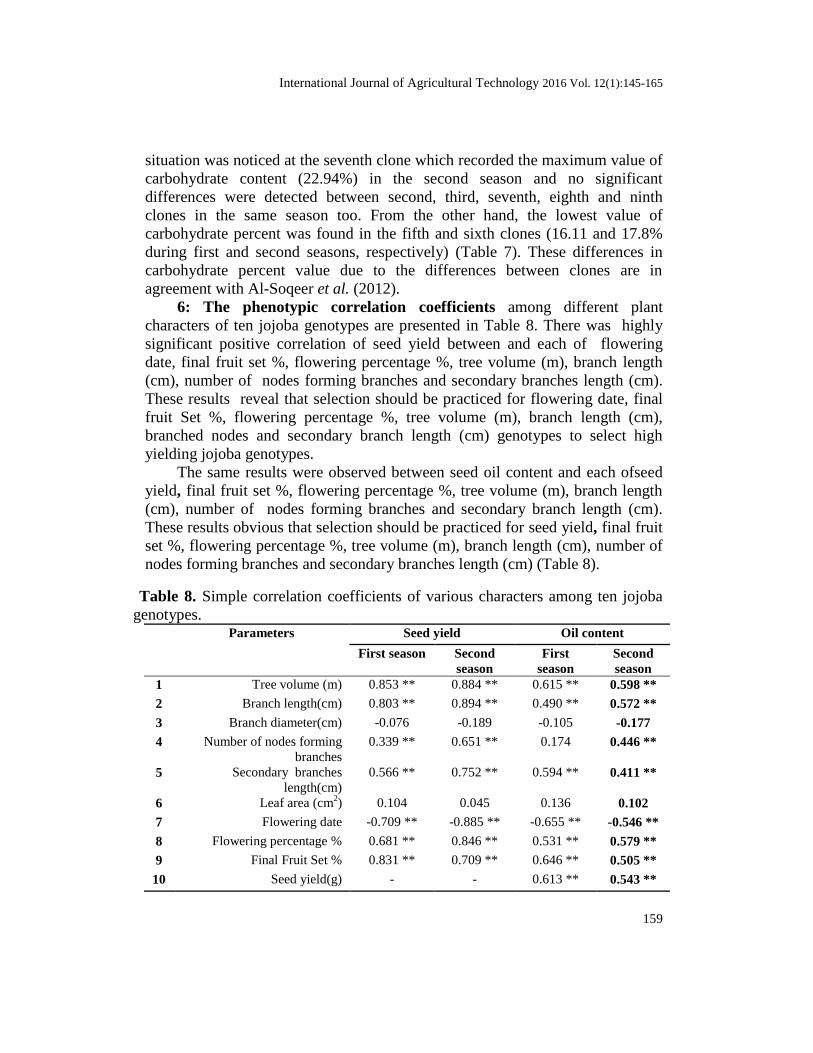
6: The phenotypic correlation coefficients among different plant
characters of ten jojoba genotypes are presented in Table 8. There was highly
significant positive correlation of seed yield between and each of flowering
date, final fruit set %, flowering percentage %, tree volume (m), branch length
(cm), number of nodes forming branches and secondary branches length (cm).
These results reveal that selection should be practiced for flowering date, final
fruit Set %, flowering percentage %, tree volume (m), branch length (cm),
branched nodes and secondary branch length (cm) genotypes to select high
yielding jojoba genotypes.
The same results were observed between seed oil content and each ofseed
yield, final fruit set %, flowering percentage %, tree volume (m), branch length
(cm), number of nodes forming branches and secondary branch length (cm).
These results obvious that selection should be practiced for seed yield, final fruit
set %, flowering percentage %, tree volume (m), branch length (cm), number of
nodes forming branches and secondary branches length (cm) (Table 8).
Table 8. Simple correlation coefficients of various characters among ten jojoba
genotypes. Oil content Seed yield Parameters
Second
season
First
season
Second
season
First season
0.598 ** 0.615 ** 0.884 ** 0.853 ** Tree volume (m) 1
0.572 ** 0.490 ** 0.894 ** 0.803 ** Branch length(cm) 2
-0.177 -0.105 -0.189 -0.076 Branch diameter(cm) 3
0.446 ** 0.174 0.651 ** 0.339 ** Number of nodes forming
branches 4
0.411 ** 0.594 ** 0.752 ** 0.566 ** Secondary branches
length(cm) 5
0.102 0.136 0.045 0.104 Leaf area (cm2) 6
-0.546 ** -0.655 ** -0.885 ** -0.709 ** Flowering date 7
0.579 ** 0.531 ** 0.846 ** 0.681 ** Flowering percentage % 8
0.505 ** 0.646 ** 0.709 ** 0.831 ** Final Fruit Set % 9
0.543 ** 0.613 ** - - Seed yield(g) 10

160
7: Fingerprinting of ten jojoba clones Using Random Amplified
Polymorphic DNA (RAPD): Using five primers in RAPD-PCR showed clear
difference among the ten studied ten jojoba clones on the basis of amplified
product band patterns observed with each primer. The amplification profiles
with the primers and are shown in Figure 1. All of these primers succeeded to
give polymorphic patterns among jojoba clones. Also, high similarity was
observed between 1 and 4 jojoba clones (These two jojoba clones were
moderately in protein content) and 2 and 3 jojoba clones (These two jojoba
clones were low in protein content) followed by 6 and 10 jojoba clones (These
two jojoba clones were high in protein content).
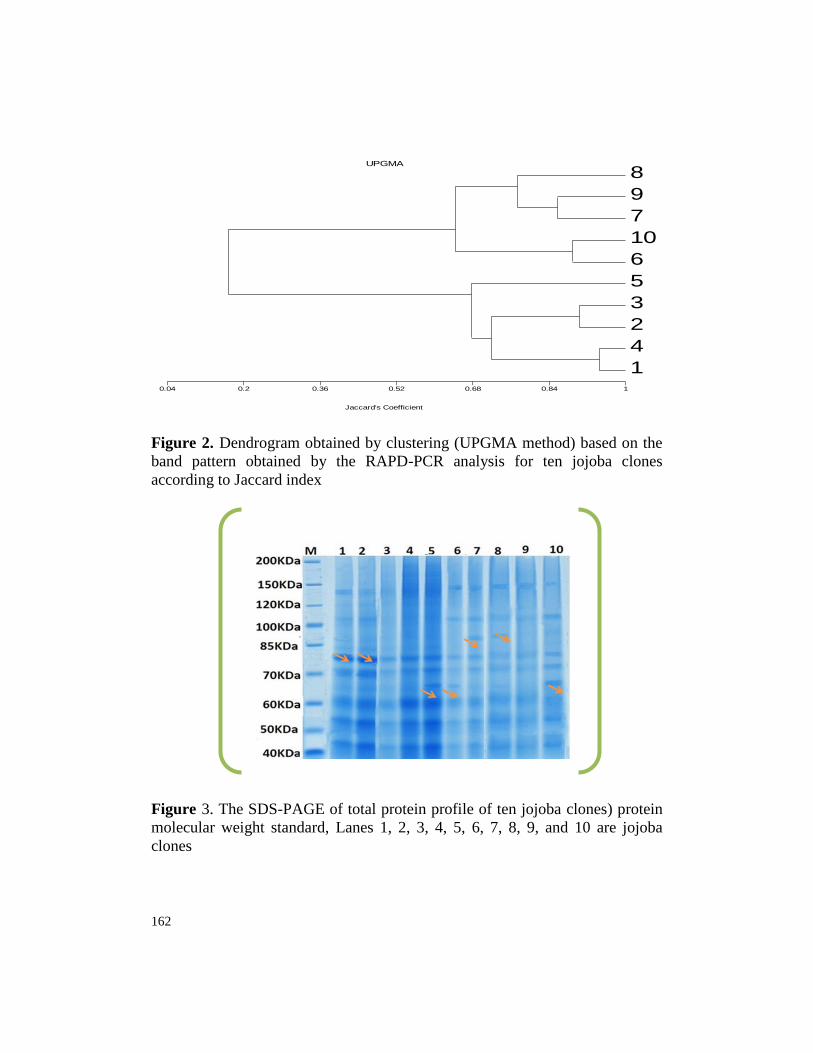
Cluster analysis of RAPD results
The RAPD band patterns were analyzed using UPGMA method to
generate a dendrogram indicating the relationship between ten jojoba clones.
The presence or absence of any particular DNA bands was the only factor
considered in the computer analysis. The generated dendrogram showed
linkage distance (Figure2) indicating that the ten jojoba clones were classified
into two main clusters. Cluster A includes two sub-clusters. Sub- cluster 1 was
divided into two groups. Group 1 includes clone7, and 9. Group 2 includes
clone 8. Sub- cluster 2 includes clones 6 and 10.Cluster B includes two sub-
clusters, sub- cluster 1 was divided into two groups, group 1 includes clones
1and 4. Group 2 includes clones 2 and 3, sub- cluster 2 includes clone 5.
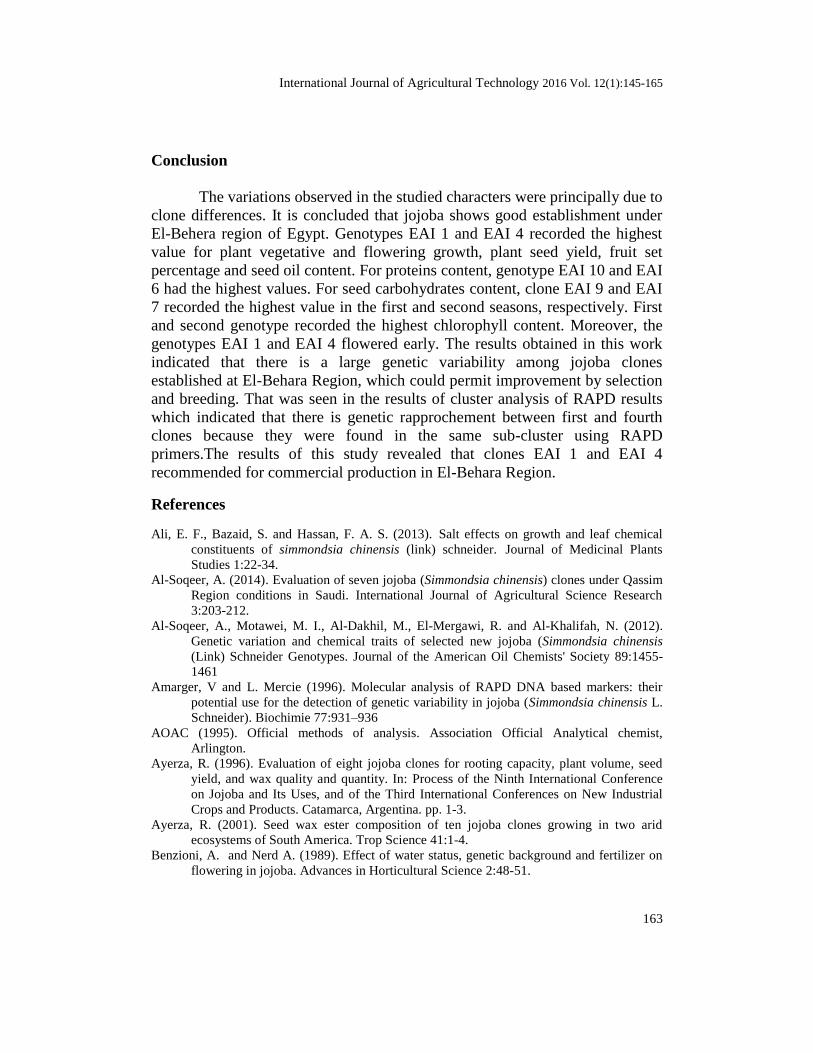
The differences in total protein band in the jojoba clones
Figure 3 showed the differences in total protein bands in ten jojoba
clones. New bands were appeared; also intensity was increased in some clones
compared with each other. Jojoba clones1 and 2 increased the intensity band at
80 kDa. 7 and 8 clones showed new band at 90kDa, while5, 6 and 10 clones
had new band at 65kDa.

International Journal of Agricultural Technology 2016 Vol. 12(1):145-165
161
Figure 1 - RAPD-PCR using primer A (OPA-
02), B (OPA-04) , C (OPA-05),D (OPA-09)
and E (OPA-12), M: DNA marker. Lanes1
(clone 1), Lanes2 (clone 2), Lanes3 (clone 3),
Lanes4 (clone 4), Lanes5 (clone 5), Lanes6
(clone 6), Lanes7 (clone 7), Lanes8 (clone 8),
Lanes9 (clone 9) and Lane10 (clone 10) are
jojoba clones
A B
C
D
D
E
162
Figure 2. Dendrogram obtained by clustering (UPGMA method) based on the
band pattern obtained by the RAPD-PCR analysis for ten jojoba clones
according to Jaccard index
Figure 3. The SDS-PAGE of total protein profile of ten jojoba clones) protein
molecular weight standard, Lanes 1, 2, 3, 4, 5, 6, 7, 8, 9, and 10 are jojoba
clones
UPGMA
Jaccard's Coefficient
1
4
2
3
5
6
10
7
9
8
0.04 0.2 0.36 0.52 0.68 0.84 1
International Journal of Agricultural Technology 2016 Vol. 12(1):145-165
163
Conclusion
The variations observed in the studied characters were principally due to
clone differences. It is concluded that jojoba shows good establishment under
El-Behera region of Egypt. Genotypes EAI 1 and EAI 4 recorded the highest
value for plant vegetative and flowering growth, plant seed yield, fruit set
percentage and seed oil content. For proteins content, genotype EAI 10 and EAI
6 had the highest values. For seed carbohydrates content, clone EAI 9 and EAI
7 recorded the highest value in the first and second seasons, respectively. First
and second genotype recorded the highest chlorophyll content. Moreover, the
genotypes EAI 1 and EAI 4 flowered early. The results obtained in this work
indicated that there is a large genetic variability among jojoba clones
established at El-Behara Region, which could permit improvement by selection
and breeding. That was seen in the results of cluster analysis of RAPD results
which indicated that there is genetic rapprochement between first and fourth
clones because they were found in the same sub-cluster using RAPD
primers.The results of this study revealed that clones EAI 1 and EAI 4
recommended for commercial production in El-Behara Region.
References
Ali, E. F., Bazaid, S. and Hassan, F. A. S. (2013). Salt effects on growth and leaf chemical
constituents of simmondsia chinensis (link) schneider. Journal of Medicinal Plants
Studies 1:22-34.
Al-Soqeer, A. (2014). Evaluation of seven jojoba (Simmondsia chinensis) clones under Qassim
Region conditions in Saudi. International Journal of Agricultural Science Research
3:203-212.
Al-Soqeer, A., Motawei, M. I., Al-Dakhil, M., El-Mergawi, R. and Al-Khalifah, N. (2012).
Genetic variation and chemical traits of selected new jojoba (Simmondsia chinensis
(Link) Schneider Genotypes. Journal of the American Oil Chemists' Society 89:1455-
1461
Amarger, V and L. Mercie (1996). Molecular analysis of RAPD DNA based markers: their
potential use for the detection of genetic variability in jojoba (Simmondsia chinensis L.
Schneider). Biochimie 77:931–936
AOAC (1995). Official methods of analysis. Association Official Analytical chemist,
Arlington.
Ayerza, R. (1996). Evaluation of eight jojoba clones for rooting capacity, plant volume, seed
yield, and wax quality and quantity. In: Process of the Ninth International Conference
on Jojoba and Its Uses, and of the Third International Conferences on New Industrial
Crops and Products. Catamarca, Argentina. pp. 1-3.
Ayerza, R. (2001). Seed wax ester composition of ten jojoba clones growing in two arid
ecosystems of South America. Trop Science 41:1-4.
Benzioni, A. and Nerd A. (1989). Effect of water status, genetic background and fertilizer on
flowering in jojoba. Advances in Horticultural Science 2:48-51.
164
Benzioni, A. and Dunstone, R. L. (1985). Jojoba flower buds: A possible role for abscisic acid
in controlling dormancy. Australia Journal Plant Physiology 12:463-470.
Benzioni, A., Palzkill, D. A. and Nelson, J. M. (1992). Flower bud dormancy, ABA
concentration, and survival during frost of jojoba genotypes under water stress. Journal
of the American Society for Horticultural Science 117:976-980.
Benzioni, A., Shiloh, E. and Ventura, M. (1999). Yield parameters in young jojoba plants and
their relation to actual yield in later years. Industrial Crops and Products 10:85-95.
Benzioni, A., Ventura, M. and De-Maleach, Y. (1996). Long-term effect of irrigation with
saline water on the development and productivity of jojoba clones. In Process of the
Ninth International Conferences on Jojoba and Its Uses, and of the Third International
Conference on New Industrial Crops and Products. Catamarca, Argentina. pp. 4-8.
Botti, C., Palzkill D., Muñoz, D. and Prat, L. (1998). Morphological and anatomical
characterization of six jojoba clones at saline and non-saline sites. Industrial Crops and
Products 9:53-62.
Caetano-Anolles, G., Bassam, B. J. and Bresshopp, P. M. (1991). DNA amplification
fingerprinting: a strategy for genome analysis. Plant Molecular Biology Reporter 9:294-
307.
Cappillino, P., Kleiman, R. and Botti, C. (2003). Composition of chilean jojoba seeds.
Industrial Crops and Products 17:177-182.
Dunstone, R. L. (1980). Jojoba flower buds: Temperature and photoperiod effects in breaking
dormancy. Australia Journal Plant Physiology 31:727-737.
Dunstone, R. L. (1988). The reproductive cycle of jojoba. In:7th International Conference on
Jojoba and its uses. American Oil Chemistry Assn., Champaign. pp. 50-59.
Dunstone, R. L. and Begg, J. E. (1983). A potential crop for Australia. The Australia Institute
Agriculture Science 51-59.
Ferriere, J., Milthorpe, P. L. and Dunstone, R. L. (1989). Variability in chilling requirements
for the breaking of flower bud dormancy in jojoba (Simmondsia chinensis [Link]
Schneider). Journal of Pomology and Horticultural Science 64:379-387.
Gaber, A. and Heba, M. M., El-Maraghy M. A. M., Nahed, A. K. R. and Gamal, E. A. Y.
(2007). Induction of somatic embryogenesis and DNA fingerprinting of Jojoba. Arab
Journal of Biotechnology 10:341-354.
Gayol, M. F., Labuckas, D. O., Oberti, J. C. and Guzmán, C. A. (2004). Characterization of
shungite by physical adsorption of gases. The Journal of the Argentine Chemical
Society 92:59-63.
Gentry, H. S. (1958). The natural history of jojoba (Simmondsia chinensis) and its cultural
aspects. Economic Botany 12:261-291.
Hiroshi, T., Yasuda, S. and Oginuma, K. (1992). Seed coat anatomy, karyomorphology, and
relationships of Simmondsia (Simmondsiaceae). The Botanical Magazine Tokyo 105:
529-538.
Istock, C. A., Ferguson, N., Istock, N. L. and Duncan, K. E. (2001). Geographical diversity of
genomic lineages in Bacillus subtilis (Ehrenberg) Cohn sensulato. Organic Diversity
Evology 1:179 -191.
Koller, H. B. (1972). Leaf area -leaf weight relationship in the soybean canopy. Crop Science
12:180-183.
Laemmli, U. K. (1970). Cleavage of structural proteins during the assembly of head of
bacteriophage T4. Nature 227:680-685.
Mckelvie, L., Bills, J. and Peat, A. (1994). Jojoba, blue mallee and broom bush: market
assessment and outlook, ABARE Research Report, Canberra.
International Journal of Agricultural Technology 2016 Vol. 12(1):145-165
165
Nelson, J. M. and Watson, J. E. (2001). Nitrogen fertilization effects on jojoba seed
production. Industrial Crops and Products 13:145-154.
Nelson, J. M., Palzkill, D. A. and Hart, G. L. (1997). Evaluation of jojoba clones at two
locations in arizona. Forage and Grain: A College of Agriculture Report.
Nybon, H. (1994). DNA fingerprinting: a useful tool in fruit breeding. Euphytica 77:59-64.
Osman, H. E. and Abo Hassan, A. A. (2013). Introducing jojoba in the Arabian desert:
agronomic performance of nine jojoba clones selected in Makkah area in Northern and
Western Saudi Arabia. International Journal Theor Apply Science 5:37-46.
Perez-Gil, F., Sangines, G. L., Torreblanca, R. A., Grande, M. L. and Carrasco, J. M. A. (1989).
Chemical composition and content of antiphysiological factors of jojoba (Simmondsia
chinensis) residual meal. Archivos Latinoamericanos De Nutricion 39:591-600.
Phillips, S. J. and Patricia, W. C. (2000). A natural history of the sonoran desert. university of
california press. pp. 256-257.
Prat, L., Botti, C. and Fichet, T. (2008). Effect of plant growth regulators on floral
differentiation and seed production in Jojoba (Simmondsia chinensis (Link) Schneider).
Industrial Crops and Products 27:44-49.
Purcell, H. C. and Purcell, H. C. (1988). Jojoba crop improvement through genetics. Journal
American Oil 65:1-13.
Purcell, H. C., Abbott, T. P., Holser, R. A. and Philips, B. S. (2000). Simmondsin wax ester
levels in 100 high-yielding jojoba genotypes. Industrial Crops and Products 12:151-157.
SAS Institute Inc. (1988). SAS/STAT User’s Guide, Release 6.03 Edition. SAS Institute, Cary,
NC.
Tobares, L., Frati, M., Guzmán, C. and Maestri, D. (2004). Agronomical and chemical traits as
descriptors for discrimination and selection of jojoba (Simmondsia chinensis) clones.
Industrial Crops and Products 19:107-111.
Ulger, S., Akdeþür, O. and Baktir, U. (2002). Selection of promising jojoba (simmondsia
chinensis link schneider) types in terms of yield and oil content. Turky Journal Forestry
Agriculture 26:319-322.
US National Research Council (1985). Jojoba: new crop for arid lands, new material for
industry. National Academy Press, Washington, DC.
Verbanic, C. J. (1986). Jojoba: Answer to sperm whale. Chemical Business. pp. 30-32.
Westwood, M. N. (1978). Dormancy plant hardiness. In: Temperate-zone pomology, San
Francisco, CA. pp. 299-319.
Wild, S. A., Corey, R. B., Lyer, J. G. and Voigt, G. K. (1985). Soil and plant analysis for tree
culture. Oxford and IBH Publishing Co., New Delhi, India.
Wintermans, J. F. G. M. and Mats, D. E. (1965). Spectrophtometeric characteristic of
chlorophyll and their pheophytins in ethanol. Biochemecal Biophysiology. pp. 448-453.
Wisniak, J. (1987). The chemistry and technology of jojoba oil. American Oil Chemistry
Society, Champaign, IL.
(Received: 28 December 2015, accepted: 5 January 2016)