
Increase in Expected Net Present Value Through Study Design
28
Increase in Expected Net Present Value Through Study Design Modifications Within Phase III - Jonathan R. Smith, Ph.D. June 28th, 2005, DIA Annual Meeting, Washington, DC
Transcript of Increase in Expected Net Present Value Through Study Design

Increase in Expected Net Present Value Through Study Design Modifications
Within Phase III
- Jonathan R. Smith, Ph.D.
June 28th, 2005, DIA Annual Meeting, Washington, DC

Outline of Presentation
• Introduction• Impact on Expected NPV (ENPV) through:
– Choice of Power Level & Number of Pivotal Trials– Analysis Improvements– Number & Timing of Interim Analyses for
Early Demonstration of Efficacy
• Overview of New Types of Adaptive Designs– Financial Impact of Power Re-Assessment
• Conclusions

Example Decision Tree
Submit NDA
Trials both +ve& no safety probs
1 or 2 Trials -veor safety probs
0.688
0.312
Prob = 0.312PV = -$32.8m
Prob = 0.620PV = $767.7m
Prob = 0.069PV = -$36.0m
FDAApprove
FDA NotApprove
0.9
0.1
ENPV = (0.620 x $767.7m) -(0.069 x $36.0m) -(0.312 x $32.8m) = $463.0m

Calculation of Expected Net Present Value
• Define the Set of All Possible Outcomes from thedrug development program for a particular compound– e.g., Phase III results -ve, Phase III results +ve but not
approved, etc.
• For Each Outcome– Determine total costs & total return (if any)– Convert all costs & returns to present values (PVs)
• I use an annual interest rate of 10% in my examples
– Estimate probability of this outcome occurring
• The Expected Net Present Value (ENPV) is then aWeighted Sum of the PVs
Modelling the ENPV- Assumptions for Example 1
The following components of this model aredescribed in turn:
(a) Study Designs(b) Site Enrollment Patterns & Trial Costs(c) Chance of Success(d) Assumptions re: Time and NDA(e) Projected Yearly Sales(f) Post-Approval Costs

Example 1 - Assumptions:(a) Study Designs
• 2 or more Phase III Trials are carried out• Primary Endpoint is Continuous• 1m run-in + 6m on treatment• Standardized Effect Size of 0.18• 1442 Patients Per Trial (if 2 pivotals each at 90%
power)

Example 1 - Assumptions:(b) Site Enrollment Patterns & Trial Costs
• 200 Sites are Available for Phase III Program– Sites 1-50 enroll at 1.25 ppm,– Sites 51-100 at 1.00 ppm,– Sites 101-150 at 0.75 ppm,– Sites 151-200 at 0.5 ppm– Same # of sites used for each pivotal
• Assumed Cost per Phase III Trial= $1.0m +$0.04m x # of Sites + $0.009m x # of Patients
= $18.0m per Phase III[If 2 pivotals at 90% power]

Example 1 - Assumptions:(c) Chance of Success
• Probability a given Pivotal is Positive = Power– Assumes we have effect size correct– Later I assume a distribution on effect size
• Chance of having No Limiting Safety Probs = 0.85 (given that Phase III trials show efficacy)
• FDA Chance of Approval =0.90(given submit w' 2 +ve trials & no limiting safety probs.)
• Overall Chance of FDA Approval w' 2 Pivotals= 0.90 x 0.85 x (Power)2
= 0.62 (if power = 0.90)

Example 1 - Assumptions:(d) Time & NDA
• Study Start-Up = 3 mths• Two Pivotals Run Exactly in Parallel• Time from LPO to NDA Submission = 5.5 mths• NDA Review Time = 12 mths• NDA Cost =$4million

Example 1 - Assumptions:(e) Projected Sales by Year
0
100
200
300
400
500
0 1 2 3 4 5 6 7 8 9 10 11
Years on Market
Sale
s ($
mill
ions
)
•Examples assume Peak Sales = $500m and 15 yrs of Patent Remain Prior toStarting Phase III•Only include Sales Until Patent Expiration
Curve shapebased onGrabowski et al,2002

Example 1 - Assumptions:(f) Post-Approval Costs
• Launch Costs = $15m + 0.12 x Projected Peak Sales,e.g., $75m if projected peak sales = $500m
• Annual Manufacturing & Marketing Costs= $25m + 0.15 x Annual Sales
• Launch costs spread over 3m between FDA approvaland market entry
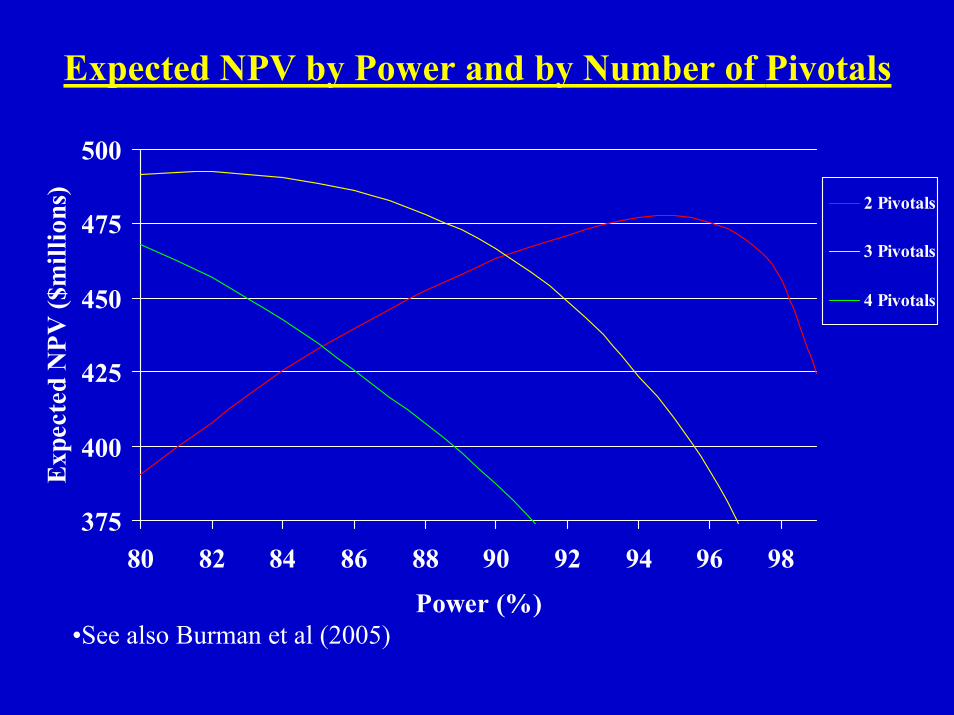
Expected NPV by Power and by Number of Pivotals
375
400
425
450
475
500
80 82 84 86 88 90 92 94 96 98
Power (%)
Exp
ecte
d N
PV ($
mill
ions
)
2 Pivotals
3 Pivotals
4 Pivotals
•See also Burman et al (2005)
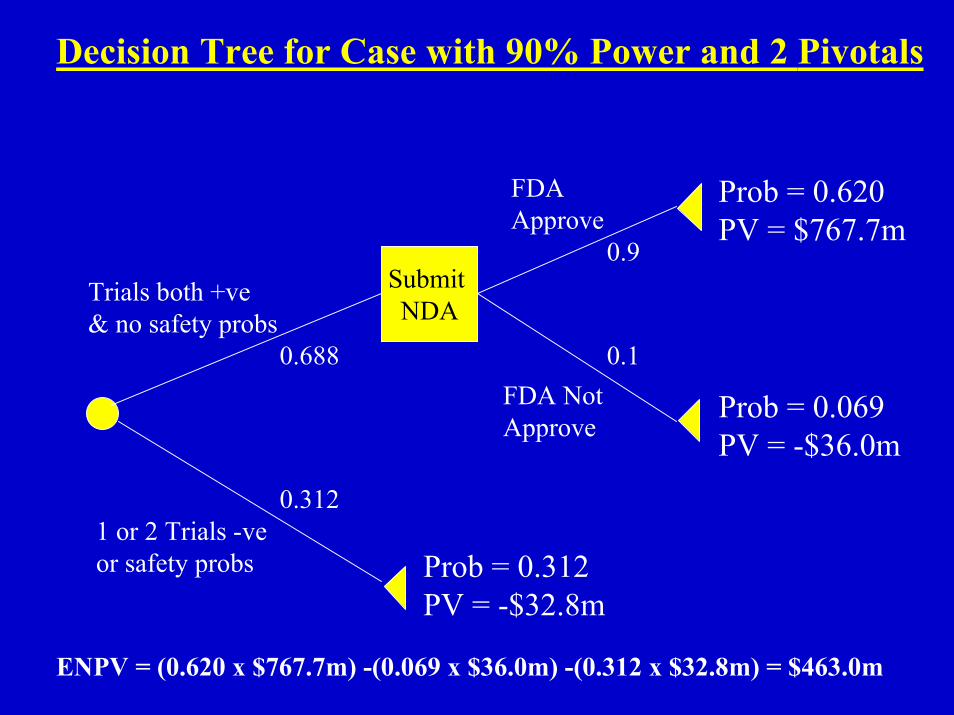
Decision Tree for Case with 90% Power and 2 Pivotals
Submit NDA
Trials both +ve& no safety probs
1 or 2 Trials -veor safety probs
0.688
0.312
Prob = 0.312PV = -$32.8m
Prob = 0.620PV = $767.7m
Prob = 0.069PV = -$36.0m
FDAApprove
FDA NotApprove
0.9
0.1
ENPV = (0.620 x $767.7m) -(0.069 x $36.0m) -(0.312 x $32.8m) = $463.0m

Power that gives Highest Expected NPV- by Peak Sales and by Patent Life
Patent Remaining
at Start of
Phase III (years)
Peak Sales
($millions)
Optimal Power
Per Trial
(when 2 pivotals)
ENPV
($millions)
10 $100m No Trial 0
10 $500m 86% $120m
10 $1000m 88% $327m
15 $100m 80% $3m
15 $500m 95% $478m
15 $1000m 95% $1080m

Extensions to the Previous Approach
• Allow Possibility of Conducting 3rd Pivotal if 1 out of 2Pivotals +ve (& no major safety probs)
• Do Not Assume that Effect Size is Known Exactly• Could average power over a distribution on ∆• In case where I did this, ENPV reduced by about 7%
• Allow Sales to Depend on Effect Size• Could also base on predictive distribution for effect size [See Johns & Andersen (1999), Pallay (2001), Stallard et al (2005)]
• Allow for Impact of Position-To-Market on Sales
Note: Extensive Sensitivity Analysis is Always Needed

Gain in Expected NPVThrough Improved Analysis
• Suppose with 2 pivotals in previous example wechoose N so that Power = 80%
• Suppose Improved Statistical Analysis Increases PowerPer Trial to 85% or 90% (without extra patients)
• Still consider $500m peak sales, 15 year patent• Then we Obtain these Gains in ENPV:
Power fromAnalysis
ENPV ($millions) Gain in ENPV($millions)
80% $390.5m85% $444.2m $53.7m90% $501.2m $110.7m

Example 2 - Study Design• Primary Endpoint is Time-To-Event
• Suppose we Need Only 1 Phase III Trial with α = 0.050e.g., w' primary endpoint = time-to-death
• Hazard Ratio = 1.25 (60m/48m)
• Enrollment Duration = 18m (150 sites)
• Trial Continues until Fixed # of Events Occur– Expect this # reached at 42m
• One Interim built in At 50% (for early demo of efficacy)
• With 90% power we need 850 events from 2582 patients

Example 2 - Assumptions
Same Assumptions as for Example 1 Except:
• Trial Cost now also must allow for:– the Variable Patient Duration– Cost of Interim(s)
• Trial Cost = $4.0m + $0.04m x # of Sites + $0.002m x # of Pts
+$0.007m x Average Pt Duration (yrs)+ $1.0m x # of Interims
= $55.4m

Example 2 -Gains Through Changes to Interim Analysis?
• Current Design would have– Interim at 50% (24m projected)– Final at 100% (42m projected)
• Key Questions re: Impact of Interim Analyses onENPV:– Can we increase ENPV if we include More Interims?– How does Timing of Interims impact ENPV?– Do we increase ENPV if we Change α-Spending Fn?
• currently O'Brien-Fleming (OBF)

Example 2 - Impact of Timing of Looks andHow we "Spend" Alpha
• Suppose Interim #1 Cannot Be Sooner Than 50%– Based on Safety Dbase needs and Long-Term Efficacy needs
• When Should we Take the 2 Interim Looks?– Having Interims at 50% & 75% gives v. close to Max. ENPV
• Could Increase ENPV by up to 3% by Using Less Conservative Method (Pocock) to spend α
– but Current Method (OBF) Performs Well if we have Over-Estimated HR
[See also Gould et al (2004), Burman & Senn (2003)]
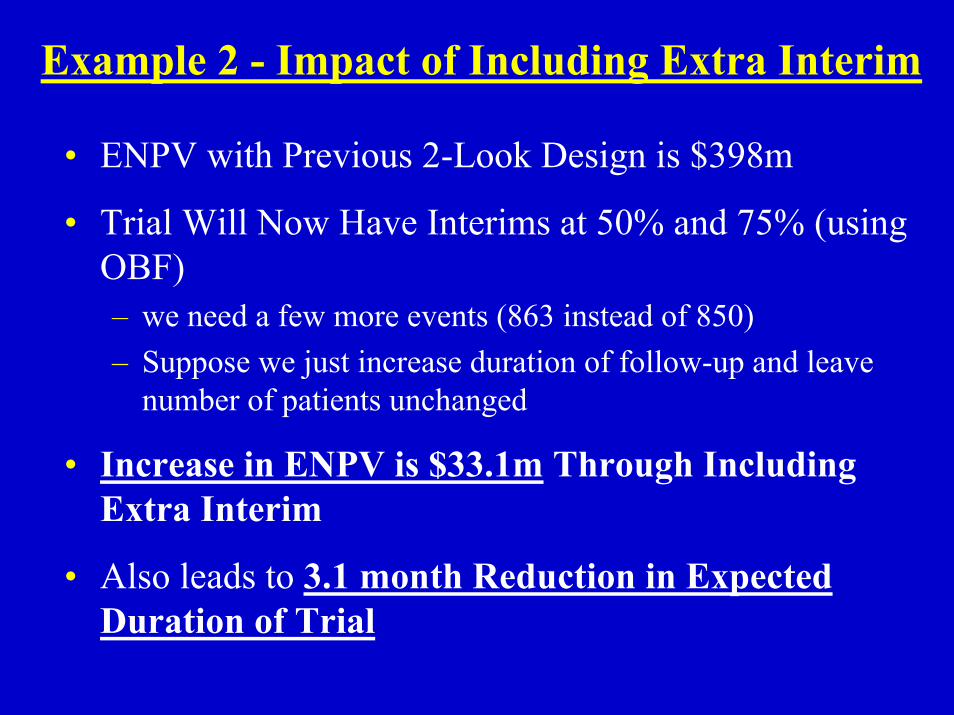
Example 2 - Impact of Including Extra Interim
• ENPV with Previous 2-Look Design is $398m
• Trial Will Now Have Interims at 50% and 75% (usingOBF)– we need a few more events (863 instead of 850)– Suppose we just increase duration of follow-up and leave
number of patients unchanged
• Increase in ENPV is $33.1m Through IncludingExtra Interim
• Also leads to 3.1 month Reduction in ExpectedDuration of Trial
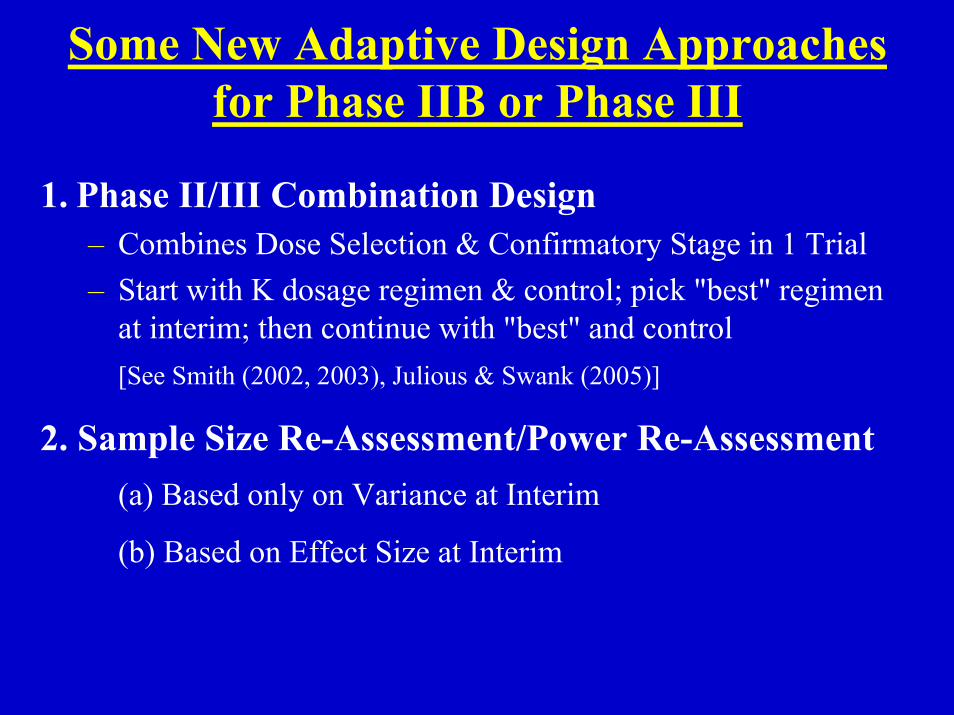
Some New Adaptive Design Approachesfor Phase IIB or Phase III
1. Phase II/III Combination Design– Combines Dose Selection & Confirmatory Stage in 1 Trial– Start with K dosage regimen & control; pick "best" regimen
at interim; then continue with "best" and control[See Smith (2002, 2003), Julious & Swank (2005)]
2. Sample Size Re-Assessment/Power Re-Assessment(a) Based only on Variance at Interim
(b) Based on Effect Size at Interim

Example 3 - Power Re-AssessmentBased on Effect Size at the Interim
Details of Power Re-Assessment used in Example 3:
• Method Weights Events Equally– Leads to small change in α
• Increase in # of Events but Not # of Patients
• Power Re-Assessment Occurs at just before Target # ofEvents is reached
• Power Re-Assessment lengthens trial by ≤ 6m

Example 3 - Power Re-AssessmentBased on Effect Size at the Interim, cont'd
Assume Same set-up as Example 2, except:• Not Enough Safety or l/t Efficacy Data to Stop Before
M39– Therefore Cannot Have Early Interim(s)
• Build in Power Re-Assessment 2-3m before EOS• Overall Power of Trial still 90%• Use Same # of Patients as before• Max/Min # of Events ≤ 1.15

Example 3 - Power Re-AssessmentBased on Effect Size at the Interim, cont'd
• Without Power Re-Assessment– Trial Always Continues Until M42 (844 events)
• With Power Re-Assessment (at M36)– 88% of Time Trial Continues only to M39 (781 events)– 12% of Time Trial Continues to M45 (898 = 1.15 x 781
events) if Interim Results are "Intermediate"
[See also Liu et al (2004), Mehta (2004)]
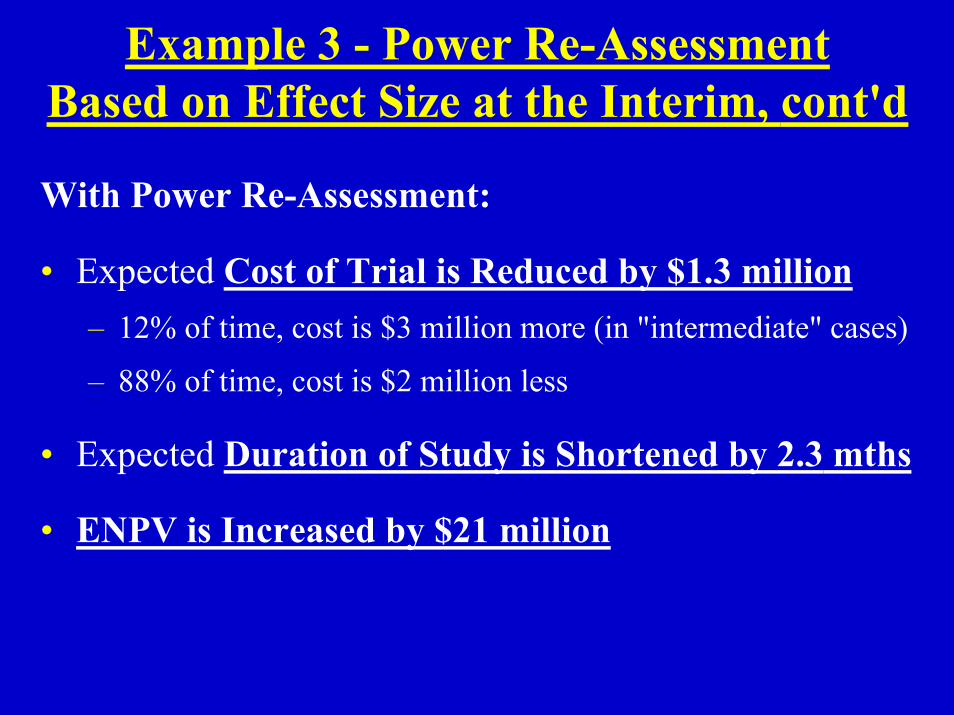
Example 3 - Power Re-AssessmentBased on Effect Size at the Interim, cont'd
With Power Re-Assessment:
• Expected Cost of Trial is Reduced by $1.3 million – 12% of time, cost is $3 million more (in "intermediate" cases)
– 88% of time, cost is $2 million less
• Expected Duration of Study is Shortened by 2.3 mths
• ENPV is Increased by $21 million
Conclusions
• ENPV Can be Calculated in Real TrialSituations Even for Complicated Study Designs
• Each Situation Should be Considered on a Case-by-Case Basis
• Carrying Out Extensive Sensitivity Analyses isAlways Very Important
[Point Estimates for ENPV were only used in examples here forSimplicity of Presentation]

Conclusions, cont'd
• The Following Can Have A Large Impact onENPV:– Choice of Power Level– Number of Pivotals Conducted– Incorporation of Improved Analysis Methods
• ENPV Can often Be Increased & Expected Study Duration Decreased by:– Changes to # and Timing of Interims (for early
demonstration of efficacy)– Incorporation of Power Re-Assessment


![[INFOGRAPHIC] LNG Expected to Increase Presence in Rail and Marine Transportation Significantly](https://static.fdocuments.in/doc/165x107/55836a40d8b42a360c8b4f2c/infographic-lng-expected-to-increase-presence-in-rail-and-marine-transportation-significantly.jpg)


