Incorporating risk analysis and multi-criteria decision ... · Incorporating risk analysis and...
8
Reliability, Risk and Safety: Theory and Applications – Briš, Guedes Soares & Martorell (eds) © 2010Taylor & Francis Group, London, ISBN 978-0-415-55509-8 Incorporating risk analysis and multi-criteria decision making in electricity distribution system asset management M.D. Catrinu SINTEF Energy Research, Trondheim, Norway D.E. Nordgård Norwegian University of Science and Technology, Trondheim, Norway ABSTRACT: This paper discusses techniques for integrating risk and multi-criteria analysis in electricity distribution system asset management. The focus is on the tasks of the distribution company asset managers whose challenge is to incorporate the different company objectives and risk analysis into a structured decision framework when deciding how to handle the company physical assets. 1 INTRODUCTION Electricity distribution networks are considered natu- ral monopolies and therefore companies operating and maintaining these networks are under regulatory con- trol. Although the regulatory practice is different in each country, the goal is generally the same: to assure good service quality, higher efficiency in using the net- work and lower costs/prices. Hence, when managing their physical assets, distribution companies are asked to increase reliability and use less human and financial resources. This presents a challenge for asset man- agers that are constrained in distributing the amount of resources available, on different maintenance and reinvestment actions (Yeddanapudi et al. 2008). Distribution system asset management (DSAM) is a complex process comprising the lifecycle manage- ment of a large number of geographically distributed assets. The failure of one or several assets may cause system failures (power supply interruption), with neg- ative consequences on company economy and repu- tation, personnel safety or the environment. However, not all assets pose the same risks given their failure and therefore, from a risk perspective, not all assets deserve the same level of attention. Proper identification and assessment of risks are keys factors in DSAM. Generally, asset managers (AMs) in electricity dis- tribution companies recognize the need and the chal- lenge of adding structure and a higher degree of formal analysis into increasingly complex asset management decisions (Nordgård, 2008). Examples of such decisions are: ‘Maintain or replace a specific asset or asset group?’; ‘Which (how many) assets to maintain and which (how many) assets to replace?’; ‘How often to maintain?’; ‘When to replace?’ In almost all cases, the answer should be based on an assessment of the foreseeable risks associ- ated with the assets and an evaluation of consequences a decision would have on company’s economy and reputation, personnel safety or the environment. This paper focuses on decision support tools for risk assessment and multi criteria analysis that can be used in DSAM decision making. We give a short overview of available theoretical methods and discuss some of the challenges of applying these methods in practice. A case study is presented for illustrating the use of risk and multiple criteria assessment in an integrated framework for designing maintenance and reinvestment strategies for 12 kV MV air insulated switch-disconnectors. 2 MULTIPLE CRITERIAAND UNCERTAINTY IN DISTRIBUTION SYSTEM ASSET MANAGEMENT 2.1 Criteria in distribution system asset management DSAM decisions concerning specific assets or asset groups are, in general, of a multi-criteria nature. Because of the role electricity infrastructure has in the society, and because of regulatory pressure, dis- tribution companies must balance economy (costs and profits) against reliability, quality of supply, person- nel safety and other aspects. In other words an asset or network failure might lead to more or less criti- cal incidents with consequences for the company and customers, personnel or third party safety, etc. Asset management decisions must be in line with the company’s overall objectives, and the role of the AM is to make these objectives operational at lower decision levels. The challenge is to balance the eval- uation of consequences at company level with the evaluation of consequences of daily operational rou- tine and maintenance decisions. In general, criteria at 393
Transcript of Incorporating risk analysis and multi-criteria decision ... · Incorporating risk analysis and...

Reliability, Risk and Safety: Theory and Applications – Briš,Guedes Soares & Martorell (eds)
© 2010 Taylor & Francis Group, London, ISBN 978-0-415-55509-8
Incorporating risk analysis and multi-criteria decision makingin electricity distribution system asset management
M.D. CatrinuSINTEF Energy Research, Trondheim, Norway
D.E. NordgårdNorwegian University of Science and Technology, Trondheim, Norway
ABSTRACT: This paper discusses techniques for integrating risk and multi-criteria analysis in electricitydistribution system asset management. The focus is on the tasks of the distribution company asset managerswhose challenge is to incorporate the different company objectives and risk analysis into a structured decisionframework when deciding how to handle the company physical assets.
1 INTRODUCTION
Electricity distribution networks are considered natu-ral monopolies and therefore companies operating andmaintaining these networks are under regulatory con-trol. Although the regulatory practice is different ineach country, the goal is generally the same: to assuregood service quality, higher efficiency in using the net-work and lower costs/prices. Hence, when managingtheir physical assets, distribution companies are askedto increase reliability and use less human and financialresources. This presents a challenge for asset man-agers that are constrained in distributing the amountof resources available, on different maintenance andreinvestment actions (Yeddanapudi et al. 2008).
Distribution system asset management (DSAM) isa complex process comprising the lifecycle manage-ment of a large number of geographically distributedassets. The failure of one or several assets may causesystem failures (power supply interruption), with neg-ative consequences on company economy and repu-tation, personnel safety or the environment. However,not all assets pose the same risks given their failure andtherefore, from a risk perspective, not all assets deservethe same level of attention. Proper identification andassessment of risks are keys factors in DSAM.
Generally, asset managers (AMs) in electricity dis-tribution companies recognize the need and the chal-lenge of adding structure and a higher degree of formalanalysis into increasingly complex asset managementdecisions (Nordgård, 2008).
Examples of such decisions are: ‘Maintain orreplace a specific asset or asset group?’; ‘Which (howmany) assets to maintain and which (how many) assetsto replace?’; ‘How often to maintain?’; ‘When toreplace?’ In almost all cases, the answer should bebased on an assessment of the foreseeable risks associ-ated with the assets and an evaluation of consequences
a decision would have on company’s economy andreputation, personnel safety or the environment.
This paper focuses on decision support tools forrisk assessment and multi criteria analysis that canbe used in DSAM decision making. We give a shortoverview of available theoretical methods and discusssome of the challenges of applying these methodsin practice. A case study is presented for illustratingthe use of risk and multiple criteria assessment in anintegrated framework for designing maintenance andreinvestment strategies for 12 kV MV air insulatedswitch-disconnectors.
2 MULTIPLE CRITERIA AND UNCERTAINTYIN DISTRIBUTION SYSTEMASSET MANAGEMENT
2.1 Criteria in distribution system assetmanagement
DSAM decisions concerning specific assets or assetgroups are, in general, of a multi-criteria nature.Because of the role electricity infrastructure has inthe society, and because of regulatory pressure, dis-tribution companies must balance economy (costs andprofits) against reliability, quality of supply, person-nel safety and other aspects. In other words an assetor network failure might lead to more or less criti-cal incidents with consequences for the company andcustomers, personnel or third party safety, etc.
Asset management decisions must be in line withthe company’s overall objectives, and the role of theAM is to make these objectives operational at lowerdecision levels. The challenge is to balance the eval-uation of consequences at company level with theevaluation of consequences of daily operational rou-tine and maintenance decisions. In general, criteria at
393

lower decision levels are easier to operationalize andmeasure than criteria at higher decision levels. Forexample, we can say that each component in the net-work operates in unique conditions and has an uniquerole and position with respect to the other assets in thenetwork. It can be therefore difficult to generalize aset of rules to measure these criteria (performances)for all assets of a similar type, and even more difficultwhen it comes to the entire asset base.All these aspectshave to be taken into consideration if a multi-criteriaapproach is to be used in asset management decisions.
2.2 Uncertainty in distribution system assetmanagement
Many decision elements in DSAM are uncertain dur-ing a real decision making process: what can go wrongwith an asset or within a distribution system, how likelyis that a system or asset fails and what will be theconsequences.
Many classifications exist for uncertainty and riskin decision making. For example Stewart (Stewart,2005), differentiates between two uncertainty aspects:‘external’ uncertainty and ‘internal’ uncertainty.
The ‘external’ uncertainty, according to Stewart,refers to the lack of knowledge about the consequencesof a particular choice (decision). In this paper we con-sider that external uncertainty resides in the estimationof the problem ‘data’, e.g.: probabilities and conse-quences. In this category we would like to include twosub-types:
1. Uncertainty that arises because of natural, unpre-dictable variations associated with the system orthe environmental – aleatory uncertainty. This typeof uncertainty is outside the control of the decisionmaker, e.g. the 100 years big storm, variations inthe material fatigue in specific system components,etc.
2. Uncertainties that stem from lack of knowledgeabout different phenomena – epistemic uncertainty.This uncertainty resides from the lack of data tocharacterize the system or component failure, thelack of understanding and proper modeling of assetdeterioration processes, the poor understanding offailure interdependencies in the system (physicalor other phenomena) or the poor understanding ofinitiating events.
The ‘internal’uncertainty can be better described asambiguity / imprecision in decision making and mostof it is due to the uncertainty in problem ‘data’. Itreflects the imprecision in human judgements: prefer-ences, values and risk attitudes. This uncertainty canstem from insufficient problem understanding, insuf-ficient data, insufficient modelling, little acceptanceof modelling assumptions, etc.
Under many circumstances a boundary betweenexternal and internal uncertainties is difficult (if notimpossible) to draw, but this differentiation is neces-sary because each uncertainty aspect has in generaldifferent implications for the decision support process,
and the designs of decision support tools as it will bediscussed further.
3 THEORETICAL APPROACHES TOMULTI-CRITERIA DECISION MAKINGUNDER UNCERTAINTY
The most common representation of a multi-criteriaproblem is in a matrix form, where the set of alterna-tives (A) is mapped against a set of criteria (C). Makinga decision in this setting means choosing an alternativebased on an evaluation of outcomes aik.
When there is no uncertainty about the outcomesthere is a direct correspondence between alterna-tives and consequences in terms of the criteria – aik.Moreover, aik are deterministic.
Essential in multi-criteria decision analysis (MCDA)is the assumption that when analysing such a multi-dimensional decision problem, the decision maker(DM) has a set of values, preferences, and that thesevalues can somehow be modelled. One of the mostused theories for this purpose is the multi-attributevalue function theory (MAVT) (Belton & Stewart,2002). MAVT provides the background for modellingpreferences by constructing a value function V(Ai)based on a comparison of outcomes in each criterion(scores) and a comparison of criteria (weights). In itssimplest form, this value function is additive and canbe written as in the following:
where vk (aik ) are the scores and wk are the weights.Under uncertainty there may exist many possible
values for the outcomes aik at the time of decision(external uncertainty) and often the values (scores andweights) can be difficult to express (internal uncer-tainty). Under uncertainty outcomes can be describedquantitatively (through probabilistic quantities), fuzzy,or quantitatively (through verbal descriptions) – when
Figure 1. The decision matrix.
394

outcomes are not fully known or understood. Veryoften scenarios (future states of the world) are con-structed in order to simulate the consequences (quan-titative or qualitative) the decisions alternatives mighthave in terms of the different criteria. In the construc-tion of scenarios, approaches like Bayesian Networks(BN) and influence diagrams or fault and events threes,are often used to understand and model random eventsand how they affect outcomes.
There are two main approaches to resolve uncer-tainty in MCDA (Stewart, 2005). One approach is toresolve first the uncertainty in outcomes by somehowreducing the set of possible aik to single values andthen solve the MCDA problem in a ‘deterministic’ set-ting. Uncertainty ‘aggregation’ can be done by using adecision paradigm such as: expected values, utilities,MaxMin, MinMax, MinRegret, etc. or to define riskas a separate criterion. The other approach is to definescenarios with associated probabilities of occurrenceand evaluate alternatives in each scenario – however,the theoretical background for integrating MCDA andscenario planning is not yet fully developed (Stewart,2005).
The ‘main’ method for modelling preferencesunder uncertainty is the Multi-Attribute Utility The-ory (MAUT). In its simples (additive) form, a multiattribute utility function resembles a multi-attributevalue function. The way to find parameters of a util-ity function is however different. While in the caseof MAVT the scores and weights can be determinedbased on direct comparison of consequences, in thecase of MAUT these components are found throughlottery types of questions (Keeney & Raiffa, 1999).
MAUT measures ‘complete’ preferences underuncertainty. However, because preferences may notalways be completely specified (internal uncer-tainty), methods have been developed to deal withvalue intervals, qualitative estimations and incom-pletes in judgements. Examples of such methods are:PRIME (Preference Ratios In Multi-attribute Evalua-tion) (Salo & Hämäläinenn, 2001) and ER (EvidentialReasoning) approach (Yang & Xu, 2002), amongothers.
Without going further into theory and method clas-sifications, we summarize that dealing with uncer-tainty in multi-criteria analysis in practice requiresmethods to:
1) Represent and understand uncertainty in outcomes(data), and
2) Model preferences and risk attitudes.
4 CHALLENGES IN APPLYING MCDA ANDRISK ANALYSIS TECHNIQUES INPRACTICE
The successful application of multi-criteria approachesrelies on effective facilitation by a decision analystor on the ability and willingness of individual usersto make an effective use of an approach, without
becoming experts in the fields of MCDA or risk anal-ysis. The main challenge in both cases is to make usein the best way, of:
1) the information available, and2) the existing tools and personnel competences, i.e.
to build upon the decisions support tools availablein a decision situation in distribution system assetmanagement.
An integrated MCDA and risk analysis may seem asthe ultimate tool to gather all information available ina decision situation, and to obtain ‘The’ answer, butthis is not the case. The advantages of using such anapproach in real life decision support are:
1) a better problem understanding2) a better understanding on how DM’s judgments at
a given moment in time, contribute to the finaldecision.
However, the decision must be important enoughto justify the extra time and resources necessary inusing such an approach. The approach is not betteror worse than traditional ones and it does not replacefundamental analyses, but it can only improve it.
4.1 Available information
The amount, accuracy and relevance of informa-tion are crucial for problem understanding, modelingand the final decision. In distribution system assetmanagement the following information is essential:
– Information about each equipment/asset: installa-tion year, condition, historical failure rates, failuremechanisms, specific maintenance activities, etc.
– Information about the system: critical components,interdependencies, consequences of failure for thecustomers, the company and the environment.
In general, the easiest to access is information about:manufacturer equipment specifications, age and sta-tistical failure rates, costs of repair and replacement.
However, some of this information is not alwaysavailable in a format suitable to the problem at hand.For example, various sources of statistics exist forspecific equipment, but often they are not in theright format for providing sufficient information ina specific situation. Companies may have specificpractices and formats for recording failures, main-tenance history, etc. Often, different databases andstatistics must be compared and completed with expertevaluations.
Moreover the cost of repair and replacement forsingle components should be considered as evolv-ing over time and as dependent on the existingspare parts in stock, available providers, technologicaladvances, etc.
Then, the information must be structured and com-bined in order to provide further essential cluessuch as: equipment condition, failure modes andconsequences, equipment criticality, environmentalimpact, etc.
395

4.2 Existing tools for asset managementin distribution networks
Traditionally, electrical engineers have relied most ontechnical models/data, statistics and their own experi-ence, and less on decision support models. However,because asset management decisions have becomemore complex, this trend is changing, and differenttypes of models and tools used ‘traditionally’ decou-pled are now being integrated in order to offer the bestavailable decision support.
The ‘tools’ available and used by AMs in electricitydistribution companies can be classified as following:
– databases for recording asset information, faults,damages, system operation and maintenance prac-tice
– software used for a complete distribution systemrepresentation, power flow and reliability modeling
– management tools used at higher decision levels:economic calculations, balance scorecards, or riskmatrices.
Generally, AMs recognize the need and the challengeof adding structure and a higher degree of formalanalysis into increasingly complex asset managementdecisions (Nordgård, 2008). One example is the wayrisk matrices are used in practice. Undesired events areplaced in a risk matrix based on an overall expert eval-uation of probability and consequences. There is verylittle practical use of tools for understanding and mod-eling equipment condition, aging, and failure modesand how this information (if available) could be usedfurther in risk assessment, completion of risk matricesand asset management decisions.
5 INTEGRATING RISK AND MCDAANALYISIS IN ASSET MANAGEMENTDECISION MAKING
This chapter offers an example of how an integratedframework for risk and MCDA analysis can be used indesigning asset maintenance strategies for 12 kV MVair-insulated switch-disconnectors.
The scope of this study is to illustrate how a main-tenance and reinvestment strategy can be designed inorder to manage the risks and costs associated withthese assets. A strategy is considered to be a set ofrules about what to do with different types of assets,e.g. whether to maintain or replace them. The case isbuilt upon previous research reported in (Nordgård,2008; Nordgård & Sand 2008) and has as focus onpersonnel injury caused by malfunction of manuallyoperated switch with a burning electric arc as a result.
5.1 Description of the case
There are 12 kV MV air-insulated switch-disconnectorsin electricity distribution networks. These assets arelocated in MV/LV sub-stations and their function is tobreak the load current when sectioning the MV grid.
In general, these assets are not particularly critical orimportant from a system/security of power supply per-spective. However, the operation and maintenance ofspecific types of switch-disconnectors in specific con-ditions may pose non-negligible personnel safety risks.
Factors such as equipment type, condition and oper-ation environment may lead to switch pole stuck orslow operation thus incorrect breaking of the currentand personnel injuries. In the transient period afterthe opening of the switch – when there is no longerphysical contact between the switches’ poles – thecurrent will continue to flow through an electric arcuntil the natural zero-crossing of the alternating cur-rent. Normally the electric arc will then extinguish ina controlled manner, and the breaking of the currentis successful. However, in some cases, when there is aslow movement of the switch during operation, thearc will re-ignite and current will continue to flowthrough, generating energy dispersion through heat(with accompanying pressure rise) and creating sta-ble burning conditions. This will pose a safety risk forthe operator.
In this study we consider a distribution networkhaving in its structure the following types of switch-disconnectors:
– full encapsulated switches (steel plate coveredcubicles, with pressure relieving outlets in safedirections)
– semi encapsulated switches (steel plated cubiclefronts, but the top and bottom of the cubicle is open)
– wire fence switch cubicles (only wire fences –supplies little protection from electric arcs comingfrom the switchgear).
The reason for different encapsulations is that thesubstations have been built over quite a long periodof time, during which the technical solutions haveimproved from the wire fence solution to the fullencapsulations.
5.2 Risk analysis and modeling
The first step in the analysis was to clarify whether allassets pose the same risk or if different asset groupscan be identified based on risk differentiation.
A Bayesian Network (BN) modeling approach hasbeen used to analyze the safety risk (expressed as PLL– Potential Loss of Life) associated with different assetgroups, considering today’s condition of componentsand maintenance practice.
The BN model is illustrated in Figure 2 and hasbeen developed in (Nordgård & Sand 2008). This ref-erence paper contains all details about the data andassumptions made.
Several factors have been identified by experts inthe field, as being relevant for differentiating the pop-ulation of the switches: switch type (encapsulation),age and operating environment.
Asset’s age, operating environment and mainte-nance practice are important in the estimation ofdifferent failure modes (burning electric arc). Two age
396
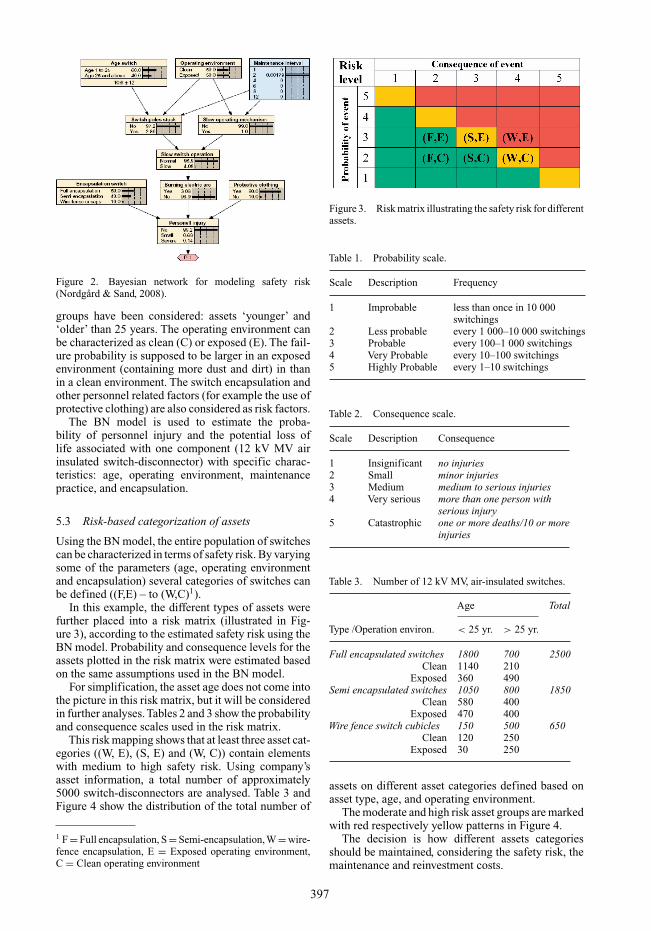
Figure 2. Bayesian network for modeling safety risk(Nordgård & Sand, 2008).
groups have been considered: assets ‘younger’ and‘older’ than 25 years. The operating environment canbe characterized as clean (C) or exposed (E). The fail-ure probability is supposed to be larger in an exposedenvironment (containing more dust and dirt) in thanin a clean environment. The switch encapsulation andother personnel related factors (for example the use ofprotective clothing) are also considered as risk factors.
The BN model is used to estimate the proba-bility of personnel injury and the potential loss oflife associated with one component (12 kV MV airinsulated switch-disconnector) with specific charac-teristics: age, operating environment, maintenancepractice, and encapsulation.
5.3 Risk-based categorization of assets
Using the BN model, the entire population of switchescan be characterized in terms of safety risk. By varyingsome of the parameters (age, operating environmentand encapsulation) several categories of switches canbe defined ((F,E) – to (W,C)1).
In this example, the different types of assets werefurther placed into a risk matrix (illustrated in Fig-ure 3), according to the estimated safety risk using theBN model. Probability and consequence levels for theassets plotted in the risk matrix were estimated basedon the same assumptions used in the BN model.
For simplification, the asset age does not come intothe picture in this risk matrix, but it will be consideredin further analyses.Tables 2 and 3 show the probabilityand consequence scales used in the risk matrix.
This risk mapping shows that at least three asset cat-egories ((W, E), (S, E) and (W, C)) contain elementswith medium to high safety risk. Using company’sasset information, a total number of approximately5000 switch-disconnectors are analysed. Table 3 andFigure 4 show the distribution of the total number of
1 F = Full encapsulation, S = Semi-encapsulation, W = wire-fence encapsulation, E = Exposed operating environment,C = Clean operating environment
Figure 3. Risk matrix illustrating the safety risk for differentassets.
Table 1. Probability scale.
Scale Description Frequency
1 Improbable less than once in 10 000switchings
2 Less probable every 1 000–10 000 switchings3 Probable every 100–1 000 switchings4 Very Probable every 10–100 switchings5 Highly Probable every 1–10 switchings
Table 2. Consequence scale.
Scale Description Consequence
1 Insignificant no injuries2 Small minor injuries3 Medium medium to serious injuries4 Very serious more than one person with
serious injury5 Catastrophic one or more deaths/10 or more
injuries
Table 3. Number of 12 kV MV, air-insulated switches.
Age Total
Type /Operation environ. < 25 yr. > 25 yr.
Full encapsulated switches 1800 700 2500Clean 1140 210
Exposed 360 490Semi encapsulated switches 1050 800 1850
Clean 580 400Exposed 470 400
Wire fence switch cubicles 150 500 650Clean 120 250
Exposed 30 250
assets on different asset categories defined based onasset type, age, and operating environment.
The moderate and high risk asset groups are markedwith red respectively yellow patterns in Figure 4.
The decision is how different assets categoriesshould be maintained, considering the safety risk, themaintenance and reinvestment costs.
397
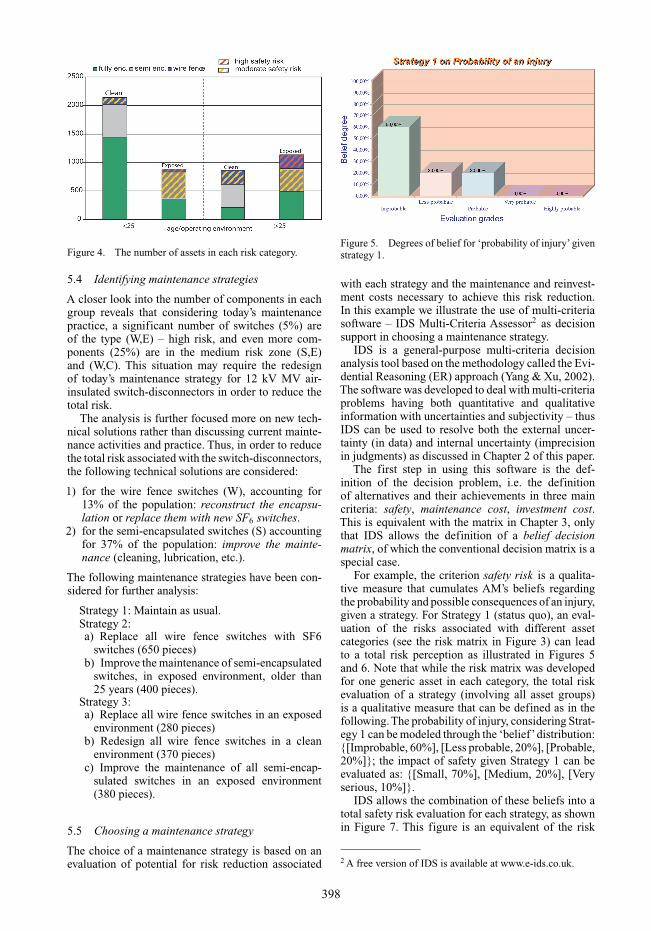
Figure 4. The number of assets in each risk category.
5.4 Identifying maintenance strategies
A closer look into the number of components in eachgroup reveals that considering today’s maintenancepractice, a significant number of switches (5%) areof the type (W,E) – high risk, and even more com-ponents (25%) are in the medium risk zone (S,E)and (W,C). This situation may require the redesignof today’s maintenance strategy for 12 kV MV air-insulated switch-disconnectors in order to reduce thetotal risk.
The analysis is further focused more on new tech-nical solutions rather than discussing current mainte-nance activities and practice. Thus, in order to reducethe total risk associated with the switch-disconnectors,the following technical solutions are considered:
1) for the wire fence switches (W), accounting for13% of the population: reconstruct the encapsu-lation or replace them with new SF6 switches.
2) for the semi-encapsulated switches (S) accountingfor 37% of the population: improve the mainte-nance (cleaning, lubrication, etc.).
The following maintenance strategies have been con-sidered for further analysis:
Strategy 1: Maintain as usual.Strategy 2:a) Replace all wire fence switches with SF6
switches (650 pieces)b) Improve the maintenance of semi-encapsulated
switches, in exposed environment, older than25 years (400 pieces).
Strategy 3:a) Replace all wire fence switches in an exposed
environment (280 pieces)b) Redesign all wire fence switches in a clean
environment (370 pieces)c) Improve the maintenance of all semi-encap-
sulated switches in an exposed environment(380 pieces).
5.5 Choosing a maintenance strategy
The choice of a maintenance strategy is based on anevaluation of potential for risk reduction associated
Figure 5. Degrees of belief for ‘probability of injury’ givenstrategy 1.
with each strategy and the maintenance and reinvest-ment costs necessary to achieve this risk reduction.In this example we illustrate the use of multi-criteriasoftware – IDS Multi-Criteria Assessor2 as decisionsupport in choosing a maintenance strategy.
IDS is a general-purpose multi-criteria decisionanalysis tool based on the methodology called the Evi-dential Reasoning (ER) approach (Yang & Xu, 2002).The software was developed to deal with multi-criteriaproblems having both quantitative and qualitativeinformation with uncertainties and subjectivity – thusIDS can be used to resolve both the external uncer-tainty (in data) and internal uncertainty (imprecisionin judgments) as discussed in Chapter 2 of this paper.
The first step in using this software is the def-inition of the decision problem, i.e. the definitionof alternatives and their achievements in three maincriteria: safety, maintenance cost, investment cost.This is equivalent with the matrix in Chapter 3, onlythat IDS allows the definition of a belief decisionmatrix, of which the conventional decision matrix is aspecial case.
For example, the criterion safety risk is a qualita-tive measure that cumulates AM’s beliefs regardingthe probability and possible consequences of an injury,given a strategy. For Strategy 1 (status quo), an eval-uation of the risks associated with different assetcategories (see the risk matrix in Figure 3) can leadto a total risk perception as illustrated in Figures 5and 6. Note that while the risk matrix was developedfor one generic asset in each category, the total riskevaluation of a strategy (involving all asset groups)is a qualitative measure that can be defined as in thefollowing. The probability of injury, considering Strat-egy 1 can be modeled through the ‘belief’distribution:{[Improbable, 60%], [Less probable, 20%], [Probable,20%]}; the impact of safety given Strategy 1 can beevaluated as: {[Small, 70%], [Medium, 20%], [Veryserious, 10%]}.
IDS allows the combination of these beliefs into atotal safety risk evaluation for each strategy, as shownin Figure 7. This figure is an equivalent of the risk
2 A free version of IDS is available at www.e-ids.co.uk.
398

Figure 6. Degrees of beliefs for ‘consequences’ (in termsof personnel injuries) given strategy 1.
Figure 7. Degrees of beliefs for ‘safety risk’ given strat-egy 1.
Table 4. Cost estimates for different maintenancestrategies.
Criteria Increase in Investmentmaintenance cost cost
K NOK k NOK
Strategy 1 0 0Strategy 2 800 52 000Strategy 3 1745 29 800
*NOK – Norwegian krone
matrix in Figure 3, but showing the ‘cumulated’ riskperception for all asset groups, given Strategy 1.
In the same way, the total safety risk picture foralternatives 2 and 3 can be described.
The advantage of using IDS is that such qualitativeevaluations or ‘degrees of belief’ can be included in aformal analysis, together other, quantitative criteria.
Reinvestment in large amounts of assets requiressignificant economic efforts for a distribution com-pany whose annual costs and profits are under reg-ulatory control. Table 4 shows a rough estimation ofthe increase in maintenance costs and investment costsassociated with each strategy.
These cost figures are defined as quantitative,certain values into IDS.
Up to now we have described how to define eval-uation grades for the three criteria considered for theanalysis of the three maintenance strategies. In addi-tion to this, rules have to be defined in IDS, to showhow each criterion grade may contribute to the overallobjective – the potential for risk reduction- based onwhich the alternatives will be ranked. For example, aninvestment cost of 0 NOK is likely to induce higherrisk exposure while and investment cost of 52 000 islikely to contribute to a lower risk exposure.
Once the description of each alternative in termsof the three criteria is done, criteria weights mustbe defined. Figure 8 below shows the normalizedweights used in this example. Safety is considered themost important criterion, followed by maintenance andreinvestment costs.
The results from IDS consist in a ranking of strate-gies based on the potential for risk reduction as shownin Figure 9. This figure shows that Strategy 3 hasthe highest potential of risk reduction. The rankingis based on average degree of beliefs (utilities) calcu-lated based on preference and belief information aboutcriteria and weights.
These results indicate that Strategies 2 and 3 canreduce the possibility (belief) of having higher per-sonnel risk exposure. The results can be used to justifyhow assets on ‘red’ in the risk matrix in Figure 3 maymove towards ‘yellow’ or ‘green’ zones by applyingone of Strategies 2 and 3. While the safety risk is still
Figure 8. Criteria weights.
Figure 9. The ranking of strategies in terms of risk exposure.
399

‘qualitatively’assessed, the costs of different strategiesfor reducing the risk exposure are however supposedto be known.
5.6 Concluding remarks
This case study was used to illustrate how BN modelscan be used as basis for constructing risk matrices, andhow this information may be used further in (multiplecriteria) decision making using the ER approach andIDS Multi-Criteria Assessor.
This link between different tools for risk analysisand the final decision is often missing in real lifedecision making in distribution companies. While riskmatrices are often used by asset managers, justifica-tions for how the matrices are built and how they areused further in decision making are often missing.The IDS software, as an integrated tool for risk andmulti-criteria analysis and visualization, has a goodapplication potential in DSAM.
6 CONCLUSIONS
This paper addresses the challenges in adding structureand a higher degree of formal analysis into increas-ingly complex distribution system asset managementdecision making. It discusses the available theoret-ical approaches for multi-criteria decision makingunder uncertainty and the tools and information assetmanagers already have at their disposal.
A case study was used to illustrate how to useavailable theoretical methods as Bayesian Networksto improve the usability of risk matrices – tools thatAMs in electricity distribution companies already use.
A multi-criteria decision analysis tool – IDS Multi-criteria Assessor is further used to deal with themulti-criteria decision of choosing among severalstrategies for managing 12 kV MV air insulatedswitch-disconnectors. The software allows for bothquantitative and qualitative information with uncer-tainties and subjectivity – thus uncertainty in data andimprecision in judgments.
An integrated MCDA and risk analysis may seemas the ultimate tool to gather all information available
in a decision situation, and to obtain ‘The’ answer, butthis is not the case. The advantages of using such anapproach in real life decision support are: 1) a betterproblem understanding, and 2) a better understand-ing on how decision maker’s judgments at a givenmoment in time, contribute to the final decision. Ingeneral, the decision must be important enough to jus-tify the extra time and resources necessary in usingsuch an approach. The approach is not better or worsethan traditional tools in DSAM and it does not replacefundamental analyses, but it can only improve it.
REFERENCES
Belton, V. & Stewart S.T. 2002. Multiple Criteria DecisionAnalysis – An integrated approach, Kluwer AcademicPublishers.
Keeney R.L. & Raiffa H. 1999. Decisions with MultipleObjectives. Preferences and Value Tradeoffs, CambridgeUniversity Press.
Nordgård, D.E. 2008. Quantitative RiskAssessment in Distri-bution System Maintenance Management using Bow-tieModelling, Proc. PSCC 2008, July 14–17, Glasgow.
Nordgård, D. E. & Sand, K. 2008. Application of Bayesiannetworks for risk assessment in electricity distribution sys-tem maintenance management. Proc. European Safety &Reliability Conference – ESREL 2008, Valencia.
Salo, A.A & Hämäläinen, R. 2001. Preference Ratios inMulti-attribute Evaluation (PRIME) – Elicitation anddecision procedures under incomplete information, IEEETransactions on Systems, Man and Cybernetics – PartA:Systems and Humans, 31: 533.
Stewart, T.J. 2005. Dealing with Uncertainties in MCDA. InFigueira, J., Greco, S., Ehrgott, M. (eds.), Multiple CriteriaDecision Analysis, State of the Art, Surveys, Springer’sInternational Series.
Schneider J, Gaul,A.J, Neumann C, Hogräfer, W.W, SchwannM, Schnettler A. 2006. Asset Management techniques,Electrical Power and Energy Systems, 28: 643–654.
Yang, J.B; Xu, D.L. 2002. On the evidential reasoningalgorithm for multiple attribute decision analysis underuncertainty, IEEE Transactions on Systems, Man, andCybernetics Part A: Systems and Humans, 32 (3): 289–304.
Yeddanapudi, S.R.K, McCalley, J.D, Chowdhury, A.A. &Jewell, W.T. 2008. Risk-based Allocation of DistributionSystem Maintenance Resources, IEEE Transactions onPower Systems, 23(2): 287–295.
400