Incorporating Efficiency in Hospital Capacity Planning...
28
Incorporating Efficiency in Hospital Capacity Planning: Experience from Germany Objective. The hospital occupancy rate is a key metric in hospital capacity planning, despite the fact that this metric neglects economic efficiency and offers the abnormal incentive to artificially increase the length-of-stay with detrimental effect on medical and economic performance. We suggest a modification of the occupancy metric to alleviate these shortcomings. The resulting metric incorporates economic efficiency explicitly and can be useful for medium term capacity planning cycles. Data Sources/Study Setting. The practical setting of this study is the hospital capacity planning process in a German federal state. The sample consists of all 92 acute care hospitals of the considered federal state. The study is based on standard hospital data, including annual costs, number of cases - disaggregated by medical departments and ICD codes, respectively – length-of-stay, certified beds and occupancy rates. Study Design. We construct a general efficiency index, which allows the identification of inefficient hospitals as candidates for capacity cuts as well as highly efficient hospitals, which are candidates for capacity increase. The index is designed to serve as a practically useful tool for medium term capacity planning. Analytic Methods. Linear programming based efficiency measurement. Principal Findings. Our methodology identified 18 of the 92 hospitals as inefficient and targets for over-proportional capacity cuts. Interestingly, the average occupancy
-
Upload
nguyennhan -
Category
Documents
-
view
223 -
download
1
Transcript of Incorporating Efficiency in Hospital Capacity Planning...
Incorporating Efficiency in Hospital Capacity
Planning: Experience from Germany
Objective. The hospital occupancy rate is a key metric in hospital capacity planning,
despite the fact that this metric neglects economic efficiency and offers the abnormal
incentive to artificially increase the length-of-stay with detrimental effect on medical
and economic performance. We suggest a modification of the occupancy metric to
alleviate these shortcomings. The resulting metric incorporates economic efficiency
explicitly and can be useful for medium term capacity planning cycles.
Data Sources/Study Setting. The practical setting of this study is the hospital capacity
planning process in a German federal state. The sample consists of all 92 acute care
hospitals of the considered federal state. The study is based on standard hospital data,
including annual costs, number of cases - disaggregated by medical departments and
ICD codes, respectively – length-of-stay, certified beds and occupancy rates.
Study Design. We construct a general efficiency index, which allows the identification
of inefficient hospitals as candidates for capacity cuts as well as highly efficient
hospitals, which are candidates for capacity increase. The index is designed to serve as
a practically useful tool for medium term capacity planning.
Analytic Methods. Linear programming based efficiency measurement.
Principal Findings. Our methodology identified 18 of the 92 hospitals as inefficient
and targets for over-proportional capacity cuts. Interestingly, the average occupancy
2
rate of these hospitals is not significantly different from the total sample. The
inefficiency is due to high treatment cost and low patient throughput. On the upside, the
methodology identified 15 efficient hospitals. For this group of hospitals, several
productivity indicators are significantly better than in the total sample, including
occupancy rates, length-of-stay, patient throughput, and operational costs per case. The
developed model and analysis has influenced the federal state's most recent medium
term planning cycle.
Conclusions. The employed data and developed indices enable an effective
consideration of efficiency criteria, complementing and enhancing demography and
occupation based medium term capacity planning processes.
Key Words. Hospital capacity planning, occupancy, efficiency.
Introduction
In many countries hospitals are regulated by governments and financed through a
combination of health insurance and direct government contributions. Insurance
agencies reimburse hospitals for delivery of health care services; governments grant
licences and sometimes funding to provide hospitals with the legal and financial basis
to deliver their services. Examples of such licences are the certificates of need (CON)
in the United States. CON regulation requires health care providers to obtain
authorization from the federal state before they can expand their services.

3
CON programs are controversially discussed. CON opponents argue that CON-based
regulation drives up prices because it establishes anticompetitive barriers to entry
(Federal Trade Commission 2004). CON supporter reply that CON is invaluable as a
market-balancing tool (Health Planning Association 2005). The arguments of both sides
have some merit. A sensible compromise might be the strengthening of economic
efficiency as a criterion for CON authorization.
In this paper we report on a recent project in Germany, where hospitals face a similar
regulatory environment with regard to capacity planning. In Germany the shared
financial responsibility of insurance companies and the government is explicitly
recognized through the so-called dual financing system: Operational costs of medical
treatment, care and accommodation are covered through reimbursement contracts
between hospitals and Germany’s predominantly statutory health insurance companies,
whilst longer-term infrastructure investments are financed by the federal states.
Hospitals are only authorized to participate in this dual financing system if they are
listed in the federal state’s regional hospital plan, which is the German equivalent of
the CON regulation in the United States.
As in most developed countries, the containment of treatment costs has been a focal
point of political attention in Germany over the past decade. The corresponding
reimbursement processes have undergone fundamental changes from static full-cost-
coverage to reimbursement on a pay-per-case basis (Lüngen and Lapsley 2003). In the
light of the ongoing economical and political pressures it is quite surprising that the
longer-term infrastructure planning process in Germany has remained largely untapped
for efficiency gains.
4
It is widely acknowledged that efficiency considerations should be incorporated in
hospital capacity planning. Indeed, the literature on hospital closures in the US provides
some evidence that this is already happening, i.e., efficient hospitals are less likely to be
closed than inefficient ones (e.g. Deily et al. 2000 and Lindrooth et al. 2003). However,
these studies are largely descriptive and focus on complete closures rather than
adjustments of hospital capacities. Bogetoft (2000) considers the capacity planning
problem from the viewpoint of incentives and agency theory and argues for the
usefulness of a particular efficiency metric as a planning tool. The present paper builds
on Bogetoft’s theoretical work by suggesting a related practical tool to help health care
planners incorporate efficiency considerations in the capacity planning process in a
structured manner. The tool was applied in the recent planning cycle in a German
federal state to determine the hospital capacity plan for 2003-2007. The results of this
study are used as an illustration of the potential of the methodology.
Hospital capacity planning in Germany
Legal background
In Germany every federal state is legally obliged to produce and regularly update a
hospital plan, which details the provision of hospital-based medical care for the
population. Only hospitals that are registered in this plan are eligible for treatment
compensation by the statutory health insurance companies. Further hospital
specifications in the register, such as number of certified beds per department or
treatment specialization, play a fundamental role for internal hospital planning and
5
corresponding negotiations with the insurance companies and are also critical reference
points for long-term investments financed by the federal states.
The capacity planning process involves essentially two stages: In a first stage future
capacity needs are forecast on a regional level, based on demand projections, which
take account of medical and demographic trends and regional morbidity structures. In a
second stage the new regional capacity plans are broken down to the level of individual
hospitals. However, changing the capacities of individual hospitals is a highly sensitive
political issue, which is resolved in complex negotiations with little use of economic
performance indicators. Decision makers in the federal states' health departments
welcome help to rationalize this process and need tools to help them incorporate
economic efficiency considerations.
Hospital capacity and occupancy
Hospital capacity is a complex mix of assets including, for instance, buildings and
medical equipment for operating theatres and intensive care units. To avoid overly
complex models, it has become customary to measure capacity in terms of certified
hospital beds (e.g. Gaynor and Anderson 1995, Keeler and Ying 1996). The output of
the first stage of the German capacity planning process, the regional capacity plan, is
therefore a recommended total bed capacity for each region in the federal state. The key
factors in the regional analysis are population, frequency of hospital admission, length-
of-stay and bed occupancy. On the basis of estimates of these key factors, the regional
bed capacity is calculated by the formula
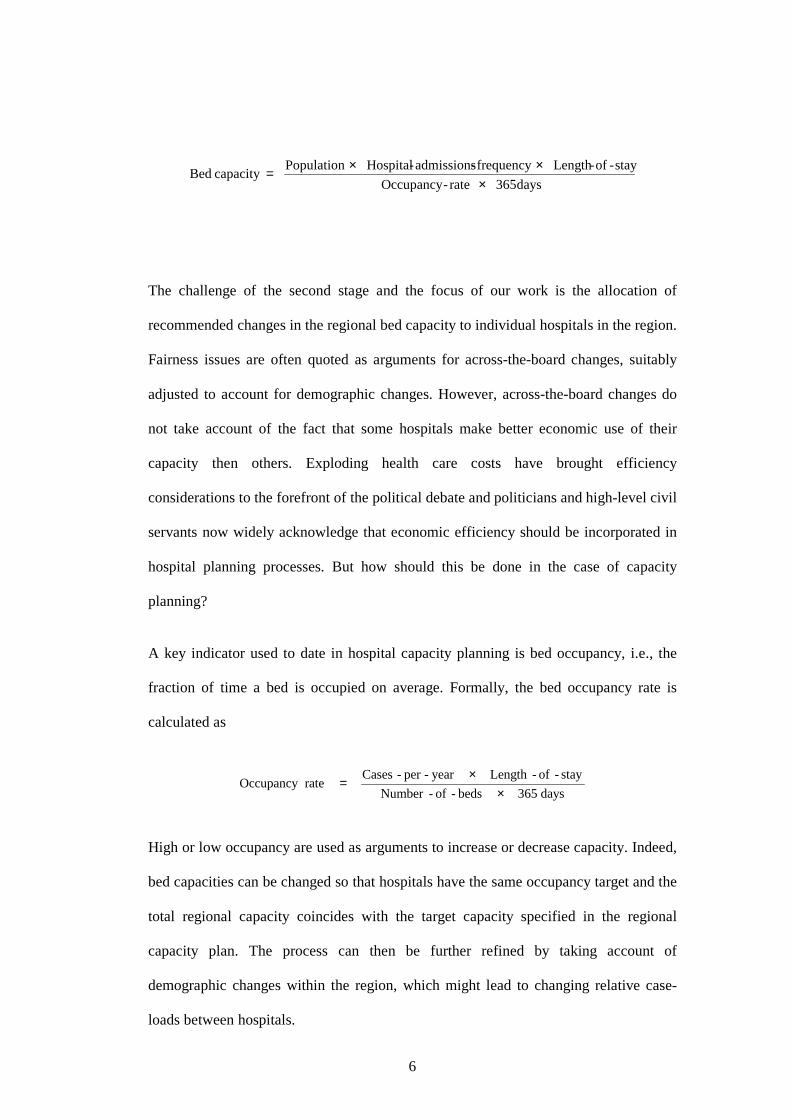
6
days365rate - Occupancy
stay-of-Lengthfrequency- admissions-HospitalPopulationcapacity Bed
×××=
The challenge of the second stage and the focus of our work is the allocation of
recommended changes in the regional bed capacity to individual hospitals in the region.
Fairness issues are often quoted as arguments for across-the-board changes, suitably
adjusted to account for demographic changes. However, across-the-board changes do
not take account of the fact that some hospitals make better economic use of their
capacity then others. Exploding health care costs have brought efficiency
considerations to the forefront of the political debate and politicians and high-level civil
servants now widely acknowledge that economic efficiency should be incorporated in
hospital planning processes. But how should this be done in the case of capacity
planning?
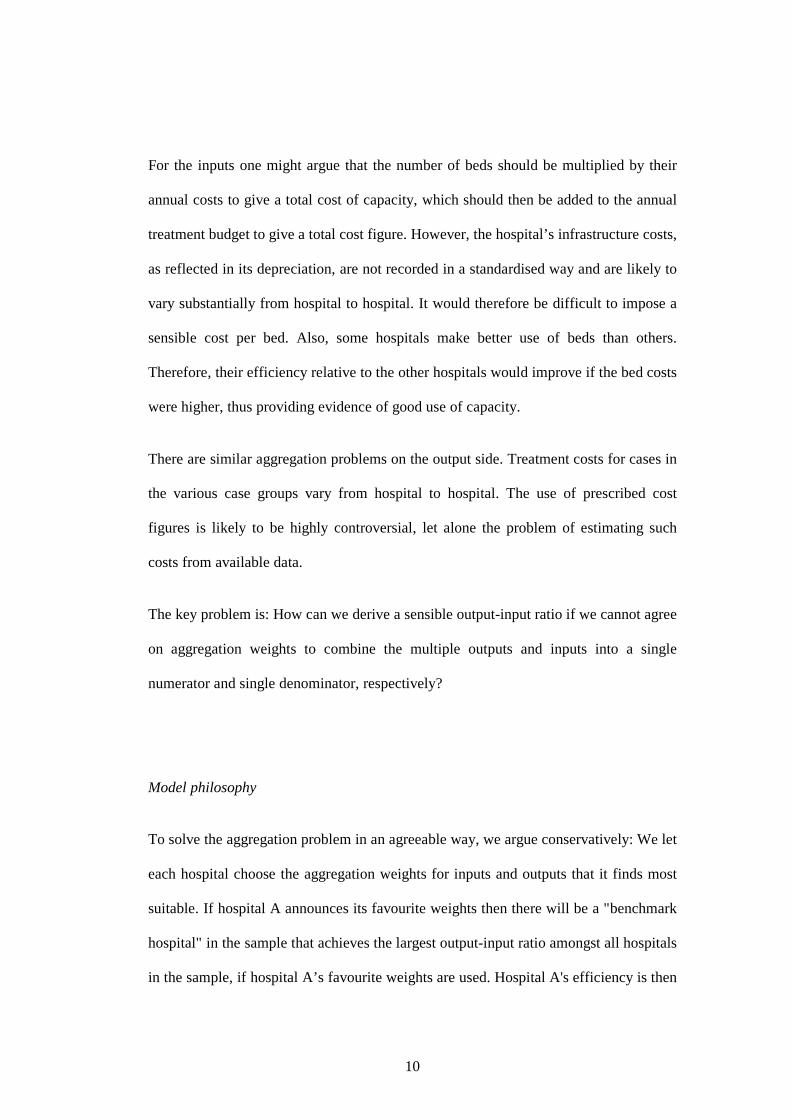
A key indicator used to date in hospital capacity planning is bed occupancy, i.e., the
fraction of time a bed is occupied on average. Formally, the bed occupancy rate is
calculated as
days365beds-of-Number
stay-of-Lengthyear-per-CasesrateOccupancy
××
=
High or low occupancy are used as arguments to increase or decrease capacity. Indeed,
bed capacities can be changed so that hospitals have the same occupancy target and the
total regional capacity coincides with the target capacity specified in the regional
capacity plan. The process can then be further refined by taking account of
demographic changes within the region, which might lead to changing relative case-
loads between hospitals.

7
It is widely recognized that the use of occupancy rates as an efficiency indicator in
capacity planning has severe drawbacks (Green and Nguyen 2001). In our sample, for
example, occupancy rates are not significantly correlated with costs per case. A key
problem of occupancy-based capacity planning lies in the abnormal incentive it
provides for hospitals to artificially increase the length-of-stay of their patients in order
to meet occupancy targets and thereby avoid capacity reductions. This is obviously
medically undesirable. It is also unproductive as it increases operational costs, which is
clearly unacceptable in the current political climate. In fact, excessive operational costs,
although not an immediate part of the federal state's responsibility within Germany’s
dual hospital financing system, provide an indication for such non-productive usage of
bed capacity.
In summary, what is needed is a sensible measure of economic efficiency, which can
replace occupancy as a guide in hospital capacity planning. In the next section we will
develop such a methodology.
Method
Step 1: Measuring Efficiency
It is customary to measure the efficiency of a system by a ratio of system output per
unit input or system input per unit output. Such ratio-metrics are commonplace in
hospital benchmarking and practitioners are conversant in the use of indicators such as
cases per bed, cost per case, occupied-bed-days per case (length-of-stay), or occupied-
bed-days per certified-bed-day (occupancy).

8
Whilst simple ratio-metrics play an important role in the communication and discussion
of hospital efficiency, they all share a common limitation: They focus on a single
output and a single input, thereby neglecting important factors or artificially
aggregating them. They present a snapshot of the system, a projection, not the full
picture. Practitioners know very well that different ratios may well give completely
different efficiency ratings for hospitals.
A modified input-output metric
In view of the prevalent usage of occupancy for capacity planning, we decided to take
this ratio, occupied-bed-days per certified-bed-day, as a starting point for our
methodological developments. Rather than depart completely from this metric, we
enhance it and remove some of its shortcomings, thereby improving its usefulness and
at the same time increasing the chance of acceptability of the new methodology, due to
its proximity to existing practice.
Inputs
As mentioned before, a key drawback of the occupancy rate in capacity planning is its
lack of accounting for the costs associated with an increased occupancy through a
medically unnecessary increase in the length-of-stay. Indeed, the resource base for
inpatient treatment in a hospital has two main components, reflected in capacity costs
and treatment costs, and occupancy rates only use capacity, measured in number of

9
certified beds. A sensible efficiency index should incorporate both inputs, the number
of certified beds as well as the annual treatment costs.
Outputs
The output considered in the occupancy rate is occupied-bed-days, which equals
number-of-cases per year times the length-of-stay. To avoid an incentive for increasing
the length-of-stay, we prefer the number-of-cases per year as an output. However,
simple annual case numbers do not take account of different case-mixes of hospitals,
which is to some extend reflected in the length-of-stay. We therefore suggest to
measure output not by the single total number of cases but to separate the cases into
groups and considered the respective case numbers in these groups as multiple outputs.
Based on available data in the setting of our study, we could either use the coarse
grouping into departmental case numbers or a classification based on the WHO's
international classification of diseases (ICD).
Aggregation of inputs and outputs
Having defined the inputs and outputs that we regard as most relevant for the efficient
use of capacity, we are now faced with the problem of defining a suitable efficiency
index that takes these multiple inputs and outputs into account. In order to define a
ratio, we need to combine the inputs to a total input and the outputs to a total output. It
is not obvious how this should be done.
10
For the inputs one might argue that the number of beds should be multiplied by their
annual costs to give a total cost of capacity, which should then be added to the annual
treatment budget to give a total cost figure. However, the hospital’s infrastructure costs,
as reflected in its depreciation, are not recorded in a standardised way and are likely to
vary substantially from hospital to hospital. It would therefore be difficult to impose a
sensible cost per bed. Also, some hospitals make better use of beds than others.
Therefore, their efficiency relative to the other hospitals would improve if the bed costs
were higher, thus providing evidence of good use of capacity.
There are similar aggregation problems on the output side. Treatment costs for cases in
the various case groups vary from hospital to hospital. The use of prescribed cost
figures is likely to be highly controversial, let alone the problem of estimating such
costs from available data.
The key problem is: How can we derive a sensible output-input ratio if we cannot agree
on aggregation weights to combine the multiple outputs and inputs into a single
numerator and single denominator, respectively?
Model philosophy
To solve the aggregation problem in an agreeable way, we argue conservatively: We let
each hospital choose the aggregation weights for inputs and outputs that it finds most
suitable. If hospital A announces its favourite weights then there will be a "benchmark
hospital" in the sample that achieves the largest output-input ratio amongst all hospitals
in the sample, if hospital A’s favourite weights are used. Hospital A's efficiency is then

11
measured as the percentage deviation of its output-input ratio from its “benchmark
hospital's” output-input ratio. Formally, hospital A’s efficiency metric is
.
weightssA'for input totalsB' weightssA'for output totalsB'
weightssA'for input totalsA' weightssA'for output totalsA'
E
B hospitals Allmax
A =
The managers of hospital A will of course be keen that their hospital is seen to be as
efficient as possible and therefore choose weights so that EA is as large as possible. The
resulting score is used as efficiency score for hospital A. Managers of hospitals will
find it difficult to argue with their efficiency score because there are no weights that
would improve their score.
A hospital’s optimal weight can be determined by a computer program
A particular advantage of this efficiency score is that we don't have to ask the
individual hospital managers which weights they would like to be applied but can
compute the best ones for them with a computer programme. Indeed, the corresponding
optimization problem can be turned into a linear program, which can be
straightforwardly solved with standard spreadsheet software (e.g. Scheel 2005). We
refer the interested reader to Worthington (2004) for a recent review of health care
applications of such linear programming-based efficiency scores, also known as data
envelopment analysis, and to standard textbooks such as (Cooper et al. 1999) for further
technical details and possible extensions.

12
Weight constraints for capacity
In the score’s pure form, some hospitals might be able to achieve a score of 100% by
putting all their input weights on the treatment costs and assign zero weight to the
capacity input. These hospitals may only be efficient if capacity is essentially free. We
correct for this by allowing hospital managers, or rather our computer algorithms, to
choose only combinations of input weights for which the weight for beds is at least
2000 times the weight for the treatment budget. This captures the fact that the inflation-
adjusted average investment in facilities over the past 30 years was about ��������������
bed and year, which we regard as a minimal cost-weight for beds. Whilst a bed might
be worth more for a particular hospital, in which case the manager can assign a higher
relative weight, no hospital is allowed to account for less than this cost in their
calculation of the total cost figure for the output-input ratio. By constraining the
capacity weight in this way, we take account of the fact that the score will be used for
capacity planning, where the decision maker is more interested in indications of
efficient use of capacity than in good use of treatment budgets.
Step 2: Re-allocating capacity
The efficiency score allows us to rank hospitals and, in particular, classify them as
either efficient or inefficient. We assume that inefficient hospitals should experience
more severe cuts in their capacity than efficient ones. But how much more? We want to
give the decision maker an indication of sensible over-proportional cuts in inefficient
hospitals and under-proportional cuts in highly efficient hospitals.
13
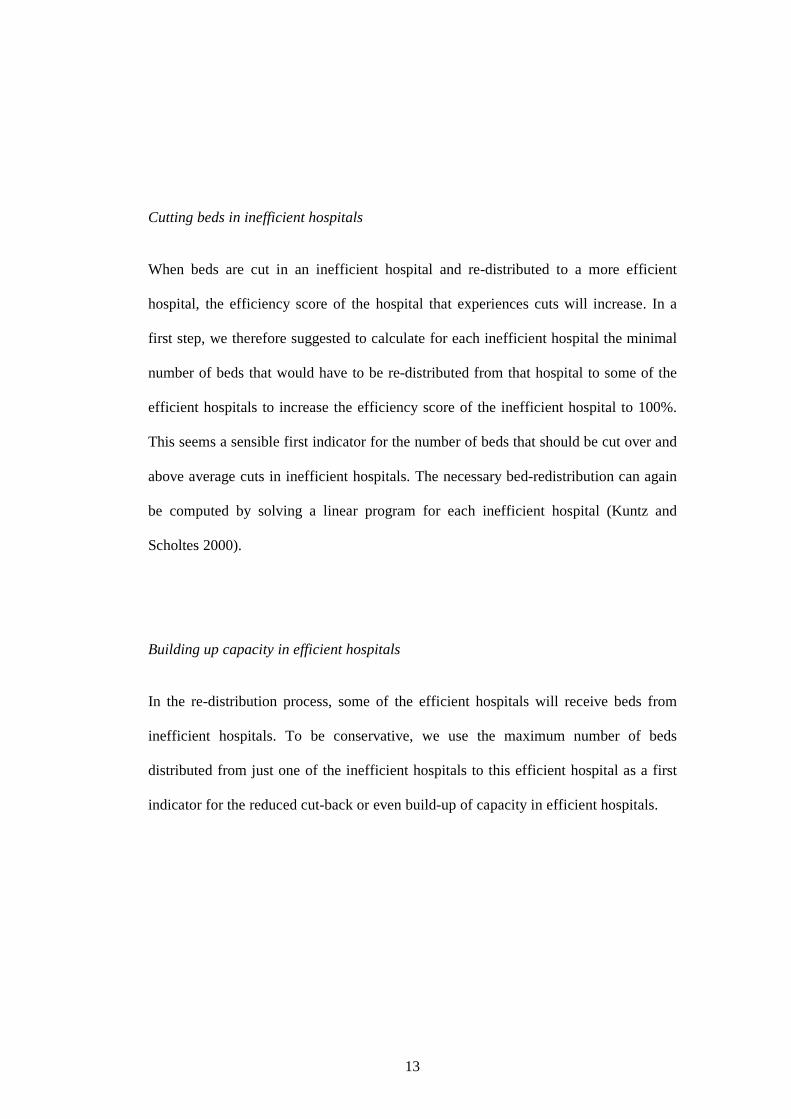
Cutting beds in inefficient hospitals
When beds are cut in an inefficient hospital and re-distributed to a more efficient
hospital, the efficiency score of the hospital that experiences cuts will increase. In a
first step, we therefore suggested to calculate for each inefficient hospital the minimal
number of beds that would have to be re-distributed from that hospital to some of the
efficient hospitals to increase the efficiency score of the inefficient hospital to 100%.
This seems a sensible first indicator for the number of beds that should be cut over and
above average cuts in inefficient hospitals. The necessary bed-redistribution can again
be computed by solving a linear program for each inefficient hospital (Kuntz and
Scholtes 2000).
Building up capacity in efficient hospitals
In the re-distribution process, some of the efficient hospitals will receive beds from
inefficient hospitals. To be conservative, we use the maximum number of beds
distributed from just one of the inefficient hospitals to this efficient hospital as a first
indicator for the reduced cut-back or even build-up of capacity in efficient hospitals.

14
Summary of the approach
In summary, we propose the following 2-step approach to produce quantitative
information to guide efficiency-based capacity allocation.
- Step 1: Calculate efficiency scores. In the first step we calculate the efficiency
scores for all hospitals and classify hospitals as efficient or inefficient on the
basis of these scores.
- Step 2: Calculate bed re-allocations. In the second step we simulate cutting
beds in inefficient hospitals and building them up in efficient ones. For each
inefficient hospital we compute the minimal number of beds that have to be re-
distributed from this hospital to efficient hospitals in order to make the
inefficient hospital efficient. For the efficient hospitals we calculate the
maximum number of beds assigned to this hospital by one of the inefficient
hospitals in the re-distribution process.
A key feature of this model is the incentive provided by the possible build-up of beds in
efficient hospitals, i.e., a highly efficient hospital may well be rewarded with an
increased capacity, even if the overall capacity in the federal state decreases.
It is crucial for the adoption of the proposed model that the various stakeholders in the
capacity planning process - public servants, medical experts and politicians -
understand the essence of the model. In our experience, explaining the model as an
extension of the occupancy rate is a good starting point as it related the new model to a
familiar and already accepted metric. However, it is crucial for decision makers to build
intuition about the working of the new model to help them understand and appreciate

15
the added-value to the existing occupancy-based allocation. In our experience, this
intuition is best developed by way of simple stylised examples, enhanced by graphical
illustrations. A brief illustrative example is provided in the appendix.
Data
The study is based on the 2001 reported data of all 92 hospitals in a federal state in
Germany. We have worked with two different data sets, which are differentiated by the
underlying output structure. We could either use a case classification based on the
WHO's international classification of disease (ICD) as output structure (Model 1 in the
sequel) or use the case numbers in the different hospital departments (Model 2). The
two models reflect two different views of "output": The ICD-basis of Model 1 is
diagnosis-related and therefore reflects direct case-based efficiency. In contrast, Model
2 offers a resource-oriented view as the output structure averages over all cases in
individual departments, which are the recipients of the resources, the model inputs,
within the hospitals.
As inputs we used the number of certified beds as a proxy for annual capacity
investment as well as adjusted annual costs of treatment. Treatment costs are total costs
of the hospital minus costs of education departments, outpatient service, research and
other costs allocated to activities that are not directly related to the chosen output
structure. In Germany, the majority of doctors are employees of the hospital and
therefore the costs of their service are part of the hospital’s total costs. Very few
hospitals use independent practitioners or specialists. Where this was the case, we
adjusted treatment costs by adding a proxy for the costs of independent doctors, based

16
on the reported percentage of beds where medical service is provided by independent
doctors and the costs of medical service in the hospital, which was part of the data set.
This is based on the simplifying assumption that the costs of medical service for
independent doctors are the same as the costs for doctors employed by the hospital. A
few hospitals in the sample work exclusively with independent doctors and had no data
available for the costs of medical service. Here we added a proxy for medical services
to the treatment costs, based on the fact that the total costs of medical service for all
hospitals amount to 15% of total treatment costs. The input-output structure is
summarized in Table 1.
(Insert Table 1 here).
Results
Step 1: Efficiency analysis
In a first step we calculated the efficiency scores of the hospitals for the two models.
Given the different output interpretations of the two models, as explained above, it was
quite surprising and somewhat comforting that the efficiency scores in the two models
were highly correlated. To be prudent, we decided to classify a hospital as inefficient
only if it had an efficiency score below 90% in Model 1 or an efficiency scores below
100% in both models. This rule introduces an asymmetry between Model 1 and Model
2, as hospitals with a low departmental efficiency (Model 2 below 90%) are not
classified as inefficient if their case-mix related efficiency score (Model 1) is 100%.
This exception applied to 5 hospitals in the sample, which, upon inspection, showed a
specialist case-mix structure.
17
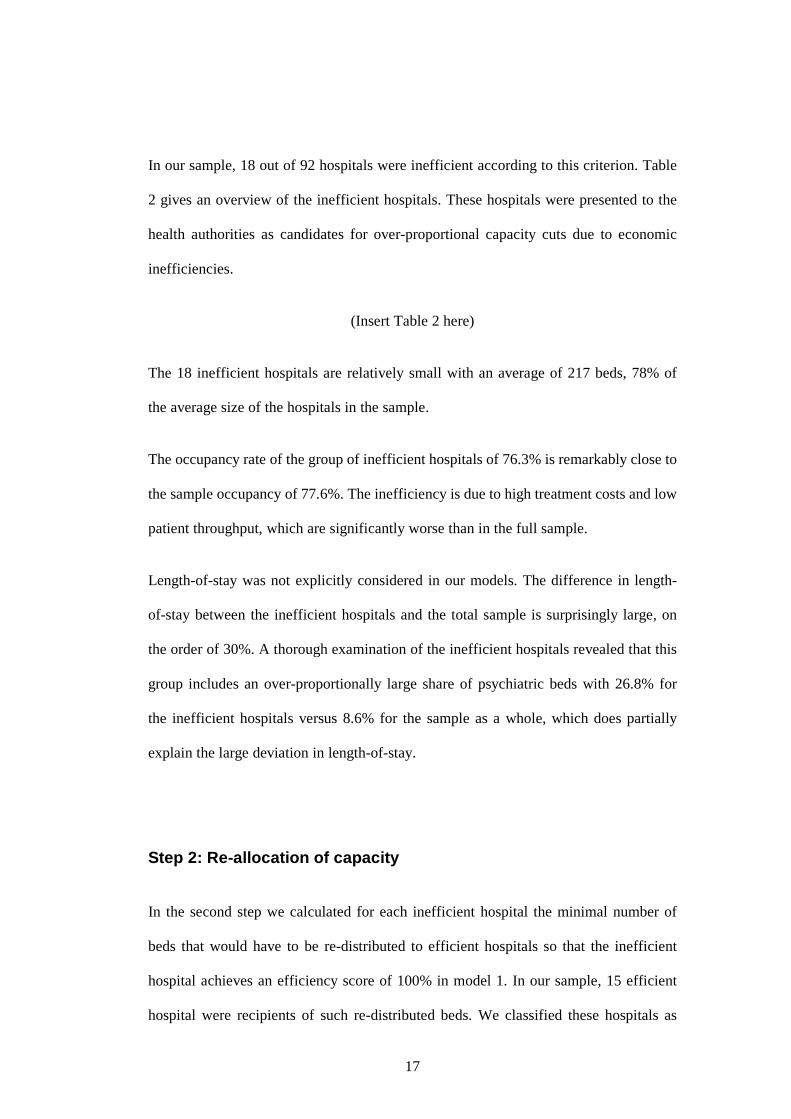
In our sample, 18 out of 92 hospitals were inefficient according to this criterion. Table
2 gives an overview of the inefficient hospitals. These hospitals were presented to the
health authorities as candidates for over-proportional capacity cuts due to economic
inefficiencies.
(Insert Table 2 here)
The 18 inefficient hospitals are relatively small with an average of 217 beds, 78% of
the average size of the hospitals in the sample.
The occupancy rate of the group of inefficient hospitals of 76.3% is remarkably close to
the sample occupancy of 77.6%. The inefficiency is due to high treatment costs and low
patient throughput, which are significantly worse than in the full sample.
Length-of-stay was not explicitly considered in our models. The difference in length-
of-stay between the inefficient hospitals and the total sample is surprisingly large, on
the order of 30%. A thorough examination of the inefficient hospitals revealed that this
group includes an over-proportionally large share of psychiatric beds with 26.8% for
the inefficient hospitals versus 8.6% for the sample as a whole, which does partially
explain the large deviation in length-of-stay.
Step 2: Re-allocation of capacity
In the second step we calculated for each inefficient hospital the minimal number of
beds that would have to be re-distributed to efficient hospitals so that the inefficient
hospital achieves an efficiency score of 100% in model 1. In our sample, 15 efficient
hospital were recipients of such re-distributed beds. We classified these hospitals as

18
"highly efficient" with respect to their usage of capacity. These hospitals are candidates
for a reduced cut-back or even a build-up of capacity. Summary information on these
hospitals in comparison to the inefficient ones is given in Table 2.
The highly efficient hospitals have significantly lower lengths-of-stay, costs per case,
and higher patient through-put. The average number of departments is, at 4.47,
significantly higher in the group of highly efficient hospitals and also the standard
deviation of the number of beds is larger than in the inefficient group. An examination
of the individual re-distribution results shows that beds were re-distributed to small
specialized hospitals as well as to large hospitals.
Since we calculated bed re-distributions for all inefficient hospitals sequentially, some
of the highly efficient hospitals were allocated beds from several inefficient ones,
giving them an over-proportional share of re-distributed beds in total. We therefore
recommended as a conservative starting point for discussions about reduced bed-cuts in
a highly efficient hospital the maximal number of beds allocated to this hospital from
one of the inefficient hospitals. This results in a total build-up of 285 beds. Assuming
patient flows from inefficient to efficient hospitals, such a modest build-up would allow
the treatment of an additional 3517 cases in the highly efficient hospitals, based on 285
extra beds and the patient throughput differential of 12.34 patients per bed and year
between the two groups of hospitals, and could reduce costs by approximately �����������
based on the differential of costs per case between the two groups.
These numbers seem modest in comparison to the overall scale. We found that such a
modest immediate impact is immensely helpful for the acceptance of the methodology
and its use in the decision making process. After all, this is a first attempt to incorporate
economic efficiency considerations in the capacity planning process of a German

19
federal state. It is difficult for politicians to argue for an increase in bed numbers in
certain hospitals when capacity is drastically reduced in others. Indeed, were the results
of our analysis suggesting a complete break-away from the status-quo, it is unlikely that
we would have been able to have an impact at all.
Impact
The new hospital plan for the considered federal state has been finalized and ratified1.
For political reasons, the numbers of psychiatric beds were kept very close to existing
levels. From 2003 to 2007, hospital capacity without psychiatry in the federal state will
be reduced by 1872 beds, which amounts to 8.3% of the 2003 capacity. The health
department has confirmed that hospitals, which our methodology identified as
inefficient were suffering over-proportionally from bed cut-backs, whilst the highly
efficient hospitals had less-than-average cut-backs. Since the target bed numbers are
allocated to hospital groups rather than individual hospitals in the federal state’s
hospital plan, it is not straight-forward to calculate the average cut-back in the groups
of efficient and inefficient hospitals, respectively. A conservative estimate, based on
cut-back targets of hospital groups applied across-the-board, shows a cut-back target of
10.9% in the group of 14 inefficient and not purely psychiatric hospitals, versus 6.8% in
the group of 12 efficient and not purely psychiatric hospitals.
1 Downloadable from www.masfg.rlp.de/Gesundheit/Krankenhauswesen/Krankenhausplanung.htm
20
References
American Health Planning Association. 2005. “The Federal Trade Commission &
Certificate of Need Regulation” [accessed April 8, 2005]. Available at:
http://www.ahpanet.org/Images/AHPAcritiqueFTC.pdf>
Bogetoft, P. 2000. “DEA and activity planning under asymmetric information” , Journal
of Productivity Analysis 13: 7-48.
Cooper, W.W., L. M. Seiford, and K. Tone. 1999. “Data Envelopment Analysis.”
Boston: Kluwer Academic Publishers.
Deily, ME, N.L. McKay, and F.H. Dorner. 2000. “Exit and inefficiency.” Journal of
Human Resources 35: 734-747.
Federal Trade Commission and Department of Justice. 2004. “ Improving Health Care:
A Dose of Competition” [accessed April 8, 2005], Available at:
http://www.ftc.gov/opa/2004/07/healthcarerpt.htm
Gaynor, M., and G.F. Anderson. 1995. “Uncertain demand structure of hospital costs,
and the cost of empty hospital beds.” Journal of Health Economics 14: 291-317.
Green, L., and V. Nguyen. 2001.”Strategies for cutting hospital beds: The impact on
patient service.” Health Services Research 36: 421-442
Keeler, T.E., and J.S. Ying. 1996.“Hospital costs and excess capacity: A statistical
analysis.” The Review of Economics and Statistics 78: 470-481.
Kuntz, L., and S. Scholtes. 2000.“Measuring the robustness of empirical efficiency
valuations.” Management Science 46: 807-823.
21
Lindrooth, R.C., and A.T. Lo Sasso, G.J. Bazzoli. 2003.”The effect of urban hospital
closure on markets.” Journal of Health Economics 22: 691-712.
Lüngen, M. and I. Lapsley. 2003, “The reform of hospital financing in Germany: An
international solution.” Journal of Health, Organisation and Management 17:
360-372.
Scheel, H. 2005. “EMS: Efficiency Measurement System” [accessed April 8, 2005],
Available at: http://www.wiso.uni-dortmund.de/lsfg/or/scheel/ems
Worthington, A.C. 2004. “Frontier efficiency measurement in health care: A review of
empirical techniques and selected applications” . Medical Care Research and
Review 61: 135-170.

22
Appendix
The following simple example illustrates step 1 of the used method:
Hospital Treatment
costs Cases
Costs per case
Cases in group 1
Cases in group 2
Efficency score
1 ��� �������
6,000 ��� ������
2,000 4,000 100 % 2
��� ������� 4,500
� ��� ����� 1,500 3,000 75 %
3 ��� �������
4,000 � ��������
3,500 500 100 %
Hospital 1 has the lowest costs per case and dominates hospital 2, because it treats more
cases in both case groups. This is recognized in the efficiency score provided by the
model. The domination argument cannot be extended to hospital 3 because this hospital
treats more patients in group 1 than all other hospitals. If the cost of treatment in this
group is considerably higher than the cost of treatment in group 2, then this hospital can
be more efficient than the other two hospitals. The model does not incorporate cost-
comparisons between cases because of the difficulty to obtain reliable data and, more
importantly, the controversy that such assumptions would lead to. Therefore, being
conservative, we allow hospital 3, through the model, to make a case that it is efficient,
even though it has the highest costs per case. Figure 1 illustrates the example.
(Insert Figure 1 here)
A hospital, which is regarded as efficient by the model is assigned an efficiency score
of 100 %. If a hospital is assigned a smaller efficiency score, say 75 %, then it needs to
reduce its costs by 25 % or increase its cases by 33 % (=(1/0.75-1) x 100) to achieve an
efficiency score of 100 %.
23
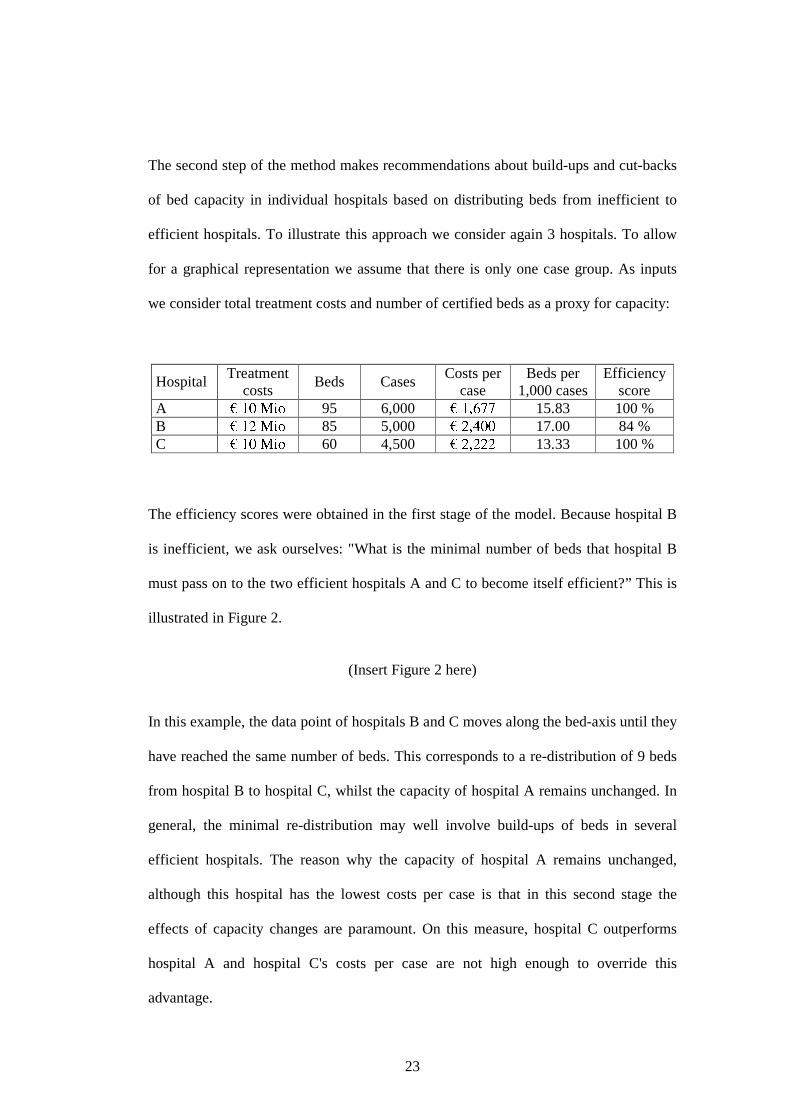
The second step of the method makes recommendations about build-ups and cut-backs
of bed capacity in individual hospitals based on distributing beds from inefficient to
efficient hospitals. To illustrate this approach we consider again 3 hospitals. To allow
for a graphical representation we assume that there is only one case group. As inputs
we consider total treatment costs and number of certified beds as a proxy for capacity:
Hospital Treatment
costs Beds Cases
Costs per case
Beds per 1,000 cases
Efficiency score
A ��� �������
95 6,000 ��� � �����
15.83 100 % B
��� ������� 85 5,000
����������� 17.00 84 %
C ��� �������
60 4,500 ����� �����
13.33 100 %
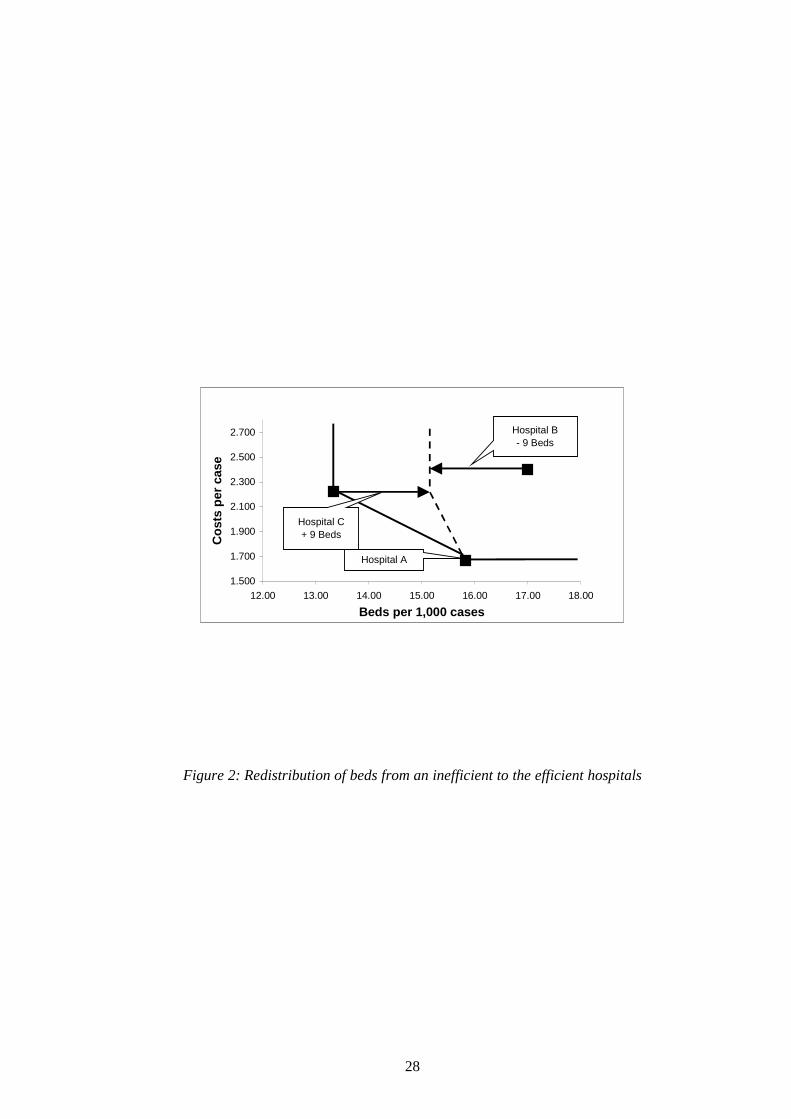
The efficiency scores were obtained in the first stage of the model. Because hospital B
is inefficient, we ask ourselves: "What is the minimal number of beds that hospital B
must pass on to the two efficient hospitals A and C to become itself efficient?” This is
illustrated in Figure 2.
(Insert Figure 2 here)
In this example, the data point of hospitals B and C moves along the bed-axis until they
have reached the same number of beds. This corresponds to a re-distribution of 9 beds
from hospital B to hospital C, whilst the capacity of hospital A remains unchanged. In
general, the minimal re-distribution may well involve build-ups of beds in several
efficient hospitals. The reason why the capacity of hospital A remains unchanged,
although this hospital has the lowest costs per case is that in this second stage the
effects of capacity changes are paramount. On this measure, hospital C outperforms
hospital A and hospital C's costs per case are not high enough to override this
advantage.

24
Infectious and parasitic diseases Neoplasms Endocrine, nutritional and metabolic diseases Diseases of the blood and blood forming organs Mental and behavioural disorders Diseases of the nervous system Diseases of the eye and adnexa Diseases of the ear and the mastoid process Diseases of the circulatory system Diseases of the respiratory system Diseases of the digestive system Diseases of the genitourinary system Pregnancy, childbirth and puerperium Diseases of skin and subcutaneous tissue Diseases of the musculoskeletal-system and connective Congenital malformations, deformations and chromosomal abnormalities Certain conditions originating in the perinatal period Symptoms, signs, and abnormal clinical and laboratory findings Injury, poisoning, and certain other consequences of external causes
Cases differentiated by ICD main groups
Factors influencing health status and contact with health services
Output
(Model 1)
Partial in-patients (treated as in-patient w/o overnight stay) Internal medicine Pediatrics Surgery Neurosurgery Plastic surgery Cardio surgery Urology Orthopedics Gynecology and obstetrics Otorhinolaryngology Ophthalmology Neurology Psychiatry Child and adolescent psychiatry Psychosomatic medicine / Psychotherapy Nuclear medicine / Radiology Radio therapeutics Dermatology Dentistry
Cases differentiated by specialist departments
Other departments
Output
(Model 2)
Partial in-patients
Number of beds Input Treatment costs
Table 1: Input-Output Structures

25

26
Selected inefficient
hospitals (Step 1)
Selected efficient
hospitals (Step 2)
All hospitals
Number 18 (19.6%) 15 (16.3%) 92
Number of beds 3,909 (15.3%) 3,176 (12.4%) 25,558
- of which Number Prop. Number Prop. Number Prop.
Intensive care 97 (8.7%) 2.5% 95 (8.5%) 3.0% 1,112 4.4%
Independent doctors 449 (19.4%) 11.5% 435 (18.8%) 13.7% 2,317 9.1%
Costs (Mio. EUR) 302.3 (12.8%) 286.5 (12.1%) 2,362.4
Full in-patient cases 92,557 (11.3%) 114,401 (14.0%) 815,592
Part in-patient cases 392 (3.7%) 987 (9.2%) 10,739
Indicators
Occupancy rate 76.32% (98.3%) 81.75% (105.3%) 77.63%
Length-of-stay 11.77 (132.5%) 8.28 (93.3%) 8.88
Beds per hospital 217.1 (78.1%) 211.7 (76.2%) 277.8
Departm. per hospital 3.89 (75.5%) 4.47 (86.8%) 5.15
Costs per case (EUR) 3,266 (112.7%) 2,504 (86.5%) 2,897
Patient throughput 23.68 (74.2%) 36.02 (112.9%) 31.91
Table 2: Characteristics of inefficient and efficient hospitals

27
0500
10001500200025003000350040004500
0 1000 2000 3000 4000
Cases in Group 1
Cas
es in
Gro
up
2
Hospital 2
Hospital 1
Hospital 3
Figure 1: Efficiency of hospitals
28
1.500
1.700
1.900
2.100
2.300
2.500
2.700
12.00 13.00 14.00 15.00 16.00 17.00 18.00
Beds per 1,000 cases
Co
sts
per
cas
e
Hospital C+ 9 Beds
Hospital B- 9 Beds
Hospital A
Figure 2: Redistribution of beds from an inefficient to the efficient hospitals