INCOME STATEMENTS “BY NATURE” AND ANALYSIS · PDF fileINCOME STATEMENTS “BY...
44
INCOME STATEMENTS “BY NATURE” AND ANALYSIS OF COMPANY PERFORMANCE –AN APPLICATION TO U.S. AIRLINE COMPANIES C. Richard Baker Department of Accounting & Finance University of Massachusetts Dartmouth North Dartmouth, MA 02747 USA Telephone: (508) 999-9243 Fax: (508) 999-8776 E-mail: [email protected] Yuan Ding Department of Accounting and Management Control H.E.C. School of Management 78351 Jouy-en-Josas - FRANCE Telephone: +33 1 39 67 74 77 Fax: + 33 1 39 67 70 86 E-mail: [email protected] Hervé Stolowy Department of Accounting and Management Control H.E.C. School of Management 78351 Jouy-en-Josas - FRANCE Telephone: +33 1 39 67 94 42 Fax: + 33 1 39 67 70 86 E-mail: [email protected] Acknowledgments. Yuan Ding would like to acknowledge the financial support of the Research Center at the HEC School of Management (project A0306). Yuan Ding and Hervé Stolowy are also members of the Research Center in International Accounting and Management Control (CRECCI – University of Montesquieu Bordeaux IV). Corresponding author: Hervé Stolowy, HEC School of Management, Department of Accounting and Management Control, 1, rue de la Libération, 78351 – Jouy-en-Josas, France. E-mail: [email protected].
-
Upload
truongliem -
Category
Documents
-
view
217 -
download
3
Transcript of INCOME STATEMENTS “BY NATURE” AND ANALYSIS · PDF fileINCOME STATEMENTS “BY...

INCOME STATEMENTS “BY NATURE” AND ANALYSIS OF COMPANY PERFORMANCE –AN APPLICATION TO U.S. AIRLINE COMPANIES
C. Richard Baker Department of Accounting & Finance
University of Massachusetts Dartmouth North Dartmouth, MA 02747 USA
Telephone: (508) 999-9243 Fax: (508) 999-8776
E-mail: [email protected]
Yuan Ding Department of Accounting and Management Control
H.E.C. School of Management 78351 Jouy-en-Josas - FRANCE
Telephone: +33 1 39 67 74 77 Fax: + 33 1 39 67 70 86
E-mail: [email protected]
Hervé Stolowy Department of Accounting and Management Control
H.E.C. School of Management 78351 Jouy-en-Josas - FRANCE
Telephone: +33 1 39 67 94 42 Fax: + 33 1 39 67 70 86 E-mail: [email protected]
Acknowledgments. Yuan Ding would like to acknowledge the financial support of the Research Center at the HEC School of Management (project A0306). Yuan Ding and Hervé Stolowy are also members of the Research Center in International Accounting and Management Control (CRECCI – University of Montesquieu Bordeaux IV). Corresponding author: Hervé Stolowy, HEC School of Management, Department of Accounting and Management Control, 1, rue de la Libération, 78351 – Jouy-en-Josas, France. E-mail: [email protected].

INCOME STATEMENTS “BY NATURE” AND ANALYSIS OF COMPANY PERFORMANCE –AN APPLICATION TO U.S. AIRLINE COMPANIES
ABSTRACT
Since September 11, 2001, and during the ensuing economic slowdown, U.S. airline companies have experienced significant financial difficulties, including bankruptcies and near bankruptcies on the part of several major carriers. In an economic setting where U.S. airlines are struggling to achieve or maintain profitability, it is important for accountants, auditors and financial analysts to be able to analyze the relative performance of airline companies. In the airline industry, income statements are normally prepared “by nature” rather than “by function.” This differs from the usual presentation found in the income statements of most American companies. This case demonstrates how to perform a comparative financial statement analysis when an income statement is prepared “by nature,” by applying a tool called the “Statement of Intermediate Balances.” The three companies studied in this case are United Airlines, Delta Air Lines and Southwest Airlines.
RESUME Depuis les tragiques événements du 11 septembre 2001, les compagnies aériennes américaines ont dû faire face à de sérieuses difficultés financières, allant jusqu’à la quasi-faillite ou même la faillite de certaines d’entre elles. Dans ce contexte, il est important pour les comptables, auditeurs et analystes financiers de porter un jugement sur la performance relative des compagnies aériennes. Dans ce secteur, le compte de résultat est en principe présenté « par nature » plutôt que « par fonction ». Cette présentation diffère du format traditionnel américain. La présente étude de cas montre comment réaliser une analyse financière comparée de sociétés américaines lorsque le compte de résultat est présenté par nature à l’aide d’un outil, les « soldes intermédiaires de gestion ». Les trois sociétés étudiées sont United Airlines, Delta Air Lines et Southwest Airlines.
KEY WORDS Financial statement analysis – Income statement format – Income statement by nature – Income statement by function - Statement of intermediate balances
MOTS CLES Analyse financière – Présentation du compte de résultat – Compte de résultat par nature – Compte de résultat par fonction – Soldes intermédiaires de gestion
1

INCOME STATEMENTS “BY NATURE” AND ANALYSIS OF COMPANY PERFORMANCE –AN APPLICATION TO U.S. AIRLINE COMPANIES
PART I: THE CASE
The Companies
United Airlines (“United”) and Delta Air Lines (“Delta”) are major air carriers that
provide air transportation for persons, property and mail throughout the United States and
around the world. The revenue passenger miles1 for United were 116,635 million miles in
2001. This compares to 101,717 million revenue passenger miles for Delta. Southwest
Airlines Co. (“Southwest”) is a major U.S. domestic airline that provides primarily short-haul,
high-frequency, point-to-point, low-fare service. Southwest’s revenue passenger miles were
44,494 million in 2001.
Both United and Delta, and to a lesser extent Southwest, suffered extensively from the
tragic events of September 11, 2001. In fact, United has been struggling to avoid filing for
bankruptcy (Wong 2002). The Management’s Discussion and Analysis of Financial Position
and Results of Operations (MD&A) in the annual report of United for the year 2001
summarized the state of the U.S. airline industry in the following way:
Beginning in 2001, the weakening U.S. economy had a significant impact on the
airline industry as corporations reduced their business travel budgets and changed their
travel behavior. During the first six months of 2001, the industry began experiencing
significant revenue declines as a result of the decrease in business traffic (…),
particularly in the domestic markets. (…) United’s revenues (…) were significantly
1 The term “revenue passenger mile” is defined as a mile flown on each flight stage multiplied by the number of
“revenue passengers” on that stage. A “revenue passenger” is a person receiving air transportation from the air
carrier for which remuneration is received by the air carrier.
2

impacted by the events of September 11 and the resulting reduction in the Company’s
operations.”
In the Exhibits 1, 2, and 3 find the following:
- Statements of Consolidated Operations for the six months ended June 30, 2002 (source:
SEC Filings) and the fiscal years ended December 31, 1998 through December 31, 2001
for UAL Corporation (a holding company whose principal subsidiary is United) (source:
Annual Reports 2001 and 2000) (see Exhibit 1).
- Consolidated Statements of Income for the six months ended June 30, 2002 (source: SEC
Filings) and for the fiscal years ended December 31, 1998 through December 31, 2001 for
Delta (source: Annual Reports 2001 and 2000) (see Exhibit 2)
- Consolidated Statements of Income for the six months ended June 30, 2002 (source: SEC
Filings) and for the fiscal years ended December 31, 1998 through December 31, 2002 for
Southwest (source: Annual Reports 2001 and 2000) (see Exhibit 3).
*** Insert Exhibits 1, 2 and 3 here ***
These consolidated financial statements have been prepared in accordance with
accounting principles generally accepted in the United States. For simplification purposes,
the term “income statement” is used to refer to the “statements of consolidated operations”
and the “consolidated statements of income” of the three companies studied in this case. The
SEC 10-Q filings for United, Delta and Southwest’s for the six months ended June 30, 2002,
also include the following comparative data for six months ended June 30, 2001:
3

United Delta Southwest
In Millions of $ 2001 (6 months) 2001 (6 months) 2001 (6 months)
Passenger 7,840 7,135 2,887
Cargo 389 271 50
Other operating revenues 853 212 45
Total production for the period 9,082 7,618 2,982
In United’s MD&A (2001) and notes to the financial statements for the year ended December
31, 2001, the following information is also included:
- Other operating revenues include fuel sales to third parties and revenues related to
frequent-flyer sales of miles to third parties.
- The increase in salaries and related costs was partially offset by the reduction in force
implemented after September 11.
- In August 2001, a change to the commission structure was implemented and reduced
the cap paid on commissions in the U.S. for domestic travel.
- Purchased services relate to computer reservations fees and credit card discount fees.
- Landing fees and other rent increased in 2001 primarily due to increased rates at
various airports.
- Depreciation and amortization increased due to an increase in the number of owned
aircraft.
- Cost of sales is related to costs associated with fuel sales to third parties.
- Other operating expenses include advertising costs, crew layover expenses and food
and beverage costs.
- The special charge caption includes an expense of $1.3 billion for amounts relating to
the September 11 terrorist attacks and the resulting impact in the Company’s schedule
and operations (aircraft groundings and impairment, reduction in force, early
termination fees, discontinued capital projects).
4

- As of December 31, 2001, United had received $652 million in compensation under
the Air transportation safety and System Stabilization Act.
- The “non-operating special charges” in 2001 is related to September 11.
The Delta’s 2001 annual report and its MD&A for the six months ended June 30, 2002
contain the following additional information:
- Other operating revenues include code share revenues, mileage memberships and
administrative service fees.
- Salaries and related costs increased during 2001 in relation to increased costs
associated with the new pilot contract.
- Depreciation and amortization expense rose in 2001 due to the acquisition of
additional aircraft and ground equipment.
- Other selling expenses decreased in 2001 due to a lower volume of credit card charges
resulting from lower revenue. This item includes advertising costs.
- Passenger commissions expense declined in 2001, primarily as a result of lower
passenger revenues.
- Contracted services expense increased in 2001 as a result of rate increases for building
and equipment maintenance and increased security costs.
- Other operating expenses decreased in 2001 as a result of lower fuel-related taxes,
interrupted trip expenses and professional fees, partially offset by new uniform costs
and higher insurance expenses.
- “Asset write downs and other special charges” relates to charges for early retirement
and severance costs relating to staffing reductions, charges for the impairment and
early retirement of certain aircraft for discontinued contracts, facilities and information
technology projects.
5

- The “Stabilization act compensation” reflects the compensation recognized under the
Stabilization Act, following September 11.
In the Southwest 2001 Annual report, the following additional information is provided:
- Agency commissions decreased primarily due to a change in the Company’s
commission rate policy.
- Depreciation expense increased due to the growth in the Company’s aircraft fleet prior
to September 11.
- “Other operating expenses” increased due to a significant increase in passenger
liability, aircraft hull, and third-party liability insurance costs following the terrorist
attacks.
- The “other expenses (income)” include other gains and losses which represent $235
million received as the Company’s share of government grant funds under the
Stabilization Act, less special charges of $48 million arising from the terrorist attacks.
Required:
1. Compare the format of the income statements of United, Delta and Southwest with the
format that is more common found among U.S. companies (see for example the income
statement of General Motors Corp. at the following internet address:
http://www.gm.com/company/investor_information/docs/fin_data/gm01ar/). What major
differences do you find between the income statement format of the airlines companies
and the more common income statement format?
2. Explain the difference between an income statement presented “by function” and an
income statement “by nature” (also referred to as an income statement prepared with an
6

“objective classification” of its elements). What are the relative advantages and
disadvantages of each of these formats?
3. Why are the income statements of airline companies usually presented “by nature”?
4. Using the income statements shown in Exhibits 1, 2 and 3 and the templates shown in
Exhibits 4.1 and 4.2, prepare revised income statements for United, Delta and Southwest
following the model Statement of Intermediate Balances (SIB) described in Appendix 1.
5. Prepare a comparative analysis of the Statements of Intermediate Balances prepared in
Question 4.
*** Insert Exhibits 4.1 and 4.2 here ***
PART II: CASE LEARNING OBJECTIVES AND IMPLEMENTATION GUIDANCE
Overview
This case study addresses the differences between income statements presented “by
nature” (or “objective classification”) and income statements presented “by function.” When
an income statement is presented “by nature,” expenses are organized into categories like
salaries, fuel, depreciation, rent, etc., or, in others words, by nature of expenditure. In the
U.S., income statements prepared “by function” are more commonly seen than those prepared
“by nature.” However, in the airline industry income statements presented “by nature” are the
norm. This is because the U.S. Department of Transportation (DOT) recommends this form
of presentation in their Uniform System of Accounts and Reports (USAR). In addition to the
companies studied in this case, the companies that prepare their income statements “by
nature” include, among others, American Airlines, Continental Airlines and Northwest
Airlines. In other countries, Air Canada and Japan Airlines, for example, also prepare their
income statements “by nature.”
7

One of the advantages of income statements prepared “by nature” is that they facilitate
the calculation of intermediate balances before the net income figure. The calculation of
intermediate balances is a useful tool for financial statement analysis, particularly to prepare
comparative analyses of company performance. When an income statement is organized “by
function” (e.g. cost of goods sold; selling expenses; administrative expense, etc.), the
calculation of intermediate balances such as commercial margin, value added, operating profit
and operating income are often difficult to perform. Pro forma Statements of Intermediate
Balances are much easier to prepare when an income statement is organized “by nature”
rather than “by function.”
This case study can be used in sections of introductory accounting courses, at both the
undergraduate and MBA levels, where the focus is on financial statement analysis, or in
courses that are exclusively devoted to financial statement analysis.
Teaching Objectives
In an economic setting where American airline companies have experienced serious
financial difficulties (e.g. Chapter 11 bankruptcy for U.S. Airways on August 11, 2002;
financial restructuring of Continental Airlines in summer of 2002), it is important to be able to
analyze and measure the relative performance of such companies. Fortunately, in the airline
industry, income statements are normally prepared “by nature” rather than “by function.”
Income statements prepared “by nature” facilitate comparative analysis. This case
demonstrates how to perform a comparative financial statement analysis when an income
statement is prepared “by nature.” The three companies studied in this case (United, Delta
and Southwest) were chosen for the following reasons. United and Delta are both among the
8

largest airline companies in the world, but United experienced greater financial difficulties
from September 11th than did Delta. A comparative analysis should reveal this difference.
Southwest is a different type of airline in comparison with United and Delta. It is a self-
described “low-cost” carrier, consequently, a comparative analysis should also reveal this
difference.
Learning Objectives
Students should be able to:
- Discuss the differences between an income statement prepared “by nature” and “by
function”;
- Explain why U.S. airline companies use a “by nature” income statement format;
- Prepare a Statement of Intermediate Balances which shows the various levels of a
company’s operating performance;
- Analyze Statements of Intermediate Balances and compare the performance of three
U.S. airlines: United, Delta and Southwest.
Suggestions for Case Administration
Based on our previous experience with this case, there are at least two ways to use it:
Alternative 1- Students are asked to prepare Statements of Intermediate Balances
(question 4) and then analyze these statements (question 5). The preparation of the
Statements of Intermediate Balances can be facilitated by asking the students to use columnar
worksheets like those shown in Exhibits 4.1 and 4.2. These exhibits provide a template for
preparing the Statement of Intermediate Balances for United. The same template should be
adapted to the income statements items of Delta and Southwest.
9
Alternative 2- The instructor distributes the Statements of Intermediate Balances included in
the teaching notes to the students and the students are asked to analyze them. Question 4
would therefore be skipped.
The first alternative provides a richer learning experience because students must
prepare the Statements of Intermediate Balances, but this alternative requires more time. The
second alternative provides a good understanding of the Statement of Intermediate Balances
and how such statements can be used for financial statement analysis.
Estimated Time Required for Class Discussion of the Case
Our previous experience with the cases indicates that the time required depends on the
alternative chosen for the case administration:
- Alternative 1 (preparation and analysis of the Statement of Intermediate Balances for
each company): one 90 minute session
- Alternative 2 (analysis of the SIBs only): 60 minutes.
10

PART III: TEACHING NOTES
Principal Themes Explored in the Case
- Difference between an income statement “by nature” and an income statement “by
function”;
- Reasons of adoption of the “by nature” format in the U.S. airline industry;
- Preparation of a Statement of Intermediate Balances and common-sized income
statements following the “by nature” format;
- Comparative analysis of United, Delta and Southwest based on the Statements of
Intermediate Balances.
1. Comparing the Income Statements of the Three Airline Companies with the Most
Common Format Found in the U.S.
In comparing the income statements of United, Delta and Southwest with the income
statement of General Motors, the major difference that is immediately obvious is the
classification of expenses. Typically, expenses in an income statement are classified “by
function” (e.g. costs of goods sold, selling and marketing expenses, general and
administrative expenses, and other operating expenses). In the income statements of the three
airline companies, the expenses are classified “by nature” (e.g. salaries and related costs,
aircraft fuel, commissions, aircraft rent, etc.). This difference in income statement format is
discussed more fully in the following section.
2. Differences Between an Income Statement “By Nature” and “By Function”
An income statement reflects the revenues and expenses of an enterprise during a
given period and serves to establish the net income for the period. Net income is the
remainder after all expenses have been deducted from revenues. Net income is one measure
11

of the wealth generated by an economic entity (i.e. the net increase to stockholders’ equity)
during an accounting period. Income statements report how a company’s financial and
operating performance was achieved.
Possible Presentations
There are several ways of organizing an income statement (e.g. horizontal vs. vertical
format) and a choice regarding degree of fineness, as well as a choice between ways of
classifying expenses (see Exhibit 5).
*** Insert Exhibit 5 here ***
Formats
An income statement provides a list of revenue and expense account balances, usually
in aggregate form. The list of account balances can be presented as a continuous list (vertical
format) or as two lists side by side (horizontal format). Although not commonly used in
business reporting, the horizontal format may useful for pedagogical purposes. For example,
an income statement can be presented in the form of a T-account. United, Delta and
Southwest all use the vertical format for their income statements.
Degree of Fineness
Expenses in an income statement are usually grouped into homogeneous categories
and then subtracted step-by-step from revenues. With regard to the degree of fineness, the
choice is between a single-step and a multiple step format.
Single-step: This is simplest version for an income statement. All revenues are
grouped into one category and all expenses are grouped into another category. A difference is
then taken between the revenues and the expenses. A variation of this format can be seen
12

where all operating revenues are followed by all operating expenses. This permits the
determination of operating income. Afterwards, several sub-levels of earnings may be
presented (e.g. income from continuing operations before taxation, income from continuing
operations, net income). This kind of format is still considered to be a single-step format
because the essential elements of the income statement (i.e. operating revenues and operating
expenses) are presented separately.
Multiple-step: In a multiple-step format, the revenue and expense categories are
paired in a way that highlights various sub-components of net income (e.g. gross profit,
operating income, income from continuing operations). The multiple-step format is the most
common format used in business reporting because it is considered to be more informative
than the single-step approach. The usefulness of the multiple-step approach is dependent on
the ability of the management of a company to separate revenue and expenses using
meaningful criteria, without adopting rules of allocation that reduce usefulness for decision-
making (see, for more detail, Kieso et al., 2001, p. 132).
In the three companies studied, the first parts of the income statements (up to the point
of “earnings from operations” for United and “operating income” for Delta and Southwest),
follow the single-step format, whereby operating expenses are subtracted from operating
revenues. Following operating income several sub-level earnings numbers are presented.
This format corresponds to the variation of the single-step format discussed previously above.
13
Classification of Expenses
The distinction between classifying expenses “by nature” or “by function” is not
addressed in U.S. GAAP, even though U.S. government regulations do address this
distinction. The International Accounting Standards Board (IASB) has specifically addressed
the distinction between “by nature” and “by function” expense classification, by stating that:
“Expense items are sub-classified in order to highlight a range of components of
financial performance, which may differ in terms of stability, potential for gain or loss
and predictability. This information is provided either by nature or by function.
Classification issues are especially important for operating expenses” (IASB, 1997).
Classification by Function (or “Cost of Sales Method”): This kind of income
statement format classifies expenses according to their role in the determination of net
income. Cost of goods sold, commercial, distribution and administrative expenses are
common categories employed in the “by function” format (see Exhibit 6).
Classification by Nature (or “Nature of Expenditure Method”): In using the “by
nature” format, expense accounts are combined in a way that reflects their nature or objective
(e.g. purchases of raw materials, transportation costs, taxes other than income tax, salaries and
social expenses, depreciation, etc.) (see Exhibit 6)2. This format is relatively easy to use, even
for small enterprises, because no allocation or partitioning of expenses is required.
*** Insert Exhibit 6 here ***
2 The answer to Question 3 indicates that classification “by nature” is called an “objective classification of the
elements of an income statement” in the regulations promulgated by the U.S. Department of Transportation.
14

Choice of a Classification Approach
The categorization of income statements according to their of “degree of fineness” or
their method of “classifying expenses” can by viewed as a 2 x 2 matrix. For example, an
income statement prepared “by nature” can be presented in a single-step or a multiple-step
format. An income statement prepared “by function” can also be presented in a single-step or
multiple-step format. The multiple-step format, organized by function, is the most common
format used by American companies (AICPA, 1999). In comparing the different approaches
to income statement presentation, several remarks can be made:
- A preference for classification “by nature” may reflect the requirements of
governmental agencies who need such information to prepare national income
accounts (this is often the case in European countries). A “by nature” presentation
allows the calculation of the value added by an enterprise to the over-all economy of a
country. The “value added” concept is important for countries that have a value added
tax system. In essence, the value added concept3 measures the amount of value
created by a firm beyond what it acquired from outside the economic entity.
- Preference for a “by function” presentation often reflects an emphasis on the needs of
capital markets. The “by function” format is the preferred method in North America,
and it is used by most firms listed on the New York Stock Exchange.
The IASB has indicated that presentation of income statements “by function”: “provides
more relevant information to users than the classification of expenses by nature” (IASB 1997:
par. 82). However, the IASC also points out that: “the allocation of costs to functions can be
3 “Value added” should not be confused with “economic value added”, a term which is usually defined as
operating income minus cost of capital employed.
15

arbitrary and involves considerable judgment.” Paragraph 84 of the IASB conceptual
framework recognizes that: “the choice of analysis between the cost of sales method and the
nature of expenditure method depends on both historical and industry factors and the nature of
the organization” (IASB 1997). The IASC states that “each method of presentation has merit
for different types of enterprise” (IASC 1997: § 84). United, Delta and Southwest have
clearly adopted the “by nature” format.
3. Reasons for the Adoption of the “By Nature” Format in the U.S. Airline Industry
Airline accounting in the U.S. has been determined in part by the Uniform System of
Accounts and Reports (USAR) issued by the U.S. Department of Transportation (DOT).
Pursuant to DOT regulations: “all profit and loss elements are accounted for within specific
objective accounts, which are descriptive of both basic areas of financial activity, or
functional operation, and objective served” (USAR, part 241, section 1-3). The USAR
envisions two types of classification; one by function (or financial activity) and one by nature
(or objective). Section 7 of the USAR includes a “chart of profit and loss accounts”
employing an “objective classification of profit and loss elements,” including:
- Transport revenues (passenger, mail, property, charter, other)
- Transport-related revenues and expenses (in-flight sales, restaurant and food service
(ground), rents, limousine service…)
- Transport expenses (pilots and co-pilots, other flight personnel, maintenance labor…,
traffic commissions, general services purchased, landing fees, maintenance materials,
passenger food expense, provisions for obsolescence and deterioration…).
The USAR states that: “The profit and loss accounts are designed to reflect, through natural
groupings, the elements entering into the derivation of income or loss” (our emphasis)
16

(USAR, part 141, section 8). This regulation provides some explanation of why U.S. airlines
report their income statement “by nature.”
4. Preparation of Statements of Intermediate Balances for Each Company
Preliminary Remarks
- The income statements for the three airline companies are presented “by nature,”
facilitating the preparation of Statements of Intermediate Balances (SIB).
- In a Statement of Intermediate Balances, percentage figures usually do not appear
following the year to which they relate because it is more important to have the
percentages figures adjacent to one another so as to be able to analyze the evolution of
the enterprise over the periods investigated. In practice, the percentages are as
important, if not more important, than the absolute dollar values.
- Common-sized Statements of Intermediate Balances offer the additional advantage of
allowing comparisons to be made between periods of unequal length. For example,
the SIB for the first six months of 2002 can be compared to the SIBs for the year 2001
and the previous years.
- The “net earnings” of United and the “net income (loss) available to common
shareowners” of Delta both show net income after preferred stock dividends. It is
possible to terminate the SIBs at the net income figure before preferred stock
dividends.
- If there is a difference between companies in the treatment of certain specific revenues
or expenses, it is important to adjust these items so that they are treated in the same
manner. For example, the “Airline Stabilization Act” caption for United is reflected
among the non-operating expenses, while the “Stabilization Act Compensation” for
Delta is treated as an operating item. For Southwest, this grant is reflected in “other
17

expenses (income)”. In the teaching notes, we decided to treat these items as
“unusual items” in the SIB.
- The “Special Charges” of United and the “Asset Writedowns and Other Special
Charges” of Delta have also been included in the unusual area of the SIB.
- In the income statement of Southwest, the “other expenses (income)” line is presented
with a sign opposite to what would be considered to be a normal presentation (i.e. plus
for expenses and minus for income). To facilitate the comparison with United and
Delta the signs have been reversed in the SIB.
Statements of Intermediate Balances
Statements of Intermediate Balances for United (see Exhibits 7.1 and 7.2), Delta (see
Exhibits 8.1 and 8.2) and Southwest (see Exhibits 9.1 and 9.2), are presented both in absolute
dollar terms and in percentage terms (i.e. common-sized).
*** Insert Exhibits 7.1, 7.2, 8.1, 8.2, 9.1 and 9.2 here ***
5. Comparative Analysis of the Statements of Intermediate Balances
Revenues/Production4
Even though the common-sized SIBs are based on the principle of dividing all the
other figures in the statement by the total production for the year, we have added to the
statement a line showing the change in revenues for each year in comparison with the
previous year as well as the change during the first six months of year 2002. It can be seen
that before the events of September 11, 2001, Southwest had the greatest growth in revenues
(+ 19.3 % in 2000), followed by Delta (+12.5%) and United (+7.4%). After September 11th,
4 All three companies have no reselling activity. Consequently, there is no commercial margin to compute.
18

the decrease in revenues was the greatest for United (-17.1%) and Delta (-16.6%). In contrast,
the decrease in revenues for Southwest was much less (-1.7%). In addition, in 2002, the
decrease was less for Southwest (- 8.5% during the first six months) than for Delta (- 13.7%)
or for United (- 22%). This comparative analysis allows us to see that Southwest, and to a
lesser extent, Delta, came through the crisis better than United.
The activities of United, Delta and Southwest are relatively different: United Airlines’
revenues are more diversified (less passenger oriented) than Delta, and even more diversified
than Southwest. Eighty-four percent (84%) of United’s revenues were derived from
passengers versus 92.7% and 96.7% for Delta and Southwest respectively in 2002. It appears
that United derives an increasing portion of its overall production from “other operating
revenues” which include fuel sales to third parties and revenues related to frequent-flyer sales
of miles to third parties.
Consumption from Third Parties
The ratio of Consumption from Third Parties to Total Production is lower for
Southwest (49.7% in 2002) and Delta (52.3% in 2002) than for United (61.1% in 2002). This
ratio has increased for all three companies in comparison with 2001, indicating an inability to
pass on increased costs to airline passengers. Looking at the breakdown of Consumption
from Third Parties, we see that Fuel Cost represent the greatest expense for each of the
companies (if we except “Other Operating Expenses” for Southwest), and that Fuel Cost as a
percent of Total Production increased for each of the companies in every year through 2000.
Between 1998 and 2001, Fuel Cost increased from 10.2% to 15.3% for United. Delta went
from 9.6% to 13.1%, and Southwest from 9.3% to 14.2%. In 2002, fuel costs decreased
19

somewhat because of a decrease in consumption of fuel and a decrease in the average cost per
gallon.
Delta and Southwest were able to soften the increase in Consumption from Third
Parties because of a reduction in the amount of Commissions (i.e. fees paid to travel agents)
(from 6.6% in 1998 to 3.0% in 2002 for Delta, and from 3.8% in 1998 to 1.1% in 2002 for
Southwest). Delta also experienced a reduction in the cost of Passenger Service (from 3.4%
in 1998 to 2.9% in 2002). United experienced a similar reduction in Commissions (from
7.5% in 1998 to 3.3% in 2002). For United and Delta, Commissions decreased primarily as a
result of a decrease in commissionable revenues. In addition, on March 20, 2002, United
discontinued paying base commissions on all tickets issued in the U.S. and Canada. As for
Southwest, it modified its system of paying commissions in 2001, which reduced this cost.
With respect to United, Purchased Services decreased in 2002 primarily as a result of volume-
driven decreases in GDS (global distribution systems) and credit card discount fees. In
absolute value terms, Aircraft Rent decreased because of the retirement of older aircraft and a
decrease in engine and aircraft repair volumes as a result of reduced flying levels in late 2001
and 2002. However, this number increased in percentage terms for both United and Delta.
Southwest was able to stabilize its Aircraft Rental cost.
For Delta, Other Operating Expenses remained stable between 2001 and 2002. This
was the result of lower fuel-related taxes, interrupted trip expenses and professional fees. The
decrease in these expenses was partially offset by increases in new uniform costs and higher
insurance costs. Delta’s Other Operating Expense is lower than the comparative one for
United (5.9% versus 10.5% of production in 2002). However, the composition of this
category may not be entirely comparable between the companies because the Other Operating
20
Expenses of United includes advertising costs, crew layover expenses and food and beverage
costs. The comparison with Southwest, where the number is 18.6% of production in 2002, is
even more difficult to make because the annual report of Southwest provides little specific
information concerning the make-up of Other Operating Expenses. The only information
provided is that the category includes insurance premiums and advertising expenses.
In general, for all three companies, the costs of Consumption from Third Parties
increased in 2001 in relation to Total Production. This trend diminished somewhat in 2002. It
can also be seen that Southwest generally has a lower cost structure than United and Delta.
Value Added
While not widely used in North America, the Value Added figure shows the extent to
which an enterprise contributes to the national wealth of the country. The Value Added figure
for United has consistently declined since 1999. This is because the cost of Consumption
from Third Parties has increased in relation to Total Production. This trend shows that United
has been unable to pass along the increased cost to its customers. The comparative Value
Added figures for Delta shown in Exhibit 8.2, indicate a similar pattern, but not as dramatic as
that of United. For Southwest, the Value Added figures remained relatively stable prior to the
events of September 11th but declined somewhat thereafter.
Gross Operating Income
United and Delta had similar levels of Salaries and Related Costs until 2001 (44.1% of
Total Production for Delta versus 43.9% for United in 2001). However, the SIB indicates that
following the events of September 11th, United experienced a greater increase in the ratio of
Salaries and Related Costs to Total Production (an increase from 44.1% in 2001 to 47.7% in
21

2002) than did Delta (an increase from 43.9% in 2001 to 46.6% in 2002). The fact that Delta
was better able to manage its Salaries and Related Costs than United contributed to a positive
Gross Operating Income for Delta in 2002 (1.1%), while that of United was strongly negative
(- 8.8% in 2002). The ratio of Salaries, Wages and Benefits to Total Production for
Southwest is generally much lower than for United and Delta (35.3% in 2002 versus 46.6%
for Delta and 47.7% for United). For Southwest, the ratio of Salaries, Wages and Benefits to
Total Production was considerably higher in 2002 (35.3%) and 2001 (33.4%) than the average
of about 30% for the years 1998 through 2000. The increase was due in part to increased
security requirements following the events of September 11th. Nevertheless, the lower level
of salaries allowed Southwest to record a Gross Operating Profit in both 2001 and 2002.
As discussed in Appendix 1, Gross Operating Income reflects the return derived from
the core activities of the enterprise. The different Gross Operating Income figures indicate the
relative performances of United, Delta and Southwest. A negative gross operating income
(i.e., a Gross Operating Loss) is a sign of financial distress.
Operating Income
For all three companies Depreciation and Amortization expense rose in 2001 in
comparison with 2002 because of the acquisition of additional aircraft and ground equipment.
The ratio of Depreciation and Amortization to Total Production differs substantially between
the three companies: 8.7% for Delta, 6.9% for United and 6.3% for Southwest in 2002. The
higher level of Depreciation and Amortization expense for Delta is attributable to the
composition of its aircraft fleet. The annual reports of the three companies indicate that the
operating fleet of United consisted of 243 owned aircraft, while the size of the Southwest fleet
was 355 (which may include leased aircraft), while that of Delta consisted of 459 owned
22

aircraft as of December 31, 2001. Consequently, Delta has more owned aircraft that either
United or Southwest. The difference in the ratio of Depreciation and Amortization expense to
Total Production has an important impact on Operating Income (Loss) of the companies. The
Operating Losses of United and Delta became closer than their Gross Operating figure
numbers due to the higher level of Depreciation and Amortization expense for Delta. United
and Delta both had Operating Losses in both 2001 and 2002 (United: -14.5% in 2001, -15.7%
in 2002; Delta: -8.0% in 2001, -7.6% in 2002). Southwest posted Operating profits in 2001
(11.4%) and 2002 (8.7%).
Operating Net Income before Taxes
Delta’s ratio of Interest Expense (Net) to Total Production increased dramatically over
the period 1998 to 2002 (from 0.5% to 4.5%). United experienced the same trend (from 2.0%
to 4.1%), although it was not as marked. This increase in the Interest Expense ratio was due
primarily to increases the outstanding debt of both companies. An increasing Interest
Expense to Total Production ratio may be a sign of financial difficulty for United and Delta.
Southwest also recorded an increase in the ratio (from 1.3% in 1998 to 1.9% in 2002), but the
level of Interest Expense in relation to Total Production was much lower than it was for
United and Delta. After adjustments for Interest Expense and other items, United and Delta
both posted negative Operating Income before Taxes, with that of United (-19.3%) being
more strongly negative than that of Delta (-12.5%). The Operating Net Income of Southwest
remained positive in 2002 (7.8%).
Unusual Income (Loss)
A special charge was recorded by each of the companies in 2001 with in relation to the
September 11 terrorist attacks and the resulting impact on the companies’ schedules and
23

operations. All three companies also received compensation under the Airline Stabilization
Act which partially offset their losses. The impact from unusual items was greater for United
(-3.5% in 2001) than for Delta (- 2.6%). The over all effect of unusual items was positive for
Southwest (3.7% in 2001).
Net Income (Loss)
Both United and Delta include a Provision for Income Taxes that reflects the negative
Operating Income before Taxes of these companies. In other words, the Provisions for
Income Taxes are positive instead of negative, indicating that an income tax benefit has been
recorded rather than an expense. The Provision for Income Taxes for United is larger than for
Delta because of its relatively larger Operating Loss before Taxes. The larger tax benefit
allowed United to reduce its Net Loss (-19.3% pre-tax versus -12.0% after tax) more than
Delta (-12.5% pre-tax versus – 9.0% after tax). Southwest had a positive Net Income number
representing 4.5% of its Total Production in 2002.
Conclusion
The SIB shows that studying the net income figures alone is not sufficient. If we look
at the Gross Operating Income of the companies, it is clear that the situation of United is very
troublesome. At the level of Operating Income (Loss) before Taxes the situation is delicate
for both United and Delta, but it is clearly worse for United. The Net Income (Loss) numbers
for United and Delta are much closer. The situation for Southwest remained satisfactory
because of its generally lower costs. However, it can be seen that there was a deterioration in
even Southwest’s performance in 2002.
24

REFERENCES
AICPA. 1999. Accounting Trends and Techniques-1999. New York: American Institute of
CPAs.
DOT. 2002. Uniform System of Accounts and Reports for Large Certificated Air Carriers.
Washington, D.C.: Department of Transportation.
http://www.bts.gov/lawlib/docs/Part241cy2000.pdf.
IASC. 1997. International Accounting Standard No. 1: Presentation of Financial Statements
(Revised). London: International Accounting Standards Board.
Kieso, D., Weygandt, J. and Warfield, T. 2001. Intermediate Accounting. Tenth edition. New
York, NY: John Wiley & Sons, Inc.
Wong, E. 2002. United amends cost-cut plan to try to get loan guarantee. The New York
Times. October 24: C5.
Annual Reports
Delta Air Lines. The annual reports and SEC filings can be found at the following Internet
address: http://www.delta.com/inside/investors/index.jsp
Southwest Air Lines. The annual reports and SEC filings can be found at the following
Internet address:
http://www.southwest.com/about_swa/financials/investor_relations_index.html
25

United Air Lines. The annual reports and SEC filings can be found at the following Internet
address: http://www.ual.com/page/middlepage/0,1454,1368,00.html
26

EXHIBIT 1 UNITED AIRLINES
Statements of Consolidated Operations For the six months ended June 30, 2002 and
for the years ended December 31, 2001, 2000, 1999 and 1998 (In millions of US $) 2002
(6 months)2001 2000 1999 1998
Operating Revenues Passenger 5,948 13,788 16,932 15,784 15,520 Cargo 309 704 931 906 913 Other operating revenues 824 1,646 1,489 1,337 1,128 7,081 16,138 19,352 18,027 17,561Operating Expenses Salaries and related costs 3,378 7,080 6,877 6,426 6,170 Aircraft fuel 865 2,476 2,511 1,776 1,788 Commissions 225 710 1,025 1,139 1,325 Purchased services 695 1,650 1,711 1,575 1,505 Aircraft rent 419 827 888 876 893 Landing fees and other rents 501 1,009 959 949 881 Depreciation and amortization 488 1,026 988 850 793 Aircraft maintenance 296 701 698 689 624 Cost of sales 585 1,280 1,061 602 474 Other operating expenses 743 1,722 1,841 1,737 1,630 Special charges 82 1,428 139 17 8,277 19,909 18,698 16,636 16,083Earnings (loss) from operations (1,196) (3,771) 654 1,391 1,478Other income (expense) Interest expense (288) (525) (402) (362) (355) Interest capitalized 17 79 77 75 105 Interest income 36 105 101 68 59 Equity in earnings (losses) of affiliates (4) (23) (12) 37 72 Gains on sale of investments 46 261 109 731 0 Non-operating special charges 0 (49) (61) 0 0 Airline stabilization grant 80 652 0 0 0 Miscellaneous, net (17) (86) (35) 2 (103) (130) 414 (223) 551 (222)Earnings (loss) before income taxes, distributions on preferred securities, extraordinary item and cumulative effect (1,326) (3,357) 431 1,942 1,256Provision for income taxes (479) (1,226) 160 699 429Earnings (loss) before distributions on preferred securities, extraordinary item and cumulative effect (847) (2,131) 271 1,243 827Distributions on preferred securities, net of tax (3) (6) (6) (5) (6)Earnings (loss) before extraordinary item and cumulative effect (850) (2,137) 265 1,238 821Extraordinary loss on early extinguishment of debt, net of tax 0 0 (6) (3) 0Cumulative effect of accounting change, net of tax 0 (8) (209) 0 0Net earnings (850) (2,145) 50 1,235 821
27

EXHIBIT 2 DELTA AIR LINES
Consolidated Statements of Income For the six months ended June 30, 2002 and
for the years ended December 31, 2001, 2000, 1999 and 1998 (In millions of US $) 2002
(6 months)2001 2000 1999 1998
Operating Revenues Passenger 6,095 12,964 15,657 13,949 13,428 Cargo 220 506 583 561 569 Other, net 262 409 501 373 315 Total operating revenues 6,577 13,879 16,741 14,883 14,312Operating Expenses Salaries and related costs 3,064 6,124 5,971 5,194 4,894 Aircraft fuel 740 1,817 1,969 1,421 1,379 Depreciation and amortization 572 1,283 1,187 1,057 902 Other selling expenses 285 616 688 626 632 Passenger commissions 196 540 661 784 939 Contracted services 504 1,016 966 824 729 Landing fees and other rents 414 780 771 723 670 Aircraft rent 357 737 741 622 569 Aircraft maintenance materials and outside repairs 366 801 723 594 526 Passenger service 192 466 470 498 491 Asset writedowns and other special charges 63 1,119 108 469 0 Stabilization Act compensation 0 (634) 0 0 0 Other 386 816 849 753 778 Total operating expenses 7,139 15,481 15,104 13,565 12,509Operating Income (Loss) (562) (1,602) 1,637 1,318 1,803Other Income (Expense) Interest expense, net (296) (410) (257) (126) (66) Net gain from sale of investments (3) 127 301 927 Miscellaneous income (expense), net 15 (47) 27 (26) 39 Fair value adjustments of SFAS 133 derivatives (43) 68 (159) Total other income (expense) (327) (262) (88) 775 (27)Income (Loss) Before Income Taxes and Cumulative Effect of Change in Accounting Principles (889) (1,864) 1,549 2,093 1,776Income tax benefit (provision) 306 648 (621) (831) (698)Net Income (Loss) Before Cumulative Effect of Changes in Accounting Principles, Net of tax (583) (1,216) 928 1,262 1,078Cumulative Effect of Changes in Accounting Principles 0 0 (100) (54) Net Income (Loss) (583) (1,216) 828 1,208 1,078Preferred Stock Dividends (7) (14) (13) (12) (11)Net Income (Loss) Available to Common Shareowners (590) (1,230) 815 1,196 1,067
28

EXHIBIT 3 SOUTHWEST AIRLINES
Consolidated Statements of Income For the six months ended June 30, 2002 and
for the years ended December 31, 2001, 2000, 1999 and 1998 (In millions of US $) 2002
(6 months)2001 2000 1999 1998
Operating Revenues Passenger 2,640 5,379 5,468 4,563 4,010 Freight 43 91 111 103 99 Other 47 85 71 70 55 Total operating revenues 2,730 5,555 5,650 4,736 4,164Operating Expenses Salaries, wages, and benefits 963 1,856 1,684 1,455 1,286 Fuel and oil 359 771 805 492 388 Maintenance materials and repairs 198 397 378 368 302 Agency commissions 29 103 160 156 158 Aircraft rentals 94 192 196 200 202 Landing fees and other rentals 171 311 265 242 215 Depreciation 171 318 281 249 225 Other operating expenses 507 976 860 792 704 Total operating expenses 2,492 4,924 4,629 3,954 3,480Operating Income 238 631 1,021 782 684Other Expenses (Income) Interest expense 53 70 70 54 56 Capitalized interest (9) (21) (28) (31) (26) Interest income (19) (43) (40) (25) (31) Other (gains) losses, net 9 (203) 2 10 (21) Total other expenses (income) 34 (197) 4 8 (22)Income Before Income Taxes and Cumulative Effect of Change in Accounting Principle 204 828 1,017 774 706Provision for income taxes 81 317 392 300 271Income before Cumulative Effect of Changes in Accounting Principles 123 511 625 474 435Cumulative Effect of Changes in Accounting Principles, Net of income tax 0 0 (22) 0 0Net Income 123 511 603 474 435
29

APPENDIX 1 DISCUSSION OF STATEMENTS OF INTERMEDIATE BALANCES
When an income statement is presented “by nature,” it is often useful to adjust the
statement to highlight the key intermediate balances that determine the value creation process
of the enterprise. In preparing a Statement of Intermediate Balances the following balances
can be shown: “commercial margin,” “value added,” “gross operating income,” “EBITDA,”
and so forth. Figure 1 demonstrates the structure of a Statement of Intermediate Balances.
*** Insert Figure 1 here ***
Essentially, the SIB dissects the income statement into meaningful blocks of data to
help in the user understand and interpret the firm’s economic activity. The intermediate
balances can be presented in monetary terms, or as percentage variations from one period to
the next (trend analysis), or as percentages of some relevant basis (common-size analysis).
The SIB can be particularly useful if a company has manufacturing operations along with
merchandising (i.e. wholesale or retail) activities.
Definition of Terms
Commercial Margin: The commercial margin expresses the difference between sales of
merchandise and cost of merchandise sold.
Current Period Production: The company’s industrial output during the period is the
total of production sold plus the cost of self-produced fixed assets.
Value Added: The term “value added” is a concept used in National Income accounting.
It refers to the amount contributed by a particular enterprise to the national wealth. Value
added is defined as the increase in value resulting from the enterprise’s activities over and
30

above that of goods and services provided by third parties and consumed by the firm. The
concept is used in a number of countries, especially Australia, France, Germany, South Africa
and the United Kingdom. Value added represents the wealth created by the enterprise that
will be distributed to various stakeholders including employees, lenders, governments and
shareholders.
EBITDA or Gross Operating Income: The EBITDA (Earnings from Operations
Before Interest, Taxes, Depreciation and Amortization) or Gross Operating Income measures
the wealth created by the enterprise from its operations, independently of its financial income
and expenses, and charges for depreciation and amortization. This indicator helps in
evaluating the firm’s short-term ability to create wealth since it is not affected by long-term
strategic decisions regarding financing (i.e. capital structure) and capital investment policies.
The ratio of EBITDA to sales (or accounting “production”) is often considered to be a
measure of the “business profitability” of the firm, allowing inter-company comparisons.
EBITDA is also be considered as a measure of the cash flow generated by operations.
Operating Profit: Operating profit represents the result of the firm’s normal and
current activity without taking into account financial and unusual elements.
Net Operating Income Before Income Taxes: Operating net income before taxes
indicates economic and financial performance before consideration of unusual items and
taxes.
Unusual Income (Loss): Unusual income (loss) is the profit or loss from activities
that are not related to the firm’s usual operations, and are, therefore, out of the ordinary, or
exceptional. This “income” is shown as a separate item on the Statement of Intermediate
Balances.
Net Income (Loss): The last line of the Statement of Intermediate Balances is the Net
Income (Loss), which is self-explanatory. This figure serves as a check on the equality
31

between the adjusted SIB and the original income statement. An income statement prepared
“by nature” can be presented in a common-size format, even without the adjusting it to reflect
the intermediate balances, but the usefulness of such a presentation is reduced because the
metrics identified may not be comparable between two different enterprises.
32

FIGURE 1
STRUCTURE OF THE STATEMENT OF INTERMEDIATE BALANCES
- Income taxes - Cumulative effect of changes in accounting principles - Preferred stock dividends - Others = Net income/loss after tax available to common shareholders
± Gain/loss from sale of fixedassets - Asset writedowns - Other unusual expenses = Unusual income/loss
+ Financial income - Financial expense = Operating net income/loss before taxes
- Depreciation and amortization expense + Other operating revenues (not included in sales) - Other operating expenses (not included above) = Operating profit/loss
+ Operating subsidies - Taxes and similar expenses (excluding income taxes) - Wages and salaries - Social security and other welfare allowances = EBITDA or Gross operating profit/loss
Consumption of goods andservices from third parties
- Cost of raw materials and other supplies consumed - Other purchases and external expenses - Other operating expenses = Value added
+ Sale of goods and/or services produced by thebusiness + Production capitalized (tangible and intangibleassets constructed for the firm itself) = Total “production” for the period
+ Sale of merchandise (goods purchased forresale) - Cost of merchandise sold = Commercial margin (margin on sale ofmerchandise)
33

EXHIBIT 4.1 Template for the Preparation of a Statement of Intermediate Balances for United
Airlines Part 1 (in $ millions)
2002
(6 months)2001 2000 1999 1998
Passenger Cargo Other operating revenues Total production for the period Aircraft fuel Commissions Purchased services Aircraft rent Landing fees and other rents Aircraft maintenance Cost of sales Other operating expenses Consumption from third parties Value added Salaries and related costs Gross operating income Depreciation and amortization Earnings (loss) from operations Interest expense Interest capitalized Interest income Equity in earnings (losses) of affiliates Miscellaneous, net Operating net income before taxes Special charges Gains on sale of investments Non-operating special charges Airline stabilization grant Unsual income Provision for income taxes Distributions on preferred securities, net of tax Cumulative effect of accounting change, net of tax Extraordinary loss on early extinguishment of debt, net of tax Net earnings (850) (2,145) 50 1,235 821
34

EXHIBIT 4.2 Template for the Preparation of a Statement of Intermediate Balances for United
Airlines Part 2 (in percentage terms)
2002
(6 months)2001 2000 1999 1998
Passenger Cargo Other operating revenues Total production for the period 100.0% 100.0% 100.0% 100.0% 100.0%Change in production - Change in Passenger revenues - Change in Cargo revenues - Aircraft fuel Commissions Purchased services Aircraft rent Landing fees and other rents Aircraft maintenance Cost of sales Other operating expenses Consumption from third parties Value added Salaries and related costs Gross operating income Depreciation and amortization Earnings (loss) from operations Interest expense Interest capitalized Interest income Equity in earnings (losses) of affiliates Miscellaneous, net Operating net income before taxes Special charges Gains on sale of investments Non-operating special charges Airline stabilization grant Unsual income Provision for income taxes Distributions on preferred securities, net of tax Cumulative effect of accounting change, net of tax Extraordinary loss on early extinguishment of debt, net of tax Net earnings (12.0%) (13.3%) 0.3% 6.9% 4.7%* These three lines are obtained by calculating the change from one year to the next. All the other lines are obtained by dividing the line concerned by the Total Production for the Period.
35

EXHIBIT 5
CHOICES REGARDING THE PRESENTATION OF INCOME STATEMENTS
Multiple step
Vertical Horizontal
Format Degree of
simplification
Single step
By function (by type of operation)
By nature (by type of
expenditure)
Classification of
expenses
Presentation of the income statement
36

EXHIBIT 6
FUNCTION OF EXPENSE VERSUS NATURE OF EXPENSE PRESENTATIONS
Income statement by function
(Vertical presentation)
Income statement by nature
(Vertical presentation)
Net sales revenue Net sales
- Cost of goods sold (cost of sales) + Other operating revenues
= Gross margin - Cost of merchandise and raw materials sold and
consumed
- Commercial and distribution expenses - Labor and Personnel expenses
- Administrative expenses - Other operating expenses
- Other operating expenses - Depreciation expense
= Operating income = Operating income
37

EXHIBIT 7.1 UNITED AIRLINES
STATEMENT OF INTERMEDIATE BALANCES (IN $MILLIONS)
2002
(6 months)2001 2000 1999 1998
Passenger 5,948 13,788 16,932 15,784 15,520 Cargo 309 704 931 906 913 Other operating revenues 824 1,646 1,489 1,337 1,128Total production for the period 7,081 16,138 19,352 18,027 17,561 Aircraft fuel (865) (2,476) (2,511) (1,776) (1,788) Commissions (225) (710) (1,025) (1,139) (1,325) Purchased services (695) (1,650) (1,711) (1,575) (1,505) Aircraft rent (419) (827) (888) (876) (893) Landing fees and other rents (501) (1,009) (959) (949) (881) Aircraft maintenance (296) (701) (698) (689) (624) Cost of sales (585) (1,280) (1,061) (602) (474) Other operating expenses (743) (1,722) (1,841) (1,737) (1,630)Consumption from third parties (4,329) (10,375) (10,694) (9,343) (9,120)Value added 2,752 5,763 8,658 8,684 8,441 Salaries and related costs (3,378) (7,080) (6,877) (6,426) (6,170)Gross operating income (626) (1,317) 1,781 2,258 2,271 Depreciation and amortization (488) (1,026) (988) (850) (793)Earnings (loss) from operations (1,114) (2,343) 793 1,408 1,478 Interest expense (288) (525) (402) (362) (355) Interest capitalized 17 79 77 75 105 Interest income 36 105 101 68 59 Equity in earnings (losses) of affiliates (4) (23) (12) 37 72 Miscellaneous, net (17) (86) (35) 2 (103)Operating net income before taxes (1,370) (2,793) 522 1,228 1,256 Special charges (82) (1,428) (139) (17) 0 Gains on sale of investments 46 261 109 731 0 Non-operating special charges 0 (49) (61) 0 0 Airline stabilization grant 80 652 0 0 0Unusual income 44 (564) (91) 714 0Provision for income taxes 479 1,226 (160) (699) (429)Distributions on preferred securities, net of tax (3) (6) (6) (5) (6)Cumulative effect of accounting change, net of tax 0 (8) (209) 0 0Extraordinary loss on early extinguishment of debt, net of tax 0 0 (6) (3) 0Net earnings (850) (2,145) 50 1,235 821
38

EXHIBIT 7.2 UNITED AIRLINES
STATEMENT OF INTERMEDIATE BALANCES (IN PERCENTAGE TERMS)
2002
(6 months)2001 2000 1999 1998
Passenger 84.0% 85.4% 87.5% 87.6% 88.4% Cargo 4.4% 4.4% 4.8% 5.0% 5.2% Other operating revenues 11.6% 10.2% 7.7% 7.4% 6.4%Total production for the period 100.0% 100.0% 100.0% 100.0% 100.0%Change in production* (22.0%) (16.6%) 7.4% 2.7% - Change in Passenger revenues* (24.1%) (18.6%) 7.3% 1.7% - Change in Cargo revenues* (20.6%) (24.4%) 2.8% (0.8%) - Aircraft fuel (12.2%) (15.3%) (13.0%) (9.9%) (10.2%) Commissions (3.2%) (4.4%) (5.3%) (6.3%) (7.5%) Purchased services (9.8%) (10.2%) (8.8%) (8.7%) (8.6%) Aircraft rent (5.9%) (5.1%) (4.6%) (4.9%) (5.1%) Landing fees and other rents (7.1%) (6.3%) (5.0%) (5.3%) (5.0%) Aircraft maintenance (4.2%) (4.3%) (3.6%) (3.8%) (3.6%) Cost of sales (8.3%) (7.9%) (5.5%) (3.3%) (2.7%) Other operating expenses (10.5%) (10.7%) (9.5%) (9.6%) (9.3%)Consumption from third parties (61.1%) (64.3%) (55.3%) (51.8%) (51.9%)Value added 38.9% 35.7% 44.7% 48.2% 48.1% Salaries and related costs (47.7%) (43.9%) (35.5%) (35.6%) (35.1%)Gross operating income (8.8%) (8.2%) 9.2% 12.5% 12.9% Depreciation and amortization (6.9%) (6.4%) (5.1%) (4.7%) (4.5%)Earnings (loss) from operations (15.7%) (14.5%) 4.1% 7.8% 8.4% Interest expense (4.1%) (3.3%) (2.1%) (2.0%) (2.0%) Interest capitalized 0.2% 0.5% 0.4% 0.4% 0.6% Interest income 0.5% 0.7% 0.5% 0.4% 0.3% Equity in earnings (losses) of affiliates (0.1%) (0.1%) (0.1%) 0.2% 0.4% Miscellaneous, net (0.2%) (0.5%) (0.2%) 0.0% (0.6%)Operating net income before taxes (19.3%) (17.3%) 2.7% 6.8% 7.2% Special charges (1.2%) (8.8%) (0.7%) (0.1%) 0.0% Gains on sale of investments 0.6% 1.6% 0.6% 4.1% 0.0% Non-operating special charges 0.0% (0.3%) (0.3%) 0.0% 0.0% Airline stabilization grant 1.1% 4.0% 0.0% 0.0% 0.0%Unusual income 0.6% (3.5%) (0.5%) 4.0% 0.0%Provision for income taxes 6.8% 7.6% (0.8%) (3.9%) (2.4%)Distributions on preferred securities, net of tax (0.0%) (0.0%) (0.0%) (0.0%) (0.0%)Cumulative effect of accounting change, net of tax 0.0% (0.0%) (1.1%) 0.0% 0.0%Extraordinary loss on early extinguishment of debt, net of tax 0.0% 0.0% (0.0%) (0.0%) 0.0%Net earnings (12.0%) (13.3%) 0.3% 6.9% 4.7%* The figures for the increases in 2002 are with reference to the first six months of 2001.
39
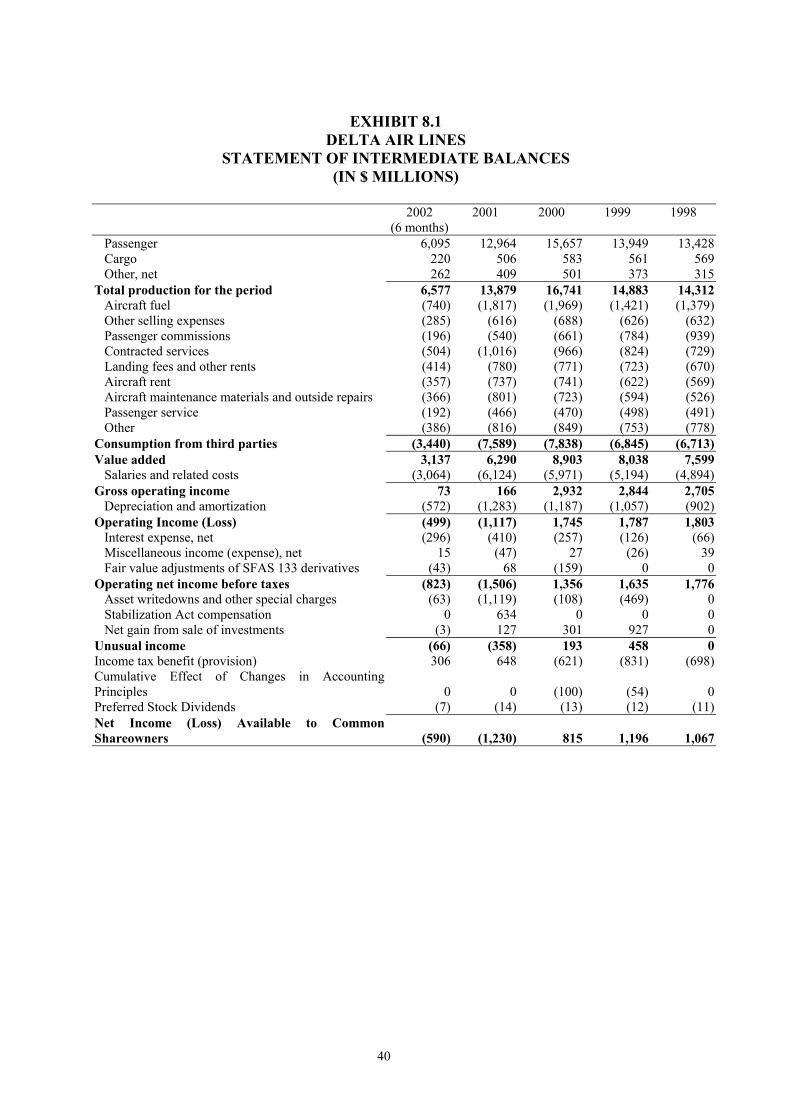
EXHIBIT 8.1
DELTA AIR LINES STATEMENT OF INTERMEDIATE BALANCES
(IN $ MILLIONS) 2002
(6 months)2001 2000 1999 1998
Passenger 6,095 12,964 15,657 13,949 13,428 Cargo 220 506 583 561 569 Other, net 262 409 501 373 315Total production for the period 6,577 13,879 16,741 14,883 14,312 Aircraft fuel (740) (1,817) (1,969) (1,421) (1,379) Other selling expenses (285) (616) (688) (626) (632) Passenger commissions (196) (540) (661) (784) (939) Contracted services (504) (1,016) (966) (824) (729) Landing fees and other rents (414) (780) (771) (723) (670) Aircraft rent (357) (737) (741) (622) (569) Aircraft maintenance materials and outside repairs (366) (801) (723) (594) (526) Passenger service (192) (466) (470) (498) (491) Other (386) (816) (849) (753) (778)Consumption from third parties (3,440) (7,589) (7,838) (6,845) (6,713)Value added 3,137 6,290 8,903 8,038 7,599 Salaries and related costs (3,064) (6,124) (5,971) (5,194) (4,894)Gross operating income 73 166 2,932 2,844 2,705 Depreciation and amortization (572) (1,283) (1,187) (1,057) (902)Operating Income (Loss) (499) (1,117) 1,745 1,787 1,803 Interest expense, net (296) (410) (257) (126) (66) Miscellaneous income (expense), net 15 (47) 27 (26) 39 Fair value adjustments of SFAS 133 derivatives (43) 68 (159) 0 0Operating net income before taxes (823) (1,506) 1,356 1,635 1,776 Asset writedowns and other special charges (63) (1,119) (108) (469) 0 Stabilization Act compensation 0 634 0 0 0 Net gain from sale of investments (3) 127 301 927 0Unusual income (66) (358) 193 458 0Income tax benefit (provision) 306 648 (621) (831) (698)Cumulative Effect of Changes in Accounting Principles 0 0 (100) (54) 0Preferred Stock Dividends (7) (14) (13) (12) (11)Net Income (Loss) Available to Common Shareowners (590) (1,230) 815 1,196 1,067
40

EXHIBIT 8.2 DELTA AIR LINES
STATEMENT OF INTERMEDIATE BALANCES (IN PERCENTAGE TERMS)
2002
(6 months)2001 2000 1999 1998
Passenger 92.7% 93.4% 93.5% 93.7% 93.8% Cargo 3.3% 3.6% 3.5% 3.8% 4.0% Other, net 4.0% 2.9% 3.0% 2.5% 2.2%Total production for the period 100.0% 100.0% 100.0% 100.0% Change in Production (13.7%) (17.1%) 12.5% 4.0% - Change in Passenger revenues (14.6%) (17.2%) 12.2% 3.9% - Change in Cargo revenues 3.8% (13.2%) 3.9% (1.4%) - Aircraft fuel (11.3%) (13.1%) (11.8%) (9.5%) (9.6%) Other selling expenses (4.3%) (4.4%) (4.1%) (4.2%) (4.4%) Passenger commissions (3.0%) (3.9%) (3.9%) (5.3%) (6.6%) Contracted services (7.7%) (7.3%) (5.8%) (5.5%) (5.1%) Landing fees and other rents (6.3%) (5.6%) (4.6%) (4.9%) (4.7%) Aircraft rent (5.4%) (5.3%) (4.4%) (4.2%) (4.0%) Aircraft maintenance materials and outside repairs (5.6%) (5.8%) (4.3%) (4.0%) (3.7%) Passenger service (2.9%) (3.4%) (2.8%) (3.3%) (3.4%) Other (5.9%) (5.9%) (5.1%) (5.1%) (5.4%)Consumption from third parties (52.3%) (54.7%) (46.8%) (46.0%) (46.9%)Value added 47.7% 45.3% 53.2% 54.0% 53.1% Salaries and related costs (46.6%) (44.1%) (35.7%) (34.9%) (34.2%)Gross operating income 1.1% 1.2% 17.5% 19.1% 18.9% Depreciation and amortization (8.7%) (9.2%) (7.1%) (7.1%) (6.3%)Operating Income (Loss) (7.6%) (8.0%) 10.4% 12.0% 12.6% Interest expense, net (4.5%) (3.0%) (1.5%) (0.8%) (0.5%) Miscellaneous income (expense), net 0.2% (0.3%) 0.2% (0.2%) 0.3% Fair value adjustments of SFAS 133 derivatives (0.7%) 0.5% (0.9%) 0.0% 0.0%Operating net income before taxes (12.5%) (10.9%) 8.1% 11.0% 12.4% Asset writedowns and other special charges (1.0%) (8.1%) (0.6%) (3.2%) 0.0% Stabilization Act compensation 0.0% 4.6% 0.0% 0.0% 0.0% Net gain from sale of investments (0.0%) 0.9% 1.8% 6.2% 0.0%Unusual income (1.0%) (2.6%) 1.2% 3.1% 0.0%Income tax benefit (provision) 4.7% 4.7% (3.7%) (5.6%) (4.9%)Cumulative Effect of Changes in Accounting Principles 0.0% 0.0% (0.6%) (0.4%) 0.0%Preferred Stock Dividends (0.1%) (0.1%) (0.1%) (0.1%) (0.1%)Net Income (Loss) Available to Common Shareowners (9.0%) (8.9%) 4.9% 8.0% 7.5%
100.0%
41

EXHIBIT 9.1 SOUTHWEST AIRLINES
STATEMENT OF INTERMEDIATE BALANCES (IN $ MILLIONS)
2002
(6 months)2001 2000 1999 1998
Passenger 2,640 5,379 5,468 4,563 4,010 Freight 43 91 111 103 99 Other 47 85 71 70 55Total production for the period 2,730 5,555 5,650 4,736 4,164 Fuel and oil (359) (771) (805) (492) (388) Agency commissions (29) (103) (160) (156) (158) Landing fees and other rentals (171) (311) (265) (242) (215) Aircraft rentals (94) (192) (196) (200) (202) Maintenance materials and repairs (198) (397) (378) (368) (302) Other operating expenses (507) (976) (860) (792) (704)Consumption from third parties (1,358) (2,750) (2,664) (2,250) (1,969)Value added 1,372 2,805 2,986 2,486 2,195 Salaries, wages, and benefits (963) (1,856) (1,684) (1,455) (1,286)Gross operating income 409 949 1,302 1,031 909 Depreciation (171) (318) (281) (249) (225)Operating Income 238 631 1,021 782 684 Interest expense (53) (70) (70) (54) (56) Capitalized interest 9 21 28 31 26 Interest income 19 43 40 25 31Operating net income before taxes 213 625 1,019 784 685 Other (gains) losses, net (9) 203 (2) (10) 21Unusual income (9) 203 (2) (10) 21Provision for income taxes 81 317 392 300 271Cumulative Effect of Changes in Accounting Principles, Net of income tax 0 0 (22) 0 0Preferred Stock Dividends 0 0 0 0 0Net Income (Loss) Available to Common Shareowners 123 511 603 474 435
42

43
EXHIBIT 9.2 SOUTHWEST AIRLINES
STATEMENT OF INTERMEDIATE BALANCES (IN PERCENTAGE TERMS)
2002
(6 months)2001 2000 1999 1998
Passenger 96.7% 96.8% 96.8% 96.3% 96.3% Freight 1.6% 1.6% 2.0% 2.2% 2.4% Other 1.7% 1.5% 1.3% 1.5% 1.3%Total production for the period 100.0% 100.0% 100.0% 100.0% 100.0%Change in Production (8.5%) (1.7%) 19.3% 13.7% - Change in Passenger revenues (8.6%) (1.6%) 19.8% 13.8% - Change in Cargo revenues (4.4%) (18.0%) 7.8% 4.0% - Fuel and oil (13.2%) (13.9%) (14.2%) (10.4%) (9.3%) Agency commissions (1.1%) (1.9%) (2.8%) (3.3%) (3.8%) Landing fees and other rentals (6.3%) (5.6%) (4.7%) (5.1%) (5.2%) Aircraft rentals (3.4%) (3.5%) (3.5%) (4.2%) (4.9%) Maintenance materials and repairs (7.3%) (7.1%) (6.7%) (7.8%) (7.3%) Other operating expenses (18.6%) (17.6%) (15.2%) (16.7%) (16.9%)Consumption from third parties (49.7%) (49.5%) (47.2%) (47.5%) (47.3%)Value added 50.3% 50.5% 52.8% 52.5% 52.7% Salaries, wages, and benefits (35.3%) (33.4%) (29.8%) (30.7%) (30.9%)Gross operating income 15.0% 17.1% 23.0% 21.8% 21.8% Depreciation (6.3%) (5.7%) (5.0%) (5.3%) (5.4%)Operating Income 8.7% 11.4% 18.1% 16.5% 16.4% Interest expense (1.9%) (1.3%) (1.2%) (1.1%) (1.3%) Capitalized interest 0.3% 0.4% 0.5% 0.7% 0.6% Interest income 0.7% 0.8% 0.7% 0.5% 0.7%Operating net income before taxes 7.8% 11.3% 18.0% 16.6% 16.5% Other (gains) losses, net (0.3%) 3.7% (0.0%) (0.2%) 0.5%Unusual income (0.3%) 3.7% (0.0%) (0.2%) 0.5%Provision for income taxes 3.0% (5.7%) 6.9% 6.3% 6.5%Cumulative Effect of Changes in Accounting Principles, Net of income tax 0.0% 0.0% (0.4%) 0.0% 0.0%Preferred Stock Dividends 0.0% 0.0% 0.0% 0.0% 0.0%Net Income (Loss) Available to Common Shareowners 4.5% 9.2% 10.7% 10.0% 10.4%