Income Shares Source: WDI Database 2012 Kenya. Gini Index Source: WDI Database 2012.
25
Income Shares Source: WDI Database 2012 Kenya
-
Upload
daniella-stevens -
Category
Documents
-
view
251 -
download
2
Transcript of Income Shares Source: WDI Database 2012 Kenya. Gini Index Source: WDI Database 2012.

Income Shares
Source: WDI Database 2012
Kenya

Gini Index
Source: WDI Database 2012

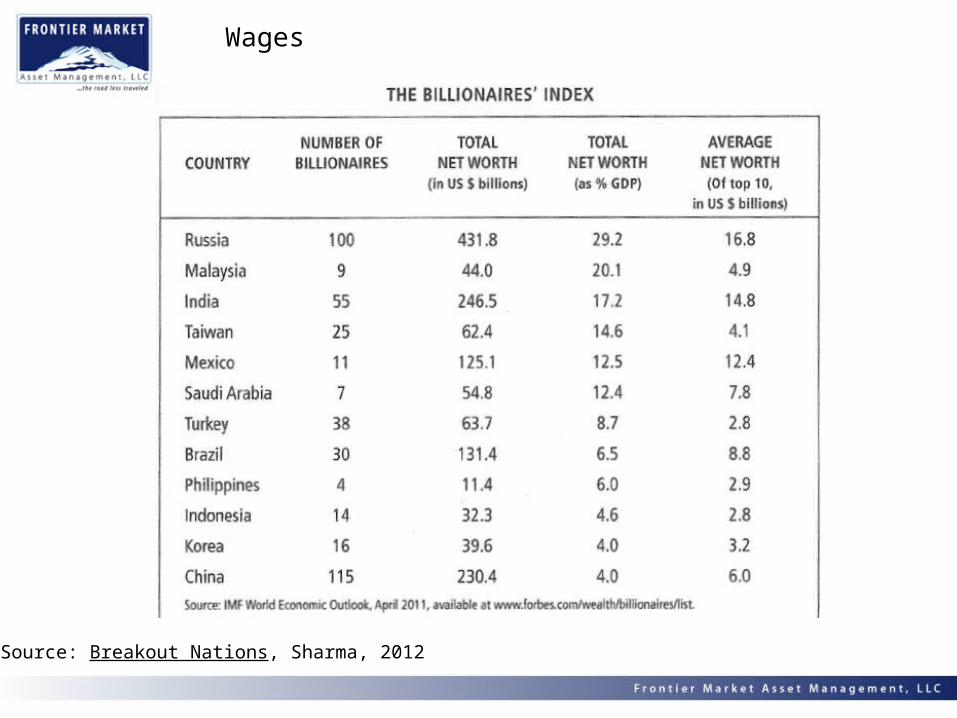
Wages
Source: Breakout Nations, Sharma, 2012

Human Capital
Source: BP Statistical Review of World Energy, Frontier Market Asset Management, 2009
Age 35-49 /20-34 2040/2010
Urban % chg 2000-2010
Literacy rate, adult female (% of females
ages 15 and above)
Population ages 65 and above (% of
total) GINI index Human CapitalEmerging Philippines 21% 7.9 95.83 3.70 42.98 68Frontier Bangladesh 42% 4.5 52.22 4.62 32.12 67Emerging Indonesia 22% 11.7 89.68 5.63 34.01 66Frontier Vietnam 32% 4.5 91.12 6.03 35.57 65Frontier Pakistan 30% 3.8 40.31 4.33 30.02 63Frontier Qatar 33% 0.9 95.40 1.07 41.10 62Frontier Zimbabwe 47% 4.5 89.89 4.22 50.10 62Frontier Kazakhstan -6% 2.2 99.60 6.68 29.04 62Frontier Costa Rica 37% 5.3 96.37 6.68 50.73 62Emerging South Korea 6% 2.3 99.00 11.53 31.00 59Frontier Mozambique 28% 7.7 42.85 3.32 45.66 59Frontier Botswana 30% 7.9 84.91 4.08 63.00 59Frontier Paraguay 27% 6.2 92.93 5.20 52.42 58Frontier Cote d'Ivoire 21% 6.6 46.61 3.84 41.50 56Frontier Namibia 24% 5.6 88.48 3.73 70.70 56Frontier Ghana 14% 7.5 61.22 3.88 42.76 54Emerging Brazil 35% 5.3 90.41 7.19 54.69 54Emerging India 24% 2.4 50.82 4.99 33.38 54Developed Australia -3% 1.9 99.00 13.69 30.50 54Emerging China 13% 9.1 91.33 8.37 42.48 53Frontier Malawi 7% 4.6 68.49 3.11 39.00 52Frontier Tanzania 6% 4.1 67.50 3.16 37.58 51Frontier Tunisia 26% 3.9 70.96 6.99 41.42 51Frontier Argentina 22% 2.3 97.83 10.68 44.49 51Emerging South Africa 23% 4.8 87.04 4.76 63.14 51Frontier Rwanda 12% 5.1 67.53 2.68 50.82 50Frontier Kenya 16% 2.5 84.18 2.66 47.68 49Frontier Senegal 15% 2.3 38.67 2.39 39.19 49Frontier Nigeria 8% 7.3 50.41 3.41 48.83 47Developed United States -6% 3.2 99.00 13.30 45.00 45Developed France -12% 2.0 99.00 17.07 32.70 45Frontier Uganda 10% 1.2 64.59 2.50 44.30 42Frontier Slovenia -5% (2.8) 99.66 16.72 28.40 42Frontier Mauritius 29% (0.1) 86.21 7.16 39.00 41Frontier Georgia 8% 0.2 99.67 14.33 41.34 41Developed Germany -18% 0.7 99.00 20.59 27.00 41Developed United Kingdom -8% 0.7 99.00 16.84 34.00 40Emerging Russia 3% (0.6) 99.47 12.76 40.11 38Developed Japan -7% 1.6 99.00 23.39 37.60 38Developed Italy -28% 1.2 98.68 20.58 32.00 34Developed Greece -10% 1.7 96.10 18.68 33.00 33Frontier Zambia 4% 0.9 61.75 3.05 54.63 32

2050 Hindsight
• Where are we… where were we?
• Growth Drivers
– Human Capital
• Demographics
• Education, Innovation, Wages
• Middle Class
– Investment
– Government
• Economic Freedom & Rule of Law
• Governability and Veto Points
– Culture
• Trust & Behavior
• 2050 Success and Failure

Capital Formation
Source: WDI Database 2012
0.0
10.0
20.0
30.0
40.0
50.0
60.0
1970
1980
1990
2000
2002
2004
2006
2008
2010
Gross capital formation (% of GDP)
China IndiaBrazil RussiaBangladesh
`

Investment
Source: McKinsey
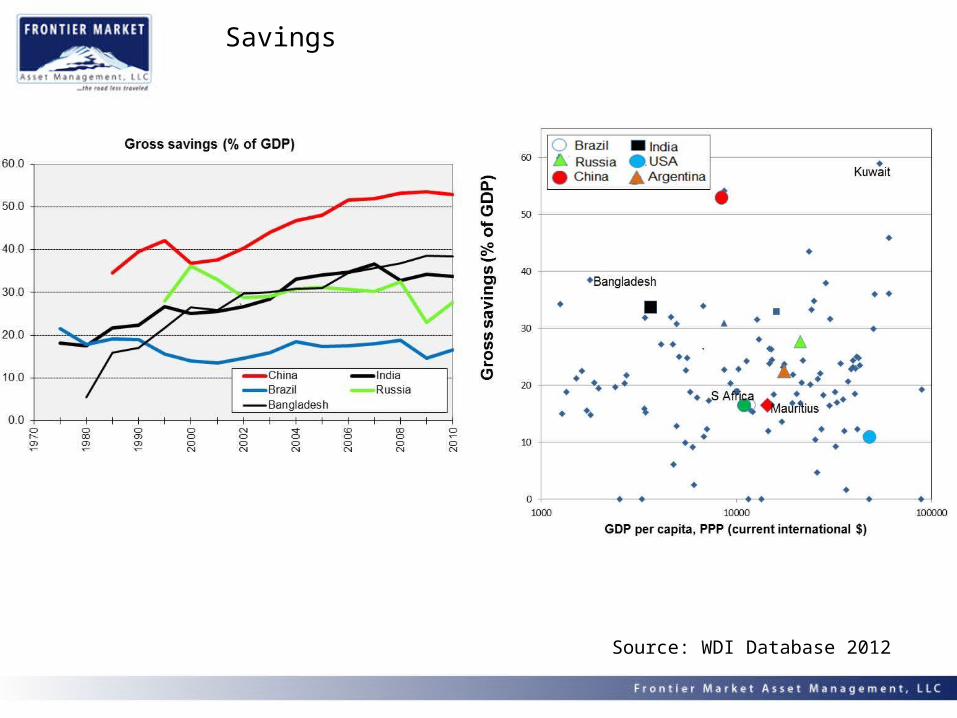
Savings
Source: WDI Database 2012

Electricity Losses
Source: WDI Database 2012

Gross capital formation (% of GDP)
Foreign direct investment, net inflows (% of GDP)
Gross savings (% of GDP)
Electric power transmission and distribution losses (% of output) Investment
Emerging China 48.45 3.12 52.93 6.10 93Frontier Mongolia 62.51 23.46 27.13 11.27 87Frontier Vietnam 35.01 7.52 31.86 10.11 86Emerging Thailand 26.63 3.04 30.89 6.34 82Developed Australia 26.68 2.70 24.30 6.06 78Frontier Bangladesh 25.15 0.91 38.45 2.08 76Frontier Kazakhstan 22.19 7.16 27.99 8.03 74Developed Hong Kong 23.38 31.66 29.89 12.71 74Emerging Chile 24.65 7.10 23.14 8.22 73Frontier Namibia 26.53 6.54 33.93 24.66 70Emerging Russia 25.00 2.93 27.65 10.13 69Frontier Saudi Arabia 19.12 4.96 33.24 8.91 66Developed Finland 20.88 2.97 20.67 3.43 65Frontier Uganda 24.64 4.80 18.77 65Frontier Romania 32.15 1.82 26.30 11.71 65Frontier Mauritius 25.44 4.43 16.49 63Emerging India 36.59 1.40 33.71 21.97 60Frontier Mozambique 24.34 8.23 10.85 9.02 58Developed Spain 21.54 1.75 18.82 3.73 57Frontier Zambia 24.96 6.43 22.46 23.76 57Frontier Georgia 25.62 7.00 9.88 10.89 57Frontier Zimbabwe 22.78 1.41 6.46 57Frontier Sri Lanka 29.94 0.97 24.76 13.81 57Frontier Bolivia 19.56 3.17 25.00 11.08 56Emerging Mexico 25.11 1.91 24.45 16.33 55Frontier Botswana 31.34 1.78 26.43 34.16 55Frontier Tanzania 36.67 1.89 21.18 21.37 54Developed Japan 19.87 -0.02 23.76 4.45 51Frontier Senegal 30.63 1.85 19.40 18.44 50Developed France 20.64 1.32 17.47 6.28 46Frontier Ghana 18.56 7.82 20.48 23.57 44Frontier Nigeria 2.99 17.22 43Frontier Venezuela 23.07 0.31 31.47 19.35 42Developed Italy 19.67 0.47 16.99 6.88 37Developed United States 14.91 1.62 10.91 5.99 36Emerging Brazil 19.73 2.32 16.53 16.63 34Emerging South Africa 19.73 0.34 16.45 9.53 32Frontier Malawi 15.51 2.77 12.83 29Frontier Pakistan 13.07 1.14 21.76 16.08 27Frontier Rwanda 21.37 0.75 14.97 27Frontier Kenya 21.18 0.58 15.56 15.73 27Developed Greece 16.11 0.14 4.63 6.59 25Frontier Cote d'Ivoire 16.43 1.83 14.73 23.11 20
Investment
Source: Frontier Market Asset Management, WDI Database, 2012

2050 Hindsight
• Where are we… where were we?
• Growth Drivers
– Human Capital
• Demographics
• Education, Innovation, Wages
• Middle Class
– Investment
– Government
• Economic Freedom & Rule of Law
• Governability and Veto Points
– Culture
• Trust & Behavior
• 2050 Success and Failure

Government
What is best?
Entrepreneurial
ChaosRules
Bureaucratic
Taiwan
Chile
Hong Kong
Singapore
Mexico
Greece
India
Russia
TurkeyChinaThailand
Czech Rep
Poland
Pakistan
IndonesiaPhilippines
Japan Italy
U.S.

Countries Do Change!
Entrepreneurial
ChaosRules
Bureaucratic
Taiwan
Chile
Hong Kong
Singapore
Mexico
Greece
India
Turkey
ChinaThailand
Czech Rep
Poland
Pakistan
IndonesiaPhilippines
Japan Italy
U.S. Russia
1990
2000
1970
1990
GovernmentGovernment

Heritage Economic Freedom
Source: WDI Database 2012

(Frontier Countries in Blue)Source: The Heritage Foundation, 2008
BUSINESS FREEDOM • Starting a business—procedures (number), time (days), cost (% of income per capita), minimum capital (% of income per capita)• Obtaining a license—procedures (number), time (days), cost (% of income per capita)• Closing a business—time (years), cost (% of estate), recovery rate (cents on the dollar)TRADE FREEDOM• The trade-weighted average tariff rate• Non-tariff barriers: quantity restrictions, price restrictions, regulatory restrictions, investment restrictions, customs restrictions, and direct government interventionFISCAL FREEDOM• The top tax rate on individual income and on corporate income• Total tax revenue as a percentage of GDPGOVERNMENT SIZE• Government spending % of GDPMONETARY FREEDOM• The weighted average inflation rate for the most recent three years• Price controlsINVESTMENT FREEDOM• Restrictions in sectors related to national security or real estate • Expropriation risk• Access to foreign exchange • Restrictions on transfers or capital transactions
Heritage Foundation – Economic Freedom Rank
http://www.heritage.org/index/Explore.aspx

(Frontier Countries in Blue)Source: The Heritage Foundation, 2008
FINANCIAL FREEDOM• Central Bank Independence• Freedom of credit allocation• Contract enforcement• Presence of private financial institutions• Foreign financial institutions not restrictedPROPERTY RIGHTS• Private property guaranteed by the government • There is no corruption or expropriation• The court system enforces contracts efficiently and quickly.• The justice system punishes those who unlawfully confiscate private propertyCORRUPTION• Transparency International’s Corruption Perceptions Index (CPI)LABOR FREEDOM• Ratio of minimum wage to the average value added per worker• Hindrance to hiring additional workers• Rigidity of hours• Difficulty of firing redundant employees• Legally mandated notice period
Heritage Foundation – Economic Freedom Rank
http://www.heritage.org/index/Explore.aspx
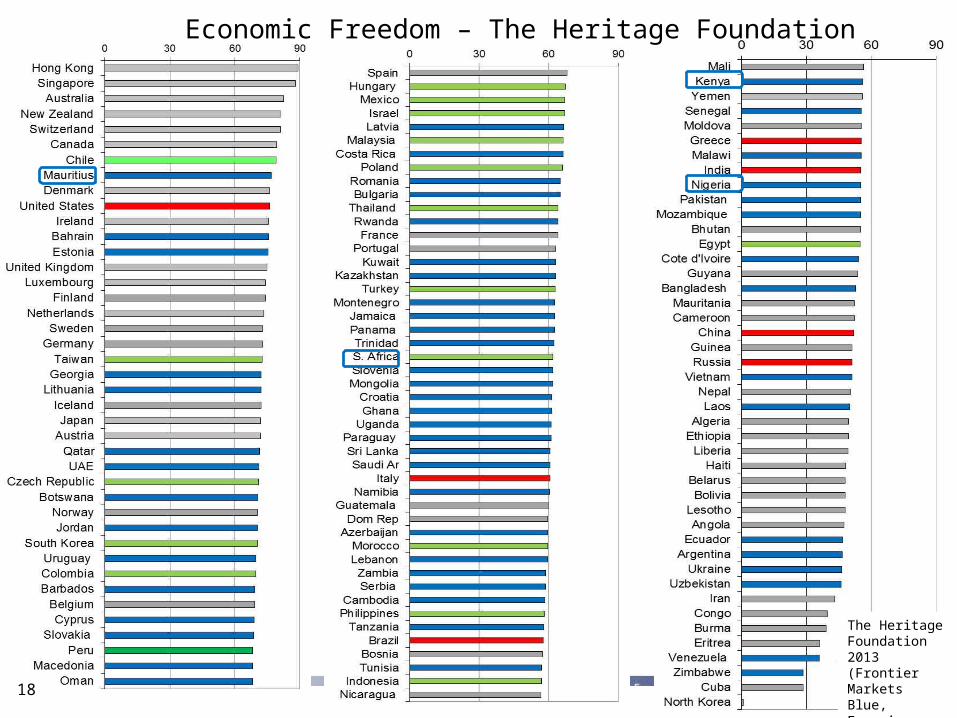
Economic Freedom – The Heritage Foundation
The Heritage Foundation 2013 (Frontier Markets Blue, Emerging Green)
18

Today’s World:
Argentina:26 days to start a business
Brazil:119 days to start a business
20072012

World Bank Rule of Law & Corruption
Source: WDI Database 2012

World Bank Governance – Change 2010 versus 2000
Source: WDI Database 2012
SA

Government % GDP
Source: WDI Database 2012

Heritage Economic Freedom
Rule of Law & Corruption
Current account balance (% of GDP)
General government final consumption expenditure (% of GDP) Government
Developed Singapore 88.0 189.6 23.74 10.68 105Developed Hong Kong 89.3 184.9 5.70 8.44 104Frontier United Arab Emirates 71.1 147.7 8.25 92Emerging Chile 79.0 180.2 1.79 12.50 90Developed Germany 72.8 184.4 5.73 19.73 82Developed Australia 82.6 192.9 -2.83 18.20 79Emerging Malaysia 66.1 124.0 11.48 12.73 78Developed United States 76.0 176.9 -3.23 17.29 73Frontier Mauritius 76.9 147.6 -8.22 13.91 68Frontier Botswana 70.6 149.6 0.31 20.94 65Emerging Mexico 67.0 84.5 -0.55 11.65 65Frontier Macedonia 68.2 140.6 -2.18 18.32 63Developed United Kingdom 74.8 184.0 -3.33 23.05 62Emerging Philippines 58.2 57.5 4.47 9.72 61Frontier Zambia 58.7 84.5 3.80 13.29 60Emerging Colombia 69.6 94.3 -3.07 16.19 58Frontier Cote d'Ivoire 54.1 31.0 7.25 8.64 56Frontier Ghana 61.3 116.5 -8.36 9.49 54Frontier Bangladesh 52.6 44.8 2.10 5.37 54Developed France 64.1 181.1 -1.74 24.83 54Emerging China 51.9 69.3 5.15 13.36 52Frontier Rwanda 64.1 116.6 -7.49 14.52 51Frontier Pakistan 55.1 36.3 -0.77 7.95 50Emerging India 55.2 87.7 -3.00 11.51 49Frontier Namibia 60.3 125.0 0.25 22.12 46Frontier Senegal 55.5 72.6 -6.77 8.70 46Frontier Vietnam 51.0 68.4 -4.03 6.53 45Frontier Venezuela 36.1 48.8 3.08 13.27 45Frontier Argentina 46.7 75.5 0.80 14.92 44Emerging South Africa 61.8 118.4 -2.78 21.48 44Frontier Uganda 61.1 63.1 -10.23 11.85 42Developed Italy 60.6 120.7 -3.49 21.06 41Emerging Brazil 57.7 118.4 -2.27 21.17 41Emerging Russia 51.1 45.1 4.75 19.45 39Developed Greece 55.4 122.6 -10.26 18.18 37Frontier Mozambique 55.0 75.5 -11.61 12.16 35Frontier Lebanon 59.5 49.5 -22.84 12.08 34Frontier Nigeria 55.1 19.8 1.22 31Frontier Tanzania 57.9 70.3 -8.63 18.18 31Frontier Kenya 55.9 34.9 -7.80 16.65 27Frontier Malawi 55.3 92.9 -11.90 20.16 25Frontier Ukraine 46.3 40.1 -2.19 20.11 25Frontier Swaziland 57.2 92.5 -10.50 26.79 21Frontier Uzbekistan 46.0 9.4 17.58 19Frontier Zimbabwe 28.6 6.2 19.07 15
Government
Source: Frontier Market Asset Management, WDI Database, 2013

Total Scores
Source: WDI Database 2013
Human Capital Investment Government Z-Score
Developed Singapore -0.19 1.13 1.64 2.58Frontier United Arab Emirates 1.39 0.14 0.99 2.51Developed Hong Kong -0.66 0.65 1.47 1.46Emerging China 0.39 1.15 -0.11 1.43Frontier Vietnam 0.57 0.84 -0.13 1.28Emerging Chile -0.09 0.33 1.00 1.24Frontier Bangladesh 0.32 0.65 0.06 1.04Developed Australia -0.10 0.29 0.72 0.92Frontier Mongolia 0.17 1.14 -0.54 0.76Frontier Kazakhstan 0.18 0.37 0.07 0.63Frontier Mauritius 0.03 -0.08 0.38 0.33Frontier Botswana 0.32 -0.24 0.20 0.28Developed Germany -0.52 0.00 0.67 0.14Emerging India -0.09 0.23 -0.14 0.00Frontier Namibia 0.13 0.04 -0.22 -0.05Developed Japan -0.56 -0.02 0.52 -0.06Frontier Ghana 0.13 -0.46 0.06 -0.28Developed United States -0.32 -0.48 0.51 -0.29Frontier Mozambique 0.04 0.03 -0.53 -0.46Developed France -0.36 -0.15 -0.06 -0.58Frontier Argentina 0.03 -0.19 -0.43 -0.59Frontier Venezuela 0.29 -0.24 -0.66 -0.61Developed United Kingdom -0.42 -0.46 0.24 -0.64Emerging South Africa 0.01 -0.37 -0.29 -0.66Emerging Brazil 0.22 -0.53 -0.36 -0.67Frontier Tanzania 0.00 -0.04 -0.66 -0.70Frontier Uganda -0.31 -0.02 -0.37 -0.70Emerging Russia -0.37 0.19 -0.54 -0.72Frontier Rwanda -0.11 -0.55 -0.08 -0.73Frontier Pakistan 0.04 -0.66 -0.13 -0.75Frontier Senegal -0.39 -0.18 -0.20 -0.77Frontier Georgia -0.33 -0.07 -0.37 -0.77Frontier Zambia -0.68 -0.27 0.09 -0.86Frontier Cote d'Ivoire -0.01 -0.94 0.06 -0.89Frontier Ukraine -0.05 -0.16 -0.95 -1.16Developed Italy -0.72 -0.26 -0.32 -1.29Frontier Kenya 0.02 -0.56 -0.77 -1.31Frontier Zimbabwe 0.49 0.05 -1.97 -1.43Frontier Nigeria -0.20 -0.51 -0.73 -1.44Frontier Malawi 0.03 -0.75 -0.83 -1.55Developed Greece -0.46 -0.69 -0.54 -1.68Frontier Moldova -0.14 -0.66 -0.94 -1.74Frontier Swaziland 0.12 -1.27 -1.04 -2.19

2050
Source: Frontier Market Asset Management, WDI Database, 2012


![Wdi Generic Network Flyer Rev 1[1]](https://static.fdocuments.in/doc/165x107/5592bbf21a28ab3b658b4766/wdi-generic-network-flyer-rev-11.jpg)