Income opportunities with SPX options - Interactive Brokers · committing capital to any options...
22
Income opportunities with SPX options April 2016 Gareth Ryan Founder & Managing Director 1
Transcript of Income opportunities with SPX options - Interactive Brokers · committing capital to any options...

Income opportunities with SPX options April 2016
Gareth Ryan Founder & Managing Director
1
Risk Disclosure Options are leveraged products that involve risk and are not suitable for all investors. Before committing capital to any options strategies, read the “Characteristics & Risks of Standardized Options” provided by the Options Industry Council. For a copy call 312-542-6901.
A copy is also available at: http://www.optionsclearing.com/publications/risks/riskstoc.pdf
IUR Capital is an investment advisor firm registered with the Securities & Exchange Commission and authorized and regulated by the UK Financial Conduct Authority. We do not hold any client funds. Client accounts are held at a FINRA regulated broker-dealer and clearing firm. Neither the presenter (Gareth Ryan) or IUR Capital is a FINRA registered representative. IUR Capital is not affiliated with Interactive Brokers LLC, or any other FINRA broker-dealer.
Interactive Brokers does not endorse or recommend IUR Capital. Interactive Brokers provides execution and clearing services to customers of IUR Capital. For more information regarding Interactive Brokers, please visit www.interactivebrokers.com.
None of the content discussed in this presentation carry an offer or solicitation of an offer to buy or sell any security or operate any specific strategy. Any securities included in this presentation are for illustrative purposes only and are not intended as recommendations. Execution fees for US options contracts with Interactive Brokers are $0.70c per contract for non-directed orders and $1.00 per contract for directed orders. Where multi-leg strategies (including spreads) are discussed, the execution fee is per leg and therefore multiple commissions will apply.
The information provided in this presentation is believed to be accurate, but the accuracy and completeness of the information is not guaranteed. Investors should not rely on any information for the maintenance of books and records or for tax, accounting, financial, or regulatory reporting. Past performance is not indicative of future results. 2

Host Profile (Gareth Ryan) • Began his trading career at 19 years old in London • Proprietary Spot FX Trader – EUR/USD, GBP/USD • Went to work for a Wall Street Broker in Equities &
Options • Founded IUR in 2007 – registered with the Securities
& Exchange Commission as an investment advisor firm and regulated by the UK Financial Conduct Authority.
• IUR Capital is an investment advisor for its clients on the Interactive Brokers TWS Advisor Platform.
• Specialising in options strategies for client portfolios • Regular guest on Bloomberg/FOX TV
3
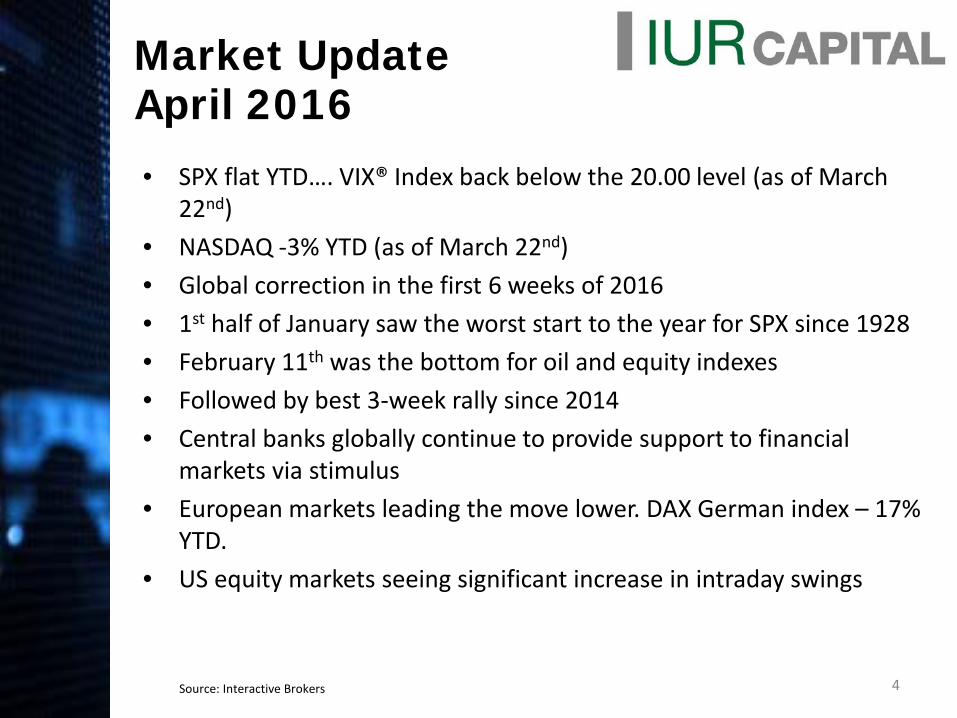
Market Update April 2016 • SPX flat YTD…. VIX® Index back below the 20.00 level (as of March
22nd) • NASDAQ -3% YTD (as of March 22nd) • Global correction in the first 6 weeks of 2016 • 1st half of January saw the worst start to the year for SPX since 1928 • February 11th was the bottom for oil and equity indexes • Followed by best 3-week rally since 2014 • Central banks globally continue to provide support to financial
markets via stimulus • European markets leading the move lower. DAX German index – 17%
YTD. • US equity markets seeing significant increase in intraday swings
Source: Interactive Brokers 4

SPX 2 YEAR CHART 4% MINI-CORRECTION
6% MINI-CORRECTION
S&P 500 INDEX 2 YEAR CHART
Source: Interactive Brokers
S&P 500 Index 1 year
August Correction
Source: Interactive Brokers
August correction
Source: Interactive Brokers 5
S&P 500 Index 1 Year
Source: Interactive Brokers
US Oil Fund ETF vs SPX 1 year
Source: Interactive Brokers

SPX 2 YEAR CHART 4% MINI-CORRECTION
6% MINI-CORRECTION
S&P 500 INDEX 1 MONTH CHART
IWM (Russell 2000 Index) 1 Year
Source: Interactive Brokers
IWM ETF 1 year
August Correction
Source: Interactive Brokers
(Russell 2000 Index ETF) 1 year
August correction
Week 1 Jan 2016 1 year range: 18% (peak to trough)
Source: Interactive Brokers 6
Russell 2000 Index ETF 1 Year
Source: Interactive Brokers
Russell 2000 index ETF vs SPX 1 year
Source: Interactive Brokers
CBOE VIX 2 YEAR CHART
EVERY SPIKE IN VIX DURING 2014 HAS BEEN AGGRESSIVELY SOLD INTO. THE BIGGER THE SPIKE, THE BIGGER THE CORRECTION TRANSLATES INVERSELY TO BULLISH SENTIMENT ON SPX
CBOE VIX INDEX 2 YEAR CHART
FXE (Euro Trust ETF) 1 Year
Source: Interactive Brokers
Aggressively bearish on euro? Buy OTM puts Modestly bearish on euro? Sell OTM calls/call spreads Both of these strategies will benefit from continued euro weakness
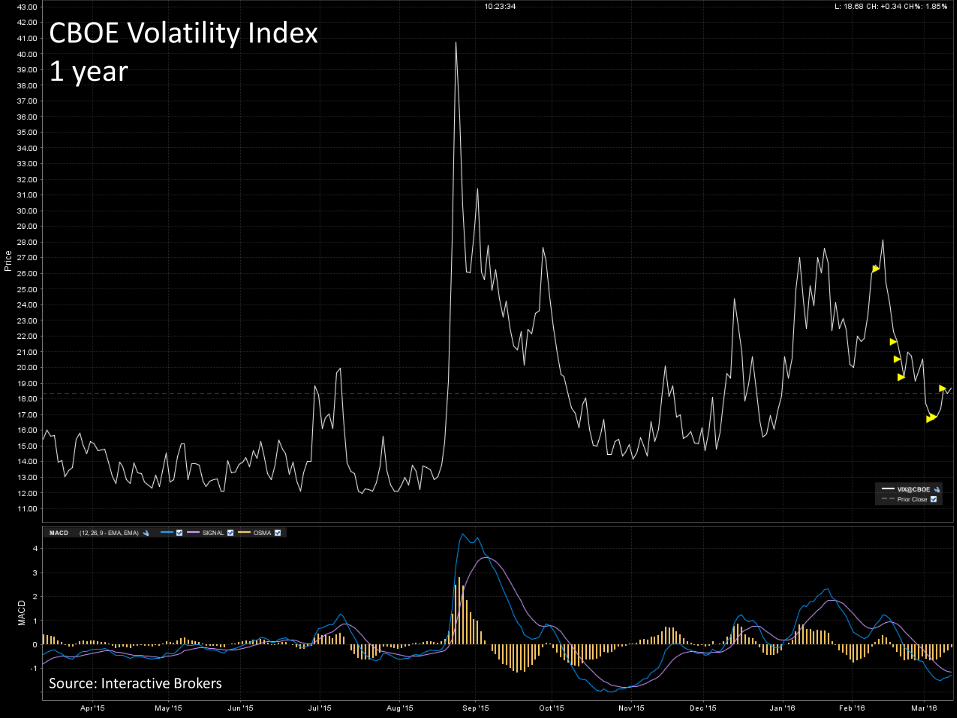
CBOE Volatility Index 1 year
VIX gained 3x on global sell-off
Source: Interactive Brokers
CBOE Volatility Index (VIX)1 year
VIX almost tripled during August correction
Source: Interactive Brokers 7
CBOE VOLATILITY INDEX 1 YEAR
Source: Interactive Brokers
CBOE Volatility Index 1 year
Source: Interactive Brokers

Scenario 1: $500k portfolio
• You are in the 40-60 age range, married with 0 / 1 dependent
• You are looking to supplement income from employment through your current portfolio
• Currently invested in bonds, mutual fund, dividend-paying stocks
• You need to generate consistent income in the portfolio BUT with a focus on capital preservation
• You are willing to allocate 15-20% of the overall portfolio to a conservative option strategy to generate regular premium
• You want to achieve regular premium even if the market remains flat to negative. 8
Scenario 2: $100k retirement account
• You are nearing retirement or already retired, with no dependents
• Your income has dropped, but you are wary that you will still have living costs for you and your spouse
• Mostly invested in bonds with a small element of stocks, but your interest/dividend income is not sufficient for regular drawdowns
• Preserving your capital in your retirement accounts is a priority
• But you are willing to look at an income strategy using options that does not require a rising market
• You want to achieve regular premium even if the market remains flat to negative. 9
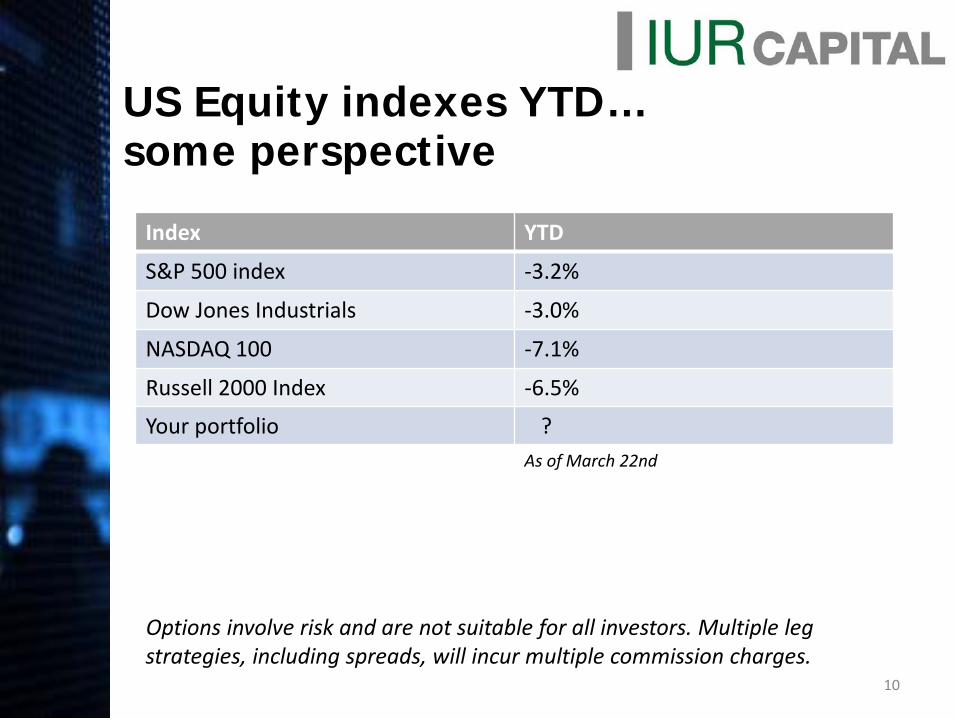
US Equity indexes YTD… some perspective
Options involve risk and are not suitable for all investors. Multiple leg strategies, including spreads, will incur multiple commission charges.
10
Index YTD
S&P 500 index -3.2%
Dow Jones Industrials -3.0%
NASDAQ 100 -7.1%
Russell 2000 Index -6.5%
Your portfolio ? As of March 22nd
Potential income-seeking strategies with SPX options
• Credit Spread (Bull put spread / Bear call spread) • Iron Condor
11
Multiple leg strategies, including spreads, will incur multiple commission charges.
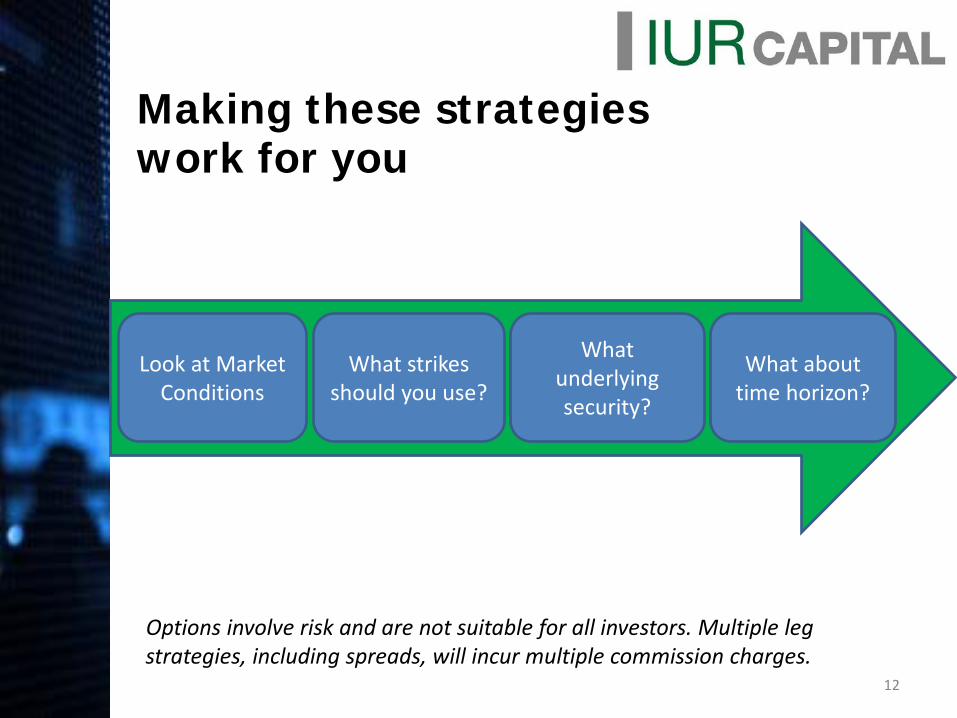
Making these strategies work for you
Options involve risk and are not suitable for all investors. Multiple leg strategies, including spreads, will incur multiple commission charges.
Look at Market Conditions
What strikes should you use?
What underlying security?
What about time horizon?
12

SPX Options Highlights
13
• The S&P 500 index covers many different sectors and industries and can be used as an overall barometer for the US equity
• SPX options provide direct exposure to the index • Daily volumes on SPX options are the largest across any
US index option contract
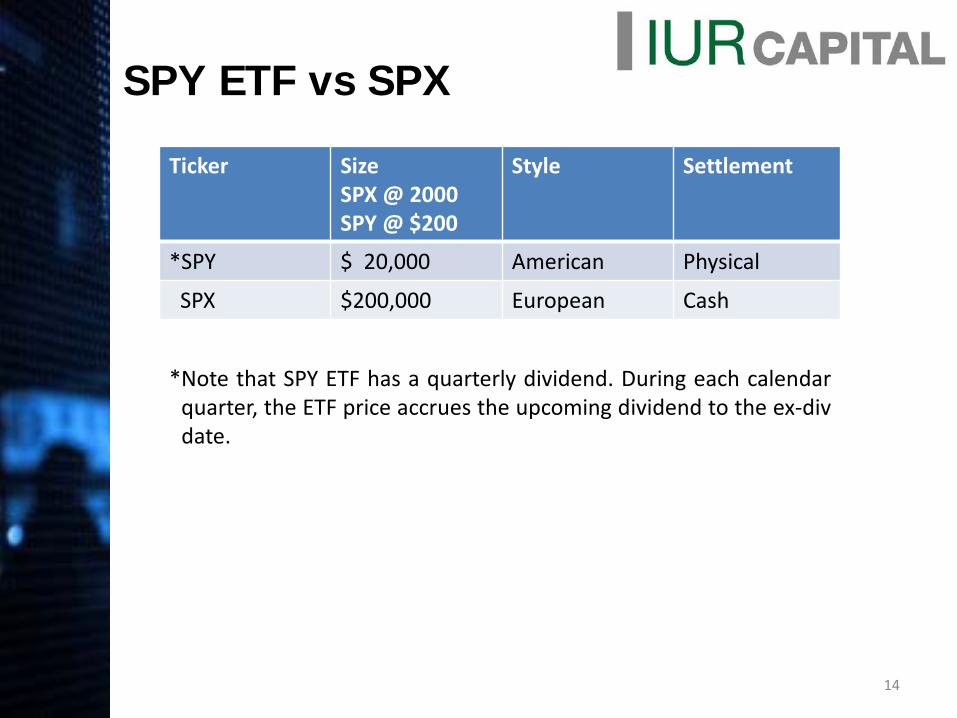
SPY ETF vs SPX
14
Ticker Size SPX @ 2000 SPY @ $200
Style Settlement
*SPY $ 20,000 American Physical
SPX $200,000 European Cash
*Note that SPY ETF has a quarterly dividend. During each calendar quarter, the ETF price accrues the upcoming dividend to the ex-div date.

Potential monthly income in 2016… the specifics • Moderately bullish outlook:
Sell 5% SPY OTM Put Spread on SPX • $5 maximum spread value (strikes are $5 apart)
• With a net credit above $0.48 (after IB comms), your premium received generally equates to 10% of maximum value
• Your price range will be a maximum 5% decrease in the SPX
• Understand that the margin required for this should be the maximum spread value of $5
15
Multiple leg strategies, including spreads, will incur multiple commission charges.

Bear call spreads on equity indexes…
16
• Neutral to bearish outlook • Call spreads being sold for a credit on opening transaction • Objective is to retain the entire premium if both legs of
the call spread expire OTM with zero value. • Assignment risk if the short leg of the call spread is ITM
(called away at the strike price). • What indexes are potential candidates? SPX / NDX / RUT
Multiple leg strategies, including spreads, will incur multiple commission charges.

• Strike selection ultimately depends on what your monthly income target will be and how sensitive you are to daily price moves on the S&P 500 index.
• Consider a monthly target, and where you can position your strikes for the OTM call spread being sold above the market.
• Think about STAYING AWAY from ATM options on the SPY. Look at what premiums are available between 5 – 10% OTM strikes on SPY ETF (above the current market).
• Remember - you are exposed to any move higher in SPY ETF.
Bearish setup with bear call spreads on SPX…
17
Multiple leg strategies, including spreads, will incur multiple commission charges.

What is the risk/return profile? • Receiving a credit of $0.50 means you have
significant risk if the S&P 500 index rallies by more than 5% during the period in which you hold your position.
• HOWEVER, You can manage upside risk using protection (i.e., bull call spreads closer to ATM)
• This requires active management of the position…
18
Multiple leg strategies, including spreads, will incur multiple commission charges.
Notes on credit spreads • The credit spread strategy can generate income if the
underlying security price is above the higher strike of an OTM Put Spread at expiry.
• Can be established in one transaction, but always at a credit (net cash inflow).
• Maximum loss generally occurs where underlying security price moves in the direction that makes both strikes of the credit spread ITM at expiry.
• If both legs of the put spread expire out-of-the-money with no value, the entire premium received on the opening transaction is retained.
Options involve risk and are not suitable for all investors. Multiple leg strategies, including spreads, will incur multiple commission charges.
19
Key points to consider for risk/return in 2016
• Don’t allow one specific event or price move to seriously affect your options portfolio!
• Consider the possibility that 2016 may be a down year for equity indexes… and then seek a strategy that allows you to benefit from this.
• Look at what your monthly objectives are for returns. Is your strike selection and strategy still going to allow you to achieve that?
• Keep a small basket of underlying securities on the book… we are not here to be stock-pickers.
20

Options Advisor Account 2016 Highlights
– Dedicated IUR Options Advisor allocated to your portfolio from day one. – Work with your advisor 1-to-1. Discuss your objectives, risk tolerance and
time horizon. – Direct Advisor input on option strategy setup for the underlying security,
strike selection, position sizing. Strong emphasis on risk management. – Your Advisor will advise, undertake and monitor all positions. – Focus on trying to achieve consistent P&L for your options account.
Our Options Advisory Process
Sector/Industry Analysis
Market Outlook
Time Horizon
Strategy/Strike Selection
Portfolio & Risk
Ongoing input from your IUR Advisor on broad market sentiment
Adapt a Neutral/Bullish/Bearish stance
Guidance on use of near-tern/ longer-term options expiry
Set key risk parameters on positions on positions that will be monitored by your advisor. Input from your advisor on timing of opening/closing of positions.
Use of single leg/two leg and 4-leg options strategies for ITM/ATM/OTM strikes. Multiple leg strategies will incur multiple commission charges.
21

Let’s talk…
Email us at [email protected] to arrange a 1-to-1 call and to request the slides for this webinar. To watch Gareth live, tune into Bloomberg TV every week
22