INCOME INEQUALITY AND PROGRESSIVE INCOME TAXATION IN …
43
DISCUSSION PAPER SERIES ABCD www.cepr.org Available online at: www.cepr.org/pubs/dps/DP5703.asp www.ssrn.com/xxx/xxx/xxx No. 5703 INCOME INEQUALITY AND PROGRESSIVE INCOME TAXATION IN CHINA AND INDIA, 1986-2015 Thomas Piketty and Nancy Qian PUBLIC POLICY
Transcript of INCOME INEQUALITY AND PROGRESSIVE INCOME TAXATION IN …
DISCUSSION PAPER SERIES
ABCD
www.cepr.org
Available online at: www.cepr.org/pubs/dps/DP5703.asp www.ssrn.com/xxx/xxx/xxx
No. 5703
INCOME INEQUALITY AND PROGRESSIVE INCOME TAXATION
IN CHINA AND INDIA, 1986-2015
Thomas Piketty and Nancy Qian
PUBLIC POLICY
ISSN 0265-8003
INCOME INEQUALITY AND PROGRESSIVE INCOME TAXATION
IN CHINA AND INDIA, 1986-2015
Thomas Piketty, PSE, Paris and CEPR Nancy Qian, Brown University
Discussion Paper No. 5703
June 2006
Centre for Economic Policy Research 90–98 Goswell Rd, London EC1V 7RR, UK
Tel: (44 20) 7878 2900, Fax: (44 20) 7878 2999 Email: [email protected], Website: www.cepr.org
This Discussion Paper is issued under the auspices of the Centre’s research programme in PUBLIC POLICY. Any opinions expressed here are those of the author(s) and not those of the Centre for Economic Policy Research. Research disseminated by CEPR may include views on policy, but the Centre itself takes no institutional policy positions.
The Centre for Economic Policy Research was established in 1983 as a private educational charity, to promote independent analysis and public discussion of open economies and the relations among them. It is pluralist and non-partisan, bringing economic research to bear on the analysis of medium- and long-run policy questions. Institutional (core) finance for the Centre has been provided through major grants from the Economic and Social Research Council, under which an ESRC Resource Centre operates within CEPR; the Esmée Fairbairn Charitable Trust; and the Bank of England. These organizations do not give prior review to the Centre’s publications, nor do they necessarily endorse the views expressed therein.
These Discussion Papers often represent preliminary or incomplete work, circulated to encourage discussion and comment. Citation and use of such a paper should take account of its provisional character.
Copyright: Thomas Piketty and Nancy Qian
CEPR Discussion Paper No. 5703
June 2006
ABSTRACT
Income Inequality and Progressive Income Taxation in China and India, 1986-2015*
This paper evaluates the prospects for income tax reform in China during the coming decade (with a comparison to India), and argues that such reforms should rank high on the policy agenda in these two countries. Due to high average income growth and sharply rising top income shares during the 1990s and early 2000s, progressive income taxation is about to raise non-trivial tax revenues in China and India and to become an important political object. According to our projections, the income tax should raise at least 4% of Chinese GDP in 2010 (versus less than 1% in 2000 and 0,1% in 1990), in spite of the 20% nominal rise in the exemption threshold that took effect in 2004. The fact that progressive income taxation is becoming an important policy tool has important consequences for China’s ability to finance social spending and to keep under control the rise in income inequality associated to globalization and growth. Due to faster income growth and to a higher fraction of wage earners in the labor force, the prospects for income tax development look better in China than in India. This potential is however limited by the fact that Chinese top wage-earners are under-taxed relatively to top non-wage income earners.
JEL Classification: E25 Keywords: income distribution and income taxation
Thomas Piketty Ecole Normale Superieure (ENS) Campus Paris-Jourdan 48 Boulevard Jourdan 75014 Paris FRANCE Tel: (33 1) 43 13 62 50 Fax: (33 1) 43 13 62 59 Email: [email protected] For further Discussion Papers by this author see: www.cepr.org/pubs/new-dps/dplist.asp?authorid=119727
Nancy Qian Assistant Professor of Economics Box B Brown University Providence, RI 02912 USA Tel: (1 401) 863 2097 Fax: (1401) 863 1970 Email: [email protected] For further Discussion Papers by this author see: www.cepr.org/pubs/new-dps/dplist.asp?authorid=164319

* We gratefully acknowledge financial support from the Mac Arthur Foundation. We are grateful to the Urban Household Income Survey Team of China’s National Statistical Bureau (NSB) for helping us with the data, and to Ge Shozhong at the Shanghai Cai Jing University for sharing his expertise in China’s tax system Wang Youjuan. We also thank Ye Jiang for excellent research assistance. All comments are welcome.
Submitted 15 May 2006
2
1. Introduction
Current debates about policy reform in LDCs generally focus on improving the
delivery of social services, the design of market-friendly economic institutions, the
effectiveness of poverty reduction programmes, or the role of trade and market
liberalization, and very rarely deal explicitly with tax reform and the need to develop
modern income tax systems in those countries.1
This is unfortunate for at least three reasons. First, poor countries tend to rely
excessively on highly distortionary tax instruments such as taxes on trade or indirect
taxes on specific consumption goods. The gradual shift towards modern and
transparent income and payroll tax systems is generally regarded as an important,
efficiency-enhancing aspect of the modernization process.
Next, many LDCs need to raise more tax revenues in order to properly finance
education and health investment, and income taxation can be part of the solution,
especially in an international context characterized by sharp downward pressures on
tariffs and various indirect taxes. In countries like China and India, in spite of very
rapid growth, tax revenues are currently stagnating around 10%-15% of GDP, which
is probably far too little. There is no example of a country in the West that has been
able to develop a proper education and health system with total tax revenues around
10-15% of GDP. Improving the efficiency of social services delivery is probably a
good idea, but might well be illusory in case those services are not properly funded.
Finally, many LDCs have witnessed a sharp rise in income inequality during the
recent period. Progressive taxation is probably one of the least distortionary policy
tools available to keep the rise in inequality under control and to redistribute a bit
more equally the gains from growth (it is less distortionary than more radical policy
tools such as nationalization, minimum wages or autarky). In India, the fact that many
people did not benefit from the 5%-6% annual growth rates advertised by the
government and felt left behind of “shining India” probably played an important role in
recent electoral outcomes.
In this paper, we choose to focus on the case of progressive income taxation in
China. Although a progressive individual income tax system has been in place in
China since 1980, it has received very little attention so far, probably because the
1 See, e.g., the list of topics covered in World Development Reports over the past few years.
3
fraction of the population with income above the exemption threshold was negligible
until the 1990s (less than 1%). Using annual, 1986-2003 tabulations from urban
household income surveys collected by China’s National Statistical Bureau (NSB),
we compute series on levels and shares of top incomes in China over this period, as
well as series on theoretical numbers of taxpayers and total income tax receipts
(based on actual tax law).2 We also make projections about the evolution of the
number of taxpayers and total receipts over the 2004-2015 period, assuming
constant income trends and income tax schedules.
One additional motivation for computing theoretical numbers of taxpayers and tax
receipts is the fact that there is widespread presumption that official Chinese income
tax law is not being applied very rigorously by tax authorities. In particular, many
observers seem to believe that tax authorities make deals with large firms and
autonomous regions or cities whereby the latter offer a lump-sum payment to tax
authorities and their employees and residents are not subject to the official income
tax schedule. Although at this stage there does not seem to exist detailed tabulations
of income tax returns by income brackets or tax liability in China (such tabulations
exist in most countries with an income tax system), we were able to use aggregate
1996-2003 income tax receipts series (broken down by wage income, business
income and capital income for 2000-2003) and compare them with our theoretical
series. It turns out that although there is some evidence that the law is not fully
applied, actual receipts and theoretical receipts are reasonably close.
We were also able to compare our Chinese findings with similar series for India.
Contrarily to its Chinese counterpart, the Indian tax administration has been
compiling detailed tabulations of income tax returns every year since the creation of a
progressive income tax in India (1922). Indian tax returns tabulations were recently
exploited by Banerjee and Piketty (2004, 2005) to study the long run evolution of top
income shares in India, and we use their results for the 1986-2001 sub-period as a
comparison point for our Chinese series.
2 A number of economists have used NBS’s household surveys and have documented the rise in income inequality that took place in China during the 1990s (see e.g. Chen and Wang (2001), Eckaus, Lester and Qian (2003) and Ravallion and Chen (2001)). However these works generally focus on poverty: they generally do not deal specifically with the top of the distribution and (most importantly) do not look at the issue of progressive income taxation. Chen and Wang (2001) show that income dispersion has increased at the top of the distribution (which is fully consistent with our findings) but do not mention the issue of income taxation. For more details on the NSB tabulations used in this study (these tabulations were designed explicitly to focus on top income brackets and to facilitate tax simulations), see section 2 below.
4
Our main conclusions are the following. First, our general conclusion is that
progressive income taxation is about to become an important economic and political
object in China and India, and that income tax reform should rank high on the policy
agenda in these two countries. Due to high average income growth and sharply rising
top income shares during the 1990s and early 2000s, progressive income taxation is
starting to hit non-negligible fraction of the population in both countries (as more and
more workers pass the exemption threshold, following what happened in Western
countries half-a-century ago) and to raise non-trivial tax revenues. According to our
projections, the income tax should raise at least 4% of Chinese GDP in 2010 (versus
less than 1% in 2000 and 0,1% in 1990), in spite of the 20% nominal rise in the
exemption threshold that took effect in 2004. In case no further rise in exemption
threshold occurs (which seems fairly unlikely), we predict that over 80% of urban
wage earners will be subject to tax by 2015, and that income tax revenues will well
exceed 10% of Chinese GDP (i.e. more than in a number of developed countries).
The fact that progressive income taxation is becoming an important policy tool has
important consequences for China’s ability to finance social spending and to keep
under control the rise in income inequality associated to globalization and growth.
Due to faster income growth, to lower bracket indexation and to a higher fraction of
wage earners in the labor force, the prospects for income tax development look
better in China than in India. This potential is however limited by the fact that Chinese
top wage-earners are under-taxed relatively to top non-wage income earners.
The rest of the paper is organized as follows. Section 2 briefly describes the NSB
data used in this paper. In Section 3, we present our findings for the evolution of top
income shares in China, and compare them to the Indian series of Banerjee and
Piketty (2003). The results of our income tax simulations are presented and analyzed
in section 4. Section 5 offers some concluding comments.
2. Data and Methodology
The Chinese data used in this paper comes from the urban household income
surveys collected by China’s National Statistical Bureau (NSB). These surveys are
designed so as to representative of urban China. Between 13 000 and 17 000
5
households are being surveyed each year until 2002, up to 45 000-50 000 in 2002
and 2003 (see appendix Table A1). The micro-files for these surveys are
unfortunately not available for all years,3 and we asked NSB to provide us with
annual, 1986-2003 tabulations based on the micro-files. We asked for two series of
tabulations: household tabulations and individual tabulations.4 Household tabulations
report for a large number of income brackets (and in particular a large number of top
income brackets) the number of households whose total household income falls into
that bracket, their average total income and household size, as well as their average
income broken down by income sources (wage income, business income, capital
income and transfer income). Individual tabulations report for a large number of
income brackets (and in particular a large number of top income brackets) the
number of individuals whose individual income falls into that bracket, their average
age, years of education, income and household size, as well as their average income
broken down by income sources. In practice, some forms of income cannot be
properly attributed to a specific individual within the household (this is particularly true
for transfer income and capital income), so that the total income aggregates reported
in household tabulations are larger than in individual tabulations, and various
adjustments are necessary when one uses the latter (see appendix Tables A1 and
A2). However the important advantage of individual tabulations is that China’s
income tax applies to individual income (rather than household income).
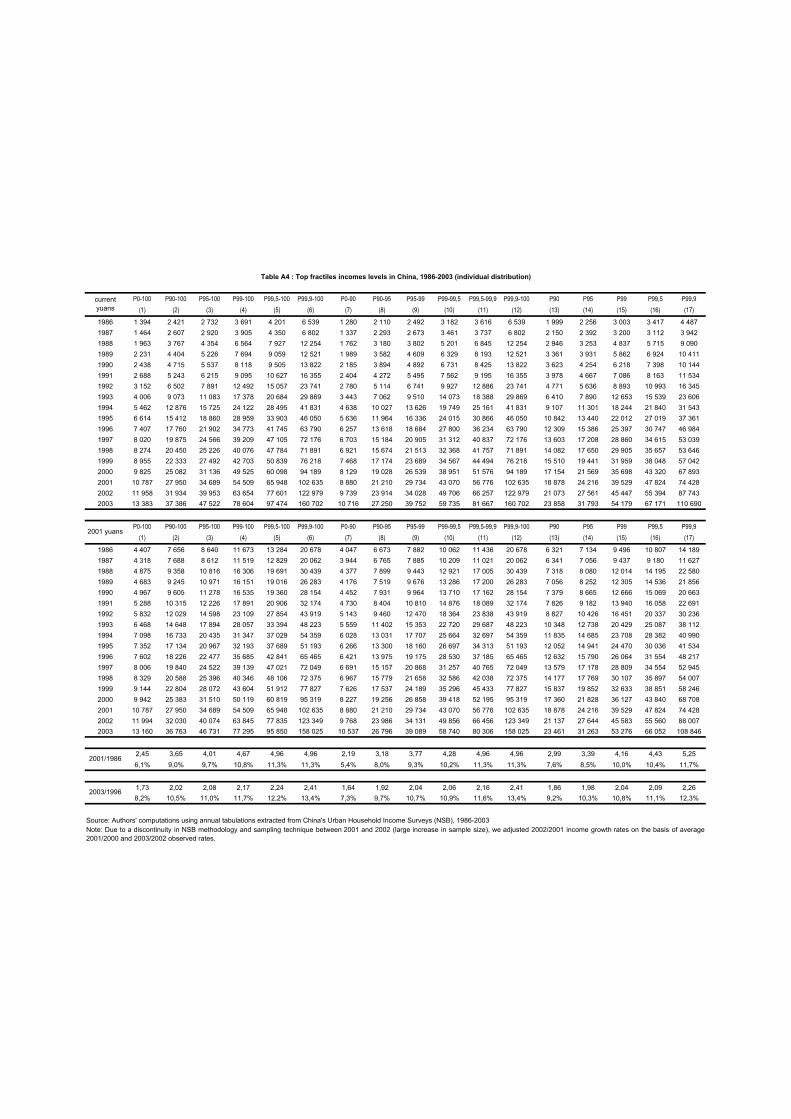
We used standard Pareto interpolation techniques to approximate the form of the
Chinese household and individual distribution of income, and we then used these
structural parameters to compute top fractiles incomes and to make income tax
simulations.5 The Chinese data appears to be very well approximated by a Pareto
distribution (for any given year, Pareto coefficients are extremely stable within the top
decile), although there is some presumption that top incomes are underestimated in
the survey data (more on this below).6
3 The micro-files for urban household surveys are available for researchers for years 1988 and 1995 only (see Eckaus, Lester and Qian (2003)). 4 We also asked for “age tabulations” (reporting for each age cell the relevant number of individuals, their average years of education and income, as well as their average income broken down by income sources).We did not use these tables in the current version of this paper. 5 For recent use of Pareto interpolation techniques, see e.g. Piketty (2003) and Piketty and Saez (2003). 6 The Pareto coefficients, as defined by the ratio between average income above a given threshold and the threshold (the definition of a Pareto distribution is that this ratio does not depend on the threshold), appear to be extremely low in China (around 1,2 in the late 1980s, up to around 1,4 in the late 1990s and early 2000s), much lower than in any country for which we have seen similar data. In
6
We did not attempt to use similar tabulations from rural household surveys, but
given that our focus is on top incomes and progressive income taxation this should
not be too much of a problem: average rural income was in 2001 more than 3 times
smaller than average urban income,7 so that there are probably very few rural
households and individuals in the national top decile, and even less so within the top
incomes subject to progressive income taxation (agricultural income is exempt from
the income tax and is being taxed separately).
We did not use any new Indian data in this research. All our series regarding India
are borrowed from Banerjee and Piketty (2003), who used Indian income tax returns
tabulations published in “All-India Income Tax Statistics” brochures (annually
available since 1922) to estimate top income levels and national accounts to
compute the average income denominator. Top income shares estimates based
upon income tax returns are likely to be higher than estimates based on survey data
(as the latter generally underestimates top incomes), but there is no obvious reason
why the trends should not be comparable. Note also that the standard household
surveys used by economists working on India (NSS surveys) can hardly be used to
compute top income shares, as these are mostly expenditure surveys: except for
particular years, and contrarily to NSB surveys, NSS surveys contain no systematic
information on incomes.8
3. Top Income Shares in China and India, 1986-2001
Did income inequality in China increase as much as in India during the 1990s?
Before we look at our top income shares series, it is useful to recall one important
difference between Chinese and Indian incomes during the past 15 to 20 years.
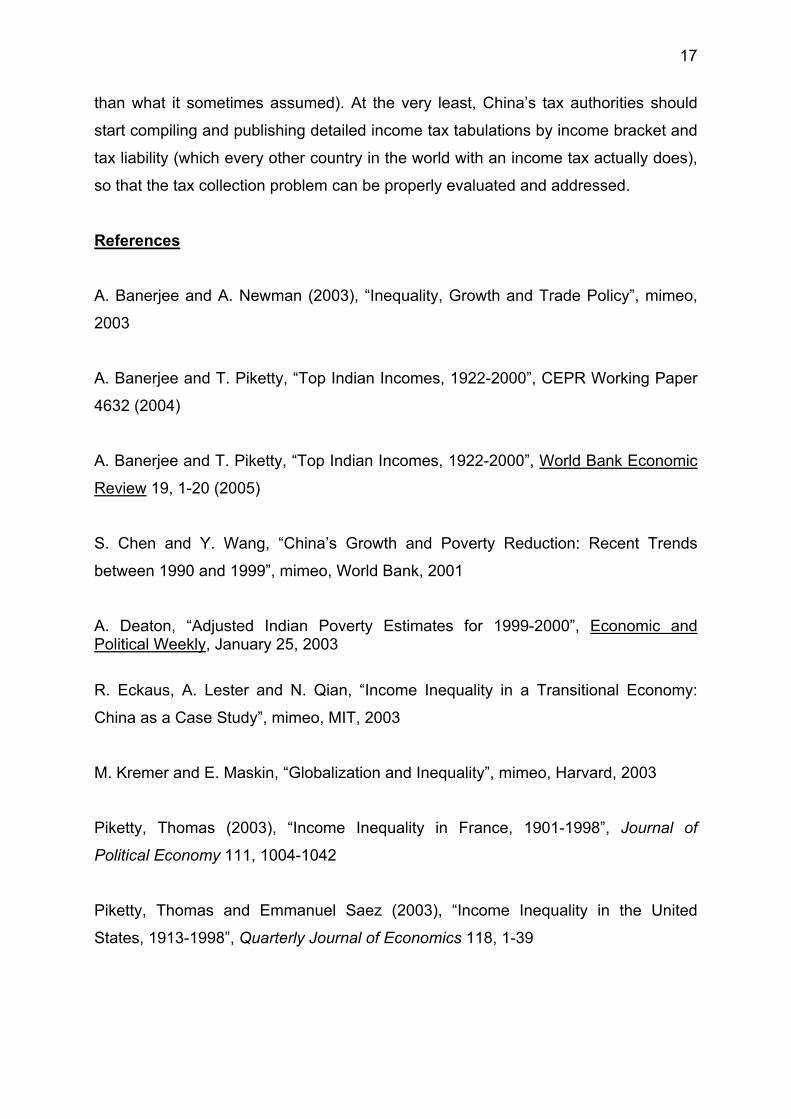
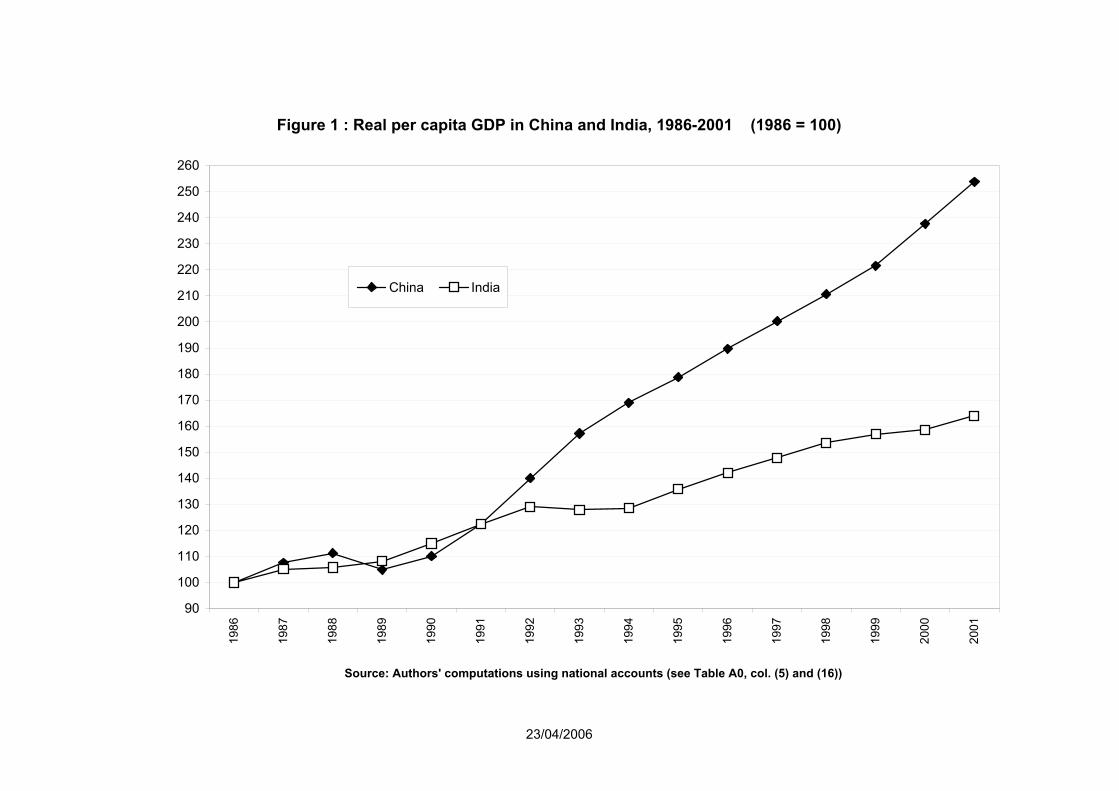
While real per capita GDP increased by almost 160% in China between 1986 and
2001 (6,4% per year), it increased by slightly more than 60% in India (3,4% per year)
(see Figure 1). According to the best available PPP conversion factors, real per
the 1990s, similarly defined Pareto coefficients are around 1,7-1,8 in France and 2,3-2,4 in the U.S. A higher Pareto coefficient means a fatter upper tail of the distribution (a coefficient equal to 1 means that there is nobody above the given threshold, i.e. the distribution is truncated) and generally implies higher top income shares. 7 See appendix Table A0. 8 This important difference between China’s NSB and India’s NSS surveys has probably a lot to do with the fact that the Indian population includes a much higher fraction of independent workers with ill-defined income (including in the urban sector) and a much smaller fraction of formal wage-earners than China (more on this below).
7
capita GDP was virtually identical in China and India in 1986 (less than 20% larger in
China), and it is almost twice as large in China as in India by 2001.9 Note that the
growth gap is even larger if we look at survey data rather than national accounts.
While total 1986-2001 income growth is virtually the same in Chinese national
accounts and household surveys, there exists a well-known “growth paradox” in
Indian statistics: real GDP per capita (as measured by Indian national accounts) has
increased by 64% between 1986 and 2001 (3,4% per year), but real consumption per
capita (as measured by NSS surveys) has increased by only 24% (1,4% per year).10
According to official Chinese statistics, there exists no such growth paradox in China:
real GDP per capita (as measured by Chinese national accounts) has increased by
154% between 1986-2001 (6,4% per year), and real per capita income (as measured
by NSB surveys) has increased by 140% (6,0% per year).11
Insert Figure 1: Real per capita GDP in China and India, 1986-2001
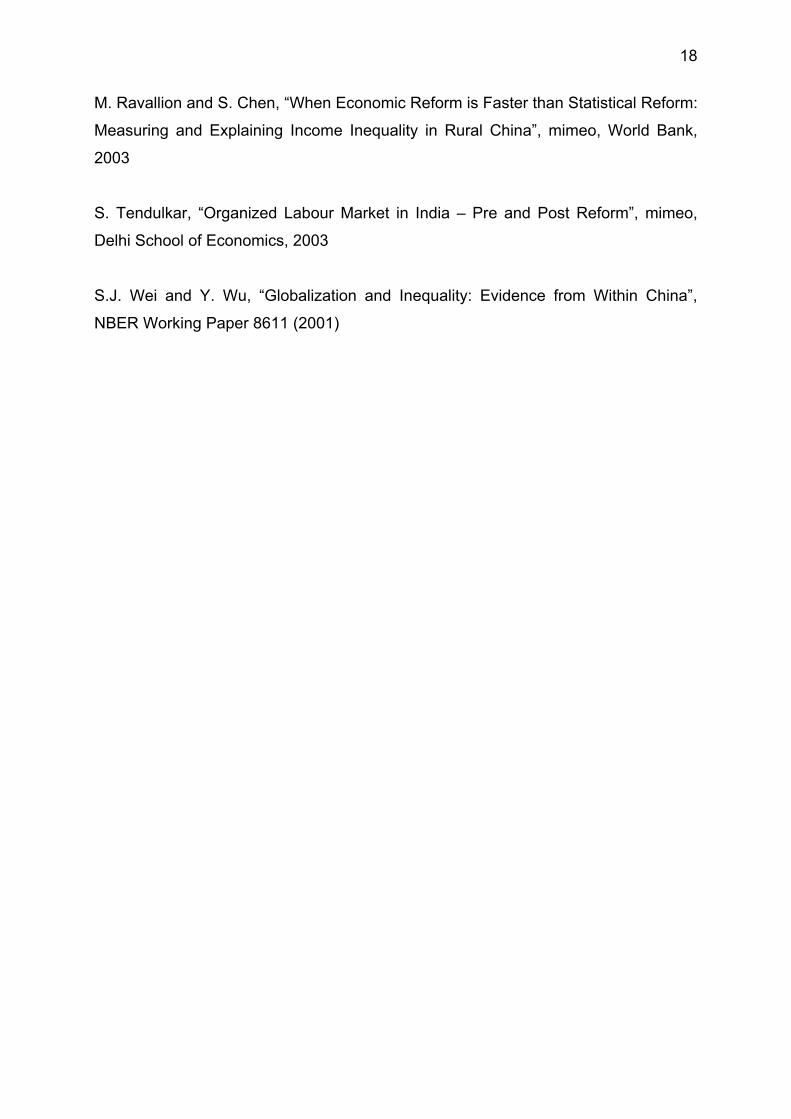
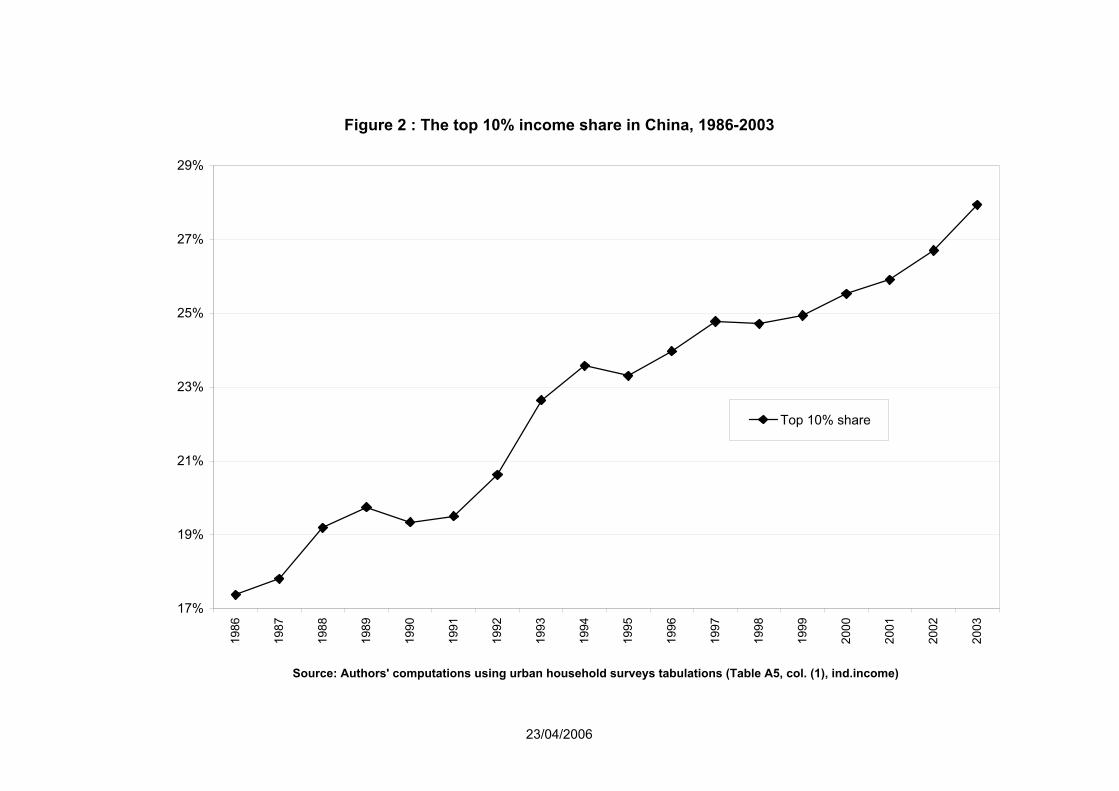
If we now look at the evolution of the top decile income shares in China over the
same period, we find that income inequality has increased at a very high rate during
the 1986-2003 period. According to our urban survey estimates, the top decile
income share rose from about 17% in 1986 to almost 28% in 2003, i.e. by more than
60% (see Figure 2). The levels are probably underestimated (during most of the
period they are even lower than in the most egalitarian developed countries, e.g.
Scandinavia), but the upward trend seems large and robust.
Insert Figure 2: The top 10% income share in China, 1986-2003
9 See appendix Table A0. 10 See appendix Table A0. This “Indian growth paradox” has attracted a lot of attention from economists. Here we use as an end point the latest NSS figures corrected by Deaton (2003) on the basis of the 1999-2000 NSS round (we adjusted upwards this figure to make it comparable to other estimates available for 2001). Deaton’s corrections did reduce the size of the gap between national accounts and NSS figures (until these corrections, there was basically no growth at all in the NSS during the 1990s), but the gap is still substantial. Banerjee and Piketty (2003) argue that the gap can be partly explained by the rise in top incomes in India during the 1990s (top incomes are not properly recorded in the NSS). 11 See appendix Table A0. Note that rural per capita income has increased much less rapidly than urban per capita income and national per capita GDP (both increased at approximately the same rate), but that this was almost exactly compensated by the rise in the urban population share.
8
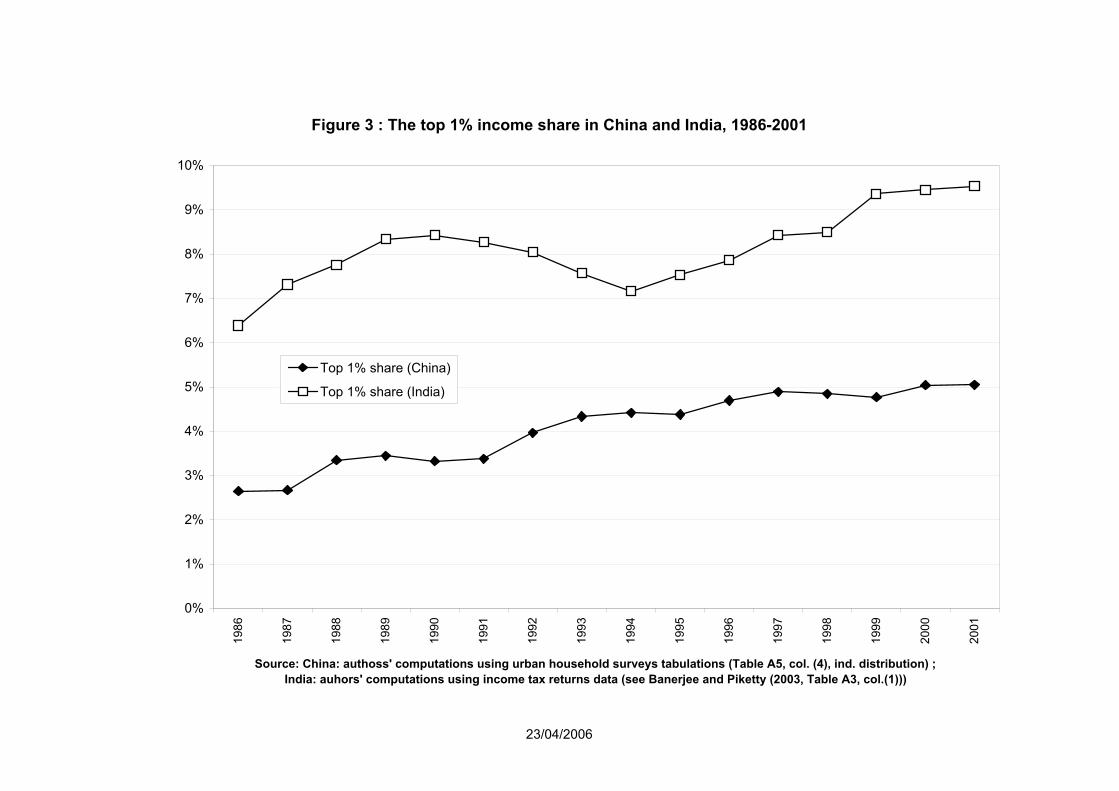
As we move up in the income hierarchy, the trend gets even bigger. For instance, the
top 1% income share more than doubled between 1986 and 2001, from slightly more
than 2,6% in 1986 to 5,9% in 2003 (see Figure 3 and Appendix Table A5). If we
compare these results with those obtained for India,12 we find that the levels are
much lower in China than in India (the Chinese 2003 top 1% share is still lower than
the Indian 1986 top 1% share), which again suggests that survey-based measures
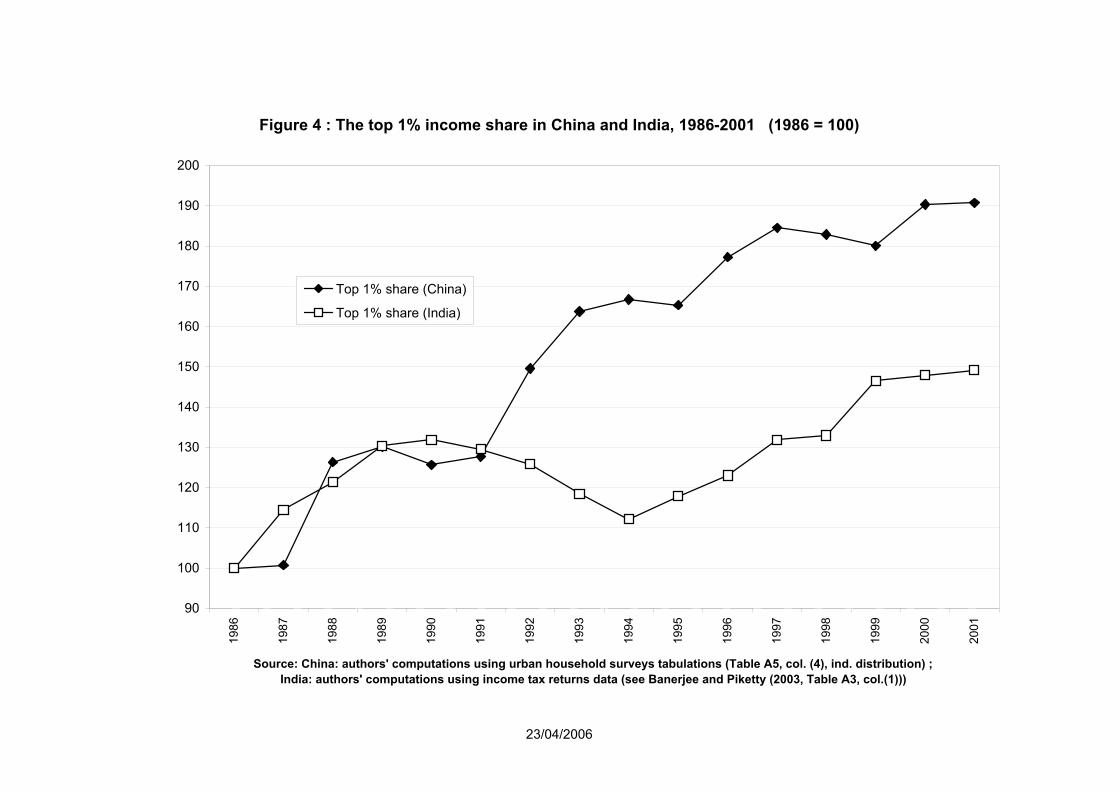
underestimate top incomes, but that the trend is substantially larger in China. The top
1% income share has increased by more than 90% in China between 1986 and
2001, and by less than 50% in India (sees Figure 4).
Insert Figure 3: The top 1% income share in China and India, 1986-2001
Insert Figure 4: The top 1% income share in China and India, 1986-2001 (1986=100)
These results can be used not only to evaluate the prospects for progressive
income taxation in China and India (see Section 4 below), but also to shed some new
light on the on-going debate about globalization and the rise in inequality. Although
our data does not allow us to identify precisely the causal channels at work, and in
particular to isolate the impact of globalization, we note that the fact that the rise in
income inequality was so much concentrated within top incomes in both countries
seems more consistent with a theory based on rents and market frictions (see e.g.
Banerjee and Newman (2003)) than with a theory based solely on skills and
technological complementarity (i.e. inequality rises in the South because low-skill
southern workers are too low-skill to benefit from globalization; see e.g. Kremer and
Maskin (2003)), which would seem to imply more gradual shifts in the distribution. To
the extent that the skill distribution is more unequal in India than in China (e.g.
literacy rates are substantially higher in China), the skill-based theory would also
seem to imply that income inequality should have risen more rapidly in India than in
China, whereas we find the opposite (as far as the top 1% income share is
concerned).
12 Banerjee and Piketty (2003) were only able to compute the income shares for the top percentile (and above) for India (and not the top decile), due to the low proportion of individuals subject to the income tax.
9
4. Progressive Income Taxation in China and India, 1986-2010
4.1. Income Tax Schedules and Exemption Levels
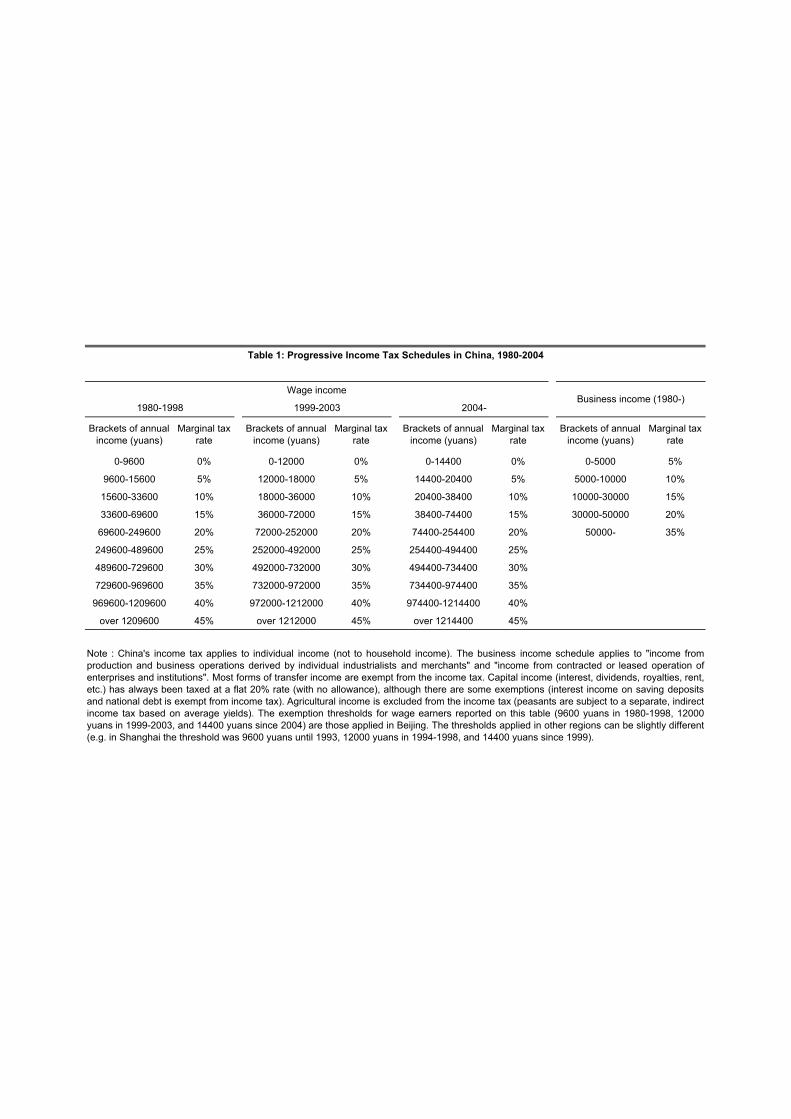
We now come to the issue of progressive income taxation. Table 1 describes the
evolution of Chinese income tax schedules during the 1980-2004 period.13 In the pre-
reform era, all workers worked for the state and paid an implicit tax from their wages.
Expansion of the private sector by the market reforms decreased the government’s
ability to tax directly. Following other countries, China developed an individual income
taxation system, which officially began in 1980. In order to avoid negative public
opinion, the deductible amount was set so high such that virtually no one had to pay
income taxes in 1980.
However the striking fact is that China’s income tax law has remained basically
unchanged in nominal terms since its creation in 1980. The only major change is that
the nominal exemption threshold for wage earners has been raised from 9 600 yuans
per year in fiscal years 1980-1998 to 12 000 yuans in 1999-2003 and 14 400 yuans
since 2004. Also note that the Chinese income tax systems treats wage income in a
much more favourable manner than business income and capital income: while
wage-earners are subject to the progressive income tax only if their annual wage is
large enough, all business and capital income earners are subject to the tax (with no
exemption). Business income is taxed by applying graded progressive rates, while
capital income is taxed at a flat 20% rate. Many Western countries had a similar
system when they first introduced income taxation (i.e. varying rates and deductions
for different sources of income, with general a large exemption for wages and little or
no exemption for business and capital income), before gradually shifting to a more
integrated system.14
13 Keeping track of all the changes in China’s tax law is not an easy business, so unfortunately we cannot exclude the possibility that we missed some important changes. However to the best of our knowledge all parameters reported on Table 1 are accurate. Tax laws are enacted jointly by the National People’s Congress and the Standing Committee of the National People’s Congress. Some local tax regulations may be formulated at the provincial level. However, individual income tax brackets are set by the central government and it is illegal for regional governments to alter it although in fact, some rapidly growing cities such as Shanghai and Shenzhen have on occasion increased the threshold above the centrally threshold to alleviate the tax burden of its lower income citizens. 14 For instance, a similar schedular system existed in France when the income tax was put in place in 1914, and it was turned into an integrated system in 1948-1959.
10
Insert Table 1: Progressive Income Tax Schedules in China, 1980-2004
In contrast to the Chinese income tax, the Indian income tax is a much older
institution, since it was created in 1922 by the British. Moreover, it has always been
an integrated system treating all income sources equally: Indian progressive tax
schedules apply to total individual income, irrespective of where the income comes
from. Another important difference is that the tax schedule has been changed almost
constantly in India during the 1986-2004 period, resulting into a general decline in tax
rates and a continuous increase in the exemption threshold (see Table 2).
Insert Table 2: Progressive Income Tax Schedules in India, 1986-2004
From our perspective, the first important implication of these differing evolutions is
that the exemption threshold (for wage earners) has increased less than inflation
(and much less than nominal incomes) in China since 1986, while it increased
approximately at the same rate as inflation in India, resulting into a massive increase
in the proportion of the population subject to the income tax in China and a more
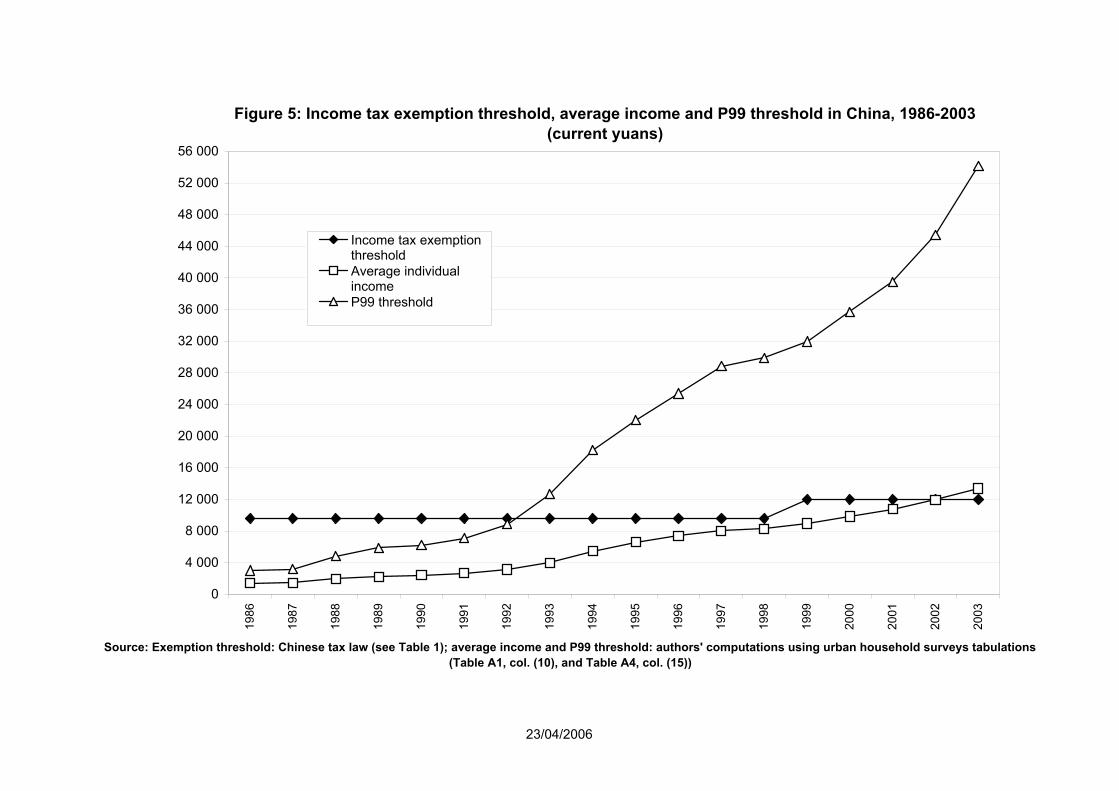
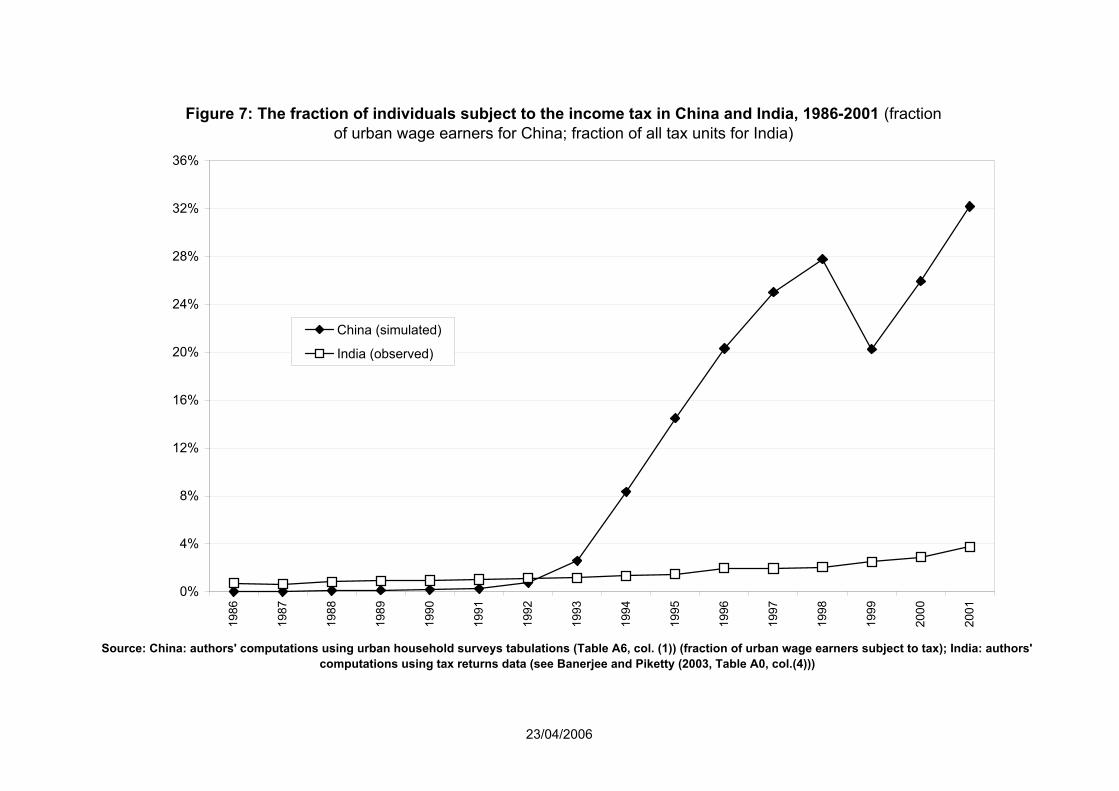
modest increase in India (see Figures 5, 6 and 7). In China, the exemption threshold
in 1986 (9 600 yuans) was about 7 times larger than average individual urban income
(1 394 yuans), so that less than 0,1% of all wage earners were subject to the income
tax in 1986. By 2003, the exemption threshold (12 000 yuans) has passed below
average individual urban income (13 383 yuans), so that according to our estimates
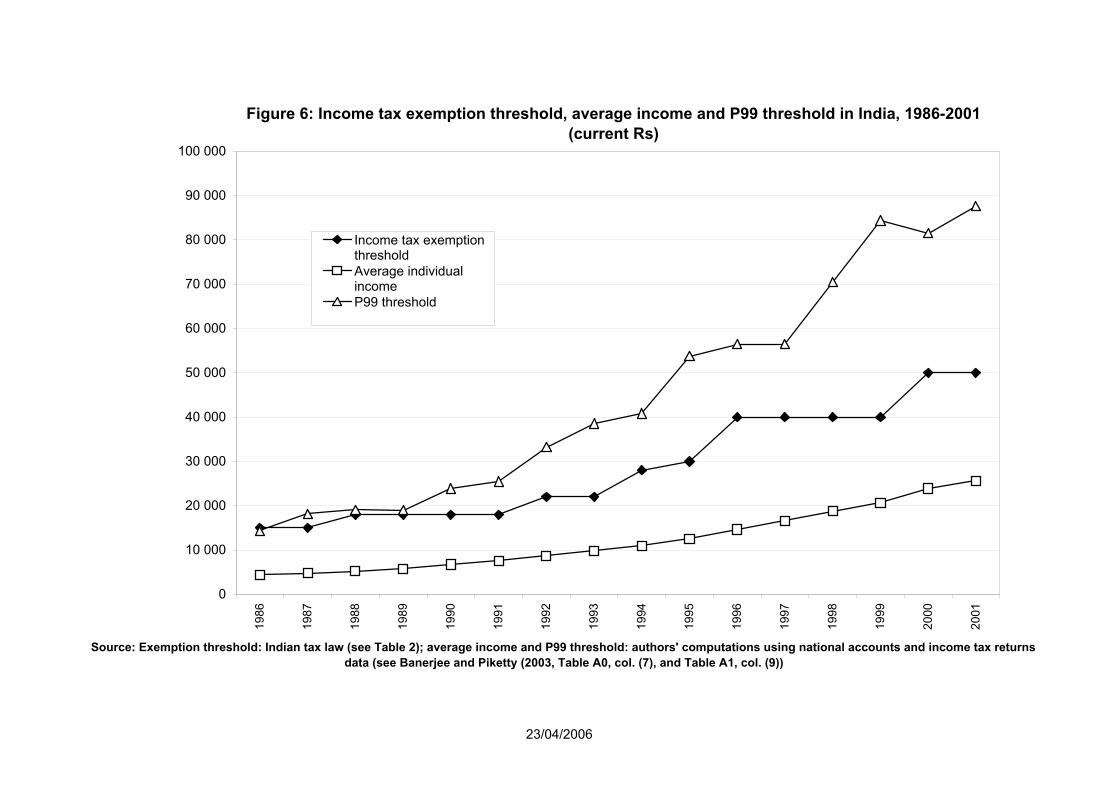
44,1% of all urban wage earners were subject to tax. In India, the exemption
threshold has always been set around 2-3 times average income during the 1986-
2001 period, and it is only because of the rise in top income shares that the
proportion of the population subject to the income tax has increased somewhat
during this period (from 0,7% in 1986 to 3,8% in 2001). This is an important rise from
an historical perspective (the proportion of the population subject to the Indian
income tax had been relatively stable around 0,5%-1% between the 1920s and the
early 1990s), but this is clearly much less than in China.15
15 The levels reported on figure 7 are not strictly comparable, since the Chinese figure applies to urban wage earners, while the Indian figure applies to all tax units (i.e. adult individuals). Note however that the fraction of urban wage earners is fairly large in China: in 2003 total urban population (adults and children) was about 500 millions, and the total numbers of urban wage earners was about 260 millions (see Appendix Tables A0 et A2).
11
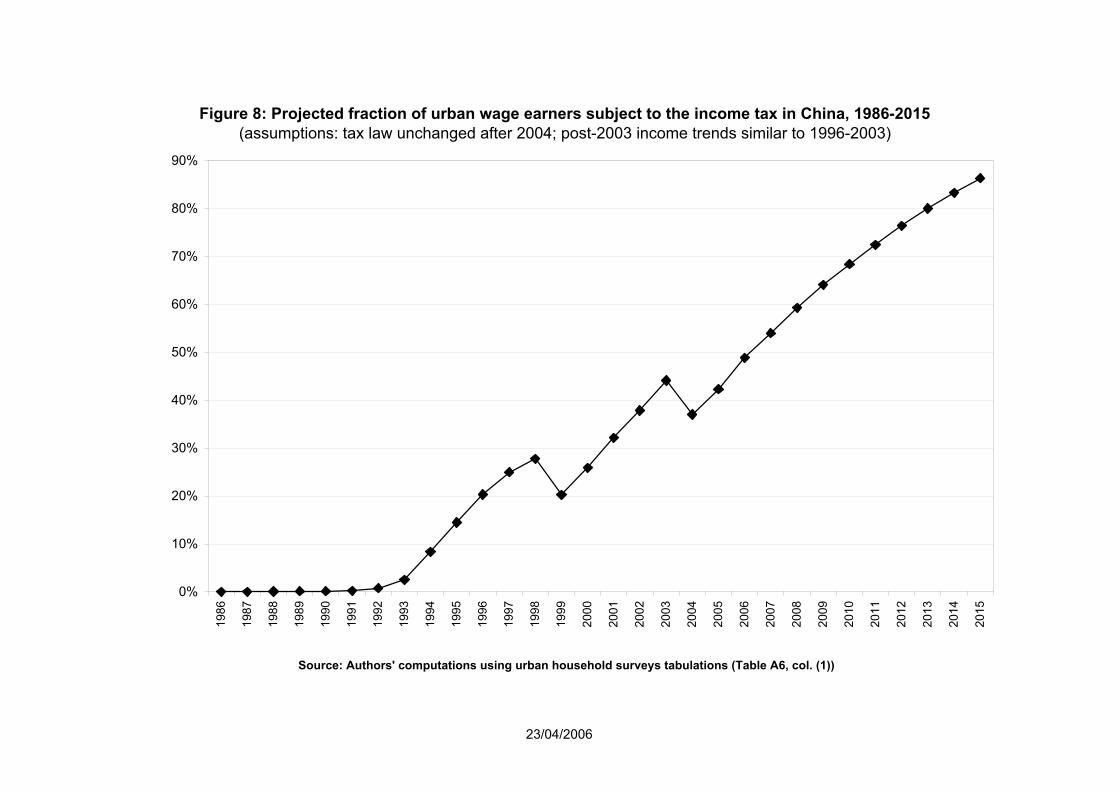
In other words, due to lower bracket indexation and higher real income growth, the
Chinese income tax has become a mass tax during the 1990s, while it has remained
an elite tax in India. Assuming that China’s 2004 income tax law applies until 2010
(i.e. there is no further rise in the exemption threshold after 2004) and the income
trends (both in average income and top income shares) continue after 2001 at the
same rate as during the 1996-2001 period, our projections indicate that almost two
thirds of Chinese urban wage earners (over 200 millions individuals) will be subject to
the income tax by 2010, and over 85% by 2015 (see Figure 8). As we shall see
below, it is fairly likely that the exemption threshold will be increased again in order to
keep this booming trend under control.
Insert Figure 5: Income tax exemption threshold, average income and P99 threshold
in China, 1986-2003
Insert Figure 6: Income tax exemption threshold, average income and P99 threshold
in India, 1986-2001
Insert Figure 7: The fraction of individuals subject to the income tax in China and
India, 1986-2001
Insert Figure 8: Projected fraction of individuals subject to the income tax in China,
1986-2015
4.2. Income Tax Revenues
One important question, however, is whether the Chinese income tax law is really
being applied in practice. I.e. do all individuals who are supposed to be subject to the
income tax according to the law really pay the income tax? Chinese tax laws are
reasonably well documented, but there is almost no documentation of the actual
implementation of these laws. Many observers in and outside China seem to believe
that tax authorities make deals with large firms and autonomous regions or cities
whereby the latter offer a lump-sum payment to tax authorities and their employees
and residents are not subject to the official income tax schedule. We conducted a
series of interviews with managers of six firms in Shanghai and several former
employees of local tax ministries from another large city. We interviewed 2 large
public sector firms (4 000-10 000 employees), 2 middle size private sector firms (a
non-Chinese firm and a Chinese firm, 200-500 employees), and 2 small private
12
sector Chinese firms (30-100). According to these firms, the amount of income tax
deducted from salaries is determined by the tax bureau that sends a representative
to the firm once every couple of years. The duration is not set or announced ex ante.
However, all the firms we met with had been visited by the tax bureau in the past
three years. The visit entails an examination of the employment records and salaries.
It is unclear whether the tax bureau determines an average tax rate for the firm on
the basis of average wage only, or whether the full progressive schedule is really
being applied . In many cases, all employees within a firm seem to share the same
proportional tax liability. In other words, income taxation often seems to be
progressive across firms, but not within firms.
Although this kind of anecdotal evidence is suggestive, one would obviously need
systematic tabulations of taxpayers and effective tax rates by income brackets in
order to better understand how income tax is really collected in China. Unfortunately,
such tabulations by income brackets (similar what is being published by the tax
administration in India and other countries) are not available in China. There does not
even seem to exist any reliable statistics on the number of income tax taxpayers in
China, so we cannot compare our theoretical numbers of taxpayers with the actual
numbers.16 However we can use published statistics on aggregate income tax
revenues and compare it to theoretical tax revenues in order to evaluate how strictly
the law is being applied. We compiled from China Tax Yearbooks aggregate income
tax revenues series for 1996-2003. Starting in 2000, published aggregate revenue
statistics are broken down by income source (wage income, business income, capital
income and other income).17 This very useful decomposition of tax revenues does
not seem to be available prior to 2000. The comparison between actual tax revenues
and theoretical tax revenues is given on Table 3. The theoretical tax revenues were 16 Estimates according to which there were approximately 10-11 millions income tax taxpayers in China in 1997-1998 have been published in the China Tax Yearbooks, but we were unable to find out what these numbers exactly refer to and how they were constructed. If they were true, these numbers would be substantially smaller than our theoretical estimates (about 25% of 200 millions wage-earners subject to income tax in 1997-1998, i.e. approximately 50 million taxpayers; see appendix Tables A2 and A6), which would seem to suggest that the law is not being applied properly. However the missing taxpayers might well have very low average tax liabilities, so it is hard to know how these figures should be interpreted (if the Chinese tax authorities were able to produce reliable estimates of the total number of taxpayers, they should also be able to break down this total number by income bracket or tax liability). 17 « Other income » includes small items such as « author’s remuneration » and « property transferring income » (these income types are not properly recorded in income surveys, and we did not attempt to replicate the corresponding tax revenues).
13
computed by applying the relevant tax schedules to the individual distributions of
wage income, business income and capital income estimated from urban household
income survey tabulations.
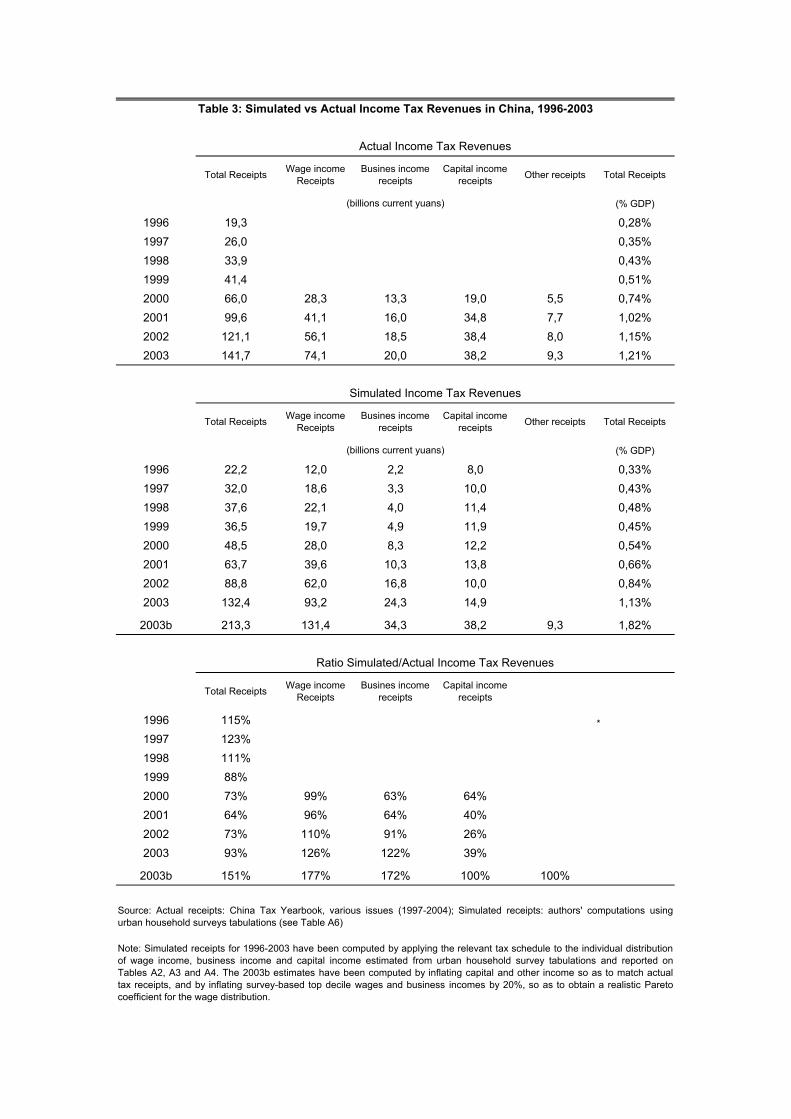
Insert Table 3: Simulated vs. Actual Income Tax Revenues in China, 1996-2003
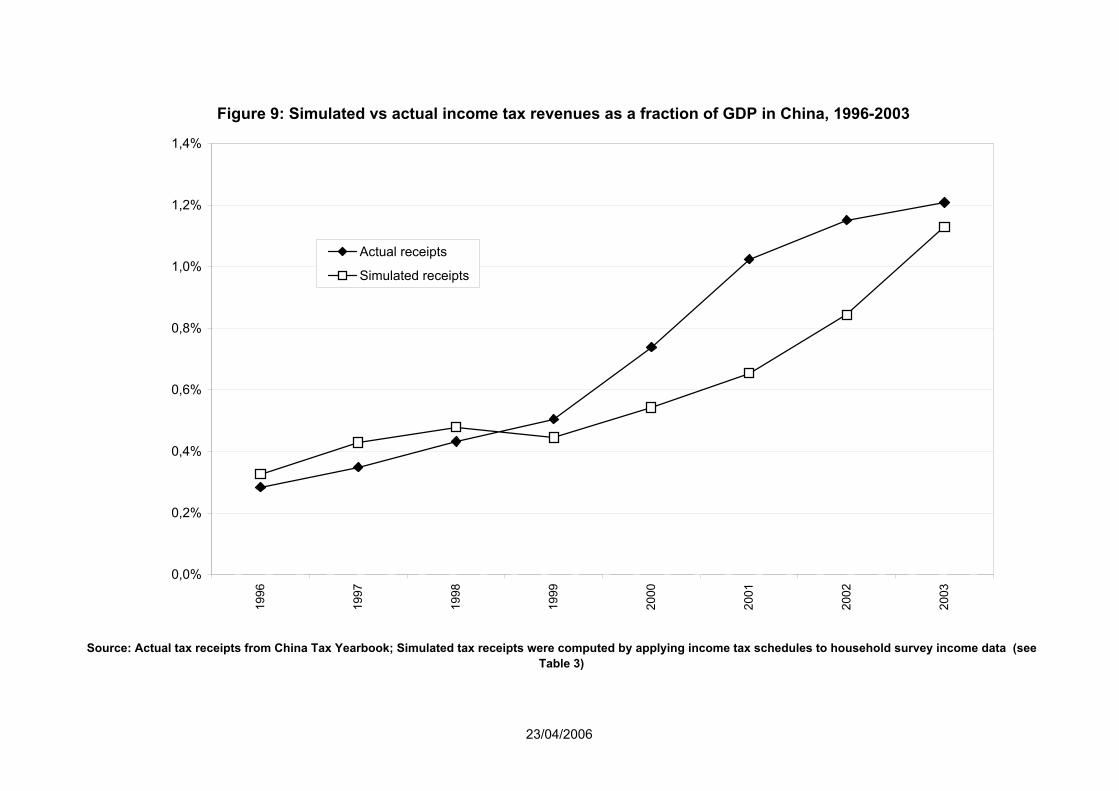
The first conclusion emerging from Table 3 is that actual income tax revenues are
reasonably in line with theoretical tax revenues (as a first-order approximation),
thereby suggesting that income tax collection in China is somewhat less chaotic and
arbitrary than what many observers tend to assume. In 1996, actual income tax
receipts made 0,28% of GDP, and theoretical receipts 0,33% of GDP; in 2003, actual
income tax receipts made 1,21% of GDP, and theoretical receipts 1,13% of GDP (cf.
Table 3). If we look separately at receipts by income source for 2003, we find
theoretical receipts on capital income were equal to 40% of actual receipts (this
reflects the fact capital income is under-reported in surveys), and that the
corresponding figure was over 120% for business income and wage income. The
latter figure could be interpreted as saying that business income and wage income
have an excellent reporting rate in household surveys, and that the tax law is
reasonably well applied: almost all business income earners and wage earners who
are supposed to pay the income tax do pay it and are charged the right rate.
Such an interpretation might be misleading, however. There are good reasons to
believe that top business incomes and top wages are under-reported in NSB
household surveys, in which case the fact that theoretical receipts (based upon
under-reported top business incomes and wages) and actual receipts coincide
merely reflects the fact that collection rate is much less than 100%. If we adjust top
survey wages and business incomes so as to obtain reasonable Pareto coefficients
for the distribution,18 we find that theoretical receipts for wage and business income
are equal to 170%-180% of actual receipts (see Table 3), i.e. the tax collection rate
for wage and business income is less than 60%. Although the problem is probably
less severe than what many observers tend to assume, these illustrative (and highly
18 In order to obtain Pareto coefficients in line with what we observe in the most egalitarian Western countries, NSB coefficients (and therefore top decile wages and business income) need to be raised by about 20%: the Pareto coefficient is around 1,4 in Chinese survey tabulations in the early 2000s, while it is at least in 1,6-1,7 in Western countries. This is of course purely illustrative, as we have no reason to believe that the true Chinese Pareto coefficient is the same as in the West.
14
uncertain) computations suggest that there does exist a tax collection problem in
China.
It is also interesting to note that actual receipts have increased at a significantly
higher rate than theoretical receipts during the 1996-2001 period. One interpretation
could be that tax collection has improved. Another interpretation is that household
surveys underestimate not only the levels of top incomes, but also the upward trend
in top income shares. In order to get a sense of the likely magnitude of this effect, we
computed by how much the upward trend in top income shares needs to be scaled
up in order to ensure that the trend in theoretical receipts does match the trend in
actual receipts. We find that the 2001 top 1% share should be scaled up by about
35% relatively to the top 1% share in 1996, which is substantial.
Insert Figure 9: : Simulated vs. Actual Income Tax Revenues in China, 1996-2003
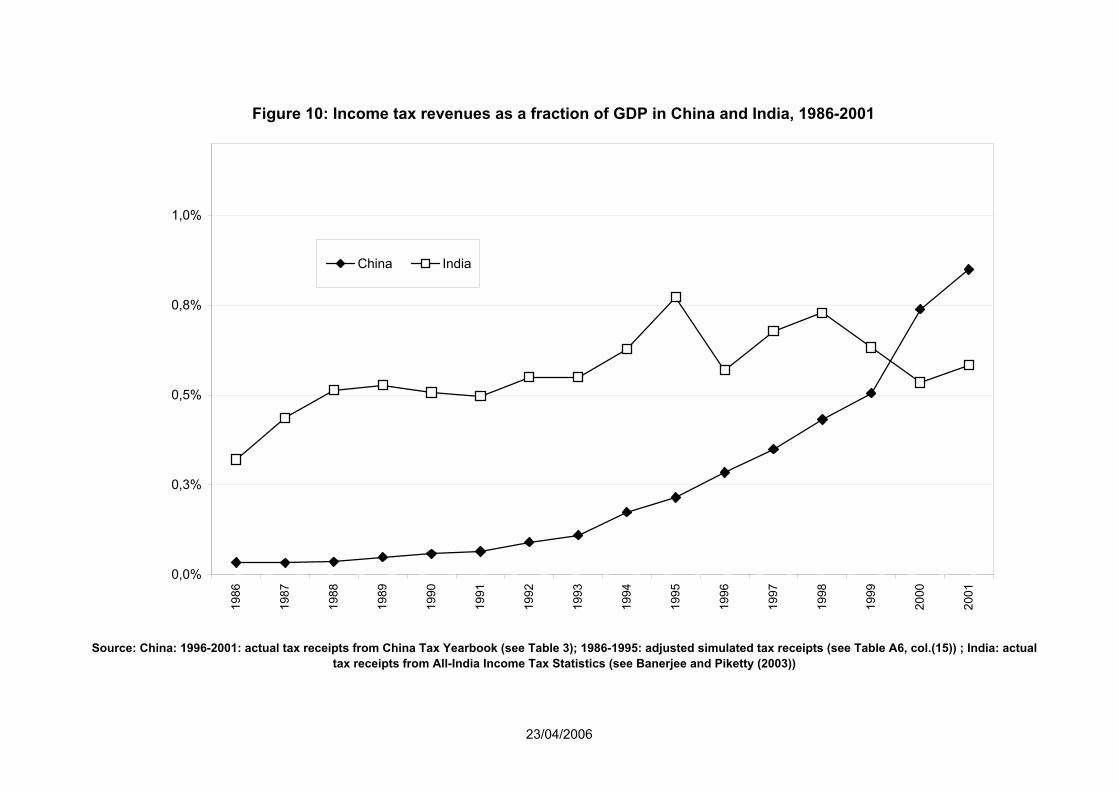
Although there is some uncertainty about the quality of tax collection and survey
data, actual and theoretical tax receipts both show that income tax receipts (as a
fraction of GDP) have increased substantially during the 1990s and 2000s. The
contrast with India is particularly striking: while Indian income tax revenues have
stagnated around 0,5%-0,6% of GDP during the 1990s, Chinese income tax
revenues have been multiplied by more than 10, from less than 0,1% of GDP in the
early 1990s to over 1,2% of GDP in 2003 (see Figure 10). The stagnation of Indian
tax revenues reflects the fact that tax rates have been continuously reduced (see
Table 2) and that the proportion of individuals subject to tax has increased only
modestly (see Figure 7). The substantial rise in Chinese tax revenues reflects the
facts that tax rates have remained the same (see Table 1) and that the proportion of
individuals subject to tax has increased enormously (see Figure 7).
Insert Figure 10: Income tax revenues as a fraction of GDP in China and India, 1986-
2001
Note that Chinese tax revenues would be substantially larger in the absence of a
preferential tax treatment given to top wage earners over top business and capital
income earners. We computed that if the business income tax schedule was applied
to wage income as well, then Chinese income tax revenues in 2001 would be more
15
than 3% of GDP (instead of 1%). Although this preferential tax treatment of wage
income might raise serious political problems in the medium run (as independent
workers feel more and more disadvantaged as compared to top wage earners in
large firms), as it did in other countries where similar preferential tax treatment was
applied, removing this legal provision is however unnecessary to ensure the growth
of Chinese income tax revenues. Because of the phenomenal growth in average
incomes (and even more so of top incomes), income tax revenues should make
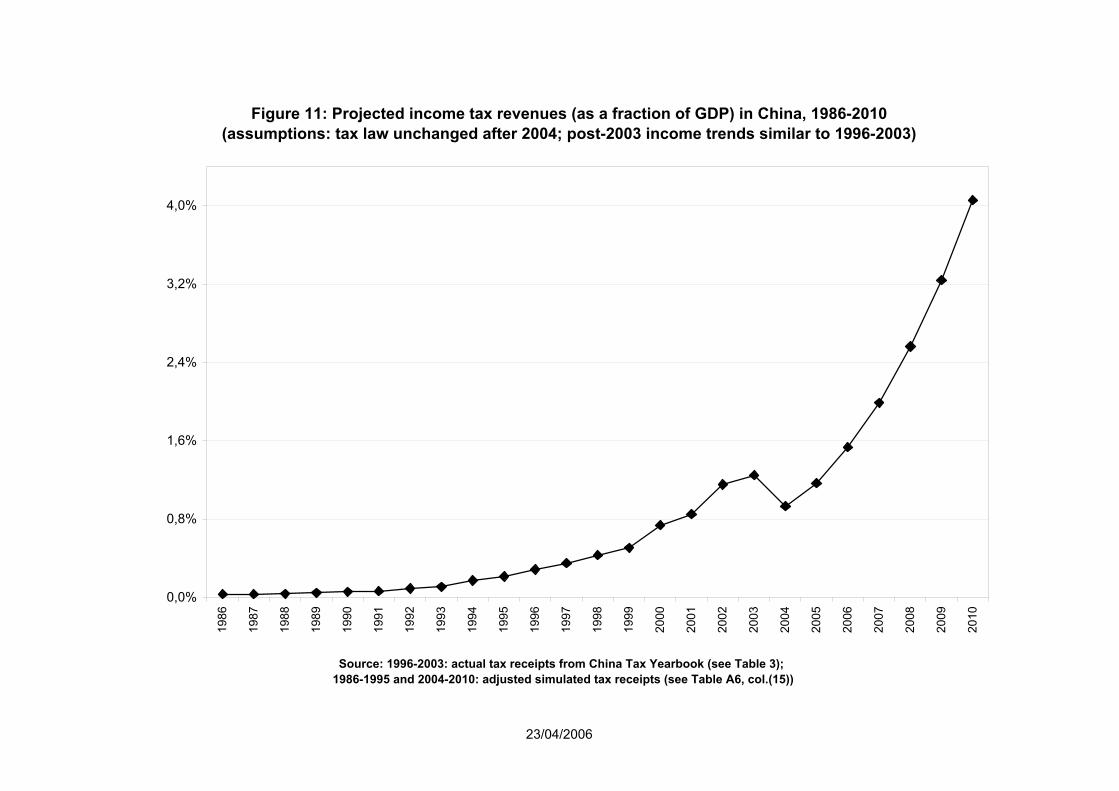
much more than 1% of GDP in 2010. According to our projections, which are based
on the assumption that tax law will not be changed after 2004 and that income trends
will remain the same as in the 1996-2003 period, income tax revenues in China
should make about 4,1% in GDP by 2010 (see Figure 11).19
The assumption that the exemption threshold will not be raised in the short run does
not seem unreasonable, given that the 2004 increase in the exemption threshold was
fairly high (from 12 000 to 14 400 yuans, i.e. 20%) and that inflation is currently very
close to 0%. Moreover our projected tax revenues estimates should be viewed as a
lower bound, first because we assumed that the survey-based trends and levels in
top shares were not under-estimated (in particular we did not make the adjustment
reported on Figure 9), and next because we assumed that there would be no
improvement in tax collection. In other words, there are good reasons to believe that
the income tax will raise at least 4% of GDP in China by 2010.
Insert Figure 11: Projected income tax revenues (as a fraction of GDP) in China,
1986-2010
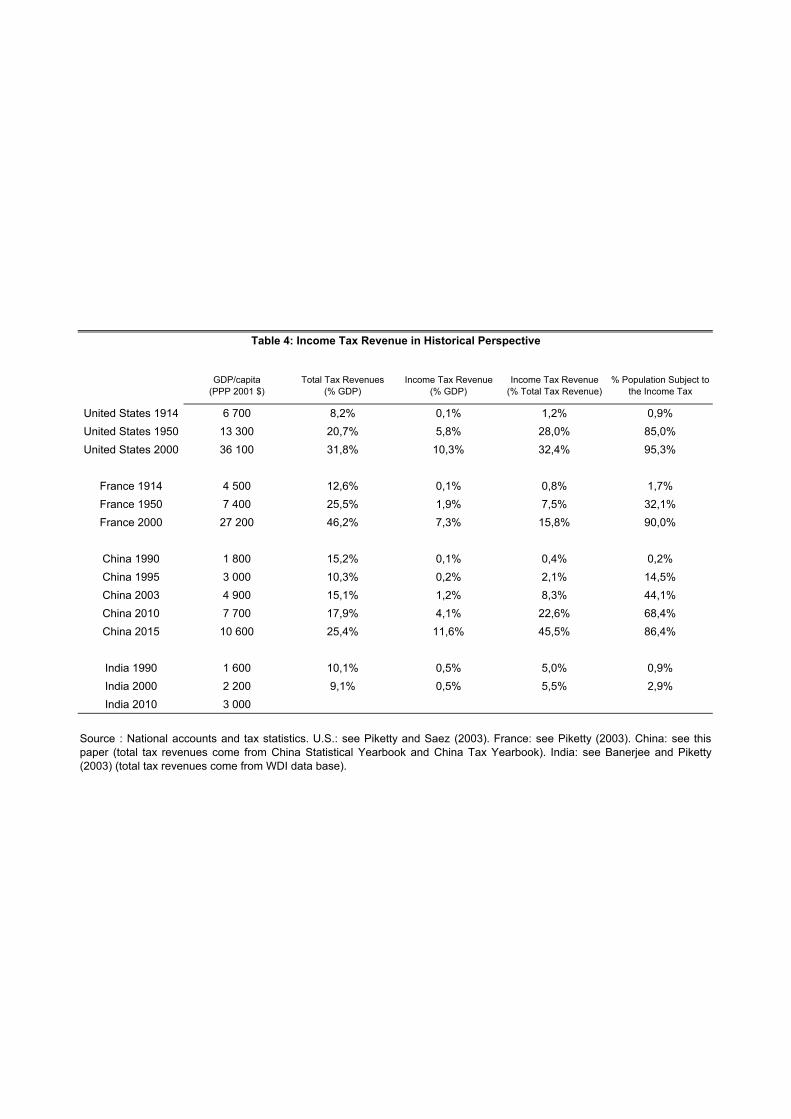
If this happens, then China will have gone through its fiscal revolution. As Table 4
illustrates, moving from an elite income tax raising less than 1% of GDP to a mass
income tax raising around 4-5% of GDP is exactly the kind of process through which
Western countries have gone during the 1914-1950 period (when their income levels
were similar to current Chinese levels). Although Indian income tax revenues will
probably increase during the coming years, the prospects for India look less good,
both because of lower income growth and higher bracket indexation. One reason 19 We did not make similar projections for India, first because it depends a lot on how tax law will evolve (if exemption levels are increased as much as during the 1990s, then revenues won’t increase very much), next because available income data is poorer than in China (we do not know much about incomes immediately below the current exemption threshold).
16
why India faces more difficulties than China in making its income tax a mass tax
might also be that the proportion of formal wage earners in the labor force is
ridiculously low in India.20
Insert Table 4: Income tax development in historical perspective
Finally, note that according to our projections Chinese income tax revenues will
exceed 10% of GDP by 2015, with over 85% of the urban workforce paying the
income tax. This is again assuming fixed income trends, and most importantly no
nominal change in income tax schedules until 2015, which seems very unlikely over
such a long time period. As the income tax becomes larger and starts hitting the
majority of the population, it is likely that the Chinese authorities will need to start
adjusting exemption thresholds and tax brackets in line with inflation and real growth. 5. Concluding comments
One might be tempted to conclude from this paper that the high growth performance
of the Chinese economy is going to solve every problem, including the fiscal
modernization problem, and that there is nothing else to worry about. We indeed
found that due to high income growth and low bracket indexation, income tax
revenues are currently booming in China, and that they should exceed 4% of GDP by
2010 (assuming constant tax law and income trends). The prospects look much less
promising in India, where the income tax will probably will probably remain an elite
tax (rather than a mass tax) in the coming years.
The main conclusion that we draw from this paper, however, is that there is a lot
policy makers and economists can do in order to improve the functioning and
implications of progressive income taxation in countries like China and India. Given
that income taxation is about to become something big, it is urgent to put income tax
reform at the top of the policy agenda. For instance, China will not be able to under-
index its exemption threshold forever, and the preferential tax treatment of wage
earners will need to be addressed at some point. Next, there is clearly a problem with
income tax collection in China (although our estimates suggest that it is less massive
20 See e.g. Tendulkar (2003).
17
than what it sometimes assumed). At the very least, China’s tax authorities should
start compiling and publishing detailed income tax tabulations by income bracket and
tax liability (which every other country in the world with an income tax actually does),
so that the tax collection problem can be properly evaluated and addressed.
References
A. Banerjee and A. Newman (2003), “Inequality, Growth and Trade Policy”, mimeo,
2003
A. Banerjee and T. Piketty, “Top Indian Incomes, 1922-2000”, CEPR Working Paper
4632 (2004)
A. Banerjee and T. Piketty, “Top Indian Incomes, 1922-2000”, World Bank Economic
Review 19, 1-20 (2005)
S. Chen and Y. Wang, “China’s Growth and Poverty Reduction: Recent Trends
between 1990 and 1999”, mimeo, World Bank, 2001
A. Deaton, “Adjusted Indian Poverty Estimates for 1999-2000”, Economic and Political Weekly, January 25, 2003
R. Eckaus, A. Lester and N. Qian, “Income Inequality in a Transitional Economy:
China as a Case Study”, mimeo, MIT, 2003
M. Kremer and E. Maskin, “Globalization and Inequality”, mimeo, Harvard, 2003
Piketty, Thomas (2003), “Income Inequality in France, 1901-1998”, Journal of
Political Economy 111, 1004-1042
Piketty, Thomas and Emmanuel Saez (2003), “Income Inequality in the United
States, 1913-1998”, Quarterly Journal of Economics 118, 1-39
18
M. Ravallion and S. Chen, “When Economic Reform is Faster than Statistical Reform:
Measuring and Explaining Income Inequality in Rural China”, mimeo, World Bank,
2003
S. Tendulkar, “Organized Labour Market in India – Pre and Post Reform”, mimeo,
Delhi School of Economics, 2003
S.J. Wei and Y. Wu, “Globalization and Inequality: Evidence from Within China”,
NBER Working Paper 8611 (2001)
23/04/2006
Figure 1 : Real per capita GDP in China and India, 1986-2001 (1986 = 100)
90
100
110
120
130
140
150
160
170
180
190
200
210
220
230
240
250
260
1986
1987
1988
1989
1990
1991
1992
1993
1994
1995
1996
1997
1998
1999
2000
2001
Source: Authors' computations using national accounts (see Table A0, col. (5) and (16))
China India
23/04/2006
Figure 2 : The top 10% income share in China, 1986-2003
17%
19%
21%
23%
25%
27%
29%
1986
1987
1988
1989
1990
1991
1992
1993
1994
1995
1996
1997
1998
1999
2000
2001
2002
2003
Source: Authors' computations using urban household surveys tabulations (Table A5, col. (1), ind.income)
Top 10% share
23/04/2006
Figure 3 : The top 1% income share in China and India, 1986-2001
0%
1%
2%
3%
4%
5%
6%
7%
8%
9%
10%
1986
1987
1988
1989
1990
1991
1992
1993
1994
1995
1996
1997
1998
1999
2000
2001
Source: China: authoss' computations using urban household surveys tabulations (Table A5, col. (4), ind. distribution) ; India: auhors' computations using income tax returns data (see Banerjee and Piketty (2003, Table A3, col.(1)))
Top 1% share (China)
Top 1% share (India)
23/04/2006
Figure 4 : The top 1% income share in China and India, 1986-2001 (1986 = 100)
90
100
110
120
130
140
150
160
170
180
190
200
1986
1987
1988
1989
1990
1991
1992
1993
1994
1995
1996
1997
1998
1999
2000
2001
Source: China: authors' computations using urban household surveys tabulations (Table A5, col. (4), ind. distribution) ; India: authors' computations using income tax returns data (see Banerjee and Piketty (2003, Table A3, col.(1)))
Top 1% share (China)
Top 1% share (India)
23/04/2006
Figure 5: Income tax exemption threshold, average income and P99 threshold in China, 1986-2003(current yuans)
0
4 000
8 000
12 000
16 000
20 000
24 000
28 000
32 000
36 000
40 000
44 000
48 000
52 000
56 000
1986
1987
1988
1989
1990
1991
1992
1993
1994
1995
1996
1997
1998
1999
2000
2001
2002
2003
Source: Exemption threshold: Chinese tax law (see Table 1); average income and P99 threshold: authors' computations using urban household surveys tabulations (Table A1, col. (10), and Table A4, col. (15))
Income tax exemptionthresholdAverage individual incomeP99 threshold
23/04/2006
Figure 6: Income tax exemption threshold, average income and P99 threshold in India, 1986-2001(current Rs)
0
10 000
20 000
30 000
40 000
50 000
60 000
70 000
80 000
90 000
100 000
1986
1987
1988
1989
1990
1991
1992
1993
1994
1995
1996
1997
1998
1999
2000
2001
Source: Exemption threshold: Indian tax law (see Table 2); average income and P99 threshold: authors' computations using national accounts and income tax returns data (see Banerjee and Piketty (2003, Table A0, col. (7), and Table A1, col. (9))
Income tax exemptionthresholdAverage individual incomeP99 threshold
23/04/2006
Figure 7: The fraction of individuals subject to the income tax in China and India, 1986-2001 (fraction of urban wage earners for China; fraction of all tax units for India)
0%
4%
8%
12%
16%
20%
24%
28%
32%
36%
1986
1987
1988
1989
1990
1991
1992
1993
1994
1995
1996
1997
1998
1999
2000
2001
Source: China: authors' computations using urban household surveys tabulations (Table A6, col. (1)) (fraction of urban wage earners subject to tax); India: authors' computations using tax returns data (see Banerjee and Piketty (2003, Table A0, col.(4)))
China (simulated)
India (observed)
23/04/2006
Figure 8: Projected fraction of urban wage earners subject to the income tax in China, 1986-2015(assumptions: tax law unchanged after 2004; post-2003 income trends similar to 1996-2003)
0%
10%
20%
30%
40%
50%
60%
70%
80%
90%
1986
1987
1988
1989
1990
1991
1992
1993
1994
1995
1996
1997
1998
1999
2000
2001
2002
2003
2004
2005
2006
2007
2008
2009
2010
2011
2012
2013
2014
2015
Source: Authors' computations using urban household surveys tabulations (Table A6, col. (1))
23/04/2006
Figure 9: Simulated vs actual income tax revenues as a fraction of GDP in China, 1996-2003
0,0%
0,2%
0,4%
0,6%
0,8%
1,0%
1,2%
1,4%
1996
1997
1998
1999
2000
2001
2002
2003
Source: Actual tax receipts from China Tax Yearbook; Simulated tax receipts were computed by applying income tax schedules to household survey income data (see Table 3)
Actual receipts
Simulated receipts
23/04/2006
Figure 10: Income tax revenues as a fraction of GDP in China and India, 1986-2001
0,0%
0,3%
0,5%
0,8%
1,0%1986
1987
1988
1989
1990
1991
1992
1993
1994
1995
1996
1997
1998
1999
2000
2001
Source: China: 1996-2001: actual tax receipts from China Tax Yearbook (see Table 3); 1986-1995: adjusted simulated tax receipts (see Table A6, col.(15)) ; India: actual tax receipts from All-India Income Tax Statistics (see Banerjee and Piketty (2003))
China India
23/04/2006
Figure 11: Projected income tax revenues (as a fraction of GDP) in China, 1986-2010(assumptions: tax law unchanged after 2004; post-2003 income trends similar to 1996-2003)
0,0%
0,8%
1,6%
2,4%
3,2%
4,0%1986
1987
1988
1989
1990
1991
1992
1993
1994
1995
1996
1997
1998
1999
2000
2001
2002
2003
2004
2005
2006
2007
2008
2009
2010
Source: 1996-2003: actual tax receipts from China Tax Yearbook (see Table 3);1986-1995 and 2004-2010: adjusted simulated tax receipts (see Table A6, col.(15))
0-9600 0% 0-12000 0% 0-14400 0% 0-5000 5%
9600-15600 5% 12000-18000 5% 14400-20400 5% 5000-10000 10%
15600-33600 10% 18000-36000 10% 20400-38400 10% 10000-30000 15%
33600-69600 15% 36000-72000 15% 38400-74400 15% 30000-50000 20%
69600-249600 20% 72000-252000 20% 74400-254400 20% 50000- 35%
249600-489600 25% 252000-492000 25% 254400-494400 25%
489600-729600 30% 492000-732000 30% 494400-734400 30%
729600-969600 35% 732000-972000 35% 734400-974400 35%
969600-1209600 40% 972000-1212000 40% 974400-1214400 40%
over 1209600 45% over 1212000 45% over 1214400 45%
Brackets of annual income (yuans)
Marginal tax rate
Wage incomeBusiness income (1980-)
Brackets of annual income (yuans)
Marginal tax rate
Note : China's income tax applies to individual income (not to household income). The business income schedule applies to "income fromproduction and business operations derived by individual industrialists and merchants" and "income from contracted or leased operation ofenterprises and institutions". Most forms of transfer income are exempt from the income tax. Capital income (interest, dividends, royalties, rent,etc.) has always been taxed at a flat 20% rate (with no allowance), although there are some exemptions (interest income on saving depositsand national debt is exempt from income tax). Agricultural income is excluded from the income tax (peasants are subject to a separate, indirectincome tax based on average yields). The exemption thresholds for wage earners reported on this table (9600 yuans in 1980-1998, 12000yuans in 1999-2003, and 14400 yuans since 2004) are those applied in Beijing. The thresholds applied in other regions can be slightly different(e.g. in Shanghai the threshold was 9600 yuans until 1993, 12000 yuans in 1994-1998, and 14400 yuans since 1999).
Table 1: Progressive Income Tax Schedules in China, 1980-2004
Brackets of annual income (yuans)
Marginal tax rate
1980-1998 1999-2003
Brackets of annual income (yuans)
Marginal tax rate
2004-

0-15000 0% 0-18000 0% 0-18000 0% 0-22000 0%
15000-20000 20% 18000-25000 25% 18000-25000 20% 22000-30000 20%
20000-25000 25% 25000-50000 30% 25000-50000 30% 30000-60000 30%
25000-30000 30% 50000-100000 40% 50000-100000 40% 60000-100000 40%
30000-40000 35% over 100000 50% over 100000 50% over 100000 50%
40000-50000 40%
50000-70000 45%
70000-100000 50%
over 100000 55%
0-28000 0% 0-30000 0% 0-40000 0% 0-40000 0%
50000-100000 20% 50000-100000 20% 40000-60000 20% 40000-60000 15%
50000-100000 30% 50000-100000 30% 60000-120000 30% 60000-120000 30%
over 100000 40% over 100000 40% over 120000 40% over 120000 40%
0-40000 0% 0-50000 0%
40000-60000 10% 50000-60000 10%
60000-150000 20% 60000-150000 20%
over 150000 30% over 150000 30%
Table 2: Progressive Income Tax Schedules in India, 1986-2004
Brackets of annual income (Rs)
Marginal tax rate
1986-1988 1989-1990
Brackets of annual income (Rs)
Marginal tax rate
1991 1992-1993
Brackets of annual income (Rs)
Marginal tax rate
Note : India's income tax applies to individual income, not to household income (except for Hindu Undivided Families). The generalprinciple is that all income sources are subject to the same tax rates (the progressive tax schedule applies to the sum of all individualincomes, whatever the source). There are however special exemptions for particular forms of interest income, transfer income, etc. Thetax schedules reported on this table do not include "temporary" tax surcharges (for instance, a 10% tax surcharge has been applied to allincomes above 60000 Rs since 2000, so that the effective top rate is 33% rather than 30%).
1996-1997 1998
Brackets of annual income (Rs)
Marginal tax rate
Brackets of annual income (Rs)
Marginal tax rate
Brackets of annual income (Rs)
Marginal tax rate
1999 2000-
Brackets of annual income (Rs)
Marginal tax rate
Brackets of annual income (Rs)
Marginal tax rate
1994 1995
Brackets of annual income (Rs)
Marginal tax rate
Brackets of annual income (Rs)
Marginal tax rate
(% GDP)
1996 19,3 0,28%1997 26,0 0,35%1998 33,9 0,43%1999 41,4 0,51%2000 66,0 28,3 13,3 19,0 5,5 0,74%2001 99,6 41,1 16,0 34,8 7,7 1,02%2002 121,1 56,1 18,5 38,4 8,0 1,15%2003 141,7 74,1 20,0 38,2 9,3 1,21%
(% GDP)
1996 22,2 12,0 2,2 8,0 0,33%1997 32,0 18,6 3,3 10,0 0,43%1998 37,6 22,1 4,0 11,4 0,48%1999 36,5 19,7 4,9 11,9 0,45%2000 48,5 28,0 8,3 12,2 0,54%2001 63,7 39,6 10,3 13,8 0,66%2002 88,8 62,0 16,8 10,0 0,84%2003 132,4 93,2 24,3 14,9 1,13%
2003b 213,3 131,4 34,3 38,2 9,3 1,82%
1996 115% *
1997 123%1998 111%1999 88%2000 73% 99% 63% 64%2001 64% 96% 64% 40%2002 73% 110% 91% 26%2003 93% 126% 122% 39%
2003b 151% 177% 172% 100% 100%
(billions current yuans)
Note: Simulated receipts for 1996-2003 have been computed by applying the relevant tax schedule to the individual distributionof wage income, business income and capital income estimated from urban household survey tabulations and reported onTables A2, A3 and A4. The 2003b estimates have been computed by inflating capital and other income so as to match actualtax receipts, and by inflating survey-based top decile wages and business incomes by 20%, so as to obtain a realistic Paretocoefficient for the wage distribution.
Total Receipts Wage income Receipts
Busines income receipts
Ratio Simulated/Actual Income Tax Revenues
Capital income receipts
Source: Actual receipts: China Tax Yearbook, various issues (1997-2004); Simulated receipts: authors' computations usingurban household surveys tabulations (see Table A6)
Table 3: Simulated vs Actual Income Tax Revenues in China, 1996-2003
Other receipts
(billions current yuans)
Actual Income Tax Revenues
Total Receipts Wage income Receipts
Busines income receipts
Capital income receipts Total Receipts
Simulated Income Tax Revenues
Total Receipts Wage income Receipts
Busines income receipts
Capital income receipts Total ReceiptsOther receipts
United States 1914 6 700 8,2% 0,1% 1,2% 0,9%United States 1950 13 300 20,7% 5,8% 28,0% 85,0%United States 2000 36 100 31,8% 10,3% 32,4% 95,3%
France 1914 4 500 12,6% 0,1% 0,8% 1,7%France 1950 7 400 25,5% 1,9% 7,5% 32,1%France 2000 27 200 46,2% 7,3% 15,8% 90,0%
China 1990 1 800 15,2% 0,1% 0,4% 0,2%China 1995 3 000 10,3% 0,2% 2,1% 14,5%China 2003 4 900 15,1% 1,2% 8,3% 44,1%China 2010 7 700 17,9% 4,1% 22,6% 68,4%China 2015 10 600 25,4% 11,6% 45,5% 86,4%
India 1990 1 600 10,1% 0,5% 5,0% 0,9%India 2000 2 200 9,1% 0,5% 5,5% 2,9%India 2010 3 000
Source : National accounts and tax statistics. U.S.: see Piketty and Saez (2003). France: see Piketty (2003). China: see thispaper (total tax revenues come from China Statistical Yearbook and China Tax Yearbook). India: see Banerjee and Piketty(2003) (total tax revenues come from WDI data base).
Table 4: Income Tax Revenue in Historical Perspective
GDP/capita (PPP 2001 $)
Total Tax Revenues (% GDP)
Income Tax Revenue (% GDP)
% Population Subject to the Income Tax
Income Tax Revenue (% Total Tax Revenue)
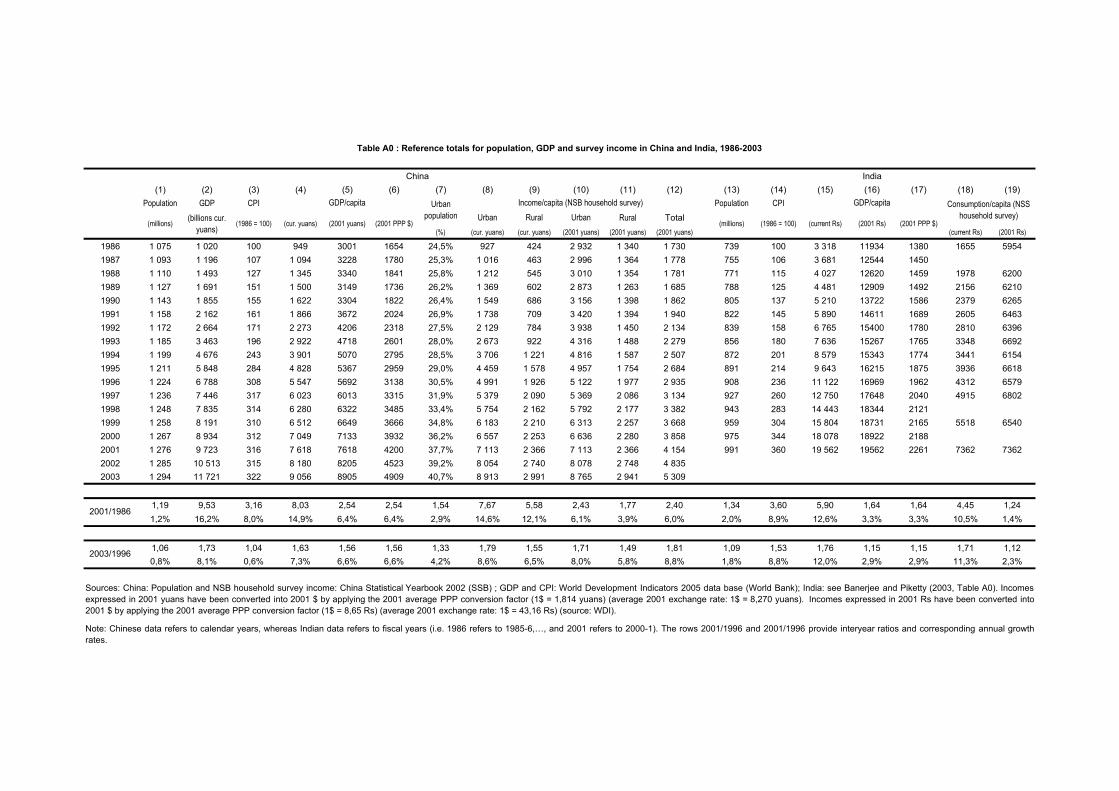
(1) (2) (3) (4) (5) (6) (7) (8) (9) (10) (11) (12) (13) (14) (15) (16) (17) (18) (19)Population GDP CPI Population CPI
Urban Rural Urban Rural Total(%) (cur. yuans) (cur. yuans) (2001 yuans) (2001 yuans) (2001 yuans) (current Rs) (2001 Rs)
1986 1 075 1 020 100 949 3001 1654 24,5% 927 424 2 932 1 340 1 730 739 100 3 318 11934 1380 1655 59541987 1 093 1 196 107 1 094 3228 1780 25,3% 1 016 463 2 996 1 364 1 778 755 106 3 681 12544 14501988 1 110 1 493 127 1 345 3340 1841 25,8% 1 212 545 3 010 1 354 1 781 771 115 4 027 12620 1459 1978 62001989 1 127 1 691 151 1 500 3149 1736 26,2% 1 369 602 2 873 1 263 1 685 788 125 4 481 12909 1492 2156 62101990 1 143 1 855 155 1 622 3304 1822 26,4% 1 549 686 3 156 1 398 1 862 805 137 5 210 13722 1586 2379 62651991 1 158 2 162 161 1 866 3672 2024 26,9% 1 738 709 3 420 1 394 1 940 822 145 5 890 14611 1689 2605 64631992 1 172 2 664 171 2 273 4206 2318 27,5% 2 129 784 3 938 1 450 2 134 839 158 6 765 15400 1780 2810 63961993 1 185 3 463 196 2 922 4718 2601 28,0% 2 673 922 4 316 1 488 2 279 856 180 7 636 15267 1765 3348 66921994 1 199 4 676 243 3 901 5070 2795 28,5% 3 706 1 221 4 816 1 587 2 507 872 201 8 579 15343 1774 3441 61541995 1 211 5 848 284 4 828 5367 2959 29,0% 4 459 1 578 4 957 1 754 2 684 891 214 9 643 16215 1875 3936 66181996 1 224 6 788 308 5 547 5692 3138 30,5% 4 991 1 926 5 122 1 977 2 935 908 236 11 122 16969 1962 4312 65791997 1 236 7 446 317 6 023 6013 3315 31,9% 5 379 2 090 5 369 2 086 3 134 927 260 12 750 17648 2040 4915 68021998 1 248 7 835 314 6 280 6322 3485 33,4% 5 754 2 162 5 792 2 177 3 382 943 283 14 443 18344 21211999 1 258 8 191 310 6 512 6649 3666 34,8% 6 183 2 210 6 313 2 257 3 668 959 304 15 804 18731 2165 5518 65402000 1 267 8 934 312 7 049 7133 3932 36,2% 6 557 2 253 6 636 2 280 3 858 975 344 18 078 18922 21882001 1 276 9 723 316 7 618 7618 4200 37,7% 7 113 2 366 7 113 2 366 4 154 991 360 19 562 19562 2261 7362 73622002 1 285 10 513 315 8 180 8205 4523 39,2% 8 054 2 740 8 078 2 748 4 8352003 1 294 11 721 322 9 056 8905 4909 40,7% 8 913 2 991 8 765 2 941 5 309
1,19 9,53 3,16 8,03 2,54 2,54 1,54 7,67 5,58 2,43 1,77 2,40 1,34 3,60 5,90 1,64 1,64 4,45 1,241,2% 16,2% 8,0% 14,9% 6,4% 6,4% 2,9% 14,6% 12,1% 6,1% 3,9% 6,0% 2,0% 8,9% 12,6% 3,3% 3,3% 10,5% 1,4%
1,06 1,73 1,04 1,63 1,56 1,56 1,33 1,79 1,55 1,71 1,49 1,81 1,09 1,53 1,76 1,15 1,15 1,71 1,120,8% 8,1% 0,6% 7,3% 6,6% 6,6% 4,2% 8,6% 6,5% 8,0% 5,8% 8,8% 1,8% 8,8% 12,0% 2,9% 2,9% 11,3% 2,3%
GDP/capita
(2001 PPP $) (1986 = 100)
2001/1986
Table A0 : Reference totals for population, GDP and survey income in China and India, 1986-2003
IndiaChina
(current Rs) (2001 Rs) (2001 PPP $)
Urban population
GDP/capita Income/capita (NSB household survey) Consumption/capita (NSS household survey)
Note: Chinese data refers to calendar years, whereas Indian data refers to fiscal years (i.e. 1986 refers to 1985-6,…, and 2001 refers to 2000-1). The rows 2001/1996 and 2001/1996 provide interyear ratios and corresponding annual growthrates.
(billions cur. yuans)
(millions) (millions)(1986 = 100) (cur. yuans) (2001 yuans)
Sources: China: Population and NSB household survey income: China Statistical Yearbook 2002 (SSB) ; GDP and CPI: World Development Indicators 2005 data base (World Bank); India: see Banerjee and Piketty (2003, Table A0). Incomesexpressed in 2001 yuans have been converted into 2001 $ by applying the 2001 average PPP conversion factor (1$ = 1,814 yuans) (average 2001 exchange rate: 1$ = 8,270 yuans). Incomes expressed in 2001 Rs have been converted into2001 $ by applying the 2001 average PPP conversion factor (1$ = 8,65 Rs) (average 2001 exchange rate: 1$ = 43,16 Rs) (source: WDI).
2003/1996
(1) (2) (3) (4) (5) (6) (7) (8) (9) (10) (11) (12) (13) (14) (15)
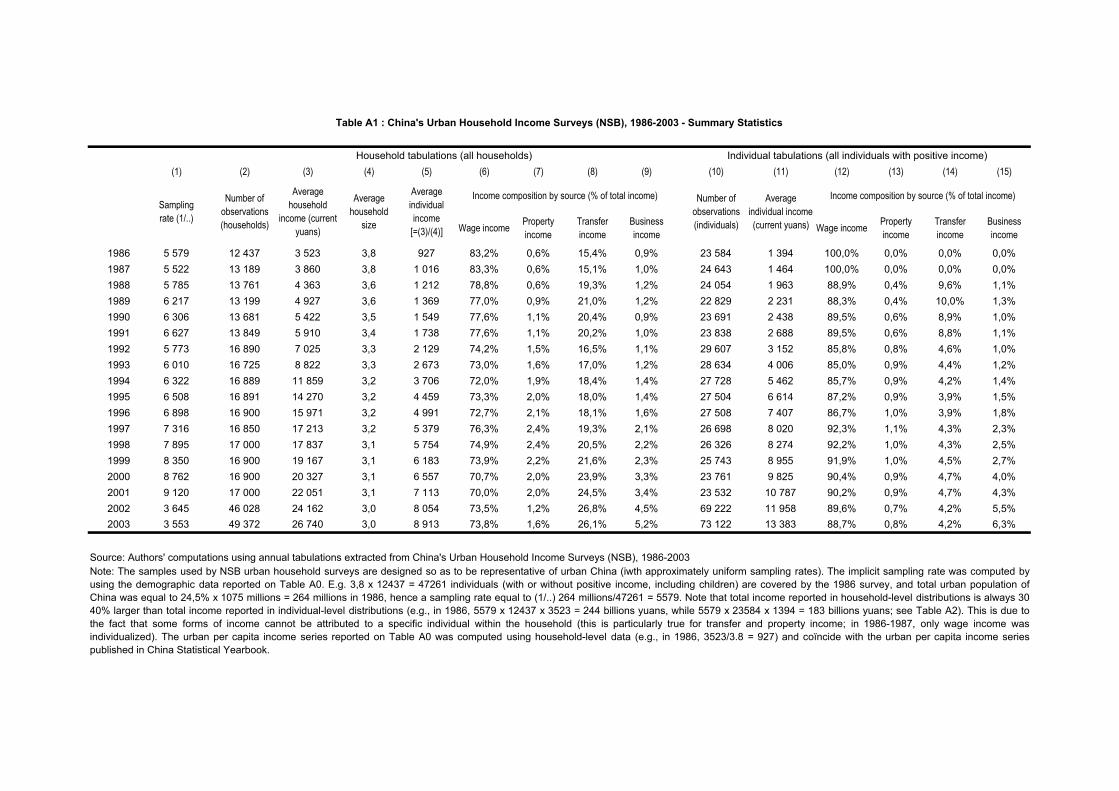
1986 5 579 12 437 3 523 3,8 927 83,2% 0,6% 15,4% 0,9% 23 584 1 394 100,0% 0,0% 0,0% 0,0%1987 5 522 13 189 3 860 3,8 1 016 83,3% 0,6% 15,1% 1,0% 24 643 1 464 100,0% 0,0% 0,0% 0,0%1988 5 785 13 761 4 363 3,6 1 212 78,8% 0,6% 19,3% 1,2% 24 054 1 963 88,9% 0,4% 9,6% 1,1%1989 6 217 13 199 4 927 3,6 1 369 77,0% 0,9% 21,0% 1,2% 22 829 2 231 88,3% 0,4% 10,0% 1,3%1990 6 306 13 681 5 422 3,5 1 549 77,6% 1,1% 20,4% 0,9% 23 691 2 438 89,5% 0,6% 8,9% 1,0%1991 6 627 13 849 5 910 3,4 1 738 77,6% 1,1% 20,2% 1,0% 23 838 2 688 89,5% 0,6% 8,8% 1,1%1992 5 773 16 890 7 025 3,3 2 129 74,2% 1,5% 16,5% 1,1% 29 607 3 152 85,8% 0,8% 4,6% 1,0%1993 6 010 16 725 8 822 3,3 2 673 73,0% 1,6% 17,0% 1,2% 28 634 4 006 85,0% 0,9% 4,4% 1,2%1994 6 322 16 889 11 859 3,2 3 706 72,0% 1,9% 18,4% 1,4% 27 728 5 462 85,7% 0,9% 4,2% 1,4%1995 6 508 16 891 14 270 3,2 4 459 73,3% 2,0% 18,0% 1,4% 27 504 6 614 87,2% 0,9% 3,9% 1,5%1996 6 898 16 900 15 971 3,2 4 991 72,7% 2,1% 18,1% 1,6% 27 508 7 407 86,7% 1,0% 3,9% 1,8%1997 7 316 16 850 17 213 3,2 5 379 76,3% 2,4% 19,3% 2,1% 26 698 8 020 92,3% 1,1% 4,3% 2,3%1998 7 895 17 000 17 837 3,1 5 754 74,9% 2,4% 20,5% 2,2% 26 326 8 274 92,2% 1,0% 4,3% 2,5%1999 8 350 16 900 19 167 3,1 6 183 73,9% 2,2% 21,6% 2,3% 25 743 8 955 91,9% 1,0% 4,5% 2,7%2000 8 762 16 900 20 327 3,1 6 557 70,7% 2,0% 23,9% 3,3% 23 761 9 825 90,4% 0,9% 4,7% 4,0%2001 9 120 17 000 22 051 3,1 7 113 70,0% 2,0% 24,5% 3,4% 23 532 10 787 90,2% 0,9% 4,7% 4,3%2002 3 645 46 028 24 162 3,0 8 054 73,5% 1,2% 26,8% 4,5% 69 222 11 958 89,6% 0,7% 4,2% 5,5%2003 3 553 49 372 26 740 3,0 8 913 73,8% 1,6% 26,1% 5,2% 73 122 13 383 88,7% 0,8% 4,2% 6,3%
Note: The samples used by NSB urban household surveys are designed so as to be representative of urban China (iwth approximately uniform sampling rates). The implicit sampling rate was computed byusing the demographic data reported on Table A0. E.g. 3,8 x 12437 = 47261 individuals (with or without positive income, including children) are covered by the 1986 survey, and total urban population ofChina was equal to 24,5% x 1075 millions = 264 millions in 1986, hence a sampling rate equal to (1/..) 264 millions/47261 = 5579. Note that total income reported in household-level distributions is always 30-40% larger than total income reported in individual-level distributions (e.g., in 1986, 5579 x 12437 x 3523 = 244 billions yuans, while 5579 x 23584 x 1394 = 183 billions yuans; see Table A2). This is due tothe fact that some forms of income cannot be attributed to a specific individual within the household (this is particularly true for transfer and property income; in 1986-1987, only wage income wasindividualized). The urban per capita income series reported on Table A0 was computed using household-level data (e.g., in 1986, 3523/3.8 = 927) and coïncide with the urban per capita income seriespublished in China Statistical Yearbook.
Business income
Average individual income (current yuans)
Income composition by source (% of total income)
Wage income Property income
Transfer income
Transfer income
Individual tabulations (all individuals with positive income)
Source: Authors' computations using annual tabulations extracted from China's Urban Household Income Surveys (NSB), 1986-2003
Number of observations (individuals) Business
income
Table A1 : China's Urban Household Income Surveys (NSB), 1986-2003 - Summary Statistics
Sampling rate (1/..)
Number of observations (households)
Average household
income (current yuans)
Average household
size
Income composition by source (% of total income)
Wage income Property income
Average individual income
[=(3)/(4)]
Household tabulations (all households)
(1) (2) (3) (4) (5) (6) (7) (8) (9) (10)
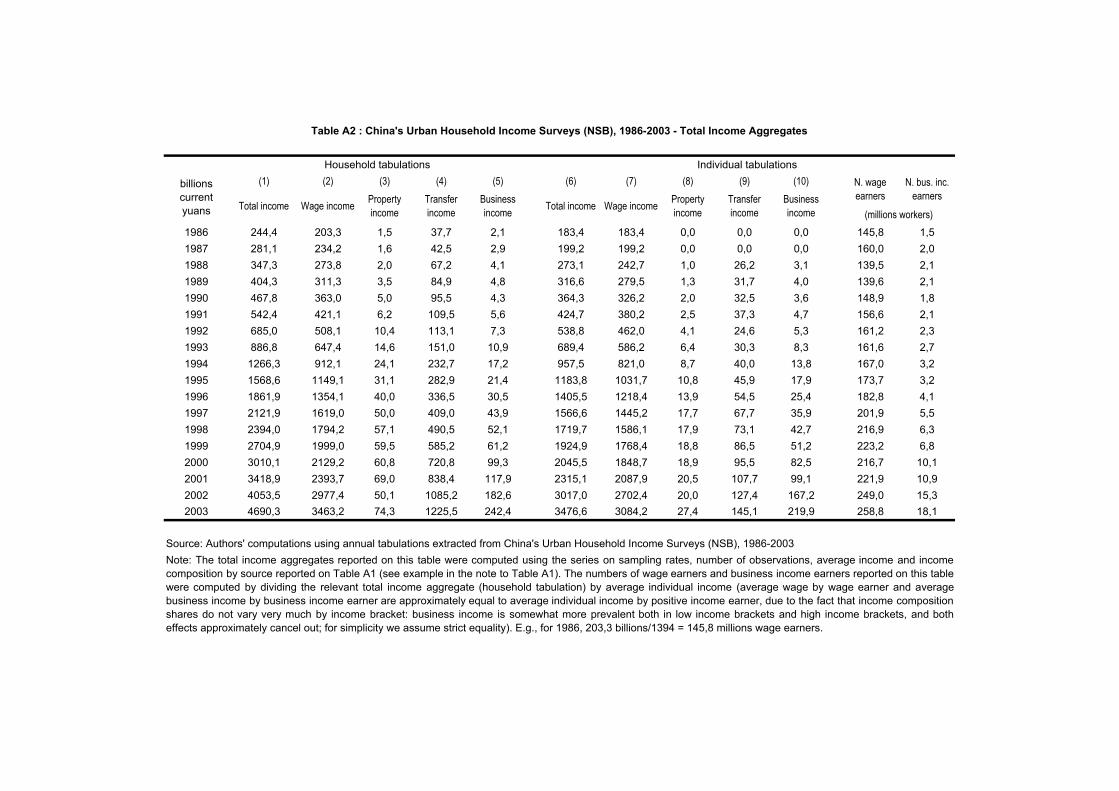
1986 244,4 203,3 1,5 37,7 2,1 183,4 183,4 0,0 0,0 0,0 145,8 1,51987 281,1 234,2 1,6 42,5 2,9 199,2 199,2 0,0 0,0 0,0 160,0 2,01988 347,3 273,8 2,0 67,2 4,1 273,1 242,7 1,0 26,2 3,1 139,5 2,11989 404,3 311,3 3,5 84,9 4,8 316,6 279,5 1,3 31,7 4,0 139,6 2,11990 467,8 363,0 5,0 95,5 4,3 364,3 326,2 2,0 32,5 3,6 148,9 1,81991 542,4 421,1 6,2 109,5 5,6 424,7 380,2 2,5 37,3 4,7 156,6 2,11992 685,0 508,1 10,4 113,1 7,3 538,8 462,0 4,1 24,6 5,3 161,2 2,31993 886,8 647,4 14,6 151,0 10,9 689,4 586,2 6,4 30,3 8,3 161,6 2,71994 1266,3 912,1 24,1 232,7 17,2 957,5 821,0 8,7 40,0 13,8 167,0 3,21995 1568,6 1149,1 31,1 282,9 21,4 1183,8 1031,7 10,8 45,9 17,9 173,7 3,21996 1861,9 1354,1 40,0 336,5 30,5 1405,5 1218,4 13,9 54,5 25,4 182,8 4,11997 2121,9 1619,0 50,0 409,0 43,9 1566,6 1445,2 17,7 67,7 35,9 201,9 5,51998 2394,0 1794,2 57,1 490,5 52,1 1719,7 1586,1 17,9 73,1 42,7 216,9 6,31999 2704,9 1999,0 59,5 585,2 61,2 1924,9 1768,4 18,8 86,5 51,2 223,2 6,82000 3010,1 2129,2 60,8 720,8 99,3 2045,5 1848,7 18,9 95,5 82,5 216,7 10,12001 3418,9 2393,7 69,0 838,4 117,9 2315,1 2087,9 20,5 107,7 99,1 221,9 10,92002 4053,5 2977,4 50,1 1085,2 182,6 3017,0 2702,4 20,0 127,4 167,2 249,0 15,32003 4690,3 3463,2 74,3 1225,5 242,4 3476,6 3084,2 27,4 145,1 219,9 258,8 18,1
Note: The total income aggregates reported on this table were computed using the series on sampling rates, number of observations, average income and incomecomposition by source reported on Table A1 (see example in the note to Table A1). The numbers of wage earners and business income earners reported on this tablewere computed by dividing the relevant total income aggregate (household tabulation) by average individual income (average wage by wage earner and averagebusiness income by business income earner are approximately equal to average individual income by positive income earner, due to the fact that income compositionshares do not vary very much by income bracket: business income is somewhat more prevalent both in low income brackets and high income brackets, and botheffects approximately cancel out; for simplicity we assume strict equality). E.g., for 1986, 203,3 billions/1394 = 145,8 millions wage earners.
Table A2 : China's Urban Household Income Surveys (NSB), 1986-2003 - Total Income Aggregates
Total income
Household tabulations Individual tabulations
Wage income Property income
Transfer income
Business incomeTotal income Property
incomeTransfer incomeWage income
Source: Authors' computations using annual tabulations extracted from China's Urban Household Income Surveys (NSB), 1986-2003
billions current yuans
Business income
N. wage earners
N. bus. inc. earners
(millions workers)
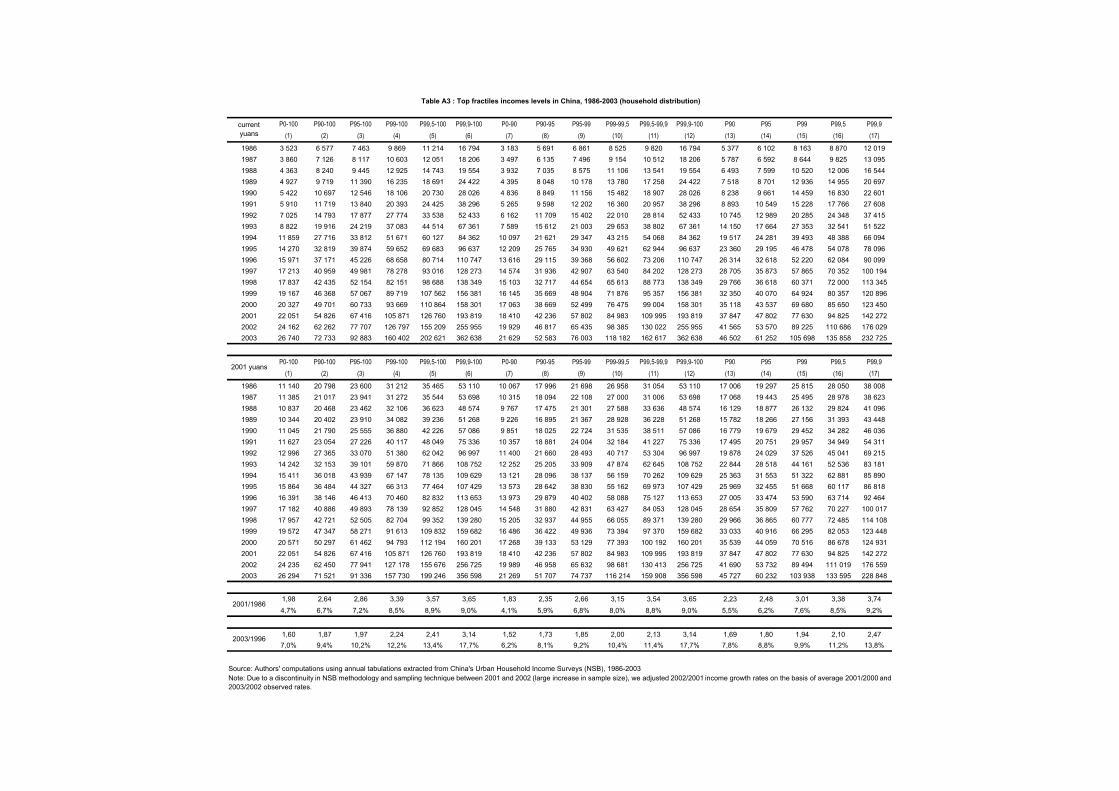
P0-100 P90-100 P95-100 P99-100 P99,5-100 P99,9-100 P0-90 P90-95 P95-99 P99-99,5 P99,5-99,9 P99,9-100 P90 P95 P99 P99,5 P99,9(1) (2) (3) (4) (5) (6) (7) (8) (9) (10) (11) (12) (13) (14) (15) (16) (17)
1986 3 523 6 577 7 463 9 869 11 214 16 794 3 183 5 691 6 861 8 525 9 820 16 794 5 377 6 102 8 163 8 870 12 0191987 3 860 7 126 8 117 10 603 12 051 18 206 3 497 6 135 7 496 9 154 10 512 18 206 5 787 6 592 8 644 9 825 13 0951988 4 363 8 240 9 445 12 925 14 743 19 554 3 932 7 035 8 575 11 106 13 541 19 554 6 493 7 599 10 520 12 006 16 5441989 4 927 9 719 11 390 16 235 18 691 24 422 4 395 8 048 10 178 13 780 17 258 24 422 7 518 8 701 12 936 14 955 20 6971990 5 422 10 697 12 546 18 106 20 730 28 026 4 836 8 849 11 156 15 482 18 907 28 026 8 238 9 661 14 459 16 830 22 6011991 5 910 11 719 13 840 20 393 24 425 38 296 5 265 9 598 12 202 16 360 20 957 38 296 8 893 10 549 15 228 17 766 27 6081992 7 025 14 793 17 877 27 774 33 538 52 433 6 162 11 709 15 402 22 010 28 814 52 433 10 745 12 989 20 285 24 348 37 4151993 8 822 19 916 24 219 37 083 44 514 67 361 7 589 15 612 21 003 29 653 38 802 67 361 14 150 17 664 27 353 32 541 51 5221994 11 859 27 716 33 812 51 671 60 127 84 362 10 097 21 621 29 347 43 215 54 068 84 362 19 517 24 281 39 493 48 388 66 0941995 14 270 32 819 39 874 59 652 69 683 96 637 12 209 25 765 34 930 49 621 62 944 96 637 23 360 29 195 46 478 54 078 78 0961996 15 971 37 171 45 226 68 658 80 714 110 747 13 616 29 115 39 368 56 602 73 206 110 747 26 314 32 618 52 220 62 084 90 0991997 17 213 40 959 49 981 78 278 93 016 128 273 14 574 31 936 42 907 63 540 84 202 128 273 28 705 35 873 57 865 70 352 100 1941998 17 837 42 435 52 154 82 151 98 688 138 349 15 103 32 717 44 654 65 613 88 773 138 349 29 766 36 618 60 371 72 000 113 3451999 19 167 46 368 57 067 89 719 107 562 156 381 16 145 35 669 48 904 71 876 95 357 156 381 32 350 40 070 64 924 80 357 120 8962000 20 327 49 701 60 733 93 669 110 864 158 301 17 063 38 669 52 499 76 475 99 004 158 301 35 118 43 537 69 680 85 650 123 4502001 22 051 54 826 67 416 105 871 126 760 193 819 18 410 42 236 57 802 84 983 109 995 193 819 37 847 47 802 77 630 94 825 142 2722002 24 162 62 262 77 707 126 797 155 209 255 955 19 929 46 817 65 435 98 385 130 022 255 955 41 565 53 570 89 225 110 686 176 0292003 26 740 72 733 92 883 160 402 202 621 362 638 21 629 52 583 76 003 118 182 162 617 362 638 46 502 61 252 105 698 135 858 232 725
P0-100 P90-100 P95-100 P99-100 P99,5-100 P99,9-100 P0-90 P90-95 P95-99 P99-99,5 P99,5-99,9 P99,9-100 P90 P95 P99 P99,5 P99,9(1) (2) (3) (4) (5) (6) (7) (8) (9) (10) (11) (12) (13) (14) (15) (16) (17)
1986 11 140 20 798 23 600 31 212 35 465 53 110 10 067 17 996 21 698 26 958 31 054 53 110 17 006 19 297 25 815 28 050 38 0081987 11 385 21 017 23 941 31 272 35 544 53 698 10 315 18 094 22 108 27 000 31 006 53 698 17 068 19 443 25 495 28 978 38 6231988 10 837 20 468 23 462 32 106 36 623 48 574 9 767 17 475 21 301 27 588 33 636 48 574 16 129 18 877 26 132 29 824 41 0961989 10 344 20 402 23 910 34 082 39 236 51 268 9 226 16 895 21 367 28 928 36 228 51 268 15 782 18 266 27 156 31 393 43 4481990 11 045 21 790 25 555 36 880 42 226 57 086 9 851 18 025 22 724 31 535 38 511 57 086 16 779 19 679 29 452 34 282 46 0361991 11 627 23 054 27 226 40 117 48 049 75 336 10 357 18 881 24 004 32 184 41 227 75 336 17 495 20 751 29 957 34 949 54 3111992 12 996 27 365 33 070 51 380 62 042 96 997 11 400 21 660 28 493 40 717 53 304 96 997 19 878 24 029 37 526 45 041 69 2151993 14 242 32 153 39 101 59 870 71 866 108 752 12 252 25 205 33 909 47 874 62 645 108 752 22 844 28 518 44 161 52 536 83 1811994 15 411 36 018 43 939 67 147 78 135 109 629 13 121 28 096 38 137 56 159 70 262 109 629 25 363 31 553 51 322 62 881 85 8901995 15 864 36 484 44 327 66 313 77 464 107 429 13 573 28 642 38 830 55 162 69 973 107 429 25 969 32 455 51 668 60 117 86 8181996 16 391 38 146 46 413 70 460 82 832 113 653 13 973 29 879 40 402 58 088 75 127 113 653 27 005 33 474 53 590 63 714 92 4641997 17 182 40 886 49 893 78 139 92 852 128 045 14 548 31 880 42 831 63 427 84 053 128 045 28 654 35 809 57 762 70 227 100 0171998 17 957 42 721 52 505 82 704 99 352 139 280 15 205 32 937 44 955 66 055 89 371 139 280 29 966 36 865 60 777 72 485 114 1081999 19 572 47 347 58 271 91 613 109 832 159 682 16 486 36 422 49 936 73 394 97 370 159 682 33 033 40 916 66 295 82 053 123 4482000 20 571 50 297 61 462 94 793 112 194 160 201 17 268 39 133 53 129 77 393 100 192 160 201 35 539 44 059 70 516 86 678 124 9312001 22 051 54 826 67 416 105 871 126 760 193 819 18 410 42 236 57 802 84 983 109 995 193 819 37 847 47 802 77 630 94 825 142 2722002 24 235 62 450 77 941 127 178 155 676 256 725 19 989 46 958 65 632 98 681 130 413 256 725 41 690 53 732 89 494 111 019 176 5592003 26 294 71 521 91 336 157 730 199 246 356 598 21 269 51 707 74 737 116 214 159 908 356 598 45 727 60 232 103 938 133 595 228 848
1,98 2,64 2,86 3,39 3,57 3,65 1,83 2,35 2,66 3,15 3,54 3,65 2,23 2,48 3,01 3,38 3,744,7% 6,7% 7,2% 8,5% 8,9% 9,0% 4,1% 5,9% 6,8% 8,0% 8,8% 9,0% 5,5% 6,2% 7,6% 8,5% 9,2%
1,60 1,87 1,97 2,24 2,41 3,14 1,52 1,73 1,85 2,00 2,13 3,14 1,69 1,80 1,94 2,10 2,477,0% 9,4% 10,2% 12,2% 13,4% 17,7% 6,2% 8,1% 9,2% 10,4% 11,4% 17,7% 7,8% 8,8% 9,9% 11,2% 13,8%
Note: Due to a discontinuity in NSB methodology and sampling technique between 2001 and 2002 (large increase in sample size), we adjusted 2002/2001 income growth rates on the basis of average 2001/2000 and2003/2002 observed rates.
2003/1996
Source: Authors' computations using annual tabulations extracted from China's Urban Household Income Surveys (NSB), 1986-2003
Table A3 : Top fractiles incomes levels in China, 1986-2003 (household distribution)
current yuans
2001 yuans
2001/1986
P0-100 P90-100 P95-100 P99-100 P99,5-100 P99,9-100 P0-90 P90-95 P95-99 P99-99,5 P99,5-99,9 P99,9-100 P90 P95 P99 P99,5 P99,9(1) (2) (3) (4) (5) (6) (7) (8) (9) (10) (11) (12) (13) (14) (15) (16) (17)
1986 1 394 2 421 2 732 3 691 4 201 6 539 1 280 2 110 2 492 3 182 3 616 6 539 1 999 2 256 3 003 3 417 4 4871987 1 464 2 607 2 920 3 905 4 350 6 802 1 337 2 293 2 673 3 461 3 737 6 802 2 150 2 392 3 200 3 112 3 9421988 1 963 3 767 4 354 6 564 7 927 12 254 1 762 3 180 3 802 5 201 6 845 12 254 2 946 3 253 4 837 5 715 9 0901989 2 231 4 404 5 226 7 694 9 059 12 521 1 989 3 582 4 609 6 329 8 193 12 521 3 361 3 931 5 862 6 924 10 4111990 2 438 4 715 5 537 8 118 9 505 13 822 2 185 3 894 4 892 6 731 8 425 13 822 3 623 4 254 6 218 7 398 10 1441991 2 688 5 243 6 215 9 095 10 627 16 355 2 404 4 272 5 495 7 562 9 195 16 355 3 978 4 667 7 086 8 163 11 5341992 3 152 6 502 7 891 12 492 15 057 23 741 2 780 5 114 6 741 9 927 12 886 23 741 4 771 5 636 8 893 10 993 16 3451993 4 006 9 073 11 083 17 378 20 684 29 869 3 443 7 062 9 510 14 073 18 388 29 869 6 410 7 890 12 653 15 539 23 6061994 5 462 12 876 15 725 24 122 28 495 41 831 4 638 10 027 13 626 19 749 25 161 41 831 9 107 11 301 18 244 21 840 31 5431995 6 614 15 412 18 860 28 959 33 903 46 050 5 636 11 964 16 336 24 015 30 866 46 050 10 842 13 440 22 012 27 019 37 3611996 7 407 17 760 21 902 34 773 41 745 63 790 6 257 13 618 18 684 27 800 36 234 63 790 12 309 15 386 25 397 30 747 46 9841997 8 020 19 875 24 566 39 209 47 105 72 176 6 703 15 184 20 905 31 312 40 837 72 176 13 603 17 208 28 860 34 615 53 0391998 8 274 20 450 25 226 40 076 47 784 71 891 6 921 15 674 21 513 32 368 41 757 71 891 14 082 17 650 29 905 35 657 53 6461999 8 955 22 333 27 492 42 703 50 839 76 218 7 468 17 174 23 689 34 567 44 494 76 218 15 510 19 441 31 959 38 048 57 0422000 9 825 25 082 31 136 49 525 60 098 94 189 8 129 19 028 26 539 38 951 51 576 94 189 17 154 21 569 35 698 43 320 67 8932001 10 787 27 950 34 689 54 509 65 948 102 635 8 880 21 210 29 734 43 070 56 776 102 635 18 878 24 216 39 529 47 824 74 4282002 11 958 31 934 39 953 63 654 77 601 122 979 9 739 23 914 34 028 49 706 66 257 122 979 21 073 27 561 45 447 55 394 87 7432003 13 383 37 386 47 522 78 604 97 474 160 702 10 716 27 250 39 752 59 735 81 667 160 702 23 858 31 793 54 179 67 171 110 690
P0-100 P90-100 P95-100 P99-100 P99,5-100 P99,9-100 P0-90 P90-95 P95-99 P99-99,5 P99,5-99,9 P99,9-100 P90 P95 P99 P99,5 P99,9(1) (2) (3) (4) (5) (6) (7) (8) (9) (10) (11) (12) (13) (14) (15) (16) (17)
1986 4 407 7 656 8 640 11 673 13 284 20 678 4 047 6 673 7 882 10 062 11 436 20 678 6 321 7 134 9 496 10 807 14 1891987 4 318 7 688 8 612 11 519 12 829 20 062 3 944 6 765 7 885 10 209 11 021 20 062 6 341 7 056 9 437 9 180 11 6271988 4 875 9 358 10 816 16 306 19 691 30 439 4 377 7 899 9 443 12 921 17 005 30 439 7 318 8 080 12 014 14 195 22 5801989 4 683 9 245 10 971 16 151 19 016 26 283 4 176 7 519 9 676 13 286 17 200 26 283 7 056 8 252 12 305 14 536 21 8561990 4 967 9 605 11 278 16 535 19 360 28 154 4 452 7 931 9 964 13 710 17 162 28 154 7 379 8 665 12 666 15 069 20 6631991 5 288 10 315 12 226 17 891 20 906 32 174 4 730 8 404 10 810 14 876 18 089 32 174 7 826 9 182 13 940 16 058 22 6911992 5 832 12 029 14 598 23 109 27 854 43 919 5 143 9 460 12 470 18 364 23 838 43 919 8 827 10 426 16 451 20 337 30 2361993 6 468 14 648 17 894 28 057 33 394 48 223 5 559 11 402 15 353 22 720 29 687 48 223 10 348 12 738 20 429 25 087 38 1121994 7 098 16 733 20 435 31 347 37 029 54 359 6 028 13 031 17 707 25 664 32 697 54 359 11 835 14 685 23 708 28 382 40 9901995 7 352 17 134 20 967 32 193 37 689 51 193 6 266 13 300 18 160 26 697 34 313 51 193 12 052 14 941 24 470 30 036 41 5341996 7 602 18 226 22 477 35 685 42 841 65 465 6 421 13 975 19 175 28 530 37 185 65 465 12 632 15 790 26 064 31 554 48 2171997 8 006 19 840 24 522 39 139 47 021 72 049 6 691 15 157 20 868 31 257 40 765 72 049 13 579 17 178 28 809 34 554 52 9451998 8 329 20 588 25 396 40 346 48 106 72 375 6 967 15 779 21 658 32 586 42 038 72 375 14 177 17 769 30 107 35 897 54 0071999 9 144 22 804 28 072 43 604 51 912 77 827 7 626 17 537 24 189 35 296 45 433 77 827 15 837 19 852 32 633 38 851 58 2462000 9 942 25 383 31 510 50 119 60 819 95 319 8 227 19 256 26 858 39 418 52 195 95 319 17 360 21 828 36 127 43 840 68 7082001 10 787 27 950 34 689 54 509 65 948 102 635 8 880 21 210 29 734 43 070 56 776 102 635 18 878 24 216 39 529 47 824 74 4282002 11 994 32 030 40 074 63 845 77 835 123 349 9 768 23 986 34 131 49 856 66 456 123 349 21 137 27 644 45 583 55 560 88 0072003 13 160 36 763 46 731 77 295 95 850 158 025 10 537 26 796 39 089 58 740 80 306 158 025 23 461 31 263 53 276 66 052 108 846
2,45 3,65 4,01 4,67 4,96 4,96 2,19 3,18 3,77 4,28 4,96 4,96 2,99 3,39 4,16 4,43 5,256,1% 9,0% 9,7% 10,8% 11,3% 11,3% 5,4% 8,0% 9,3% 10,2% 11,3% 11,3% 7,6% 8,5% 10,0% 10,4% 11,7%
1,73 2,02 2,08 2,17 2,24 2,41 1,64 1,92 2,04 2,06 2,16 2,41 1,86 1,98 2,04 2,09 2,268,2% 10,5% 11,0% 11,7% 12,2% 13,4% 7,3% 9,7% 10,7% 10,9% 11,6% 13,4% 9,2% 10,3% 10,8% 11,1% 12,3%
Note: Due to a discontinuity in NSB methodology and sampling technique between 2001 and 2002 (large increase in sample size), we adjusted 2002/2001 income growth rates on the basis of average2001/2000 and 2003/2002 observed rates.
2003/1996
Source: Authors' computations using annual tabulations extracted from China's Urban Household Income Surveys (NSB), 1986-2003
Table A4 : Top fractiles incomes levels in China, 1986-2003 (individual distribution)
current yuans
2001 yuans
2001/1986

P90-100 P95-100 P99-100 P99,5-100 P99,9-100 P90-95 P95-99 P99-99,5 P99,5-99,9 P99,9-100(1) (2) (3) (4) (5) (6) (7) (8) (9) (10)
1986 18,7% 10,6% 2,8% 1,6% 0,5% 8,1% 7,8% 1,2% 1,1% 0,5%1987 18,5% 10,5% 2,7% 1,6% 0,5% 7,9% 7,8% 1,2% 1,1% 0,5%1988 18,9% 10,8% 3,0% 1,7% 0,4% 8,1% 7,9% 1,3% 1,2% 0,4%1989 19,7% 11,6% 3,3% 1,9% 0,5% 8,2% 8,3% 1,4% 1,4% 0,5%1990 19,7% 11,6% 3,3% 1,9% 0,5% 8,2% 8,2% 1,4% 1,4% 0,5%1991 19,8% 11,7% 3,5% 2,1% 0,6% 8,1% 8,3% 1,4% 1,4% 0,6%1992 21,1% 12,7% 4,0% 2,4% 0,7% 8,3% 8,8% 1,6% 1,6% 0,7%1993 22,6% 13,7% 4,2% 2,5% 0,8% 8,8% 9,5% 1,7% 1,8% 0,8%1994 23,4% 14,3% 4,4% 2,5% 0,7% 9,1% 9,9% 1,8% 1,8% 0,7%1995 23,0% 14,0% 4,2% 2,4% 0,7% 9,0% 9,8% 1,7% 1,8% 0,7%1996 23,3% 14,2% 4,3% 2,5% 0,7% 9,1% 9,9% 1,8% 1,8% 0,7%1997 23,8% 14,5% 4,5% 2,7% 0,7% 9,3% 10,0% 1,8% 2,0% 0,7%1998 23,8% 14,6% 4,6% 2,8% 0,8% 9,2% 10,0% 1,8% 2,0% 0,8%1999 24,2% 14,9% 4,7% 2,8% 0,8% 9,3% 10,2% 1,9% 2,0% 0,8%2000 24,5% 14,9% 4,6% 2,7% 0,8% 9,5% 10,3% 1,9% 1,9% 0,8%2001 24,9% 15,3% 4,8% 2,9% 0,9% 9,6% 10,5% 1,9% 2,0% 0,9%2002 25,8% 16,1% 5,2% 3,2% 1,1% 9,7% 10,8% 2,0% 2,2% 1,1%2003 27,2% 17,4% 6,0% 3,8% 1,4% 9,8% 11,4% 2,2% 2,4% 1,4%
P90-100 P95-100 P99-100 P99,5-100 P99,9-100 P90-95 P95-99 P99-99,5 P99,5-99,9 P99,9-100(2) (3) (4) (5) (6) (8) (9) (10) (11) (12)
1986 17,4% 9,8% 2,6% 1,5% 0,5% 7,6% 7,2% 1,1% 1,0% 0,5%1987 17,8% 10,0% 2,7% 1,5% 0,5% 7,8% 7,3% 1,2% 1,0% 0,5%1988 19,2% 11,1% 3,3% 2,0% 0,6% 8,1% 7,7% 1,3% 1,4% 0,6%1989 19,7% 11,7% 3,4% 2,0% 0,6% 8,0% 8,3% 1,4% 1,5% 0,6%1990 19,3% 11,4% 3,3% 1,9% 0,6% 8,0% 8,0% 1,4% 1,4% 0,6%1991 19,5% 11,6% 3,4% 2,0% 0,6% 7,9% 8,2% 1,4% 1,4% 0,6%1992 20,6% 12,5% 4,0% 2,4% 0,8% 8,1% 8,6% 1,6% 1,6% 0,8%1993 22,6% 13,8% 4,3% 2,6% 0,7% 8,8% 9,5% 1,8% 1,8% 0,7%1994 23,6% 14,4% 4,4% 2,6% 0,8% 9,2% 10,0% 1,8% 1,8% 0,8%1995 23,3% 14,3% 4,4% 2,6% 0,7% 9,0% 9,9% 1,8% 1,9% 0,7%1996 24,0% 14,8% 4,7% 2,8% 0,9% 9,2% 10,1% 1,9% 2,0% 0,9%1997 24,8% 15,3% 4,9% 2,9% 0,9% 9,5% 10,4% 2,0% 2,0% 0,9%1998 24,7% 15,2% 4,8% 2,9% 0,9% 9,5% 10,4% 2,0% 2,0% 0,9%1999 24,9% 15,4% 4,8% 2,8% 0,9% 9,6% 10,6% 1,9% 2,0% 0,9%2000 25,5% 15,8% 5,0% 3,1% 1,0% 9,7% 10,8% 2,0% 2,1% 1,0%2001 25,9% 16,1% 5,1% 3,1% 1,0% 9,8% 11,0% 2,0% 2,1% 1,0%2002 26,7% 16,7% 5,3% 3,2% 1,0% 10,0% 11,4% 2,1% 2,2% 1,0%2003 27,9% 17,8% 5,9% 3,6% 1,2% 10,2% 11,9% 2,2% 2,4% 1,2%
Source: Authors' computations based on top fractiles incomes levels reported on Tables A3 and A4
Table A5 : Top fractiles incomes shares in total income in urban China, 1986-2003
household distribution
individual distribution
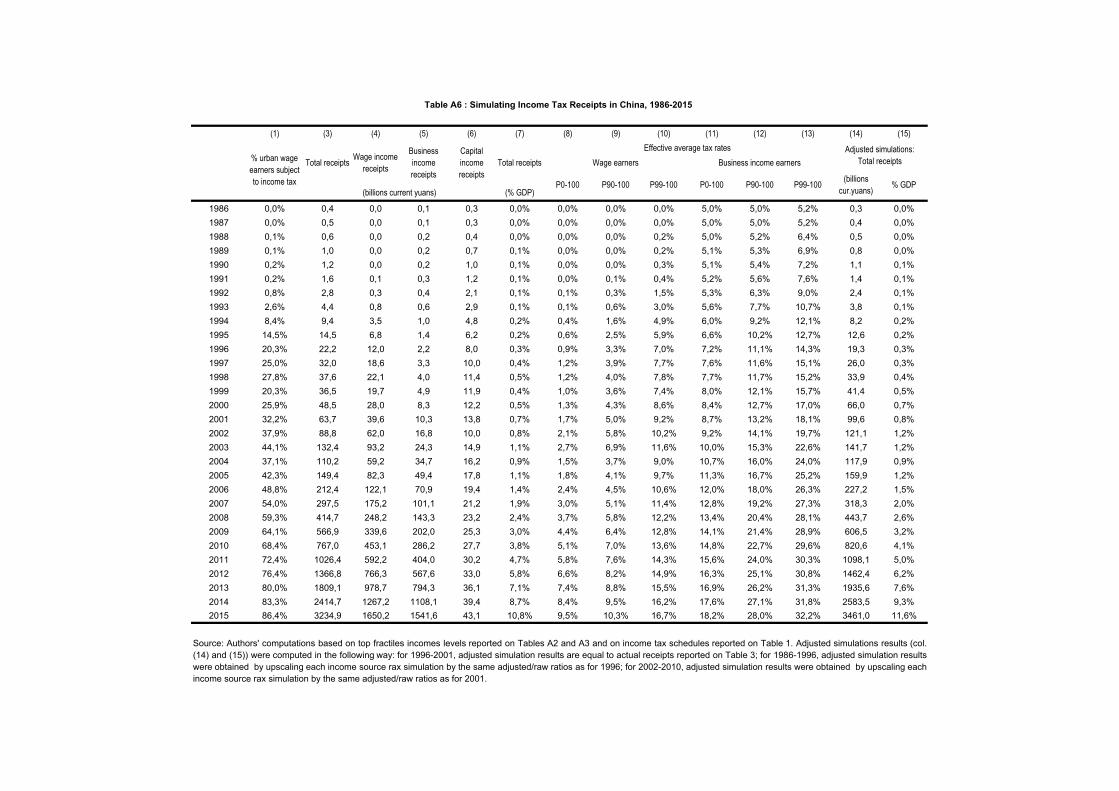
(1) (3) (4) (5) (6) (7) (8) (9) (10) (11) (12) (13) (14) (15)
(% GDP)
1986 0,0% 0,4 0,0 0,1 0,3 0,0% 0,0% 0,0% 0,0% 5,0% 5,0% 5,2% 0,3 0,0%1987 0,0% 0,5 0,0 0,1 0,3 0,0% 0,0% 0,0% 0,0% 5,0% 5,0% 5,2% 0,4 0,0%1988 0,1% 0,6 0,0 0,2 0,4 0,0% 0,0% 0,0% 0,2% 5,0% 5,2% 6,4% 0,5 0,0%1989 0,1% 1,0 0,0 0,2 0,7 0,1% 0,0% 0,0% 0,2% 5,1% 5,3% 6,9% 0,8 0,0%1990 0,2% 1,2 0,0 0,2 1,0 0,1% 0,0% 0,0% 0,3% 5,1% 5,4% 7,2% 1,1 0,1%1991 0,2% 1,6 0,1 0,3 1,2 0,1% 0,0% 0,1% 0,4% 5,2% 5,6% 7,6% 1,4 0,1%1992 0,8% 2,8 0,3 0,4 2,1 0,1% 0,1% 0,3% 1,5% 5,3% 6,3% 9,0% 2,4 0,1%1993 2,6% 4,4 0,8 0,6 2,9 0,1% 0,1% 0,6% 3,0% 5,6% 7,7% 10,7% 3,8 0,1%1994 8,4% 9,4 3,5 1,0 4,8 0,2% 0,4% 1,6% 4,9% 6,0% 9,2% 12,1% 8,2 0,2%1995 14,5% 14,5 6,8 1,4 6,2 0,2% 0,6% 2,5% 5,9% 6,6% 10,2% 12,7% 12,6 0,2%1996 20,3% 22,2 12,0 2,2 8,0 0,3% 0,9% 3,3% 7,0% 7,2% 11,1% 14,3% 19,3 0,3%1997 25,0% 32,0 18,6 3,3 10,0 0,4% 1,2% 3,9% 7,7% 7,6% 11,6% 15,1% 26,0 0,3%1998 27,8% 37,6 22,1 4,0 11,4 0,5% 1,2% 4,0% 7,8% 7,7% 11,7% 15,2% 33,9 0,4%1999 20,3% 36,5 19,7 4,9 11,9 0,4% 1,0% 3,6% 7,4% 8,0% 12,1% 15,7% 41,4 0,5%2000 25,9% 48,5 28,0 8,3 12,2 0,5% 1,3% 4,3% 8,6% 8,4% 12,7% 17,0% 66,0 0,7%2001 32,2% 63,7 39,6 10,3 13,8 0,7% 1,7% 5,0% 9,2% 8,7% 13,2% 18,1% 99,6 0,8%2002 37,9% 88,8 62,0 16,8 10,0 0,8% 2,1% 5,8% 10,2% 9,2% 14,1% 19,7% 121,1 1,2%2003 44,1% 132,4 93,2 24,3 14,9 1,1% 2,7% 6,9% 11,6% 10,0% 15,3% 22,6% 141,7 1,2%2004 37,1% 110,2 59,2 34,7 16,2 0,9% 1,5% 3,7% 9,0% 10,7% 16,0% 24,0% 117,9 0,9%2005 42,3% 149,4 82,3 49,4 17,8 1,1% 1,8% 4,1% 9,7% 11,3% 16,7% 25,2% 159,9 1,2%2006 48,8% 212,4 122,1 70,9 19,4 1,4% 2,4% 4,5% 10,6% 12,0% 18,0% 26,3% 227,2 1,5%2007 54,0% 297,5 175,2 101,1 21,2 1,9% 3,0% 5,1% 11,4% 12,8% 19,2% 27,3% 318,3 2,0%2008 59,3% 414,7 248,2 143,3 23,2 2,4% 3,7% 5,8% 12,2% 13,4% 20,4% 28,1% 443,7 2,6%2009 64,1% 566,9 339,6 202,0 25,3 3,0% 4,4% 6,4% 12,8% 14,1% 21,4% 28,9% 606,5 3,2%2010 68,4% 767,0 453,1 286,2 27,7 3,8% 5,1% 7,0% 13,6% 14,8% 22,7% 29,6% 820,6 4,1%2011 72,4% 1026,4 592,2 404,0 30,2 4,7% 5,8% 7,6% 14,3% 15,6% 24,0% 30,3% 1098,1 5,0%2012 76,4% 1366,8 766,3 567,6 33,0 5,8% 6,6% 8,2% 14,9% 16,3% 25,1% 30,8% 1462,4 6,2%2013 80,0% 1809,1 978,7 794,3 36,1 7,1% 7,4% 8,8% 15,5% 16,9% 26,2% 31,3% 1935,6 7,6%2014 83,3% 2414,7 1267,2 1108,1 39,4 8,7% 8,4% 9,5% 16,2% 17,6% 27,1% 31,8% 2583,5 9,3%2015 86,4% 3234,9 1650,2 1541,6 43,1 10,8% 9,5% 10,3% 16,7% 18,2% 28,0% 32,2% 3461,0 11,6%
P90-100 P99-100
Table A6 : Simulating Income Tax Receipts in China, 1986-2015
% urban wage earners subject to income tax
Total receipts Wage income receipts
Business income receipts
Capital income receipts
(billions current yuans)(billions
cur.yuans) % GDP
Source: Authors' computations based on top fractiles incomes levels reported on Tables A2 and A3 and on income tax schedules reported on Table 1. Adjusted simulations results (col.(14) and (15)) were computed in the following way: for 1996-2001, adjusted simulation results are equal to actual receipts reported on Table 3; for 1986-1996, adjusted simulation resultswere obtained by upscaling each income source rax simulation by the same adjusted/raw ratios as for 1996; for 2002-2010, adjusted simulation results were obtained by upscaling eachincome source rax simulation by the same adjusted/raw ratios as for 2001.
Effective average tax ratesWage earners Business income earners
P0-100 P90-100 P99-100 P0-100
Total receiptsAdjusted simulations:
Total receipts