Income inequality and population health: a panel … · Income inequality and population health: a...
35
MPIDR WORKING PAPER WP 2011-006 FEBRUARY 2011 Roberta Torre ([email protected]) Mikko Myrskylä ([email protected]) Income inequality and population health: a panel data analysis on 21 developed countries Max-Planck-Institut für demografische Forschung Max Planck Institute for Demographic Research Konrad-Zuse-Strasse 1 · D-18057 Rostock · GERMANY Tel +49 (0) 3 81 20 81 - 0; Fax +49 (0) 3 81 20 81 - 202; http://www.demogr.mpg.de © Copyright is held by the authors. Working papers of the Max Planck Institute for Demographic Research receive only limited review. Views or opinions expressed in working papers are attributable to the authors and do not necessarily reflect those of the Institute.
Transcript of Income inequality and population health: a panel … · Income inequality and population health: a...

MPIDR WORKING PAPER WP 2011-006FEBRUARY 2011
Roberta Torre ([email protected])Mikko Myrskylä ([email protected])
Income inequality and population health: a panel data analysis on 21 developed countries
Max-Planck-Institut für demografi sche ForschungMax Planck Institute for Demographic ResearchKonrad-Zuse-Strasse 1 · D-18057 Rostock · GERMANYTel +49 (0) 3 81 20 81 - 0; Fax +49 (0) 3 81 20 81 - 202; http://www.demogr.mpg.de
© Copyright is held by the authors.
Working papers of the Max Planck Institute for Demographic Research receive only limited review.Views or opinions expressed in working papers are attributable to the authors and do not necessarily refl ect those of the Institute.

Income inequality and population health: a panel
data analysis on 21 developed countries
Roberta Torre [email protected]
Mikko Myrskylä [email protected]
Max Planck Institute for Demographic Research
1

Abstract
The relative income-health hypothesis postulates that income distribution is one of the key
determinants of population health. The discussion on the age and gender patterns of this
association is still open. We test the relative income-health hypothesis using a panel data
covering 21 developed countries for over 30 years. We find that net of trends in GDP per head
and unobserved period and country factors, income inequality, measured by the Gini index, is
strongly and positively associated with male and female mortality up to age 15. For women
the association vanishes at older ages, but for men persists up to age 50. These findings
suggest that policies decreasing income inequality may improve the health of children and
young- to middle-aged men. The mechanisms behind the income inequality-mortality
association are not known, but may be related to parental stress and male competition. Future
research could focus on unravelling these mechanisms.
Keywords: Income inequality; Population health; Mortality rates; Panel data; Developed
countries
2
Introduction
The income inequality-health hypothesis postulates that population health and mortality are
importantly influenced by income distribution (Lynch et al. 2004). Evidence for the
hypothesis would support redistributive policies aimed at decreasing income inequality. With
some exceptions (Wagstaff and van Doorslaer 2000; Mellor and Milyo 2001; Gravelle et al.
2002; Beckfield 2004; Jen et al. 2009), most of recent research has been supportive of the
hypothesis ( Shmueli 2004; De Vogli et al. 2005; Ram 2006; Dorling et al. 2007; Babones
2008; Karlsson et al. 2009; Biggs et al. 2010; Idrovo et al. 2010).
A large share of the research on income inequality and mortality has focused on the
community and individual levels, as discussed in several review papers ( Wagstaff and van
Doorslaer 2000; Macinko et al. 2003; Lynch et al. 2004; Wilkinson and Pickett 2006) . We
study the income inequality-mortality link and focus on the population level association for
three reasons. First, we are interested in understanding the population level health differences;
second, income inequality by definition is a property of the population and not of the
individual (Kaplan et al. 1996); and third, because the population level approach allows us to
takes into account social and environmental reasons behind the association (Kawachi and
Kennedy 1999; Wolfson et al. 1999; Wilkinson 1999; Wagstaff and van Doorslaer 2000;
Wilkinson and Pickett 2009).
We analyze the income inequality-health hypothesis using a panel of 21 developed countries
over the years 1975-2006 (see Appendix for a list of countries). The data allows us to control
for all shared period factors and time-invariant country specific factors. We use mortality as
the measure for health and the high-quality Human Mortality Database (2010) as the data
source. The source for Gini index of income inequality, our income inequality measure, is the
United Nations University-World Institue for Development Economics Research (UNU-
3

WIDER) World Income Inequality Database (2010). In contrast to previous research that has
looked at the population level association between income inequality and total mortality or
life expectancy (Mellor and Milyo 2001; Beckfield 2004; De Vogli et al. 2005; Babones
2008), we distinguish between genders and age groups and control for trends in GDP per head
and unobserved period and country factors.
Our results suggest that an increase in income inequality increases mortality at birth and up to
age 15 for both genders. For women the association vanishes at ages above 15, but for men
this association persists up to age 50. However, as the contribution of mortality at ages below
50 on life expectancy at birth is relatively small in developed countries, we find no effects of
income inequality on life expectancy. Nevertheless, these findings highlight the importance of
income inequality on the health and mortality of children and young- to middle-aged men,
suggesting that redistributive policies decreasing income inequality could decrease mortality
among these populations.
Potential Mechanisms
Mortality has continuously decreased over time, but since 1970s income inequality increased
steadily in the industrialized nations (Subramanian and Kawachi 2004). As the average
income per head explains only a small proportion of life expectancy among developed
countries (Preston 1975), it has been suggested that income distribution might explain the
differences in mortality across wealthy nations (Rodgers 1979). This “income inequality-
health hypothesis” is based on the thought that within a population, an income inequality
decreasing transfer from the rich to the poor would increase population level health as the
marginal health gain is higher at lower income levels than the marginal health loss at higher
4

income levels. Lynch, Smith, Kaplan & House (2000) have classified the possible
mechanisms through which income inequality and population health could be related as
follows:
• the Individual Income Interpretation asserts that individual absolute income accounts for
all the health effects of income distribution, and population health effects of income
inequality are merely the sum of individual income effects (Gravelle 1998; Heerink,
Mulatu and Bulte 2001; Gravelle et al. 2002);
• the Psychosocial Interpretation argues that individual health is affected by the perceptions
that people have on their relative position in the social hierarchy, and lower positions may
be related to lower investment in human capital, lack of social cohesion, and feelings of
insecurity (Wilkinson 1992; Porta, Borrell and Copete 2002;).
• the Neo-material Interpretation suggests that income inequality affects health mainly
through the lack of resources held by individuals and the systematic underinvestment in
social and environmental conditions (Lynch et al., 2000).
Prior Population Level Research
Even though most of recent research finds an association between income inequality and
health measures especially at the individual levels, the nature, magnitude and carachteristics
on the population level association between income inequality and health are not well
understood (Wagstaff and van Doorslaer 2000; Macinko et al. 2003; Lynch et al. 2004;
Wilkinson and Pickett 2006). For example, in a review of 26 cross-country studies, 15 studies
support the income inequality-health hypothesis, 5 showed mixed results and the remaining 6
5

provided no evidence for the hypothesis (Lynch et al. 2004). The results were most consistent
for infant mortality, but less so regarding adult mortality.
We believe that much of the heterogeneity in the findings depends often on the method used;
data quality; and study populations. For example, some studies pool together less developed
and developed countries (Rodgers 1979; Waldmann 1992; Karlsson et al. 2009) or perform
only a cross-sectional analysis which fails to control for country-specific characteristics such
as welfare systems (Judge et al. 1998; Pampel and Zimmer 1989; Wilkinson 1992; Lynch et
al. 2001; De Vogli et al. 2005; Ram 2006; Idrovo et al. 2010). In addition, most studies
especially at the individual level that support the income inequality-health hypothesis have
been carried out after the mid 1990s. This can be interpreted as evidence for either the income
inequality-health link changing over time, or better data quality and better methods providing
less biased results (Judge 1995; Judge et al. 1998). Much of the early research that found an
association between income inequality and health was based on cross-sectional analyses with
no adjustment for potential confounders (e.g. welfare systems, environmental factors)
(Rodgers 1979; Wilkinson 1992; McIsaac and Wilkinson 1997; Lynch et al. 2001).
In more recent papers, one cross-sectional analysis on 21 economically developed nations
which controlled for income per head and educational achievements found the Gini index to
be negatively associated with life expectancy at birth (De Vogli et al. 2005). A similar study
using data on 126 countries found income inequality to be positively associated with mortality
especially among men aged 15-29 (Dorling et al. 2007). Another cross-sectional study
focusing on 75 countries, however, did not find any associations (Gravelle et al. 2002). Many
of these cross-sectional studies suffer from one or more of these three shortcomings: use of
simple bivariate methods without appropriate controls; no consideration for the possibility of
unobserved country heterogeneity; or measures of income distribution that are often not
internationally comparable (Beckfield 2004). There are only few population level comparative
6

studies that use panel data and account for heterogeneity across countries (Mellor and Milyo
2001; Beckfield 2004; Babones 2008; Shkolnikov et al. 2009). Some of these studies,
however, may be limited in statistical power as they use very short time series (e.g. 5 years) (
Mellor & Milyo, 2001; Babones, 2008) or difficult to interpret because they pool together
very different countries (Beckfield 2004; Babones 2008).
To our knowledge, the first study to make use of time series data analyzed 30 countries and
implemented a first-differences model to control for country-specific effects (Mellor and
Milyo 2001). The study does not find any evidence for the income inequality-health
hypothesis, for a sample of twelve countries belonging to the Organization for Economic Co-
operation and Development (OECD). However, the time series considered was quite short,
only four years. Moreover, the use of a first-differences model may questionable. This is
because if there is measurement error in the explanatory variable, as it might be the case for
Gini time-series, first-differences model may exacerbate the asymptotic bias in the estimation
of the coefficients. Beckfield (2004) analyzed 115 countries over 50 years and used a fixed-
effect model to take into account unobserved heterogeneity, but found no evidence for the
income inequality-health hypothesis. Babones (2008) analyzed 135 countries over a period
from 1970 to 1995 and found that changes in income distribution are associated with changes
in life expectancy and infant mortality. However, the association vanished when income per
capita per head was added as control. A potential limitation of these studies is including such
a heterogeneous sample of countries (i.e. pooling together transition economies with
economically developed countries).
We also hypothesize that some of the inconsistencies in prior research may be due to mixing
of sexes and different age groups (McIsaac & Wilkinson 1997; Dorling et al. 2007; Kruger
2010). Mechanisms that explain the association might be different by gender and by age (e.g.
children making invidious social comparisons as well as being affected by quality of family
7

life, young adult men more keen on risk taking behaviors than women) (Courtenay, 2000;
Pickett & Wilkinson, 2007). In a recent paper, Shkolnikov et al. (2009) used data from 17
developed countries to analyze how income inequality is associated with life expectancy
losses, a measure of the degree of variation in age at death within a country. Shkolnikov et al.
(2009) used a country fixed-effect approach and a quinquennial time series for a set of
comparable developed countries, and found that income inequality does not explain reduction
in life expectancy losses over time, but it does explain differences in life expectancy losses
across countries. In other words, income distribution may explain why some countries have
higher inequality in life expectancy than in others. However, they do not distinguish among
different age-intervals.
We build on prior research by extending the Shkolnikov et al. (2009) analysis from health
inequality measures to absolute ones in order to test the income inequality-health hypothesis.
We use a similar design to Shkolnikov et al. (2009) to analyze how mortality and life
expectancy are associated with income inequality in developed nations. We perform a panel
data analysis using random-effect models on 21 developed countries for a yearly time-series
of more than 30 years and controlling for serial correlation. We pay particular attention to the
methods (panel data), data quality (comparability, source reliability especially for income
inequality) and appropriate selection of countries (economically developed nations), as these
are suggested to be the main weaknesses in prior literature (Macinko et al. 2003). The
selection of the countries analyzed is particularly important since there are significant
differences in the effects of income inequality according to the type of countries considered
(Moore 2006). We focus on developed countries with relatively stable past. Thus we exclude
from the analysis former socialist countries as they have exhibited peculiar mortality
trajectories since the collapse of the Soviet Union (Stuckler et al. 2009).
8

Data and methods
Response variables: Life expectancy and mortality rates by age
We use data from the Human Mortality Database (HMD). The HMD provides internationally
comparable data on mortality for national populations over long periods of time. In our time
window, 1975-2006, we have only three years missing (2004-06) of observations for New
Zealand only. Our focus is on developed countries as in wealthier nations the relation between
population health and income per head may be weaker than for less developed countries
(Preston 1975). We exclude countries that were part of the Soviet Bloc as mortality changes
following the collapse of the Soviet Union might otherwise dominate the results.
We use life expectancy at birth and age-specific mortality rates as our response variables. Life
expectancy at birth summarizes the mortality experience of a synthetic cohort over the life
course, thus being a concise measure of population health. Life expectancy at birth also
allows comparisons to existing research, as it has been used as the dependent variable in other
comparable studies (Lynch et al. 2004). In order to gain understanding on how specific age
groups respond to income inequality, we analyze age-specific mortality rates. We use age
groups 0, 1-14, 15-49, 50-64, and 65-89. These represent mortality experience in infancy,
childhood, young adulthood, middle ages, and old ages.
Independent variables: The Gini coefficient and Gross Domestic Product (GDP) per head
As the key independent variable, income inequality, we used the Gini index of income
inequality. Data for the Gini coefficient are taken from UNU/WIDER World Income
Inequality Database (last available version: May, 2008). The coefficient tells us how equally
income is distributed across the population and is derived from the Lorenz curve that draws
the proportion of the total income of the population earned by the bottom given percentage of
9

the population. The Gini coefficient is then calculated as the ratio of the area that lies between
the 45 degree line of perfect equality and the Lorenz curve over the total area under the line of
perfect equality. It ranges between zero and one: the closer the coefficient is to one, the higher
the degree of inequality is. The advantage of using Gini coefficient is that data are relatively
easily available. In addition, the literature suggests that the association between income
inequality and mortality is robust to the choice of the income inequality measure (Kawachi
and Kennedy 1997).
We use data on Gini coefficient only for countries in which the income sharing unit is the
household, the income concept refers to disposable income and the unit of analysis is the
person. Of OECD countries for which data is available from the UNU/WIDER database, we
drop Australia from the analysis as the data refers to person instead of household as the
income sharing unit. We also drop Japan as the Gini data suggested surprising fluctuations
and a decreasing trend over time, which is not consistent with published research (Jones
2007). After these exclusions we had time series data for 21 countries over the years 1975-
2006.
Following Shkolnikov et al. (2009), we interpolated missing observations through a simple
linear interpolation. As the Gini index evolves slowly over time, jumps and short-term
fluctuations in the index are likely to be caused by measurement error rather than changes in
the true income inequality. Therefore we applied a locally weighted (lowess) regression to
smooth the time-series that otherwise would have shown irregular variations across time.
Our models control for income per head. As measure, data for Gross Domestic Product per
head expressed in US$ (constant prices and parity purchasing power, reference year 2000)
10

have been collected from the OECD database. GDP per head data for Taiwan have been
collected from the IMF web-site but are expressed in the same units as in the OECD database.
Methods
The dataset constitutes a time-series of observations. Before regression we take logs of the
variables to allow for an easier interpretation and comparison of the size of the estimated
coefficients, and to control for heteroskedasticity and achieve linearity. We use panel data
regression techniques to estimate the effect of income inequality on mortality. We control for
country fixed-effects which control of unobserved factors that differ between countries but are
constant over time for each country (e.g. welfare systems, geographical and environmental
differences). We also control for time fixed-effects which control for unobserved factors that
are shared by all countries at a specific point in time and are not accounted for by GDP per
head. In addition, we adjust the model to account for autocorrelation. The following equation
expresses the regression model:
ittiititit GiniGDPY εγτββα +++++= lnlnln 21 with ititit ηερε += −1 ,
where Y denotes the dependent variable (life expectancy at birth, or age-specific mortality
rate) for country i at time t; GDP is our control variable for income per head of country i at
time t; Gini is the index of income inequality for country i at time t and represents the main
explanatory variable; τi is the country heterogeneity term that is constant over time; γt is a
period dummy capturing time fixed-effects (five year intervals starting from 1975 with the
exception of 2000-2006, for which the interval is seven years long); and εit is the error term
which we allow to be serially correlated.
Controls for country fixed-effects may be implemented by differencing or by including fixed-
or random-effects in the model. Initially, we compared fixed-effect model versus a first-
11

difference one. We preferred fixed-effect models to a first-difference model because of two
reasons. First, differencing reduces the sample size and decreases statistical power. Second, if
both the error term and the regressors are serially correlated, and the latter correlation is
stronger, the first-difference estimator will worsen the asymptotic bias due to the
measurement error (Wooldridge 2001).
As a following step, we compared the fixed-effect model to the random-effect model using
the Hausman test. In most cases, the test preferred the specification with random effects for
countries and fixed effects for periods. Given the relatively small number of observations, we
preferred the random country and fixed period effect model over the alternative with both
effects fixed (Wooldridge 2001). However, the results from these two models were
qualitatively and quantitatively similar, leading to same conclusions.
Finally, we checked for serial correlation of the residuals using the Baltagi-Wu LBI test
(Baltagi and Wu 1999). Values for the test statistic were generally below 1.5, suggesting that
there is serial correlation in the errors. Therefore we control for autocorrelation in the model.
Our preferred model, then, is a panel model in which country heterogeneity is controlled for
by using random-effects; time fixed-effects are controlled for by using five year period
dummies; and autocorrelation in the residuals is allowed.
Results
Descriptive results
Table 1 shows descriptive statistics for all the variables. The table shows that there is large
variation in both the Gini coefficient and GDP per head. For example, the difference between
the largest and smallest Gini coefficients is more than 100% (46.5% for the United States in
12

year 2004 vs. 20.3% for Sweden in year 1978). The mean Gini coefficient in the data is 29.8,
a figure consistent with prior research which has found the Gini coefficient to be on average
30% in OECD (Förster and Mira d'Ercole 2005).
Male life expectancy at birth is on average 73.1 years, ranging from 65.1 (for Portugal in
1975) to 79.5 years (for Iceland in 2003). As expected, female life expectancy at birth is on
average six years higher than male, and has slightly less variation than male life expectancy.
Mortality rates are higher among men than among women in all age groups, with the largest
proportional difference in the age interval 15-49 years where male mortality is approximately
two times female mortality.
TABLE 1 ABOUT HERE
Table 2 shows bivariate correlations across the main variables. The Gini coefficient is
negatively correlated with life expectancy at birth (significant for men, not for women) and
positively correlated with mortality rate for both men and women up to age 50. At ages 50-64,
the correlation becomes insignificant and at ages 65-90 changes sign and is negatively
correlated with mortality. Overall, the bivariate correlations suggest that a higher level of
income inequality is linked to lower life expectancy at birth and higher mortality rates below
age 50. For GDP per head, the results are similar for men and women, and suggest that higher
average income is associated with increased life expectancy and decreased mortality in all age
groups.
TABLE 2 ABOUT HERE
13

Regression results
Table 3 reports the results of the regressions of life expectancy and age-specific mortality on
the Gini coefficient. All models control for GDP per head, country random-effects, time
fixed-effects, and allow for autocorrelation in the residuals. Figure 1 illustrates the key results
shown in Table 3.
Table 3 presents the estimates for the twelve models implemented (six response variables, two
genders). Each row shows the estimates according to the response variable considered and
results are reported separately for men and for women. Columns refer to the explanatory
variables introduced in the models. The first row shows the association between life
expectancy at birth, Gini coefficient, and GDP per head. For both men and women, the Gini
coefficient has a negative sign but is statistically not significant, suggesting that the
importance of income inequality on life expectancy is small. GDP per capita, on the other
hand, is strongly and positively associated with life expectancy. For example, the coefficient
0.055 for men suggests that a 1% increase in GDP per head leads to a 0.055% increase in life
expectancy. With the average 73 years life expectancy for men, this corresponds to 15 days.
While this number seems small, a doubling of GDP per head – which happens every 25 years
with 3% growth rate – would increase life expectancy by almost three years. For women, the
results are similar, so that a doubling of GDP per head corresponds to two years and a half
increase in life expectancy. These calculations suggest that a large fraction of the overall
increases in life expectancy over the last decades may be attributable to increasing wealth.
TABLE 3 ABOUT HERE
FIGURE 1 ABOUT HERE
14

The following rows in Table 3 show results from regression models where age-specific
mortality rates are regressed on the Gini index and GDP per head. For men, we observe
positive and significant coefficients for Gini index up to age 50. Above this age, the
coefficients are small, negative, and statistically insignificant. Among women, the coefficients
are positive for all age intervals but significant at p=0.05 level only up to age 15 and with
p=0.10 level up to age 50. For higher ages the coefficients are statistically insignificant.
Thus, for both men and women, infant mortality is positively associated with income
inequality. The magnitude and significance of the effects are also similar for men and women.
The coefficient 0.47 for infant mortality (both men and women) suggests that a 1% increase in
income inequality would increase infant mortality by 0.47%. However, during our
observation period, typical changes in the Gini coefficient are much larger. For instance, in
the UK the Gini index increased by 43%, from 23% to 33% in the period 1975-2006. Such an
increase in the Gini index corresponds to a nearly 20% increase in infant mortality for both
men and women. This would imply that with baseline infant mortality rate 8/1000 (average
infant mortality over our study period) and a population of 60 million people with 0.6 million
infants (population size and age structure comparable to that of UK in 2009), the number of
infant deaths per year would increase by almost 1,000 if income inequality increased by 43%.
In the actual data we observe today, this is not the case because other factors, such as
increasing wealth, health, nutrition, medical care, and parental education, may offset this
effect. Thus the effect of income inequality on infant mortality needs to be interpreted as a
factor that may slow down the progress.
For mortality at ages 1-14, the coefficients are also positive and significant for both genders.
For women, the magnitude of the coefficient is larger, but as child mortality is higher for men
15

than for women, the absolute effect is slightly smaller than that of men. Again using U.K. as
the example for an increase in the Gini index, a 43% increase in income inequality would
correspond to 14% (1.43^0.373) increase in child mortality for men and 16% (1.43^0.424)
increase for women. However, since mortality rate at ages 1-14 is lower for women than for
men (in our data, on average 25% lower), the absolute effect is greater for men.
At ages 15-49, the male mortality coefficient for Gini index is still positive (0.285) and highly
significant (p<0.01). However, for women aged 15-49 the coefficient size is 40% smaller than
for men (0.171), and significant only at the p<0.10 level. A 43% increase in the Gini index,
which was observed in the U.K over the period 1975-2006, would correspond to a 11%
increase in male mortality but only 6% increase in female mortality at ages 15-49. This
increases the mortality rates for men from 1.9/1000 to 2.1/1000 and for women from 0.9/1000
to 1.0/1000. With a U.K. population size and age structure, these mortality changes would
correspond to approximately 3,100 excess male deaths but only 900 excess female deaths.
Conversely, if the Gini coefficient declined from 30 % (the average in our data) to 20% (the
minimum in our data), then in a population with the size and structure of U.K and baseline
mortality rates corresponding to the average in our sample, the number of lives saved between
ages 14-49 would be similar: be 3,100 for men and 900 for women.
For the GDP per head predictor, we observe both among men and women a negative and
significant association with all age-specific mortality rates. For both genders, the coefficients
are of similar magnitude and decrease with age. For both men and women, the coefficient -
0.30 at ages 1-14 suggests that a doubling of GDP per head would decrease child mortality by
30%. For ages 65-90, the corresponding decrease is 14% for both men and women. In
16
absolute terms, however, the impact is much larger at older ages as mortality at ages 65-90 is
approximately 200 times higher than mortality at ages 1-14.
Robustness checks
We checked if the results were sensitive to exclusion of single countries. The results were
robust against this check. We also checked if the inclusion of time fixed-effects would have
influenced the results by re-estimating the models without time controls; the results changed
only marginally. Finally, we estimated the models with income inequality lagged by one year.
The results did not change in any significant manner.
Discussion
Rodgers (1979) and Wilkinson (1992) were among the first to provide evidence for the
negative association between income inequality and population health. Part of recent research
based on longitudinal data, however, has failed to find support for the income inequality-
health hypothesis (Mellor and Milyo 2001; Beckfield 2004), and results from cross-sectional
data have been mixed (Judge et al. 1998; Ellison 2002; Gravelle et al. 2002; Dorling et al.
2007). Recently, Shkolnikov et al. (2009) used longitudinal data to analyze the association
between income inequality and life-expectancy losses, a measure of the variation in age at
death within a country, and found that income inequality explains cross- but not within-
country differences in variation in age at death. We used a similar analytical design to
Shkolnikov et al. (2009) to analyze how absolute measures of population health, namely life
expectancy and age-specific mortality, depend on income inequality. We analyzed the
association between income inequality and mortality by sex in 21 developed countries for the
period 1975-2006 and found income inequality to be an important predictor of infant and
17

child mortality for both sexes. In addition, income inequality predicted mortality at ages 15-
49 for men, but not for women.
These results shed new light on the income inequality-health hypothesis. A potential
explanation as to why our results differ from some earlier studies (Judge 1995; Judge et al.
1998; Bobak et al. 2000; Mellor and Milyo 2001; Gravelle et al. 2002; Beckfield 2004) is that
we focus only on developed countries (in contrast to Gravelle et al. 2002 and Beckfield
2004;); we exclude transition economies (in contrast to Bobak et al. 2000); and we use panel
data models which allow controlling for unobserved country heterogeneity (in contrast to
Gravelle et al. 2002; Judge 1995 and Judge et al. 1998). Finally, we consider separately
genders and different age groups (in contrast to Mellor & Milyo 2001 and Beckfield 2004).
We reach three main conclusions. First, results for life expectancy at birth do not reveal any
association between income inequality and population mortality. For both male and female,
regression coefficients are of the expected sign but very small and statistically not significant.
This is a key aspect since we also show that an analysis of age-specific mortality rates reveals
important income inequality-mortality links. Thus using life expectancy at birth as the single
measure of population mortality hides important associations. Therefore, this constitutes an
important limitation in some previous studies (Judge et al. 1998; Mellor and Milyo 2001;
Gravelle et al. 2002; Beckfield 2004).
Second, when considering infant mortality and child mortality up to age 14, we find that
increases in income inequality increases mortality for both genders. The life expectancy
measures do not find this because life expectancy at birth includes all ages and therefore
includes also age intervals when the association might be close to zero, slightly positive and
18

insignificant. In addition, in developed world the influence of mortality at ages below 50 on
life expectancy is limited.
Our finding on infant mortality is consistent with prior research (Wennemo 1993; Hales et al.
1999; Lynch et al. 2001). The mechanisms through which income inequality increases infant
mortality, however, are not known. Infant mortality is strongly linked to poverty and social
exclusion. Social underinvestment in services directed at mothers-to-be and their babies, as
well as a lack of monetary support to families are likely candidates as mediators (Marmot
2003; Lundberg et al. 2008). It is possible that in societies with higher income inequality
parents have to struggle more in order to maintain or improve their status in the social
hierarchy. As a consequence, parents may invest, in relative terms, more energy in work in the
attempt to avoid falling back in the social ladder, rather than investing in their children’s well-
being. Increasing income inequality may also increase stress levels. Stress, in turn, is related
to pre-term births and short gestational length, both of which increase the probability of infant
death (Huynh et al. 2005).
Our results show that the positive link between income inequality and mortality at ages 1-14
is similar for girls and for boys. This is consistent with recent individual level research
(Collison, Dey, Hannah, & Stevenson, 2007; Pickett, & Wilkinson, 2007). As with infant
mortality, at this stage of life the effect of income inequality on health is conveyed on the
children through parents’ resources and investment in offspring care. As discussed by
Macinko et al. (2003), higher inequality may translate into higher levels of social stress; lower
equality in access to resources; fewer investments in infrastructure and social security systems
directed to the poorest; lower levels of social cohesion; and less trust and less mutual
cooperation and higher opportunity costs for the parents. In particular, the opportunity cost of
19

time in uneven societies is higher: parents have to struggle more to maintain or improve their
position in the social ladder. Indeed, recent economic literature suggests that income
inequality is associated with longer work hours and increase in household debt between
(Bowles & Park 2005; Iacoviello 2008). Parents may then be forced to spend more time
working rather then raising the offspring. This may hinder the children’s health and their
probability of surviving, especially among those disabled or ill who require more resources
and investment from the parents than an average child.
Third, we observe an important difference between genders in the association between income
distribution and health when we focus on adults aged 15-49. For this age interval, we find a
strong positive association between income inequality and mortality for men. For women, the
association is weaker and only marginally significant. Backlund et al. (2007) found a similar
gender difference for ages 25-64 in an analysis of 50 U.S. states: income inequality was
associated more with male than female mortality. Dorling et al. (2007) also found a gender
difference in favor of women using data for OECD countries. A plausible explanation for this
gender difference comes from sexual selection theory that among young adults, men have
higher incentive than women to compete and advance their position in the social hierarchy as
higher status increases the success in finding a mate more for men than it does for women
(Kruger 2010). Therefore higher income inequality cannot but foster a stronger competition
and risk-taking behaviors. The male-male competition may also increase testosterone levels
and increase the propensity to take potentially fatal risks (Ferrini and Barrett-Connor 1998;
Wilson et al. 2002). Moreover, in societies where men are typically the bread-winners, men
by definition carry higher responsibility for supporting the family financially. In an unequal
society, men may be more exposed to the stress of maintaining or improving the family’s
socioeconomic status. A step forward from our analysis would be to look at how income
20

inequality influences male excess mortality. An analysis by cause of death would also allow a
better understanding on which pathways are at work in explaining this association.
Finally, for the ages above 50, we do not find any association between mortality and income
inequality. It is possible that at later stages of adulthood as well as at old ages, most men have
secured their position in the social hierarchy and most mating and reproduction have already
taken place. Consequently, there is less incentive to adopt competitive and risk-taking
behaviors that hinder men’s health. This hypothesis would be consistent with the fact that
male testosterone levels, which are correlated with risk-taking behavior, decrease with age
(Ferrini and Barrett-Connor 1998). Alternative explanation could be selection, so that those
who survived to age 50 either were never affected by the negative effects of the income
inequality or represent the selected successful individuals.
In summary, our results show that in developed countries income inequality has an important
effect on child and adult mortality, but not on old-age mortality. The importance of average
income level, however, is higher than the importance of income distribution. Nevertheless,
our results suggest that the recent skepticism (Gravelle et al. 2002; Lynch and Smith 2002) on
the income inequality-health hypothesis needs to be reconsidered. While our population level
analysis cannot disentangle the problem related to the concave association between income
and individual health, our analysis shows that societies where income distribution is equal
have lower infant, child and young adult mortality than societies where income distribution is
unequal. Moreover, income distribution is associated more with young adult men than women
mortality, introducing an interesting and relevant gender difference worth of further study.
Given the importance of health on productivity as well as sustainability of an aging society,
redistributive policies aimed at reducing income inequality might lead, in addition to
improved population health, to general positive spillover effects in the society.
21
References
Babones, S.J. 2008. "Income inequality and population health: Correlation and causality."
Social Science & Medicine 66(7): 1614-1626.
Backlund, E., G. Rowe, J. Lynch, M.C. Wolfson, G.A. Kaplan, and P.D. Sorlie. 2007.
"Income inequality and mortality: a multilevel prospective study of 521 248 individuals in 50
US states." Int. J. Epidemiol. 36(3): 590-596.
Baltagi, B.H.and P.X. Wu. 1999. "Unequally Spaced Panel Data Regressions with AR(1)
Disturbances." Econometric Theory 15(6): 814-823.
Beckfield, J. 2004. "Does Income Inequality Harm Health? New Cross-National Evidence."
Journal of Health and Social Behavior 45(3): 231-248.
Biggs, B., King, L., Basu, S., & Stuckler, D. 2010. "Is wealthier always healthier? The impact
of national income level, inequality, and poverty on public health in Latin America." Social
Science & Medicine 71(2): 266-73.
Bobak, M., H. Pikhart, R. Rose, C. Hertzman, and M. Marmot. 2000. "Socioeconomic factors,
material inequalities, and perceived control in self-rated health: cross-sectional data from
seven post-communist countries." Social Science & Medicine 51(9): 1343-1350.
Bowles, S., & Park, Y. 2005. "Emulation, Inequality, and Work Hours: Was Thorsten Veblen
Right?" The Economic Journal 115(507): F397-412.
Collison, D., Dey, C., Hannah, G., & Stevenson, L. 2007. "Income inequality and child
mortality in wealthy nations." Journal of Public Health 29(2): 114-117.
Courtenay, W.H. 2000. "Constructions of masculinity and their influence on men's well-
being: a theory of gender and health." Social Science & Medicine 50(10): 1385-401.
22

De Vogli, R., R. Mistry, R. Gnesotto, and G.A. Cornia. 2005. "Has the relation between
income inequality and life expectancy disappeared? Evidence from Italy and top
industrialized countries." J Epidemiology and Community Health 59(2): 158-162.
Dorling, D., R. Mitchell, and J. Pearce. 2007. "The global impact of income inequality on
health by age: an observational study." BMJ 335(7625): 873-.
Ellison, G.T.H. 2002. "Letting the Gini out of the bottle? Challenges facing the relative
income hypothesis." Social Science & Medicine 54(4): 561-576.
Ferrini, R.L.and E. Barrett-Connor. 1998. "Sex Hormones and Age: A Cross-sectional Study
of Testosterone and Estradiol and Their Bioavailable Fractions in Community-dwelling Men."
Am. J. Epidemiol. 147(8): 750-754.
Förster, M.and M. Mira d'Ercole. 2005. "Income Distribution and Poverty in OECD Countries
in the Second Half of the 1990s." OECD Social, Employment and Migration Working
Papers(22).
Gravelle, H. 1998. "How much of the relation between population mortality and unequal
distribution of income is a statistical artefact?" BMJ 316(7128): 382-385.
Gravelle, H., J. Wildman, and M. Sutton. 2002. "Income, income inequality and health: what
can we learn from aggregate data?" Social Science & Medicine 54(4): 577-589.
Hales, S., P. Howden-Chapman, C. Salmond, A. Woodward, and J. Mackenbach. 1999.
"National infant mortality rates in relation to gross national product and distribution of
income." The Lancet 354(9195): 2047-2047.
Heerink, N., A. Mulatu, and E. Bulte. 2001. "Income inequality and the environment:
aggregation bias in environmental Kuznets curves." Ecological Economics 38(3): 359-367.
23

Human Mortality Database. (2010). University of California, Berkeley (USA) and Max
Planck Institute for Demographic Research (Germany). Available at
http://www.mortality.org/ (Accessed in March 2010).
Huynh, M., J.D. Parker, S. Harper, E. Pamuk, and K.C. Schoendorf. 2005. "Contextual effect
of income inequality on birth outcomes." Int. J. Epidemiol. 34(4): 888-895.
Iacoviello, M. (2008). "Household Debt and Income Inequality, 1963-2003." Journal of
Money, Credit and Banking 40(5): 929-965.
Idrovo, A.J., Ruiz-Rodriguez, M., & Manzano-Patino, A.P. 2010. "Beyond the income
inequality hypothesis and human health: a worldwide exploration." Rev Saude Publica 44(4):
695-702.
Jen, M.H., Jones, K., & Johnston, R. 2009. "Global variations in health: evaluating
Wilkinson's income inequality hypothesis using the World Values Survey." Social Science &
Medicine 68(4): 643-53.
Jones, R.S. 2007. "Income Inequality, Poverty and Social Spending in Japan." OECD
Economics Department Working Papers No. 556.
Judge, K. 1995. "Income distribution and life expectancy: a critical appraisal." BMJ
311(7015): 1282-1285.
Judge, K., J.-A. Mulligan, and M. Benzeval. 1998. "Income inequality and population health."
Social Science & Medicine 46(4-5): 567-579.
Kaplan, G., E. Pamuk, J. Lynch, and J. Balfour. 1996. "Inequality in income and mortality in
the United States: analysis of mortality and potential pathways." BMJ 312(7037): 999-1003.
24

Karlsson, M., Nilsson, T., Lyttkens, C.H., & Leeson, G. 2009. "Income inequality and health:
importance of a cross-country perspective." Social Science & Medicine 70(6): 875-85.
Kawachi, I.and B.P. Kennedy. 1997. "The relationship of income inequality to mortality:
Does the choice of indicator matter?" Social Science & Medicine 45(7): 1121-1127.
Kawachi, I. and Kennedy, B. P. 1999. "Income inequality and health: pathways and
mechanisms." Health Services research 34(1 Pt 2): 215-227.
Kruger, D.J. 2010. " Socio-demographic factors intensifying male mating competition
exacerbate male mortality rates." Evolutionary Psychology 8(2): 194-204.
Lundberg, O., Yngwe, M.A., Stjärne, M.K., Elstad, J.I., Ferrarini, T., Kangas, O., Norström,
T., Palme, J., Fritzell, J., NEWS Nordic Expert Group. 2008. "The role of welfare state
principles and generosity in social policy programmes for public health: an international
comparative study." Lancet 372(9650): 1633-40.
Lynch, J.and G.D. Smith. 2002. "Commentary: Income inequality and health: The end of the
story?" Int. J. Epidemiol. 31(3): 549-551.
Lynch, J., G.D. Smith, S. Harper, M. Hillemeier, N. Ross, G.A. Kaplan, and M. Wolfson.
2004. "Is Income Inequality a Determinant of Population Health? Part 1. A Systematic
Review." The Milbank Quarterly 82(1): 5-99.
Lynch, J., G.D. Smith, M. Hillemeier, M. Shaw, T. Raghunathan, and G. Kaplan. 2001.
"Income inequality, the psychosocial environment, and health: comparisons of wealthy
nations." The Lancet 358(9277): 194-200.
25

Lynch, J., G.D. Smith, G.A. Kaplan, and J.S. House. 2000. "Income inequality and mortality:
importance to health of individual income, psychosocial environment, or material conditions."
BMJ 320(7243): 1200-1204.
Macinko, J.A., L. Shi, B. Starfield, and J.T. Wulu, Jr. 2003. "Income Inequality and Health: A
Critical Review of the Literature." Med Care Res Rev 60(4): 407-452.
Marmot, M.G. 2003. "Understanding Social Inequalities in Health." Perspectives in Biology
and Medicine 46(3): S9-S23.
McIsaac, S.J.and R.G. Wilkinson. 1997. "Income distribution and cause-specific mortality."
Eur J Public Health 7(1): 45-53.
Mellor, J.M.and J. Milyo. 2001. "Reexamining the Evidence of an Ecological Association
between Income Inequality and Health." Journal of Health Politics Policy and Law 26(3):
487-522.
Moore, S. 2006. "Peripherality, income inequality, and life expectancy: revisiting the income
inequality hypothesis." Int. J. Epidemiol. 35(3): 623-632.
OECD.Stat. 2008. Organization for Economic Development and Cooperation. Available at
http://stats.oecd.org/index.aspx?r=242437
Pampel, F.C.and C. Zimmer. 1989. "Female labour force activity and the sex differential in
mortality: Comparisons across developed nations, 1950–1980." European Journal of
Population/Revue européenne de Démographie 5(3): 281-304.
Pickett, K.E., & Wilkinson, R.G. 2007. "Child wellbeing and income inequality in rich
societies: ecological cross sectional study." BMJ 335(7629): 1080.
26

Porta, M., C. Borrell, and J.L. Copete. 2002. "Commentary: Theory in the fabric of evidence
on the health effects of inequalities in income distribution." Int. J. Epidemiol. 31(3): 543-546.
Preston, S.H. 1975. "The Changing Relation between Mortality and Level of Economic
Development." Population Studies 29(2): 231-248.
Ram, R. 2006. "Further examination of the cross-country association between income
inequality and population health." Social Science & Medicine 62(3): 779-91.
Rodgers, G.B. 1979. "Income and Inequality as Determinants of Mortality: An International
Cross-Section Analysis." Population Studies 33(2): 343-351.
Shkolnikov, V., E.M. Andreev, Z. Zhang, J. Oeppen, and J.W. Vaupel. 2009. "Losses of
expected lifetime in the US and other developed countries: methods and empirical analyses."
MPIDR Working Paper.
Shmueli, A. 2004. "Population health and income inequality: new evidence from Israeli time-
series analysis." Int. J. Epidemiol. 33(2): 311-317.
Stuckler, D., L. King, and M. McKee. 2009. "Mass privatisation and the post-communist
mortality crisis: a cross-national analysis." The Lancet 373(9661): 399-407.
Subramanian, S.V. and I. Kawachi. 2004. "Income Inequality and Health: What Have We
Learned So Far?" Epidemiol Rev 26(1): 78-91.
UNU-WIDER World Income Inequality Database, Version 2.0c. 2008. United Nations
University-World Institute for Development Economics Research. Available at
http://www.wider.unu.edu/research/Database/en_GB/database/
27

Wagstaff, A. and E. van Doorslaer. 2000. "Income inequality and health: What does the
literature tell us?" Annual Review of Public Health 21: 543-567.
Waldmann, R.J. 1992. "Income Distribution and Infant Mortality." The Quarterly Journal of
Economics 107(4): 1283-1302.
Wennemo, I. 1993. "Infant mortality, public policy and inequality: a comparison of 18
industrialised countries 1950-85." Sociology of Health & Illness 15(4): 429-446.
Wilkinson, R.G. 1992. "Income Distribution And Life Expectancy." BMJ: British Medical
Journal 304(6820): 165-168.
Wilkinson, R. G. 1999. "Two Pathways, but How Much Do They Diverge?" BMJ: British
Medical Journal 319(7215): 956-957.
Wilkinson, R.G. and K.E. Pickett. 2006. "Income inequality and population health: A review
and explanation of the evidence." Social Science & Medicine 62(7): 1768-1784.
Wilkinson, R.G. and K.E. Pickett. 2009. "Income Inequality and Social Dysfunction." Annual
Review of Sociology 35(1): 493-511.
Wilson, M., Daly, M., & Pound, N. 2002. "An evolutionary psychological perspective on the
modulation of competitive confrontation and risk taking." Hormones, Brain and Behavior 5:
381-408.
Wolfson, M., G. Kaplan, J. Lynch, N. Ross, E. Backlund, H. Gravelle, and R.G. Wilkinson.
1999. "Relation between income inequality and mortality: empirical demonstration •
Diminishing returns to aggregate level studies • Two pathways, but how much do they
diverge?" BMJ 319(7215): 953-957.
28

Wooldridge, J. 2001. Econometric Analysis of Cross Section and Panel Data: The MIT Press.
World Economic Outlook Database. 2008. International Monetary Fund. Available at
https://www.imf.org/external/ns/cs.aspx?id=28
29

APPENDIX
List of sample countries
Austria, Belgium, Canada, Denmark, United Kingdom, Finland, France, Germany, West
Germany, Iceland, Italy, Luxembourg, Netherlands, New Zealand, Norway, Portugal, Spain,
Sweden, Switzerland, Taiwan and United States.
30

TABLES AND FIGURES
Table 1.
Descriptive statistics on the Gini Coefficient, GDP per head, life expectancy and age-specific
mortality.
N=551 Mean Std. dev. Min. Max.
Gini coefficient (%) 29.79 5.11 20.32 46.54 GDP per head $19,048 $10,054 $3,071 $78,138 MALE Life expectancy at birth 73.10 2.60 65.14 79.49 Mortality rates by age 0 8.81 4.81 1.34 45.27 1-14 0.33 0.16 0.06 1.16 15-49 1.92 0.50 0.73 3.41 50-64 11.51 2.66 6.03 19.76 65-90 63.05 7.75 45.93 84.89 FEMALE Life expectancy at birth 79.35 2.18 73.55 84.13 Mortality rates by age 0 6.96 3.68 1.00 35.95 1-14 0.24 0.11 0.00 0.87 15-49 0.92 0.21 0.49 1.62 50-64 5.82 1.32 3.06 10.58 65-90 45.71 6.28 30.40 64.32
Note: Data on GDP per head are from the OECD on-line database (with the only exception of
Taiwan, for which data are from the IMF web-site) and are expressed in US$, constant prices
and PPP’s (2000); data on Gini coefficients are from the WIID database, version 2008; data
on mortality rates and life expectancy at birth are from the Human Mortality Database (2010).
Mortality rates are here expressed in per thousand person-years.
31
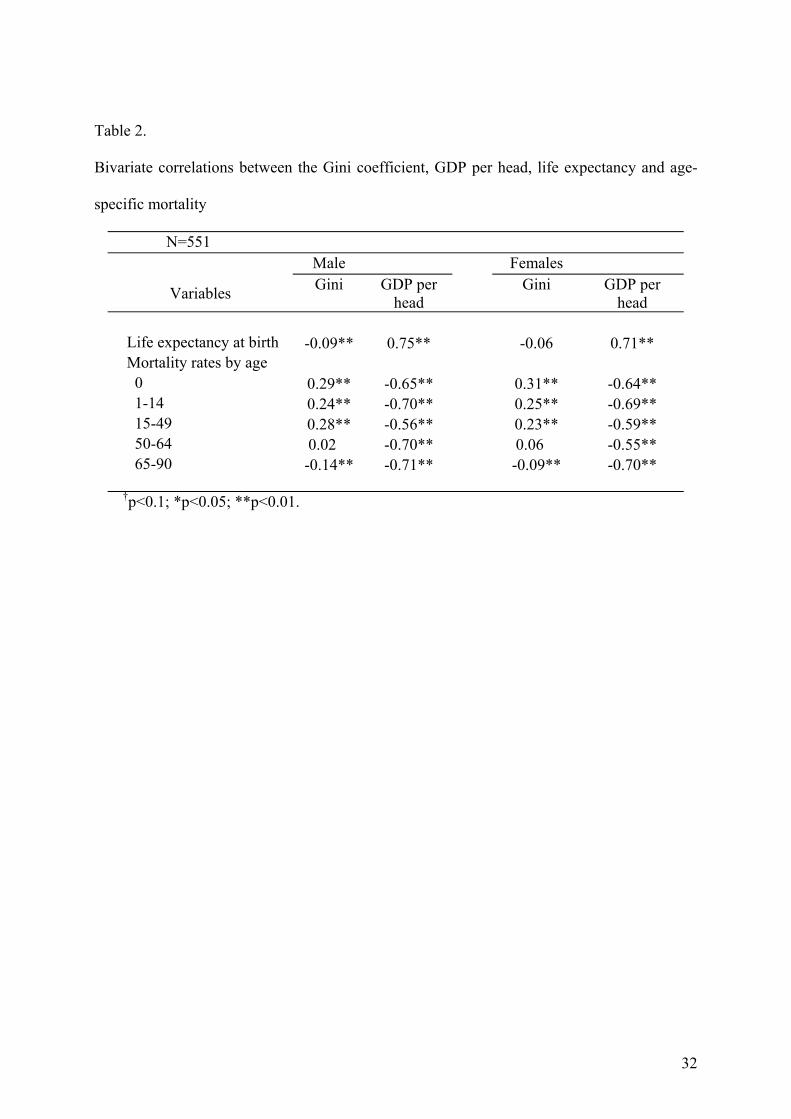
Table 2.
Bivariate correlations between the Gini coefficient, GDP per head, life expectancy and age-
specific mortality
N=551 Male Females
Variables Gini GDP per head
Gini GDP per head
Life expectancy at birth -0.09** 0.75** -0.06 0.71** Mortality rates by age 0 0.29** -0.65** 0.31** -0.64** 1-14 0.24** -0.70** 0.25** -0.69** 15-49 0.28** -0.56** 0.23** -0.59** 50-64 0.02 -0.70** 0.06 -0.55** 65-90 -0.14** -0.71** -0.09** -0.70**
†p<0.1; *p<0.05; **p<0.01.
32

Table 3.
Regression results of life expectancy and age-specific mortality on Gini index and GDP per
head.
N=551 Male Females
Response Variable Gini GDP per head R2 Gini GDP per head R2
Life expectancy at birth -0.011 0.055** 0.65 -0.014 0.045** 0.59 Mortality rates by age Age 0 0.470** -0.648** 0.70 0.465** -0.634** 0.68 Ages 1-14 0.373** -0.512** 0.75 0.424** -0.493** 0.75 Ages 15-49 0.285* -0.295** 0.40 0.171† -0.304** 0.45 Ages 50-64 -0.031 -0.308** 0.57 0.038 -0.288** 0.33 Ages 65-90 -0.025 -0.213** 0.58 0.055 -0.220** 0.54
†p<0.1; *p<0.05; **p<0.01. Standard errors in parenthesis
Note: Twelve models are estimated (six dependent variables, men and women separately)
using a panel of 21 countries from 1975 to 2006. All variables are expressed in logarithmic
scale. The models control for GDP per head, country random-effects and time fixed-effects
(five year intervals starting from 1975 with the exception of 2000-2006, for which the interval
is 7 years long) and allow for autocorrelation in the residuals.
33

Figure 1.
Regression coefficients for Gini index of income inequality on age-specific mortality rates.
Note: The coefficients are shown in Table 3. The models are estimated with all variables in
log scale and control for GDP per capita, country random-effects and time fixed-effects and
allow for autocorrelation in the residuals.
34