Income in the United States: 2002 - Census.gov Citation DeNavas-Walt, Carmen, Robert Cleveland and...
35
U S C E N S U S B U R E A U Helping You Make Informed Decisions Issued September 2003 P60-221 Income in the United States: 2002 Demographic Programs By Carmen DeNavas-Walt Robert W. Cleveland Bruce H. Webster, Jr. A U.S. Department of Commerce Economics and Statistics Administration U.S. CENSUS BUREAU Current Population Reports Consumer Income
Transcript of Income in the United States: 2002 - Census.gov Citation DeNavas-Walt, Carmen, Robert Cleveland and...

U S C E N S U S B U R E A UHelping You Make Informed Decisions
Issued September 2003
P60-221
Income in the United States: 2002
Demographic Programs
ByCarmen DeNavas-WaltRobert W. ClevelandBruce H. Webster, Jr.
A
U.S.Department of CommerceEconomics and Statistics Administration
U.S. CENSUS BUREAU
Current Population Reports
Consumer Income
P60
-22
1U
S C E N
S U S B
U R
E A U
Inco
me in
the U
nited
States: 20
02 C
urre
nt P
op
ula
tion
Rep
orts C
onsu
mer In
come
U.S. Department of CommerceEconomics and Statistics AdministrationU.S. CENSUS BUREAUWashington, DC 20233
OFFICIAL BUSINESS
Penalty for Private Use $300
FIRST-CLASS MAILPOSTAGE & FEES PAIDU.S. Census Bureau
Permit No. G-58

This report was prepared under the direction of Edward J. Welniak Jr., Chief of the Income Surveys Branch. Diana Marz andRuth E. Davis provided statistical assistance. Doris Sansbury pro-vided clerical assistance. Charles T. Nelson, Assistant DivisionChief for Income, Poverty, and Health Statistics, Housing andHousehold Economic Statistics Division, provided overall direction.
David Nguyen and John Dinh, Demographic Surveys Division,processed the Current Population Survey 2003 Annual Social andEconomic Supplement file. Caroline S. Carbaugh, Chief of theSurvey Processing Branch, Stacy J. Lyons, Mary Thrift Bush, KirkE. Davis, Jaime L. Hasiuk, and Thy K. Le programmed thedetailed tables.
Aneesah Stephenson of the Demographic Statistical MethodsDivision conducted sampling review.
Tim J. Marshall, Demographic Surveys Division, and Andrew M.Stevenson, Technologies Management Office, prepared and pro-grammed the computer-assisted interviewing instrument used toconduct the Annual Social and Economic Supplement.
U.S. Census Bureau field representatives and telephone interviewerscollected the data. Without their dedication, the preparation of thisreport or any report from the Current Population Survey would beimpossible.
Greg Carroll, Penny Heiston, Jan Sweeney, and Mary Stinson ofthe Administrative and Customer Services Division, Walter C. Odom,Chief, provided publications and printing management, graphicsdesign and composition, and editorial review for print and electronicmedia. General direction and production management were providedby Susan L. Rappa, Chief, Publications Services Branch.
Acknowledgments

U.S. Department of CommerceDonald L. Evans,
Secretary
Samuel W. Bodman,Deputy Secretary
Economics and Statistics AdministrationKathleen B. Cooper,
Under Secretary for Economic Affairs
U.S. CENSUS BUREAUCharles Louis Kincannon,
Director
Income in theUnited States: 2002
P60-221
Issued September 2003
Suggested Citation
DeNavas-Walt, Carmen,Robert Cleveland and Bruce H.
Webster, Jr., U.S. Census Bureau,Current Population Reports, P60-221,
Income in the United States: 2002,U.S. Government Printing Office,
Washington, DC, 2003.
ECONOMICS
AND STATISTICS
ADMINISTRATION
Economics and StatisticsAdministration
Kathleen B. Cooper,Under Secretary for Economic Affairs
U.S. CENSUS BUREAU
Charles Louis Kincannon,Director
Hermann Habermann,Deputy Director and Chief Operating Officer
Vacant,Principal Associate Director for Programs
Nancy M. Gordon,Associate Director for Demographic Programs
Daniel H. Weinberg,Chief, Housing and Household Economic Statistics Division
For sale by the Superintendent of Documents, U.S. Government Printing Office
Internet: bookstore.gpo.gov Phone: toll-free 866-512-1800; DC area 202-512-1800
Fax: 202-512-2250 Mail: Stop SSOP, Washington, DC 20402-0001

U.S. Census Bureau Income in the United States: 2002 iii
TEXT
Introduction . . . . . . . . . . . . . . . . . . . . . . . . . . . . . . . . . . . . . . . . . . 1Highlights . . . . . . . . . . . . . . . . . . . . . . . . . . . . . . . . . . . . . . . . . . . . 1Income in the United States . . . . . . . . . . . . . . . . . . . . . . . . . . . . . . . 2
Race and Hispanic Origin . . . . . . . . . . . . . . . . . . . . . . . . . . . . . . 2Income During Recessions . . . . . . . . . . . . . . . . . . . . . . . . . . . . . 7
Other Findings . . . . . . . . . . . . . . . . . . . . . . . . . . . . . . . . . . . . . . . . 7Household Composition . . . . . . . . . . . . . . . . . . . . . . . . . . . . . . . 7Nativity . . . . . . . . . . . . . . . . . . . . . . . . . . . . . . . . . . . . . . . . . . . 8Regions . . . . . . . . . . . . . . . . . . . . . . . . . . . . . . . . . . . . . . . . . . . 8Residence . . . . . . . . . . . . . . . . . . . . . . . . . . . . . . . . . . . . . . . . . 8Work Experience and Earnings . . . . . . . . . . . . . . . . . . . . . . . . . . 10Per Capita Income . . . . . . . . . . . . . . . . . . . . . . . . . . . . . . . . . . . 11State Income . . . . . . . . . . . . . . . . . . . . . . . . . . . . . . . . . . . . . . . 11
Income Inequality . . . . . . . . . . . . . . . . . . . . . . . . . . . . . . . . . . . . . . 14
The Effects of Including Noncash Benefits and Taxes on Estimates of Income . . . . . . . . . . . . . . . . . . . . . . . . . . . . . . . . . . . 15
CPS Data Collection . . . . . . . . . . . . . . . . . . . . . . . . . . . . . . . . . . . . . 16
User Comments . . . . . . . . . . . . . . . . . . . . . . . . . . . . . . . . . . . . . . . . 16
TEXT TABLES
1. Household Income by Race and Hispanic Origin and Income Definition: 2001 and 2002 . . . . . . . . . . . . . . . . . . . . . . . . 3
2. Change in Real Median Household Income During Recessions by Income Definition . . . . . . . . . . . . . . . . . . . . . . . . . . . . . . . . . . 7
3. Comparison of Summary Measures of Money Income and Earnings by Selected Characteristics: 2001 and 2002 . . . . . . . . . . 9
4. Per Capita Money Income by Race and Hispanic Origin: 2001 and 2002 . . . . . . . . . . . . . . . . . . . . . . . . . . . . . . . . . . . . . . 11
5. Money Income of Households by State Using 2- and 3-Year-Average Medians . . . . . . . . . . . . . . . . . . . . . . . . . . . . . . . . 12
6. Median Household Income by Income Definition: 2001 and 2002 . . 147. Percentage of Aggregate Household Income Received by
Income Quintiles and Gini Index by Income Definition: 2001 and 2002 . . . . . . . . . . . . . . . . . . . . . . . . . . . . . . . . . . . . . . 15
FIGURES
1. Median Household Income by Race and Hispanic Origin of Householder and Income Definition: 2002 . . . . . . . . . . . . . . . . . 6
2. Median Household Income by Income Definition: 1967 to 2002 . . 83. Median Earnings of Full-Time, Year-Round Workers 15 Years
Old and Over by Sex: 1967 to 2002 . . . . . . . . . . . . . . . . . . . . . 104. Percent Change in 2-Year-Average Median Household Income
by State: 2001-2002 Less 2000-2001 . . . . . . . . . . . . . . . . . . . . 13
Contents

Appendix A.HISTORICAL INCOME
A-1. Households by Total Money Income, Race, and Hispanic Origin of Householder: 1967 to 2002 . . . . . . . . . . . . . . . . . . .17
A-2. Median Household Income for Selected Definitions of Income by Race and Hispanic Origin of Householder: 1979 to 2002 . . . . .22
A-3. Share of Aggregate Income Received by Each Fifth and Top 5 Percent of Households: 1967 to 2002 . . . . . . . . . . . . . .25
A-4. Selected Measures of Household Income Dispersion: 1967 to 2002 . . . . . . . . . . . . . . . . . . . . . . . . . . . . . . . . . . . . .26

INTRODUCTION
The 2002 median household moneyincome in the United States was$42,409, representing a 1.1 percentreal decline from its 2001 level of$42,900.1 By type of residence, thedecline in median household moneyincome was experienced mainly byhouseholds in metropolitan areas.Both family and nonfamily house-holds also experienced declines inmoney income. In contrast, bothmen and women who were full-time, year-round workers in 2002experienced increases in their medi-an earnings. Income inequality asmeasured by money income did not change.
Traditionally, income data inCensus Bureau reports have beenbased on the amount of moneypeople or households receive dur-ing a calendar year. This income
concept is limited and does notprovide a completely satisfactorymeasure of economic well-being.For example, it does not includethe effect of taxes and, therefore,does not reflect the effect of taxlaw changes on economic well-being. Similarly, this conceptexcludes the effect of noncashbenefits (such as employer-provid-ed group health insurance, foodstamps, school lunches, and hous-ing assistance), which certainlyenhance economic well-being.
This report features four alterna-tive income measures that deductpayroll, federal, and state incometaxes and includes the value ofvarious noncash benefits — foodstamps, school lunches, housingsubsidies, health programs, andreturn on home equity. Of thesefour alternative income definitions,only one showed a real decline inmedian household income between2001 and 2002 — money incomeless taxes declined 0.8 percentfrom $37,376 to $37,066. Theother three were unchanged.
HIGHLIGHTS
Most of the estimates described inthis section are shown in Table 1,
Table 3, Table 7, and AppendixTable A-1; the estimates for statesare shown in Table 5.
• Real median household moneyincome declined by 1.1 percentbetween 2001 and 2002 to alevel of $42,409. This is thesecond consecutive annualdecline in median householdmoney income.
• Real median household incomewas unchanged between 2001and 2002 for three of the fouralternative income definitionshighlighted in this report. Thefourth, real median householdincome less taxes, declined 0.8 percent.
• Real median household moneyincome declined for all racegroups except those with aWhite or Asian (and no otherrace) householder. However,under the alternative incomedefinitions, most groups experi-enced no change. Only house-holds with householders whowere Asian or Native Hawaiianand Other Pacific Islander expe-rienced a real decline in medianhousehold income.
U.S. Census Bureau Income in the United States: 2002 1
Income in the United States: 2002
The estimates in this report are based on data col-lected by the 2003 Current Population SurveyAnnual Social and Economic Supplement (ASEC wasformerly called the Annual DemographicSupplement or the March Income Supplement) con-ducted by the U.S. Census Bureau. As with all sur-veys, the estimates may differ from the actual
values because of sampling variation or other fac-tors. All statements in this report have undergonestatistical testing, and all comparisons are signifi-cant at the 90-percent confidence level unless other-wise noted. For further information about thesource and accuracy of the estimates, go towww.census.gov/hhes/income/income02.sa.pdf.
1 All income values are in 2002 dollars.Changes in real income refer to comparisonsafter adjusting for inflation. The percentagechanges in prices between earlier years and2002 were computed by dividing the annualaverage Consumer Price Index for 2002 bythe annual average for earlier years. TheCPI-U values for 1947 to 2002 are availableon the Internet at: www.census.gov/hhes/income/income02/cpiurs.html; click on“Annual Average Consumer Price Index (CPI-U-RS): 1947 to 2002.” Inflation between2001 and 2002 was 1.6 percent.
Source of Estimates; Statistical Accuracy

• The real median money incomeof both family and nonfamilyhouseholds declined between2001 and 2002. Overall, familyhousehold income dropped 0.8 percent to $52,704.Nonfamily households experi-enced a decline of 2.4 percentto $25,406.
• The real median money incomeof households in the Midwestdeclined, for the second consec-utive year, to $43,622. Theincomes of households in theother regions remainedunchanged.
• For the second consecutive year,real median money incomedeclined for households insidemetropolitan areas, by 1.5 per-cent, to $45,257.
• Per capita money incomedeclined by 1.8 percent, in realterms, between 2001 and 2002to $22,794. This is the firstannual decline in per capitaincome since 1991.
• Based on comparisons of 2-year-average medians (comparing2000-2001 with 2001-2002),real median household incomerose for one state (Oklahoma),and declined for ten states andthe District of Columbia. Fourof the states that experienceddeclines were in the Midwest(Illinois, Michigan, Missouri, andOhio), three in the South(Florida, Mississippi, and NorthCarolina), and three in the West(Hawaii, Nevada, and Oregon).
• Both the Gini index of incomeinequality and the quintileshares of aggregate income indi-cated no change in householdmoney income inequalitybetween 2001 and 2002, but
income inequality declinedbetween 2001 and 2002 undereach of the four alternativeincome definitions.
INCOME IN THE UNITED STATES
Real median money incomedeclined 1.1 percent between 2001and 2002 to $42,409. Under alter-native income definition MI-Tx,median household income was$37,066, 0.8 percent lower in realterms than its 2001 level (see,“What are . . . definitions ofincome?”). None of the other alter-native income definitions showed astatistically significant change from
2001. For income definition MI-Tx+NC-MM, 2002 median house-hold income was $39,426, for defi-nition MI-Tx+NC, it was $42,061,and for definition MI-Tx+NC+HE, itwas $43,760.
Race and Hispanic Origin
The money income definitionshows that real median income didnot change between 2001 and2002 for households with a non-Hispanic householder who report-ed White as his or her only racecategory and households withhouseholders who reported Asianas his or her only race category.Real median household income
2 Income in the United States: 2002 U.S. Census Bureau
What are. . . definitions of income?
Money Income (MI) is collected for all people in the sample 15 yearsold and over. Money income includes earnings, unemployment com-pensation, workers’ compensation, social security, supplementalsecurity income, public assistance, veterans’ payments, survivor ben-efits, pension or retirement income, interest, dividends, rents, royal-ties, income from estates, trusts, educational assistance, alimony,child support, assistance from outside the household, and other mis-cellaneous sources. It is income before deductions for taxes or otherexpenses and does not include lump-sum payments or capital gains.
MI - Tx is money income plus realized capital gains (losses), lessfederal and state income taxes, and less payroll taxes.
MI - Tx + NC - MM is money income, plus realized capital gains(losses), less federal and state income taxes, less payroll taxes, plusthe value of employer-provided health benefits and the value of allnoncash transfers except medicare and medicaid. Noncash transfersinclude food stamps, rent subsidies, and free and reduced-priceschool lunches.
MI - Tx + NC is money income plus realized capital gains (losses),less federal and state income taxes, less payroll taxes, plus the valueof employer-provided health benefits and all noncash transfers.
MI - Tx + NC + HE is money income plus realized capital gains(losses), less federal and state income taxes, less payroll taxes, plusthe value of employer-provided health benefits and all noncash trans-fers, plus the annual benefits of converting one’s home equity intoan annuity, net of property taxes.
declined for each of the remainingrace groups and for households ofHispanic origin.2
The money income definition showsthat real median income declinedby 2.5 percent for households with
householders who reported his orher race was Black (and may or maynot have reported another race) andby 3.0 percent for households withhouseholders who reported Black ashis or her only race. Real medianincome declined by 4.0 percent forhouseholds with householders whoreported only Asian or Asian andanother race and by 4.5 percent forhouseholds with householders whoreported his or her race as either
U.S. Census Bureau Income in the United States: 2002 3
2 Because Hispanics may be of any race,data in this report for Hispanics overlap withdata for racial groups. Hispanic origin wasreported by 11.4 percent of White house-holders who reported only one race; 3.5 per-cent for Black householders who reportedonly one race; 27.3 percent for AmericanIndian or Alaska Native householders whoreported only one race; 1.4 percent for Asianhouseholders who reported only one race;
and 19.0 percent for Native Hawaiian andOther Pacific Islander householders whoreported only one race. Data users shouldexercise caution when interpreting aggregateresults for the Hispanic population or forrace groups because these populations con-sist of many distinct groups that differ insocio-economic characteristics, culture, andrecency of immigration. Data were first col-lected for Hispanics in 1972 and Asians andPacific Islanders in 1987.
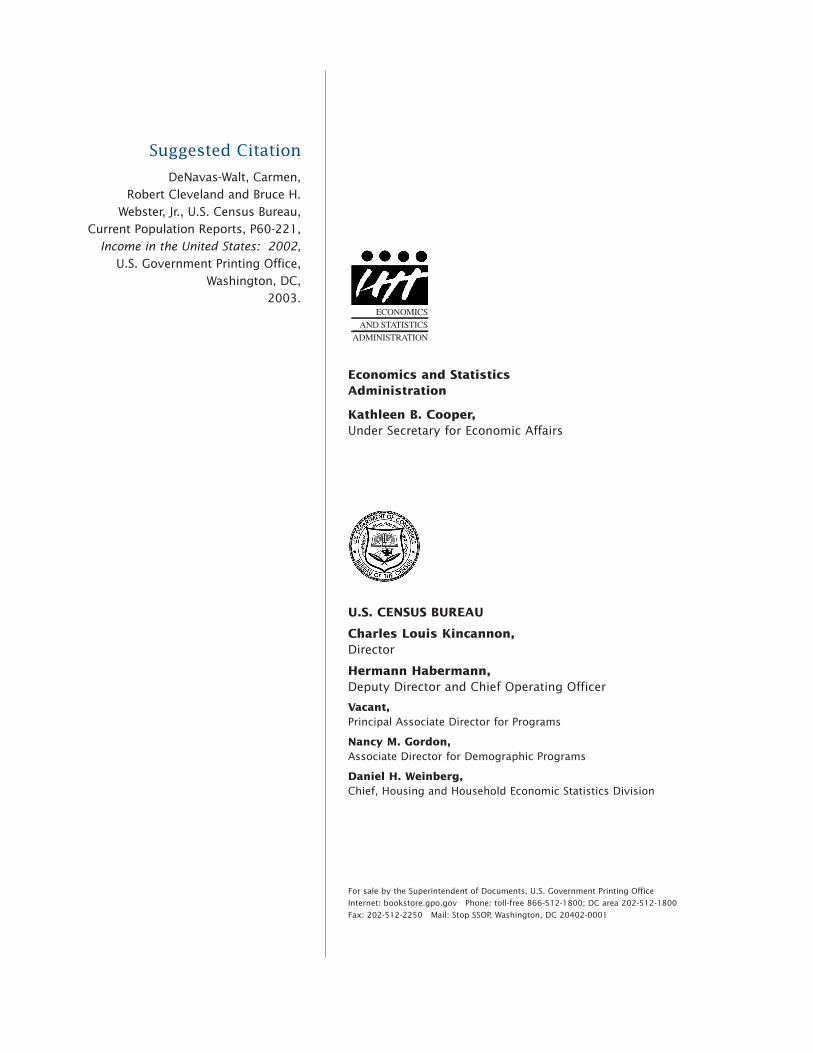
Table 1.Household Income by Race and Hispanic Origin and Income Definition: 2001 and 2002(See text for comparability issues regarding 2001 and 2002 race data using single and multiple race reporting methods. Households as ofMarch of the following year)
Race and Hispanic origin
2001
Race and Hispanic origin
2002
Percentchangein real
income2002less
2001
90-percentconfi-
denceinterval1
(±) ofpercentchange
Number(thousands)
Median income(in 2002 dollars)
Number(thousands)
Median income
Value(dollars)
90-percentconfi-
denceinterval1
(± dollars)Value
(dollars)
90-percentconfi-
denceinterval1
(± dollars)
MONEY INCOME (MI)
All races . . . . . . . . . . . . . . . . 109,297 42,900 215 All races . . . . . . . . . . . . . . . 111,278 42,409 229 *–1.1 0.6
White . . . . . . . . . . . . . . . . . . . . . . 90,682 45,225 349 White alone or in combination . . . 92,740 44,964 319 –0.6 0.8White alone2 . . . . . . . . . . . . . . 91,645 45,086 301 –0.3 0.8
White, not Hispanic . . . . . . . . . . 80,818 47,041 321 White alone, not Hispanic . . . . . . 81,166 46,900 303 –0.3 0.8
Black . . . . . . . . . . . . . . . . . . . . . . 13,315 29,939 581 Black alone or in combination. . . . 13,778 29,177 632 *–2.5 2.3Black alone3. . . . . . . . . . . . . . . 13,465 29,026 643 *–3.0 2.3
Asian and Pacific Islander . . . . . . . 4,071 54,488 2,139 Asian alone or in combination. . . . 4,079 52,285 1,301 *–4.0 3.7Asian alone4 . . . . . . . . . . . . . . 3,917 52,626 1,515 –3.4 3.8
Asian, Native Hawaiian and OtherPacific Islander, alone or in com-bination . . . . . . . . . . . . . . . . . . . 4,371 52,018 1,091 *–4.5 3.6Asian and/or Native Hawaiian and
Other Pacific Islander5 . . . . . . 4,164 52,291 1,288 *–4.0 3.7
Hispanic origin (of any race) . . . . . 10,499 34,099 712 Hispanic origin (of any race). . . . . 11,339 33,103 793 *–2.9 2.1
MI - Tx (MONEY INCOME PLUSREALIZED CAPITAL GAINS(LOSSES), LESS INCOME ANDPAYROLL TAXES)
All races . . . . . . . . . . . . . . . . 109,297 37,376 201 All races . . . . . . . . . . . . . . . 111,278 37,066 199 *–0.8 0.6
White . . . . . . . . . . . . . . . . . . . . . . 90,682 38,991 232 White alone or in combination . . . 92,740 38,764 224 –0.6 0.7White alone2 . . . . . . . . . . . . . . 91,645 38,857 227 –0.3 0.7
White, not Hispanic . . . . . . . . . . 80,818 40,254 247 White alone, not Hispanic . . . . 81,166 40,212 253 –0.1 0.7
Black . . . . . . . . . . . . . . . . . . . . . . 13,315 26,613 447 Black alone or in combination. . . . 13,778 26,288 400 –1.2 1.8Black alone3. . . . . . . . . . . . . . . 13,465 26,168 405 –1.7 1.8
Asian and Pacific Islander . . . . . . . 4,071 45,360 1,328 Asian alone or in combination. . . . 4,079 43,803 1,270 *–3.4 3.2Asian alone4 . . . . . . . . . . . . . . 3,917 44,080 1,286 –2.8 3.2
Asian, Native Hawaiian and OtherPacific Islander, alone or in com-bination . . . . . . . . . . . . . . . . . . . 4,371 43,482 1,194 *–4.1 3.1Asian and/or Native Hawaiian and
Other Pacific Islander5 . . . . . . 4,164 43,779 1,221 *–3.5 3.1
Hispanic origin (of any race) . . . . . 10,499 30,607 507 Hispanic origin (of any race). . . . . 11,339 30,291 479 –1.0 1.5
See footnotes at end of table.

Asian or Native Hawaiian and OtherPacific Islander (and may or maynot have reported any other race).Real median income also declinedby 4.0 percent for households withhouseholders who reported his or
her race as being only Asian or onlyNative Hawaiian and Other PacificIslander or as Asian and NativeHawaiian and Other Pacific Islander.Median income declined 2.9 percentfor households with householders
who were of Hispanic origin (seeTable 1).3
4 Income in the United States: 2002 U.S. Census Bureau
Table 1.Household Income by Race and Hispanic Origin and Income Definition: 2001 and2002—Con.(See text for comparability issues regarding 2001 and 2002 race data using single and multiple race reporting methods. Households as ofMarch of the following year)
Race and Hispanic origin
2001
Race and Hispanic origin
2002
Percentchangein real
income2002less
2001
90-percentconfi-
denceinterval1
(±) ofpercentchange
Number(thousands)
Median income(in 2002 dollars)
Number(thousands)
Median income
Value(dollars)
90-percentconfi-
denceinterval1
(± dollars)Value
(dollars)
90-percentconfi-
denceinterval1
(± dollars)
MI - Tx + NC - MM (MONEYINCOME PLUS REALIZEDCAPITAL GAINS (LOSSES),LESS INCOME AND PAYROLLTAXES, PLUS VALUE OFEMPLOYER-PROVIDEDHEALTH BENEFITS AND ALLNONCASH TRANSFERSEXCEPT MEDICARE ANDMEDICAID)
All races . . . . . . . . . . . . . . . . 109,297 39,553 217 All races . . . . . . . . . . . . . . . 111,278 39,426 219 –0.3 0.6
White . . . . . . . . . . . . . . . . . . . . . . 90,682 41,218 247 White alone or in combination . . . 92,740 41,173 237 –0.1 0.7White alone2 . . . . . . . . . . . . . . 91,645 41,272 239 0.1 0.7
White, not Hispanic . . . . . . . . . . 80,818 42,521 266 White alone, not Hispanic . . . 81,166 42,623 276 0.2 0.7
Black . . . . . . . . . . . . . . . . . . . . . . 13,315 28,748 462 Black alone or in combination. . . . 13,778 28,467 434 –1.0 1.8Black alone3. . . . . . . . . . . . . . . 13,465 28,338 443 –1.4 1.8
Asian and Pacific Islander . . . . . . . 4,071 48,287 1,219 Asian alone or in combination. . . . 4,079 47,252 1,209 –2.1 2.8Asian alone4 . . . . . . . . . . . . . . 3,917 47,501 1,260 –1.6 2.9
Asian, Native Hawaiian and OtherPacific Islander, alone or in com-bination . . . . . . . . . . . . . . . . . . . 4,371 46,829 1,124 *–3.0 2.7Asian and/or Native Hawaiian and
Other Pacific Islander5 . . . . . . 4,164 47,109 1,183 –2.4 2.8
Hispanic origin (of any race) . . . . . 10,499 32,678 497 Hispanic origin (of any race). . . . . 11,339 32,651 485 –0.1 1.4
MI - Tx + NC (MONEY INCOMEPLUS REALIZED CAPITALGAINS (LOSSES), LESSINCOME AND PAYROLL TAXES,PLUS VALUE OF EMPLOYER-PROVIDED HEALTH BENEFITSAND ALL NONCASHTRANSFERS)
All races . . . . . . . . . . . . . . . . 109,297 42,194 212 All races . . . . . . . . . . . . . . . 111,278 42,061 201 –0.3 0.6
White . . . . . . . . . . . . . . . . . . . . . . 90,682 43,860 240 White alone or in combination . . . 92,740 43,767 229 –0.2 0.6White alone2 . . . . . . . . . . . . . . 91,645 43,871 232 – 0.6
White, not Hispanic . . . . . . . . . . 80,818 45,171 253 White alone, not Hispanic . . . 81,166 45,203 255 0.1 0.6
Black . . . . . . . . . . . . . . . . . . . . . . 13,315 31,002 457 Black alone or in combination. . . . 13,778 30,698 475 –1.0 1.7Black alone3. . . . . . . . . . . . . . . 13,465 30,576 477 –1.4 1.7
Asian and Pacific Islander . . . . . . . 4,071 49,913 1,265 Asian alone or in combination. . . . 4,079 48,698 1,163 –2.4 2.7Asian alone4 . . . . . . . . . . . . . . 3,917 48,954 1,189 –1.9 2.8
Asian, Native Hawaiian and OtherPacific Islander, alone or in com-bination . . . . . . . . . . . . . . . . . . . 4,371 48,303 1,156 *–3.2 2.7Asian and/or Native Hawaiian and
Other Pacific Islander5 . . . . . . 4,164 48,596 1,181 –2.6 2.8
Hispanic origin (of any race) . . . . . 10,499 34,939 546 Hispanic origin (of any race). . . . . 11,339 34,633 475 –0.9 1.4
See footnotes at end of table.
3 The differences between the percentagedeclines in household income by race andHispanic origin are not statistically significant.

Under the four alternative incomemeasures, none of the race orHispanic groups showed a declinein real household income between2001 and 2002 except for house-holds with householders who wereAsian or Native Hawaiian andOther Pacific Islander (and may ormay not have reported any otherrace). These households experi-enced declines of 4.1 percentunder income definition MI-Tx; 3.0 percent under incomedefinition MI-Tx+NC-MM; 3.2 percent under incomedefinition MI-Tx+NC; and
3.3 percent under income defini-tion MI-Tx+NC+HE (see Table 1).4
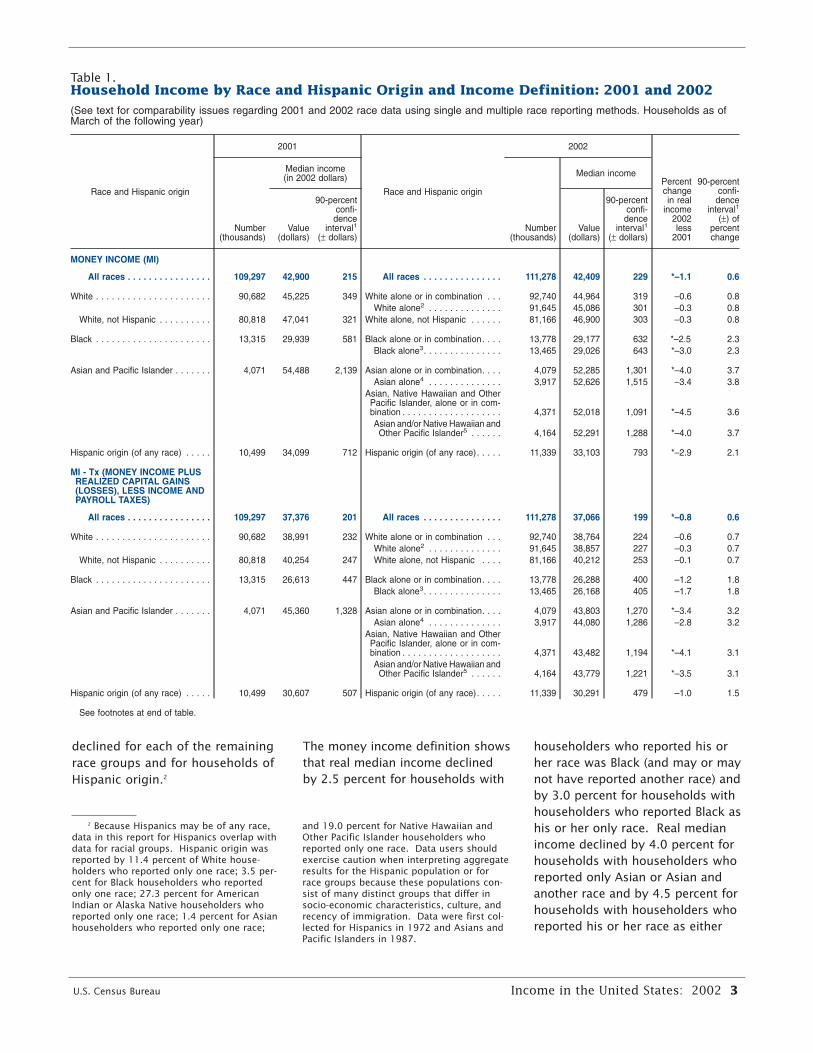
Households with householders whoindicated they were Black and did notreport any other race had the lowestmedian income for each of theincome definitions (see Figure 1).5
Their 2002 median money incomewas $29,026, which was 62 per-cent of the median for householdswith non-Hispanic householderswho reported a single race catego-ry of White; $26,168 under defini-tion MI-Tx, 65 percent of the non-Hispanic White median; $28,338under definition MI-Tx+NC-MM, 66 percent of the non-HispanicWhite median; $30,576 under defi-nition MI-Tx+NC, 68 percent of thenon-Hispanic White median; and$31,048 or 67 percent of the non-Hispanic White median under
U.S. Census Bureau Income in the United States: 2002 5
Table 1.Household Income by Race and Hispanic Origin and Income Definition: 2001 and2002–Con.(See text for comparability issues regarding 2001 and 2002 race data using single and multiple race reporting methods. Households as ofMarch of the following year)
Race and Hispanic origin
2001
Race and Hispanic origin
2002
Percentchangein real
income2002less
2001
90-percentconfi-
denceinterval1
(±) ofpercentchange
Number(thousands)
Median income(in 2002 dollars)
Number(thousands)
Median income
Value(dollars)
90-percentconfi-
denceinterval1
(± dollars)Value
(dollars)
90-percentconfi-
denceinterval1
(± dollars)
MI - Tx + NC + HE (MONEYINCOME PLUS REALIZEDCAPITAL GAINS (LOSSES),LESS INCOME AND PAYROLLTAXES, PLUS VALUE OFEMPLOYER-PROVIDEDHEALTH BENEFITS AND ALLNONCASH TRANSFERS, PLUSIMPUTED RETURN TO HOMEEQUITY)
All races . . . . . . . . . . . . . . . . 109,297 43,925 214 All races . . . . . . . . . . . . . . . 111,278 43,760 220 –0.4 0.6
White . . . . . . . . . . . . . . . . . . . . . . 90,682 45,631 234 White alone or in combination. . . . 92,740 45,635 232 – 0.6White alone2 . . . . . . . . . . . . . . . . 91,645 45,743 234 0.2 0.6
White, not Hispanic . . . . . . . . . . 80,818 47,033 265 White alone, not Hispanic . . . . 81,166 47,199 252 0.4 0.6
Black . . . . . . . . . . . . . . . . . . . . . . 13,315 31,891 477 Black alone or in combination. . . . 13,778 31,523 474 –1.2 1.7Black alone3. . . . . . . . . . . . . . . 13,465 31,408 479 –1.5 1.7
Asian and Pacific Islander . . . . . . . 4,071 51,624 1,152 Asian alone or in combination. . . . 4,079 50,312 1,207 –2.5 2.6Asian alone4 . . . . . . . . . . . . . . 3,917 50,604 1,252 –2.0 2.6
Asian, Native Hawaiian and OtherPacific Islander, alone or in com-bination . . . . . . . . . . . . . . . . . . . 4,371 49,920 1,158 *–3.3 2.5Asian and/or Native Hawaiian and
Other Pacific Islander5 . . . . . . 4,164 50,242 1,199 *–2.7 2.6
Hispanic origin (of any race) . . . . . 10,499 35,882 543 Hispanic origin (of any race). . . . . 11,339 35,447 610 –1.2 1.5
– Represents zero or rounds to zero. *Significantly different from zero at the 90-percent confidence level.1For an explanation of confidence intervals, see ‘‘Standard errors and their use’’ at www.census.gov/hhes/income/income02/sa.pdf.2The 2003 Current Population Survey allowed respondents to choose more than one race. White alone refers to people who reported White and did not
report any other race category. The use of this single-race population does not imply that it is the preferred method of presenting or analyzing data. The CensusBureau uses a variety of approaches. Information on people who reported more than one race, such as ‘‘White and American Indian and Alaska Native’’ or‘‘Asian and Black or African American,’’ in Census 2000 is forthcoming and will be available through American FactFinder in 2003. About 2.6 percent of peoplereported more than one race.
3Black alone refers to people who reported Black and did not report any other race category.4Asian alone refers to people who reported Asian and did not report any other race category.5Asian and/or Native Hawaiian and Other Pacific Islander refers to people who reported either or both of these categories, but did not report any other
category.Source: U.S. Census Bureau, Current Population Survey, 2002 and 2003 Annual Social and Economic Supplements.
4 The differences among the percentagedeclines in median household income byincome definitions were not statistically significant.
5 The differences among the medianincomes for households with householderswho reported Black are not statistically sig-nificant. The levels of household income fordifferent groups are influenced by many dif-ferent variables such as number of earnersand household size.

the most comprehensive incomedefinition, MI-Tx+NC+HE.6
Median money income for house-holds with an Hispanic originhouseholder was $33,103 in 2002which was 71 percent of themedian for households with non-Hispanic householders who report-ed a single race category of Whiteand 14 percent higher than house-holds with householders whoreported a single race category ofBlack. The Hispanic-to-non-HispanicWhite median income relationshipsunder the alternative income defini-tions were 75 percent for defini-tions MI-Tx and MI-Tx+NC+HE and77 percent for definitions MI-Tx+NC-MM and MI-Tx+NC. TheHispanic-to-Black median incomerelationships were 116 percent fordefinitions MI-Tx; 115 percent for MI-Tx+NC-MM; and 113 percent forMI-Tx+NC and MI-Tx+NC+HE.7
Households with householderswho reported Asian as his or heronly race category had the highestmedian income under all defini-tions of income.8 Their 2002median money income was$52,626, 112 percent of the medi-an for households with non-Hispanic householders who report-ed a single race category of White;$44,080 under definition MI-Tx,110 percent of the non-HispanicWhite median; $47,501 under defi-nition MI-Tx+NC-MM, 111 percentof the non-Hispanic White median;$48,954 under definition MI-Tx+NC, 108 percent of the non-Hispanic White median; and$50,604 or 107 percent of thenon-Hispanic White median under
6 Income in the United States: 2002 U.S. Census Bureau
Figure 1.Median Household Income by Race and Hispanic Origin of Householder and Income Definition: 2002
Source: U.S. Census Bureau, Current Population Survey, 2003 Annual Social and Economic Supplement.
Hispanic origin (of any race)
All races
White alone, not Hispanic
Black alone
Asian alone
Income definition
MI - Tx +NC + HE
MI - Tx +NC
MI - Tx +NC - MM
MI - TxMI
$26,168$28,338
$30,576 $31,408$33,103
$30,291$32,651
$34,633 $35,447
$42,409
$37,066$39,426
$42,061$43,760
$46,900
$40,212$42,623
$45,203$47,199
$52,626
$44,080
$47,501$48,954
$50,604
$29,026
Racial Group Comparisons in the 2003 Current Population Survey
For the first time in 2003, CPS respondents could identify themselvesin more than one racial group; previously they had to choose one.9
This may complicate year-to-year comparisons. We do not know howpeople who reported more than one race in 2003 previously reportedtheir race; there is no single way to compare changes in income byrace. This report compares 2001 single-race data with two differentsets of race data for 2002: one comparison based on those who report-ed only one race and another comparison based on those who report-ed more than one race. For example, this report compares the 2001income figures for Blacks with 2002 income figures for two groups:
1. Those who reported Black and did not report any other race (alone).
2. Those who reported Black and did not report any other race orBlack who reported some other race (alone or in combination).
This report provides year-to-year comparisons for each racial groupexcept American Indians and Alaska Natives, and Native Hawaiians andOther Pacific Islanders, because the sample was not sufficiently large.
9 The Office of Management and Budget (OMB) establishes the guidelines for the col-lection and classification of data for race (including the option for respondents to markmore than one race) and Hispanic origin. Race and Hispanic origin are treated as sepa-rate and distinct concepts in accordance with OMB guidelines. For further information,see www.whitehouse.gov/omb/ombdir15.html.
6 The income ratios for MI-Tx+NC-MMand MI-Tx+NC+HE were not different fromone another.
7 The income ratio for MI-Tx+NC-MM wasnot different from MI-Tx+NC and MI-Tx+NC+HE.
8 The differences among the medianincomes for households with householderswho reported Asian are not statistically sig-nificant.

the most comprehensive incomedefinition, MI-Tx+NC+HE.10
Income During Recessions
Before the most recent recession,which began in March 2001 andended in November 2001, medianhousehold money income peaked in1999 at $43,915 (in 2002 adjusteddollars).11 The decline in householdincome between 1999 and 2002was 3.4 percent, not statistically dif-ferent from the 4.7 percent declinein income which occurred between1989 and 1992, the income yearssurrounding the July 1990 to March1991 recession, but lower than the4.8 percent decline between 1978and 1983, the income years sur-rounding the combined recessionsspanning January 1980 to July 1980and July 1981 to November 1982,and the 5.7 percent declinebetween 1973 and 1975, theincome years surrounding theNovember 1973 to March 1975recession. However, the currentdecline in household money incomeis significantly larger than the
decline in money income for theyears surrounding the recessionspanning from December 1969 toNovember 1970 (see Table 2 andFigure 2).12
The most recent recession resultedin less severe declines in real medi-an household income under the
alternative income definitions.Between 1999 and 2002, incomedeclined 2.4 percent under defini-tion MI-Tx; 1.6 percent under defini-tion MI-TX+NC-MM; and 1.3 percentunder the most comprehensiveincome definition, MI-TX+NC+HE(see Table 2 and Figure 2).13
OTHER FINDINGS
This section examines changes inincome between 2001 and 2002 forseveral demographic groups usingonly the money income (MI) defini-tion. Income tabulations for theseadditional demographic groups arenot currently available for the alter-native income definitions. Anexpanded set of tabulations for thealternative income definitions willbe made available on the Internetwhen completed and will be a partof next year’s report.
Household Composition
The real median money income offamily households declined 0.8 per-cent between 2001 and 2002 to$52,704 (see Table 3). For nonfami-ly households, income dropped by2.4 percent to $25,406. The appar-ent changes in income by type offamily households and for
U.S. Census Bureau Income in the United States: 2002 7
Detailed Tabulations
Detailed tabulations that pro-vide income estimates forhouseholds, families, andpeople 15 years of age andolder for 2002 and earlieryears are available on theInternet at: www.census.gov/hhes/www/income.html.
Income data are cross-tabu-lated by various demographiccharacteristics such as age,sex, race, Hispanic origin,presence of children, maritalstatus, educational attain-ment, work experience, occu-pation, type of worker, andsource of income.
10 The ratios for the following income definitions were not different from oneanother: MI and MI-Tx+NC-MM; MI-Tx andMI-Tx+NC-MM; MI-Tx and MI-Tx+NC; and MI-Tx+NC and MI-Tx+NC+HE.
11 Recessions are determined by theNational Bureau of Economic Research, a pri-vate research organization.
Table 2.Change in Real Median Household Income During Recessions by Income Definition
Recessions1 Incomeyears
Percent change in real median income2
MI MI-Tx MI-Tx+NC-MM MI-Tx+NC MI-Tx+NC+HE
March 2001 to November 2001 . . . . . . . 1999 to 2002 *–3.4 *–2.4 *–1.6 *–0.7 *–1.3July 1990 to March 1991 . . . . . . . . . . . . . 1989 to 1992 *–4.7 (NA) (NA) *–2.1 *–3.9January 1980 to July 1980 andJuly 1981 to November 1982 . . . . . . . . 1978 to 1983 *–4.8 (NA) (NA) (NA) (NA)
November 1973 to March 1975 . . . . . . . 1973 to 1975 *–5.7 (NA) (NA) (NA) (NA)December 1969 to November 1970. . . . 1969 to 1971 *–1.7 (NA) (NA) (NA) (NA)
NA Not available.*Significantly different from zero at the 90-percent confidence level.1Recessions are determined by the National Bureau of Economic Research, a private research organization.2Median household income adjusted to 2002 dollars using the CPI-U-RS price deflator.
Note: Income years are based on peak income year prior to the start of the recession, unless the recession started after June, and the year after the end ofthe recession, unless the recession ended before June.
Source: U.S. Census Bureau, Current Population Survey, 1970 to 2003 Annual Social and Economic Supplements.
12 The differences between the declines inmedian household income for the followingyears are not statistically different: 1989 to1992 compared with 1978 to 1983 and1973 to 1975; and 1978 to 1983 comparedwith 1973 to 1975.
13 None of the declines for the alternativeincome definitions were different from oneanother.

nonfamily households maintainedby a woman were not statisticallysignificant. For nonfamily house-holds maintained by a man, medianincome dropped 4.3 percent, to $31,404.
Nativity
Native households and foreign-born households each had realmedian money incomes in 2002that were not different from 2001,but were very different from eachother (see Table 3).14 The realmedian income of households
maintained by a foreign-bornperson who was not a citizen ofthe United States, however,declined by 3.9 percent. This isthe second consecutive annualdecline for these households.
Median money income was$43,222 for native households, 14 percent higher than the medianfor foreign-born households($37,979), and 27 percent higherthan noncitizen foreign-bornhouseholds ($33,980).
Regions
Real median money income ofhouseholds did not change between2001 and 2002 in 3 of the 4regions; however, income in theMidwest declined 2.0 percent to$43,622. In 2002, the medianincome of households in theNortheast was $45,862, in the Westit was $45,143, and in the South it
was $39,522 (see Table 3).15
Household money income contin-ued to be the lowest in the Southamong the four regions.
Residence
Real median income remainedunchanged between 2001 and2002 for households outside met-ropolitan areas while incomedeclined for the second consecu-tive year for households insidemetropolitan areas. The real medi-an money income of households inmetropolitan areas was $45,257,down 1.5 percent (see Table 3).The median income of householdsinside central cities declined by 1.2 percent to $36,863 and 1.5 percent for households outside
8 Income in the United States: 2002 U.S. Census Bureau
Figure 2.Median Household Income by Income Definition: 1967 to 2002
Source: U.S. Census Bureau, Current Population Survey, 1968 to 2003 Annual Social and Economic Supplements.
Income in 2002 dollars Recession
0
10,000
20,000
30,000
40,000
50,000
2002 1997 1994 1991 1988 1985 1982 1979 1976 1973 19701967
MI-Tx+NC+HE
MI
MI-TxMI-Tx+NC-MMMI-Tx+NC
$43,760$42,409$42,061$39,426$37,066
14 Native households are those in whichthe householder was born in the UnitedStates, Puerto Rico, or an outlying area ofthe United States or was born in a foreigncountry but had at least one parent who wasa U.S. citizen. All other households are con-sidered foreign-born regardless of the dateof entry into the United States or citizenshipstatus. The CPS does not interview house-holds in Puerto Rico.
15 The difference between the medianhousehold income in the Northeast and themedian income in the West was not statisti-cally significant.

U.S. Census Bureau Income in the United States: 2002 9
Table 3.Comparison of Summary Measures of Money Income and Earnings by SelectedCharacteristics: 2001 and 2002(Households and people as of March of the following year)
Characteristic
2001 2002
Percentchange in
realmoneyincome
2002 less2001
90-percentconfidence
interval1
(±) ofpercentchange
Number(thousands)
Median money income(in 2002 dollars)
Number(thousands)
Median money income
Value(dollars)
90-percentconfi-
denceinterval1
(± dollars)Value
(dollars)
90-percentconfi-
denceinterval1
(± dollars)
HOUSEHOLDS
All households . . . . . . . . . . . . . . 109,297 42,900 216 111,278 42,409 229 *–1.1 0.6
Type of Household
Family households . . . . . . . . . . . . . . . 74,329 53,106 294 75,596 52,704 396 *–0.8 0.8Married-couple families . . . . . . . . . 56,747 61,433 348 57,320 61,254 327 –0.3 0.6Female householder, no husbandpresent . . . . . . . . . . . . . . . . . . . . . . 13,143 28,590 483 13,620 29,001 497 1.4 2.0
Male householder, no wifepresent . . . . . . . . . . . . . . . . . . . . . . 4,438 41,363 874 4,656 41,711 684 0.8 2.2
Nonfamily households . . . . . . . . . . . . 34,969 26,039 282 35,682 25,406 281 *–2.4 1.2Female householder . . . . . . . . . . . . 19,390 20,586 353 19,662 20,913 316 1.6 1.9Male householder . . . . . . . . . . . . . . 15,579 32,826 401 16,020 31,404 433 *–4.3 1.4
Age of Householder
Under 65 years . . . . . . . . . . . . . . . . . . 86,821 50,010 333 88,619 49,510 352 *–1.0 0.815 to 24 years . . . . . . . . . . . . . . . . . 6,391 28,644 812 6,611 27,828 748 –2.9 3.125 to 34 years . . . . . . . . . . . . . . . . . 18,988 45,797 623 19,055 45,330 484 –1.0 1.435 to 44 years . . . . . . . . . . . . . . . . . 24,031 54,168 700 24,069 53,521 679 –1.2 1.445 to 54 years . . . . . . . . . . . . . . . . . 22,208 58,968 814 22,623 59,021 864 0.1 1.655 to 64 years . . . . . . . . . . . . . . . . . 15,203 46,593 710 16,260 47,203 702 1.3 1.7
65 years and over . . . . . . . . . . . . . . . . 22,476 23,486 319 22,659 23,152 309 –1.4 1.5
Nativity of the Householder
Native born . . . . . . . . . . . . . . . . . . . . . . 95,884 43,600 344 97,365 43,222 345 –0.9 0.9Foreign born . . . . . . . . . . . . . . . . . . . . . 13,413 38,552 958 13,912 37,979 883 –1.5 2.7
Naturalized citizen. . . . . . . . . . . . . . 6,069 44,667 1,537 6,423 45,430 1,323 1.7 3.7Not a citizen . . . . . . . . . . . . . . . . . . . 7,344 35,366 886 7,490 33,980 1,272 *–3.9 3.6
Region
Northeast. . . . . . . . . . . . . . . . . . . . . . . . 21,128 46,443 625 21,229 45,862 566 –1.3 1.5Midwest . . . . . . . . . . . . . . . . . . . . . . . . . 25,755 44,531 583 25,630 43,622 627 *–2.0 1.5South . . . . . . . . . . . . . . . . . . . . . . . . . . . 39,151 39,523 515 40,107 39,522 490 – 1.5West. . . . . . . . . . . . . . . . . . . . . . . . . . . . 23,263 45,804 752 24,313 45,143 674 –1.4 1.8
Residence
Inside metropolitan areas. . . . . . . . . . 88,112 45,938 314 90,075 45,257 291 *–1.5 0.7Inside central cities . . . . . . . . . . . . . 32,540 37,315 353 33,543 36,863 357 *–1.2 1.1Outside central cities . . . . . . . . . . . 55,572 51,503 343 56,532 50,717 349 *–1.5 0.8
Outside metropolitan areas . . . . . . . . 21,185 34,135 613 21,203 34,654 609 1.5 2.1
EARNINGS OF FULL-TIME,YEAR-ROUND WORKERS
Male . . . . . . . . . . . . . . . . . . . . . . . . . . . . 58,712 38,884 431 58,761 39,429 401 *1.4 1.3Female. . . . . . . . . . . . . . . . . . . . . . . . . . 41,639 29,680 276 41,876 30,203 132 *1.8 0.9
– Represents zero or rounds to zero.*Significantly different from zero at the 90-percent confidence level.1For an explanation of confidence intervals, see ‘‘Standard errors and their use’’ at www.census.gov/hhes/income/income02/sa.pdf.
Source: U.S. Census Bureau, Current Population Survey, 2002 and 2003 Annual Social and Economic Supplements.

central cities, to $50,717. Theincome of households outside met-ropolitan areas ($34,654) has notshown a statistically significantchange in the past 2 years.16
Work Experience and Earnings
Of the 80.5 million men aged 15and over who worked in 2002,73.0 percent worked full-time,year-round, unchanged from 2001.Of the 71.5 million women in thesame age group who worked in2002, 58.6 percent worked full-time, year-round — also unchangedfrom 2001 (see Table 3).
Between 2001 and 2002, the realmedian earnings of men whoworked full-time, year-roundincreased by 1.4 percent, to
$39,429 (see Table 3). The realearnings of women with similarwork experience increased by 1.8 percent to $30,203.17 18 In2002, the female-to-male earningsratio was 0.77, not statistically dif-ferent from the all-time high of0.76 reached in 2001.
The increase in real earnings formen who worked full-time, year-round between 2001 and 2002 fol-lowed a year of stagnant earningsgrowth (2000-2001) and a year ofdeclining earnings (1999-2000). Incontrast, the comparable group ofwomen have not experienced anannual decline in earnings since1995 (see Figure 3).
10 Income in the United States: 2002 U.S. Census Bureau
What are . . .? Full-time,Year-round workers arepeople who worked 50 ormore weeks and 35 or morehours per week during thecalendar year. Paid vacationsare counted as time worked.
Figure 3.Median Earnings of Full-Time, Year-Round Workers 15 Years Old and Over by Sex: 1967 to 2002
Source: U.S. Census Bureau, Current Population Survey, 1968 to 2003 Annual Social and Economic Supplements.
Earnings in 2002 dollars Recession
$39,429
$30,203
0
5,000
10,000
15,000
20,000
25,000
30,000
35,000
40,000
2002 1997 1994 1991 1988 1985 1982 1979 1976 1973 1970 1967
Female, full-time, year-round workers
Male, full-time, year-round workers
16 The differences between the percent-age declines in income by residence are notstatistically different.
What is . . .? Earnings con-sist of gross money wage orsalary income, including com-missions, tips and cash bonus-es, before deductions; netincome from nonfarm self-employment (gross receiptsminus business expenses); andnet income from farm self-employment (gross receiptsminus farm expenses).
17 The demographic characteristics of full-time, year-round workers may be consider-ably different from one year to the next.
18 The difference between the percentageincreases in the median earnings of men andwomen was not statistically different.

U.S. Census Bureau Income in the United States: 2002 11
Per Capita Income
Per capita money income declinedby 1.8 percent, to $22,794, for theoverall population between 2001and 2002. This is the first annualdecline in overall per capitaincome since 1991. By race, realper capita income declined by 2.2 percent, to $23,962, for peoplewho reported White as their onlyrace or White along with anotherrace; by 1.5 percent, to $24,142,for those who reported White astheir only race category; by 1.6percent to $26,128, for non-Hispanics who reported White astheir only race; by 5.7 percent, to$23,252, for those who reportedonly Asian or Asian with another
race; and by 7.5 percent, to$22,810, for those who reportedAsian or Native Hawaiian andOther Pacific Islander, either as hisor her only race or with anotherrace category (see Table 4).19 20
State Income
Median household income rose forone state and declined for 10states and the District of Columbia,based on percent changes in 2-year-average medians comparing
Table 4.Per Capita Money Income by Race and Hispanic Origin: 2001 and 2002(See text for comparability issues regarding 2001 and 2002 race data using single and multiple race reporting methods. People as of Marchof the following year.)
Race and Hispanic origin
2001
Race and Hispanic origin
2002
Percentchangein real
income2002less
2001
90-percentconfi-
denceinterval1
(±) ofpercentchange
Number(thousands)
Per capita income(in 2002 dollars)
Number(thousands)
Per capita income
Value(dollars)
90-percentconfi-
denceinterval1
(± dollars)Value
(dollars)
90-percentconfi-
denceinterval1
(± dollars)
All races . . . . . . . . . . . . . 282,082 23,214 175 All races . . . . . . . . . . . . . . . . . . 285,933 22,794 166 *–1.8 0.9
White . . . . . . . . . . . . . . . . . . . 230,071 24,511 214 White alone or in combination . . . . . . 235,036 23,962 202 *–2.2 1.0White alone2 . . . . . . . . . . . . . . . . . 230,809 24,142 206 *–1.5 1.0
White, not Hispanic . . . . . . . 194,822 26,550 254 White alone, not Hispanic . . . . . . 194,421 26,128 245 *–1.6 1.1
Black . . . . . . . . . . . . . . . . . . . 36,023 15,191 304 Black alone or in combination. . . . . . . 37,350 15,269 415 0.5 2.9Black alone3. . . . . . . . . . . . . . . . . . 35,806 15,441 421 1.6 2.9
Asian and Pacific Islander . . . . 12,500 24,663 1,171 Asian alone or in combination. . . . . . . 12,504 23,252 1,181 *–5.7 5.5Asian alone4 . . . . . . . . . . . . . . . . . 11,558 24,131 1,257 –2.2 5.8
Asian, Native Hawaiian and Other PacificIslander, alone or in combination. . . . 13,523 22,810 1,110 *–7.5 5.3Asian and/or Native Hawaiian andOther Pacific Islander5 . . . . . . . . . 12,362 23,792 1,193 –3.5 5.6
Hispanic origin (of any race) . . 37,438 13,210 319 Hispanic origin (of any race). . . . . . . . 39,384 13,487 342 2.1 2.7
*Significantly different from zero at the 90-percent confidence level.1For an explanation of confidence intervals, see ‘‘Standard errors and their use’’ at www.census.gov/hhes/income/income02/sa.pdf.2The 2003 Current Population Survey allowed respondents to choose more than one race. White alone refers to people who reported White and did not
report any other race category. The use of this single-race population does not imply that it is the preferred method of presenting or analyzing data. The CensusBureau uses a variety of approaches. Information on people who reported more than one race, such as ‘‘White and American Indian and Alaska Native’’ or‘‘Asian and Black or African American,’’ in Census 2000 is forthcoming and will be available through American FactFinder in 2003. About 2.6 percent of peoplereported more than one race.
3Black alone refers to people who reported Black and did not report any other race category.4Asian alone refers to people who reported Asian and did not report any other race category.5Asian and/or Native Hawaiian and Other Pacific Islander refers to people who reported either or both of these categories, but did not report any other
category.
Source: U.S. Census Bureau, Current Population Survey, 2002 and 2003 Annual Social and Economic Supplements.
19 The differences between the per capitaincomes were not statistically different for:the overall population compared with thosewho reported Asian as their only race orAsian with another race or those who report-ed Asian or Native Hawaiian and OtherPacific Islander either as their only race orwith another race category; those whoreported White as their only race or Whitealong with another race, compared withthose that reported White as their only raceor who reported Asian as their only race orAsian with another race; those who reportedWhite as their only race compared with thosewho reported Asian as their only race orAsian with another race; and those who
reported their race as only Asian or Asianwith another race compared with those whoreported their race as Asian or NativeHawaiian and Other Pacific Islander either astheir only race or with another race category.
20 None of the differences between thepercentage declines in this paragraph arestatistically significant except: the differencebetween those who reported Asian or NativeHawaiian and Other Pacific Islander either astheir only race or with another race categorycompared with the overall population andthose who reported White as their only race,and those who reported being non-Hispanicand reported White as their only race.

12 Income in the United States: 2002 U.S. Census Bureau
Table 5.Money Income of Households by State Using 2- and 3-Year-Average Medians(Income in 2002 dollars)
States
3-year-average median1
2000-2002
2-year-average medians2
2001-2002 average less2000-2001 average
2000-2001 2001-2002
Medianmoneyincome
(dollars)
90-percentconfidence
interval3(± dollars)
Medianmoneyincome
(dollars)
90-percentconfidence
interval3(± dollars)
Medianmoneyincome
(dollars)
90-percentconfidence
interval3(± dollars) Difference
Percentchange
United States . . . . . . . . . . . 43,052 156 43,374 182 42,654 183 *–720 *–1.7
Alabama . . . . . . . . . . . . . . . . . . . 36,771 1,224 36,355 1,448 36,661 1,408 306 0.8Alaska . . . . . . . . . . . . . . . . . . . . . 55,412 1,739 56,731 2,234 55,525 2,155 –1,206 –2.1Arizona . . . . . . . . . . . . . . . . . . . . 41,554 1,458 42,463 1,845 41,559 1,681 –905 –2.1Arkansas . . . . . . . . . . . . . . . . . . . 32,423 1,082 32,440 1,341 33,128 1,323 688 2.1California . . . . . . . . . . . . . . . . . . . 48,113 852 48,451 983 47,725 1,017 –725 –1.5Colorado . . . . . . . . . . . . . . . . . . . 49,617 1,512 50,279 1,690 49,238 1,810 –1,041 –2.1Connecticut . . . . . . . . . . . . . . . . . 53,325 1,544 53,294 1,810 53,791 1,778 497 0.9Delaware . . . . . . . . . . . . . . . . . . . 50,878 1,814 51,492 2,072 50,020 2,148 –1,472 –2.9District of Columbia . . . . . . . . . . . 41,313 1,209 42,435 1,459 40,447 1,375 *–1,988 *–4.7Florida . . . . . . . . . . . . . . . . . . . . . 38,533 764 38,788 827 37,512 867 *–1,276 *–3.3
Georgia . . . . . . . . . . . . . . . . . . . . 43,316 1,185 43,504 1,327 43,096 1,485 –408 –0.9Hawaii . . . . . . . . . . . . . . . . . . . . . 49,775 1,491 51,010 1,704 47,748 1,789 *–3,262 *–6.4Idaho . . . . . . . . . . . . . . . . . . . . . . 38,613 1,274 39,062 1,509 38,282 1,422 –780 –2.0Illinois . . . . . . . . . . . . . . . . . . . . . 45,906 1,057 47,504 1,286 44,808 1,182 *–2,696 *–5.7Indiana. . . . . . . . . . . . . . . . . . . . . 41,581 945 41,847 1,136 41,034 1,161 –813 –1.9Iowa. . . . . . . . . . . . . . . . . . . . . . . 41,827 1,224 42,216 1,358 41,338 1,556 –878 –2.1Kansas . . . . . . . . . . . . . . . . . . . . 42,523 1,305 42,475 1,590 42,346 1,474 –129 –0.3Kentucky . . . . . . . . . . . . . . . . . . . 37,893 1,077 38,459 1,293 37,905 1,285 –554 –1.4Louisiana . . . . . . . . . . . . . . . . . . . 33,312 1,298 32,965 1,414 33,930 1,671 965 2.9Maine. . . . . . . . . . . . . . . . . . . . . . 37,654 1,043 38,055 1,256 37,024 1,227 *–1,031 –2.7
Maryland . . . . . . . . . . . . . . . . . . . 55,912 1,804 55,665 2,124 55,394 2,170 –271 –0.5Massachusetts. . . . . . . . . . . . . . . 50,587 1,598 50,953 2,001 51,470 1,830 516 1.0Michigan . . . . . . . . . . . . . . . . . . . 45,335 1,192 46,645 1,374 44,239 1,354 *–2,406 *–5.2Minnesota . . . . . . . . . . . . . . . . . . 54,931 1,582 55,085 2,002 54,070 1,587 –1,015 –1.8Mississippi . . . . . . . . . . . . . . . . . . 32,447 1,329 33,229 1,772 30,761 1,348 *–2,468 *–7.4Missouri . . . . . . . . . . . . . . . . . . . . 43,955 1,362 44,545 1,664 42,386 1,554 *–2,158 *–4.8Montana . . . . . . . . . . . . . . . . . . . 33,900 1,138 33,432 1,220 33,736 1,343 304 0.9Nebraska . . . . . . . . . . . . . . . . . . . 43,566 1,246 43,951 1,485 43,550 1,468 –401 –0.9Nevada . . . . . . . . . . . . . . . . . . . . 46,289 1,293 46,954 1,490 45,542 1,560 *–1,413 *–3.0New Hampshire . . . . . . . . . . . . . . 53,549 1,251 52,664 1,396 53,734 1,390 1,071 2.0
New Jersey . . . . . . . . . . . . . . . . . 53,266 1,376 52,615 1,340 53,581 1,752 966 1.8New Mexico. . . . . . . . . . . . . . . . . 35,251 1,397 35,148 1,731 34,554 1,570 –595 –1.7New York . . . . . . . . . . . . . . . . . . . 42,432 690 42,666 822 42,375 804 –291 –0.7North Carolina . . . . . . . . . . . . . . . 38,432 982 39,391 1,223 37,642 1,143 *–1,749 *–4.4North Dakota . . . . . . . . . . . . . . . . 36,717 1,053 36,976 1,311 36,281 1,109 –695 –1.9Ohio. . . . . . . . . . . . . . . . . . . . . . . 43,332 843 43,656 971 42,567 980 *–1,090 *–2.5Oklahoma . . . . . . . . . . . . . . . . . . 35,500 791 35,021 974 36,317 889 *1,295 *3.7Oregon . . . . . . . . . . . . . . . . . . . . 42,704 989 43,155 1,181 41,866 1,095 *–1,289 *–3.0Pennsylvania . . . . . . . . . . . . . . . . 43,577 867 44,117 993 43,344 1,034 –772 –1.8Rhode Island . . . . . . . . . . . . . . . . 44,311 1,206 45,257 1,507 44,434 1,385 –824 –1.8
South Carolina. . . . . . . . . . . . . . . 38,460 1,243 38,784 1,364 38,074 1,532 –710 –1.8South Dakota. . . . . . . . . . . . . . . . 38,755 980 39,196 1,075 39,087 1,232 –108 –0.3Tennessee . . . . . . . . . . . . . . . . . . 36,329 1,096 35,979 1,202 36,691 1,302 712 2.0Texas. . . . . . . . . . . . . . . . . . . . . . 40,659 728 40,914 916 40,829 732 –84 –0.2Utah. . . . . . . . . . . . . . . . . . . . . . . 48,537 1,520 48,875 1,851 47,978 1,887 –897 –1.8Vermont . . . . . . . . . . . . . . . . . . . . 41,929 1,060 41,395 1,298 42,221 1,210 826 2.0Virginia . . . . . . . . . . . . . . . . . . . . 49,974 1,368 50,145 1,540 50,336 1,661 190 0.4Washington . . . . . . . . . . . . . . . . . 44,252 1,363 43,786 1,722 44,174 1,527 388 0.9West Virginia . . . . . . . . . . . . . . . . 30,072 789 30,429 918 29,752 935 –677 –2.2Wisconsin . . . . . . . . . . . . . . . . . . 46,351 1,193 46,575 1,444 45,985 1,413 –590 –1.3Wyoming . . . . . . . . . . . . . . . . . . . 40,499 1,262 40,867 1,546 40,057 1,463 –810 –2.0
*Significantly different from zero at the 90-percent confidence level.1The 3-year-average median is the sum of 3 inflation-adjusted single-year medians divided by 3.2The 2-year-average median is the sum of 2 inflation-adjusted single-year medians divided by 2.3For an explanation of confidence intervals, see ‘‘Standard errors and their use’’ at www.census.gov/hhes/income/income02/sa.pdf.
Source: U.S. Census Bureau, Current Population Survey, 2001, 2002, and 2003 Annual Social and Economic Supplements.

U.S. Census Bureau Income in the United States: 2002 13
data for 2000-2001 with data for2001-2002 (see Table 5 and Figure4).21 Real median householdincome rose for Oklahoma. Fourof the states that experienceddeclines were in the Midwest(Illinois, Michigan, Missouri, andOhio), three in the South (Florida,Mississippi, and North Carolina),and three in the West (Hawaii,Nevada, and Oregon). States in the
Northeast did not experiencechanges in income.
Comparing the relative ranking ofstates using 3-year-average mediansfor 2000-2002 shows that the
median household income forMaryland, although not statisticallydifferent from the median incomesfor Alaska and Minnesota, was high-er than that for the remaining 47states and the District of Columbia.
21 To reduce the possibilities of misinter-preting changes in, or rankings of, incomeestimates for states, the Census Bureau uses2-year-average medians for evaluatingchanges in state estimates over time and 3-year-average medians when comparing therelative ranking of states.
TX
NM
WA
NV-3.0
MI-5.2
IL-5.7
MO-4.8
MT
WY
ID
UTCO
HI-6.4
NE
AK
KS
OK+3.7
WI
IA
LA
MEVT
IN
KY
TN
AL GA
OH-2.5
WV
NC-4.4
SC
NJMD
CT
RI
MA
DE
SD
VA
AR
CA
AZ
NY
DC-4.7
OR-3.0
PA
ND
MN
MS-7.4
FL-3.3
NH
IncreaseNo changeDecrease
Median Household Income Change
Figure 4. Percent Change in 2-Year-Average Median Household Income by State: 2001-2002 Less 2000-2001
Source: U.S. Census Bureau, Current Population Survey, 2001, 2002, and 2003 Annual Social and Economic Supplements.
Model-Based State Estimates
The Census Bureau also produces improved (in the sense of havinglower standard errors) annual estimates of median household incomefor states and counties, based on models using data from the ASEC,the decennial census, and administrative records, as well as personalincome data published by the Bureau of Economic Analysis.Estimates for 1999 are available on the Internet at www.census.gov/hhes/www/saipe.html. Estimates for income year 2000 will beavailable later this fall.

14 Income in the United States: 2002 U.S. Census Bureau
Conversely, the median householdincome for West Virginia was lowerthan the incomes of the remaining49 states and the District ofColumbia. The relative standing ofthe remaining states and theDistrict of Columbia was less clearbecause of sampling variability sur-rounding the estimates.
INCOME INEQUALITY
There was no change in householdmoney income inequality between2001 and 2002. However, inequal-ity declined between 2001 and2002 under all four of the alterna-tive income definitions.
The Gini index under the moneyincome definition has not shownan annual change since 1993.
However, the 2002 Gini index(0.462) was higher than in 1995and earlier years (see appendixTable A-3 for historical Gini andother inequality measures).22
Comparisons with years earlierthan 1993 are not recommended
because of substantial method-ological changes in the 1994 CPSAnnual Social and EconomicSupplement.23 Under the alterna-tive income definitions, the Giniindex in 2002 was 0.426 for MI-Tx;0.421 for MI-Tx+NC-MM; 0.405 forMI-Tx+NC; and 0.400 for the most
Table 6.Median Household Income by Income Definition: 2001 and 2002(Income in 2002 dollars)
Definition of incomeMedian income Percent change
in real income2002 less 2001
Percent ofofficial definition
of income2001 2002
1. Money income excluding capital gains (losses) (MI) . . . . . . . . 42,900 42,409 *–1.1 100.01b. Definition 1 plus realized capital gains (losses) less
taxes (MI-Tx). . . . . . . . . . . . . . . . . . . . . . . . . . . . . . . . . . . . . . . . . . 37,376 37,066 *–0.8 87.42. Definition 1 less government cash transfers . . . . . . . . . . . . . . . . 39,630 39,102 *–1.3 92.23. Definition 2 plus realized capital gains (losses) . . . . . . . . . . . . 40,190 39,268 *–2.3 92.64. Definition 3 plus health insurance supplements to wage
or salary income . . . . . . . . . . . . . . . . . . . . . . . . . . . . . . . . . . . . . . 42,004 41,294 *–1.7 97.45. Definition 4 less social security payroll taxes . . . . . . . . . . . . . . 39,390 38,602 *–2.0 91.06. Definition 5 less federal income taxes (excluding the EIC) . . . 36,456 36,278 –0.5 85.57. Definition 6 plus the earned income credit (EIC)1 . . . . . . . . . . . 36,646 36,453 –0.5 86.08. Definition 7 less state income taxes . . . . . . . . . . . . . . . . . . . . . . 35,482 35,280 –0.6 83.29. Definition 8 plus nonmeans-tested government cash
transfers . . . . . . . . . . . . . . . . . . . . . . . . . . . . . . . . . . . . . . . . . . . . . . 39,242 39,099 –0.4 92.210. Definition 9 plus the value of medicare . . . . . . . . . . . . . . . . . . . 41,281 41,169 –0.3 97.111. Definition 10 plus the value of regular-price school lunches . . 41,300 41,183 –0.3 97.112. Definition 11 plus means-tested government cash transfers . . 41,468 41,363 –0.3 97.513. Definition 12 plus the value of medicaid . . . . . . . . . . . . . . . . . . . 42,031 41,928 –0.2 98.914a. Definition 13 plus the value of other means-tested
government noncash transfers less medicare andmedicaid (MI-Tx+NC-MM) . . . . . . . . . . . . . . . . . . . . . . . . . . . . . . 39,553 39,426 –0.3 93.0
14. Definition 14a plus the value of medicare and medicaid(MI-Tx+NC) . . . . . . . . . . . . . . . . . . . . . . . . . . . . . . . . . . . . . . . . . . 42,194 42,061 –0.3 99.2
15. Definition 14 plus imputed return on home equity(MI-Tx+NC+HE) . . . . . . . . . . . . . . . . . . . . . . . . . . . . . . . . . . . . . . 43,925 43,760 –0.4 103.2
*Significantly different from zero at the 90-percent confidence level.1 Thirteen states (Colorado, Illinois, Iowa, Kansas, Maine, Maryland, Massachusetts, New Jersey, New York, Oregon, Rhode Island, Vermont, and Wiscon-
sin) and the District of Columbia have an earned income credit (EIC) that uses federal eligibility rules to compute the state credit. The remaining states do nothave such a program.
Note: Definition numbering reflects historical series identification.
Source: U.S. Census Bureau, Current Population Survey, 2002 and 2003 Annual Social and Economic Supplements.
22 The Gini index in 2002 was not statisti-cally different from the index in 1994. SeeCurrent Population Reports, Series P60-204,“The Changing Shape of the Nation’s IncomeDistribution, 1947-98,” for trends in otherincome inequality measures. A higher Giniindex represents greater inequality.
What is . . .? The Gini Index summarizes the dispersion of incomeacross the entire income distribution. It ranges from 0, which indicatesperfect equality (where everyone receives an equal amount), to 1,which denotes perfect inequality (where all the income is received byonly one recipient or group of recipients).
23 The Census Bureau introduced comput-er-assisted interviewing, increased incomereporting limits, and introduced new Census2000-based population controls in the 1994CPS.
U.S. Census Bureau Income in the United States: 2002 15
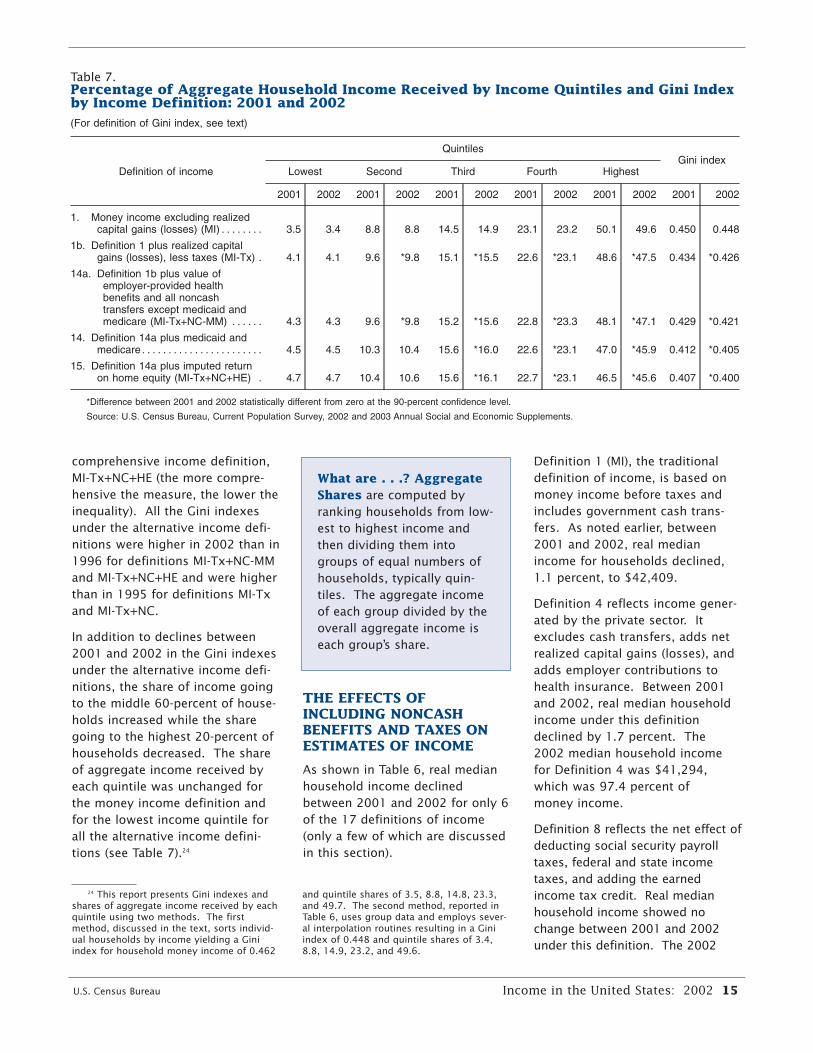
comprehensive income definition,MI-Tx+NC+HE (the more compre-hensive the measure, the lower theinequality). All the Gini indexesunder the alternative income defi-nitions were higher in 2002 than in1996 for definitions MI-Tx+NC-MMand MI-Tx+NC+HE and were higherthan in 1995 for definitions MI-Txand MI-Tx+NC.
In addition to declines between2001 and 2002 in the Gini indexesunder the alternative income defi-nitions, the share of income goingto the middle 60-percent of house-holds increased while the sharegoing to the highest 20-percent ofhouseholds decreased. The shareof aggregate income received byeach quintile was unchanged forthe money income definition andfor the lowest income quintile forall the alternative income defini-tions (see Table 7).24
THE EFFECTS OFINCLUDING NONCASHBENEFITS AND TAXES ONESTIMATES OF INCOME
As shown in Table 6, real medianhousehold income declinedbetween 2001 and 2002 for only 6of the 17 definitions of income(only a few of which are discussedin this section).
Definition 1 (MI), the traditionaldefinition of income, is based onmoney income before taxes andincludes government cash trans-fers. As noted earlier, between2001 and 2002, real medianincome for households declined,1.1 percent, to $42,409.
Definition 4 reflects income gener-ated by the private sector. Itexcludes cash transfers, adds netrealized capital gains (losses), andadds employer contributions tohealth insurance. Between 2001and 2002, real median householdincome under this definitiondeclined by 1.7 percent. The 2002 median household incomefor Definition 4 was $41,294,which was 97.4 percent of money income.
Definition 8 reflects the net effect ofdeducting social security payrolltaxes, federal and state incometaxes, and adding the earnedincome tax credit. Real medianhousehold income showed nochange between 2001 and 2002under this definition. The 2002
Table 7.Percentage of Aggregate Household Income Received by Income Quintiles and Gini Indexby Income Definition: 2001 and 2002(For definition of Gini index, see text)
Definition of income
QuintilesGini index
Lowest Second Third Fourth Highest
2001 2002 2001 2002 2001 2002 2001 2002 2001 2002 2001 2002
1. Money income excluding realizedcapital gains (losses) (MI) . . . . . . . . 3.5 3.4 8.8 8.8 14.5 14.9 23.1 23.2 50.1 49.6 0.450 0.448
1b. Definition 1 plus realized capitalgains (losses), less taxes (MI-Tx) . 4.1 4.1 9.6 *9.8 15.1 *15.5 22.6 *23.1 48.6 *47.5 0.434 *0.426
14a. Definition 1b plus value ofemployer-provided healthbenefits and all noncashtransfers except medicaid andmedicare (MI-Tx+NC-MM) . . . . . . 4.3 4.3 9.6 *9.8 15.2 *15.6 22.8 *23.3 48.1 *47.1 0.429 *0.421
14. Definition 14a plus medicaid andmedicare. . . . . . . . . . . . . . . . . . . . . . . 4.5 4.5 10.3 10.4 15.6 *16.0 22.6 *23.1 47.0 *45.9 0.412 *0.405
15. Definition 14a plus imputed returnon home equity (MI-Tx+NC+HE) . 4.7 4.7 10.4 10.6 15.6 *16.1 22.7 *23.1 46.5 *45.6 0.407 *0.400
*Difference between 2001 and 2002 statistically different from zero at the 90-percent confidence level.
Source: U.S. Census Bureau, Current Population Survey, 2002 and 2003 Annual Social and Economic Supplements.
What are . . .? AggregateShares are computed byranking households from low-est to highest income andthen dividing them intogroups of equal numbers ofhouseholds, typically quin-tiles. The aggregate incomeof each group divided by theoverall aggregate income iseach group’s share.
24 This report presents Gini indexes andshares of aggregate income received by eachquintile using two methods. The firstmethod, discussed in the text, sorts individ-ual households by income yielding a Giniindex for household money income of 0.462
and quintile shares of 3.5, 8.8, 14.8, 23.3,and 49.7. The second method, reported inTable 6, uses group data and employs sever-al interpolation routines resulting in a Giniindex of 0.448 and quintile shares of 3.4,8.8, 14.9, 23.2, and 49.6.

median household income forDefinition 8 was $35,280, whichwas 83.2 percent of money income.
Definition 11 includes nonmeans-tested cash transfers such as socialsecurity. Real median householdincome showed no change between2001 and 2002 under Definition 11.The 2002 median householdincome under Definition 11 was$41,183, which was 97.1 percent ofmoney income.25
Definition 14a (MI-Tx+NC-MM)includes the value of means-testedcash transfers and nonmeans-test-ed noncash transfers, except medi-caid and medicare. Real medianhousehold income showed nochange between 2001 and 2002under this definition of income.The 2002 median householdincome for Definition 14a was$39,426, which was 93.0 percentof money income
Definition 14 (MI-Tx+NC) adds thevalue of medicare and medicaid.Real median household incomeshowed no change between 2001and 2002 under this definition ofincome. The 2002 median house-hold income for Definition 14 was$42,061, which was 99.2 percentof money income.
The impact of including an estimat-ed return on home equity is shownin Definition 15. Real medianhousehold income showed nochange between 2001 and 2002under this definition of income.The 2002 median household
income for Definition 15 was$43,760, which was 103.2 percentof money income.
An important finding of the CensusBureau’s tax and noncash benefitresearch is that government trans-fers have a greater impact on lower-ing income inequality than the tax
system. In 2002, subtracting taxesand including the earned incomecredit (EIC) lowered the Gini indexby 4.1 percent (from 0.508 to0.487), while including transferslowered the Gini index by 16.8 per-cent (from 0.487 to 0.405).
CPS DATA COLLECTION
The information in this report wascollected in the 50 states and theDistrict of Columbia and does notinclude residents of Puerto Ricoand outlying areas. The estimatesin this report are controlled tonational population estimates byage, race, sex, and Hispanic originand to state population estimatesby age.
The CPS excludes armed forcespersonnel living on military basesand people living in institutions.For further documentation aboutthe CPS Annual Social andEconomic Supplement, seewww.bls.census.gov/cps/ads/adsmain.htm.
USER COMMENTS
The Census Bureau welcomes thecomments and advice of users ofdata and reports. If you have anysuggestions or comments, pleasewrite to:
Edward J. Welniak, Jr.Chief, Income Surveys BranchHousing and Household Economics
Statistics DivisionU.S. Census BureauWashington, DC 20233-8500
16 Income in the United States: 2002 U.S. Census Bureau
What are . . .?Government CashTransfers include socialsecurity, railroad retirement,black lung, unemploymentcompensation, workers’ com-pensation, veterans’ benefits,government educationalassistance, cash public assis-tance, and supplementalsecurity income.
What are . . .? Nonmeans-Tested CashTransfers include socialsecurity, railroad retirement,black lung, unemploymentcompensation, workers’ com-pensation, nonmeans- testedveterans’ benefits, and all gov-ernment educational assis-tance including Pell Grants(which are means-tested).
What are . . .? Means-tested Cash Transfersinclude cash public assis-tance, supplemental securityincome, and means-testedveterans’ benefits.
25 The income ratio for Definition 11 wasnot different from Definition 4.

U.S. Census Bureau Income in the United States: 2002 17
APPENDIX TABLES
Table A-1.Households by Total Money Income, Race, and Hispanic Origin of Householder:1967 to 2002(Income in 2002 CPI-U-RS adjusted dollars. Households as of March of the following year. See text for comparability issues regarding com-parison of data for racial groups using single and multiple race reporting methods)
Race andHispanic originof householder
and year Number(thou-
sands)
Percent distribution Medianincome
Meanincome
TotalUnder
$5,000
$5,000to
$9,999
$10,000to
$14,999
$15,000to
$24,999
$25,000to
$34,999
$35,000to
$49,999
$50,000to
$74,999
$75,000to
$99,999$100,000and over
Value(dol-lars)
Stan-darderror(dol-lars)
Value(dol-lars)
Stan-darderror(dol-lars)
ALL RACES
2002 . . . . . . . . 111,278 100.0 3.2 5.9 7.0 13.2 12.3 15.1 18.3 11.0 14.1 42,409 139 57,852 2172001 . . . . . . . . 109,297 100.0 3.1 5.7 6.8 13.2 12.4 15.3 18.3 11.0 14.3 42,900 131 59,134 23620001 . . . . . . . 108,209 100.0 2.8 5.7 6.8 12.6 12.6 15.2 18.7 11.0 14.5 43,848 138 59,664 23519992 . . . . . . . 106,434 100.0 2.7 5.7 6.7 13.3 12.3 15.3 18.5 11.0 14.4 43,915 205 59,067 3061998 . . . . . . . . 103,874 100.0 3.0 6.2 6.9 13.2 12.5 15.3 18.9 10.8 13.2 42,844 253 57,134 3091997 . . . . . . . . 102,528 100.0 3.0 6.5 7.3 13.8 12.5 15.5 18.8 10.3 12.3 41,346 191 55,522 3111996 . . . . . . . . 101,018 100.0 2.9 6.9 7.6 13.8 13.0 15.5 18.9 10.2 11.2 40,503 204 53,776 30119953 . . . . . . . 99,627 100.0 3.0 6.8 7.5 14.5 12.3 16.6 18.5 10.1 10.6 39,931 231 52,659 28819944 . . . . . . . 98,990 100.0 3.3 7.3 7.7 14.4 12.8 16.2 17.9 9.9 10.4 38,726 176 51,771 27819935 . . . . . . . 97,107 100.0 3.5 7.5 7.9 14.2 13.1 16.3 18.1 9.4 10.0 38,287 179 50,772 275
19926 . . . . . . . 96,426 100.0 3.3 7.6 7.6 14.5 13.0 16.3 18.8 9.5 9.4 38,482 182 48,788 2051991 . . . . . . . . 95,669 100.0 3.0 7.6 7.4 14.1 13.4 16.5 18.9 9.5 9.4 38,791 187 48,829 2011990 . . . . . . . . 94,312 100.0 3.0 7.3 7.3 13.6 13.3 17.1 19.0 9.5 9.7 39,949 204 49,902 2111989 . . . . . . . . 93,347 100.0 2.8 7.0 7.3 13.7 12.4 17.2 19.4 10.0 10.1 40,484 223 51,148 2231988 . . . . . . . . 92,830 100.0 3.0 7.7 7.2 14.0 12.3 17.0 19.6 10.0 9.4 39,767 194 49,688 22219877 . . . . . . . 91,124 100.0 3.2 7.7 7.1 14.1 13.0 16.6 19.3 9.9 9.1 39,453 188 49,065 2011986 . . . . . . . . 89,479 100.0 3.4 7.8 7.1 14.1 13.1 16.8 19.3 9.7 8.6 38,975 202 48,152 19619858 . . . . . . . 88,458 100.0 3.3 8.0 7.6 14.5 13.4 17.5 18.9 9.3 7.6 37,648 204 46,332 1831984 . . . . . . . . 86,789 100.0 3.2 8.0 8.0 14.9 13.7 17.5 18.7 8.8 7.2 36,921 168 45,238 16619839 . . . . . . . 85,290 100.0 3.5 8.1 8.0 15.3 14.2 17.5 18.8 8.2 6.5 36,001 163 43,865 163
1982 . . . . . . . . 83,918 100.0 3.4 8.4 8.2 15.2 13.7 18.4 18.3 8.1 6.1 35,986 162 43,369 1611981 . . . . . . . . 83,527 100.0 3.2 8.5 7.9 15.8 13.4 18.1 19.1 8.2 5.8 36,042 189 43,059 1571980 . . . . . . . . 82,368 100.0 2.9 8.3 8.2 15.0 13.6 18.5 19.6 8.1 5.9 36,608 188 43,539 159197910 . . . . . . 80,776 100.0 2.9 8.1 7.5 14.4 13.9 17.9 20.6 8.3 6.4 37,784 179 44,883 1701978 . . . . . . . . 77,330 100.0 2.6 8.1 7.8 14.5 13.7 18.2 20.5 8.6 6.0 37,826 153 44,520 1711977 . . . . . . . . 76,030 100.0 2.8 8.7 8.5 15.3 14.2 18.7 19.5 7.4 4.9 35,545 134 42,166 128197611 . . . . . . 74,142 100.0 2.8 8.8 8.3 15.3 14.4 19.2 19.6 7.1 4.5 35,345 131 41,575 128197512 . . . . . . 72,867 100.0 3.0 9.0 8.5 15.5 14.4 19.6 19.1 6.7 4.2 34,763 141 40,593 127197412 13 . . . . 71,163 100.0 2.9 8.5 7.8 15.0 14.7 19.9 19.4 7.0 4.6 35,719 137 41,770 1311973 . . . . . . . . 69,859 100.0 3.4 7.9 8.0 14.6 13.6 20.3 19.8 7.4 5.0 36,855 140 42,623 130
197214 . . . . . . 68,251 100.0 3.8 8.2 7.9 14.4 14.4 20.1 19.5 6.9 4.8 36,126 138 42,046 130197115 . . . . . . 66,676 100.0 4.3 8.7 7.5 15.2 15.2 20.9 18.2 6.1 3.9 34,669 134 39,873 1271970 . . . . . . . . 64,778 100.0 4.5 8.4 7.4 14.7 15.3 21.2 18.6 6.0 4.0 35,030 128 40,111 1281969 . . . . . . . . 63,401 100.0 4.4 8.5 7.1 14.1 16.1 21.1 19.2 5.9 3.8 35,266 130 40,122 1261968 . . . . . . . . 62,214 100.0 4.8 8.3 7.5 14.9 16.3 22.2 17.8 5.0 3.1 33,968 123 38,430 123196716 . . . . . . 60,813 100.0 5.6 8.8 7.8 15.3 17.1 21.5 16.3 4.6 3.1 32,591 119 36,452 119
WHITEALONE 17
2002 . . . . . . . . 91,645 100.0 2.5 5.2 6.8 12.8 12.0 15.2 18.9 11.6 15.0 45,086 183 60,166 245
WHITE 18
2001 . . . . . . . . 90,682 100.0 2.4 5.0 6.7 12.8 12.2 15.4 18.7 11.6 15.2 45,225 212 61,474 26420001 . . . . . . . 90,030 100.0 2.3 5.0 6.5 12.3 12.5 15.2 19.2 11.5 15.4 45,860 203 61,876 26519992 . . . . . . . 88,893 100.0 2.2 4.9 6.3 13.1 12.2 15.4 19.1 11.7 15.1 45,673 231 61,214 3461998 . . . . . . . . 87,212 100.0 2.4 5.2 6.6 12.8 12.4 15.5 19.6 11.4 14.2 45,077 226 59,726 3511997 . . . . . . . . 86,106 100.0 2.5 5.7 6.9 13.4 12.3 15.6 19.4 10.9 13.2 43,544 276 57,991 3531996 . . . . . . . . 85,059 100.0 2.3 6.0 7.2 13.5 13.0 15.6 19.7 10.7 12.0 42,407 219 55,911 33119953 . . . . . . . 84,511 100.0 2.4 5.9 7.1 14.2 12.3 16.9 19.2 10.5 11.5 41,911 219 54,758 31819944 . . . . . . . 83,737 100.0 2.7 6.2 7.4 14.1 12.8 16.6 18.6 10.4 11.1 40,843 229 54,053 31419935 . . . . . . . 82,387 100.0 2.7 6.4 7.4 13.9 13.1 16.8 19.0 9.9 10.8 40,394 235 53,048 30619926 . . . . . . . 81,795 100.0 2.5 6.5 7.2 14.1 13.1 16.7 19.7 10.1 10.1 40,458 196 50,991 227
See footnotes at end of table.

18 Income in the United States: 2002 U.S. Census Bureau
Table A-1.Households by Total Money Income, Race, and Hispanic Origin of Householder:1967 to 2002–Con.(Income in 2002 CPI-U-RS adjusted dollars. Households as of March of the following year. See text for comparability issues regarding com-parison of data for racial groups using single and multiple race reporting methods)
Race andHispanic originof householder
and year Number(thou-
sands)
Percent distribution Medianincome
Meanincome
TotalUnder
$5,000
$5,000to
$9,999
$10,000to
$14,999
$15,000to
$24,999
$25,000to
$34,999
$35,000to
$49,999
$50,000to
$74,999
$75,000to
$99,999$100,000and over
Value(dol-lars)
Stan-darderror(dol-lars)
Value(dol-lars)
Stan-darderror(dol-lars)
WHITE—Con.
1991 . . . . . . . . 81,675 100.0 2.3 6.5 7.0 13.9 13.4 16.9 19.8 10.1 10.1 40,649 197 50,890 2211990 . . . . . . . . 80,968 100.0 2.3 6.2 6.9 13.5 13.4 17.5 19.8 10.1 10.4 41,668 191 51,916 2321989 . . . . . . . . 80,163 100.0 2.2 6.0 6.9 13.4 12.4 17.5 20.4 10.4 10.9 42,585 207 53,278 2461988 . . . . . . . . 79,734 100.0 2.4 6.5 6.6 13.6 12.2 17.5 20.5 10.6 10.1 42,040 248 51,807 24419877 . . . . . . . 78,519 100.0 2.5 6.6 6.6 13.7 12.9 17.1 20.2 10.6 9.7 41,568 210 51,161 2211986 . . . . . . . . 77,284 100.0 2.7 6.9 6.7 13.7 13.0 17.2 20.2 10.4 9.2 40,976 199 50,157 21419858 . . . . . . . 76,576 100.0 2.7 6.9 7.2 14.1 13.4 17.9 19.7 9.8 8.3 39,704 212 48,234 2021984 . . . . . . . . 75,328 100.0 2.7 6.9 7.4 14.5 13.7 18.1 19.6 9.3 7.8 38,951 196 47,104 18319839 . . . . . . . 74,170 100.0 2.8 7.1 7.4 15.0 14.3 18.1 19.7 8.7 7.0 37,743 170 45,698 1761982 . . . . . . . . 73,182 100.0 2.9 7.4 7.6 14.7 13.9 18.9 19.2 8.8 6.7 37,674 171 45,156 177
1981 . . . . . . . . 72,845 100.0 2.6 7.4 7.4 15.3 13.5 18.6 20.1 8.7 6.3 38,081 176 44,863 1701980 . . . . . . . . 71,872 100.0 2.4 7.3 7.6 14.5 13.6 19.0 20.6 8.6 6.4 38,621 198 45,296 174197910 . . . . . . 70,766 100.0 2.4 7.2 7.0 14.0 13.8 18.3 21.5 8.8 6.9 39,616 188 46,653 1861978 . . . . . . . . 68,028 100.0 2.2 7.1 7.3 14.1 13.7 18.6 21.5 9.1 6.5 39,323 173 46,170 1861977 . . . . . . . . 66,934 100.0 2.5 7.7 7.9 14.7 14.2 19.3 20.6 7.8 5.4 37,378 157 43,813 141197611 . . . . . . 65,353 100.0 2.5 7.8 7.7 14.9 14.4 19.6 20.5 7.6 4.9 37,025 153 43,174 139197512 . . . . . . 64,392 100.0 2.7 8.0 8.0 15.1 14.3 20.2 20.1 7.1 4.6 36,354 133 42,093 138197412 13 . . . . 62,984 100.0 2.6 7.7 7.3 14.5 14.6 20.5 20.4 7.5 5.0 37,355 140 43,317 1401973 . . . . . . . . 61,965 100.0 3.0 7.2 7.3 13.9 13.5 20.8 20.9 8.0 5.4 38,626 147 44,271 140197214 . . . . . . 60,618 100.0 3.3 7.5 7.3 13.7 14.3 20.8 20.5 7.4 5.2 37,899 145 43,681 142
197115 . . . . . . 59,463 100.0 3.9 7.9 7.1 14.6 15.1 21.7 19.1 6.5 4.2 36,263 138 41,316 1341970 . . . . . . . . 57,575 100.0 4.0 7.7 6.9 14.1 15.2 21.9 19.5 6.3 4.3 36,486 140 41,515 1361969 . . . . . . . . 56,248 100.0 3.8 7.8 6.6 13.3 15.9 21.8 20.3 6.3 4.1 36,805 135 41,610 1391968 . . . . . . . . 55,394 100.0 4.2 7.7 6.9 14.2 16.4 23.0 18.9 5.3 3.3 35,367 132 39,811 132196716 . . . . . . 54,188 100.0 5.0 8.1 7.1 14.6 17.3 22.4 17.3 4.8 3.3 33,988 123 37,784 128
WHITEALONE, NOTHISPANIC17
2002 . . . . . . . . 81,166 100.0 2.3 5.0 6.6 12.2 11.5 15.0 19.2 12.2 16.0 46,900 184 62,115 264
WHITE, NOTHISPANIC18
2001 . . . . . . . . 80,818 100.0 2.3 4.9 6.5 12.2 11.8 15.1 19.0 12.0 16.2 47,041 195 63,437 28820001 . . . . . . . 80,527 100.0 2.2 4.8 6.4 11.7 12.2 15.0 19.4 12.0 16.4 47,642 191 63,759 28619992 . . . . . . . 79,819 100.0 2.0 4.7 6.0 12.6 11.8 15.2 19.5 12.1 16.1 47,650 314 63,221 3911998 . . . . . . . . 78,577 100.0 2.2 4.8 6.2 12.2 12.1 15.4 20.0 11.9 15.1 46,760 269 61,639 3771997 . . . . . . . . 77,936 100.0 2.2 5.2 6.6 13.0 12.1 15.6 19.9 11.5 14.0 45,338 237 59,849 (NA)1996 . . . . . . . . 77,240 100.0 2.1 5.6 6.9 12.9 12.8 15.6 20.2 11.2 12.7 44,263 304 57,602 (NA)19953 . . . . . . . 76,932 100.0 2.2 5.4 6.7 13.6 12.1 17.0 19.8 11.1 12.2 43,566 227 56,543 33919944 . . . . . . . 77,004 100.0 2.5 5.8 7.1 13.8 12.6 16.7 19.1 10.9 11.7 42,161 223 55,430 32919935 . . . . . . . 75,697 100.0 2.6 6.1 7.0 13.5 12.8 16.8 19.5 10.3 11.4 41,881 245 54,446 32519926 . . . . . . . 75,107 100.0 2.3 6.1 7.0 13.7 12.8 16.7 20.2 10.5 10.6 41,816 259 52,286 241
1991 . . . . . . . . 75,625 100.0 2.1 6.2 6.8 13.6 13.3 16.9 20.2 10.4 10.5 41,619 205 51,981 2321990 . . . . . . . . 75,035 100.0 2.2 5.9 6.6 13.1 13.2 17.5 20.2 10.5 10.9 42,620 199 53,060 2401989 . . . . . . . . 74,495 100.0 2.0 5.7 6.7 13.2 12.2 17.5 20.7 10.8 11.4 43,501 213 54,341 2661988 . . . . . . . . 74,067 100.0 2.2 6.2 6.4 13.3 12.1 17.5 20.8 10.9 10.5 43,198 242 52,862 24819877 . . . . . . . 73,120 100.0 2.3 6.3 6.4 13.4 12.7 17.2 20.6 10.9 10.1 42,711 248 52,168 2421986 . . . . . . . . 72,067 100.0 2.5 6.6 6.5 13.3 12.9 17.3 20.6 10.7 9.6 41,907 216 51,159 23519858 . . . . . . . 71,540 100.0 2.6 6.6 7.0 13.8 13.3 17.9 20.1 10.0 8.7 40,597 207 49,176 2231984 . . . . . . . . 70,586 100.0 2.5 6.7 7.2 14.2 13.7 18.1 19.9 9.6 8.1 39,759 221 47,916 21419839 . . . . . . . (NA) 100.0 2.7 6.8 7.1 14.7 14.2 18.1 20.1 9.0 7.3 (NA) (NA) (NA) (NA)1982 . . . . . . . . 69,214 100.0 2.7 7.2 7.4 14.5 13.8 19.0 19.5 9.0 6.9 38,306 193 45,815 196
See footnotes at end of table.

U.S. Census Bureau Income in the United States: 2002 19
Table A-1.Households by Total Money Income, Race, and Hispanic Origin of Householder:1967 to 2002–Con.(Income in 2002 CPI-U-RS adjusted dollars. Households as of March of the following year. See text for comparability issues regarding com-parison of data for racial groups using single and multiple race reporting methods)
Race andHispanic originof householder
and year Number(thou-
sands)
Percent distribution Medianincome
Meanincome
TotalUnder
$5,000
$5,000to
$9,999
$10,000to
$14,999
$15,000to
$24,999
$25,000to
$34,999
$35,000to
$49,999
$50,000to
$74,999
$75,000to
$99,999$100,000and over
Value(dol-lars)
Stan-darderror(dol-lars)
Value(dol-lars)
Stan-darderror(dol-lars)
WHITE, NOTHISPANIC—Con.
1981 . . . . . . . . 68,996 100.0 2.6 7.3 7.3 15.1 13.4 18.6 20.4 8.9 6.6 38,631 197 45,426 1891980 . . . . . . . . 68,106 100.0 2.3 7.1 7.5 14.2 13.5 19.1 20.9 8.8 6.6 39,306 108 45,889 207197910 . . . . . . 67,203 100.0 2.3 7.1 6.8 13.8 13.7 18.3 21.8 9.0 7.1 40,173 223 47,192 2071978 . . . . . . . . 64,836 100.0 2.2 7.0 7.2 13.9 13.5 18.6 21.7 9.3 6.7 40,063 211 46,705 2011977 . . . . . . . . 63,721 100.0 2.5 7.6 7.8 14.4 14.0 19.3 21.0 8.0 5.6 38,120 215 44,366 210197611 . . . . . . 62,365 100.0 2.5 7.6 7.5 14.6 14.3 19.7 20.9 7.8 5.1 37,780 220 43,743 195197512 . . . . . . 61,533 100.0 2.6 7.9 7.8 14.8 14.2 20.2 20.5 7.3 4.7 36,628 194 42,599 206197412 13 . . . . 60,164 100.0 2.5 7.6 7.1 14.2 14.5 20.5 20.7 7.7 5.1 37,674 185 43,799 1911973 . . . . . . . . 59,236 100.0 3.0 7.1 7.2 13.6 13.3 20.9 21.2 8.2 5.6 38,966 182 44,765 189197214 . . . . . . 58,005 100.0 3.3 7.5 7.1 13.4 14.1 20.8 20.9 7.5 5.4 38,439 183 44,188 197
BLACKALONE OR INCOMBINA-TION
2002 . . . . . . . . 13,778 100.0 6.9 10.7 9.5 16.3 14.5 14.8 13.9 6.7 6.6 29,177 384 40,334 470
BLACKALONE19
2002 . . . . . . . . 13,465 100.0 7.0 10.8 9.6 16.4 14.5 14.8 13.9 6.7 6.4 29,026 391 40,011 462
BLACK18
2001 . . . . . . . . 13,315 100.0 6.8 10.7 8.8 16.3 14.3 14.9 15.4 7.0 5.9 29,939 353 39,872 42120001 . . . . . . . 13,174 100.0 5.9 10.5 8.8 16.1 14.1 15.7 15.3 7.0 6.7 30,980 410 40,912 41519992 . . . . . . . 12,838 100.0 5.8 11.3 9.3 15.9 13.9 14.6 14.9 6.6 7.6 30,118 561 41,505 5961998 . . . . . . . . 12,579 100.0 6.7 13.2 9.4 16.9 13.4 14.5 14.0 6.4 5.6 27,932 437 37,615 5021997 . . . . . . . . 12,474 100.0 6.4 12.6 10.0 16.9 14.1 14.5 14.7 6.1 4.6 27,989 482 36,830 5281996 . . . . . . . . 12,109 100.0 6.9 13.0 10.7 16.8 13.6 15.0 14.0 5.4 4.5 26,797 527 37,043 72419953 . . . . . . . 11,577 100.0 7.0 13.4 10.5 17.5 13.2 15.1 13.1 6.5 3.7 26,240 448 35,623 60919944 . . . . . . . 11,655 100.0 7.3 15.1 10.4 17.0 13.5 13.2 13.3 5.6 4.6 25,238 469 35,119 50419935 . . . . . . . 11,281 100.0 8.5 15.3 11.8 16.2 13.7 13.5 12.0 4.9 4.0 23,939 473 33,370 55419926 . . . . . . . 11,269 100.0 8.7 15.9 10.6 16.9 13.4 13.7 12.7 4.6 3.5 23,558 481 31,968 433
1991 . . . . . . . . 11,083 100.0 8.1 16.1 10.8 16.1 13.3 14.3 12.9 5.0 3.3 24,216 509 32,246 4211990 . . . . . . . . 10,671 100.0 7.8 15.7 11.1 15.5 13.6 14.5 13.3 4.7 3.8 24,917 568 33,106 4471989 . . . . . . . . 10,486 100.0 7.6 15.3 10.4 16.5 13.0 15.0 12.6 6.0 3.6 25,326 515 33,606 4571988 . . . . . . . . 10,561 100.0 7.1 16.7 11.5 16.5 12.8 13.6 12.9 5.6 3.4 23,965 500 32,832 47919877 . . . . . . . 10,192 100.0 7.7 17.0 10.3 17.2 14.4 13.0 12.2 4.8 3.4 23,725 457 32,035 4411986 . . . . . . . . 9,922 100.0 8.9 15.4 10.7 17.1 13.5 13.7 13.1 4.4 3.1 23,607 463 31,672 43019858 . . . . . . . 9,797 100.0 7.2 16.7 10.8 18.3 13.5 14.4 12.2 4.7 2.3 23,622 459 30,821 4001984 . . . . . . . . 9,480 100.0 7.4 16.8 12.4 18.4 13.9 13.4 11.1 4.4 2.1 22,189 427 29,593 36419839 . . . . . . . 9,243 100.0 8.3 16.9 12.7 18.4 13.6 13.2 11.3 3.9 1.8 21,365 399 28,458 3491982 . . . . . . . . 8,916 100.0 8.1 17.1 12.2 19.1 12.6 15.1 11.5 2.9 1.4 21,352 343 28,094 351
1981 . . . . . . . . 8,961 100.0 7.5 17.7 12.3 19.5 12.7 13.8 11.5 3.8 1.2 21,370 359 28,072 3401980 . . . . . . . . 8,847 100.0 7.0 16.6 12.9 18.7 13.3 14.7 11.5 3.8 1.5 22,250 420 28,877 356197910 . . . . . . 8,586 100.0 6.5 16.0 12.3 18.4 14.1 14.5 12.6 4.0 1.6 23,259 425 29,844 3671978 . . . . . . . . 8,066 100.0 5.3 16.8 12.2 17.9 14.0 15.5 12.3 4.3 1.7 23,631 500 30,200 3941977 . . . . . . . . 7,977 100.0 5.4 17.1 12.7 20.5 14.4 14.3 11.0 3.4 1.1 22,057 296 28,262 251197611 . . . . . . 7,776 100.0 5.3 17.2 13.2 19.3 14.4 15.3 11.3 3.0 1.1 22,016 273 28,129 251197512 . . . . . . 7,489 100.0 6.4 17.2 13.8 18.5 15.1 14.6 10.7 2.7 0.9 21,824 321 27,242 242197412 13 . . . . 7,263 100.0 6.1 16.3 12.8 20.0 15.5 14.9 11.1 2.5 0.9 22,215 268 27,629 2461973 . . . . . . . . 7,040 100.0 6.8 14.3 13.7 19.7 14.9 16.0 10.4 3.0 1.3 22,737 354 28,234 280197214 . . . . . . 6,809 100.0 7.8 14.6 13.0 19.9 15.4 14.2 11.5 2.3 1.3 22,122 332 27,945 298
See footnotes at end of table.

20 Income in the United States: 2002 U.S. Census Bureau
Table A-1.Households by Total Money Income, Race, and Hispanic Origin of Householder:1967 to 2002–Con.(Income in 2002 CPI-U-RS adjusted dollars. Households as of March of the following year. See text for comparability issues regarding com-parison of data for racial groups using single and multiple race reporting methods)
Race andHispanic originof householder
and year Number(thou-
sands)
Percent distribution Medianincome
Meanincome
TotalUnder
$5,000
$5,000to
$9,999
$10,000to
$14,999
$15,000to
$24,999
$25,000to
$34,999
$35,000to
$49,999
$50,000to
$74,999
$75,000to
$99,999$100,000and over
Value(dol-lars)
Stan-darderror(dol-lars)
Value(dol-lars)
Stan-darderror(dol-lars)
BLACK—Con.
197115 . . . . . . 6,578 100.0 8.5 15.8 11.8 20.7 16.3 14.4 9.3 2.3 0.8 21,421 319 26,543 2731970 . . . . . . . . 6,180 100.0 8.9 14.6 12.2 20.5 15.6 15.0 9.8 2.6 0.9 22,207 305 27,116 2931969 . . . . . . . . 6,053 100.0 8.7 14.6 12.1 20.6 17.0 14.9 9.2 2.2 0.7 22,247 328 26,484 2821968 . . . . . . . . 5,870 100.0 9.2 14.5 13.1 22.2 15.3 14.5 8.4 2.1 0.6 20,855 303 25,400 268196716 . . . . . . 5,728 100.0 10.7 15.3 13.8 21.6 15.9 12.8 7.0 1.9 0.9 19,734 329 23,712 265
ASIANALONE OR INCOMBINA-TION
2002 . . . . . . . . 4,079 100.0 4.3 3.8 4.0 10.5 10.3 13.9 18.9 12.5 21.8 52,285 791 69,476 1,321
ASIANALONE20
2002 . . . . . . . . 3,917 100.0 4.3 3.6 4.0 10.5 10.5 13.6 18.8 12.6 22.1 52,626 921 70,047 1,366
ASIAN ANDPACIFICISLANDER18
2001 . . . . . . . . 4,071 100.0 4.2 3.9 4.2 10.0 9.7 14.3 18.9 12.6 22.3 54,488 1,300 74,323 1,75420001 . . . . . . . 3,963 100.0 3.6 3.3 4.3 8.9 10.0 13.6 19.0 13.7 23.5 58,225 993 76,019 1,57819992 . . . . . . . 3,742 100.0 3.9 4.1 4.6 9.0 10.0 14.5 17.8 12.8 23.2 54,991 1,938 72,718 1,8431998 . . . . . . . . 3,308 100.0 4.4 4.1 4.8 10.0 10.8 14.8 18.3 13.6 19.1 51,385 1,430 66,338 1,9161997 . . . . . . . . 3,125 100.0 4.3 4.4 5.7 9.9 9.5 15.8 19.7 11.8 18.8 50,558 1,406 65,799 2,0391996 . . . . . . . . 2,998 100.0 3.9 5.9 5.4 10.0 10.1 15.7 18.2 13.4 17.5 49,386 1,770 64,530 2,31419953 . . . . . . . 2,777 100.0 4.8 4.3 6.6 10.7 9.4 17.3 19.4 12.2 15.3 47,592 1,194 64,717 2,61119944 . . . . . . . 2,040 100.0 4.4 4.9 5.6 10.8 10.3 15.4 19.5 13.3 15.8 48,590 1,841 63,089 2,24819935 . . . . . . . 2,233 100.0 4.6 6.3 6.5 11.8 10.3 13.4 18.3 13.0 15.9 46,996 2,311 61,577 2,47919926 . . . . . . . 2,262 100.0 4.2 4.7 5.6 12.4 9.9 16.0 19.4 12.8 15.0 47,482 1,370 58,849 1,618
1991 . . . . . . . . 2,094 100.0 3.8 5.6 4.8 11.7 12.3 14.8 19.3 12.8 14.9 46,932 1,514 59,588 1,7561990 . . . . . . . . 1,958 100.0 3.8 4.0 5.5 10.8 9.8 14.7 21.4 13.4 16.6 51,299 1,520 61,922 1,7531989 . . . . . . . . 1,988 100.0 3.0 3.5 6.3 10.1 10.1 17.2 20.6 12.7 16.5 50,562 1,367 62,856 1,8291988 . . . . . . . . 1,913 100.0 3.1 4.7 6.1 12.6 10.2 15.4 20.6 11.5 15.8 47,132 1,937 58,925 1,760
HISPANIC(OF ANYRACE)21
2002 . . . . . . . . 11,339 100.0 4.3 6.7 8.1 17.2 15.7 16.4 16.9 7.5 7.2 33,103 482 44,887 6002001 . . . . . . . . 10,499 100.0 3.9 6.6 8.2 17.4 15.4 17.3 16.1 7.8 7.2 34,099 433 45,089 57020001 . . . . . . . 10,034 100.0 3.3 6.9 8.0 16.8 15.5 17.3 17.3 8.1 6.7 34,636 499 45,924 66119992 . . . . . . . 9,579 100.0 3.7 6.9 8.8 17.7 16.0 16.9 15.7 7.7 6.6 33,178 482 43,585 7741998 . . . . . . . . 9,060 100.0 4.5 9.2 9.4 17.2 15.6 15.9 15.4 6.5 6.2 31,214 602 42,177 8971997 . . . . . . . . 8,590 100.0 4.7 9.9 10.3 17.9 15.0 16.0 14.8 5.9 5.6 29,752 531 40,093 8091996 . . . . . . . . 8,225 100.0 4.4 10.3 10.6 19.0 15.3 15.4 14.1 5.9 4.8 28,422 551 38,806 89819953 . . . . . . . 7,939 100.0 5.1 11.5 10.7 20.0 14.3 15.5 13.5 5.2 4.3 26,788 584 36,562 82019944 . . . . . . . 7,735 100.0 4.9 11.6 10.7 18.1 14.9 15.7 13.5 5.7 4.8 28,112 522 37,907 94619935 . . . . . . . 7,362 100.0 4.4 10.7 11.4 18.8 15.4 16.3 13.3 5.6 4.1 28,048 564 37,123 781
19926 . . . . . . . 7,153 100.0 4.8 10.5 10.3 18.9 15.6 16.3 13.9 5.7 4.0 28,384 587 36,204 5691991 . . . . . . . . 6,379 100.0 4.3 10.2 10.6 18.0 15.4 16.5 14.6 5.9 4.5 29,217 608 37,176 5951990 . . . . . . . . 6,220 100.0 4.3 10.0 10.8 17.8 15.2 17.2 14.8 5.6 4.3 29,792 611 37,320 6151989 . . . . . . . . 5,933 100.0 4.7 10.0 9.1 16.9 15.0 16.9 16.2 6.4 4.9 30,701 595 39,204 6741988 . . . . . . . . 5,910 100.0 5.2 10.0 9.6 18.6 13.8 16.8 15.5 5.8 4.5 29,738 733 37,967 80519877 . . . . . . . 5,642 100.0 5.1 10.9 9.6 18.3 15.4 15.8 14.9 5.6 4.5 29,272 642 37,523 6951986 . . . . . . . . 5,418 100.0 4.9 10.7 10.0 18.7 14.7 16.3 14.6 6.4 3.7 28,729 748 36,276 59619858 . . . . . . . 5,213 100.0 4.7 11.1 11.2 18.4 15.0 17.0 14.0 5.7 2.9 27,840 650 34,787 5661984 . . . . . . . . 4,883 100.0 5.3 11.4 10.5 18.7 13.7 18.0 14.4 4.8 3.1 27,989 702 34,803 67919839 . . . . . . . 4,666 100.0 5.1 11.5 11.8 18.4 15.7 17.0 13.4 4.5 2.7 27,053 690 33,137 637
See footnotes at end of table.

U.S. Census Bureau Income in the United States: 2002 21
Table A-1.Households by Total Money Income, Race, and Hispanic Origin of Householder:1967 to 2002–Con.(Income in 2002 CPI-U-RS adjusted dollars. Households as of March of the following year. See text for comparability issues regarding com-parison of data for racial groups using single and multiple race reporting methods)
Race andHispanic originof householder
and year Number(thou-
sands)
Percent distribution Medianincome
Meanincome
TotalUnder
$5,000
$5,000to
$9,999
$10,000to
$14,999
$15,000to
$24,999
$25,000to
$34,999
$35,000to
$49,999
$50,000to
$74,999
$75,000to
$99,999$100,000and over
Value(dol-lars)
Stan-darderror(dol-lars)
Value(dol-lars)
Stan-darderror(dol-lars)
HISPANIC(OF ANYRACE)21—Con.
1982 . . . . . . . . 4,085 100.0 5.2 11.0 12.4 18.5 15.4 16.9 13.5 4.9 2.3 27,078 715 33,419 6781981 . . . . . . . . 3,980 100.0 4.0 10.4 10.1 19.1 16.3 18.2 14.6 5.1 2.3 28,911 792 34,718 6631980 . . . . . . . . 3,906 100.0 4.6 10.2 9.9 20.1 15.6 17.1 15.2 4.5 2.6 28,218 765 34,467 686197910 . . . . . . 3,684 100.0 3.4 9.8 9.4 18.9 16.1 18.8 15.5 5.1 3.1 29,936 863 36,221 7281978 . . . . . . . . 3,291 100.0 3.4 9.5 9.9 18.3 17.9 18.5 15.7 4.5 2.4 29,638 718 35,009 7081977 . . . . . . . . 3,304 100.0 3.3 10.0 11.2 20.0 18.3 18.2 13.3 3.8 1.9 27,884 490 32,908 508197611 . . . . . . 3,081 100.0 3.7 12.0 11.2 20.1 17.3 17.6 13.8 2.7 1.7 26,661 568 31,506 513197512 . . . . . . 2,948 100.0 4.2 11.6 10.8 21.5 16.8 19.2 11.7 2.7 1.4 26,116 577 31,004 551197412 13 . . . . 2,897 100.0 3.3 9.3 10.8 21.1 17.1 19.8 13.3 3.6 1.6 28,410 622 32,911 5361973 . . . . . . . . 2,722 100.0 3.3 8.5 10.3 20.7 17.6 19.4 15.0 3.7 1.6 28,553 649 33,174 540197214 . . . . . . 2,655 100.0 3.6 7.9 11.5 20.8 19.8 20.1 11.5 3.1 1.7 28,600 559 32,873 559
NA Not available.
1Implementation of a 28,000 household sample expansion.2Implementation of Census 2000-based population controls.3Full implementation of 1990 census-based sample design and metropolitan definitions, 7,000 household sample reduction, and revised race edits.4Introduction of 1990 census sample design.5Data collection method changed from paper and pencil to computer-assisted interviewing. In addition, the March 1994 income supplement was revised to
allow for the coding of different income amounts on selected questionnaire items. Limits either increased or decreased in the following categories: earnings lim-its increased to $999,999; social security limits increased to $49,999; supplemental security income and public assistance limits increased to $24,999; veterans’benefits limits increased to $99,999; child support and alimony limits decreased to $49,999.
6Implementation of 1990 census population controls.7Implementation of a new March CPS processing system.8Recording of amounts for earnings from longest job increased to $299,999. Full implementation of 1980 census-based sample design.9Implementation of Hispanic population weighting controls and introduction of 1980 census-based sample design.10Implementation of 1980 census population controls. Questionnaire expanded to show 27 possible values from 51 possible sources of income.11First year medians were derived using both Pareto and linear interpolation. Before this year, all medians were derived using linear interpolation.12Some of these estimates were derived using Pareto interpolation and may differ from published data which were derived using linear interpolation.13Implementation of a new March CPS processing system. Questionnaire expanded to ask 11 income questions.14Full implementation of 1970 census-based sample design.15Introduction of 1970 census sample design and population controls.16Implementation of a new March CPS processing system.17The 2003 CPS allowed respondents to choose more than one race. White alone refers to people who reported White and did not report any other race
category. The use of this single-race population does not imply that it is the preferred method of presenting or analyzing data. The Census Bureau uses a vari-ety of approaches. Information on people who reported more than one race, such as ‘‘White and American Indian and Alaska Native’’ or ‘‘Asian and Black orAfrican American,’’ in Census 2000 is forthcoming and will be available through American FactFinder in 2003. About 2.6 percent of people reported more thanone race.
18For the year 2001 and earlier, the CPS allowed respondents to report only one race group.19Black alone refers to people who reported Black and did not report any other race category.20Asian alone refers to people who reported Asian and did not report any other race category.21Because Hispanics may be of any race, data in this report for Hispanics overlap with data for other racial groups. Hispanic origin was reported by 11.4
percent of White householders (and no other race); 3.5 percent for Black householders (and no other race); 27.3 percent for American Indian or Alaska Nativehouseholders (and no other race); 1.4 percent for Asian householders (and no other race); and 19.0 percent for Native Hawaiian and Other Pacific Islanderhouseholders (and no other race). Data users should exercise caution when interpreting aggregate results for the Hispanic population because this populationconsists of many distinct groups that differ in socio-economic characteristics, culture, and recency of immigration. Data were first collected for Hispanics in 1972.
Source: U.S. Bureau of the Census, Current Population Survey, 1968 through 2003 Annual Social and Economic Supplements.

22 Income in the United States: 2002 U.S. Census Bureau
Table A-2.Median Household Income for Selected Definitions of Income by Race andHispanic Origin of Householder: 1979 to 2002(Income in 2002 CPI-U-RS adjusted dollars. See text for comparability issues regarding comparison of data for racial groups using singleand multiple race reporting methods)
Race and Hispanic originof householder and year
Total moneyincome (MI) (MI - TX)1 (MI- TX + NC - MM)2 (MI - Tx + NC)3 (MI - TX + NC + HE)4
ALL RACES
2002. . . . . . . . . . . . . . . . . . . . . . . . . 42,409 37,066 39,426 42,061 43,7602001. . . . . . . . . . . . . . . . . . . . . . . . . 42,900 37,376 39,553 42,194 43,92520005 . . . . . . . . . . . . . . . . . . . . . . . . 43,848 37,880 39,992 42,315 44,61219996 . . . . . . . . . . . . . . . . . . . . . . . . 43,915 37,972 40,052 42,357 44,3381998. . . . . . . . . . . . . . . . . . . . . . . . . 42,844 37,014 39,141 41,508 43,3101997. . . . . . . . . . . . . . . . . . . . . . . . . 41,346 35,552 37,691 40,067 42,0371996. . . . . . . . . . . . . . . . . . . . . . . . . 40,503 34,602 36,910 39,392 41,49319957 . . . . . . . . . . . . . . . . . . . . . . . . 39,931 34,239 36,654 39,028 41,31719948 . . . . . . . . . . . . . . . . . . . . . . . . 38,726 33,407 35,690 37,872 40,19219939 . . . . . . . . . . . . . . . . . . . . . . . . 38,287 33,051 35,248 37,251 39,329
199210 . . . . . . . . . . . . . . . . . . . . . . . 38,482 32,996 34,940 36,896 39,1291991. . . . . . . . . . . . . . . . . . . . . . . . . 38,791 33,119 34,856 36,604 39,2481990. . . . . . . . . . . . . . . . . . . . . . . . . 39,949 (NA) (NA) 37,110 39,6191989. . . . . . . . . . . . . . . . . . . . . . . . . 40,484 (NA) (NA) 37,693 40,7291988. . . . . . . . . . . . . . . . . . . . . . . . . 39,767 (NA) (NA) 36,949 40,272198711 . . . . . . . . . . . . . . . . . . . . . . . 39,453 (NA) (NA) 36,852 40,1451986. . . . . . . . . . . . . . . . . . . . . . . . . 38,975 (NA) (NA) 36,364 39,130198512 . . . . . . . . . . . . . . . . . . . . . . . 37,648 (NA) (NA) 34,909 38,5281984. . . . . . . . . . . . . . . . . . . . . . . . . 36,921 (NA) (NA) 34,264 38,382198313 . . . . . . . . . . . . . . . . . . . . . . . 36,001 (NA) (NA) 33,590 37,348
1982. . . . . . . . . . . . . . . . . . . . . . . . . 35,986 (NA) (NA) 33,073 37,5381981. . . . . . . . . . . . . . . . . . . . . . . . . 36,042 (NA) (NA) 32,755 38,3211980. . . . . . . . . . . . . . . . . . . . . . . . . 36,608 (NA) (NA) 33,522 36,957197914 . . . . . . . . . . . . . . . . . . . . . . . 37,784 (NA) (NA) 34,641 36,930
WHITE ALONE15
2002. . . . . . . . . . . . . . . . . . . . . . . . . 45,086 38,857 41,272 43,871 45,743
WHITE16
2001. . . . . . . . . . . . . . . . . . . . . . . . . 45,225 38,991 41,218 43,860 45,63120005 . . . . . . . . . . . . . . . . . . . . . . . . 45,860 39,395 41,557 43,905 46,26719996 . . . . . . . . . . . . . . . . . . . . . . . . 45,673 39,535 41,594 43,924 46,0631998. . . . . . . . . . . . . . . . . . . . . . . . . 45,077 38,861 41,019 43,282 45,2011997. . . . . . . . . . . . . . . . . . . . . . . . . 43,544 37,149 39,338 41,632 43,7651996. . . . . . . . . . . . . . . . . . . . . . . . . 42,407 36,156 38,597 40,988 43,24119957 . . . . . . . . . . . . . . . . . . . . . . . . 41,911 35,770 38,271 40,544 43,07619948 . . . . . . . . . . . . . . . . . . . . . . . . 40,843 34,951 37,206 39,291 41,76819939 . . . . . . . . . . . . . . . . . . . . . . . . 40,394 34,763 36,992 39,026 41,181
199210 . . . . . . . . . . . . . . . . . . . . . . . 40,458 34,642 36,719 38,632 40,9911991. . . . . . . . . . . . . . . . . . . . . . . . . 40,649 34,615 36,468 38,207 40,9941990. . . . . . . . . . . . . . . . . . . . . . . . . 41,668 (NA) (NA) 38,567 41,2491989. . . . . . . . . . . . . . . . . . . . . . . . . 42,585 (NA) (NA) 39,243 42,4741988. . . . . . . . . . . . . . . . . . . . . . . . . 42,040 (NA) (NA) 38,648 42,120198711 . . . . . . . . . . . . . . . . . . . . . . . 41,568 (NA) (NA) 38,560 42,1021986. . . . . . . . . . . . . . . . . . . . . . . . . 40,976 (NA) (NA) 37,965 40,904198512 . . . . . . . . . . . . . . . . . . . . . . . 39,704 (NA) (NA) 36,411 40,3121984. . . . . . . . . . . . . . . . . . . . . . . . . 38,951 (NA) (NA) 35,768 40,158198313 . . . . . . . . . . . . . . . . . . . . . . . 37,743 (NA) (NA) 35,015 38,906
1982. . . . . . . . . . . . . . . . . . . . . . . . . 37,674 (NA) (NA) 34,397 39,0761981. . . . . . . . . . . . . . . . . . . . . . . . . 38,081 (NA) (NA) 34,100 39,9951980. . . . . . . . . . . . . . . . . . . . . . . . . 38,621 (NA) (NA) 34,843 38,462197914 . . . . . . . . . . . . . . . . . . . . . . . 39,616 (NA) (NA) 35,968 38,369
See footnotes at end of table.
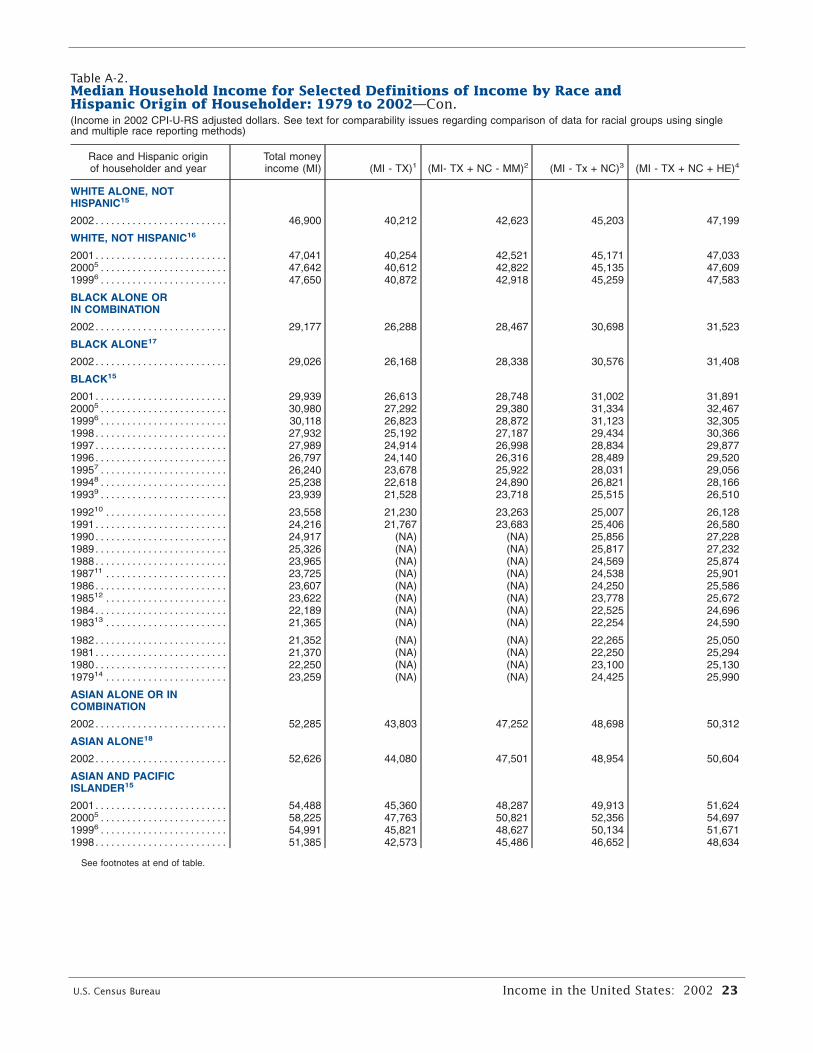
U.S. Census Bureau Income in the United States: 2002 23
Table A-2.Median Household Income for Selected Definitions of Income by Race andHispanic Origin of Householder: 1979 to 2002—Con.(Income in 2002 CPI-U-RS adjusted dollars. See text for comparability issues regarding comparison of data for racial groups using singleand multiple race reporting methods)
Race and Hispanic originof householder and year
Total moneyincome (MI) (MI - TX)1 (MI- TX + NC - MM)2 (MI - Tx + NC)3 (MI - TX + NC + HE)4
WHITE ALONE, NOTHISPANIC15
2002. . . . . . . . . . . . . . . . . . . . . . . . . 46,900 40,212 42,623 45,203 47,199
WHITE, NOT HISPANIC16
2001. . . . . . . . . . . . . . . . . . . . . . . . . 47,041 40,254 42,521 45,171 47,03320005 . . . . . . . . . . . . . . . . . . . . . . . . 47,642 40,612 42,822 45,135 47,60919996 . . . . . . . . . . . . . . . . . . . . . . . . 47,650 40,872 42,918 45,259 47,583
BLACK ALONE ORIN COMBINATION
2002. . . . . . . . . . . . . . . . . . . . . . . . . 29,177 26,288 28,467 30,698 31,523
BLACK ALONE17
2002. . . . . . . . . . . . . . . . . . . . . . . . . 29,026 26,168 28,338 30,576 31,408
BLACK15
2001. . . . . . . . . . . . . . . . . . . . . . . . . 29,939 26,613 28,748 31,002 31,89120005 . . . . . . . . . . . . . . . . . . . . . . . . 30,980 27,292 29,380 31,334 32,46719996 . . . . . . . . . . . . . . . . . . . . . . . . 30,118 26,823 28,872 31,123 32,3051998. . . . . . . . . . . . . . . . . . . . . . . . . 27,932 25,192 27,187 29,434 30,3661997. . . . . . . . . . . . . . . . . . . . . . . . . 27,989 24,914 26,998 28,834 29,8771996. . . . . . . . . . . . . . . . . . . . . . . . . 26,797 24,140 26,316 28,489 29,52019957 . . . . . . . . . . . . . . . . . . . . . . . . 26,240 23,678 25,922 28,031 29,05619948 . . . . . . . . . . . . . . . . . . . . . . . . 25,238 22,618 24,890 26,821 28,16619939 . . . . . . . . . . . . . . . . . . . . . . . . 23,939 21,528 23,718 25,515 26,510
199210 . . . . . . . . . . . . . . . . . . . . . . . 23,558 21,230 23,263 25,007 26,1281991. . . . . . . . . . . . . . . . . . . . . . . . . 24,216 21,767 23,683 25,406 26,5801990. . . . . . . . . . . . . . . . . . . . . . . . . 24,917 (NA) (NA) 25,856 27,2281989. . . . . . . . . . . . . . . . . . . . . . . . . 25,326 (NA) (NA) 25,817 27,2321988. . . . . . . . . . . . . . . . . . . . . . . . . 23,965 (NA) (NA) 24,569 25,874198711 . . . . . . . . . . . . . . . . . . . . . . . 23,725 (NA) (NA) 24,538 25,9011986. . . . . . . . . . . . . . . . . . . . . . . . . 23,607 (NA) (NA) 24,250 25,586198512 . . . . . . . . . . . . . . . . . . . . . . . 23,622 (NA) (NA) 23,778 25,6721984. . . . . . . . . . . . . . . . . . . . . . . . . 22,189 (NA) (NA) 22,525 24,696198313 . . . . . . . . . . . . . . . . . . . . . . . 21,365 (NA) (NA) 22,254 24,590
1982. . . . . . . . . . . . . . . . . . . . . . . . . 21,352 (NA) (NA) 22,265 25,0501981. . . . . . . . . . . . . . . . . . . . . . . . . 21,370 (NA) (NA) 22,250 25,2941980. . . . . . . . . . . . . . . . . . . . . . . . . 22,250 (NA) (NA) 23,100 25,130197914 . . . . . . . . . . . . . . . . . . . . . . . 23,259 (NA) (NA) 24,425 25,990
ASIAN ALONE OR INCOMBINATION
2002. . . . . . . . . . . . . . . . . . . . . . . . . 52,285 43,803 47,252 48,698 50,312
ASIAN ALONE18
2002. . . . . . . . . . . . . . . . . . . . . . . . . 52,626 44,080 47,501 48,954 50,604
ASIAN AND PACIFICISLANDER15
2001. . . . . . . . . . . . . . . . . . . . . . . . . 54,488 45,360 48,287 49,913 51,62420005 . . . . . . . . . . . . . . . . . . . . . . . . 58,225 47,763 50,821 52,356 54,69719996 . . . . . . . . . . . . . . . . . . . . . . . . 54,991 45,821 48,627 50,134 51,6711998. . . . . . . . . . . . . . . . . . . . . . . . . 51,385 42,573 45,486 46,652 48,634
See footnotes at end of table.

24 Income in the United States: 2002 U.S. Census Bureau
Table A-2.Median Household Income for Selected Definitions of Income by Race andHispanic Origin of Householder: 1979 to 2002—Con.(Income in 2002 CPI-U-RS adjusted dollars. See text for comparability issues regarding comparison of data for racial groups using singleand multiple race reporting methods)
Race and Hispanic originof householder and year
Total moneyincome (MI) (MI - TX)1 (MI- TX + NC - MM)2 (MI - Tx + NC)3 (MI - TX + NC + HE)4
ASIAN AND PACIFICISLANDER15—Con.1997. . . . . . . . . . . . . . . . . . . . . . . . . 50,558 42,059 44,917 46,510 48,7961996. . . . . . . . . . . . . . . . . . . . . . . . . 49,386 40,958 43,750 45,207 47,52819957 . . . . . . . . . . . . . . . . . . . . . . . . 47,592 39,911 43,034 44,658 46,36719948 . . . . . . . . . . . . . . . . . . . . . . . . 48,590 40,023 43,550 44,740 46,36119939 . . . . . . . . . . . . . . . . . . . . . . . . 46,996 38,737 42,007 43,659 45,793199210 . . . . . . . . . . . . . . . . . . . . . . . 47,482 38,898 41,486 42,703 45,0411991. . . . . . . . . . . . . . . . . . . . . . . . . 46,932 38,196 40,197 41,695 44,0111990. . . . . . . . . . . . . . . . . . . . . . . . . 51,299 (NA) (NA) (NA) (NA)1989. . . . . . . . . . . . . . . . . . . . . . . . . 50,562 (NA) (NA) (NA) (NA)1988. . . . . . . . . . . . . . . . . . . . . . . . . 47,132 (NA) (NA) (NA) (NA)198711 . . . . . . . . . . . . . . . . . . . . . . . 48,786 (NA) (NA) (NA) (NA)HISPANIC (OF ANY RACE)2002. . . . . . . . . . . . . . . . . . . . . . . . . 33,103 30,291 32,651 34,633 35,4472001. . . . . . . . . . . . . . . . . . . . . . . . . 34,099 30,607 32,678 34,939 35,88220005 . . . . . . . . . . . . . . . . . . . . . . . . 34,636 31,071 33,282 35,153 36,28819996 . . . . . . . . . . . . . . . . . . . . . . . . 33,178 29,909 32,295 34,055 34,8441998. . . . . . . . . . . . . . . . . . . . . . . . . 31,214 28,346 30,374 31,967 32,8181997. . . . . . . . . . . . . . . . . . . . . . . . . 29,752 26,973 29,146 30,708 31,6891996. . . . . . . . . . . . . . . . . . . . . . . . . 28,422 26,017 28,317 30,128 31,04919957 . . . . . . . . . . . . . . . . . . . . . . . . 26,788 24,817 27,245 28,862 29,73219948 . . . . . . . . . . . . . . . . . . . . . . . . 28,112 25,356 27,435 29,260 30,46519939 . . . . . . . . . . . . . . . . . . . . . . . . 28,048 25,249 27,468 29,303 30,233199210 . . . . . . . . . . . . . . . . . . . . . . . 28,384 25,435 27,434 29,073 30,2131991. . . . . . . . . . . . . . . . . . . . . . . . . 29,217 26,082 28,132 29,588 30,9941990. . . . . . . . . . . . . . . . . . . . . . . . . 29,792 (NA) (NA) 29,545 31,0121989. . . . . . . . . . . . . . . . . . . . . . . . . 30,701 (NA) (NA) 30,111 31,7251988. . . . . . . . . . . . . . . . . . . . . . . . . 29,738 (NA) (NA) 29,060 31,034198711 . . . . . . . . . . . . . . . . . . . . . . . 29,272 (NA) (NA) 28,488 30,1681986. . . . . . . . . . . . . . . . . . . . . . . . . 28,729 (NA) (NA) 28,114 29,637198512 . . . . . . . . . . . . . . . . . . . . . . . 27,840 (NA) (NA) 27,352 29,2331984. . . . . . . . . . . . . . . . . . . . . . . . . 27,989 (NA) (NA) 27,681 29,781198313 . . . . . . . . . . . . . . . . . . . . . . . 27,053 (NA) (NA) 26,957 28,8781982. . . . . . . . . . . . . . . . . . . . . . . . . 27,078 (NA) (NA) 26,914 28,9861981. . . . . . . . . . . . . . . . . . . . . . . . . 28,911 (NA) (NA) 27,951 31,1031980. . . . . . . . . . . . . . . . . . . . . . . . . 28,218 (NA) (NA) 30,944 33,069197914 . . . . . . . . . . . . . . . . . . . . . . . 29,936 (NA) (NA) 29,509 30,804
NA Not available.1Money income, less taxes.2Money income, less taxes, plus value of noncash transfers less Medicare and Medicaid.3Money income, less taxes, plus value of noncash transfers.4Money income, less taxes, plus value of noncash transfers, plus imputed value of home equity.5Implementation of a 28,000 household sample expansion.6Implementation of Census 2000-based population controls.7Full implementation of 1990 census-based sample design and metropolitan definitions, 7,000 household sample reduction, revised race edits.8Introduction of 1990 census sample design.9Data collection method changed from paper and pencil to computer-assisted interviewing. In addition, the March 1994 income supplement was revised to
allow for the coding of different income amounts on selected questionnaire items. Limits either increased or decreased in the following categories: earningslimits increased to $999,999; social security limits increased to $49,999; supplemental security income and public assistance limits increased to $24,999;veterans' benefits limits increased to $99,999; child support and alimony limits decreased to $49,999.
10Implementation of 1990 census population controls.11Implementation of a new March CPS processing system.12Recording of amounts for earnings from longest job increased to $299,999. Full implementation of 1980 census-based sample design.13Implementation of Hispanic population weighting controls and introduction of 1980 census-based sample design.14Implemenation of 1980 census population controls. Questionnaire expanded to show 27 possible values from 51 possible sources of income.15The 2003 CPS allowed respondents to choose more than one race. White alone refers to people who reported White and did not report any other race
category. The use of this single-race population does not imply that it is the preferred method of presenting or analyzing data. The Census Bureau uses a vari-ety of approaches. Information on people who reported more than one race, such as ‘‘White and American Indian and Alaska Native’’ or ‘‘Asian and Black orAfrican American,’’ in Census 2000 is forthcoming and will be available through American FactFinder in 2003. About 2.6 percent of people reported more thanone race.
16For 2001 and earlier years, the CPS allowed respondents to report only one race group. The reference race groups for 2001 and earlier income data are:White, non-Hispanic White, Black, and Asian and Pacific Islander.
17Black or African American alone refers to people who reported Black or African American and did not report any other race category.18Asian alone refers to people who reported Asian and did not report any other race category.
Source: U.S. Census Bureau, Current Population Survey, 1980 to 2003 Annual Social and Economic Supplements.

U.S. Census Bureau Income in the United States: 2002 25
Table A-3.Share of Aggregate Income Received by Each Fifth and Top 5 Percent of Households:1967 to 2002(Households as of March of the following year. Income in 2002 CPI-U-RS adjusted dollars)
Year Number(thou-
sands)
Upper limit of each fifth(dollars)
Lowerlimit of
top 5percent
(dol-lars)
Share of aggregate incomeMean
income(dol-lars)
GiniindexLowest Second Third Fourth Lowest Second Third Fourth Highest
Top 5percent
2002 . . . . . 111,278 17,916 33,377 53,162 84,016 150,002 3.5 8.8 14.8 23.3 49.7 21.7 57,852 0.4622001 . . . . . 109,297 18,256 33,844 53,843 84,828 152,893 3.5 8.7 14.6 23.0 50.1 22.4 59,134 0.46620001 . . . . 108,209 18,713 34,461 54,483 85,385 151,647 3.6 8.9 14.8 23.0 49.8 22.1 59,664 0.46219992 . . . . 106,434 18,492 34,445 54,370 85,500 153,234 3.6 8.9 14.9 23.2 49.4 21.5 59,067 0.4581998 . . . . . 103,874 17,757 33,504 53,258 82,636 145,658 3.6 9.0 15.0 23.2 49.2 21.4 57,134 0.4561997 . . . . . 102,528 17,207 32,626 51,397 79,888 141,397 3.6 8.9 15.0 23.2 49.4 21.7 55,522 0.4591996 . . . . . 101,018 16,853 31,679 50,219 77,617 136,416 3.7 9.0 15.1 23.3 49.0 21.4 53,776 0.45519953 . . . . 99,627 16,874 31,538 49,218 76,313 132,415 3.7 9.1 15.2 23.3 48.7 21.0 52,659 0.45019944 . . . . 98,990 16,115 30,247 48,131 75,426 131,815 3.6 8.9 15.0 23.4 49.1 21.2 51,771 0.45619935 . . . . 97,107 15,892 30,245 47,543 73,901 128,240 3.6 9.0 15.1 23.5 48.9 21.0 50,772 0.454
19926 . . . . 96,426 15,827 30,323 47,607 72,863 124,381 3.8 9.4 15.8 24.2 46.9 18.6 48,788 0.4341991 . . . . . 95,669 16,208 30,903 47,732 73,085 124,126 3.8 9.6 15.9 24.2 46.5 18.1 48,829 0.4281990 . . . . . 94,312 16,677 31,569 48,297 73,654 126,411 3.9 9.6 15.9 24.0 46.6 18.6 49,902 0.4281989 . . . . . 93,347 16,941 32,212 49,509 75,223 128,499 3.8 9.5 15.8 24.0 46.8 18.9 51,148 0.4311988 . . . . . 92,830 16,625 31,405 48,942 73,900 125,093 3.8 9.6 16.0 24.3 46.3 18.3 49,688 0.42719877 . . . . 91,124 16,350 31,034 48,444 73,215 122,515 3.8 9.6 16.1 24.3 46.2 18.2 49,065 0.4261986 . . . . . 89,479 16,215 30,969 47,832 72,199 122,459 3.9 9.7 16.2 24.5 45.7 17.5 48,152 0.42519858 . . . . 88,458 15,940 30,051 46,262 69,833 116,784 4.0 9.7 16.3 24.6 45.3 17.0 46,332 0.4191984 . . . . . 86,789 15,813 29,491 45,307 68,522 114,627 4.1 9.9 16.4 24.7 44.9 16.5 45,238 0.41519839 . . . . 85,290 15,416 28,730 44,052 66,628 110,652 4.1 10.0 16.5 24.7 44.7 16.4 43,865 0.414
1982 . . . . . 83,918 15,200 28,563 43,817 65,421 109,019 4.1 10.1 16.6 24.7 44.5 16.2 43,369 0.4121981 . . . . . 83,527 15,419 28,408 44,209 65,381 106,385 4.2 10.2 16.8 25.0 43.8 15.6 43,059 0.4061980 . . . . . 82,368 15,619 29,146 44,670 65,527 106,455 4.3 10.3 16.9 24.9 43.7 15.8 43,539 0.403197910. . . . 80,776 16,088 29,920 45,964 66,788 108,949 4.2 10.3 16.9 24.7 44.0 16.4 44,883 0.4041978 . . . . . 77,330 16,030 30,132 45,565 66,354 106,899 4.3 10.3 16.9 24.8 43.7 16.2 44,520 0.4021977 . . . . . 76,030 15,224 28,547 43,295 63,118 102,039 4.4 10.3 17.0 24.8 43.6 16.1 42,166 0.402197611 . . . . 74,142 15,265 28,232 42,971 61,831 98,580 4.4 10.4 17.1 24.8 43.3 16.0 41,575 0.398197512. . . . 72,867 14,804 27,840 41,969 60,381 96,278 4.4 10.5 17.1 24.8 43.2 15.9 40,593 0.397197412 13 . 71,163 15,704 29,010 42,746 62,055 99,162 4.4 10.6 17.1 24.7 43.1 15.9 41,770 0.3951973 . . . . . 69,859 15,490 29,426 43,650 63,056 99,953 4.2 10.5 17.1 24.6 43.6 16.6 42,623 0.397
197214. . . . 68,251 15,088 29,059 42,955 61,470 98,948 4.1 10.5 17.1 24.5 43.9 17.0 42,046 0.401197115. . . . 66,676 14,593 27,818 40,936 58,371 92,694 4.1 10.6 17.3 24.5 43.5 16.7 39,873 0.3961970 . . . . . 64,778 14,788 28,332 41,214 58,801 92,960 4.1 10.8 17.4 24.5 43.3 16.6 40,111 0.3941969 . . . . . 63,401 15,025 28,838 41,702 58,434 91,644 4.1 10.9 17.5 24.5 43.0 16.6 40,122 0.3911968 . . . . . 62,214 14,578 27,638 39,614 55,661 87,081 4.2 11.1 17.5 24.4 42.8 16.6 38,430 0.388196716. . . . 60,813 13,688 26,692 37,898 54,027 86,692 4.0 10.8 17.3 24.2 43.8 17.5 36,452 0.399
1Implementation of a 28,000 household sample expansion.2Implementation of Census 2000-based population controls.3Full implementation of 1990 census-based sample design and metropolitan definitions, 7,000 household sample reduction, and revised race edits.4Introduction of 1990 census-based sample design.5Data collection method changed from paper and pencil to computer-assisted interviewing. In addition, the March 1994 income supplement was revised to
allow for the coding of different income amounts on selected questionnaire items. Limits either increased or decreased in the following categories: earnings lim-its increased to $999,999; social security limits increased to $49,999; supplemental security income and public assistance limits increased to $24,999; veterans’benefits limits increased to $99,999; child support and alimony limits decreased to $49,999.
6Implementation of 1990 census population controls.7Implementation of a new March CPS processing system.8Recording of amounts for earnings from longest job increased to $299,999. Full implementation of 1980 census-based sample design.9Implementation of Hispanic population weighting controls and introduction of 1980 census-based sample design.10Implementation of 1980 census population controls. Questionnaire expanded to show 27 possible values from 51 possible sources of income.11First year medians were derived using both Pareto and linear interpolation. Before this year, all medians were derived using linear interpolation.12Some of these estimates were derived using Pareto interpolation and may differ from published data which were derived using linear interpolation.13Implementation of a new March CPS processing system. Questionnaire expanded to ask 11 income questions.14Full implementation of 1970 census-based sample design.15Introduction of 1970 census-based sample design and population controls.16Implementation of a new March CPS processing system.
Source: U.S. Census Bureau, Current Population Survey, 1968 to 2003 Annual Social and Economic Supplements.

26 Income in the United States: 2002 U.S. Census Bureau
Table
A-4
.Sele
cte
dM
easu
res
of
Hou
seh
old
Incom
eD
isp
ers
ion
:1
96
7to
20
02
(In
2002
dolla
rs.
For
furt
her
expl
anat
ion
ofin
com
ein
equa
lity
mea
sure
s,se
eC
urre
ntP
opul
atio
nR
epor
ts,
Ser
ies
P60
-204
,‘‘T
heC
hang
ing
Sha
peof
the
Nat
ion’
sIn
com
eD
istr
ibut
ion:
1947
-199
8’’)
Mea
sure
sof
inco
me
disp
ersi
on20
0220
0120
001
1999
219
9819
9719
9619
953
1994
419
935
1992
619
9119
9019
8919
8819
877
1986
1985
8
Ho
use
ho
ldIn
com
eat
Sel
ecte
dP
erce
nti
les
10th
perc
entil
eup
per
limit.
..
..
..
10,6
2011
,087
11,0
5011
,197
10,6
8810
,296
10,1
6810
,167
9,63
69,
420
9,43
39,
557
9,76
610
,084
9,58
89,
356
9,36
59,
400
20th
perc
entil
eup
per
limit.
..
..
..
17,9
1618
,256
18,7
1318
,556
17,7
5717
,207
16,8
5316
,874
16,1
1515
,892
15,8
2716
,208
16,6
7716
,941
16,6
2516
,350
16,2
1515
,940
50th
(med
ian)
..
..
..
..
..
..
..
.42
,409
42,9
0043
,848
44,0
4542
,844
41,3
4640
,503
39,9
3138
,726
38,2
8738
,482
38,7
9139
,949
40,4
8439
,767
39,4
5338
,975
37,6
4880
thpe
rcen
tile
uppe
rlim
it..
..
..
.84
,016
84,8
2885
,385
85,6
5482
,636
79,8
8877
,617
76,3
1375
,426
73,9
0172
,863
73,0
8573
,654
75,2
2373
,900
73,2
1572
,199
69,8
3390
thpe
rcen
tile
uppe
rlim
it..
..
..
.11
4,11
211
7,95
211
6,95
711
6,47
211
1,61
310
9,12
010
5,04
510
2,76
710
1,88
310
0,17
897
,977
97,7
0898
,863
100,
774
97,8
6696
,017
94,4
7591
,112
95th
perc
entil
elo
wer
limit
..
..
..
.15
0,00
215
2,89
315
1,64
715
3,25
614
5,65
814
1,39
713
6,41
613
2,41
513
1,81
512
8,24
012
4,38
112
4,12
612
6,41
112
8,49
912
5,09
312
2,51
512
2,45
911
6,78
4
Ho
use
ho
ldIn
com
eR
atio
so
fS
elec
ted
Per
cen
tile
s
90th
/10t
h.
..
..
..
..
..
..
..
..
.10
.75
10.6
410
.58
10.4
010
.44
10.6
010
.33
10.1
110
.57
10.6
410
.39
10.2
210
.12
9.99
10.2
110
.26
10.0
99.
6995
th/2
0th
..
..
..
..
..
..
..
..
..
8.37
8.38
8.10
8.26
8.20
8.22
8.09
7.85
8.18
8.07
7.86
7.66
7.58
7.59
7.52
7.49
7.55
7.33
95th
/50t
h.
..
..
..
..
..
..
..
..
.3.
543.
563.
463.
483.
403.
423.
373.
323.
403.
353.
233.
203.
163.
173.
153.
113.
143.
1080
th/5
0th
..
..
..
..
..
..
..
..
..
1.98
1.98
1.95
1.94
1.93
1.93
1.92
1.91
1.95
1.93
1.89
1.88
1.84
1.86
1.86
1.86
1.85
1.85
80th
/20t
h.
..
..
..
..
..
..
..
..
.4.
694.
654.
564.
624.
654.
644.
614.
524.
684.
654.
604.
514.
424.
444.
454.
484.
454.
3820
th/5
0th
..
..
..
..
..
..
..
..
..
0.42
0.43
0.43
0.42
0.41
0.42
0.42
0.42
0.42
0.42
0.41
0.42
0.42
0.42
0.42
0.41
0.42
0.42
Mea
nH
ou
seh
old
Inco
me
of
Qu
inti
les
Low
est
quin
tile
..
..
..
..
..
..
..
9,99
010
,297
10,6
0710
,726
10,1
629,
913
9,81
09,
785
9,31
79,
084
9,15
59,
352
9,59
99,
833
9,50
09,
336
9,30
59,
241
Sec
ond
quin
tile
..
..
..
..
..
..
..
25,4
0025
,873
26,4
8326
,369
25,6
5924
,691
24,0
7523
,901
23,0
7422
,864
22,8
3723
,369
24,0
5524
,371
23,8
3423
,592
23,4
2122
,843
Thi
rdqu
intil
e.
..
..
..
..
..
..
..
.42
,802
43,3
0744
,102
44,1
1342
,934
41,5
3940
,496
39,9
6638
,871
38,3
2538
,476
38,8
1839
,733
40,5
1039
,863
39,4
4439
,103
37,8
34F
ourt
hqu
intil
e.
..
..
..
..
..
..
..
67,3
2667
,902
68,5
5968
,583
66,4
0264
,338
62,6
7661
,437
60,4
8859
,560
59,0
6459
,175
59,9
0661
,278
60,2
5959
,621
58,8
9556
,897
Hig
hest
quin
tile
..
..
..
..
..
..
..
143,
743
148,
291
148,
566
146,
113
140,
513
137,
167
131,
822
128,
209
127,
163
124,
091
114,
445
113,
477
116,
257
119,
786
115,
042
113,
385
110,
114
104,
953
Sh
ares
of
Ho
use
ho
ldIn
com
eo
fQ
uin
tile
s
Low
est
quin
tile
..
..
..
..
..
..
..
3.5
3.5
3.6
3.6
3.6
3.6
3.7
3.7
3.6
3.6
3.8
3.8
3.9
3.8
3.8
3.8
3.9
4.0
Sec
ond
quin
tile
..
..
..
..
..
..
..
8.8
8.7
8.9
8.9
9.0
8.9
9.0
9.1
8.9
9.0
9.4
9.6
9.6
9.5
9.6
9.6
9.7
9.7
Thi
rdqu
intil
e.
..
..
..
..
..
..
..
.14
.814
.614
.814
.915
.015
.015
.115
.215
.015
.115
.815
.915
.915
.816
.016
.116
.216
.3F
ourt
hqu
intil
e.
..
..
..
..
..
..
..
23.3
23.0
23.0
23.2
23.2
23.2
23.3
23.3
23.4
23.5
24.2
24.2
24.0
24.0
24.3
24.3
24.5
24.6
Hig
hest
quin
tile
..
..
..
..
..
..
..
49.7
50.2
49.8
49.4
49.2
49.4
49.0
48.7
49.1
48.9
46.9
46.5
46.6
46.8
46.3
46.2
45.7
45.3
Su
mm
ary
Mea
sure
s
Gin
iind
exof
inco
me
ineq
ualit
y.
..
0.46
20.
466
0.46
20.
458
0.45
60.
459
0.45
50.
450
0.45
60.
454
0.43
40.
428
0.42
80.
431
0.42
70.
426
0.42
50.
419
Mea
nlo
garit
hmic
devi
atio
nof
inco
me
..
..
..
..
..
..
..
..
..
.0.
514
0.51
50.
490
0.47
60.
488
0.48
40.
464
0.45
20.
471
0.46
70.
416
0.41
10.
402
0.40
60.
401
0.41
40.
416
0.40
3T
heil
..
..
..
..
..
..
..
..
..
..
.0.
398
0.41
40.
404
0.38
60.
389
0.39
60.
389
0.37
80.
387
0.38
50.
323
0.31
30.
317
0.32
40.
314
0.31
10.
310
0.30
0A
tkin
son:
e=0.
25.
..
..
..
..
..
..
..
..
.0.
095
0.09
80.
096
0.09
20.
093
0.09
40.
093
0.09
00.
092
0.09
20.
080
0.07
80.
078
0.08
00.
078
0.07
70.
077
0.07
5e=
0.50
..
..
..
..
..
..
..
..
..
0.18
60.
189
0.18
50.
180
0.18
10.
183
0.17
90.
175
0.18
00.
178
0.16
00.
156
0.15
60.
158
0.15
50.
155
0.15
50.
151
e=0.
75.
..
..
..
..
..
..
..
..
.0.
279
0.28
20.
275
0.26
80.
271
0.27
20.
266
0.26
10.
268
0.26
60.
242
0.23
70.
236
0.23
90.
236
0.23
80.
237
0.23
1
See
foot
note
sat
end
ofta
ble.
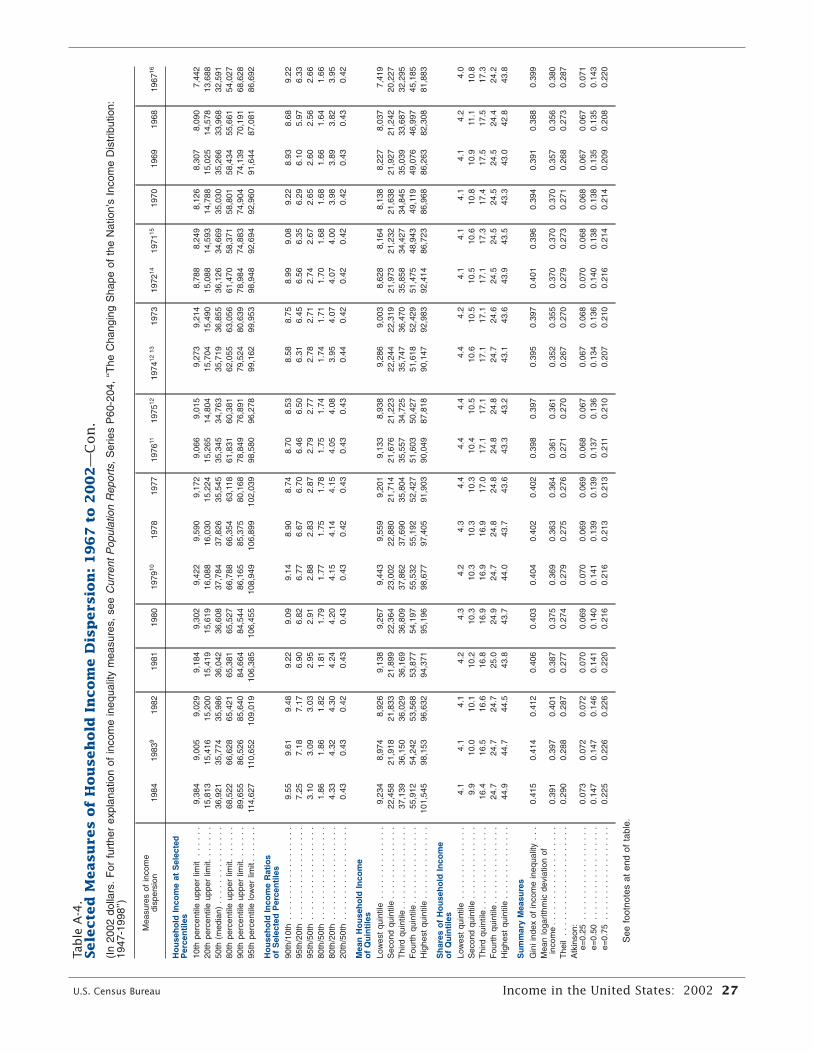
U.S. Census Bureau Income in the United States: 2002 27
Table
A-4
.Sele
cte
dM
easu
res
of
Hou
seh
old
Incom
eD
isp
ers
ion
:1
96
7to
20
02
—C
on
.(I
n20
02do
llars
.F
orfu
rthe
rex
plan
atio
nof
inco
me
ineq
ualit
ym
easu
res,
see
Cur
rent
Pop
ulat
ion
Rep
orts
,S
erie
sP
60-2
04,
‘‘The
Cha
ngin
gS
hape
ofth
eN
atio
n’s
Inco
me
Dis
trib
utio
n:19
47-1
998’
’)
Mea
sure
sof
inco
me
disp
ersi
on19
8419
839
1982
1981
1980
1979
1019
7819
7719
7611
1975
1219
7412
1319
7319
7214
1971
1519
7019
6919
6819
6716
Ho
use
ho
ldIn
com
eat
Sel
ecte
dP
erce
nti
les
10th
perc
entil
eup
per
limit
..
..
..
9,38
49,
005
9,02
99,
184
9,30
29,
422
9,59
09,
172
9,06
69,
015
9,27
39,
214
8,78
88,
249
8,12
68,
307
8,09
07,
442
20th
perc
entil
eup
per
limit.
..
..
..
15,8
1315
,416
15,2
0015
,419
15,6
1916
,088
16,0
3015
,224
15,2
6514
,804
15,7
0415
,490
15,0
8814
,593
14,7
8815
,025
14,5
7813
,688
50th
(med
ian)
..
..
..
..
..
..
..
.36
,921
35,7
7435
,986
36,0
4236
,608
37,7
8437
,826
35,5
4535
,345
34,7
6335
,719
36,8
5536
,126
34,6
6935
,030
35,2
6633
,968
32,5
9180
thpe
rcen
tile
uppe
rlim
it..
..
..
.68
,522
66,6
2865
,421
65,3
8165
,527
66,7
8866
,354
63,1
1861
,831
60,3
8162
,055
63,0
5661
,470
58,3
7158
,801
58,4
3455
,661
54,0
2790
thpe
rcen
tile
uppe
rlim
it..
..
..
.89
,655
86,5
2685
,640
84,6
6484
,544
86,1
6585
,375
80,1
6878
,849
76,8
9179
,524
80,6
3978
,984
74,8
8374
,904
74,1
3970
,191
68,6
2895
thpe
rcen
tile
low
erlim
it.
..
..
..
114,
627
110,
652
109,
019
106,
385
106,
455
108,
949
106,
899
102,
039
98,5
8096
,278
99,1
6299
,953
98,9
4892
,694
92,9
6091
,644
87,0
8186
,692
Ho
use
ho
ldIn
com
eR
atio
so
fS
elec
ted
Per
cen
tile
s90
th/1
0th
..
..
..
..
..
..
..
..
..
9.55
9.61
9.48
9.22
9.09
9.14
8.90
8.74
8.70
8.53
8.58
8.75
8.99
9.08
9.22
8.93
8.68
9.22
95th
/20t
h.
..
..
..
..
..
..
..
..
.7.
257.
187.
176.
906.
826.
776.
676.
706.
466.
506.
316.
456.
566.
356.
296.
105.
976.
3395
th/5
0th
..
..
..
..
..
..
..
..
..
3.10
3.09
3.03
2.95
2.91
2.88
2.83
2.87
2.79
2.77
2.78
2.71
2.74
2.67
2.65
2.60
2.56
2.66
80th
/50t
h.
..
..
..
..
..
..
..
..
.1.
861.
861.
821.
811.
791.
771.
751.
781.
751.
741.
741.
711.
701.
681.
681.
661.
641.
6680
th/2
0th
..
..
..
..
..
..
..
..
..
4.33
4.32
4.30
4.24
4.20
4.15
4.14
4.15
4.05
4.08
3.95
4.07
4.07
4.00
3.98
3.89
3.82
3.95
20th
/50t
h.
..
..
..
..
..
..
..
..
.0.
430.
430.
420.
430.
430.
430.
420.
430.
430.
430.
440.
420.
420.
420.
420.
430.
430.
42
Mea
nH
ou
seh
old
Inco
me
of
Qu
inti
les
Low
est
quin
tile
..
..
..
..
..
..
..
9,23
48,
974
8,92
69,
138
9,26
79,
443
9,55
99,
201
9,13
38,
938
9,28
69,
003
8,62
88,
164
8,13
88,
227
8,03
77,
419
Sec
ond
quin
tile
..
..
..
..
..
..
..
22,4
5821
,918
21,8
3321
,899
22,3
6423
,002
22,8
8021
,714
21,6
7621
,223
22,2
4422
,319
21,9
7321
,232
21,6
3821
,927
21,2
4220
,227
Thi
rdqu
intil
e.
..
..
..
..
..
..
..
.37
,139
36,1
5036
,029
36,1
6936
,809
37,8
6237
,690
35,8
0435
,557
34,7
2535
,747
36,4
7035
,858
34,4
2734
,845
35,0
3933
,687
32,2
95F
ourt
hqu
intil
e.
..
..
..
..
..
..
..
55,9
1254
,242
53,5
6853
,877
54,1
9755
,532
55,1
9252
,427
51,6
0350
,427
51,6
1852
,429
51,4
7548
,943
49,1
1949
,076
46,9
9745
,185
Hig
hest
quin
tile
..
..
..
..
..
..
..
101,
545
98,1
5396
,632
94,3
7195
,196
98,6
7797
,405
91,9
0390
,049
87,8
1890
,147
92,9
8392
,414
86,7
2386
,968
86,2
6382
,308
81,8
83
Sh
ares
of
Ho
use
ho
ldIn
com
eo
fQ
uin
tile
sLo
wes
tqu
intil
e.
..
..
..
..
..
..
.4.
14.
14.
14.
24.
34.
24.
34.
44.
44.
44.
44.
24.
14.
14.
14.
14.
24.
0S
econ
dqu
intil
e.
..
..
..
..
..
..
.9.
910
.010
.110
.210
.310
.310
.310
.310
.410
.510
.610
.510
.510
.610
.810
.911
.110
.8T
hird
quin
tile
..
..
..
..
..
..
..
..
16.4
16.5
16.6
16.8
16.9
16.9
16.9
17.0
17.1
17.1
17.1
17.1
17.1
17.3
17.4
17.5
17.5
17.3
Fou
rth
quin
tile
..
..
..
..
..
..
..
.24
.724
.724
.725
.024
.924
.724
.824
.824
.824
.824
.724
.624
.524
.524
.524
.524
.424
.2H
ighe
stqu
intil
e.
..
..
..
..
..
..
.44
.944
.744
.543
.843
.744
.043
.743
.643
.343
.243
.143
.643
.943
.543
.343
.042
.843
.8
Su
mm
ary
Mea
sure
sG
inii
ndex
ofin
com
ein
equa
lity
..
.0.
415
0.41
40.
412
0.40
60.
403
0.40
40.
402
0.40
20.
398
0.39
70.
395
0.39
70.
401
0.39
60.
394
0.39
10.
388
0.39
9M
ean
loga
rithm
icde
viat
ion
ofin
com
e.
..
..
..
..
..
..
..
..
..
0.39
10.
397
0.40
10.
387
0.37
50.
369
0.36
30.
364
0.36
10.
361
0.35
20.
355
0.37
00.
370
0.37
00.
357
0.35
60.
380
The
il.
..
..
..
..
..
..
..
..
..
..
0.29
00.
288
0.28
70.
277
0.27
40.
279
0.27
50.
276
0.27
10.
270
0.26
70.
270
0.27
90.
273
0.27
10.
268
0.27
30.
287
Atk
inso
n:e=
0.25
..
..
..
..
..
..
..
..
..
0.07
30.
072
0.07
20.
070
0.06
90.
070
0.06
90.
069
0.06
80.
067
0.06
70.
068
0.07
00.
068
0.06
80.
067
0.06
70.
071
e=0.
50.
..
..
..
..
..
..
..
..
.0.
147
0.14
70.
146
0.14
10.
140
0.14
10.
139
0.13
90.
137
0.13
60.
134
0.13
60.
140
0.13
80.
138
0.13
50.
135
0.14
3e=
0.75
..
..
..
..
..
..
..
..
..
0.22
50.
226
0.22
60.
220
0.21
60.
216
0.21
30.
213
0.21
10.
210
0.20
70.
210
0.21
60.
214
0.21
40.
209
0.20
80.
220
See
foot
note
sat
end
ofta
ble.

28 Income in the United States: 2002 U.S. Census Bureau
Table
A-4
.Sele
cte
dM
easu
res
of
Hou
seh
old
Incom
eD
isp
ers
ion
:1
96
7to
20
02
—C
on
.1Im
plem
enta
tion
ofa
28,0
00ho
useh
old
sam
ple
expa
nsio
n.2Im
plem
enta
tion
ofC
ensu
s20
00-b
ased
popu
latio
nco
ntro
ls.
3F
ulli
mpl
emen
tatio
nof
1990
cens
us-b
ased
sam
ple
desi
gnan
dm
etro
polit
ande
finiti
ons,
7,00
0ho
useh
old
sam
ple
redu
ctio
n,an
dre
vise
dra
ceed
its.
4In
trod
uctio
nof
1990
cens
us-b
ased
sam
ple
desi
gn.
5D
ata
colle
ctio
nm
etho
dch
ange
dfr
ompa
per
and
penc
ilto
com
pute
r-as
sist
edin
terv
iew
ing.
Inad
ditio
n,th
eM
arch
1994
inco
me
supp
lem
ent
was
revi
sed
toal
low
for
the
codi
ngof
diffe
rent
inco
me
amou
nts
onse
lect
edqu
estio
nnai
reite
ms.
Lim
itsei
ther
incr
ease
dor
decr
ease
din
the
follo
win
gca
tego
ries:
earn
ings
limits
incr
ease
dto
$999
,999
;so
cial
secu
rity
limits
incr
ease
dto
$49,
999;
supp
lem
enta
lsec
urity
inco
me
and
publ
icas
sist
ance
limits
incr
ease
dto
$24,
999;
vete
rans
’ben
efits
limits
incr
ease
dto
$99,
999;
child
supp
ort
and
alim
ony
limits
decr
ease
dto
$49,
999.
6Im
plem
enta
tion
of19
90ce
nsus
popu
latio
nco
ntro
ls.
7Im
plem
enta
tion
ofa
new
Mar
chC
PS
proc
essi
ngsy
stem
.8R
ecor
ding
ofam
ount
sfo
rea
rnin
gsfr
omlo
nges
tjo
bin
crea
sed
to$2
99,9
99.
Ful
lim
plem
enta
tion
of19
80ce
nsus
-bas
edsa
mpl
ede
sign
.9Im
plem
enta
tion
ofH
ispa
nic
popu
latio
nw
eigh
ting
cont
rols
and
intr
oduc
tion
of19
80ce
nsus
-bas
edsa
mpl
ede
sign
.1
0Im
plem
enta
tion
of19
80ce
nsus
popu
latio
nco
ntro
ls.
Que
stio
nnai
reex
pand
edto
show
27po
ssib
leva
lues
from
51po
ssib
leso
urce
sof
inco
me.
11F
irst
year
med
ians
wer
ede
rived
usin
gbo
thP
aret
oan
dlin
ear
inte
rpol
atio
n.B
efor
eth
isye
aral
lmed
ians
wer
ede
rived
usin
glin
ear
inte
rpol
atio
n.1
2S
ome
ofth
ese
estim
ates
wer
ede
rived
usin
gP
aret
oin
terp
olat
ion
and
may
diffe
rfr
ompu
blis
hed
data
whi
chw
ere
deriv
edus
ing
linea
rin
terp
olat
ion.
13Im
plem
enta
tion
ofa
new
Mar
chC
PS
proc
essi
ngsy
stem
.Q
uest
ionn
aire
expa
nded
toas
k11
inco
me
ques
tions
.1
4F
ulli
mpl
emen
tatio
nof
1970
cens
us-b
ased
sam
ple
desi
gn.
15In
trod
uctio
nof
1970
cens
us-b
ased
sam
ple
desi
gnan
dpo
pula
tion
cont
rols
.1
6Im
plem
enta
tion
ofa
new
Mar
chC
PS
proc
essi
ngsy
stem
.
Sou
rce:
U.S
.C
ensu
sB
urea
u,C
urre
ntP
opul
atio
nS
urve
y,19
68to
2003
Ann
ualS
ocia
land
Eco
nom
icS
uppl
emen
ts.

U S C E N S U S B U R E A UHelping You Make Informed Decisions
Issued September 2003
P60-221
Income in the United States: 2002
Demographic Programs
ByCarmen DeNavas-WaltRobert W. ClevelandBruce H. Webster, Jr.
A
U.S.Department of CommerceEconomics and Statistics Administration
U.S. CENSUS BUREAU
Current Population Reports
Consumer Income
P60
-22
1U
S C E N
S U S B
U R
E A U
Inco
me in
the U
nited
States: 20
02 C
urre
nt P
op
ula
tion
Rep
orts C
onsu
mer In
come
U.S. Department of CommerceEconomics and Statistics AdministrationU.S. CENSUS BUREAUWashington, DC 20233
OFFICIAL BUSINESS
Penalty for Private Use $300
FIRST-CLASS MAILPOSTAGE & FEES PAIDU.S. Census Bureau
Permit No. G-58