INCLUSIVE GREEN GROWTH INDEX - adb.org · The Inclusive Green Growth Index (IGGI), the new metric...
66
INCLUSIVE GREEN GROWTH INDEX A NEW BENCHMARK FOR QUALITY OF GROWTH OCTOBER 2018 ASIAN DEVELOPMENT BANK
Transcript of INCLUSIVE GREEN GROWTH INDEX - adb.org · The Inclusive Green Growth Index (IGGI), the new metric...

INCLUSIVE GREEN GROWTH INDEXA NEW BENCHMARK FOR QUALITY OF GROWTH
OCTOBER 2018
ASIAN DEVELOPMENT BANK

ASIAN DEVELOPMENT BANK
INCLUSIVE GREEN GROWTH INDEXA NEW BENCHMARK FOR QUALITY OF GROWTHShikha Jha, Sonia Chand Sandhu, and Radtasiri Wachirapunyanont
OCTOBER 2018

Creative Commons Attribution 3.0 IGO license (CC BY 3.0 IGO)
© 2018 Asian Development Bank6 ADB Avenue, Mandaluyong City, 1550 Metro Manila, PhilippinesTel +63 2 632 4444; Fax +63 2 636 2444www.adb.org
Some rights reserved. Published in 2018.
ISBN 978-92-9261-330-3 (print), 978-92-9261-331-0 (electronic)Publication Stock No. TCS189570-2DOI: http://dx.doi.org/10.22617/TCS189570-2
The views expressed in this publication are those of the authors and do not necessarily reflect the views and policies of the Asian Development Bank (ADB) or its Board of Governors or the governments they represent.
ADB does not guarantee the accuracy of the data included in this publication and accepts no responsibility for any consequence of their use. The mention of specific companies or products of manufacturers does not imply that they are endorsed or recommended by ADB in preference to others of a similar nature that are not mentioned.
By making any designation of or reference to a particular territory or geographic area, or by using the term “country” in this document, ADB does not intend to make any judgments as to the legal or other status of any territory or area.
This work is available under the Creative Commons Attribution 3.0 IGO license (CC BY 3.0 IGO) https://creativecommons.org/licenses/by/3.0/igo/. By using the content of this publication, you agree to be bound by the terms of this license. For attribution, translations, adaptations, and permissions, please read the provisions and terms of use at https://www.adb.org/terms-use#openaccess.
This CC license does not apply to non-ADB copyright materials in this publication. If the material is attributed to another source, please contact the copyright owner or publisher of that source for permission to reproduce it. ADB cannot be held liable for any claims that arise as a result of your use of the material.
Please contact [email protected] if you have questions or comments with respect to content, or if you wish to obtain copyright permission for your intended use that does not fall within these terms, or for permission to use the ADB logo.
Notes:In this publication, $ refers to United States dollars.ADB recognizes “China” as the People’s Republic of China.Corrigenda to ADB publications may be found at http://www.adb.org/publications/corrigenda.

iii
Contents
Tables, Figures, and Boxes v
Foreword vii
Preface viii
Acknowledgments ix
Abbreviations x
Highlights xiA New Index of the Quality of Growth xiApplying the Inclusive Green Growth Index xiRaising the Quality of Growth xiiPutting the Inclusive Green Growth Index into Practice xii
Introduction 1
A New Index of the Quality of Growth 2The Design of the Inclusive Green Growth Index 2
Supporting Economic Growth 5Ensuring Social Equity 5Conserving the Environment 7
Construction of the Inclusive Green Growth Index 8Balancing the Three Pillars 9
Applying the Inclusive Green Growth Index 10How the Index Relates to Other Measures 10Performance by Developing Asia Regions 13
Central Asia 15East Asia 15South Asia 16Southeast Asia 16The Pacific 17

Inclusive Green Growth Indexiv
Raising the Quality of Growth 20Following an Integrated Approach 21
Collaboration among Stakeholders 21Sector-Wide Nexus 23
Reducing Institutional Risk 24Good Governance and Quality of Growth 25Illustrating the Relationship 27Country Examples: People’s Republic of China, India, and Indonesia 29
Strengthening the Foundations of Inclusive and Sustainable Growth 31
Putting the Inclusive Green Growth Index into Practice 36Leveraging Finance for Inclusive Green Growth 36Setting Country Priorities 38Fostering Inclusive Green Growth 39
Conclusion 41
Appendixes1 Pros and Cons of Composite Indices 422 Description of Indicators and Data Sources 433 Economies Used in the Inclusive Green Growth Index for Developing Asia 454 Construction of the Inclusive Green Growth Index 46
References 48
Contents

v
Tables, Figures, and Boxes
Tables1 Comparison of the Inclusive Green Growth Index with Other Measures 112 Developing Asia Scores in the Three Pillars of the Inclusive Green Growth Indices, 2015 183 Inclusive Green Growth Index—Performance in the People’s Republic of China, 29
and Indonesia in 2005, 2010, and 2015
Figures1 Pillars and Indicators of the Inclusive Green Growth Index 42 Inclusive and Balanced Green Growth Indices versus Gross Domestic Product 12
per Capita, 2015 3 Inclusive Green Growth Index and Happiness Index Scores versus Gross Domestic Product 13
per Capita, 20154 Developing Asia’s Performance in the Inclusive Green Growth Index 14
with Balanced Pillars, 2015 5 Regional Performance of the Inclusive Green Growth Index, 2015 146 Mapping Sustainable Development Targets to Inclusive Green Growth Indicators 207 The Livable Cities Framework 228 The Water–Energy–Food Nexus 249 Institutional Risk by Country, 2015 2610 Good Governance and the Inclusive Green Growth Index, 2015 2711 Institutional Risk Inclusive Green Growth Index Pyramid for Asia Regions, 28
2005 and 2015 12 Inclusive Green Growth Index and Infrastructure Quality Relationship, 2015 3113 Inclusive Green Growth Index and Logistics Performance Index Relationship 3214 Inclusive Green Growth Index and Information and Communication Technology
Access Relationship, 2015 3315 Inclusive Green Growth Index and Financial Market Development Relationship, 2015 3416 Inclusive Green Growth Index and Civil Liberties, Safety, and Security Relationship, 2015 3517 Inclusive Green Growth Index Pillars in 24 Asian Countries, 2015 3818 Striving for Inclusive Green Growth: A Tree Analogy 39

Tables, Figures, and Boxesvi
Boxes
1 Alternative Methods for Measuring Multidimensional Concepts 32 India’s Big Plans on Social Security 63 The Blue Skies Initiative in the People’s Republic of China 74 The Choice of Weights in Constructing a Composite Index 85 Integrated Approaches to Mongolia’s Air Pollution Problems 236 Governance and Institutions—Enablers of the Inclusive Green Growth Index 257 Boosting Indonesia’s Geothermal Power Potential 37
vii
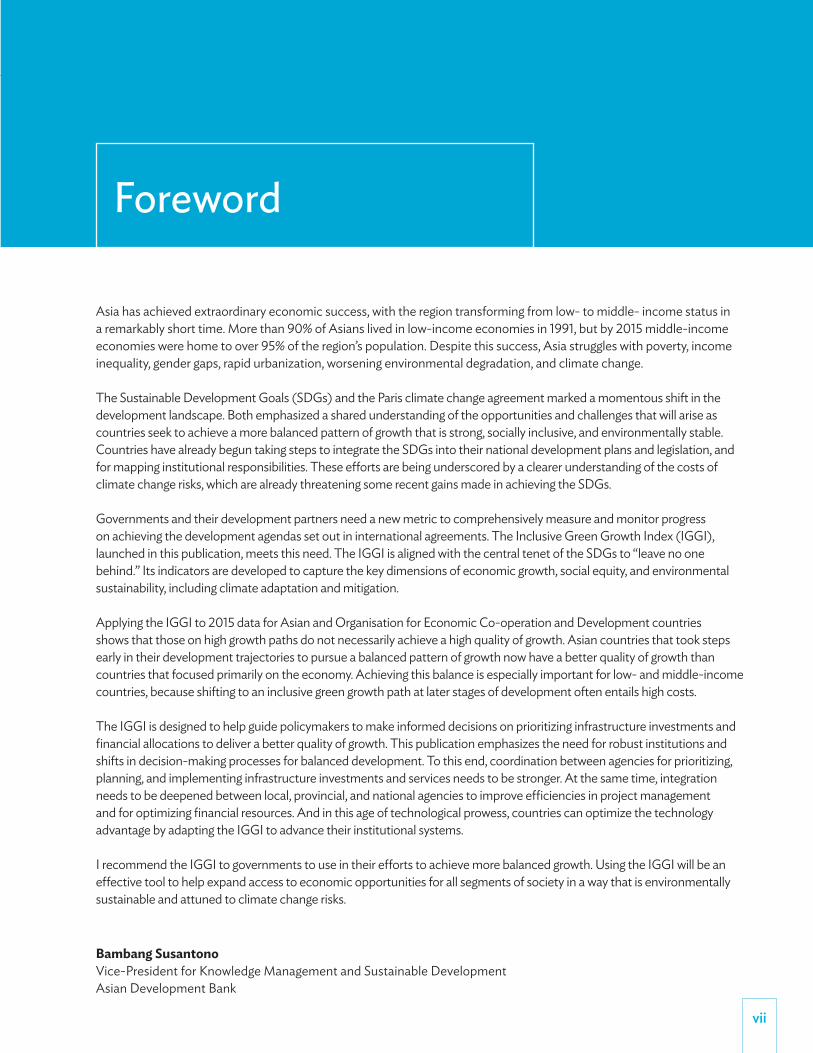
Asia has achieved extraordinary economic success, with the region transforming from low- to middle- income status in a remarkably short time. More than 90% of Asians lived in low-income economies in 1991, but by 2015 middle-income economies were home to over 95% of the region’s population. Despite this success, Asia struggles with poverty, income inequality, gender gaps, rapid urbanization, worsening environmental degradation, and climate change.
The Sustainable Development Goals (SDGs) and the Paris climate change agreement marked a momentous shift in the development landscape. Both emphasized a shared understanding of the opportunities and challenges that will arise as countries seek to achieve a more balanced pattern of growth that is strong, socially inclusive, and environmentally stable. Countries have already begun taking steps to integrate the SDGs into their national development plans and legislation, and for mapping institutional responsibilities. These efforts are being underscored by a clearer understanding of the costs of climate change risks, which are already threatening some recent gains made in achieving the SDGs.
Governments and their development partners need a new metric to comprehensively measure and monitor progress on achieving the development agendas set out in international agreements. The Inclusive Green Growth Index (IGGI), launched in this publication, meets this need. The IGGI is aligned with the central tenet of the SDGs to “leave no one behind.” Its indicators are developed to capture the key dimensions of economic growth, social equity, and environmental sustainability, including climate adaptation and mitigation.
Applying the IGGI to 2015 data for Asian and Organisation for Economic Co-operation and Development countries shows that those on high growth paths do not necessarily achieve a high quality of growth. Asian countries that took steps early in their development trajectories to pursue a balanced pattern of growth now have a better quality of growth than countries that focused primarily on the economy. Achieving this balance is especially important for low- and middle-income countries, because shifting to an inclusive green growth path at later stages of development often entails high costs.
The IGGI is designed to help guide policymakers to make informed decisions on prioritizing infrastructure investments and financial allocations to deliver a better quality of growth. This publication emphasizes the need for robust institutions and shifts in decision-making processes for balanced development. To this end, coordination between agencies for prioritizing, planning, and implementing infrastructure investments and services needs to be stronger. At the same time, integration needs to be deepened between local, provincial, and national agencies to improve efficiencies in project management and for optimizing financial resources. And in this age of technological prowess, countries can optimize the technology advantage by adapting the IGGI to advance their institutional systems.
I recommend the IGGI to governments to use in their efforts to achieve more balanced growth. Using the IGGI will be an effective tool to help expand access to economic opportunities for all segments of society in a way that is environmentally sustainable and attuned to climate change risks.
Bambang Susantono Vice-President for Knowledge Management and Sustainable DevelopmentAsian Development Bank
Foreword

viii
Preface
While development is a societal goal, economic growth is a means to achieving it. For growth to reflect development, it must be socially equitable and environmentally sustainable. Well-designed polices to promote social equity and improve the management of the environment can potentially spur long-term growth by reducing poverty, expanding the middle class, creating jobs, and increasing resilience to shocks.
Many measures are used to monitor how countries are doing in achieving a more inclusive and environmentally sustainable pattern of growth, but most tend to focus on either one or the other of these development objectives. The Inclusive Green Growth Index (IGGI), the new metric for quality of growth launched in this study, overcomes the shortcomings of these measures, and presents a more detailed and rounded picture of economic development.
The IGGI highlights the synergies between its three pillars of economic growth, social equity, environmental sustainability. Compared with other measures, these pillars cover a more comprehensive set of performance indicators—28 in all. These indicators cover various facets of growth, policy outcomes in areas where higher investment would yield better quality of growth, and the availability of data over time and across countries. The IGGI therefore provides a powerful tool for assessing a country’s progress in achieving development goals rather than gross domestic product growth. Good policy and institutional settings, and favorable socioeconomic conditions, such as high-quality infrastructure, better access to finance, and greater safety and security, should foster a strong IGGI performance.
The IGGI is designed as an easy-to-use guide for policymakers and stakeholders for evidence-based policy and practice. It provides a common basis for assessing the gains and gaps in development progress and identifying their exact sources. Most developing countries in Asia score below average on the IGGI compared with other countries with similar levels of income. Within the region, South Asia, Southeast Asia, and the Pacific have more balanced growth across the three pillars than Central Asia and East Asia.
This publication was written by Shikha Jha, principal economist at the Asian Development Bank’s Economic Research and Regional Cooperation Department; Sonia Chand Sandhu, environment engineer and senior advisor to the Asian Development Bank’s Vice-President for Knowledge Management and Sustainable Development; and Radtasiri Wachirapunyanont, graduate student in public policy at the Lee Kuan Yew School of Public Policy, National University of Singapore, who was an intern at the Economic Research and Regional Cooperation Department at the time of writing this study.
Yasuyuki SawadaChief Economist and Director GeneralAsian Development Bank

ix
The authors are grateful to Yasuyuki Sawada, chief economist and director general of the Asian Development Bank’s (ADB) Economic Research and Regional Cooperation Department (ECRD) for overall guidance; Juzhong Zhuang, ERCD senior economic advisor; and Joseph Ernest Zveglich Jr., ERCD deputy chief economist, for their insights and support. Emmanuel Alano, Rosa Mia Arao, Pilipinas Quising, and Michael Timbang provided technical support. The authors acknowledge inputs by Maria Pia Ancona, climate change specialist at ADB’s East Asia Department; David Dovan, investment specialist at the Private Sector Operations Department; Timothy Meany, principal infrastructure finance specialist at the Sustainable Development and Climate Change Department; and Ramola Naik Singru, senior urban development specialist at the Central and West Asia Department.
Elenita Pura and Heili Ann Bravo provided logistics support. Alastair McIndoe edited the publication. Layout and graphic design were by Edith Creus, and artwork for the cover by Cynthia Castillejos-Petalcorin. The study would not have been possible without the generous assistance of the Knowledge Support Division of ADB’s Department of Communications and the Printing Services Unit of the Office of Administrative Services.
Shikha Jha Principal EconomistEconomic Research and Regional Cooperation DepartmentAsian Development Bank
Sonia Chand SandhuSenior AdvisorOffice of the Vice-President Knowledge Managementand Sustainable DevelopmentAsian Development Bank
Acknowledgments
x
Abbreviations
ADB – Asian Development Bank
CPB – cross-pillar balance
GDP – gross domestic product
IGGI – Inclusive Green Growth Index
MW – megawatt
PRC – People’s Republic of China
SDG – Sustainable Development Goal

xi
A New Index of the Quality of GrowthOverwhelming support for the Sustainable Development Goals (SDGs) and the Paris Agreement on climate change underscored the new development agenda for growth that is inclusive and green. This agenda shifts the focus of growth from a higher rate—or quantity—of growth to higher quality growth that incorporates inclusiveness and environmental sustainability.
This study launches the Inclusive Green Growth Index (IGGI)—a new and better measure of the quality of growth. In line with the new global development agenda, the IGGI’s three pillars—economic growth, social equity, and environmental sustainability—cover a more comprehensive set of indicators than previous measures, which lean toward either social equity or environmental sustainability. Widely sharing higher incomes will reduce disparities among people. And conserving precious natural resources and savings from incomes will reduce disparities between current and future generations.
A balanced performance in the IGGI pillars can help align national development goals with global development goals. A country with a high IGGI score does not necessarily perform equally well on all three pillars. A strong performance in one pillar can lead to a high average score even though the performance of the other pillars is weak. Maintaining a balance across the pillars should result in better policy choices to support a country’s commitment to inclusive green growth.
Applying the Inclusive Green Growth IndexThe IGGI gives an objective and comprehensive picture of a country’s well-being. Other indices also measure well-being, but these are often based on subjective perceptions of this state, like the World Happiness Index, whereas the IGGI captures this state across far wider dimensions.
Much of developing Asia displays a high quantity–low quality pattern of growth. An analysis of 2015 data for Asian and Organisation for Economic Co-operation and Development countries shows that fast-growing countries tend to neither share incomes widely nor maintain the environment well, and this relation holds especially at low-income levels.
Environmental sustainability is the region’s main area for improvement. Countries in South Asia, Southeast Asia, and the Pacific show a more balanced performance across the IGGI pillars than those in Central Asia and East Asia. The analysis in this study shows that nine out of a sample of 24 Asian countries in 2015 focused more on economic growth, whereas environmental sustainability remains the most neglected pillar in 22 countries.
Highlights

Highlightsxii
Raising the Quality of GrowthThe IGGI can track country performances on many SDGs. Most countries have calibrated their development priorities to SDG targets. But the indicators that the United Nations say will be needed to gauge regional, national, and subnational progress may only be ready by 2025. The IGGI can be used to track country performances on many SDGs at the national level. All its indicators are taken from publicly available data, which makes monitoring SDGs relatively easy and transparent.
Improving the quality of growth calls for integrated approaches. Traditional sector-based tools are no longer suitable for capturing the nexus that transcends individual sectors and national borders. For example, climate change and rising disaster risks, rapid urbanization, and widening inequalities are closely interlinked. To improve the quality of growth, the IGGI’s pillars and indicators are best used in coordination with all relevant levels of central and local government, the private sector, and civil society.
Good institutions are associated with higher quality growth. A lack of effective and fair institutions exposes countries to institutional risks, such as corruption, inefficiency, and weak enforcement of the rule of law, which lower IGGI scores. Strong institutions promote sound economic policies which can encourage investments in the IGGI’s pillars.
Strong foundations in quality infrastructure, finance, technology, and civil liberties will support the new global development agenda. These are the most important foundations for better quality growth. They ease the movement of labor and capital across economic sectors and geographic regions, thereby promoting inclusive green growth.
Putting the Inclusive Green Growth Index into PracticeTo fulfill their objectives, governments will need to leverage more private sector and external finance. To meet all SDG targets over 2015–2030, the annual additional financing beyond public expenditure levels observed in 2013 is estimated to be 27% of the gross domestic product of low-income countries and 7% of lower-middle-income countries. However, the depleted fiscal positions of many Asian countries have not recovered to levels before the global financial crisis. Leveraging finance from other sources will therefore be critical for achieving inclusive green growth.
Countries must set development priorities and align investment decisions with them. The IGGI has a role to play in identifying leading and lagging areas of development to set country priorities. Prioritizing areas to induce prosperity and reduce disparities for current and future generations will be vital for quality growth.

1
Introduction
The 2015 global agreements on Sustainable Development Goals (SDGs) and climate change marked a turning point as the international discourse on development priorities shifted from a higher rate or quantity to the quality of economic growth. Governments across developing Asia are now striving for a pattern of growth that is strong, widely shared, and environmentally sustainable—and these objectives are now part of the national plans of many countries in the region.1
Central to achieving these objectives will be how the quality of growth is measured and defined, and the parameters that best characterize quality growth. Many studies have added the dimensions of social equity and environmental sustainability to economic growth to gauge its quality. But these miss important aspects of achieving this desired but elusive pattern of growth. This publication presents a new measure of the quality of growth—the Inclusive Green Growth Index (IGGI)—which covers a wider set of indicators than other measures by incorporating the three pillars of economic growth, social equity, and environmental sustainability. In doing this, the IGGI reflects emerging national development priorities and global commitments. This study also underscores the importance of institutional quality to foster the inclusive green growth agenda.
A cross-country comparison of the IGGI using data for 2015 shows that most countries in developing Asia fail to include all citizens in the growth process, and that achieving environmental sustainability is still far over the horizon. Most populations in the region are exposed to air pollution, water resources are far from abundant, the degeneration of productive land is increasing, and the use of renewable energy is still low. The IGGI’s high level of country coverage, its simplicity and transparency, and the ease with which it can be brought up to date make it a useful policy tool. The index can, for example, help government planners and economic managers identify development gaps and prioritize resources for lagging areas and sector investments. Although the geographic focus of this study is developing Asia, as befits an Asian Development Bank (ADB) study, the IGGI can be applied in all country and regional settings, and for all levels of development. For multilateral development banks, which are moving their business models beyond finance to knowledge solutions to development problems, the IGGI can be used to track the progress of countries in achieving inclusive and environmentally sustainable growth. The IGGI should prove to be an effective tool for measuring the quality of growth by policymakers, academia, and think tanks.
1 Developing Asia, a term used in ADB’s Asian Development Outlook and in this study, refers to ADB’s 45 developing member countries in Asia and the Pacific.

2
The Global Commission on the Economy and Climate (2014) noted the pursuit of “inclusive, high-quality, and resilient” growth has become a top development agenda. The commission defines “better growth” as growth that increases incomes, reduces poverty, improves health, makes cities more livable, fosters resilience, encourages faster innovation, and improves the climate by reducing greenhouse gas emissions. The 2018 Report of the Commission sums it up as a new era where growth is strong, sustainable, balanced and inclusive.
Decision makers need an easy-to-use measure to evaluate country performance in improving the quality of growth. Various international organizations have attempted to measure the inclusiveness and environmental sustainability of economic progress. These measures have their pros and cons, but they all either overlook some pillar of growth or have fewer comprehensive indicators in each pillar. For example, the environmental pillar is overlooked in both the ADB’s Framework for Inclusive Growth Indicators (ADB 2011) and the International Monetary Fund’s Quality of Growth Index (Mlachila, Tapsoba and Tapsoba 2014), as these only have a socioeconomic focus. The Green Growth Index, developed by the United Nations Economic and Social Commission for Asia and the Pacific and the Organisation for Economic Co-operation and Development, focuses on environmental sustainability and its relationship with economic growth. The World Economic Forum’s Inclusive Development Index seems to be the first index to cover all three pillars (WEF 2017). But its environmental pillar includes mainly the carbon intensity of gross domestic product (GDP), and it omits other important environmental dimensions, such as energy intensity and water use.
Although the United Nations adopted a set of global indicators to gauge progress on the SDGs, its Statistical Commission says more indicators need to be developed, and some existing ones need to be refined (UN 2017). The commission emphasizes that “global indicators are not necessarily applicable to all national contexts.” It says that alternative or complementary indicators for regional, national, and subnational levels of monitoring will be developed based on national priorities, realities, and capacities. But this may take years to complete since the commission has proposed “annual refinements” to the indicators and two comprehensive reviews of the global indicators in 2020 and 2025. The IGGI, which captures most SDGs, can fill the void. The IGGI has three pillars: economic growth (sustaining strong growth and openness); social equity (supporting human capital development, social inclusion, and reducing inequality); and environmental sustainability (limiting environmental degradation and the impacts of climate change).
The Design of the Inclusive Green Growth Index Different approaches with varying degrees of complexity have been used to assess a country’s development performance beyond income growth (Box 1). Constructing composite indices typically involves subjective judgments in the selection of indicators, treatment of missing values, choice of aggregation model, and the assignment of weights of indicators, among other factors. Appendix 1 summarizes the pros and cons of composite indices.
A New Index of the Quality of Growth

A New Index of the Quality of Growth 3
Box 1: Alternative Methods for Measuring Multidimensional Concepts
Complex multidimensional concepts, which are represented by many separate indicators, can be measured by three different methods: dashboards, frameworks, and composite indices.
A dashboard is a list of specific indicators to monitor individual components. A framework is a diagrammatic scheme for combining various indicators. A composite index is a single number obtained by aggregating different dimensions with specified weights. These indices start by converting their dissimilar indicator measurements to a common unit. The unit is either a physical unit, money, or a performance score. These methods can be used to compare performances on inclusive and environmentally sustainable growth among countries, or to monitor a country’s progress over time.
Dashboards of individual indicators offer flexibility, though not for broad assessments. Because each indicator is measured and examined individually, one indicator cannot be assumed to be a substitute for another. The downside of dashboards is the difficulty in discerning an overall trend from a plethora of indicators, which are difficult to compare across countries and do not provide clear guidance on what is required for environmentally sustainable growth (Stiglitz, Sen, and Fitoussi 2010). Frameworks also do not help much without a systematic guide on how to combine the indicators.
Rather than identifying common trends across many separate indicators, composite indices are a useful tool for benchmarking country performance, for policy analysis, and for public communication (Saltelli 2007; Nardo et al. 2008). While the main value of a composite index lies in its measurability, its construction involves subjective judgments in the selection of indicators, the treatment of missing values, the choice of the aggregation method, and the weights of the indicators, which are all open to debate.
Sources: J. E. Stiglitz, A. Sen, and J. P. Fitoussi. 2010. Report by the Commission on the Measurement of Economic Performance and Social Progress. Paris: Commission on the Measurement of Economic Performance and Social Progress; A. Saltelli. 2007. “Composite Indicators between Analysis and Advocacy.” Social Indicators Research 81 (1): 65–77; M. Nardo, M. Saisana, A. Saltelli, S. Tarantola, A. Hoffmann, and E. Giovannini. 2008. Handbook on Constructing Composite Indicators. Paris: Organisation for Economic Co-operation and Development.
The IGGI’s design combines the strengths of existing indices, frameworks, and dashboards into one composite index with a wider coverage of indicators. Various economic, social, and environmental indicators relevant for inclusive green growth were considered based on available country data. For the selection of indicators, this study applied the following accepted principles:
• Indicators that are related to various facets of growth; for example, openness and public debt.• Policy outcomes in areas where higher investment would yield better quality of growth in terms of
inclusive and green economies; for example, gender gaps in health and education, and environmentally friendly goods and services.
• Availability of data over time; indicators that lacked data for long periods were excluded.• Country coverage to ensure data quality (countries with over 25% missing values in any one of the pillars
were dropped).• Access to data—the indicators used in the IGGI are publicly available and do not require additional
quantitative analysis; this means the index is easy to use compared with measures that require research or complex data manipulation and use proprietary data, or are based on primary opinion surveys, which cannot be independently verified or frequently updated.
Inclusive Green Growth Index4
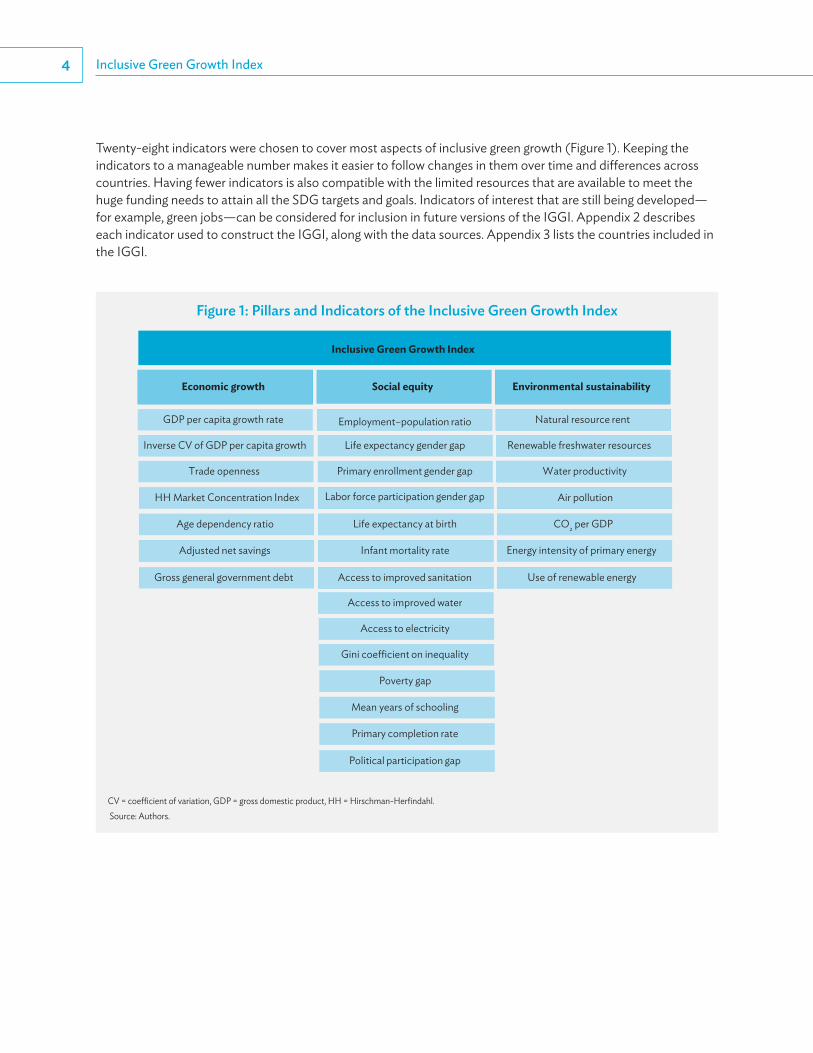
Twenty-eight indicators were chosen to cover most aspects of inclusive green growth (Figure 1). Keeping the indicators to a manageable number makes it easier to follow changes in them over time and differences across countries. Having fewer indicators is also compatible with the limited resources that are available to meet the huge funding needs to attain all the SDG targets and goals. Indicators of interest that are still being developed—for example, green jobs—can be considered for inclusion in future versions of the IGGI. Appendix 2 describes each indicator used to construct the IGGI, along with the data sources. Appendix 3 lists the countries included in the IGGI.
Figure 1: Pillars and Indicators of the Inclusive Green Growth Index
Economic growth Social equity Environmental sustainability
GDP per capita growth rate
Inverse CV of GDP per capita growth
Trade openness
HH Market Concentration Index
Age dependency ratio
Adjusted net savings
Gross general government debt
Employment–population ratio
Life expectancy gender gap
Primary enrollment gender gap
Labor force participation gender gap
Life expectancy at birth
Infant mortality rate
Access to improved sanitation
Natural resource rent
Renewable freshwater resources
Water productivity
Air pollution
CO2 per GDP
Energy intensity of primary energy
Use of renewable energy
Access to improved water
Access to electricity
Gini coe�cient on inequality
Poverty gap
Mean years of schooling
Primary completion rate
Political participation gap
Inclusive Green Growth Index
CV = coefficient of variation, GDP = gross domestic product, HH = Hirschman-Herfindahl. Source: Authors.

A New Index of the Quality of Growth 5
Supporting Economic GrowthIn the first pillar, seven indicators capture the strength, stability, diversity of sources, and sustainability of economic growth. Enhancing the growth of income per capita is fundamental to inclusive growth, as this provides the basis for creating and expanding economic opportunities.
Economic performance is measured by growth in GDP per capita and the inverse of the coefficient of variation of GDP per capita. The lower the inverse, the more volatile are the growth episodes. Higher income per capita is not a sufficient condition for higher quality growth, but it is needed to create jobs and support demand. Unstable economic growth deepens poverty and inequality because the poor are less likely to be insulated from bad times and have less capacity to recover from shocks. Thus, better quality growth translates into strong and stable growth. Given its impact on social welfare, the growth stability indicator closely interacts with the second pillar (social equity). This suggests that alternative policy instruments may need to be used to address some interconnected issues, such as the persistent poverty and inequality that overlap the three pillars.
Economic dependency on other countries includes trade openness, which measures a country’s vulnerability to external economic shocks. The more open the economy, the more vulnerable it is to external economic shocks (Barrot, Calderón, and Servén 2017). The Hirschman-Herfindahl Market Concentration Index measures the dispersion of trade value across an exporter’s trading partners. A more diverse basket of exports suggests diverse sources of growth. Diversification is therefore positively correlated with stable growth, which is vital for high quality growth (Hesse 2009). The age dependency ratio—the proportion of dependents younger than 15 years or older than 64 to the working-age population—is used as an indicator of economic sustainability by measuring the capacity of the productive population to support dependents. Two other indicators of economic sustainability are adjusted net savings and public debt. Adjusted net savings, from the World Bank’s World Development Indicators, measures the net stock of physical, financial, natural, and human capital available for future generations. Lower adjusted net savings or higher public debt means less sustainable economic development. Positive adjusted net savings suggest the value of social welfare is increasing, while negative adjusted net savings suggest that an economy is on an unsustainable path (World Bank 2007).
Ensuring Social EquityStrong, stable, and diversified growth does not necessarily involve the participation of a broad range of people that includes the poor and marginalized, such as women and ethnic minorities, or an equitable distribution of wealth or economic opportunities. By this measure, growth is successful only if it is inclusive in terms of employment, income, gender, health, education, and basic needs, as captured by the 14 indicators of the IGGI’s social equity pillar.
The gender labor force participation gap measures the absolute participation difference between men and women. A long and healthy life, access to education, and a decent standard of living are the basic building blocks of well-being. Life expectancy at birth and infant mortality rates are outcomes of the availability of and accessibility to quality health care services. Mean schooling years and the completion rate for primary education depend on the coverage of the education system and the access of the poor to basic education. The availability of safe drinking water and sanitation are a major concern in many parts of developing Asia. The indicator on the fulfillment of basic needs is influenced by access to electricity.
Equalizing opportunities promotes social justice and economic development. Box 2 takes a brief look at how India, as it moves to middle-income status, faces a growing need for universal social protection targeted to alleviate poverty and inequality and to promote inclusive economic growth.

Inclusive Green Growth Index6
Box 2: India’s Big Plans on Social Security
Public spending on social security programs in India has expanded since the 1990s to protect the poor against poverty, and contingencies and other shocks. Compared with many developing countries, a much higher proportion of India’s fiscal resources go into household subsidies on food, fuel, and electricity (World Bank 2015).
Although the government runs some 950 welfare programs that cost a combined 5% of gross domestic product, half of the cost is accounted for by the largest 11 of those programs (Government of India 2017). Many of these programs suffer from poor targeting, theft of entitlements, diversion of benefits, payment delays, elite capture by local authorities, and coverage gaps and overlaps, and require better coordination among implementing agencies.
The districts hosting the poorest 40% of the population receive only 29% of the total welfare spending on social programs (Government of India 2017). Formal pension programs do not cover enough people and are not sustainably financed. India faces persistent poverty, rising income inequality, large informal sector employment, growing old age dependency, economic shocks, environmental degradation, and climate change. Despite these problems, the country has taken leaps in digitization and automation, which can be used for leapfrogging solutions to these problems by effective management.
To tackle the huge gap in the social security coverage of workers in the unorganized sector and people living below the poverty line, the government has proposed a comprehensive social protection program. This will provide retirement, health, old age, disability, unemployment, and maternity benefits to 500 million workers, 40% of the population (Government of India 2018).
The program will be implemented in three phases. The first, costing $2.8 billion, will include the provision of health and retirement benefits, and will be followed by unemployment benefits in the second phase and other welfare measures in the third phase (Sharma 2018).
In another big plan for social security, the National Health Protection Scheme, arguably the world’s largest spending on public health, will provide government-sponsored annual health insurance of about $7,000 per family (National Portal of India 2018). The scheme plans to cover 40% of the population (Mahalakshmi 2018) and is expected to significantly reduce the out-of-pocket health expenses of Indians on low incomes and improve their access to health care.
India is also looking at big savings on bureaucratic costs and time by consolidating or replacing many centrally sponsored subsidy and income schemes with a universal basic income program (Capital Economics 2017). While the consolidation of cross-cutting programs is a good step, the high fiscal cost and infrastructure constraints make this reform implausible right now. According to an estimate by Capital Economics, even if all welfare programs were eliminated, providing a universal basic income would still need additional financing of 3.3% of gross domestic product to guarantee a minimum income for all citizens. The policy challenge is how to provide social services on this scale in a cost-effective manner.
Sources: Capital Economics. 2017. “India Economics Update: Is a Universal Basic Income Feasible?” 6 March; Government of India. 2017. Economic Survey 2016–2017. https://www.indiabudget.gov.in/es2016-17/echapter.pdf; Government of India. 2018. Draft Labour Code on Social Security and Welfare. https://labour.gov.in/sites/default/files/SS%20Code%202018-03-28.pdf; B. V. Mahalakshmi. 2018. “NHPS is Game Changer in Improving Healthcare Access, DG of Organisation of Pharma Producers of India.” Financial Express, 15 March; National Portal of India. 2018. https://www.india.gov.in/spotlight/ayushman-bharat-national-health-protection-mission; M. Rama, T. Béteille, Y. Li, P. Mitra, and J. L. Newman. 2015. Addressing Inequality in South Asia. Washington, DC: World Bank; Yogima Sharma. 2018. “Government Readies Social Security Scheme for 50 Crore Workers.” Economic Times, March 3.

A New Index of the Quality of Growth 7
Box 3: The Blue Skies Initiative in the People’s Republic of China
The 13th Five-Year Plan, 2016–2020 of the People’s Republic of China (PRC) aims to realize an “ecological civilization” to promote sustainable development, curtail resource depletion and environmental damage, promote energy conservation, reduce carbon dioxide emissions, and encourage low-carbon development to tackle climate change. A national carbon emission trading system will be set up under the plan.
The PRC’s pilot carbon pricing system through emissions trading, underway in seven provinces, is the world’s largest such initiative (ADB 2016). The government is also intensifying efforts to reduce air pollution and smog under its blue skies initiative (Phillips 2017).
A combination of integrated energy policies, improved environmental governance, and greater coordination and cooperation between national and local governments led to the merger of the Ministry of Environment’s Department of Air Pollution and the National Development and Reform Commission’s Department of Climate Change to form the Ministry of Ecology and Environment’s Department of Environment and Climate change in March 2018. This may pay off in terms of significantly better air quality in the PRC and the global climate.
The country is energetically cracking down on corporate polluters, such as steel mills and coal-fired plants, by ordering them to clean up or risk being shut down. This comes at an economic cost estimated to reduce growth by two-tenths of a percent (Bradsher 2017). But it is now widely accepted that a modest slowing of growth is a necessary sacrifice for maintaining social stability over the medium term. If the PRC is successful in cleaning its degraded environments, it will result in tangible benefits for its 1.3 billion people.
Sources: Asian Development Bank. 2016. Asian Development Outlook 2016 Update: Meeting the Low-Carbon Growth Challenge. Manila; Tom Phillips. 2017. “China’s Premier Unveils Smog-Busting Plan to ‘Make Skies Blue Again.’” Guardian, March 5; Keith Bradsher. 2017. “China’s New Antipollution Push Could Cool Its Growth Engine.” New York Times, October 23.
Conserving the EnvironmentCareful environmental management is an essential element of the IGGI’s environmental sustainability pillar. It spans air quality, water productivity, sustainable use of natural resources, and climate change impacts. The environmental pillar, however, does not cover important aspects of environmental sustainability, such as water quality, waste management, biodiversity protection, and land productivity, because of lack of data. Conserving the environment will reduce disparities between the rich and poor today and between the current and future populations.
Shortfalls in environmental management is accelerating environmental degradation across Asia. The exploitation of natural resources at an ever-expanding rate, excessive waste generation, and air and water pollution are leading to greater environmental stress, loss of ecosystem services, and higher vulnerability of countries to natural disasters. The depletion of natural resources has now reached a level that is beginning to threaten both growth and social welfare. Environmental degradation particularly harms the poor, and it compromises the ability of future generations to meet their needs. Faced with these threats, the People’s Republic of China (PRC) and other countries in the region are starting to shift from maximizing economic output toward a pattern of growth in which the emphasis is on improving its quality through better environmental standards (Box 3).
In the IGGI, the incidence or potential impact of climate change is measured in terms of carbon dioxide emission per GDP, energy intensity, and the use of renewable energy. The level of air pollution is approximated by the proportion of the population exposed to particulate matter of 2.5 microns in diameter or smaller. Natural resources rent—an indicator developed by the World Bank for its World Development Indicators—measures the total revenue that can be generated from extracting oil, natural gas, coal, and mineral and forest resources. Higher values of natural resources rent indicate faster rates of depletion. Annual freshwater stocks and water productivity capture the sustainability of water resources.

Inclusive Green Growth Index8
Construction of the Inclusive Green Growth Index The scores of the IGGI, its three pillars, and their indicators range from 1 (worst) to 6 (best) for comparability over time and across countries. The range of 1–6 also aligns the IGGI and its components’ scores with those of the World Bank’s Worldwide Governance Indicators, whose relationship with the IGGI is discussed later. The IGGI is constructed using a three-step approach (Appendix 4 gives the detailed steps of this approach). First, in brief, normalization techniques are applied to all the indicators to transform them into the same scale of scores from 1 (worst) to 6 (best). In cases where an indicator’s impact direction on the IGGI’s score is negative—that is, a higher value indicates a worse outcome, as with public debt and air pollution—a reverse transformation formula is applied to ensure that 1 and 6 still correspond to the worst and best possible outcomes.
Second, once normalized, the indicators for each pillar are assigned equal weights, after which they are aggregated to get the score of each pillar. Third, the equal weighted average of the pillar scores yields a single composite index. In designing the IGGI, we used the equal weighting method because of its simplicity, transparency, and broad acceptance (Box 4). Compared with many other measures, the computation of the IGGI is less demanding in terms of data requirements and stakeholder capacity. Using equal weights also makes it easier to interpret the index for policy purposes. Beyond assigning equal weights to the three pillars, it is useful to consider how well balanced is a country’s performance across these pillars.
Balancing the Three Pillars A country with a high score on the IGGI does not necessarily perform equally well on all three pillars. It is possible, for example, that a strong performance in one pillar lifts the overall IGGI score substantially even if the other two pillars perform weakly. To deal with this gap in performance or imbalance, we developed the concept of cross-pillar balance, which captures the pairwise performance gap between the pillars (Appendix 4). We define Balanced IGGI as the average score of the three IGGI pillars and cross-pillar balance—treated as the fourth pillar—with all the four components having equal weight. This allows us to adjust the IGGI score for the performance gaps between the three pillars. Balanced IGGI is the first index to measure the gap across pillars and put a value on a country’s effort to pursue a pattern of growth that is not only strong in each pillar but also performs equally well on all three pillars. If a weak pillar pulls down the IGGI score, the underlying indicators that are primarily responsible for the low pillar score can be identified and improved on (as explained later in the case of the PRC). A balanced performance shows that a country is paying attention to all three pillars to support its commitment to global development goals and in line with national priorities.
Maintaining a balance across the pillars results in better policy choices for improving the quality of growth, which supports global development goals, such as the SDGs and Paris climate change agreement, as well as economic growth. Given the interconnected nature of IGGI indicators, achieving these objectives require integrated approaches to development by recognizing that a change to one part of a complex economic, technological, and socio-ecological system can lead to changes in other parts. Fossil fuel subsidies are a good example of the usefulness of an integrated systems approach since they encompass the environment, energy, and the economic and social dimensions of growth. These subsidies are widely used in Asia to encourage energy production and to provide cheap energy to the poor. But they dig into priority development spending and benefit mainly the better-off who drive gas guzzling cars and live in air-conditioned homes. Artificially low prices also discourage investments in renewable energy and lead to increased greenhouse gas emissions from higher demand for coal, oil, and gas. To successfully eliminate these subsidies, coordination is needed across stakeholders.

A New Index of the Quality of Growth 9
Box 4: The Choice of Weights in Constructing a Composite Index
Given the central position weights occupy in constructing a composite index, the choice of weights is often driven by a plethora of approaches using statistical analysis, linear programming, optimization models, and opinion surveys. And there are various weighting schemes, such as optimal weighting, expert weighting, user weighting, and survey weighting.
Among the more commonly used methods for arriving at differentiated weights are optimal weighting and principal component analysis. In the former, optimal weights are obtained by solving an optimization problem to achieve a given objective, such as minimizing poverty (Sawada et al. 2004; Lorenz, Brauer, and Lorenz 2016). Principal component analysis groups together individual collinear indicators to form a composite indicator that captures as much as possible of the information common to individual indicators (Nardo et al. 2008).
Choosing differentiated weights “optimally” is not straightforward and may be misused. For example, a country could use the optimization method to attain the highest rank among all countries in the sample by assigning the highest weight to its strongest dimensions and zero weight to the others. This makes it incomparable across countries and contradicts the concept of a multidimensional index. The main weakness of principal component analysis is that it reduces the contribution of individual indicators, which do not move with other individual indicators. And correlations may not represent the real influence of the subindicator.
In contrast to differentiated weights, the equal weighting of all subcomponents eliminates the possibility of trading-off one dimension for another (Decancq and Lugo 2008). In constructing the Inclusive Green Growth Index, a pairwise correlation analysis was conducted on the indicators of each pillar to ensure that no two indicators were highly correlated.
This is needed because if two indicators of similar intrinsic value are included in any pillar it would imply that a higher value is assigned for this intrinsic value in arriving at the pillar subindex. For example, in this study, labor productivity growth was initially considered as an indicator for the economic growth pillar, but it was excluded because of its high correlation with gross domestic product per capita growth. Likewise, the poverty indicator serves as a proxy for several development problems, including hunger and malnutrition. Since poverty indicators based on national poverty lines usually apply the food-energy intake method, these indicators can reflect hunger and malnutrition.
Chowdhury and Squire (2006) in their evaluation of the UNDP’s Human Development Index and the Centre for Global Development and Foreign Policy’s Commitment to Development Index find that equal weighting is “not only convenient but also consistent with the views of experts.” Likewise, the Index of Economic Well-Being, which underwent several changes in the weighting of its components, finally adopted equal weighting as the “least objectionable” choice (Sharpe and Andrews 2012).
The simplicity and transparency of an equal-weighting approach makes it a popular choice. From the time that Sen (1996) held that the weights should be explicit, transparent, and open for public scrutiny, equal weighting has become the norm for most composite indices.
Sources: Shyamal Chowdhury and Lyn Squire. 2006. “Setting Weights for Aggregate Indices: An Application to the Commitment to Development Index and Human Development Index.” Journal of Development Studies 42 (5): 761–771; K. Decancq and M. Lugo. 2008. “Setting Weights in Multidimensional Indices of Well-Being and Deprivation.” Oxford Poverty and Human Development Initiative Working Paper 18. Oxford; Jan Lorenz, Christoph Brauer, and Dirk A. Lorenz. 2016. “Rank-Optimal Weighting or ‘How to Be Best in the OECD Better Life Index?’” ResearchGate. Berlin; M. Nardo, M. Saisana, A. Saltelli, S. Tarantola, A. Hoffmann, and E. Giovannini. 2008. Handbook on Constructing Composite Indicators. Paris: Organisation for Economic Co-operation and Development; Yasuyuki Sawada, Hirohisa Kohama, Hisaki Kono, and Munenobu Ikegami. 2004. “Commitment to Development Index (CDI): Critical Comments.” FASID Discussion Paper on Development Assistance No. 1. Tokyo; A. Sen. 1996. “On the Foundations of Welfare Economics: Utility, Capability and Practical Reason. In Ethics, Rationality, and Economic Behaviour, edited by F. Farina, F. Hahn, and S. Vannucci, Oxford: Clarendon Press; Andrew Sharpe and Brendon Andrews. 2012. An Assessment of Weighting Methodologies for Composite Indicators: The Case of the Index of Economic Well-Being. Ontario: Centre for the Study of Living Standards.

10
This section gauges how the IGGI compares with other traditional measures of growth and assesses the performance of developing Asian regions in the index.
How the Index Relates to Other Measures Table 1 presents a comparison of the components of the IGGI in relation to those of other measures. While some of these measures cover a larger number of indicators than the IGGI, they tend to lean toward either the social equity or environmental sustainability pillars, whereas the IGGI assigns equal weightings to the three pillars to reflect the new global development agenda. The index provides a common basis for observing country performance, both in the aggregate and across each pillar and each indicator. Specific indicators included in the IGGI allow for a deeper insight into the underlying causes of a rise or fall in the score of each pillar and in the IGGI overall. The indicators chosen for the IGGI assess not only its current performance but also its sustainability.
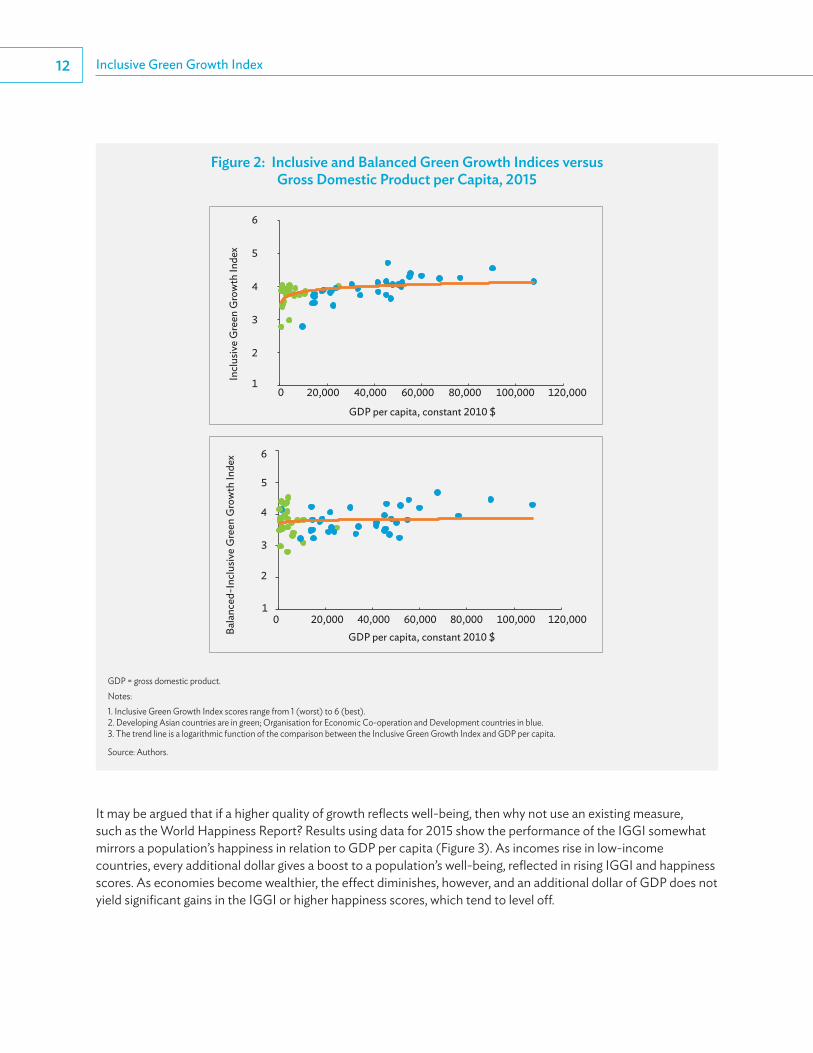
Results based on 2015 data show that in Asian and Organisation for Economic Co-operation and Development countries, high economic growth was achieved largely without much attention to the quality of growth, especially at low-income levels, as shown using the IGGI (and more so using the Balanced IGGI) (Figure 2). The figure also shows that most developing Asian countries perform at or below the fitted line or “average” level of performance in the IGGI in Asian and Organisation for Economic Co-operation and Development countries with similar levels of income. About half of Asian countries perform better than average in balancing their growth with inclusion and environmental sustainability. It is important to highlight the value of achieving cross-pillar balance even for low- and middle-income countries. A shift to an inclusive green growth path is possible at later stages of a country’s development, but this may entail large costs to the economy, which could reduce the incentive to pursue balanced growth.
Applying the Inclusive Green Growth Index

Applying the Inclusive Green Growth Index 11
Table 1: Comparison of the Inclusive Green Growth Index with Other Measures
The Three Pillars
Jha, Sandhu, and Wachirapunyanont
(ADB) ADB
Mlachila, Tapsoba,
and Tapsobaa WB WEF GGKP UNESCAP
Inclusive Green Growth Index
Framework for Inclusive
Growth Index
Quality of Growth
Index
Inclusive Green
Growth
Inclusive Development
Index
Green Growth
Indicators
Green Growth
IndexDate of
publication May 2018 August 2014September
2014 May 2012 January 2017 June 2017December
2013Economic growthEconomic performanceEconomic dependencyEconomic sustainabilitySocial EquityPublic servicesSocial securityEnvironmental sustainabilityNatural resourcesWater resourcesAir quality
Climate change and energy
Sufficient indicators to fully cover all dimensions of the pillars
Insufficient indicators to fully cover all dimensions of the pillars
Some indicators to fully cover all dimensions of the pillars
ADB = Asian Development Bank, GGKP = Green Growth Knowledge Platform, IGGI = Inclusive Green Growth Index, UNESCAP = United Nations Economic and Social Commission for Asia and the Pacific, WB = World Bank, WEF = World Economic Forum. a M. Mlachila, R. Tapsoba, and M. S. Tapsoba. 2014. “A Quality of Growth Index for Developing Countries: A Proposal.” International Monetary Fund Working Paper No. 141-
172. Washington, DC.Source: Organizations cited in the table.
Inclusive Green Growth Index12
Figure 2: Inclusive and Balanced Green Growth Indices versus Gross Domestic Product per Capita, 2015
1
2
3
4
5
6
0 20,000 40,000 60,000 80,000 100,000 120,000
Incl
usiv
e G
reen
Gro
wth
Inde
x
GDP per capita, constant 2010 $
1
2
3
4
5
6
0 20,000 40,000 60,000 80,000 100,000 120,000GDP per capita, constant 2010 $Ba
lanc
ed-I
nclu
sive
Gre
en G
row
th In
dex
GDP = gross domestic product.Notes:1. Inclusive Green Growth Index scores range from 1 (worst) to 6 (best).2. Developing Asian countries are in green; Organisation for Economic Co-operation and Development countries in blue.3. The trend line is a logarithmic function of the comparison between the Inclusive Green Growth Index and GDP per capita.
Source: Authors.
It may be argued that if a higher quality of growth reflects well-being, then why not use an existing measure, such as the World Happiness Report? Results using data for 2015 show the performance of the IGGI somewhat mirrors a population’s happiness in relation to GDP per capita (Figure 3). As incomes rise in low-income countries, every additional dollar gives a boost to a population’s well-being, reflected in rising IGGI and happiness scores. As economies become wealthier, the effect diminishes, however, and an additional dollar of GDP does not yield significant gains in the IGGI or higher happiness scores, which tend to level off.

Applying the Inclusive Green Growth Index 13
While the IGGI moves in parallel with country happiness scores, the two measures are distinct. The IGGI is a broad measure of well-being that provides an objective and comprehensive picture of a country’s economic, social, and environmental performance. The happiness scores capture only the subjective component of well-being because the responses in the World Happiness Report survey only reflect the perception and evaluation of individuals on how happy they feel. The IGGI captures the dwindling state of natural resources in a country, such as the amount of water available for human consumption. But this is not captured in the happiness scores because individuals are oblivious to impending shortages. And whereas individuals may find happiness in their own personal circumstances, growing inequality between rich and poor and men and women will impinge on the quality of growth. Thus, using the IGGI in relation to happiness as a metric of development progress has significant implications for evidence-based policymaking to achieve development priorities.
Performance by Developing Asia RegionsHere, we present how well the regions of developing Asia fare using the IGGI. In 2015, the Pacific (represented by Fiji, as this was the only country for which data are available) placed top both in the overall IGGI, with a score of 4.04, and in the Balanced IGGI, with a score of 4.52 (Figure 4). East Asia trailed behind the other regions, especially in the Balanced IGGI. In terms of the IGGI’s three pillars, South Asia, Southeast Asia, and the Pacific have a more balanced performance, and therefore rank higher on the Balanced IGGI than the IGGI in contrast with countries in Central Asia and East Asia (Figure 5). Southeast Asia has the most dynamic economy in the region, Central Asia shares growth more widely than the other regions, and the Pacific leads in managing environmental standards.
Figure 3: Inclusive Green Growth Index and Happiness Index Scores versus Gross Domestic Product per Capita, 2015
0
2
4
6
8
10
1
2
3
4
5
6
0 20,000 40,000 60,000 80,000 100,000 120,000
Hap
pine
ss sc
ore
Happiness
IGGI
Incl
usiv
e G
reen
Gro
wth
Inde
x
GDP per capita (constant 2010 $)
GDP = gross domestic product.Notes: 1. The happiness score or subjective well-being in the World Happiness Index is the national average response to the question: “Imagine a ladder, with steps
numbered from 0 at the bottom to 10 at the top. The top of the ladder represents the best possible life for you and the bottom of the ladder represents the worst possible life for you. On which step of the ladder would you say you personally feel you stand at this time?” (J. Helliwell, R. Layard, and J. Sachs, eds. 2017. World Happiness Report 2017. Sustainable Development Solutions Network. New York).
2. Inclusive Green Growth Index scores (green) range from 1 (worst) to 6 (best); happiness scores (blue) range from 1 (lowest) to 10 (highest). Source: Authors.

Inclusive Green Growth Index14
Figure 5: Regional Performance of the Inclusive Green Growth Index, 2015
3.884.38
3.96 4.03 3.914.344.13
4.55 4.50
3.753.91
3.21
2.41 2.42
3.24
4.04 3.91 3.73 3.65 3.64
Pacific Southeast Asia Central Asia East Asia South Asia
IGG
I sco
res
Economic growth Social equity Environmental sustainability IGGI
IGGI = Inclusive Green Growth Index.Source: Authors.
Figure 4: Developing Asia’s Performance in the Inclusive Green Growth Index with Balanced Pillars, 2015
0
1
2
3
4
5
Central Asia East Asia South Asia Southeast Asia PacificIGGI Balanced IGGI
IGGI = Inclusive Green Growth Index.Source: Authors.
Applying the Inclusive Green Growth Index 15
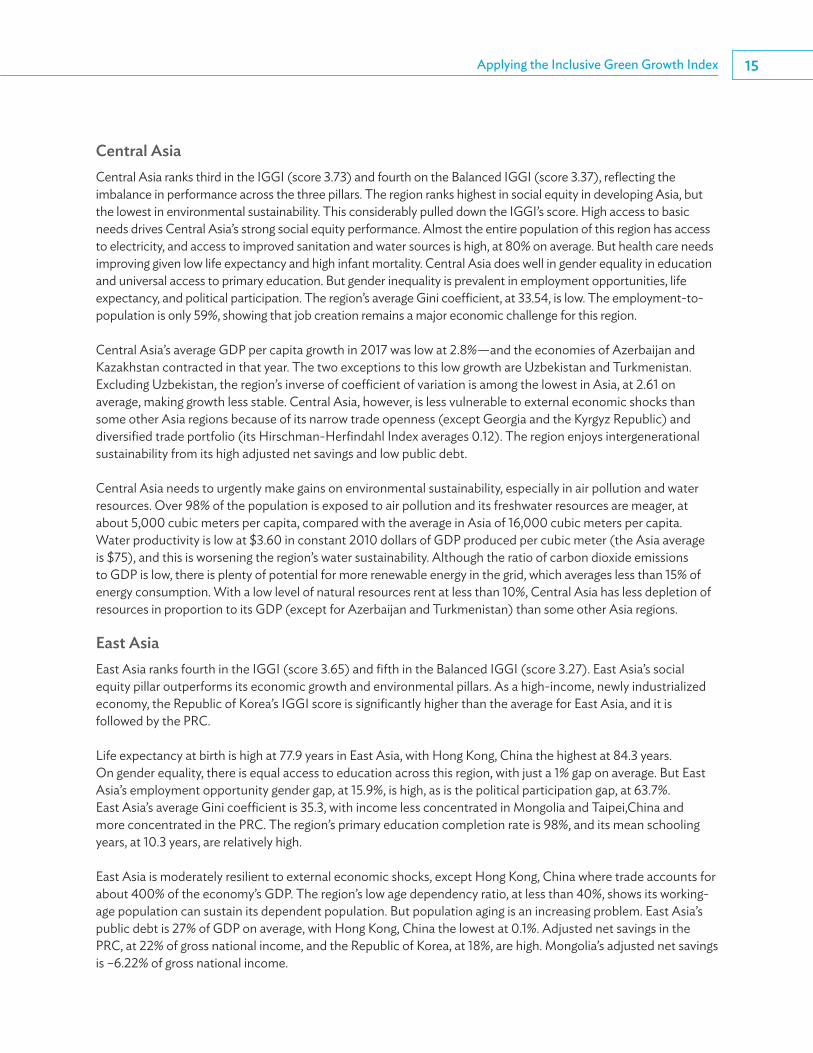
Central Asia Central Asia ranks third in the IGGI (score 3.73) and fourth on the Balanced IGGI (score 3.37), reflecting the imbalance in performance across the three pillars. The region ranks highest in social equity in developing Asia, but the lowest in environmental sustainability. This considerably pulled down the IGGI’s score. High access to basic needs drives Central Asia’s strong social equity performance. Almost the entire population of this region has access to electricity, and access to improved sanitation and water sources is high, at 80% on average. But health care needs improving given low life expectancy and high infant mortality. Central Asia does well in gender equality in education and universal access to primary education. But gender inequality is prevalent in employment opportunities, life expectancy, and political participation. The region’s average Gini coefficient, at 33.54, is low. The employment-to-population is only 59%, showing that job creation remains a major economic challenge for this region.
Central Asia’s average GDP per capita growth in 2017 was low at 2.8%—and the economies of Azerbaijan and Kazakhstan contracted in that year. The two exceptions to this low growth are Uzbekistan and Turkmenistan. Excluding Uzbekistan, the region’s inverse of coefficient of variation is among the lowest in Asia, at 2.61 on average, making growth less stable. Central Asia, however, is less vulnerable to external economic shocks than some other Asia regions because of its narrow trade openness (except Georgia and the Kyrgyz Republic) and diversified trade portfolio (its Hirschman-Herfindahl Index averages 0.12). The region enjoys intergenerational sustainability from its high adjusted net savings and low public debt.
Central Asia needs to urgently make gains on environmental sustainability, especially in air pollution and water resources. Over 98% of the population is exposed to air pollution and its freshwater resources are meager, at about 5,000 cubic meters per capita, compared with the average in Asia of 16,000 cubic meters per capita. Water productivity is low at $3.60 in constant 2010 dollars of GDP produced per cubic meter (the Asia average is $75), and this is worsening the region’s water sustainability. Although the ratio of carbon dioxide emissions to GDP is low, there is plenty of potential for more renewable energy in the grid, which averages less than 15% of energy consumption. With a low level of natural resources rent at less than 10%, Central Asia has less depletion of resources in proportion to its GDP (except for Azerbaijan and Turkmenistan) than some other Asia regions.
East Asia East Asia ranks fourth in the IGGI (score 3.65) and fifth in the Balanced IGGI (score 3.27). East Asia’s social equity pillar outperforms its economic growth and environmental pillars. As a high-income, newly industrialized economy, the Republic of Korea’s IGGI score is significantly higher than the average for East Asia, and it is followed by the PRC.
Life expectancy at birth is high at 77.9 years in East Asia, with Hong Kong, China the highest at 84.3 years. On gender equality, there is equal access to education across this region, with just a 1% gap on average. But East Asia’s employment opportunity gender gap, at 15.9%, is high, as is the political participation gap, at 63.7%. East Asia’s average Gini coefficient is 35.3, with income less concentrated in Mongolia and Taipei,China and more concentrated in the PRC. The region’s primary education completion rate is 98%, and its mean schooling years, at 10.3 years, are relatively high.
East Asia is moderately resilient to external economic shocks, except Hong Kong, China where trade accounts for about 400% of the economy’s GDP. The region’s low age dependency ratio, at less than 40%, shows its working-age population can sustain its dependent population. But population aging is an increasing problem. East Asia’s public debt is 27% of GDP on average, with Hong Kong, China the lowest at 0.1%. Adjusted net savings in the PRC, at 22% of gross national income, and the Republic of Korea, at 18%, are high. Mongolia’s adjusted net savings is –6.22% of gross national income.

Inclusive Green Growth Index16
The PRC has been successful in promoting renewable energy, which accounts for about 20% of its total energy mix. But the level is low in other countries in East Asia, averaging 5%. The region’s energy intensity level is high, ranging 6.6–7.4 mega joules per 2011 GDP measured in dollar purchasing power parity terms, except for Hong Kong, China, which has an energy intensity of 1.6. Almost the entire population of East Asia is exposed to air pollution, and further regulation is needed to combat this. Mongolia’s natural resources rent is high at 16.5% compared with the rest of the region, where the rate is about zero. All economies in East Asia face the common challenge of raising water productivity because of insufficient water resources.
South Asia South Asia ranks fifth in the IGGI (score 3.64) and third in the Balanced IGGI (score 3.92), with a strong social equity pillar helping countries in this region attain more balanced growth. Afghanistan is the big exception. The conflict has put tremendous pressure on the economy and social equity, resulting in the lowest IGGI ranking among all countries in this region. Afghanistan is also ranked lowest in gender equality, with the gender gap in education at 40.5% and labor participation at 64.4 %.
Income concentration is low in South Asia, which has Gini coefficient averaging 35.3. The region’s employment-to-population ratio is also low, averaging 60%. Its mean schooling years are particularly low at 6.5 years in almost every country, except Sri Lanka (10.9 years). Access to electricity and improved water sources in South Asia averages 88% of the population, while only 60.6% has access to improved sanitation. The infant mortality rate is high, averaging 32 deaths for every 1,000 live births (though the rate is much lower in Maldives and Sri Lanka). This and the region’s low life expectancy, at an average 70 years, highlight the insufficient access to and low quality of health care. Taken together, these figures show that better sanitation, health care, and education should be the focus areas of South Asia’s social equity goals.
The region’s GDP per capita growth averages 3%, though it ranges from 5% to 7% in India, Bangladesh, and Bhutan. South Asia’s economic growth is less than stable, as indicated by an inverse coefficient of variation of about 2% (the exception is Bangladesh, at 18.7%). The region’s adjusted net savings are a high 13.1% of gross national income. South Asia is generally resilient to external economic shocks because of its narrow trade openness, at about 45% of GDP. Trade-reliant Bhutan and Maldives are the exceptions. The region’s average age dependency ratio is 57.1%, slightly higher than developing Asia’s 54.4%.
South Asia faces multiple environmental challenges. Air pollution is a common problem throughout the region, with almost the entire population exposed to dangerous levels of particulate matter of 2.5 microns in diameter or smaller. Among South Asia’s environmental bright spots are Bhutan and Nepal, which perform well on climate action and energy efficiency. Over 80% of energy consumption in both countries comes from renewables, compared with only 37% in the region’s larger economies. Freshwater resources in Bangladesh, India, and Sri Lanka at 658.7, 1,117.6, and 2,542 cubic meters per capita, respectively, are way below developing Asia’s average of 15,963 cubic meters per capita. Water productivity in the region is also low, averaging $3.20 in constant 2010 dollars of GDP produced per cubic meter—except in Maldives, where water productivity is at $487.
Southeast Asia Southeast Asia ranks second in both the IGGI (score 3.91) and the Balanced IGGI (score 3.96). This holds true even after excluding Singapore because of limited data on its social equity pillar. The region performed best in the economic pillar because of its dynamic growth. Growth is more balanced in Southeast Asia than in other regions in developing Asia.
Applying the Inclusive Green Growth Index 17
Gender gaps in education have narrowed across the region, and are approaching parity in four countries—Brunei Darussalam, Cambodia, Malaysia, and Viet Nam. Access to basic needs is high: about 90% of the region’s population has access to improved water sources and electricity, and 77% to improved sanitation. But life expectancy at birth is low and the average infant mortality rate is high, at 21 deaths for every 1,000 live births (except in Brunei Darussalam and Singapore). The region’s average years of schooling is low, at less than 8 years. With a Gini coefficient of 39.0, Southeast Asia’s income is more concentrated than other regions in developing Asia. Southeast Asia’s employment-to-population ratio is high at 69.6%, because of its many labor-intensive industries, especially in Cambodia.
Myanmar’s GDP per capita growth—spurred by new investments—is the region’s highest, at 6.3%, followed by the Lao People’s Democratic Republic (5.9%) and Cambodia (5.3%). Southeast Asia is strongly resilient to external economic shocks because of its narrow outward orientation (except Singapore) and diversified export portfolio. Its average adjusted net savings are high at 24.7%, led by Brunei Darussalam at 38.7%. The age dependency ratio is 47.6%, indicating low pressure on the working-age population.
The entire population of Southeast Asia is exposed to air pollution. Managing water resources is a big challenge for the region, which has an average water productivity of only $23.17 in constant 2010 dollars of GDP produced per cubic meter. Southeast Asia’s carbon emissions are low at 0.55 kilogram per GDP, as is the region’s energy intensity at 4.22 mega joules per constant 2011 purchasing power parity dollars of GDP (developing Asia’s average is 5.60). The use of renewable energy is still low in region, averaging 35.9% of the total energy mix. The exceptions are Cambodia and the Lao People’s Democratic Republic, where renewables account for at least 68% of the total energy mix. Southeast Asia’s natural resources rent averages 4%, in line with developing Asia’s average of 4.2%.
The Pacific Because of insufficient data for some indicators, only Fiji was included in the IGGI score for the Pacific region, as earlier noted. Fiji ranks first among all countries in both the IGGI (score of 4.04) and the Balanced IGGI (score 4.53) because of its balanced performance across the three pillars.
Access to basic needs, however, remains a problem in Pacific island countries. Low life expectancy at birth and high infant mortality rates highlight the inadequate access to and the poor quality of health care in the region. On gender, there is equal access to education, but not employment opportunities and political participation. Unemployment is a major problem in some Pacific island countries; only about half the working-age population of Samoa and Timor-Leste have jobs. The mean years of schooling is low at 8.3 years, and only 4.5 years in Papua New Guinea and Timor-Leste. The region’s average Gini coefficient at 37.9 shows that income inequality is a high-profile concern for Pacific island countries.
The region’s average GDP per capita growth is 2.3%, but growth varies from –2.32 in Nauru to 8.37 in Palau. Moreover, the low inverse of coefficient of variation of GDP per capita in Pacific island countries signals instability. Because of geographical constraints, trade openness is wide at 101.4% of GDP, which makes these countries vulnerable to external economic shocks.
Pacific island countries have low carbon emissions and low energy intensity, except Palau. The proportion of renewable energy to total consumption varies considerably: 62.96 % in Solomon Islands and practically zero in Nauru. Freshwater availability is a problem for all countries in the region, except Papua New Guinea, and water productivity is low. Natural resources rent is very low, at 0.47 % of GDP on average.
Inclusive Green Growth Index18
Table 2 shows the scores of economies in developing Asia on both inclusive green growth indices, and, as can been seen, there is considerable variation across economies.
Table 2: Developing Asia Scores in the Three Pillars of the Inclusive Green Growth Indices, 2015
EconomiesEconomic
Growth Social EquityEnvironmental Sustainability IGGI Balanced IGGI
Central Asia 3.96 4.65 2.57 3.73 3.37Armenia 4.05 4.57 2.77 3.80 3.58Azerbaijan 4.13 4.62 2.44 3.73 3.32Georgia 4.11 4.53 3.07 3.90 3.85Kazakhstan 4.10 4.97 2.31 3.79 3.10Kyrgyz Republic 3.43 4.54 2.23 3.40 2.99Tajikistan NA 4.33 3.02 … ...Turkmenistan ... ... 1.13 ... ...Uzbekistan ... 4.05 1.62 ... ...East Asia 4.03 4.50 2.42 3.65 3.27China, People’s Rep. of 4.80 4.57 2.51 3.96 3.42Hong Kong, China ... ... ... ... ...Korea, Rep. of 4.36 4.89 2.79 4.01 3.57Mongolia 2.95 4.04 1.97 2.99 2.82Taipei,China ... ... ... ... ...South Asia 3.91 3.75 3.24 3.64 3.92Afghanistan 2.83 2.46 3.08 2.79 3.50Bangladesh 4.85 3.79 3.20 3.95 3.78Bhutan 3.57 4.02 3.69 3.76 4.32India 4.39 3.44 2.84 3.56 3.54Maldives 3.68 4.50 3.13 3.77 3.81Nepal 3.99 4.26 3.37 3.88 4.16Pakistan 3.92 3.41 3.07 3.46 3.87Sri Lanka 4.07 4.16 3.56 3.93 4.36Southeast Asia 4.38 4.13 3.21 3.91 3.96Brunei Darussalam 4.21 ... 2.97 ... ...Cambodia 4.95 3.82 3.34 4.04 3.87Indonesia 4.63 4.05 3.41 4.03 4.09Lao PDR 4.18 3.99 3.65 3.94 4.40Malaysia 4.11 4.46 3.01 3.86 3.83Myanmar 4.41 3.70 3.51 3.87 4.15Philippines 4.34 4.02 3.17 3.84 3.98Singapore 3.48 ... 3.79 ... ...Thailand 4.17 4.36 2.83 3.78 3.73Viet Nam 4.26 4.62 2.75 3.88 3.61
continued on next page

Applying the Inclusive Green Growth Index 19
Table 2 continued
EconomiesEconomic
Growth Social EquityEnvironmental Sustainability IGGI Balanced IGGI
Pacific 3.88 4.34 3.91 4.04 4.53Cook Islands ... ... ... ... ...Fiji 3.88 4.34 3.91 4.04 4.53Kiribati ... 3.15 ... ... ...Marshall Islands ... ... ... ... ...Micronesia, Fed. States of ... 3.87 ... ... ...Nauru ... ... ... ... ...Palau ... ... ... ... ...Papua New Guinea ... 2.44 4.26 ... ...Samoa 3.25 4.14 ... ... ...Solomon Islands 3.37 3.28 ... ... ...Timor-Leste ... 3.46 3.21 ... ...Tonga ... 4.30 ... ... ...Tuvalu ... ... ... ... ...Vanuatu ... 3.75 ... ... ...Asia and the Pacific 4.09 4.16 3.02 3.76 3.77
... = not available, Lao PDR = Lao People’s Democratic Republic.Note: Scores range from 1 (worst) to 6 (best).Source: Authors.

20
Figure 6: Mapping Sustainable Development Targets to Inclusive Green Growth Indicators
SDG goals
1. No poverty
2. Zero hunger
3. Good health and well-being
Primary completion rate, mean years of schooling, primary education enrollment gap4. Quality education
5. Gender equality
6. Clean water and sanitation
Access to electricity, energy intensity, renewable energy7. A�ordable and clean energy
8. Decent work and economic growth
9. Industry, innovation and infrastructure
10. Reduced inequalities
11. Sustainable cities and communities
12. Responsible consumption and production
13. Climate action
14. Life below water
15. Life on land
16. Peace, justice and strong institutions
17. Partnerships for the goals
Inclusive green growth index indicator
Poverty gap
Not applicable
Life expectancy, infant mortality, life expectancy gap
Political participation gap
Access to improved water and sanitation, water productivity, renewable water resources
Carbon dioxide emissions
Gini coe�cient
Air pollution
Adjusted net savings, natural resources rent
Not applicable
Not applicable
Public debt, trade openness, trade dispersion
Not applicable
Not applicable
Real GDP per capita growth and its coe�cient of variation, employment—population ratio, labor force participation gap, age dependency ratio
GDP = Gross Domestic Product, SDG = Social Development Goal.Source: Authors.
Most countries have set their development priorities according to SDG goals and targets and the Paris climate change agreement. Both are mutually reinforcing—one cannot be achieved without the other. Many SDGs address the core drivers of climate change, while the Paris Agreement highlights the fundamental importance of reducing carbon emissions to well-being and development. The indicators used by the United Nations to gauge progress on attaining the SDGs by 2030 may not, however, be applicable for tracking regional, national, and subnational progress. This is where the IGGI can help by mapping SDG goals and targets to the index’s indicators. The IGGI was designed to measure progress on inclusive and environmentally sustainable growth at the national level and can provide an alternative or complementary method to assess progress in achieving SDGs. As Figure 6 shows, IGGI indicators can measure many SDG goals and targets. And since all IGGI indicators are from frequently updated public data, the process of tracking progress in national development priorities and global goals is easy and transparent.
Raising the Quality of Growth
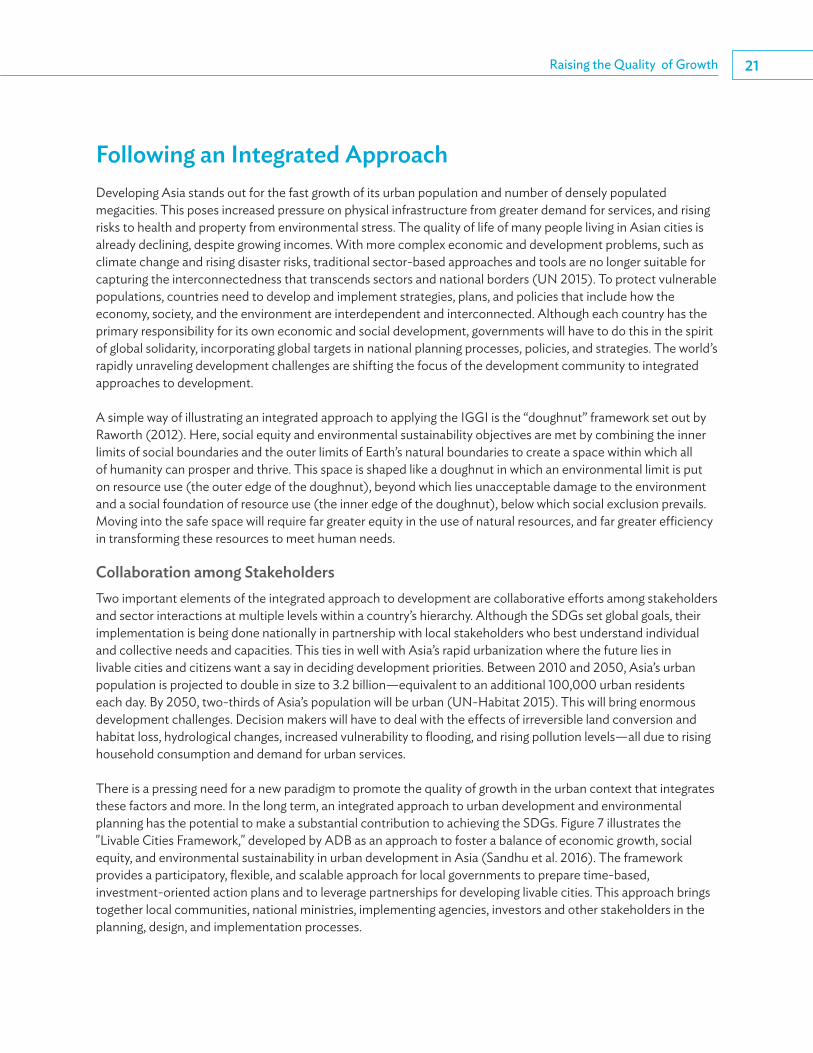
Raising the Quality of Growth 21
Following an Integrated Approach Developing Asia stands out for the fast growth of its urban population and number of densely populated megacities. This poses increased pressure on physical infrastructure from greater demand for services, and rising risks to health and property from environmental stress. The quality of life of many people living in Asian cities is already declining, despite growing incomes. With more complex economic and development problems, such as climate change and rising disaster risks, traditional sector-based approaches and tools are no longer suitable for capturing the interconnectedness that transcends sectors and national borders (UN 2015). To protect vulnerable populations, countries need to develop and implement strategies, plans, and policies that include how the economy, society, and the environment are interdependent and interconnected. Although each country has the primary responsibility for its own economic and social development, governments will have to do this in the spirit of global solidarity, incorporating global targets in national planning processes, policies, and strategies. The world’s rapidly unraveling development challenges are shifting the focus of the development community to integrated approaches to development.
A simple way of illustrating an integrated approach to applying the IGGI is the “doughnut” framework set out by Raworth (2012). Here, social equity and environmental sustainability objectives are met by combining the inner limits of social boundaries and the outer limits of Earth’s natural boundaries to create a space within which all of humanity can prosper and thrive. This space is shaped like a doughnut in which an environmental limit is put on resource use (the outer edge of the doughnut), beyond which lies unacceptable damage to the environment and a social foundation of resource use (the inner edge of the doughnut), below which social exclusion prevails. Moving into the safe space will require far greater equity in the use of natural resources, and far greater efficiency in transforming these resources to meet human needs.
Collaboration among Stakeholders Two important elements of the integrated approach to development are collaborative efforts among stakeholders and sector interactions at multiple levels within a country’s hierarchy. Although the SDGs set global goals, their implementation is being done nationally in partnership with local stakeholders who best understand individual and collective needs and capacities. This ties in well with Asia’s rapid urbanization where the future lies in livable cities and citizens want a say in deciding development priorities. Between 2010 and 2050, Asia’s urban population is projected to double in size to 3.2 billion—equivalent to an additional 100,000 urban residents each day. By 2050, two-thirds of Asia’s population will be urban (UN-Habitat 2015). This will bring enormous development challenges. Decision makers will have to deal with the effects of irreversible land conversion and habitat loss, hydrological changes, increased vulnerability to flooding, and rising pollution levels—all due to rising household consumption and demand for urban services.
There is a pressing need for a new paradigm to promote the quality of growth in the urban context that integrates these factors and more. In the long term, an integrated approach to urban development and environmental planning has the potential to make a substantial contribution to achieving the SDGs. Figure 7 illustrates the "Livable Cities Framework," developed by ADB as an approach to foster a balance of economic growth, social equity, and environmental sustainability in urban development in Asia (Sandhu et al. 2016). The framework provides a participatory, flexible, and scalable approach for local governments to prepare time-based, investment-oriented action plans and to leverage partnerships for developing livable cities. This approach brings together local communities, national ministries, implementing agencies, investors and other stakeholders in the planning, design, and implementation processes.

Inclusive Green Growth Index22
Many cities in Asia have already begun experimenting with this approach for sustainable investments in inclusive, environmentally sustainable, and climate-resilient cities. Georgia identified support for multi-sector strategies, new initiatives, and innovative funding mechanisms. These interventions will raise the essential elements of city livability, building upon the existing commercial, human, natural, cultural and tourism assets to support local economic growth for the benefit of the overall population. In Malaysia’s Melaka City, the Green City Action Plan contributed to maintaining competitiveness as a tourist and investment destination, keeping environmental challenges to a minimum, and establishing the city as a regional role model for livability. ADB also helped Melaka set up a database to track indicators in environment and economic growth. In Viet Nam, in the cities of Hue and Vinh Yen, and in Ha Giang province, this approach contributed to the goal of inclusive, climate-resilient urban development. Similar approaches are being used to improve the quality of life in Mongolia’s capital Ulaanbaatar by reducing air and environment pollution (Box 5). ASEAN is building on this approach and replicating practices by utilizing established Regional Cooperation Mechanisms, which represent a powerful network of stakeholders that have strong potential to accelerate the implementation of green growth strategies and projects.
Figure 7: The Livable Cities Framework
Elements
Liva
ble
Citie
s
Stat
us Q
uo o
f Citi
es
Urban profiling and action planning—analysis and synthesis
Enablers
“3E” Pillars for integrated development
Environment EquityEconomy
Policies
Strategies
Sector plans
Regulations
Finance
Governance
Institutions
Civil society
Private sector
GREEEN city action plans
Investment program
Financing mechanisms
Consensus building, visioning, and stakeholder ownership
Urban management partnerships
Peer -to-peer learning
Decision support systems
Skills training
Outputs
CompetitivenessService delivery e�ciencyInfrastructure, asset management, operation and maintenanceFinancial innovationPublic–private partnershipsRevenue generationEntrepreneurship and job creation
Natural resource e�ciencyLow-carbon technology Climate resilienceDisaster risk managementPollution management
InclusivenessAccessibilityA�ordabilityResilience
Source: Adapted from S. Sandhu et al. 2016. GrEEEn Solutions for Livable Cities. Manila: Asian Development Bank.

Raising the Quality of Growth 23
Box 5: Integrated Approaches to Mongolia’s Air Pollution Problems
Mongolia’s capital Ulaanbaatar has one of the world’s worst cases of air pollution—the result of poor infrastructure and heavy urban migration. Levels of particulate matter in the air have risen to almost 40 times the safe levels recommended by WHO, causing about 10% of deaths in the city. Air pollution-related health costs are estimated at 18%–28% of Ulaanbaatar’s total gross domestic product, and 8%–13% of the national gross domestic product.
The government’s strong commitment to tackle its air pollution problems is reflected in its roadmap to reduce these health risks, the National Program for Reducing Air and Environment Pollution, 2017–2025. The Asian Development Bank provided $130 million to support the program in a policy-based loan to address air pollution from governance, technology, and finance perspectives (ADB 2018a).
The policy actions focus on three reform areas: (i) improving the efficiency of the national program and the regulatory framework on air quality management; (ii) implementing urgent measures to reduce air pollution and protect health in Ulaanbaatar; and (iii) establishing mechanisms for environmentally sound and integrated urban, energy, and transport systems nationwide. These include an amended law for levies on pollutants, a new classification for the Excise Tax Law to enable imports of cleaner transport fuel, and expanding the use of district heating to displace the use of raw coal for winter heating.
Mongolia also plans to create and fund credit guarantee products for small and medium-sized enterprises engaged in air pollution reduction products or services as incentives to shift to a more efficient, safer, and greener building industry.
Source: Asian Development Bank. 2018a. Report and Recommendation of the President to the Board of Directors on a Proposed Policy-Based Loan Mongolia: Ulaanbaatar Air Quality Improvement Program. Manila.
Sector-Wide NexusClose links across different sectors are evident from the interactions among economic, social, and environmental perspectives of the IGGI. A prominent example is the exploitation of the water–energy–food–security nexus to attain greater efficiency in the use of financial, physical, natural, and human resources (Figure 8). The demand for water, energy, and food in developing Asia has grown rapidly, but this is not being sustainably managed because of population growth, rapid urbanization, and other factors. In the PRC, for example, the water–energy nexus is driven by the uneven distribution of water resources, which are under acute stress in parts of the country; inefficient water use in agriculture; and severe water pollution in most northern rivers (Perera and Zhong 2017). This situation illustrates how the IGGI’s economic, equity, and environmental pillars influence one another and can be used to avoid counterproductive decisions.
Traditionally, water, energy, and food resources were treated separately for resource management and policymaking and without much attention to their governance. But integrated management and policy choices within a common framework for water, energy, and food production and consumption can generate higher economic, social, and environmental benefits than individually (Figure 8). This approach can increase the scores of the IGGI pillars much more than the separate management of resources. The benefits will occur from reduced negative economic, social, and environmental externalities (or by-products), and improvements in the overall resource efficiency and policy coherence across the three pillars. These benefits, reflected in the indicator scores of the IGGI, can provide an assessment of net gains by shifting from separate to integrated management of these resources.

Inclusive Green Growth Index24
Figure 8: The Water–Energy–Food Nexus
Water for food and energy
Food for energy
Energy for food
• Irrigation, rainwater harvesting
• Hydroelectric power, power plant cooling
• Corn and sugar to produce biofuel
• Soybeans and palm oil to produce biodiesel
• Diesel pumps for irrigation
• Energy inputs for fertilizers
• Fuel for transport
Source: Authors.
It is relatively easy to generate energy and produce food but not water, dubbed the petroleum of the 22nd century. Indeed, water security is one of developing Asia’s greatest challenges and several countries are already experiencing shortages. Water demand from agriculture, industry, and households in the region is projected to increase by 30% to 40% by 2050 from current levels, and wastewater discharges are estimated to rise by 180% because of growing urban populations (OECD 2012). If the status quo holds, the demand for water in developing countries will outpace supply by 40% by 2030 (2030 WRG 2009). Because agriculture is heavily dependent on water, consuming 80% of developing Asia’s water resources, farmers will bear the brunt of this scenario.
Le Vernoy (2017) blames the main cause for Asia’s water-security problems from the rapid depletion of water on policies that place little value on water resources in the mistaken belief that they are inexhaustible. Setting up pricing mechanisms that internalize the cost of water use can improve water productivity. Promoting international trade in water can direct water-intensive production from water-abundant countries to water-stressed ones, and integrated design processes for water management encompassing technologies, policies, and institutions can help increase water security without adversely affecting energy or food security goals.
Reducing Institutional Risk The quality of governance or its inverse—institutional risk—can make a big difference in how IGGI scores can be improved. Good governance underpins the SDGs’ integrated agenda of economic development, social inclusion, and environmental sustainability (Schmidt-Traub 2015). Institutions are explicitly included in SDG 16—to promote peaceful and inclusive societies for sustainable development, provide access to justice for all, and build effective, accountable, and inclusive institutions at all levels (Box 6).

Raising the Quality of Growth 25
Good Governance and Quality of Growth Studies using the World Bank’s Worldwide Governance Indicators show that better governance generally correlates with higher economic growth (for example, Zhuang et al. 2015), and that more advanced economies have higher quality institutions (Figure 9).2 Better governance on most Worldwide Governance Indicators is also associated with improvements in broader development outcomes, including a lower incidence of extreme poverty, narrowed gender inequality, reduced maternal mortality and under-5 mortality rates, better access to sanitation, higher education attainment, and better infrastructure (Sen 2015). A stronger rule of law correlates with lower child mortality (Dawson 2010). Poor institutions inhibit public spending from improving health and education outcomes (Rajkumar and Swaroop 2008). Better governance also has a strong positive effect on a wide range of measures of child poverty and nutrition (Hallerod et al. 2013).
As expected, better governed countries are likely to make more development progress, as reflected in higher IGGI scores, than poorly governed ones (Figure 10). But the relationship is not straightforward. Better governance and a better development performance reinforce each other, so it pays to improve both (Jha and Zhuang 2014).
2 The World Development Indicators are made up of six indicators: control of corruption, government effectiveness, political stability and absence of violence, regulatory quality, rule of law, and voice and accountability.
Box 6: Governance and Institutions—Enablers of Inclusive Green Growth
Governance refers to entire systems of political establishments and traditions that determine policy, how it is implemented, and what its outcomes are. Institutions are human-devised constraints that shape human interactions. Institutions can be formal or informal. Core formal institutions include constitutions, statutes, and explicit government rules and regulations. Informal institutions refer to broader societal norms, values, cultures, and unwritten rules, such as traditions, codes of behavior, and social mechanisms. Institutions are effective when legal frameworks are implemented well.
A lack of effective and fair institutions exposes countries to institutional risks, such as corruption, inefficiency, and weak enforcement of the rule of law, which can adversely affect Inclusive Green Growth Index indicators, scores, and rankings.
Improving governance and strengthening institutions is a priority international development agenda. Asian Development Bank stakeholder surveys rank governance among the top development concerns in Asia. Multilateral development banks put a high weighting on governance for concessional funding, such as through the World Bank’s International Development Association, which helps world’s poorest countries, and the Asian Development Bank’s Asian Development Fund.
Sources: ADB. 2013. Asian Development Outlook 2013 Update: Governance and public service delivery. Manila; OECD. 2015. “Building more effective, accountable, and inclusive institutions for all.” OECD and Post-2015 Reflections Series, Element 6. Paris.

Inclusive Green Growth Index26
Figure 9: Institutional Risk by Country, 2015
0 20 40 60 80 100
Afghanistan
Tajikistan
Kyrgyz Republic
Pakistan
Cambodia
Azerbaijan
Papua New Guinea
People’s Republic of China
Maldives
Armenia
Philippines
Turkey
Sri Lanka
Georgia
Bhutan
Republic of Korea
France
United States
Singapore
United Kingdom
Ireland
Austria
Netherlands
Sweden
Finland
Switzerland
Myanmar
Uzbekistan
Bangladesh
Nepal
Lao PDR
Timor-Leste
Kazakhstan
Viet Nam
Indonesia
Thailand
India
Mongolia
Fiji
Malaysia
Japan
Germany
Australia
Denmark
Canada
New Zealand
Spain
Portugal
Belgium
Norway
Luxembourg
Italy
Lao PDR = Lao People’s Democratic Republic.Note: Figure based on the World Bank’s Worldwide Governance Indicators scoring of 0 to 100, before normalization to the scores of 1 to 6 to be comparable to Inclusive Green Growth Index scores. Orange shows countries in developing Asia; blue Organisation for Economic Co-operation and Development countries.Sources: World Bank, Worldwide Governance Indicators (accessed 18 May 2018); authors.

Raising the Quality of Growth 27
Illustrating the Relationship We turn to geometry to illustrate this complex relationship in the form of a pyramid with the IGGI pillars forming its triangular base and a new indicator of institutional risk as it height. First, to represent the IGGI, we draw a triangle whose sides are determined by the scores of its three pillars (ranging from 1 to 6). When all the pillars have identical scores (that is, a country is performing equally well on all three pillars), this is shown as an equilateral triangle (sides equal to the score). In this case, the performance gap between the pillars is zero, so that the pillars are balanced and the IGGI score is the same as the Balanced IGGI score. If the performances of the pillars differ, the triangle’s sides also differ. A larger imbalance across the pillars shows up in a more skewed triangle and a low cross-pillar balance pulls down the IGGI score considerably.
We define the institutional risk as the gap between the maximum potential and actual scores of aggregated Worldwide Governance Indicators. Before calculating the gap, we first normalize the indicator scores from the widely used 0—100 range to the range of 1 (worst) to 6 (best) to make it comparable with the IGGI’s scores. Therefore, the scores of institutional risk—the inverse of governance indicators—range from 6 (worst) to 1 (best), with a higher score indicating a weaker performance than a lower score, showing that good governance will reduce institutional risk while weak governance will raise it.
Adding institutional risk as the height of the IGGI triangle converts it into a pyramid—the Institutional Risk IGGI pyramid. When a country’s performance in all three IGGI pillars is equal, this pyramid has a stable base. The ideal IGGI triangle (with the highest possible score of 6 on each pillar) depicts the first-best outcome of the IGGI and creates the largest possible and stable base (Figure 11, panel a). In this scenario, if the quality of governance is at its highest level (no institutional risk), the pyramid’s height is zero and it collapses into a perfectly flat pyramid. Getting IGGI scores to achieve such a flat pyramid shows that a country has the institutions that help it to attain the highest degree of resilience to shocks and crises. But an unbalanced base results in a tall and “wobbly”
Figure 10: Good Governance and the Inclusive Green Growth Index, 2015
Afghanistan AzerbaijanBangladeshNepal
Bhutan
People’s Republic of China
Fiji
Finland
Georgia
India
Indonesia
Japan
Republic of Korea
Lao People’s Democratic Republic
Luxembourg
Malaysia
MaldivesMongolia
Myanmar
Norway
Pakistan
Kyrgyz Republic Philippines
Spain
Sri Lanka
SwedenSwitzerland
Thailand
United KingdomUnited States
Viet Nam
Iceland
R2 = 0.4734
0
1
2
3
4
5
6
0 1 2 3 4 5 6
Goo
d go
vern
ance
scor
e
Inclusive Green Growth Index
Notes: The good governance score (1–6) is calculated from the normalized summation of six World Bank Worldwide Governance Indicators: control of corruption, government effectiveness, political stability and absence of violence, regulatory quality, rule of law, and voice and accountability. Both the good governance and Inclusive Green Growth Index scores range from 1 (worst) to 6 (best). Yellow shows countries in developing Asia; blue Organisation for Economic Co-operation and Development countries. Sources: World Bank, Worldwide Governance Indicators (accessed 18 May 2018); authors.

Inclusive Green Growth Index28
pyramid illustrative of a weak economy that is vulnerable to shocks and crises. Later in this section, we discuss how the pyramid can be used in practice by applying it to three countries.
To stabilize and sustain inclusive green growth, a country needs to increase its performance in all three pillars, so that the pyramid’s base enlarges; maintain cross-pillar balance to stabilize the base of the pyramid; and minimize the institutional risk by improving the quality of governance to keep the pyramid’s height low. To further illustrate the value of such a depiction, we show regional pyramids for developing Asian regions (Figure 11, panels b–f). These are shown for 2005 and 2015 to compare the changes in each of the pillar scores and in institutional risk performance.
Central Asia (panel b) reduced institutional risk and improved its performance in the social equity pillar in 2015, but its scores for the economic growth and environmental sustainability pillars declined. Despite imbalances in performance across pillars in East Asia, the region’s low institutional risk resulted in a desired short pyramid
Figure 11: Institutional Risk Inclusive Green Growth Index Pyramid for Asia Regions, 2005 and 2015
Institutional risk:4.43 (2015)4.73 (2005)
Economic growth: 3.96 (2015)4.28 (2005)
Social equity: 4.55 (2015)4.18 (2005)
Environmental sustainability:2.41 (2015)2.82 (2005)
Institutional risk:3.52 (2015)3.31 (2005)
Economic growth: 4.03 (2015)4.59 (2005)
Social equity: 4.50 (2015)4.40 (2005)
2.42 (2015)3.17 (2005)
Institutional risk:4.47 (2015)4.34 (2005)
Economic growth: 3.91 (2015)3.92 (2005)
Social equity: 3.75 (2015)3.33 (2005)
Environmental sustainability:
Environmental sustainability:
3.24 (2015)3.61 (2005)
Institutional risk:4.30 (2015)4.33 (2005)
Economic growth: 4.38 (2015)4.23 (2005)
Social equity: 4.13 (2015)3.89 (2005)
Environmental sustainability:3.21 (2015)3.62 (2005)
Institutional risk:3.67 (2015)3.45 (2005)
Economic growth: 3.88 (2015)3.95 (2005)
Social equity: 4.34 (2015)3.96 (2005)
Environmental:3.91 (2015)4.79 (2005)
b. Central Asiaa. Full Performance and No Institutional Risk
c. East Asia d. South Asia
e. Southeast Asia f. Pacific
Institutional risk: 1
Economic growth: 6
Environmental sustainability: 6
Social equity: 6
Notes: To illustrate each region’s performance, Inclusive Green Growth Index scores for 2005 and 2015 are used. Positive developments in 2015 are shown in green and negative trends in red. The three pillar scores range from 1 (worst) to 6 (best), while the corresponding scores of institutional risk range from 6 (worst) to 1 (best), with a higher score indicating a weaker performance than a lower score.Source: Authors.

Raising the Quality of Growth 29
(panel c). South Asia (panel d) continued to suffer from high institutional risk—the highest in Asia. South Asia’s Institutional Risk IGGI pyramid is therefore very tall, which shows that even with a more balanced performance across the pillars, the region is still vulnerable to shocks and crises. High institutional risk in Southeast Asia (panel e), coupled with a lower performance in the environmental sustainability pillar relative to the other pillars, resulted in poor cross-pillar balance. The Pacific (panel f, Fiji only) had low institutional risk and more balanced performance across the pillars. The countries that need good governance and high-quality institutions the most have the least capacity to develop their institutions.
Country Examples: People’s Republic of China, India, and Indonesia To understand how the pyramid can be used in practice, we use three country examples—the PRC, India, and Indonesia. In the PRC, despite strong yearly GDP growth of 9.7% between 1980 and 2016, socioeconomic disparities persist, and the country faces environmental problems and threats posed by climate change. To deal with these issues, the government set on a path to build a “harmonious” society in its 11th Five-Year Plan, 2006–2010 and supported this with a policy for regionally balanced and environmentally sustainable growth in the 12th Five-Year Plan, 2011–2015. The emphasis on these priorities continues in the 13th Five-Year Plan, 2016–2020. The slowdown in economic growth from 7.3% in 2014 to 6.9% in 2015 and to 6.7% in 2016 shows the country is shifting toward inclusive growth and sustainable development.
This strategy can be seen in the IGGI’s score for the PRC for 2005, 2010, and 2015 (Table 3). In 2005, with an IGGI score of 4.27, the country ranked second among 24 developing Asian economies used in the sample for that year. This score is based on the PRC’s scores in the economic growth (5.20), social equity (4.59), and environmental sustainability (3.03) pillars. Its low environmental score led to a high gap across the pillars, which reduced its Balanced IGGI score to 3.60, compared with 4.27 for the IGGI. These gaps in performance across the pillars pushed back the PRC’s ranking from second in the IGGI to 22nd for the Balanced IGGI. A similar pattern emerged in 2010 and 2015, again mainly because of low and falling scores in the environmental pillar.
Table 3: Inclusive Green Growth Index—Performance in the People’s Republic of China, India, and Indonesia in 2005, 2010, and 2015
ScoreEconomic
Growth Social EquityEnvironmental Sustainability IGGI
Rank for IGGIa
IGGI Adjusted for Cross-Pillar
Balance
Rank for Balanced
IGGIb
People’s Republic of China2005 5.20 4.59 3.03 4.27 2 3.60 222010 4.98 4.63 2.69 4.10 3 3.42 212015 4.80 4.56 2.51 3.96 5 3.42 21India2005 4.35 3.07 3.21 3.54 23 3.65 202010 4.32 3.41 3.01 3.58 22 3.59 202015 4.39 3.44 2.84 3.56 21 3.54 19Indonesia2005 4.50 3.83 3.32 3.88 11 3.98 142010 4.71 4.14 3.32 4.06 4 3.91 152015 4.63 4.05 3.41 4.03 3 4.09 7
IGGI = Inclusive Green Growth Index.Notes: Scores range from 1 (worst) to 6 (best).a Data for 2010 covers 26 Asian economies. Afghanistan and Myanmar were not part of the 2005 sample (24 countries), and Tajikistan was not part of the 2015 sample (25
countries).b The higher the total gap across pillars, the lower the adjusted Balanced IGGI score. Source: Authors.

Inclusive Green Growth Index30
A breakdown of the environmental pillar for the PRC into its indicators shows that low rankings on carbon dioxide emissions, energy intensity, and renewable freshwater resources pushed the country to a lower Balanced IGGI score and ranking compared with the IGGI. Its renewable energy and air pollution indicators also ranked low. The areas to monitor are not limited to the environmental sustainability pillar, however. On the economic growth pillar, the PRC’s age dependency ratio has been steadily increasing, while its household savings rate has been falling, partly because of rapid population aging. This trend is expected to continue in the coming decades. The PRC’s elevated Gini coefficient and poverty gap in its social equity pillar are worrisome and underscore the need to measure and monitor developments in these areas. The lower Balanced IGGI scores support the underlying basis for the PRC’s shifting focus on development and the need for policy actions that are aligned with the country’s goals to achieve a higher quality of growth. A continued emphasis on social equity and environmental sustainability by identifying the gaps across the three pillars and prioritizing resources for lagging areas should help the PRC score better on the Balanced IGGI.
India had a more balanced performance across the pillars in 2005, with its IGGI score of 3.54 improving to 3.65 on the Balanced IGGI (Table 3). However, it was a weak performer overall, ranking among the bottom six countries. Over time, India sustained its scores in the growth pillar and made improvements on the social front, but it fell significantly behind in the environmental pillar. This resulted in a stagnant IGGI score and declining Balanced IGGI score, without much change in ranking between 2005 and 2015.
Since the early 1990s, India’s strong economic growth has increased employment opportunities and lifted millions of people out of poverty. But the environment suffered in the process, with damage to the environment estimated to cost the economy $80 billion a year, or 5.7% of GDP (World Bank 2014). Much remains to be done to ensure that future growth is broader based to reduce extreme poverty, improve access to sanitation and health care, increase school enrollment and the quality of education, and narrow gender gaps in labor force participation and wages. The government, however, is intensifying its efforts to provide universal social security with two new schemes aimed at expanding coverage and universalizing India’s social and health insurance system (Box 2). Given India’s weak performance in the social equity pillar, these programs, if successful, should enable the country to realize more inclusive growth.
In Indonesia, significant improvements to economic growth and the social equity pillars in 2010 resulted in higher IGGI scores compared with 2005, when the country ranked fourth in the index. But the weak performance in the environmental sustainability pillar resulted in imbalances across the pillars, thus reducing its ranking from 4 in the IGGI to 15 on the Balanced IGGI in 2010. This was also the case in 2015, but the imbalance narrowed given the improvement in the environmental sustainability score. For Indonesia to achieve inclusive and sustainable growth, it needs to tackle persisting constraints to higher quality of growth. These include unequal access to and the poor quality of education, particularly secondary and vocational education; insufficient and poor-quality infrastructure, particularly in transport and electricity; and bouts of terrorism.
Indonesia needs to fuel its growing economy and at the same time address mounting environmental concerns. The country has the largest geothermal resources in the world, but installed capacity, at 1,300 megawatts (MW), is just 5% of the potential resources that could be used (ADB 2016). The government, however, is intensifying efforts to encourage geothermal power development and expand capacity from 1,858.5 MW in 2017 to 7,241.0 MW by 2025 (ADB 2018b). Making greater use of geothermal energy resources will provide Indonesia with an opportunity to use renewable energy to drive economic growth, improve the well-being of citizens, and mitigate the risks of climate change.

Raising the Quality of Growth 31
Strengthening the Foundations of Inclusive and Sustainable Growth Improving a country’s IGGI scores will entail strengthening the index’s foundations of quality infrastructure, well-functioning markets, modern technology, and ensuring people’s liberties. The availability of quality infrastructure, such as all-weather roads and decent public transport, encourages girls to go to school and improves a country’s educational and gender record and social security. Well-developed financial markets provide a formal means for workers to save for old age and entrepreneurs to borrow for investing, both of which increase growth. Access to modern technology, such as the internet and TV, builds knowledge and increases productivity and earnings, which contribute to growth. The freedom of people, and their safety and security, give them the option to exercise their rights, seek entitlements, and do and achieve what they want. All these are among the foundations of inclusive and sustainable growth.
While institutions provide an enabling environment for inclusive sustainable growth, investments in the development of these foundations can directly facilitate and drive improvements in the IGGI’s indicators. Some other measures of inclusive green growth include these foundations as components of these measures. By excluding the foundations from the definition of the IGGI, we try to disentangle the causes from the effects. We now examine where Asia stands in these drivers for inclusive green growth and how they relate to the IGGI.
Infrastructure plays a vital role in determining a country’s long-term growth and development. For example, a 7%–10 % increase in power, transport, and telecommunication infrastructure can increase a country’s output by 1% (Calderón, Moral-Benito, and Servén 2011). Better roads, electricity supply, and sanitation facilities can significantly reduce poverty and income inequality, as has been observed in developing Asian countries (ADBI 2009). Comparing the IGGI with the overall quality of infrastructure also shows similar patterns of positive association across the region (Figure 12). The quality of infrastructure depends on a well-functioning institutional set up of public sector agencies across ministries and departments for planning and coordination, alignment with regulations, and standards and procedures (ADB 2017). The institutional system for infrastructure is also driven
Figure 12: Inclusive Green Growth Index and Infrastructure Quality Relationship, 2015
R2 = 0.209
1
2
3
4
5
6
2 3 4 5 6 7
Incl
usiv
e G
reen
Gro
wth
Inde
x
Global Competitiveness Index: Quality of Overall Infrastructure
Notes: The World Economic Forum’s quality of overall infrastructure indicator in its Global Competitive Index captures the level of general infrastructure (for example, transport, telephony, and energy) in a country. 1 = extremely underdeveloped; 7 = extensive and efficient by international standards. Sources: World Economic Forum, Global Competitiveness Index dataset 2007–2017; authors.

Inclusive Green Growth Index32
by capable engineers, contractors, consultants, and suppliers, backed by technology and private sector resources. The IGGI is influenced by the effectiveness of the institutional systems.
The logistical performance of trade and transport infrastructure is positively related to the IGGI (Figure 13). This shows that perceptions of stronger logistics efficiency are consistent with higher inclusive and sustainable growth. This is supported by the finding that active trade and foreign direct investment are the foundations of Asia’s economic success and essential for continuing solid growth (ADB 2018c).
Figure 13: Inclusive Green Growth Index and Logistics Performance Index Relationship
R2 = 0.0808
1
2
3
4
5
6
1 2 3 4 5
Incl
usiv
e G
reen
Gro
wth
Inde
x, 2
015
Logistics Performance Index, 2016
Note: The World Bank’s Logistics Performance Index 2016 ranks countries on six dimensions of trade, including customs performance, infrastructure quality, and timeliness of shipments. These are increasingly recognized as important to development.Sources: World Bank, World Development Indicators Database (accessed 18 May 2018); authors.
Access to information and communication technology (ICT) is expanding across developing Asia, but its spread is uneven. ICT access, as measured by the number of mobile subscriptions and internet users, is positively correlated to the IGGI; that is, wider access to the two is associated with higher scores in the index (Figure 14). The World Economic Forum’s Networked Readiness Index measures how effectively a country uses ICT to boost competitiveness and well-being. The index captures how countries are performing in a digital world in overall readiness (infrastructure, affordability, and skills, for example), and their use of ICT by individuals, businesses, and government.

Raising the Quality of Growth 33
Figure 14: Inclusive Green Growth Index and Information and Communication Technology Access Relationship, 2015
R2 = 0.2603
1
2
3
4
5
6
0 20 40 60 80 100
Incl
usiv
e G
reen
Gro
wth
Inde
x
Internet users, % of population
R2 = 0.0596
1
2
3
4
5
6
0 50 100 150 200 250
Incl
usiv
e G
reen
Gro
wth
Inde
x
Mobile cellular subscriptions per 100 people
Notes: 1. The World Development Indicators Database defines internet users as individuals who have used the internet from any location in the last 3 months. It defines
mobile cellular telephone subscriptions as subscriptions to a public mobile telephone service using cellular technology. 2. The Inclusive Green Growth Index scores range from 1 (worst) to 6 (best); the sample includes developing Asia and Organisation for Economic Co-operation and
Development countries.Sources: World Bank, World Development Indicators Database (accessed 18 May 2018); authors.

Inclusive Green Growth Index34
Figure 15 shows that more developed financial markets, captured by the financial market development pillar of the Global Competitive Index and the Chinn-Ito Index on Financial Openness, translates into higher IGGI scores.
According to Amartya Sen’s capability approach, a person’s well-being is affected by economic resources as well as conditions that increase individual capability, such as having the freedom to do something that is valued, regardless of whether it is done or not (Stiglitz, Sen, and Fitoussi 2009). Social norms and cultural traditions play a strong role in improving capabilities. Physical safety, respect for human rights and fundamental freedoms,
Figure 15: Inclusive Green Growth Index and Financial Market Development Relationship, 2015
R2 = 0.0641
1
2
3
4
5
6
0.0 0.2 0.4 0.6 0.8 1.0
Incl
usiv
e G
reen
Gro
wth
Inde
x
Chinn-Ito Index on Financial Opennessb
R2 = 0.1755
1
2
3
4
5
6
1 2 3 4 5 6
Incl
usiv
e G
reen
Gro
wth
Inde
x
Global Competitiveness Index: Financial Market Developmenta
Notes: a The financial market development pillar of the World Economic Forum’s Global Competitive Index has eight indicators: availability of financial services,
affordability of financial services, financing through local equity markets, ease of access to loans, venture capital availability, soundness of banks, regulation of securities exchanges, and legal rights.
b The Chinn-Ito Index measures a country’s degree of capital account openness. Sources: World Economic Forum, Global Competitiveness Index dataset 2007–2017; Menzie D. Chinn and Hiro Ito. 2006. “What Matters for Financial Development? Capital Controls, Institutions, and Interactions.” Journal of Development Economics. 81 (1): 163–192; authors.

Raising the Quality of Growth 35
promoting tolerance, and eliminating discrimination all contribute to a higher quality of life. To measure this foundation of the IGGI, the following indicators from the Social Progress Index are adopted: (i) personal rights that enable a person to participate freely in society, including political rights, rights of association and expression, and the right to own property; (ii) personal freedom and choice; (iii) tolerance and inclusion; and (iv) personal safety. Figure 16 shows that on average personal freedom and choice, tolerance and inclusion, and personal safety are associated with higher IGGI scores. But personal rights, which also have an institutional dimension, show no discernible relation with the IGGI. What clearly emerges from this is that the IGGI’s score rises in unison with people’s capacity to experience full rights, personal freedom, tolerance, and safety.
Figure 16: Inclusive Green Growth Index and Civil Liberties, Safety, and Security Relationship, 2015
R2 = 0.3844
1
2
3
4
5
6
20 40 60 80 100
Incl
usiv
e G
reen
Gro
wth
Inde
x
Social Progress Index: Personal freedom and choice
R2 = 0.1729
1
2
3
4
5
6
0 20 40 60 80 100
Incl
usiv
e G
reen
Gro
wth
Inde
x
Social Progress Index: Personal safety
Notes: The Social Progress Index’s imperatives on personal freedom and choice are the component score using the average of five indicators: freedom over life choices, freedom of religion, early marriage, satisfied demand for contraception, and perceived level of public sector corruption. The index’s personal safety component is the score using the average of five indicators: homicide rate, violent crime, perceived criminality, political terror, and traffic deaths. Sources: Social Progress Index online database (accessed 18 May 2018); authors.

36
The analytical case for inclusive green growth is solid. This pattern of growth can improve current living standards and promote the equitable welfare of future generations. Higher economic growth can spur production, increase incomes, improve labor productivity, and encourage innovation. Greater inclusiveness can create jobs and reduce poverty, resulting in better welfare through distributional effects. Green policies can generate environmental benefits and increased resilience to shocks from natural hazards. To achieve these objectives, countries need to do more.
Leveraging Finance for Inclusive Green GrowthAccess to finance will be critical for effectively implementing an inclusive green growth agenda. At the 2017 annual meetings of the World Bank and International Monetary Fund, their Development Committee, representing 189 countries, highlighted the need for financing at an unprecedented scale to meet global and national development goals. National development priorities consistent with country responses to SDGs and national plans under the Paris climate change agreement will need to be integrated with national development plans and budgets. The Paris Agreement underscores the need for external financing to help developing countries implement their nationally determined contributions on climate action and help them adapt to climate change. The need will be greatest in low-income countries, which qualify for concessional financing from multilateral development banks.
It is estimated that meeting the SDGs globally will require $5 trillion to $7 trillion a year from 2015 to 2030 (UNCTAD 2014). This is equivalent to additional public financing, beyond public expenditure levels in 2013, of 27% of the GDP of low-income countries and 7% of lower-middle-income countries (Schmidt-Traub 2015). ADB estimates that developing Asian countries will need to invest $1.7 trillion a year in infrastructure over the same period for the region to maintain its growth momentum, eradicate poverty, and respond to climate change (ADB 2017).
The fiscal positions of most Asian countries worsened after the 2008 global financial crisis and have not recovered to precrisis levels (Kose et al. 2017); this poses difficulties in making fiscal adjustments. Most of the region’s low- and middle-income countries do not adequately tap their tax bases for income, profits, assets, and capital gains, focusing instead on taxing sales of goods and services to drive government revenue. But even if all these sources of revenue were fully utilized, governments would still not have enough resources to tackle the new development agenda.
The private sector can make a substantial contribution to global development. For environmental sustainability, the financial sector can play a vital role in shifting investments toward more resource- efficient technologies and business models and away from fossil fuels and industries that are heavy users of natural resources. Green financing has so far tended to focus on bonds to raise funds based on the strength of corporate or government
Putting the Inclusive Green Growth Index into Practice

Putting the Inclusive Green Growth Index into Practice 37
balance sheets and not for specific projects. But a large part of the green-growth momentum lies in a pipeline of environmentally sustainable infrastructure projects that can attract private sector finance.
One of the biggest obstacles to attracting private sector capital for green financing is the thin pipeline of bankable green infrastructure projects and the quantification of green targets. Here, governments and their development partners can step in to mitigate some of the risks associated with public infrastructure projects, such as the unpredictability of revenues, land acquisitions, and construction periods, lack of long-tenure financing, and insufficient institutional capacity to lessen environmental and social risks (Mehta et al. 2017). Partnerships across national, institutional, and public–private boundaries must be encouraged to leverage this potentially vast source of financing for development.
Development banks can play a significant role in financing green investments and leveraging the private sector’s considerable resources. The Green Finance Catalyzing Facility is an ADB initiative that combines concessional finance with policy conditions to incentivize green outcomes in development projects. The facility covers projects that can be retrofitted, thereby linking the channeling of finance to investments to drive environmental sustainability (Mehta et al. 2017). The facility is envisaged as a national or regional green financing vehicle to help countries design bankable projects with green targets linked to financial incentives. These incentives are sourced from pooling finance from concessional, nonconcessional, and private financing sources. ADB’s financing support for renewable energy in Indonesia is a good example of the important role that development banks can play in providing finance for development sectors (Box 7).
Box 7: Boosting Indonesia’s Geothermal Power Potential
Indonesia has an estimated potential of 29,000 megawatts (MW) of geothermal energy resources—the largest in the world. But installed geothermal power capacity was only 1,800 MW in 2017, less than 10% of the potential. If fully tapped, this sustainable energy source for generating electricity could provide a big boost to economic activity and help diversify the country’s energy mix. Reducing a heavy dependence on fossil fuels will be essential for Indonesia to achieve its commitment to reduce carbon dioxide emissions by 29% by 2030 in its contribution to climate change mitigation. Increasing the use of renewable energy will be an important part of this effort.
To help Indonesia get closer to this goal, the government awarded the concession to build the Rantau Dedap Geothermal Power Project in South Sumatra in 2010. The project is expected to generate over 90 MW of electricity for up to 130,000 homes, create jobs, and avoid over 400,000 tons of carbon dioxide emissions a year by 2021.
To attract investors to such a long-term project, the Asian Development Bank (ADB), along with the Japan Bank for International Cooperation, Mizuho Bank Ltd., MUFG Bank Ltd., and Sumitomo Mitsui Banking Corporation, provided financing for the project. As guarantor, Nippon Export and Investment Insurance provided political risk cover of 100% and commercial risk cover of 90%. The project’s proponents are Indonesian geothermal power developer PT Supreme Energy, Japanese trading and investment company Marubeni Corporation, Japanese power utility Tohoku Electric Power Co., and French multinational electric utility company ENGIE.
The first phase of the project started in 2014 with geothermal resource exploration and drilling. ADB provided a $50 million loan from its Clean Technology Fund to share risks with the private sector during this phase of the project. This initial funding helped to confirm Rantau Dedap’s geothermal resource potential, enabling the project to proceed to the construction and operation phases. At the time of writing, the project was in its second phase of steam-field development and the power plant’s construction. ADB’s assistance for this phase includes a long-term loan of up to $175.3 million.
ADB’s phased financing showed that adequate risk protection enabled the private sector to successfully develop geothermal projects in Indonesia. ADB has also supported the Sarulla and Muara Laboh geothermal power projects. The guarantees and financing for these projects show that multilateral development banks, by taking some early risks out of the resource-intensive geothermal sector with risk guarantees and initial project financing, can help long-term projects for development that require substantial funding to get off the ground.
Source: Asian Development Bank. 2018b. Report and Recommendation of the President to the Board of Directors on a Proposed Loan and Administration of Loan PT Supreme Energy Rantau Dedap: Rantau Dedap Geothermal Power Project (Phase 2) Republic of Indonesia. Project Number 50330-001. Manila.

Inclusive Green Growth Index38
Setting Country PrioritiesBecause of limited public funds, governments must set development priorities and align investment decisions with broader sustainability objectives. The Balanced IGGI is a useful guide for identifying leading and lagging areas to set country priorities.
Based on 2015 data, we examine how countries in developing Asia can prioritize the IGGI’s three pillars (Figure 17). Using a ranking of 1 for the lowest score (needing the most attention) to 3 for the highest score (needing least attention), we find that nine out of a sample of 24 countries in the region focused more on
Figure 17: Inclusive Green Growth Index Priorities in 24 Asian Countries, 2015
Country
Afghanistan
Armenia
Azerbaijan
Bangladesh
Bhutan
Cambodia
People's Republic of China
Fiji
Georgia
India
Indonesia
Kazakhstan
Republic of Korea
Kyrgyz Republic
Lao PDR
Malaysia
Maldives
Mongolia
Myanmar
Nepal
Pakistan
Philippines
Sri Lanka
Thailand
Viet Nam
Economic Growth
2
2
2
3
1
3
3
1
2
3
3
2
2
2
3
2
2
2
3
2
3
3
2
2
2
Social Equity
1
3
3
2
3
2
2
3
3
2
2
3
3
3
2
3
3
3
2
3
2
2
3
3
3
Environmental Sustainability
3
1
1
1
2
1
1
2
1
1
1
1
1
1
1
1
1
1
1
1
1
1
1
1
1
Lao PDR = Lao People’s Democratic Republic.Note: 1 = lowest score (needing the most attention); 3 = highest score (needing least attention).Source: Authors.
Putting the Inclusive Green Growth Index into Practice 39
economic growth than on the other two pillars. Not surprisingly, environmental sustainability remains the most neglected of the three pillars. The regional performance on social equity lies in between. Two countries stand out on social equity, for very different reasons: Afghanistan and Bhutan. Creating an equitable society is of paramount importance in Afghanistan, while Bhutan’s guiding philosophy of “gross national happiness” has enabled it to perform well on social equity, and economic gains are shared well in this country. But to sustain this, Bhutan will need to grow its economy. In general, focusing on the environmental sustainability pillar is the top priority for almost all the countries in the sample if they want to achieve greater cross-pillar balance.
Fostering Inclusive Green Growth The pursuit of growth while improving social equity and environmental sustainability can be illustrated by using a tree as an analogy (Figure 18). A tree is secured to the ground by its roots, which draw water and nutrients from the soil for nourishment. In the same way, the availability of physical infrastructure, well-developed financial
Figure 18: Striving for Inclusive Green Growth: A Tree Analogy
Stro
ng in
stitu
tions
Airpollution
Povertygap
Gini coe cient
GDP per capita
Water productivity
Access toelectricity
Renewablefreshwater resources
Adjusted net
savings
HH MarketConcentration
Index
Tradeopenness
Life expectancy gender gapNatural
resource rent
Municipalwaste
Hunger
IGGI foundations
Agedependency
ratio
Inverse CV of GDP per
capita
Life expectancy
at birth
Quality ofeducation
Labor force participation gender gap
Employment population
ratio
Gross general
government debt
Carbon dioxide
per GDP Energy intensity of
primary
Mean years of
schooling
Primary completion
rate
Use of renewable
energy
National parliament
gap
Primary enrolment gender gap
Access to improved
water
Access to improved sanitation
CV = Coefficient of Variation, GDP = gross domestic product, HH = Hirschman-Herfindahl, IGGI = Inclusive Green Growth Index.Note: The orange circles are IGGI indicators on the economic growth pillar, the blue circles are social equity pillar indicators, and the green circles environmental sustainability pillar indicators. White circles are indicators excluded in the measuring the IGGI because of lack of data.Source: Authors.

Inclusive Green Growth Index40
markets, access to modern technology, and reliable safety and security are the foundations of inclusive green growth, acting like roots that nourish better-quality growth. Just as energy from sunlight and carbon dioxide from air, though invisible, are vital for a tree’s growth, strong institutions and good governance, though intangible, foster an inclusive green growth agenda by promoting sound policies that prioritize investments that support the IGGI, indicated by the upward arrow on the tree trunk in Figure 18. And because trees will not grow without sunlight or air, strong institutions are essential for inclusive green growth. The downward arrow on the tree trunk in Figure 18 suggests that as an economy moves to a higher quality of growth, strong institutions in turn influence and facilitate long-term improvements in the foundations of the IGGI.

41
Enhancing welfare across generations and sustaining a clean environment are the hallmarks of a high quality of growth and the basis for the new global development agenda. This study launched the Inclusive Green Growth Index to measure the quality of growth through the three pillars of economic growth, social equity, and environmental sustainability. By covering a more comprehensive set of indicators of a country’s development performance, this new metric reflects current realities and global commitments more accurately than other measures.
Applying the IGGI for developing Asia shows that of the three pillars, environmental sustainability needs the most attention in almost all countries, and this is the highest priority area for investments in development. Although the geographic focus of this study is Asia, the IGGI can be applied in all country and regional settings, and for all levels of development.
Other indices for measuring the quality of growth may not always provide the appropriate policy guidance. For example, the World Happiness Index, which is based on an individual’s subjective perceptions, does not capture the full economic, social, and environmental impact of national and regional economic shocks or the weather disasters that damage natural capital. Because the IGGI’s indicators include the stocks of this capital (water, land, and forests, for example), damage from these disasters will be reflected in the IGGI’s measurement of a country’s performance.
With close to half of Asia’s population living in urban areas, improving the quality of growth will require that decision makers and their development partners understand the cross-sector nature of urbanization, which calls for integrated approaches to sectors and agencies. Given the complexity of development challenges, integrated approaches can promote good governance and strong institutions to create an enabling environment for the IGGI to rise higher. Sound economic policies are also important catalysts to enable high IGGI scores by building on these foundations. But this is not enough. Strong foundations for a better quality of growth manifested in quality infrastructure, well-functioning markets, modern technology, and ensuring people's liberties are also needed.
Strengthening the foundations for a better quality of growth will take huge investments. Higher tax revenues will be important to boost domestic finance, but this alone will not be enough. To meet the newer and more complex development and economic challenges, such as climate change, widening inequality, and finding new sources of growth, countries must increase external financing from the new and established lenders for development and make greater use of private sector financing. Doing this will go a long way toward putting developing countries on the path of inclusive green growth by inducing prosperity and reducing disparities.
Conclusion

42
Pros Cons• Can summarize complex, multidimensional
realities to support decision makers• Easier to interpret than many separate indicators• Can assess progress of countries over time• Reduces the size of a set of indicators without
reducing the information base• Make it possible to include more information
within size limits• Puts issues of country performance and progress
at the center of the policy arena• Facilitates communication with the public
(citizens, media, and so on), and promotes accountability
• Helps to construct and underpin narratives for practitioners and nonpractitioners
• Enables users to compare complex dimensions• Provides a signal on which indicators underlying a
composite index need to be closely examined by governments
• May send misleading policy messages if poorly constructed or misinterpreted
• May invite simplistic policy conclusions• May be misused; e.g., to support a desired policy if
the construction process is not transparent or lacks sound statistical or conceptual principles
• Selection of indicators and weights could be a source of political dispute
• May disguise serious failings in some dimensions, and increase the difficulty of identifying remedial action if the process is not transparent
• May lead to inappropriate policies if dimensions of performance that are difficult to measure are ignored
• Because aggregation methods are fixed, there is little room for priorities to change, and the interpretation of the indices becomes less clear
Sources: M. Nardo, M. Saisana, A. Saltelli, S. Tarantola, A. Hoffmann, and E. Giovannini. 2008. Handbook on Constructing Composite Indicators. Paris: Organisation for Economic Co-operation and Development; U. Narloch, T. Kozluk, and A. Lloyd. 2016. “Measuring Inclusive Green Growth at the Country Level: Taking Stock of Measurement Approaches and Indicators.” Green Growth Knowledge Platform Working Paper 02/2016. Geneva; J. E. Stiglitz, A. Sen, and J. P. Fitoussi. 2010. Report by the Commission on the Measurement of Economic Performance and Social Progress. Paris.
Pros and Cons of Composite Indices
APPENDIX 1

43
Description of Indicators and Data Sources
APPENDIX 2
Pillar Indicator Description Data Source
Economic Growth
Inverse coefficient of variation, real GDP per capita growth
Ratio of average real GDP per capita growth and its standard deviation, using a 5-year rolling window to derive the time series; this variable measures economic stability
World Development Indicators
Trade openness (% of GDP) Sum of exports and imports in percentage of GDP
Hirschman-Herfindahl Index (HHI)
Measures the dispersion of trade value across an exporter’s partners
World Integrated Trade Solution
Age dependency ratio (%) Percentage of people younger than 15 or older than 64 to the working-age population
World Development Indicators
Adjusted net savings (% of gross national income [GNI])
Net national savings plus education spending and minus energy depletion, mineral depletion, net forest depletion, CO2, and particulate emissions damage, measured as a percentage of GNI
World Development Indicators
Public debt (% GDP)Gross general government debt (in many cases only central government data were available)
International Monetary Fund International Financial Statistics
Social Equity
Employment-to- population ratio (%)
Estimated percentage by the International Labour Organization (ILO) of employed to the population aged over 15
World Development Indicators
Primary education enrollment gap (% points)
Percentage point difference of the proportion of male and of female enrolled in primary education
World Development Indicators
Labor force participation gap (% points)
Percentage point difference of the ILO- estimated male and female labor force participation rates
World Development Indicators
Life expectancy at birth (years)
Number of years a newborn infant would live if prevailing patterns of mortality at the time of their birth were to stay the same throughout their life
World Development Indicators
Infant mortality rate (per 1,000 live births in a given year)
Number of infants dying before reaching 1 year per 1,000 live births in a given year
World Development Indicators
Access to improved sanitation (%)
Percentage of population with access to improved sanitation
World Development Indicators
Access to improved drinking water (%)
Percentage of population with access to improved drinking water
World Development Indicators
continued on next page

Inclusive Green Growth Index44
Pillar Indicator Description Data SourceAccess to electricity (%) Percentage of population with access to
electricity and non-solid fuelWorld Development Indicators
Gini coefficient on inequality Measures the extent to which the distribution of income (or, in some cases, consumption spending) among individuals or households within an economy deviates from a perfectly equal distribution
United Nations University World Income Inequality Database
Poverty gap (%) Percentage of population living on less than $3.10 a day
World Development Indicators
Mean years of schooling Average number of completed years of education of a country’s population, excluding years spent repeating individual grades
UNDP Human Development Reports
Primary completion rate (%) Percentage of total enrollment, regardless of age, to the population of the age group that officially corresponds to primary school
World Development Indicators
Political participation gap (% points)
Percentage point difference of the proportion of seats held by male and by female in national legislatures
World Development Indicators
Environmental Sustainability
Natural resources rent (% of GDP)
Ratio of the sum of oil, natural gas, coal (hard and soft), mineral, and forest rents to GDP
World Development Indicators
Renewable internal freshwater resources per capita (cubic meters)
Annual availability of renewable water per capita
World Development Indicators
Water productivity (constant 2010 $)
Constant 2010 $ GDP per cubic meter of total freshwater withdrawal
World Development Indicators
Air pollution (% of population with exposure)
Percentage of population exposed to air pollution levels exceeding WHO’s 2.5 particulate air quality guideline
World Development Indicators
CO2 emission per GDP (constant 2010 $)
Annual kilogram of CO2 emissions relative to annual production in constant 2010 $
World Development Indicators
Energy intensity (mega joule per constant 2011 purchasing power parity [PPP] GDP)
Energy intensity level of primary energy (mega joules per GDP measured in constant 2011 PPP dollars)
World Development Indicators
Use of renewables (% of total energy consumption)
Percentage of renewable energy consumption to total final energy consumption
World Development Indicators
Sources: As listed in the data sources column.
Table continued
Appendix 2

45
Central Asia East Asia South Asia Southeast Asia The PacificArmenia People’s Republic of China Afghanistan Brunei Darussalam Cook IslandsAzerbaijan Hong Kong, China Bangladesh Cambodia FijiGeorgia Republic of Korea Bhutan Indonesia KiribatiKazakhstan Mongolia India Lao PDR Marshall IslandsKyrgyz Republic Taipei,China Maldives Malaysia Federated States of
MicronesiaTajikistan Nepal Myanmar NauruTurkmenistan Pakistan Philippines PalauUzbekistan Sri Lanka Singapore Papua New Guinea
Thailand SamoaViet Nam Solomon Islands
Timor-LesteTongaTuvalu
VanuatuLao PDR = Lao People’s Democratic Republic.Note: Economies in red were not included due to over 25% missing values in at least one of the pillars. Source: Asian Development Bank. 2017. Asian Development Outlook 2017. Manila.
Economies Used in the Inclusive Green Growth Index for Developing Asia
APPENDIX 3

46
Construction of the Inclusive Green Growth Index
APPENDIX 4
The following steps were used in the construction of the Inclusive Green Growth Index (IGGI):
(i) Because the IGGI’s three pillars (economic growth, social equity, environmental sustainability) and 28 indicators are expressed in different units, they are first normalized to scores ranging from 0 to 1, using the min–max approach. This technique normalizes the indicators by dividing the difference between a country’s indicator performance and the sample minimum by the difference between the sample minimum and the sample maximum. Next, the scores are converted to a 1–6 scale (worst to best):
5 ×
((country score – sample minimum))
((sample maximum – sample minimum)) + 1.
To illustrate, consider the gross domestic product (GDP) per capita growth rate of the People’s Republic
of China (PRC), which was 6.36% in 2015. In that year, the lowest GDP per capita growth rate among the sample of 25 developing Asian countries was –2.96% (sample minimum), while the highest growth rate was 8.37% (sample maximum). The PRC’s normalized GDP per capita growth rate score is then calculated as:
5 x
((6.36-(-2.96)))
((8.37-(-2.96)) ) + 1 = 5.11.
The same normalization technique applies to all indicators with a positive impact on the IGGI.
(ii) For indicators where a higher value implies a worse outcome, or the impact direction is negative (for example, air pollution, income inequality, or public debt), the transformation formula takes the form:
-5 ×
((country score – sample minimum))
((sample maximum – sample minimum)) + 6.
This reversed transformation formula ensures that the scores of 1 and 6 still correspond to the worst and best possible outcomes
(iii) The indicators for each pillar are assigned equal weights and aggregated to compute the pillar scores. To compute for the economic growth pillar score, for instance, we take the simple or equally weighted average of the normalized scores of its seven indicators. In the case of the PRC in 2015, the scores of its indicators were: GDP per capita growth rate 5.11, inverse of the coefficient of variation of GDP per capita growth rate 2.12, trade openness 5.82, Hirschman-Herfindahl Market Concentration Index 5.88, age dependency ratio 5.83, adjusted net savings 4.87, and public debt 3.95. Thus, the simple average of

Appendix 4 47
the seven indicators’ normalized scores yields the economic growth pillar score of 4.80. Following the same process generates the social equity and environmental sustainability pillar scores of 4.57 and 2.51, respectively.
(iv) Next, the scores of each of the three pillars are further assigned equal weights and aggregated to compute the score for the IGGI ranging from 1 to 6, depicting the worst and the best outcomes:
IGGI = 1⁄3 (average economic pillar) + 1⁄3 (average equity pillar) + 1⁄3 (average environmental pillar). (1)
Applying this formula, the IGGI for PRC in 2015 was:
IGGI (PRC) = 1⁄3 (4.80) + 1⁄3 (4.57) + 1⁄3 (2.51) = 3.96. (2)
(v) In general, a country’s scores in the economic growth, social equity, and environmental sustainability pillars are different, which means that it is not performing equally well on all the pillars. Adding together the absolute gaps in scores between each pair of the pillars gives:
Total absolute gap = |economic pillar – equity pillar| + |equity pillar – environmental pillar| + |environmental pillar – economic pillar.| (3)
This sum is always a non-negative number. When all three pillars have identical scores, the total gap is zero, which implies a perfectly balanced IGGI. A higher total gap implies a larger imbalance across the three pillars, as it does for the PRC. In 2015, the total absolute gap for the PRC was as follows:
|4.80 – 4.57 | + |4.57-2.51 | + | 2.51-4.80 | = 4.59.
(vi) This gap is then normalized, using the min–max approach, to scores ranging from 1 to 6. Reversing the scores converts an imbalance into a balance—the cross-pillar balance (CPB), whose scores of 1 and 6 now correspond to the worst and best outcomes as in step (ii). The CPB for the PRC was:
CPB(PRC) = –5 × ((4.59 – 0.89)) ((5.31 – 0.89))
+ 6 = 1.82.
Among the countries in the 2015 sample, the lowest total absolute gap was 0.89 (sample minimum), and the highest 5.31 (sample maximum).
(vii) The IGGI is adjusted to derive the Balanced IGGI as the average of the IGGI’s three pillars and the CPB—which is treated as the fourth pillar—with equal weights of one-quarter each. Equivalently, the weighted average of the IGGI (weight three quarters) and CPB (weight one quarter) also gives:
Balanced IGGI = 3⁄4 (IGGI) + 1⁄4 (CPB). (4)
Applying this formula to the PRC with IGGI at 3.96 and the CPB at 1.82 gives:
Balanced IGGI (PRC) = 3.42. (5)
A comparison of equations (2) and (5) shows that the Balanced IGGI is less than the IGGI due to unequal performance in the IGGI pillars.

48
2030 WRG (2030 Water Resources Group). 2009. Charting Our Water Future: Economic Frameworks to Inform Decision-Making. Washington, DC: 2030 WRG.
ADB (Asian Development Bank). 2011. Key Indicators for Asia and the Pacific: Framework of Inclusive Growth Indicators. Manila.
———. 2015. Asian Development Outlook Update: Enabling Women, Energizing Asia. Manila.
———. 2016. Asian Development Outlook Update: Meeting the Low-Carbon Growth Challenge. Manila.
———. 2017. Meeting Asia’s Infrastructure Needs. Manila.
———. 2018a. Report and Recommendation of the President to the Board of Directors on a Proposed Policy-Based Loan Mongolia: Ulaanbaatar Air Quality Improvement Program. Project Number: 51199-001. Manila.
———. 2018b. Report and Recommendation of the President to the Board of Directors on a Proposed Loan and Administration of Loan PT Supreme Energy Rantau Dedap: Ranatu Dedap Geothermal Power Project (Phase 2) Republic of Indonesia. Project Number 50330-001. Manila.
———. 2018c. ADB’s New Strategy to Achieve a Prosperous, Inclusive, Resilient, and Sustainable Asia and the Pacific - Takehiko Nakao. Speech at the 51st Annual Meeting. Manila.
ADBI (Asian Development Bank Institute). 2009. Infrastructure for a Seamless Asia. Tokyo.
Barrot, L., C. Calderón, and L. Servén. 2017. “Openness, Specialization, and the External Vulnerability of Developing Countries.” Policy Research Working Paper Series. Washington, DC: World Bank.
Bradsher, K. 2017. “China’s New Antipollution Push Could Cool Its Growth Engine.” New York Times, 23 October.
Brundtland, G., M. Khalid, S. Agnelli, S. Al-Athel, B. Chidzero, L. Fadika, V. Hauff, et al. 1987. Our Common Future. Oxford: Oxford University Press.
Calderón, C., E. Moral-Benito, and L. Servén. 2011, “Is Infrastructure Capital Productive? A Dynamic Heterogeneous Approach” Working Paper Series 5682. Washington, DC: World Bank.
Capital Economics. 2017. “Is a Universal Basic Income Feasible?” India Economics Update. March 6.
Chinn, M. D. and H. Ito. 2006. “What Matters for Financial Development? Capital Controls, Institutions, and Interactions.” Journal of Development Economics 81 (1): 163–92.
References
References 49
Chowdhury, S. and L. Squire. 2006. “Setting Weights for Aggregate Indices: An Application to the Commitment to Development Index and Human Development Index.” Journal of Development Studies 42 (5): 761–71.
Cobham, A. and S. J. Klees. 2016. “Global Taxation: Financing Education and the Other Sustainable Development Goals.” Background paper for the International Commission on Financing Global Education Opportunity’s report The Learning Generation—Investing in Education for a Changing World.
Dawson, A. 2010. “State Capacity and the Political Economy of Child Mortality in Developing Countries Revisited: From Fiscal Sociology Towards the Rule of Law.” International Journal of Comparative Sociology 51 (6): 403–22.
Decancq, K. and M. Lugo, 2008. “Setting Weights in Multidimensional Indices of Well-Being and Deprivation.” OPHI Working Paper 18. Oxford: Oxford Poverty and Human Development Initiative.
Global Commission on the Economy and Climate. 2014. The New Climate Economy Report: Better Growth, Better Climate. Washington, DC.
———. 2018. The New Climate Economy Report: Unlocking the inclusive growth story of the 21st century. Washington, DC
Government of India. 2017. Economic Survey 2016–2017. https://www.indiabudget.gov.in/es2016-17/echapter.pdf.
———. 2018. Draft Labour Code on Social Security and Welfare. https://labour.gov.in/sites/default/files/SS%20Code%202018-03-28.pdf.
GGKP (Green Growth Knowledge Platform). 2013. “Moving Towards a Common Approach on Green Growth Indicators: A Green Growth Knowledge Platform Scoping Paper.” Geneva.
Hallerod, B., B. Rothstein, A. Daoud, and S. Nandy. 2013. “Bad Governance and Poor Children: A Comparative Analysis of Government Efficiency and Severe Child Deprivation in 68 Low and Middle Income Countries.” World Development 48 (8): 19–31.
Helliwell, J., R. Layard, and J. Sachs, eds. 2017. World Happiness Report 2017. New York: Sustainable Development Solutions Network.
Hesse, H. 2009. “Export Diversification and Economic Growth.” In R. Newfarmer, W. Shaw, and P. Wakenhorst, eds. Breaking into New Markets: Emerging Lessons for Export Diversification, edited by. Washington, DC: World Bank.
Kose, A., S. Kurlat, F. Ohnsorge, and N. Sugawara. 2017. “A Cross-Country Database of Fiscal Space.” Policy Research Working Paper No. 8157. Washington, DC: World Bank.
Le Vernoy, A. 2017. The Trade and Water Nexus. ADBI Working Paper Series No. 669. Tokyo: Asian Development Bank Institute.
Lorenz, J., C. Brauer, and D. A. Lorenz. 2016. “Rank-Optimal Weighting or ‘How to Be Best in the OECD Better Life Index?’” Berlin: ResearchGate.

References50
Mehta, A., S. Sandhu, B. Kinkead, and R. Teipelke. 2017. Catalyzing Green Finance: A Concept for Leveraging Blended Finance for Green Development. Manila. ADB.
Mlachila, M., R. Tapsoba, and M. S. Tapsoba. 2014. “A Quality of Growth Index for Developing Countries: A Proposal.” Working Paper No. 14–172. Washington, DC: International Monetary Fund.
Nardo, M., M. Saisana, A. Saltelli, S. Tarantola, A. Hoffmann, and E. Giovannini. 2008. Handbook on Constructing Composite Indicators. Paris: Organisation for Economic Co-operation and Development.
Narloch, U., T. Kozluk, and A. Lloyd. 2016. “Measuring Inclusive Green Growth at the Country Level: Taking Stock of Measurement Approaches and Indicators.” GGKP Working Paper 02/2016. Geneva: Green Growth Knowledge Platform.
National Portal of India. 2018. Ayushman Bharat: National Health Protection Mission. https://www.india.gov.in/spotlight/ayushman-bharat-national-health-protection-mission
OECD (Organisation for Economic Co-Operation and Development). 2012. Environmental Outlook to 2050: The Consequences of Inaction. Paris.
———. 2015. “Building More Effective, Accountable, and Inclusive Institutions for All” OECD and Post-2015 Reflections Series, Element 6. Paris.
Perera, P. and L. Zhong. 2017. Water–Energy Nexus in the People’s Republic of China and Emerging Issues. Manila.
Phillips, Tom. 2017. “China’s Premier Unveils Smog-Busting Plan to ‘Make Skies Blue Again.’ ” Guardian, 5 March.
Rajkumar A. S. and V. Swaroop. 2008. “Public Spending and Outcomes: Does Governance Matter?” Journal of Development Economics 86: 96–111.
Raworth, K. 2012. “A Safe and Just Space for Humanity: Can We Live Within the Doughnut?” Discussion Paper. Oxford: Oxfam.
Saltelli, A. 2007. “Composite Indicators between Analysis and Advocacy.” Social Indicators Research 81 (1): 65–77.
Sandhu, S., R. Naik Singru, J. Bachman, V. Sankaran, and P. Arnous. 2016. GrEEEn Solutions for Livable Cities. Manila: Asian Development Bank.
Sawada, Y., H. Kohama, H. Kono, and M. Ikegami. 2004. “Commitment to Development Index (CDI): Critical Comments.” FASID Discussion Paper on Development Assistance No. 1. Tokyo: Foundation for Advanced Studies on International Development.
Sen, A. 1996. “On the Foundations of Welfare Economics: Utility, Capability and Practical Reason.” In F. Farina, F. Hahn, and S. Vannucci, eds. Ethics, Rationality, and Economic Behaviour. Oxford: Clarendon Press.
Sen, K. 2015. “Governance and Development Outcomes in Asia.” In A. Deolalikar, S. Jha, and P. Quising, eds. Governance in Developing Asia. Manila: ADB; Cheltenham, United Kingdom: Edward Elgar.

References 51
Sharma, Y. 2018. “Government Readies Social Security Scheme for 50 Crore Workers.” The Economic Times, March 3.
Sharpe, A. and B. Andrews. 2012. An Assessment of Weighting Methodologies for Composite Indicators: The Case of the Index of Economic Well-Being. Ontario: Centre for the Study of Living Standards.
Social Progress Imperative. 2017. 2017 Social Progress Index. https://www.socialprogressindex.com/.
Stiglitz, J. E., A. Sen, and J. P. Fitoussi. 2010. Report by the Commission on the Measurement of Economic Performance and Social Progress. Paris: Commission on the Measurement of Economic Performance and Social Progress.
UNCTAD (United Nations Conference on Trade and Development). 2014. World Investment Report 2014. Geneva.
———. 2015. Report of the Capacity Building Workshop and Expert Group Meeting on Integrated Approaches to Sustainable Development Planning and Implementation. New York.
———. 2017. Statistical Commission Report on the Forty-Eighth Session. New York.
UN-Habitat (United Nations Human Settlements Programme). 2015. The State of Asian and Pacific Cities 2015. Urban Transformations: Shifting from Quantity to Quality. Nairobi.
World Bank. 2007. World Development Indicators 2007. Washington, DC.
———. 2014. “India: Green Growth—Overcoming Environment Challenges to Promote Development.” http://www.worldbank.org/en/news/feature/2014/03/06/green-growth-overcoming-india-environment-challenges-promote-development.
WEF (World Economic Forum). 2017. Global Competitiveness Report 2017–2018. Geneva.
———. 2018. Inclusive Development Index. Geneva.
Zhuang, J., X. Han, and H. Khan. 2015. “Do Governance Indicators Explain Growth Performance: A Cross-Country Analysis.” In A. Deolalikar, S. Jha, and P. Quising, eds. Governance in Developing Asia. Manila: ADB; Cheltenham, United Kingdom: Edward Elgar.

References52
The three pillars of the Inclusive Green Growth Index, i.e., economic growth, social equity, and environmental sustainability, are in line with the new global development agenda. The index is a very welcome addition to the indicators we can use in studying individual country’s performance in relation to the United Nations’ SDGs and also make cross-country comparisons. In the sample of 24 Asian countries, the analysis using the index shows that environmental sustainability remains the most neglected pillar.
Isher Judge Ahluwalia, Chairperson, Board of Governors, the Indian Council for Research on International Economic Relations
The Inclusive Green Growth Index is a timely alternative to global development indices, which focus more narrowly on environmental or social aspects of sustainability. Emphasizing balanced performance in these aspects, this index offers a practical and robust tool for prioritizing investments to achieve higher-quality development.
John Bachmann,Vice President for Design, Planning and Economics, AECOM
Inclusive green growth is the only credible growth. The Inclusive Green Growth Index developed by ADB is an important and thoughtful tool to gauge progress in rising to this challenge.
Samuel Fankhauser, Director, Grantham Research Institute on Climate Change and the Environment, London School of Economics and Political Science
The Agenda on Sustainable Development emphasizes the need for countries to achieve strong economic growth that is both socially inclusive and environmentally stable. The Inclusive Green Growth index provides an innovative approach to measure progress on the Sustainable Development Goals (SDGs) and will be a valuable tool for academics and policy makers alike.
Kunal Sen, Director-Designate, United Nations University World Institute for Development Economics Research
The Inclusive Green Growth Index is a very timely and desirable index responding to the challenges of taking an integrated, indivisible approach to the vision that the SDGs are designed to fulfill! The results are already very revealing and will provide a good guide for policy making.
Leena Srivastava, Vice Chancellor, The Energy and Resources Institute, School of Advanced Studies
Delivering green growth and sustainable development requires new measures of success. The Inclusive Green Growth Index is one such measure, and offers a benchmark for guiding policy, assessing country performance, and signaling directions for international development organizations including financing institutions.
Simon Zadek, Principal, Project Catalyst, United Nations Development Programme; Visiting Professor and Senior Fellow, Singapore Management University
Inclusive Green Growth IndexA New Benchmark for Quality of Growth
This publication launches the Inclusive Green Growth Index, a new comprehensive metric that captures the key dimensions of economic growth, social equity, and environmental sustainability. The index’s 28 performance indicators cover various aspects of growth and policy outcomes in areas where higher investment will advance better quality of growth and living standards. Designed as an easy-to-use guide for policy makers and stakeholders in development, the Inclusive Green Growth Index builds on current measures and indices. It is a powerful tool for assessing a country’s progress in achieving its development goals.
About the Asian Development Bank
ADB is committed to achieving a prosperous, inclusive, resilient, and sustainable Asia and the Pacific,while sustaining its efforts to eradicate extreme poverty. Established in 1966, it is owned by 67 members—48 from the region. Its main instruments for helping its developing member countries are policy dialogue,loans, equity investments, guarantees, grants, and technical assistance.
ASIAN DEVELOPMENT BANK6 ADB Avenue, Mandaluyong City1550 Metro Manila, Philippineswww.adb.org