Technical Workshop on Tools and Measures to Inform Inclusive Green Economy Policies 2-4 July 2013
Inclusive green economy policies and structural
transformation in Ethiopia
Contents
List of figures .................................................................................................................................... v
List of tables ..................................................................................................................................... vi
List of boxes .................................................................................................................................... vii
Acronyms and abbreviations .......................................................................................................... viii
Acknowledgements .......................................................................................................................... ix
Executive summary ........................................................................................................................... x
Key messages ............................................................................................................................... xviii
1. Introduction .............................................................................................................................. 1
1.1 Conceptual framework ................................................................................................... 2
1.2 Framework for linking inclusive green economy and structural transformation ........... 5
1.3 Objectives of the report .................................................................................................. 6
1.4 Methodological approach ............................................................................................... 6
1.4.1 Data sources ........................................................................................................ 6
1.4.2 Data analysis ....................................................................................................... 7
1.4.3 Peer review ......................................................................................................... 7
1.5 Structure of the report ..................................................................................................... 7
2. Ethiopia’s macroeconomic framework ................................................................................... 9
2.1 Overview of policies and strategies ................................................................................ 9
2.2 Macroeconomic performance under various development strategies .......................... 12
2.2.1 Macroeconomic indicators ............................................................................... 12
2.2.2 Social indicators ............................................................................................... 13
2.2.3 Infrastructure indicators .................................................................................... 16
2.2.4 Employment, productivity and earnings ........................................................... 17
2.3 Fiscal and monetary responsiveness to an inclusive green economy ........................... 21
2.3.1 Fiscal responses to an inclusive green economy .............................................. 21
2.3.2 Monetary responses to an inclusive green economy ........................................ 22
3. Ethiopia’s structural transformation agenda ...................................................................... 26
3.1 Growth and Transformation Plan as Ethiopia‟s main structural
transformation framework ............................................................................................ 27
3.1.1 Agriculture and rural development ................................................................... 28
ii
3.1.2 Industrial sector and industrialization............................................................... 28
3.1.3 Trade ................................................................................................................. 29
3.1.4 Development of social sectors .......................................................................... 30
3.1.5 Natural resources management ......................................................................... 30
3.1.6 Urban-rural linkages ......................................................................................... 30
4. Analysis of inclusive green economy policies and their role and significance
in fostering structural transformation ................................................................................. 33
4.1 Rationale for inclusive green economy policies in Ethiopia ........................................ 33
4.2 Evolution of green economy policies and strategies .................................................... 34
4.3 Development of the Climate-Resilient Green Economy Strategy:
Institutional arrangements and coordination ................................................................ 34
4.4 Vision, goal and objectives of the Climate-Resilient Green Economy Strategy and
its importance in structural transformation .................................................................. 37
4.5 Inclusiveness and the Climate-Resilient Green Economy Strategy ............................. 40
4.6 Implementation of the Climate-Resilient Green Economy Strategy ............................ 42
5. Linkages and coherence between inclusive green economy policies and those
directly addressing structural transformation in Ethiopia ................................................ 44
5.1 Synergies between inclusive green economy and structural transformation policies .. 44
5.1.1 Policy integration .............................................................................................. 44
5.1.2 Coherence and synergies at the implementation stage ..................................... 49
5.1.3 Agriculture and rural development ................................................................... 50
5.2 Trade-offs between inclusive green economy and structural
transformation policies ................................................................................................. 57
6. Analysis of other enabling measures in place and needed
to facilitate the transition to an inclusive green economy and contribute
to structural transformation. ................................................................................................ 62
6.1 Enabling measures at the national level ....................................................................... 62
6.1.1 High-level commitment and leadership ............................................................ 62
6.1.2 Appropriate policy and institutional frameworks
and effective implementation mechanisms at national level ............................ 62
6.2 Institutional and strategic frameworks for sustainable transformation
and development at the regional and subregional levels .............................................. 68
6.3 Enabling measures at the international level ................................................................ 69
iii
6.3.1 Existence and adoption of international agreements and conventions
at the global level .............................................................................................. 69
6.3.2 Communication and awareness of the public on processes,
conventions and opportunities related to an inclusive green economy
at the international level ................................................................................... 70
7. Existing analytical tools for integrated assessment of inclusive
green economy policies and strategies .................................................................................. 71
7.1 Analytical tools applied in Ethiopia ............................................................................. 71
7.1.1 Analytical tools for environment and social assessment .................................. 71
7.1.2 Integrated development planning and policy analysis models ......................... 73
7.1.3 Methodologies for governance analysis ........................................................... 74
8. Challenges and opportunities in adopting inclusive green economy policies
to achieve structural transformation .................................................................................... 78
8.1 Challenges .................................................................................................................... 78
8.1.1 Lack of coherent monitoring indicators............................................................ 78
8.1.2 Lack of timely and adequate data and information .......................................... 78
8.1.3 Inadequate funding and investment .................................................................. 78
8.1.4 Lack of adequate capacity ................................................................................ 80
8.1.5 Stability and predictability of policies and regulations .................................... 81
8.1.6 High population growth .................................................................................... 81
8.1.7 Technological inadequacy ................................................................................ 82
8.1.8 Inadequate knowledge and awareness of the Climate-Resilient
Green Economy Strategy .................................................................................. 82
8.2 Opportunities ................................................................................................................ 82
8.2.1 Commitment and long-term vision ................................................................... 82
8.2.2 Agriculture and rural development ................................................................... 82
8.2.3 Early stage of industrial development .............................................................. 82
8.2.4 Huge renewable energy potential ..................................................................... 83
8.2.5 Low urbanization .............................................................................................. 83
8.2.6 Trainable workforce, training opportunities and low labour cost .................... 83
8.2.7 Access to global finance and technology ......................................................... 84
iv
9. Conclusion and recommendation .......................................................................................... 86
9.1 Conclusion .................................................................................................................... 86
9.2 Recommendations ........................................................................................................ 88
9.2.1 General.............................................................................................................. 88
9.2.2 Specific recommendations ................................................................................ 88
References ...................................................................................................................................... 92
Annexes .......................................................................................................................................... 99
Annex 1: List of stakeholders consulted ........................................................................... 99
Annex 2: Some environmental conventions signed by Ethiopia .................................... 101
Annex 3: Selected social conventions Ethiopia has signed ............................................ 102
Annex 4: Selected economic conventions Ethiopia has signed ...................................... 104
v
List of figures
Figure 1: Indicators of inclusive growth ............................................................................. 3
Figure 2: Key elements of quality of growth ....................................................................... 4
Figure 3: Conceptual framework for an inclusive green economy and structural
transformation ...................................................................................................... 6
Figure 4: Development plans and strategies underlying the macroeconomic policy
developments ..................................................................................................... 10
Figure 5: Trends in consumption-based poverty indices (%) ............................................ 14
Figure 6: Trends in consumption-based inequality ........................................................... 14
Figure 7: Trends in sectoral employment (% of total employment).................................. 18
Figure 8: Labour productivity (in thousands of„000‟ birr), 2010/11 constant prices ........ 19
Figure 9: Share of natural resource-based revenue source (% of total revenue) ............... 21
Figure 10: Percentage share of capital expenditure in poverty sectors to total capital
expenditure.........................................................................................................22
Figure 11: Trends in GDP growth rate and inflation ........................................................... 23
Figure 12: Growth of broad money and inflation (%) ......................................................... 23
Figure 13: Share of claims on government and on other sectors
(% of total domestic credit) ................................................................................ 24
Figure 14: Evolution of Ethiopia‟s green economy policies and strategies ........................ 34
Figure 15: Preparation of Climate-Resilient Green Economy Strategy .............................. 35
Figure 16: Integration between Growth and Transformation Plan and the Climate-Resilient
Green Economy Strategy at the policy development stage................................ 45
vi
List of tables
Table 1: Macroeconomic indicators under different development plans ......................... 13
Table 2: Key indicators of social progress ....................................................................... 15
Table 3: Key infrastructure indicators .............................................................................. 16
Table 4: Type of fuel used for cooking, and sources of drinking water
(% of households) .............................................................................................. 17
Table 5: Selected labour market indicators ...................................................................... 18
Table 6: Distribution of informal employment by sector in urban areas (%) .................. 18
Table 7: Average real income by major sectors (birr per month) .................................... 20
Table 8: Monetary developments ..................................................................................... 24
Table 9: Loans and advances by banks and receiving natural resource-based sectors
(in millions of birr) ............................................................................................ 25
Table 10: Summary of key dimensions of the Growth and Transformation Plan.............. 31
Table 11: Key sectors, targets, drivers and expected outcome under two development
pathways ............................................................................................................ 38
Table 12: Main sectors, goals and activities/drivers in the Climate-Resilient Green
Economy Strategy .............................................................................................. 39
Table 13: Social dimensions of selected activities in the Climate-Resilient
Green Economy Strategy ................................................................................... 41
Table 14: Analysis of policy instruments used in promoting a green economy
in Ethiopia ........................................................... Error! Bookmark not defined.
Table 15: Synergies between inclusive green economy indicators and the Growth and
Transformation Plan ........................................................................................... 48
Table 16: Climate-resilient green economy interventions that reinforce the Growth and
Transformation Plan objectives („win-win‟ interventions) ................................ 51
Table 17: Trade-offs between inclusive green economy and structural transformation
policy instruments .............................................................................................. 61
Table 18: Summary of tools used for integrated assessment of inclusive
green economy policies ...................................................................................... 76
vii
List of boxes
Box 1: Good practices including success factors and lessons learned in the development
of the Climate-Resilient Green Economy Strategy ............................................ 36
Box 2: Productive Safety Net Programme and the environment ................................... 53
Box 3: Integrated Housing and Infrastructure Development Programme ..................... 56
Box 4: Good practices in the coherent implementation of Climate-Resilient Green
Economy Strategy and the Growth and Transformation Plan ........................... 56
Box 5: Crop productivity, farm input and natural resource management ..................... 58
Box 6: Biofuel development in Ethiopia ....................................................................... 60
Box 7: Access to, and cost of finance ............................................................................ 80
Box 8: Changes in government rules
regulations……………………………………………………….......................81
viii
Acronyms and abbreviations
CO2e carbon dioxide equivalent
ECA Economic Commission for Africa
ESCAP Economic and Social Commission for Asia
GDP gross domestic product
ha hectare
ILO International Labour Organization
IMF International Monetary Fund
km kilometre
LPG liquefied petroleum gas
MW megawatt
NGO non-governmental organization
ODA official development assistance
OECD Organization for Economic Cooperation and Development
REDD Reducing Emissions from Deforestation and Forest Degradation
SMEs small and medium enterprises
UNDP United Nations Development Programme
UNEP United Nations Environment Programme
UNESCO United Nations Educational, Scientific and Cultural Organization
UNRISD United Nations Research Institute for Social Development
VAT valued added tax
ix
Acknowledgements
The present report on Inclusive green economy policies and structural transformation
in Ethiopia benefited from the overall guidance of Ms. Fatima Denton, Director of the Special
Initiatives Division (SID) of the Economic Commission for Africa (ECA).
Ms. Isatou Gaye, Chief of the Green Economy and Natural Resource Section
(GENRS) of SID/ECA, provided intellectual leadership, substantive guidance and supervision
in the preparation of the report.
The report team comprised Charles Akol (team leader), Benjamin Mattondo Banda,
Andrew Allieu, Mathilde Closset, Yacouba Gnegne, Romuald Somlanare Kinda, and Richard
Osaliya of ECA. Dr. Tadele Ferede, Department of Economics, Addis Ababa University,
Ethiopia, is gratefully acknowledged for preparing the rich background document that
informed the report.
ECA extends its utmost gratitude to Mr. Temesgen Wallelign, Director Development
Planning and Research, National Planning Commission, and Mr. Admasu Gedamu, Director,
United Nations Agencies and Regional Economic Cooperation, Ministry of Finance and
Economic Development, of the Federal Democratic Republic of Ethiopia for facilitating the
rich collaboration with their respective institutions. Their leadership in this regard was
exemplary.
Gratitude goes to all colleagues of SID and other ECA Divisions and Subregional
Offices for their useful feedback and comments on the report. The report also benefited from
the constructive comments and inputs provided by participants at the Validation Meeting
jointly organized by ECA and the Ministry of Finance and Economic Development, of the
Federal Democratic Republic of Ethiopia, on 29 and 30 September 2014, to review and enrich
the report.
The team is grateful for the valuable administrative and organizational support
provided by Tsigereda Assayehegn, Rahel Menda, Gezahegn Shiferaw and Tesfaye Wondu.
Lastly, DembaDiarra, Chief of the ECA Publications Section and his team including Marcel
Ngoma - Mouaya, Megan Rees, Teshome Yohannes and Charles Ndungu are acknowledged
for their efficient handling of the editing, text processing, proofreading, design and printing
processes.
x
Executive summary
Introduction
The Government of Ethiopia has expressed its determination to achieve structural
transformation, as reflected in its Growth and Transformation Plan, which was adopted in
2010 and has been the key medium-term development plan for the period 2010/11-2014/15.1
Although rapid growth is necessary to reduce poverty, growth will be unsustainable in the
long run unless it is both socially inclusive and environmentally sound. Accordingly, Ethiopia
has embarked on a national strategy of building a climate-resilient green economy.2
Transitioning to an inclusive green economy is receiving growing attention as a pathway that
can lead to sustainable development. It entails a low-carbon, climate-resilient, resource-
efficient, environmentally sustainable and socially inclusive growth path, thus promoting the
achievement of internationally agreed development goals, including the Millennium
Development Goals and the sustainable development goals, which are expected to be adopted
as part of the post-2015 development agenda in September 2015.
The main objective of this report is to explore the linkages and contribution of
inclusive green economy policies and strategies to structural transformation in Ethiopia. In
this regard, the report provides an assessment of how inclusive green economy-related
policies can reinforce the structural transformation agenda of Ethiopia; and how structural
transformation policies and strategies can enhance the development of an inclusive green
economy. The intent is to enhance understanding and promote the adoption of inclusive green
economy policies that will contribute to achieving the structural transformation goals of
Ethiopia. The report is timely, as it will inform the ongoing preparation of Ethiopia‟s second
generation Growth and Transformation Plan.
Ethiopia’s macroeconomic framework
The Government has designed macroeconomic policies aimed at ensuring sustainable
and equitable development outcomes. Both fiscal and monetary policies are geared towards
supporting the Government‟s objectives of a sustainable and inclusive development trajectory.
The Government has identified spending priorities and increased its budgetary allocation to
green and social sectors such as agriculture, education, health, and infrastructure. In
particular, capital expenditure allocated to these sectors increased by about 32 per cent
between 2004/05 and 2012/13. Likewise, credit to these sectors has increased. In particular,
credit to natural resource-based sectors such as agriculture, mining, power and water grew on
average by 29 per cent between 2006/07 and 2012/13. A large share of credit has been
channelled to agriculture, indicating that monetary policy has been in support of natural
resources-based sectors. Both fiscal and monetary policies have also been instrumental in
curbing inflation and protecting the economically disadvantaged segment of the population,
through initiatives such as the subsidized distribution of basic food items (in urban areas) and
the reduction of credit to non-priority sectors.
As result of the various macroeconomic interventions, Ethiopia has experienced solid
progress in key economic and social indicators. The country‟s economic growth has been the
result of an expansion of the services and agriculture sectors. About 52per cent of the growth
1The Growth and Transformation Plan was adopted and implementation began in 2010/11.
2 In this report, we consider climate-resilient green economy to be the main inclusive green economy strategy;
the terms are therefore used interchangeably.
xi
in value added has been attributed to the services sector between 2003/04 and 2012/13. The
agriculture sector, meanwhile, accounted for 36per cent of value added growth. Industrial
sector performance was relatively meagre with a value added contribution of just 12per cent.
Rapid economic growth has led to a fall in income poverty in both rural and urban
areas, especially since 2003/04, with 3.7 million people moving out of poverty in 2010/11.
The rate of decline in the incidence of poverty was at a slower pace than the gross domestic
product (GDP) growth rate in 2010/11. Poverty incidence declined in both rural and urban
areas. The fall in urban poverty can be attributed to the boom in construction activities,
increased private sector investment in certain sectors, such as services, and the expansion of
small and medium enterprises. However, the severity of poverty has increased in recent years,
indicating that growth has failed to adequately reach the poorest segment of the population.
Ethiopia has also made some progress in enhancing the inclusiveness of its growth
process. Inequality at the national level, however, has not decreased. While income inequality
in 2010/11 declined in urban areas, it increased in rural areas. The Government‟s strong focus
on urban development and improved employment creation, especially labour-intensive
infrastructural development, expansion of small and medium enterprises, improved access to
credit, and training could have contributed to the decline in urban inequality.
The quality of human development is also improving in Ethiopia owing to improved
access to education and health services. Ethiopia is experiencing rising skill intensity,
especially in the skilled and semi-skilled labour forces, due to the expanding technical and
vocational education and training and tertiary education across the country. The net enrolment
rate has increased at primary, secondary and tertiary levels. Similarly, efforts to achieve
universal access to basic health services have resulted in improvements in maternal and infant
mortality rates. Ethiopia is well ahead in achieving the Millennium Development Goals on
health and education. Access to basic infrastructure such as roads, water, and power, has also
improved due to massive government-led investment.
Although the gender parity index has improved both in the primary and secondary
education levels, Ethiopia has yet to achieve gender parity in lower primary, secondary and
preparatory levels of education. The country has shown more progress in gender parity at the
upper primary level than at other levels of education. However, gender inequality has
remained worrisome at the preparatory level.
Despite some progress, access to potable water and electricity continues to be a
concern, especially in rural areas. A large proportion of rural households depend on unsafe
sources of water including unprotected wells, rivers, lakes, and rainwater for drinking.
Similarly, while the majority of rural households depend on biomass for energy sources, such
as firewood for cooking, a large share of urban households, representing about 18 per cent of
total population, have access to modern electricity. These features of spatial inequality in
terms of access to water and modern energy suggest that designing and implementing
inclusive green economy policies and strategies could help arrest greenhouse gas emissions
from deforestation and improve access in rural and urban areas.
The pace of overall employment growth has accelerated in recent years, with increased
labour force participation rates. The sectoral structure of employment reveals that the share of
employment in agriculture has declined from 80.3 per cent in 2005 to 72.7 per cent in 2013.
The employment shares of the manufacturing and services sectors in total employment have

xii
remained low. This indicates that the vast majority of jobs are still connected to the extraction
of natural resources, such as agriculture, and dominated by smallholders. In addition, the
informal sector has become an important source of livelihood, especially in urban areas.
Informal sector jobs are precarious or unprotected, as informal workers are less likely to have
a formal work arrangements ensuring continuity of work and social protection. These features
imply that inclusiveness remains a concern.
While aggregate labour productivity increased between 2005 and 2013, sectoral
variations are noticeable. Labour productivity levels have remained low in two productive
sectors: agriculture and manufacturing. In 2013, employment expansion was accompanied by
a contraction in labour productivity in the transport and communications sector. Three sectors
showed strong growth in labour productivity between 2005 and 2013: manufacturing,
construction, and wholesale and retail trade. Although economy-wide labour productivity
growth was accompanied by employment growth, the growth of the latter was not strong, as
reflected by the low value of the overall employment elasticity–an indicator of the response of
employment to changes in value added or GDP.3 Employment elasticity has remained low in
agriculture, manufacturing and wholesale and retail trade.
While employment grew in the majority of sectors, real income declined. Low wage
paying sectors include hotels and restaurants, agriculture, wholesale and retail trade, and
manufacturing. These sectors pay below the economy average wage (421.7 birr4 per month in
real terms in 2012) and at the same time, labour mobility occurs between these sectors. This
indicates that labour mobility occurred from a low paying sector to another low paying sector.
This type of labour reallocation is not useful from the point of view of productive
employment and of achieving inclusive growth.
Overall, the macroeconomic framework has been conducive to an inclusive green
economy approach, as reflected by spending priorities, budgetary and credit allocations,
protection of vulnerable segments of the society, and ensuring macroeconomic stability. Both
the fiscal and monetary policies of the Government are aimed at restoring macroeconomic
stability (e.g. controlling inflation), protecting the vulnerable segments of the population, and
channelling budget and credit to poverty-oriented sectors and natural resource management.
Ethiopia’s structural transformation agenda
The challenge for Ethiopia is not only speeding up the transformation process, but also
enhancing the inclusiveness of that transformation. Structural transformation is driven by the
need to transform the economy and to translate the rapid economic growth into sustained and
inclusive growth through economic diversification that creates productive jobs, reduces
poverty and inequality, and enhances access to basic services. Accordingly, the Government
of Ethiopia has embarked on structural transformation agenda as reflected in its Growth and
Transformation Plan, adopted in 2010 and which became effective in the 2010/11 fiscal year.
The Plan gives due emphasis to promoting the agricultural and manufacturing sectors. While
maintaining the emphasis accorded to the agro processing and construction industries, it also
gives priority to the chemical and metallurgical industries aimed at developing a dynamic
industrial sector that supports the transformation initiatives of the country. The Plan also
3 Employment elasticity indicates the change in employment due to a change in value added or gross domestic
product (GDP). Economy-wide employment elasticity is the ratio of the percentage change in employment to
percentage change in GDP. 4 In 2012, the exchange rate was: US$ 1=18.0 birr.
xiii
recognizes the importance of environmental issues such as climate change and conservation
and management of natural resources for sustainable structural transformation. The
transformation agenda of the country has therefore been grounded in sectors that ensure
economic, social and environmental sustainability.
Ethiopia’s inclusive green economy strategy
Ethiopia has been a champion of the green economy as reflected by the landmark
developments in green economy-related policies and initiatives since the early 1990s.
Although the approach thus far consisted of the formulation of supporting policies, mainly at
sectoral levels, a consolidated green economy policy framework is the Climate-Resilient
Green Economy Strategy. The Strategy has two building blocks: green economy and climate-
resilient strategies. Sector reduction mechanisms are being developed to guide the integration
and implementation of climate-resilient green economy investments as part of federal and
regional plans. Ethiopia has also cascaded the Strategy to the sectoral level and many of the
sectoral strategies have been incorporated into the Growth and Transformation Plan. The
green economy vision, as articulated in the strategy, is not only consistent with the structural
transformation plan but also reinforces the country‟s long-term economic vision.
Linkages and coherence between inclusive green economy and structural
transformation strategies
In terms of synergies between inclusive green economy and structural transformation
policies, a key feature of Ethiopia‟s green economy effort is combining a long-term target to
reflect the general vision, with short-and medium-term targets to guide concrete actions.
Synergies between climate-resilient green economy and structural transformation policies
feature prominently at two levels: policy/plan development and implementation. The
Government of Ethiopia has used multiple criteria to prioritize and select a small group of
green economy priority options, including local relevance and feasibility, alignment with
Growth and Transformation Plan, and low-cost abatement potential. Accordingly, four
initiatives have been selected to fast-track implementation of the Climate-Resilient Green
Economy Strategy: hydropower development, rural cooking technologies, the livestock value
chain, and forestry development. These initiatives offer the prospect of immediate economic
growth and large carbon abatement potential. Such policy integration helps to maximize
synergies between environmental, social, and economic development outcomes and manage
the costs, trade-offs, and uncertainties. Consistent with the vision of achieving sustainable
transformation in the long-term perspective, a broad range of sector-specific green initiatives
have been launched and integrated into Ethiopia‟s transformation plan at the national level.
The transition to an inclusive green economy pathway not only provides „win-win-
win‟ outcomes in terms of improved economic performance, environmental protection and
social development, but also involves trade-offs in the short term. Efforts to „green‟
production are likely to increase short-term production costs, as new production technologies
are introduced. The increase in production costs could have an impact on the overall
competitiveness of locally produced products in national, regional and international markets,
at least in the short-run. However, in the long run, the country will be competitive in the
regional and global markets by supplying low-carbon goods and services (e.g. manufactured
goods and green energy).
xiv
In order to maximize the synergies and minimize trade-offs, policy instruments need
to be selected and applied based on their dynamic net benefits to the society as well as their
capacity to trigger green structural transformation. This involves shifting investment towards
a new generation of assets, such as clean technology, high-productivity farming, renewable
energy, resource-efficient infrastructure, well-functioning ecosystems, and green skilled
labour. Moreover, the transition from the current agricultural practices towards green
agriculture and related enterprises requires significant investments in irrigation, water and soil
conservation, education, extension, as well as strong commitment to promoting and
implementing the green economy.
Alignment of the Strategy indicators and targets with those of the Growth and
Transformation Plan is important to identify and assess synergies and trade-offs among the
economic, environmental and social dimensions. Currently there is a disconnect between the
Strategy and the Plan in terms of targets. For example, while the Growth and Transformation
Plan targets are expressed in terms of activities (e.g. area covered in afforestation, irrigated
area, area rehabilitated, water coverage, health coverage), the Strategy targets are only
expressed in terms of emission reductions, suggesting a need to harmonize targets and
indicators to monitor the progress towards the green economy. In addition, although the
Strategy has dealt with economic and environmental issues, it does not take into account the
social dimensions, which means that it is difficult to know the distributional consequences of
green interventions. Clear monitoring and evaluation mechanisms and an implementation
roadmap are also lacking in the Strategy. This highlights an area where lack of data is likely
limiting the ability to establish adequate measurement and feedback mechanisms.
Although there is some progress in terms of integrating inclusive green economy
policies of selected sectors into the Growth and Transformation Plan, there is no effort in
mainstreaming inclusive green economy indicators into the national accounts. The focus of
policy design on an inclusive green economy means that there is a need to go beyond the
conventional measurement of economic performance. In the current practice of national
accounts, environmental services and costs have remained unmeasured, leading to an under-
or overestimation of overall economic, environmental and social progress. This calls for a
search for mechanisms to measure inclusive green economy policies or tools and
methodologies in terms of factoring in the environmental and social costs of growth for
measuring growth and wealth accounting. In light of this, there is a need to expand the
national accounts for informed economic, social, and environmental management.
Other enabling measures
Apart from the inclusive green economy strategies, policies and instruments put in
place, there are other enabling measures at national, subregional, regional and global and
levels that are facilitating the transition to an inclusive green economy to achieve the set of
structural transformation goals. These enabling measures reinforce the processes already set
in motion. The national level enabling measures take precedence over those at the global level
since the former influence access to or the readiness to use the international level measures.
Enabling measures include high-level commitment and leadership, favourable
macroeconomic and policy frameworks including policy instruments and effective
implementation mechanisms at the national level; emerging institutional and strategic
frameworks for sustainable transformation and development at the regional and subregional
levels; and international agreements and conventions at the global level.
xv
Integrated assessment tools and methodologies
In Ethiopia, the commonly applied environmental and social assessment tools as
national decision-making instruments include the environmental impact assessment and the
integrated environmental and social assessment tools. However, their practical application has
been beset by weak enforcement capacity as a result of a lack of trained human resources. In
addition, the application of other analytical tools, such as the strategic environmental
assessment or poverty and social impact assessment, has been limited. Available and
commonly used modelling tools in Ethiopia include simple projections based on emission
factors, sector-specific models (e.g. cost-benefit analysis) and macroeconomic models based
on key macroeconomic variables, such as GDP, and population projections. Current efforts
are limited to direct environmental and social impacts of projects, with limited focus on
assessing the indirect impacts of inclusive green economy projects. Application of other
modelling tools, such as system-wide and general equilibrium models has not been commonly
used in key public institutions due to lack of capacity and skills. Other relevant analytical
tools include sustainable development indicators and green accounting. Application of
integrated assessment tools in Ethiopia indicates a huge capacity gap in public institutions,
suggesting a need for a comprehensive capacity development programme.
Challenges and opportunities in the development and implementation of inclusive
green economy strategies to reinforce structural transformation
Ethiopia faces a range of challenges in building an inclusive green economy:
inadequate funding and investment is one. Despite some progress, Ethiopia‟s overall revenue
generation performance has remained weak. Aid flows have declined as a share of GDP and
are likely to remain low due to spending cuts by donors in the face of the severe budget
deficits. Technological inadequacy is another challenge. Technology selection and adaptation
requires adequate institutional capacity, human resources and facilities, all of which are
scarce. Coping with that high population growth that is putting pressure on natural resources,
and enhancing capacity to create more „green jobs‟ are major challenge for the country. Lack
of timely and adequate data for the formulation, monitoring and evaluation of development
plans and interventions also poses challenges to the country.
Despite the number of challenges confronting Ethiopia in advancing an inclusive
green economy to foster structural transformation, there are also a number of opportunities
that the country can leverage. The commitment of top leadership to the inclusive green
economy concept and the existing pro-poor development plans are opportunities to advance
the approach. The country‟s low levels of industrialization will allow it to leapfrog
environmentally detrimental processes and promote green investment in the manufacturing
industries and infrastructure. In that regard, Ethiopia has the opportunity to promote and
invest in a low-emission transport and infrastructure sector through mass transport,
particularly railways. Huge renewable energy potential, especially hydropower and
geothermal energy creates opportunity for an inclusive green economy and attracts profitable
ventures in the sector. A trainable labour force and low labour costs are also opportunities for
the country to attract and encourage labour-intensive green activities, especially in the
manufacturing sector. International financial cooperation and availability of assistance and
access to environmental funds are another opportunity.
xvi
Conclusion and recommendations
Overall, the Government of Ethiopia is determined to transform the country into a
middle-income country with zero-net carbon emissions by 2025 by implementing the Growth
and Transformation Plan and the Climate-Resilient Green Economy Strategy. Strong linkages
exist between the Plan and the Strategy. In order for the Strategy to foster structural
transformation and promote inclusiveness, a number of deliberate, concerted and proactive
measures in different areas are needed, including the following:
(i) The Strategy needs to be improved by explicitly integrating social concerns
into its economic and environmental dimensions both in the strategy document
and at the implementation level. Alignment of the social aspects of the Strategy
with the country‟s structural transformation plan is also required to identify the
distributional consequences and compensation mechanisms of pursuing an
inclusive green economy pathway;
(ii) Climate-resilient green economy policy instruments, indicators, and targets
should be harmonized with those of the Growth and Transformation Plan so
that synergies and trade-offs among the economic, environmental and social
dimensions, and across sectors can be easily identified and assessed. In light of
this, the Strategy needs to be expanded to incorporate other targets that will
enable comparability with the country‟s subsequent medium-term plans such as
the second Growth and Transformation Plan;
(iii) Monitoring and evaluation of climate-resilient green economy policies is
important. Efforts to regularly monitor implementation of the Strategy should
be mainstreamed into the country‟s structural transformation goals and plans to
maximize their synergies and minimize trade-offs. An effective system for
monitoring and evaluating progress in the implementation of relevant policies
and programmes should therefore be established. However, the Strategy targets
should be broadened to capture economic, social and environmental variables
for effective monitoring and evaluation;
(iv) Progress towards an inclusive green economy should be continuously assessed
and green industries and jobs monitored and reported on as part of the
country‟s statistics. This requires the strengthening of domestic capacity to
collect environmental and social statistics, which are necessary for designing
inclusive green economy indicators;
(v) Firms should be incentivized to improve resource productivity, through for
example, subsidizing the adoption of clean or environmentally-sound
technologies and promoting green foreign direct investment;
(vi) Access to inclusive green economy finance should be enhanced through, for
example, establishing a special window for firms engaged in green initiatives.
Loans or credit facilities need to be availed not only for investment, but also
for capitalizing on green initiatives. In addition, direct funds at reduced interest
rates should be extended to firms engaged in green production with the use of
domestic resources, in order to encourage intersectoral linkages. This involves
xvii
preferential treatment of firms that use local resources as inputs in their
manufacturing process;
(vii) The national income accounting framework needs to be expanded to include
inclusive metrics by integrating environmental or natural resource accounting
into the existing economic accounts;
(viii) A comprehensive capacity development programme should be developed and
implemented to strengthen the capability of key government institutions,
especially to apply and use analytical tools for integrated assessment of
inclusive green economy policies and strategies. Some of the tools and
methodologies include environmental and social assessment, development
planning and policy analysis models, and governance analysis tools. In this
regard, support such as on-the-job training and short-and long-term training,
which can be implemented in collaboration with (local) universities and
research institutes, should be promoted. In addition, continuous capacity
development programmes need to be designed to enhance awareness and
knowledge of the inclusive green economy/climate-resilient green economy
concepts for middle and lower government officials. Moreover, extensive
awareness creation programmes regarding inclusive green economy/climate-
resilient green economy concepts for communities at the grass-roots level
should be implemented. These programmes can be integrated into the ongoing
mass mobilization and training efforts, which can be organized and delivered
through Farmer Training Centres in rural areas.

xviii
Key messages
Structural transformation is crucial to addressing Ethiopia’s key development needs and
challenges. In order to ensure the sustainability of this transformation, it should be carried out
in a manner that at the same time ensures sustained economic growth, social development and
environmental protection.
An inclusive green economy is increasingly recognized as a pathway that can lead to
sustainable development enabling a low-carbon and climate-resilient approach, improved
resource efficiency, healthy and more resilient environment, greater economic
opportunities and inclusive societies. In this regard, alignment of inclusive green economy
policies and strategies with domestic priorities not only minimizes trade-offs in the short-
term, but also helps to accrue the benefits of inclusive green economy interventions and
structural transformation in the short and medium term.
The green economy vision, as articulated in the Climate-Resilient Green Economy Strategy,
is not only consistent with the structural transformation plan of Ethiopia, but also
reinforces the country’s long-term economic vision. Local relevance and feasibility,
alignment with the Growth and Transformation Plan, and low-cost abatement potential have
been key to enhancing synergies between environmental, social, and economic development
outcomes.
The climate-resilient green economy policy development and implementation processes
have been driven by high-level government leadership, which has been crucial in attracting
and sustaining support from different stakeholders, with strong mandates and objectives.
The development of strong and dynamic coalitions among State and non-State actors was
instrumental in ensuring that this high-level support is maintained during political transitions.
Having a shared vision and values agreed by stakeholders from the outset is paramount for
continuity and stability when leadership changes.
Consistent and coherent policies are needed to reinforce structural transformation.
Consistency between the Growth and Transformation Plan, the Climate-Resilient Green
Economy Strategy and other inclusive green economy policy instruments at the national level
is crucial in supporting a green transformation and enhancing the synergies between inclusive
green economy policies and structural transformation strategies.
Given that inclusive green economy policies and strategies cut across different sectors and
institutions, maintaining horizontal coherence among the different sectoral strategies is crucial
to reinforcing the transformation agenda and thereby achieving the country‟s vision to achieve
middle-income status along the green trajectory path.
Alignment of the Climate-Resilient Green Economy Strategy indicators and targets with
those of the Growth and Transformation Plan is important for identifying synergies
between the two approaches and assessing trade-offs among the economic, environmental
and social dimensions. Harmonization of targets and indicators between the Strategy and the
Plan will facilitate the development and implementation of a unified monitoring and
evaluation system within the framework of the Growth and Transformation Plan.

xix
Following green economy development pathway entails both green economy and ‘green
society’. Accordingly, the Climate-Resilient Green Economy Strategy needs to be further
improved by adequately integrating the social or inclusiveness dimension in policy design and
implementation, and in so doing, strengthen the links between the Growth and Transformation
Plan and inclusive green economy strategies.
Ethiopia largely depends on natural resource-based sectors to propel growth and
transformation. Achieving sustainable growth and transformation requires the use of
resources in a more efficient and rational manner.
Inclusive green economy policies and strategies have the potential to reinforce structural
transformation, but there are significant challenges that must be overcome to advance and
promote an inclusive green economy in Ethiopia. Opportunities that can be capitalized upon
include high-level Government commitment and leadership, low levels of industrialization,
low urbanization, huge renewable energy potential, a trainable labour force and low labour
costs, and access to international cooperation and support.
A suite of enabling measures is required to build an inclusive green economy. These
include: international agreements and conventions at the global level; emerging institutional
and strategic frameworks for sustainable transformation and development at the regional and
subregional levels; and high-level commitment and leadership, appropriate policy frameworks
and effective implementation mechanisms at the national level.
The transition to an inclusive green economy requires an extended set of new metrics that
go beyond the prevailing focus mainly on economic indicators..In that regard, there is a need
to institutionalize and build local capacity on the development and use of integrated
assessment tools and methodologies for analysing and assessing economic, social and
environmental progress and well-being.
1. Introduction
The progress made in adopting reforms collectively and individually by African
countries in the past, and the achievements in terms of sustained growth have been
impressive. However, many African countries remain home to the world‟s highest proportion
of poor people and are not on track to meet some of the Millennium Development Goals,
especially in human and social development. Additionally, there is widespread concern that
this strong growth has not created sufficient productive employment in many African
countries to lift large numbers of the population out of poverty (International Labour
Organization (ILO), 2013; McKinsey, 2012).5 Africa‟s impressive growth can therefore be
described as largely non-inclusive because of its limited contribution to job creation (United
Nations Economic Commission for Africa (ECA), 2011).
Ethiopia, like other African countries, has achieved impressive growth, but with
similar shortcomings and concerns. The challenge confronting Africa in general and Ethiopia
in particular therefore is to translate the rapid economic growth into sustained and inclusive
development that creates productive jobs, reduces poverty and inequality, and enhances
access to basic services. Cognizant of this, Ethiopia has embarked on a structural
transformation agenda as reflected in its Growth and Transformation Plan adopted in
2010/2011.Structural transformation, according to Kuznets (1966, 1989), is one that is
characterized by a growing share of modern manufacturing and services and a declining share
of agriculture in both output and employment, a rapid shift in the location of economic
activities from rural to urban areas, and demographic transition from high birth rate-high
death rate to low birth-low death rates. Such transformation requires the expansion of
economic activities and economic growth accompanied by the sustainable use of natural
resources and maintenance of harmony in society, which, inter alia, necessitates the
prevalence of high level of employment and low inequality and poverty. The overarching goal
of structural transformation through expansion of modern economic activities with
urbanization and demographic transition on the one hand, and environmental protection,
sustainable use of natural resources and social sustainability on the other could be competing
or complementary goals depending on the development strategy pursued.
Although rapid growth is necessary to meet the urgent development needs of the poor,
growth will be unsustainable in the long run unless it is both socially inclusive and
environmentally friendly (World Bank, 2012). As there is widespread acceptance that
economic and social crises combined with unsustainable approaches to the environment no
longer work, countries have been exploring new models of development (United Nations
Environment Programme (UNEP), 2009). There is increasing recognition that economies
need to be guided by development policies and strategies with the aim of attaining economic,
environmental, and social sustainability. Such an economy is termed an inclusive green
economy. An inclusive green economy ensures that the Earth‟s natural assets adequately
provide the resources and environmental services on which humans depend and enables an
inclusive improvement to people‟s living standards. Given that the goal of an inclusive green
economy is to reduce poverty, promote equity, and create remunerative opportunities without
harming the environment, there is a need to integrate these aspects into national development
plans and policies.
5 On average, about 72 per cent of the youth population in Africa lives on less than two dollars a day. In addition,
youth unemployment is estimated at 23.7 per cent in North Africa and 11.8 per cent in sub-Saharan Africa (ILO,
2013). In Ethiopia, the youth unemployment rate was 6.8 per cent in 2014, much lower than the sub-Saharan
average.
2
Ethiopia is one of the leading countries in terms of developing a green economy
strategy, namely the Climate-Resilient Green Economy Strategy (Federal Democratic
Republic of Ethiopia, 2011). The goal of the Strategy is to transform the economy from low-
income country status to a middle-income country status through a rapid economic growth
path that at the same time reduces greenhouse gas emissions, and improves resilience to
climate change. The extent to which the Strategy objectives and strategies dovetail with the
Growth and Transformation Plan in promoting structural transformation is yet to be assessed.
Likewise, the linkages and synergies between other inclusive green economy-related
strategies and structural transformation plans still have to be reviewed, which underscores the
importance of this report.
1.1 Conceptual framework
Inclusive green economy, a hybrid term combining „inclusive economy‟ with „green
economy‟, is the latest addition to the development discourse (Poverty Environment
Partnership, 2012). The concept of an inclusive green economy focuses on reducing
environmental risks and ecological scarcities and improving human well-being and social
equity (UNEP, 2012).By so doing, the inclusive green economy path overcomes economic
free-fall, pervasive climate change, resource depletion, a rapidly increasing population, and
debilitating poverty (Lipman and others,2013). It is a development model promoted by
various actors with nuances on its modality and objectives.
According to the Organization for Economic Cooperation and Development (OECD)
(2012), green growth refers to enhancing growth and development while conserving the
natural assets on which human beings depend for their livelihoods. A green growth path
fosters environmentally sustainable and low carbon development (United Nations, 2013;
UNEP, 2011). In a green economy setting, public and private investments are key engines of
growth in income and employment that reduce carbon emissions and pollution, enhance
energy and resource efficiency, and prevent the loss of environmental assets. Similarly, ECA
(2015a) views inclusive green growth as a development path that results in sustained
economic growth, social inclusion, human welfare improvement, resource efficiency, decent
and green employment creation, and environmental protection, thereby contributing to
poverty reduction and sustainable development.
Recognizing that green growth is a prerequisite for building a green economy,
greening the economy requires the maintenance and recognition of ecological integrity, goods
and services through policies that address market failures arising from open access of
environmental resources, and that correct prices through various instruments.6Both developed
and developing economies alike undertake investments, which they consider as priority areas,
and such investments interact with the environment and society. Investments that are not
environmentally friendly and that neglect renewable energy, sustainable practices in
agriculture, industry, natural resources management and the protection of ecosystems, will
have long-term costs for society, although they may lead to private gains in the short term.
Sustainable investment has now become the slogan of countries with a general understanding
of the long-term global effects on the environment of investments and businesses that aim to
capture the opportunities arising from environmentally friendly investments. Green growth is
6Although the literature on how to make growth greener dates back to the 1950s and provides range of
instruments such as environmental taxation, norms, and regulations as a green growth strategy, their
implementation has been beset by several problems including market failures, governance problems, and
coordination failures (World Bank, 2012).
3
characterized by the allocation of resources to economic activities that would improve natural
capital or reduce ecological scarcities and environmental risks (United Nations, 2013).
In greening the economy, conscious efforts are needed to address equity issues, with
emphasis on social development as a key element. ILO and its constituents (governments,
employers and employees) have identified priorities for social development. These include
job creation, decent employment and sustainable livelihoods, guaranteed rights at work for
recognition and respect of workers, adequate social protection to enjoy safe working
conditions with adequate health care, and dialogue promotion to build cohesive societies. It is
based on the understanding that work is a source of personal dignity, family stability, peace in
the community and economic growth that expands opportunities for productive jobs and
enterprise development. Broad-based growth, through productivity growth and employment
generation, is the key mechanism of reducing unemployment, poverty, the growing
inequalities and the accompanying social unrest and industrial conflicts (Lederman, 2013).
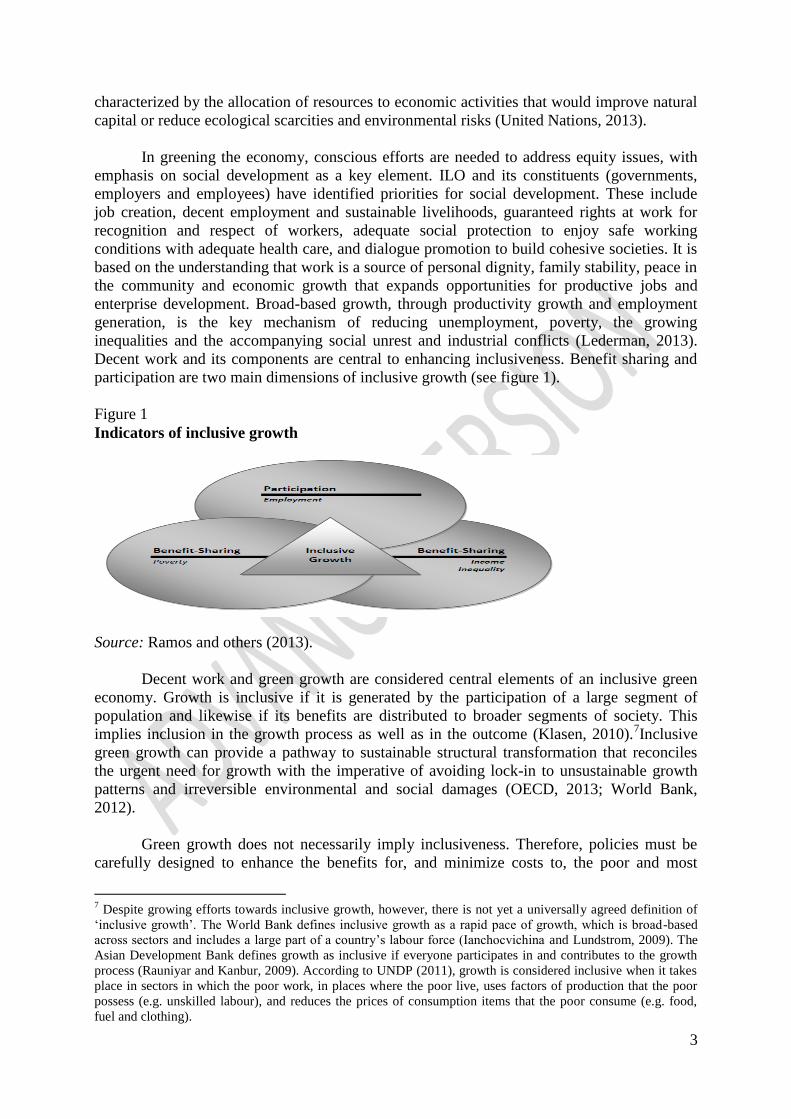
Decent work and its components are central to enhancing inclusiveness. Benefit sharing and
participation are two main dimensions of inclusive growth (see figure 1).
Figure 1
Indicators of inclusive growth
Source: Ramos and others (2013).
Decent work and green growth are considered central elements of an inclusive green
economy. Growth is inclusive if it is generated by the participation of a large segment of
population and likewise if its benefits are distributed to broader segments of society. This
implies inclusion in the growth process as well as in the outcome (Klasen, 2010).7Inclusive
green growth can provide a pathway to sustainable structural transformation that reconciles
the urgent need for growth with the imperative of avoiding lock-in to unsustainable growth
patterns and irreversible environmental and social damages (OECD, 2013; World Bank,
2012).
Green growth does not necessarily imply inclusiveness. Therefore, policies must be
carefully designed to enhance the benefits for, and minimize costs to, the poor and most
7 Despite growing efforts towards inclusive growth, however, there is not yet a universally agreed definition of
„inclusive growth‟. The World Bank defines inclusive growth as a rapid pace of growth, which is broad-based
across sectors and includes a large part of a country‟s labour force (Ianchocvichina and Lundstrom, 2009). The
Asian Development Bank defines growth as inclusive if everyone participates in and contributes to the growth
process (Rauniyar and Kanbur, 2009). According to UNDP (2011), growth is considered inclusive when it takes
place in sectors in which the poor work, in places where the poor live, uses factors of production that the poor
possess (e.g. unskilled labour), and reduces the prices of consumption items that the poor consume (e.g. food,
fuel and clothing).

4
vulnerable. By doing so, green growth could facilitate the transition to an inclusive green
economy that would lead to sustainable development. Similarly, inclusive growth may not
necessarily entail green growth, but it can be made green through targeted policies and
strategies to enhance resource efficiency and ecological assets. Formulating policies and
strategies, identifying priority and green sectors and streamlining policies in those sectors of
the economy are steps that need to be taken in phases, together with commitment to monitor
and evaluate the performance in the subsequent periods.
Hence building an inclusive green economy encompasses socioeconomic and
environmental transformation through growth of a particular quality. The United Nations
Economic and Social Commission for Asia and the Pacific (ESCAP) identifies three
dimensions of quality growth: ecological quality, economic quality, and social quality, which
correspond to the three dimensions of sustainable development (see figure 2) (ESCAP, 2013).
From a sustainable development perspective, both inclusive growth and green growth are key
aspects of quality growth, which unites economic, social and environmental qualities of
growth in a single conceptual framework. According to ESCAP (2013), five determinants of
the quality of growth can be identified: distribution (e.g. equity and access); efficiency and
productivity (e.g. efficient resource use, labour/or capital productivity, and total factor
productivity.); structural transformation (e.g. a move from low value added to higher value
added, and economic diversification); balancing capital investment (e.g. investment in human
and natural capital); and recognizing limits (e.g. policy targets and limits to resource use).
The adoption of inclusive green economy policies and strategies improves the
inclusiveness and greenness of structural transformation and promotes a structural change that
focuses on “green” activities and services, and sustainable infrastructure development
(ESCAP, 2011).
Figure 2
Key elements of quality of growth
Source: ESCAP (2013).
5
1.2 Framework for linking inclusive green economy and structural
transformation
Ethiopia‟s climate-resilient green economy provides a basis to explore the linkages
and contribution of those policies and strategies to the structural transformation of Ethiopia.
The structural transformation plans of the country are enshrined in its successive five-year
development plans: the Sustainable Development and Poverty Reduction Programme; the
Plan for Accelerated and Sustained Development to End Poverty; and the Growth and
Transformation Plan. Drawing from the ESCAP quality of growth approach, a conceptual
framework has been developed to assess the vertical consistency and horizontal coherence
between the Climate-Resilient Green Economy Strategy and the Growth and Transformation
Plan (see figure 3).
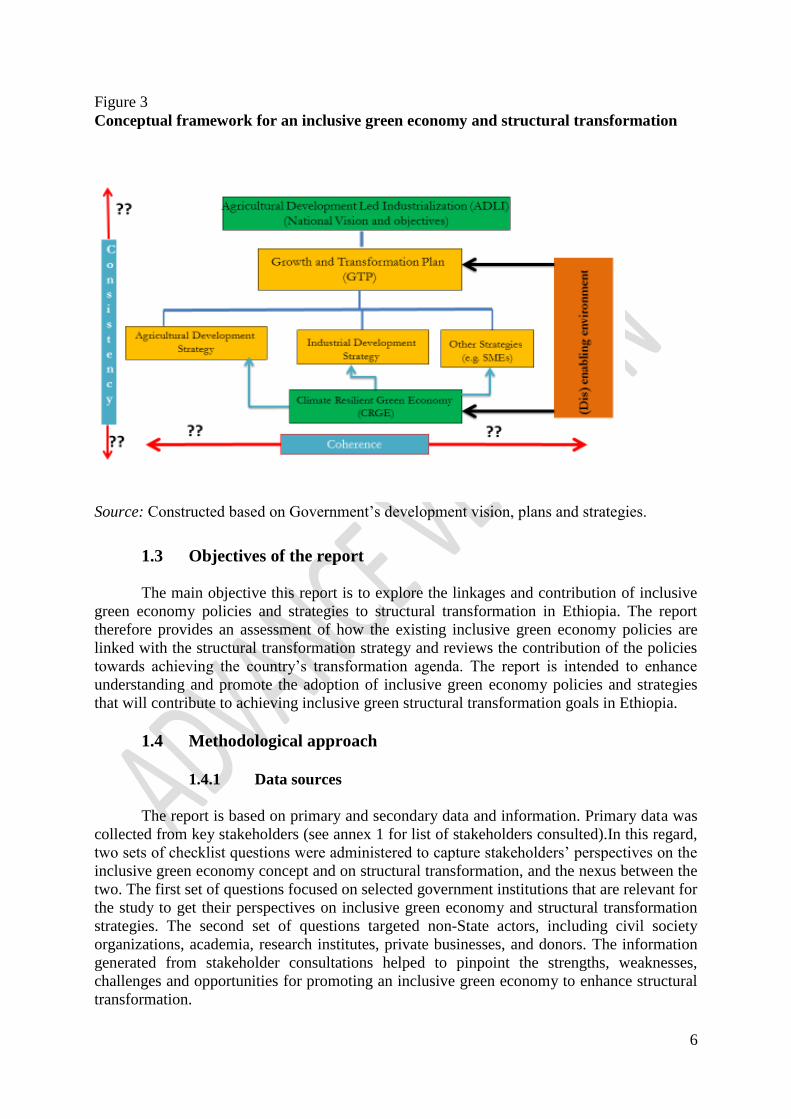
The framework provides the space for analysis to check or verify the vertical
consistency and horizontal coherence of policies and strategies. Vertical consistency refers to
whether or not climate-resilient green economy policies and strategies contribute to the
overarching goals and aspirations of the Government of Ethiopia. Vertical consistency checks
whether the policies and strategies lead to structural transformation, and whether they address
the key impediments for structural transformation. Horizontal coherence refers to how
sectoral development policies and strategies for a climate-resilient green economy and others
reinforce each other; whether or not there are conflicts between climate-resilient green
economy interventions and agricultural, industrial and other development policies and
strategies. Horizontal coherence helps to answer whether there are synergies or trade-offs
between climate-resilient green economy sectoral strategies and other sectoral strategies.
The adopted framework incorporates the pillars of the inclusive green economy
concept and helps to assess the interdependence among economic, environmental, and social
aspects by focusing on consistency and coherence of the climate-resilient green economy
policies and other policies and strategies with those indicated in the Growth and
Transformation Plan. It does so in four stages. First, an assessment of inclusive green
economy-related macroeconomic and sectoral policies and strategies, the Climate-Resilient
Green Economy Strategy and the Growth and Transformation Plan made on the basis of
existing studies and documents. In the second stage, the synergies and conflicts of the
Strategy and other relevant macroeconomic and sectoral policies and strategies with the
Growth and Transformation Plan were analysed. This was done mainly in a qualitative way,
as many of the issues at stake, such as harmonization of strategies, compatibility and
sequencing issues are not suitable for a quantitative assessment. In the third stage, a
comparison was made of national and global situations, challenges and opportunities. In the
fourth stage, identification and analysis of stakeholders‟ perspectives and assessment of actual
implementation and best practices are carried out based on stakeholder consultations and the
outcomes of investigations. This stage highlights Ethiopia‟s standing in the achievement of
structural transformation and the progress made in building an inclusive green economy under
the current setting and direction of implementation of its policies and strategies.
6
Figure 3
Conceptual framework for an inclusive green economy and structural transformation
Source: Constructed based on Government‟s development vision, plans and strategies.
1.3 Objectives of the report
The main objective this report is to explore the linkages and contribution of inclusive
green economy policies and strategies to structural transformation in Ethiopia. The report
therefore provides an assessment of how the existing inclusive green economy policies are
linked with the structural transformation strategy and reviews the contribution of the policies
towards achieving the country‟s transformation agenda. The report is intended to enhance
understanding and promote the adoption of inclusive green economy policies and strategies
that will contribute to achieving inclusive green structural transformation goals in Ethiopia.
1.4 Methodological approach
1.4.1 Data sources
The report is based on primary and secondary data and information. Primary data was
collected from key stakeholders (see annex 1 for list of stakeholders consulted).In this regard,
two sets of checklist questions were administered to capture stakeholders‟ perspectives on the
inclusive green economy concept and on structural transformation, and the nexus between the
two. The first set of questions focused on selected government institutions that are relevant for
the study to get their perspectives on inclusive green economy and structural transformation
strategies. The second set of questions targeted non-State actors, including civil society
organizations, academia, research institutes, private businesses, and donors. The information
generated from stakeholder consultations helped to pinpoint the strengths, weaknesses,
challenges and opportunities for promoting an inclusive green economy to enhance structural
transformation.
7
Relevant policy and other documents related to an inclusive green economy and
structural transformation were reviewed to acquire secondary data. Among the documents
reviewed were the Climate-Resilient Green Economy Strategy, the Growth and
Transformation Plan, the Sustainable Development and Poverty Reduction Programme and
the Plan for Accelerated and Sustained Development to End Poverty. Other publications
reviewed included annual progress reports for the Growth and Transformation Plan, reports of
the Central Statistical Agency(e.g. national labour force surveys; house hold income,
consumption and expenditure surveys; urban employment and unemployment surveys; and
agricultural sample surveys), and reports by the Ministry of Education, such as education
abstracts, and the Ministry of Labour and Social Affairs.
1.4.2 Data analysis
The overall approach was inspired by the theories of structural transformation and
recent international research work on the green economy. The three strands of work of
particular relevance for the analysis are: are view of the role of structural transformation in
economic development; green growth, and more generally, the green economy; best practices
and lessons learned from government policy and interventions in the area of green economy.
An eclectic approach was used to analyse information generated from different
sources. Accordingly, a two-pronged approach was adopted. First, desk work, which involved
the review of a wide range of policy documents and studies, including government policy
documents and strategies, proclamations, directives, and other regulations. The desk review
process also involved quantitative data analysis including productivity decomposition and
trend analysis. Second, analysis of qualitative data generated from consultation of key
stakeholders, in order to analyse factual information and elicit views on the inclusive green
economy approach and structural transformation in Ethiopia.
1.4.3 Peer review
The report was subjected to internal and external peer reviews that helped to plug
gaps, address factual errors and provided expert inputs to inform the revision of the various
draft versions of the report. In this regard, the report benefitted from comments and inputs
from internal peer review by the relevant ECA divisions and subregional offices. The report
was validated and enriched by inputs from the validation meeting organized jointly by ECA
and the Ministry of Finance and Economic Development. The meeting participants comprised
policymakers, experts and practitioners representing government ministries and agencies, the
private sector, academia, and civil society organizations working in areas related to structural
transformation and the green economy in Ethiopia. Representatives of United Nations
agencies and the African Development Bank also participated in the meeting.
1.5 Structure of the report
The report comprises nine main chapters. Chapter 2 deals with Ethiopia‟s
macroeconomic framework. The country‟s structural transformation agenda is discussed in
chapter 3 while chapter 4 presents an analysis of inclusive green economy policies and their
role and significance in fostering structural transformation in Ethiopia. Linkages and
coherence between inclusive green economy policies and those directly addressing structural
transformation in the country are discussed in chapter 5. Chapter 6 provides an analysis of
other enabling measures in place needed to facilitate the transition to an inclusive green

8
economy and contribute to structural transformation. Chapter 7 deals with existing analytical
tools for integrated assessment of inclusive green economy policies and strategies, and
chapter 8 discusses challenges to and opportunities for adopting inclusive green economy
policies to achieve structural transformation. Chapter 9 provides the conclusion and
recommendations.

9
2. Ethiopia’s macroeconomic framework
2.1 Overview of policies and strategies
The macroeconomic policy environment permeates the entire socioeconomic life of
society and shapes the evolution of the economy. It is in turn shaped by the existing
socioeconomic and political imperatives. This chapter reviews the country‟s macroeconomic
setting in relation to economic, social and environmental development imperatives and its
responsiveness to inclusive green economy principles and approaches.
The evolution over time of macroeconomic policy in Ethiopia reflects the economic
imbalances and political developments. The macroeconomic stabilization and structural
adjustment policies of the early 1990s were reversals of the policies of the preceding regime
heralding a break in continuity from the earlier political orientation. Subsequent
macroeconomic policies were responses to economic imperatives accentuated by political
changes.
In the early 1990s, Ethiopia went through a stabilization and structural adjustment
programme with the support of the International Monetary Fund and the World Bank.
Stabilization policies were short term in nature and intended to attain fiscal and monetary
balances, while structural adjustment policies were aimed at attaining long-term growth by
removing structural barricades through privatization and the lifting of market restrictions.
Specifically, the aim of the stabilization policy was to address the trade balance and extricate
the country from the cycle of foreign aid and high indebtedness in the external sector and
growing fiscal deficits domestically. The fiscal stances were fiscal discipline and
rationalization of public spending that involved retrenchment (Demeke and others, 2003).
Devaluation of the local currency (birr) was undertaken to stimulate exports and reduce the
trade imbalance. The aim of the structural adjustment programme was to unleash growth
mainly through the liberalization of prices and privatization of public enterprises.
Along with the stabilization and structural adjustment policies, the Agricultural
Development-Led Industrialization Strategy was introduced in 1995. This is because of the
strategic importance and centrality of the agricultural sector in the overall economy, and the
advantage in using the abundant resources of land and labour while progressively increasing
capital share in resource endowment. This strategy persisted in subsequent five-year
development plans including the Growth and Transformation Plan. Persistence of agricultural
development led industrialization seems to stem from the predominantly agrarian nature of
the economy and from perceived difficulty of stimulating socioeconomic development
without rural development in the Ethiopian context. It is abundantly clear that agricultural
development led industrialization is not an industrialization strategy per se but a prelude to the
industrialization strategy. An industrialization strategy puts emphasis on the manufacturing
sector as a leading sector for the onset of a sustained structural transformation of an economy
with largely agrarian origin. However, the experience of East Asian countries that succeeded
in transforming their economies indicated the importance of promoting the agriculture and
manufacturing sectors simultaneously (Ministry of Finance and Economic Development,
2014).
As happened elsewhere in the developing world, the stabilization and structural
adjustment policies were not successful in achieving the desired results in economic
performance. Not only was the GDP growth rate (annual average rate close to 5 per cent) low,

10
2011/12: SME
Development
Strategy,
Provision framework
and methods of
implementation
but it was also volatile. Inflation remained on average within single digits but trade
imbalances and the indebtedness of the country were high. Despite the overall socioeconomic
improvement compared with the 1980s, the prevalence of high levels of poverty by global
standards seemed to leave no other choice than to devise new strategies. The macroeconomic
outcomes in terms of high and sustained economic growth, improving social welfare and
reducing unemployment were not satisfactory because economic growth was volatile, and the
poverty headcount ratio remained high, at 45.5 per cent in 1995/96 and 44.2 per cent in
1999/2000 (Ministry of Finance and Economic Development, 2014). Emphasis was placed on
institutional changes and good governance, which it was believed would enable the earlier
reforms to work better. Hence, the Structural Adjustment Programme was succeeded by the
Poverty Reduction Strategy Programme, which underpinned the subsequent macroeconomic
and sectoral policies.
The interim Poverty Reduction Strategy Programme identified factors that would
enable macroeconomic stability while meeting the emergency needs of rehabilitation,
demobilization, reconstruction and support for the balance of payments between 2000/01 and
2002/03 (Government of Ethiopia, 2000). These factors were external resource inflow and
internal capacity to increase the aggregate output level. The interim Poverty Reduction
Strategy Programme gave rise to the development of subsequent plans and strategies such as
the Sustainable Development and Poverty Reduction Programme, the Industrial Development
Strategy, the Plan for Accelerated and Sustained Development to End Poverty, the Growth
and Transformation Plan, and Small and Microenterprises Development Strategy, all of which
are geared to a social imperative of poverty reduction (see figure 4). Thus, macroeconomic
policies were designed to finance poverty reduction strategies and insulate the poor against
shocks.
Figure 4
Development plans and strategies underlying the macroeconomic policy developments
Source: Constructed based on Government‟s development plans and programmes.
The Sustainable Development and Poverty Reduction Programme made rural growth
central to poverty reduction and at the same time maintained macroeconomic stability
1992: Economic Recovery and
Reconstruction programme
1993: Structural Adjustment Programme
1995:Agricultural Development-Led Industrialization
2000/01: SDPRP
2005/06: PASDEP
2010 /11: Growth and
Transformation Plan 1999/2000: Interim
Poverty
Reduction Paper
2002/03: Industrial
Development Strategy
11
(Ministry of Finance and Economic Development, 2002, 2005). However, the major focus of
the Plan for Accelerated and Sustained Development to End Poverty was growth with greater
commercialization of agriculture and development of the private sector along with a scaling-up
of efforts to achieve the Millennium Development Goals. Growth in real GDP was envisaged
under macroeconomic stability and monetary expansion consistent with targets of single digit
inflation, a stable exchange rate and sustainable external sector development (Ministry of
Finance and Economic Development, 2005). The Plan for Accelerated and Sustained
Development to End Poverty was conceived and implemented while ongoing inflation was
gaining momentum. The monetary sector assumed a stable but slowly declining velocity,
which allowed broad money to grow at a slightly higher rate than nominal GDP.
On the fiscal front, tax revenue was projected to increase. It was also assumed that the
Government would continue a prudent expenditure policy, restraining public expenditure on
defence and non-priority sectors, protecting poverty-targeted outlays and capital expenditure,
while containing total spending within affordable limits. Expenditures were expected to
decline through the provision of debt relief assistance for Heavily Indebted Poor Countries
and from an effort being made to cover recurrent expenditures with domestic revenues.
Based on experiences implementing previous development plans, the macroeconomic
policy objectives of the Growth and Transformation Plan covering the period 2010/11 to
2014/15(Ministry of Finance and Economic Development, 2010) focus on maintaining
macroeconomic stability, particularly the resource and trade balance, which is meant to
encourage savings and investment possibly emanating from broad-based growth. The fiscal
policy focuses on maintaining the deficit at a sustainable level by strengthening domestic
revenue generation capacity while enhancing pro-poor public spending. Mobilizing external
grants and borrowing, without affecting macroeconomic balances, have also been envisaged.
Monetary policy continues to focus on price and exchange rate stability, with inflation to be
maintained at a single digit level by limiting money supply growth at a rate less than that of
nominal GDP growth. Adjustment of exchange rate has been made to facilitate export and
import substitution.
In addition to fiscal and monetary policies, other policies to insulate the poor and the
environment against shocks were put in place within the macroeconomic policy frameworks
of the poverty reduction strategy programmes. Social safety net programmes and
environmental policies were tailored. The Sustainable Development and Poverty Reduction
Programme focused on the environmental policy derived from the Conservation Strategy of
Ethiopia of 1997(Ministry of Finance and Economic Development 2002). Food security
programmes that incorporate productive safety net programmes, among others, were put in
place during the Plan for Accelerated and Sustained Development to End Poverty (Ministry of
Finance and Economic Development, 2005). The Plan included an environmental vision.
Policies and interventions targeted poverty reduction, gender equity and sustainable
development during the plan period. The Growth and Transformation Plan pursues a strategic
direction of green economy with objectives of formulating and effectively implementing
policies, strategies, laws and standards to enhance welfare and environmental sustainability
(Ministry of Finance and Economic Development, 2010).
12
2.2 Macroeconomic performance under various development strategies
2.2.1 Macroeconomic indicators
There was improvement in economic performance during the first generation of the
poverty reduction programme (Sustainable Development and Poverty Reduction Programme):
real GDP grew on average by 7 or 8 per cent per year between 2000/01 and 2004/05. The
performance of the agricultural sector was volatile due to adverse weather shocks, which
further impacted the overall economy. Economic growth further improved in the second
generation of poverty reduction programme (Plan for Accelerated and Sustained Development
to End Poverty), with real GDP growing by 10.8 per cent between 2005/06 and 2009/10. The
Government of Ethiopia, in its annual progress report, highlighted a decrease in poverty and
maternal and infant mortality rates, and improvements in access to education and health. The
report attributed this to economic reform, implementation of agriculture-led growth, and
resource inflow through external assistance in a macroeconomic policy environment of fiscal
discipline and non-expansionary monetary policy (see table 1).The macroeconomic targets set
in the second and third plan periods of the poverty reduction strategy programme process in
Ethiopia were informed by the poverty reduction targets established in the Millennium
Development Goals. Although fiscal deficit exhibited sharp increase in the Sustainable
Development and Poverty Reduction Programme period, it declined in subsequent plan
periods. Government spending on poverty-oriented sectors (e.g. agriculture, natural resources,
education, health and road construction) has remained around 12 per cent of GDP during the
Plan for Accelerated and Sustained Development to End Poverty and Growth and
Transformation Plan periods.
While growth performance was strong, especially during the most recent programme
periods, macroeconomic stability has remained an issue. Interest rates have been generally
negative in real8 terms, due to inflationary situation in the country, though it has shown a
declining trend recently. At the same time, Ethiopia was able to substantially increase its
investment share of GDP, from 20.5 per cent in 2004/05 to 33 per cent of GDP in 2012/13.
However, the gap between saving and investment remained high, leading to increased reliance
on capital inflows from abroad. Heavy dependence on external sources of investment
financing has led to the accumulation of external debt. Ethiopian external trade is
characterized by a widening gap between the value of exports and imports. The faster growth
of imports over exports tends to heavily burden the foreign reserves position and its financing
capacity for future consumption, investment and debt servicing. Attainment of higher
domestic saving to narrow the resource gap is another challenge for the economy in order to
ensure sustained growth.
8 The nominal saving interest rate is about 5 % while the rate at which money loses its value due to inflation is
much more than 5 % (it remained between 8 % and 40 %) in the period. The difference between the nominal
interest rate (5 %) and the inflation rate (greater than 5 %) is the real interest rate, which is negative.

13
Table 1 Macroeconomic indicators under different development plans
Indicators
2004/05:
Sustainable
Development
and Poverty
Reduction
Programme
2009/10: Plan
for Accelerated
and Sustained
Development
to End Poverty
2012/13:
Growth and
Transformation
Plan
GDP and sectoral growth rates (%)
Real GDP 12.6 10.6 9.7
Agriculture 13.5 7.9 7.1
Industry 9.4 10.8 18.5
Services 12.8 13.2 9.9
Saving and Investment
Gross domestic investment as % of GDP 20.5 24.0 33.0
Gross domestic saving as % of GDP 3.7 5.2 17.7
Price developments
Overall inflation rate 6.1 2.8 13.5
Food inflation rate 7.4 -5.4 41.7
Non-food inflation rate 4.4 14.7 22.2
Trade
Export of goods and services as % of GDP 15.3 13.8 12.7
Import of goods and services as % of GDP 35.8 33.3 28
Revenue and expenditure
Domestic revenue as % of GDP 15.8 14.0 14.6
Tax revenue as % of GDP 12.5 11.3 12.5
Total poverty-oriented expenditure as % of
GDP 14.2 12.3 12.6
Deficit as % of GDP ( including grants) 3.6 2.8 2.0
Deficit as % of GDP ( excluding grants) 8.8 6.1 3.5
Source: Ministry of Finance and Economic Development (2012, 2013, 2014).
2.2.2 Social indicators
The economy is now in the fourth implementation period of the Growth and
Transformation Plan, with an impressive record of economic and social progress. Poverty
incidence (or poverty headcount ratio) decreased from 38.7 per cent in 2004/05 to 29.6 per
cent in 2010/11, a reduction of 9.1 percent over six years (see figure 5) (Ministry of Finance
and Economic Development, 2013). Poverty declined in both rural and urban areas. The
percentage of people living below the poverty line has decreased, but in 2010/11 the rate of
decline in poverty was at a slower pace than the GDP growth rate (11.4 per cent). The boom
in construction activities, increased private sector investment in services and expansion of
small and medium enterprises might have contributed to a fall in urban poverty. However,
poverty severity increased by 14 per cent in 2010/11 compared with the 2004/05 level,
indicating that growth has failed to adequately reach the poorest segment of the population.
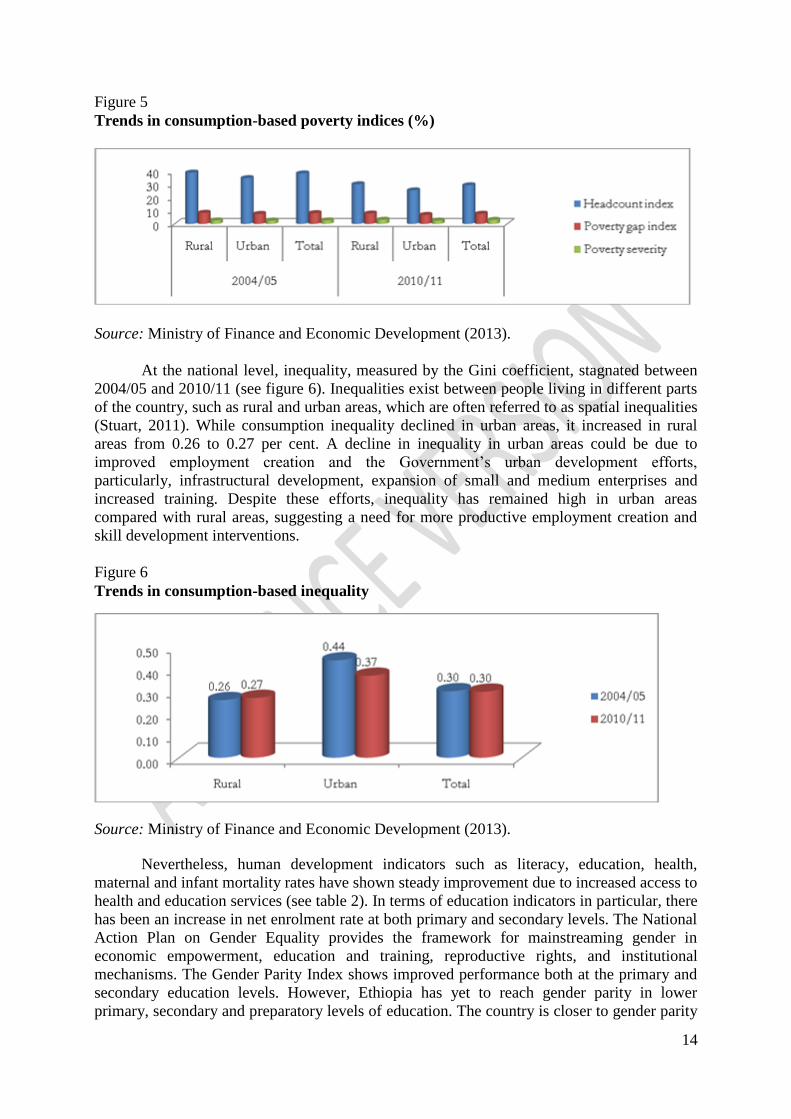
14
Figure 5
Trends in consumption-based poverty indices (%)
Source: Ministry of Finance and Economic Development (2013).
At the national level, inequality, measured by the Gini coefficient, stagnated between
2004/05 and 2010/11 (see figure 6). Inequalities exist between people living in different parts
of the country, such as rural and urban areas, which are often referred to as spatial inequalities
(Stuart, 2011). While consumption inequality declined in urban areas, it increased in rural
areas from 0.26 to 0.27 per cent. A decline in inequality in urban areas could be due to
improved employment creation and the Government‟s urban development efforts,
particularly, infrastructural development, expansion of small and medium enterprises and
increased training. Despite these efforts, inequality has remained high in urban areas
compared with rural areas, suggesting a need for more productive employment creation and
skill development interventions.
Figure 6
Trends in consumption-based inequality
Source: Ministry of Finance and Economic Development (2013).
Nevertheless, human development indicators such as literacy, education, health,
maternal and infant mortality rates have shown steady improvement due to increased access to
health and education services (see table 2). In terms of education indicators in particular, there
has been an increase in net enrolment rate at both primary and secondary levels. The National
Action Plan on Gender Equality provides the framework for mainstreaming gender in
economic empowerment, education and training, reproductive rights, and institutional
mechanisms. The Gender Parity Index shows improved performance both at the primary and
secondary education levels. However, Ethiopia has yet to reach gender parity in lower
primary, secondary and preparatory levels of education. The country is closer to gender parity

15
at the upper primary level than at any other level of education. In particular, gender inequality
is worrisome at preparatory9 level compared with other levels of education.
With regard to health-related indicators, improvements have been made, especially in
achieving universal access to basic health services: primary health services coverage reached
93 per cent in 2012/13. The proportion of births attended by skilled health personnel
improved from 5.7 per cent in 2005/06 to 23.1 per cent in 2012/13. Similarly, infant, maternal
and under-five mortality rates declined between 2005/6 and 2012/13, although some health-
related indicators such as maternal, infant, and under-five mortality rates showed no
improvement between 2010/11 and 2012/13.
Table 2
Key indicators of social progress
2010/11 2011/12 2012/13 Poverty and inequality indicators
Poverty incidence 38.7(2004/5) 29.6 (2010/11) 26
Inequality 0.30(2004/5) 0.30 (2010/11)
Health related indicators
Primary health services coverage (%) 96 93 93
Maternal mortality (per 100,000 live births) 676 676 676
Under-five child mortality rate (per 1,000 live births) 88 n.a. 88
Infant mortality rate (per 1,000 live births) 59 n.a. 59
Antenatal Care (%) 82.2 89.0 97.4
Postnatal services coverage (%) 42.1 44.5 50.5
Family planning services (%) 61.7 60.4 60.0
Proportion of births attended by skilled health
personnel (%) 16.6 20.4 23.1
Pentavalent vaccination coverage (%) 84.7 84.9 87.6
Education related indicators
Net primary (1-8) enrolment rate (%) 85.3 85.4 85.9
Net secondary (9-10) enrolment rate (%) 16.3 17.3 19.4
Adult education enrolment rate (%) 1.2 2.1 3.4
Primary school enrolment of girls to boys ratio 0.94 0.93 0.94
Gender Parity Index
Gender Parity Index at primary (1-8) level 0.95 0.90 0.94
Lower primary (1-4) 0.90 0.90 0.92
Upper primary (5-8) 0.96 1.0 0.98
Secondary (9-10) 0.83 0.90 0.92
Preparatory (11-12) 0.71 0.71 0.81
Notes: „n.a.‟-not available; Infant and maternal mortality rates for 2010/11 are obtained from
the 2011 Ethiopia Demographic and Health Survey;
Source: Ministry of Education for education data, and Ministry of Finance and Economic
Development (2014) for health-related indicators.
9 Preparatory level is grade 11 and 12 where prospective students for college education are served
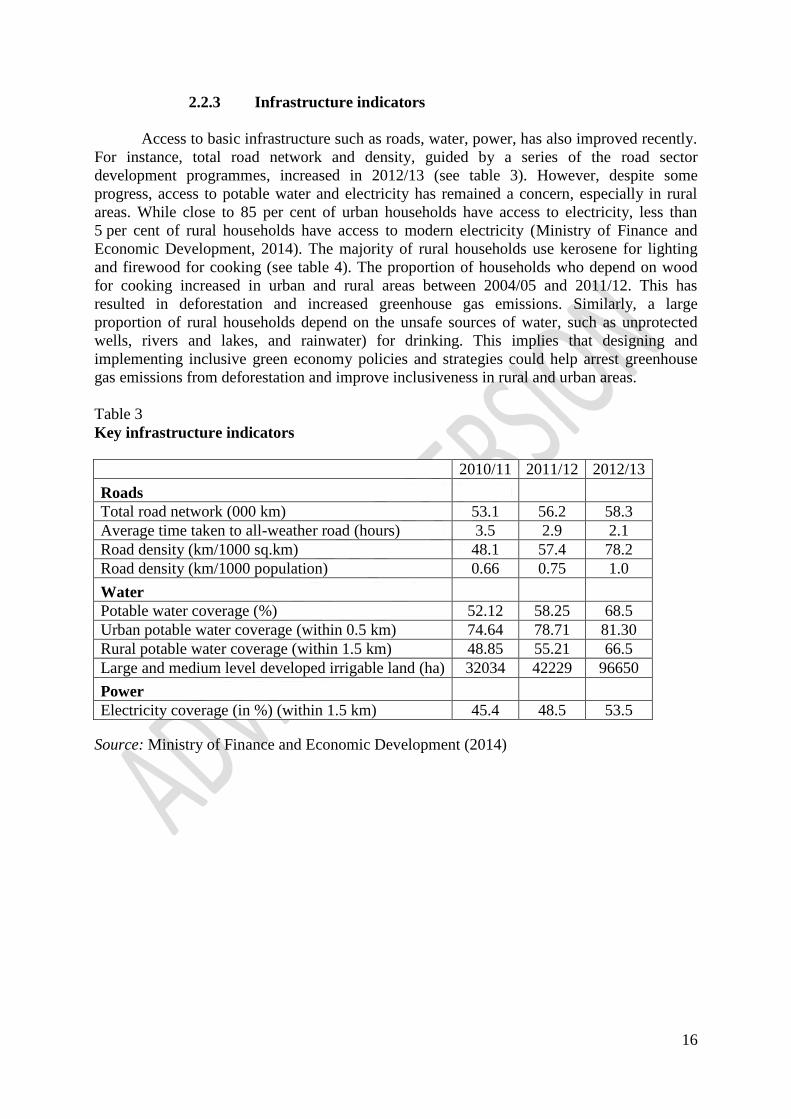
16
2.2.3 Infrastructure indicators
Access to basic infrastructure such as roads, water, power, has also improved recently.
For instance, total road network and density, guided by a series of the road sector
development programmes, increased in 2012/13 (see table 3). However, despite some
progress, access to potable water and electricity has remained a concern, especially in rural
areas. While close to 85 per cent of urban households have access to electricity, less than
5 per cent of rural households have access to modern electricity (Ministry of Finance and
Economic Development, 2014). The majority of rural households use kerosene for lighting
and firewood for cooking (see table 4). The proportion of households who depend on wood
for cooking increased in urban and rural areas between 2004/05 and 2011/12. This has
resulted in deforestation and increased greenhouse gas emissions. Similarly, a large
proportion of rural households depend on the unsafe sources of water, such as unprotected
wells, rivers and lakes, and rainwater) for drinking. This implies that designing and
implementing inclusive green economy policies and strategies could help arrest greenhouse
gas emissions from deforestation and improve inclusiveness in rural and urban areas.
Table 3
Key infrastructure indicators
2010/11 2011/12 2012/13
Roads
Total road network (000 km) 53.1 56.2 58.3
Average time taken to all-weather road (hours) 3.5 2.9 2.1
Road density (km/1000 sq.km) 48.1 57.4 78.2
Road density (km/1000 population) 0.66 0.75 1.0
Water
Potable water coverage (%) 52.12 58.25 68.5
Urban potable water coverage (within 0.5 km) 74.64 78.71 81.30
Rural potable water coverage (within 1.5 km) 48.85 55.21 66.5
Large and medium level developed irrigable land (ha) 32034 42229 96650
Power
Electricity coverage (in %) (within 1.5 km) 45.4 48.5 53.5
Source: Ministry of Finance and Economic Development (2014)
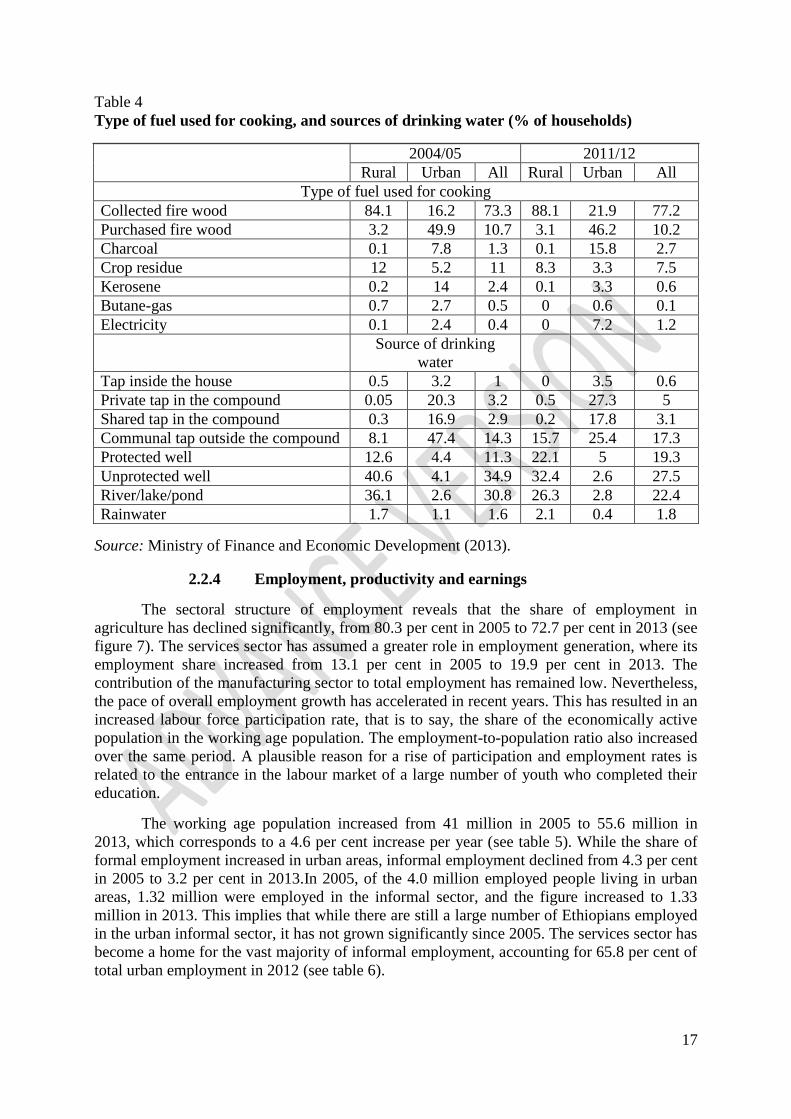
17
Table 4
Type of fuel used for cooking, and sources of drinking water (% of households)
2004/05 2011/12
Rural Urban All Rural Urban All
Type of fuel used for cooking
Collected fire wood 84.1 16.2 73.3 88.1 21.9 77.2
Purchased fire wood 3.2 49.9 10.7 3.1 46.2 10.2
Charcoal 0.1 7.8 1.3 0.1 15.8 2.7
Crop residue 12 5.2 11 8.3 3.3 7.5
Kerosene 0.2 14 2.4 0.1 3.3 0.6
Butane-gas 0.7 2.7 0.5 0 0.6 0.1
Electricity 0.1 2.4 0.4 0 7.2 1.2
Source of drinking
water
Tap inside the house 0.5 3.2 1 0 3.5 0.6
Private tap in the compound 0.05 20.3 3.2 0.5 27.3 5
Shared tap in the compound 0.3 16.9 2.9 0.2 17.8 3.1
Communal tap outside the compound 8.1 47.4 14.3 15.7 25.4 17.3
Protected well 12.6 4.4 11.3 22.1 5 19.3
Unprotected well 40.6 4.1 34.9 32.4 2.6 27.5
River/lake/pond 36.1 2.6 30.8 26.3 2.8 22.4
Rainwater 1.7 1.1 1.6 2.1 0.4 1.8
Source: Ministry of Finance and Economic Development (2013).
2.2.4 Employment, productivity and earnings
The sectoral structure of employment reveals that the share of employment in
agriculture has declined significantly, from 80.3 per cent in 2005 to 72.7 per cent in 2013 (see
figure 7). The services sector has assumed a greater role in employment generation, where its
employment share increased from 13.1 per cent in 2005 to 19.9 per cent in 2013. The
contribution of the manufacturing sector to total employment has remained low. Nevertheless,
the pace of overall employment growth has accelerated in recent years. This has resulted in an
increased labour force participation rate, that is to say, the share of the economically active
population in the working age population. The employment-to-population ratio also increased
over the same period. A plausible reason for a rise of participation and employment rates is
related to the entrance in the labour market of a large number of youth who completed their
education.
The working age population increased from 41 million in 2005 to 55.6 million in
2013, which corresponds to a 4.6 per cent increase per year (see table 5). While the share of
formal employment increased in urban areas, informal employment declined from 4.3 per cent
in 2005 to 3.2 per cent in 2013.In 2005, of the 4.0 million employed people living in urban
areas, 1.32 million were employed in the informal sector, and the figure increased to 1.33
million in 2013. This implies that while there are still a large number of Ethiopians employed
in the urban informal sector, it has not grown significantly since 2005. The services sector has
become a home for the vast majority of informal employment, accounting for 65.8 per cent of
total urban employment in 2012 (see table 6).
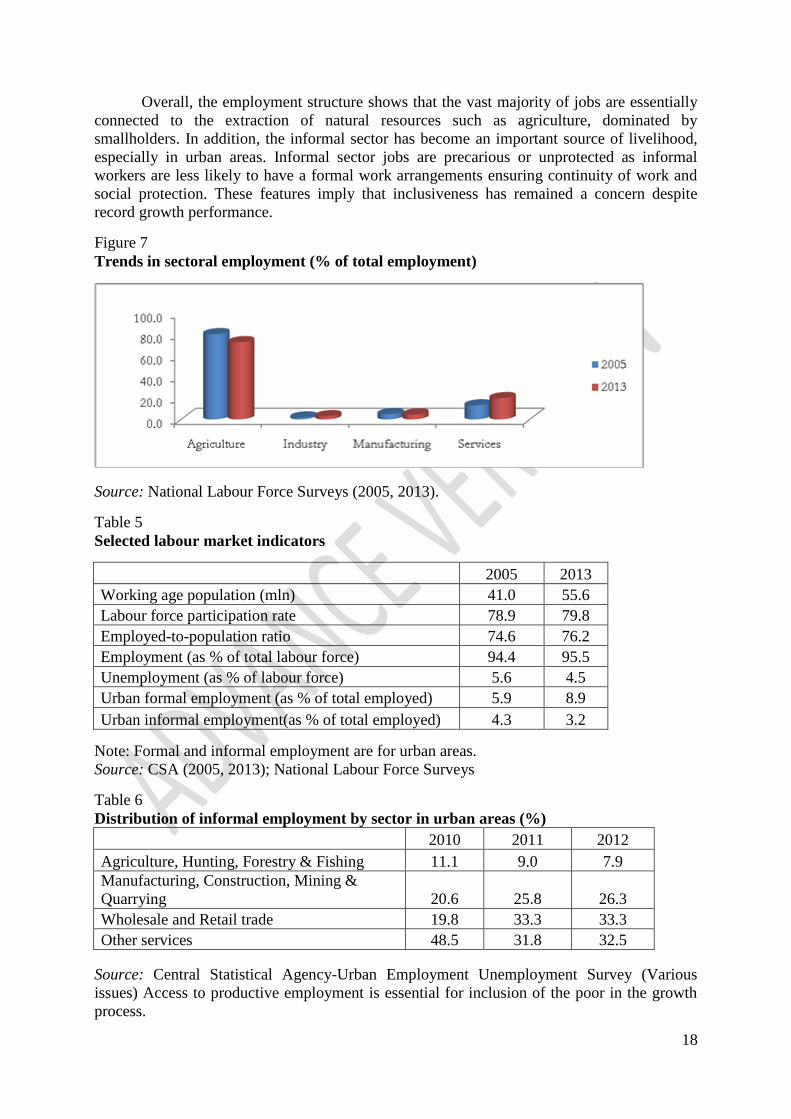
18
Overall, the employment structure shows that the vast majority of jobs are essentially
connected to the extraction of natural resources such as agriculture, dominated by
smallholders. In addition, the informal sector has become an important source of livelihood,
especially in urban areas. Informal sector jobs are precarious or unprotected as informal
workers are less likely to have a formal work arrangements ensuring continuity of work and
social protection. These features imply that inclusiveness has remained a concern despite
record growth performance.
Figure 7
Trends in sectoral employment (% of total employment)
Source: National Labour Force Surveys (2005, 2013).
Table 5
Selected labour market indicators
2005 2013
Working age population (mln) 41.0 55.6
Labour force participation rate 78.9 79.8
Employed-to-population ratio 74.6 76.2
Employment (as % of total labour force) 94.4 95.5
Unemployment (as % of labour force) 5.6 4.5
Urban formal employment (as % of total employed) 5.9 8.9
Urban informal employment(as % of total employed) 4.3 3.2
Note: Formal and informal employment are for urban areas.
Source: CSA (2005, 2013); National Labour Force Surveys
Table 6
Distribution of informal employment by sector in urban areas (%)
2010 2011 2012
Agriculture, Hunting, Forestry & Fishing 11.1 9.0 7.9
Manufacturing, Construction, Mining &
Quarrying 20.6 25.8 26.3
Wholesale and Retail trade 19.8 33.3 33.3
Other services 48.5 31.8 32.5
Source: Central Statistical Agency-Urban Employment Unemployment Survey (Various
issues) Access to productive employment is essential for inclusion of the poor in the growth
process.
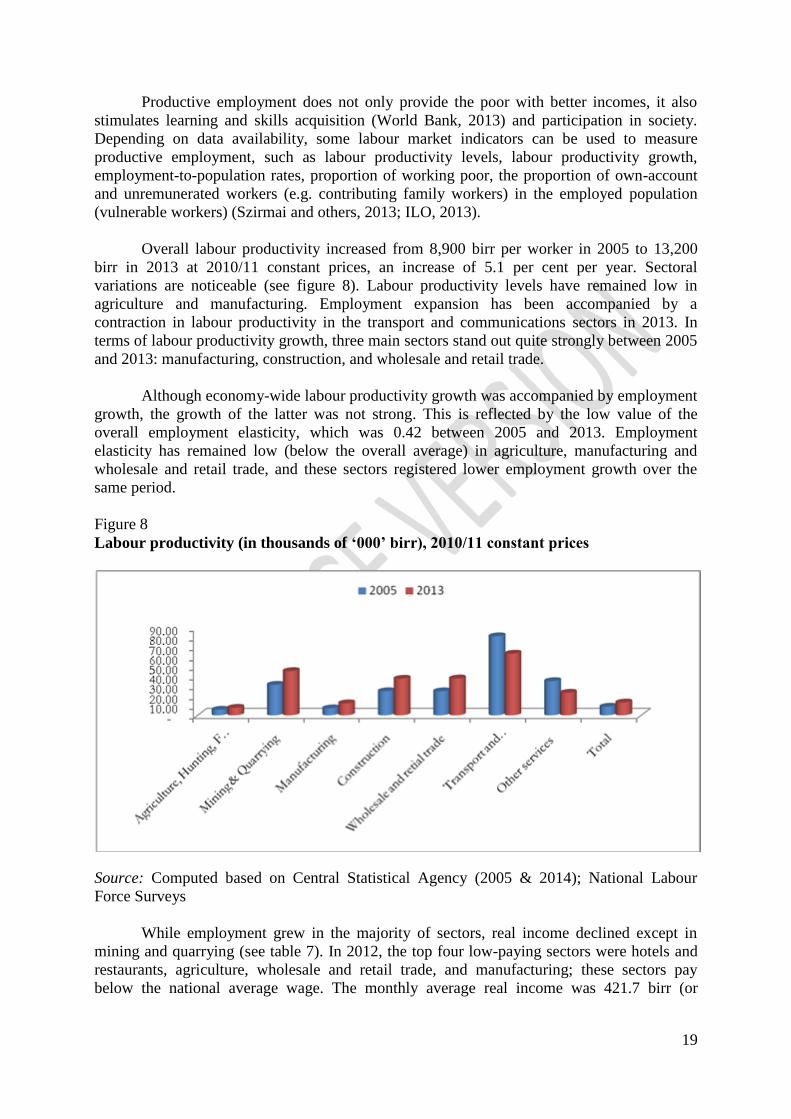
19
Productive employment does not only provide the poor with better incomes, it also
stimulates learning and skills acquisition (World Bank, 2013) and participation in society.
Depending on data availability, some labour market indicators can be used to measure
productive employment, such as labour productivity levels, labour productivity growth,
employment-to-population rates, proportion of working poor, the proportion of own-account
and unremunerated workers (e.g. contributing family workers) in the employed population
(vulnerable workers) (Szirmai and others, 2013; ILO, 2013).
Overall labour productivity increased from 8,900 birr per worker in 2005 to 13,200
birr in 2013 at 2010/11 constant prices, an increase of 5.1 per cent per year. Sectoral
variations are noticeable (see figure 8). Labour productivity levels have remained low in
agriculture and manufacturing. Employment expansion has been accompanied by a
contraction in labour productivity in the transport and communications sectors in 2013. In
terms of labour productivity growth, three main sectors stand out quite strongly between 2005
and 2013: manufacturing, construction, and wholesale and retail trade.
Although economy-wide labour productivity growth was accompanied by employment
growth, the growth of the latter was not strong. This is reflected by the low value of the
overall employment elasticity, which was 0.42 between 2005 and 2013. Employment
elasticity has remained low (below the overall average) in agriculture, manufacturing and
wholesale and retail trade, and these sectors registered lower employment growth over the
same period.
Figure 8
Labour productivity (in thousands of ‘000’ birr), 2010/11 constant prices
Source: Computed based on Central Statistical Agency (2005 & 2014); National Labour
Force Surveys
While employment grew in the majority of sectors, real income declined except in
mining and quarrying (see table 7). In 2012, the top four low-paying sectors were hotels and
restaurants, agriculture, wholesale and retail trade, and manufacturing; these sectors pay
below the national average wage. The monthly average real income was 421.7 birr (or
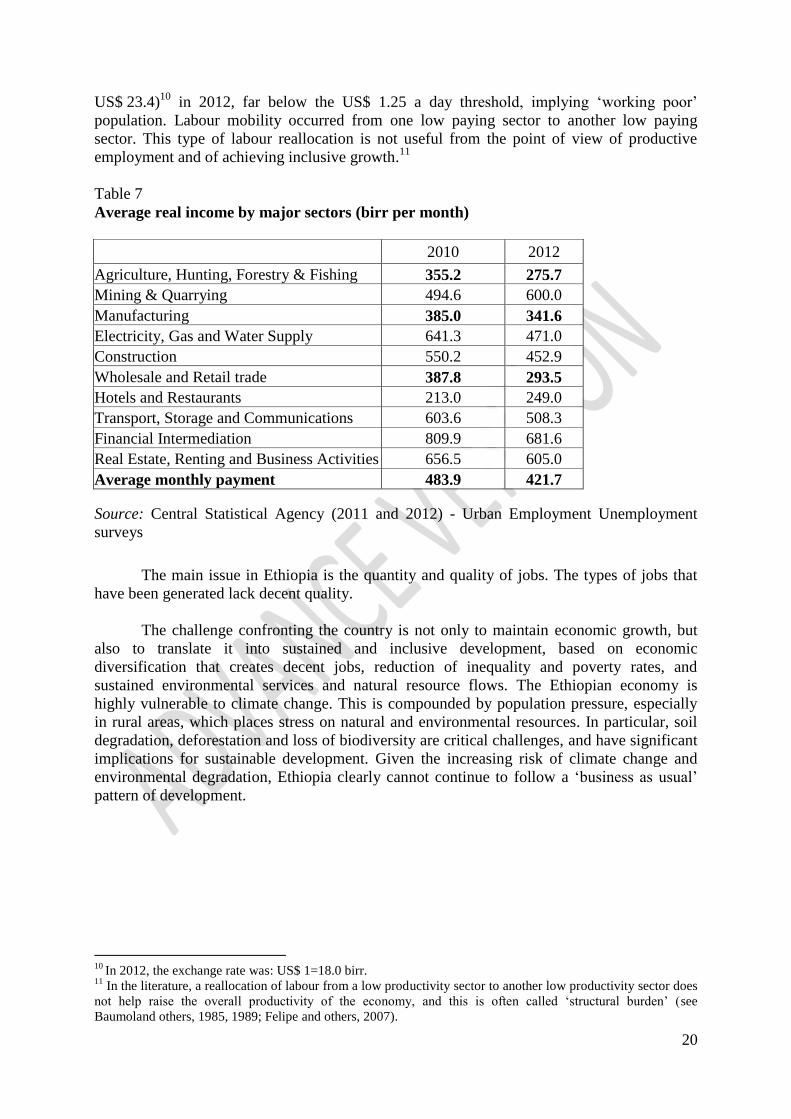
20
US$ 23.4)10
in 2012, far below the US$ 1.25 a day threshold, implying „working poor‟
population. Labour mobility occurred from one low paying sector to another low paying
sector. This type of labour reallocation is not useful from the point of view of productive
employment and of achieving inclusive growth.11
Table 7
Average real income by major sectors (birr per month)
2010 2012
Agriculture, Hunting, Forestry & Fishing 355.2 275.7
Mining & Quarrying 494.6 600.0
Manufacturing 385.0 341.6
Electricity, Gas and Water Supply 641.3 471.0
Construction 550.2 452.9
Wholesale and Retail trade 387.8 293.5
Hotels and Restaurants 213.0 249.0
Transport, Storage and Communications 603.6 508.3
Financial Intermediation 809.9 681.6
Real Estate, Renting and Business Activities 656.5 605.0
Average monthly payment 483.9 421.7
Source: Central Statistical Agency (2011 and 2012) - Urban Employment Unemployment
surveys
The main issue in Ethiopia is the quantity and quality of jobs. The types of jobs that
have been generated lack decent quality.
The challenge confronting the country is not only to maintain economic growth, but
also to translate it into sustained and inclusive development, based on economic
diversification that creates decent jobs, reduction of inequality and poverty rates, and
sustained environmental services and natural resource flows. The Ethiopian economy is
highly vulnerable to climate change. This is compounded by population pressure, especially
in rural areas, which places stress on natural and environmental resources. In particular, soil
degradation, deforestation and loss of biodiversity are critical challenges, and have significant
implications for sustainable development. Given the increasing risk of climate change and
environmental degradation, Ethiopia clearly cannot continue to follow a „business as usual‟
pattern of development.
10
In 2012, the exchange rate was: US$ 1=18.0 birr. 11
In the literature, a reallocation of labour from a low productivity sector to another low productivity sector does
not help raise the overall productivity of the economy, and this is often called „structural burden‟ (see
Baumoland others, 1985, 1989; Felipe and others, 2007).

21
2.3 Fiscal and monetary responsiveness to an inclusive green economy
2.3.1 Fiscal responses to an inclusive green economy
Natural resources have fiscal contributions. The share of natural resource-based
revenue (e.g. agricultural income and rural land-use fees) out of total revenue was relatively
high in 2004/05, but declined in 2012/13 (see figure 9). Among the natural resource-based
revenue sources, agricultural income and rural land-use fees accounted for relatively higher
shares in total revenue, especially during the Plan for Accelerated and Sustained Development
to End Poverty period. The declining share of natural resource-based revenue sources is due
to faster growth of revenues from non-natural revenue sources.
Figure 9
Share of natural resource-based revenue source (% of total revenue)
Source: Computed from Ministry of Finance and Economic Development fiscal data source
In societies where poverty is recognized as a major social problem, social
inclusiveness requires the commitment of resources to socially disadvantaged sections of the
population (the poor, youth, and women).One indication of inclusiveness is the expenditure to
poverty-oriented sectors; these include sectors and activities where the poor are largely found
and where the poor can be accessed through interventions. The poverty-oriented sectors
identified by the Ethiopian government are agriculture, natural resources, road construction,
education, and health and social welfare, which are addressing both green expenditures and
social inclusiveness. Expenditure on social welfare is the most direct expenditure targeting the
poor, while expenditure on road construction generates benefits for both the poor and other
segments of the society.
Allocation of capital expenditure to poverty-oriented sectors grew by about 32 per cent
per year between 2004/05 and 2012/13. Similarly, government capital expenditure in priority
sectors as a share of GDP has increased over time, especially on roads, education and natural
resources (see figure 10), with the share of GDP at about 7.5 per cent in 2004/5, increasing at
an average rate of 7 per cent in the period up to 2012/13. Similarly, the share of capital
expenditure in poverty-oriented sectors grew substantially, increasing from about 60 per cent
of total capital expenditure to more than 80 per cent. Among the poverty-oriented sectors,
road construction took by far the largest share of capital expenditure. Capital expenditure to
priority sectors increased during the transformation period, indicating the Government‟s focus
on social protection and natural resources management. It appears that the Government‟s
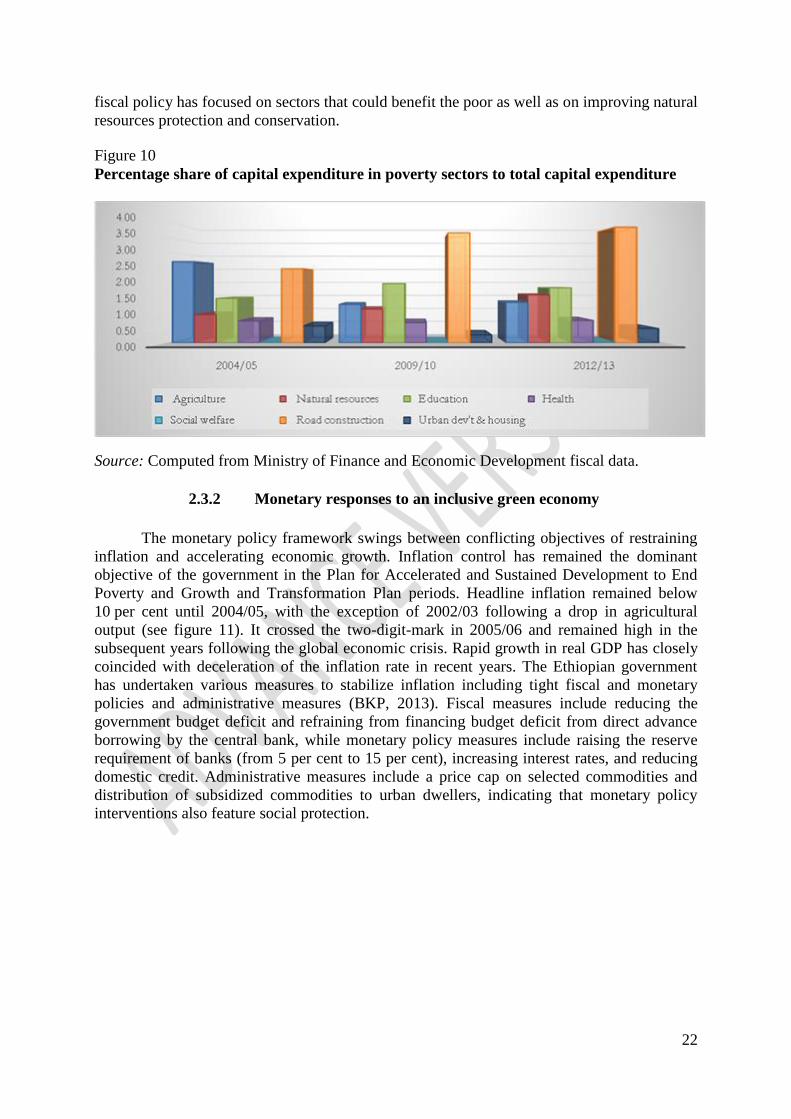
22
fiscal policy has focused on sectors that could benefit the poor as well as on improving natural
resources protection and conservation.
Figure 10
Percentage share of capital expenditure in poverty sectors to total capital expenditure
Source: Computed from Ministry of Finance and Economic Development fiscal data.
2.3.2 Monetary responses to an inclusive green economy
The monetary policy framework swings between conflicting objectives of restraining
inflation and accelerating economic growth. Inflation control has remained the dominant
objective of the government in the Plan for Accelerated and Sustained Development to End
Poverty and Growth and Transformation Plan periods. Headline inflation remained below
10 per cent until 2004/05, with the exception of 2002/03 following a drop in agricultural
output (see figure 11). It crossed the two-digit-mark in 2005/06 and remained high in the
subsequent years following the global economic crisis. Rapid growth in real GDP has closely
coincided with deceleration of the inflation rate in recent years. The Ethiopian government
has undertaken various measures to stabilize inflation including tight fiscal and monetary
policies and administrative measures (BKP, 2013). Fiscal measures include reducing the
government budget deficit and refraining from financing budget deficit from direct advance
borrowing by the central bank, while monetary policy measures include raising the reserve
requirement of banks (from 5 per cent to 15 per cent), increasing interest rates, and reducing
domestic credit. Administrative measures include a price cap on selected commodities and
distribution of subsidized commodities to urban dwellers, indicating that monetary policy
interventions also feature social protection.

23
Figure 11
Trends in GDP growth rate and inflation
Source: Ministry of Finance and Economic Development and National Bank Ethiopia (2014)
Developments in monetary aggregates such as domestic credit, broad money, narrow
money, quasi money and foreign assets constitute the macroeconomic policy environment
conditioning the inflation situation. An average growth rate well above 18 per cent was
registered for all monetary aggregates, which was higher than the growth rate of real GDP
between 2000/01 and 2012/13 and coincided with the prevalence of high inflation (see table
8). Domestic credit growth (up to 32 per cent), broad money growth (up to 30 per cent) and
foreign asset growth (up to 25 per cent) closely correlate with persistent inflation (see figure
12). The level and growth of net foreign assets, i.e. the sum of net debt, net foreign investment
and foreign exchange reserves, is the determinant of external sustainability (Lane and Milesi-
Ferretti, 2000). The fast growth of net foreign assets could result in expansionary monetary
effects that pose a challenge to domestic macroeconomic stability. Monetary authorities have
to undertake sterilization measures whenever necessary to ensure that changes in net foreign
assets do not affect the domestic monetary base, or narrow money, which is one component of
money supply. If unsterilized, the growing foreign asset position might increase the monetary
base, leading to price instability.
Figure 12
Growth of broad money and inflation (%)
Source: National Bank of Ethiopia (2014).
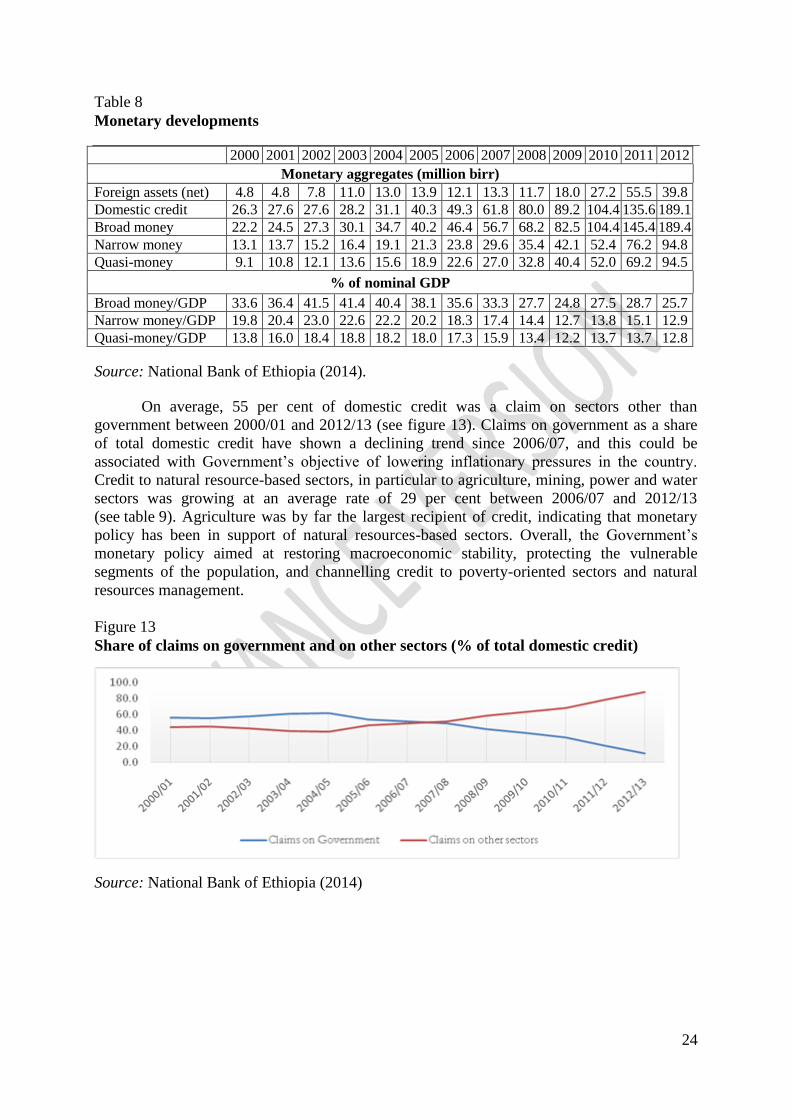
24
Table 8
Monetary developments
2000 2001 2002 2003 2004 2005 2006 2007 2008 2009 2010 2011 2012
Monetary aggregates (million birr)
Foreign assets (net) 4.8 4.8 7.8 11.0 13.0 13.9 12.1 13.3 11.7 18.0 27.2 55.5 39.8
Domestic credit 26.3 27.6 27.6 28.2 31.1 40.3 49.3 61.8 80.0 89.2 104.4 135.6 189.1
Broad money 22.2 24.5 27.3 30.1 34.7 40.2 46.4 56.7 68.2 82.5 104.4 145.4 189.4
Narrow money 13.1 13.7 15.2 16.4 19.1 21.3 23.8 29.6 35.4 42.1 52.4 76.2 94.8
Quasi-money 9.1 10.8 12.1 13.6 15.6 18.9 22.6 27.0 32.8 40.4 52.0 69.2 94.5
% of nominal GDP
Broad money/GDP 33.6 36.4 41.5 41.4 40.4 38.1 35.6 33.3 27.7 24.8 27.5 28.7 25.7
Narrow money/GDP 19.8 20.4 23.0 22.6 22.2 20.2 18.3 17.4 14.4 12.7 13.8 15.1 12.9
Quasi-money/GDP 13.8 16.0 18.4 18.8 18.2 18.0 17.3 15.9 13.4 12.2 13.7 13.7 12.8
Source: National Bank of Ethiopia (2014).
On average, 55 per cent of domestic credit was a claim on sectors other than
government between 2000/01 and 2012/13 (see figure 13). Claims on government as a share
of total domestic credit have shown a declining trend since 2006/07, and this could be
associated with Government‟s objective of lowering inflationary pressures in the country.
Credit to natural resource-based sectors, in particular to agriculture, mining, power and water
sectors was growing at an average rate of 29 per cent between 2006/07 and 2012/13
(see table 9). Agriculture was by far the largest recipient of credit, indicating that monetary
policy has been in support of natural resources-based sectors. Overall, the Government‟s
monetary policy aimed at restoring macroeconomic stability, protecting the vulnerable
segments of the population, and channelling credit to poverty-oriented sectors and natural
resources management.
Figure 13
Share of claims on government and on other sectors (% of total domestic credit)
Source: National Bank of Ethiopia (2014)
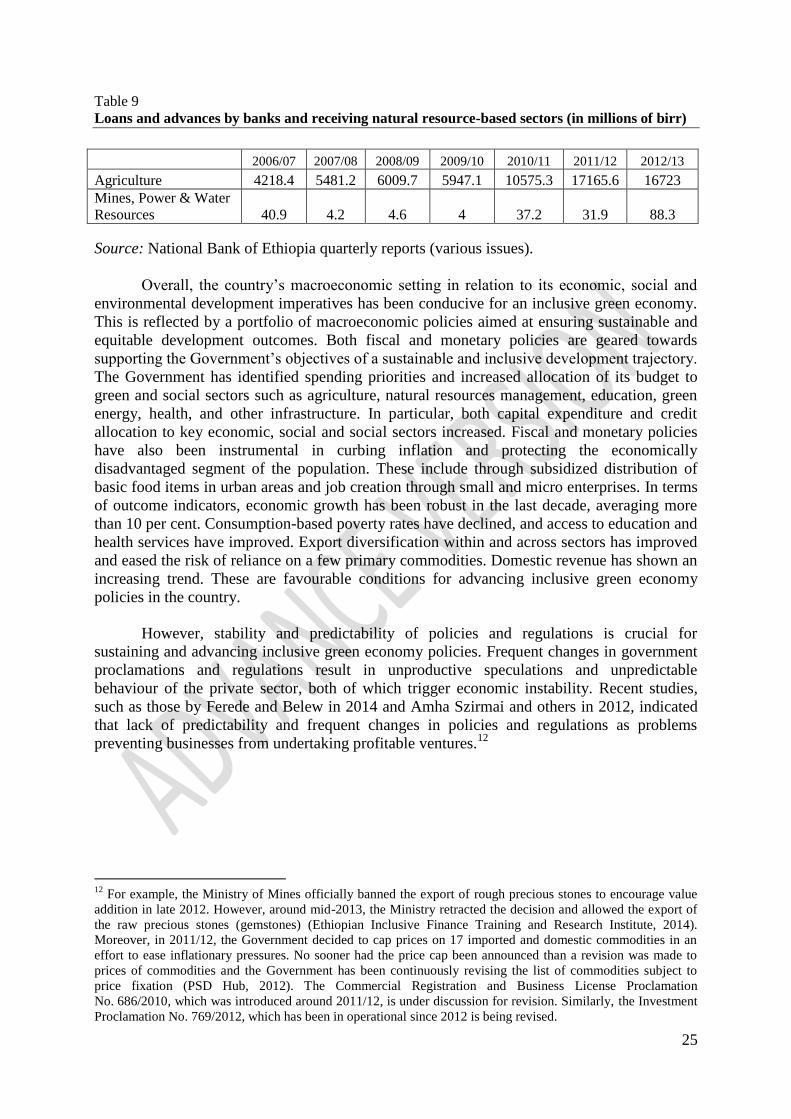
25
Table 9
Loans and advances by banks and receiving natural resource-based sectors (in millions of birr)
2006/07 2007/08 2008/09 2009/10 2010/11 2011/12 2012/13
Agriculture 4218.4 5481.2 6009.7 5947.1 10575.3 17165.6 16723
Mines, Power & Water
Resources 40.9 4.2 4.6 4 37.2 31.9 88.3
Source: National Bank of Ethiopia quarterly reports (various issues).
Overall, the country‟s macroeconomic setting in relation to its economic, social and
environmental development imperatives has been conducive for an inclusive green economy.
This is reflected by a portfolio of macroeconomic policies aimed at ensuring sustainable and
equitable development outcomes. Both fiscal and monetary policies are geared towards
supporting the Government‟s objectives of a sustainable and inclusive development trajectory.
The Government has identified spending priorities and increased allocation of its budget to
green and social sectors such as agriculture, natural resources management, education, green
energy, health, and other infrastructure. In particular, both capital expenditure and credit
allocation to key economic, social and social sectors increased. Fiscal and monetary policies
have also been instrumental in curbing inflation and protecting the economically
disadvantaged segment of the population. These include through subsidized distribution of
basic food items in urban areas and job creation through small and micro enterprises. In terms
of outcome indicators, economic growth has been robust in the last decade, averaging more
than 10 per cent. Consumption-based poverty rates have declined, and access to education and
health services have improved. Export diversification within and across sectors has improved
and eased the risk of reliance on a few primary commodities. Domestic revenue has shown an
increasing trend. These are favourable conditions for advancing inclusive green economy
policies in the country.
However, stability and predictability of policies and regulations is crucial for
sustaining and advancing inclusive green economy policies. Frequent changes in government
proclamations and regulations result in unproductive speculations and unpredictable
behaviour of the private sector, both of which trigger economic instability. Recent studies,
such as those by Ferede and Belew in 2014 and Amha Szirmai and others in 2012, indicated
that lack of predictability and frequent changes in policies and regulations as problems
preventing businesses from undertaking profitable ventures.12
12
For example, the Ministry of Mines officially banned the export of rough precious stones to encourage value
addition in late 2012. However, around mid-2013, the Ministry retracted the decision and allowed the export of
the raw precious stones (gemstones) (Ethiopian Inclusive Finance Training and Research Institute, 2014).
Moreover, in 2011/12, the Government decided to cap prices on 17 imported and domestic commodities in an
effort to ease inflationary pressures. No sooner had the price cap been announced than a revision was made to
prices of commodities and the Government has been continuously revising the list of commodities subject to
price fixation (PSD Hub, 2012). The Commercial Registration and Business License Proclamation
No. 686/2010, which was introduced around 2011/12, is under discussion for revision. Similarly, the Investment
Proclamation No. 769/2012, which has been in operational since 2012 is being revised.

26
3. Ethiopia’s structural transformation agenda
Structural transformation is a process of change of the composition of the economy
where the share of modern manufacturing and services increases and the share of agriculture
decreases, in terms of both output and employment. In the process, a rapid shift in the location
of economic activities from rural to urban areas and demographic transition from high birth
rate-high death rate to low birth-low death rates takes place (Kuznets, 1966, 1989). Structural
transformation is a sought after goal of developing economies in order to increase
productivity and per-capita income, as well as sustainably improve the standard of living of
the people. Successful structural transformation entails enhancement of social well-being,
eradication of poverty, provision of decent work and increase of self-esteem. Shifting focus to
higher productivity sectors, such as manufacturing and modern services, and the subsequent
increase in income forms the basis for improved living standards and eventual demographic
changes.
In Ethiopia, agriculture has been dominating in both output and employment share.
The service sector is closing gaps in terms of output share but remains far behind agriculture
in employment share. Structural change in the form of shift from agriculture to industry has
not been observed so far. The observed shift was rather from agriculture to services, where
expansion of the wholesale and retail trade, real estate, renting and related business was the
driving force (Ministry of Finance and Economic Development, 2014).
The structural transformation agenda remains crucial to Ethiopia since the country‟s
economy is on the initial rungs of the structural ladder that leads to the transformation of the
economy from an agrarian- to a modern manufacturing- and service-based economy. This
transformation needs to be founded on new forward-looking structural footing to ensure
economic, social and environmental sustainability.
Social inclusion ensures the exertion of concerted efforts and collaboration in pursuit
of structural transformation. Inclusiveness prevents conflict and promotes harmony, which is
necessary for long-term and continuous processes of structural transformation. Interruptions
and discontinuities in economic and social processes restrain the learning-period and
experience required to make progress. Moreover, social inclusion ensures that all sections of
society have opportunities for decent employment and income generation. In doing so,
improving human capabilities is crucial to take advantage of opportunities. Requirements for
social inclusion are investment in education, health and other social services to expand human
capacities, and promote sound and quality institutions. Social safety nets are meant to protect
chronically poor and vulnerable sections of society who cannot participate in and benefit from
emerging opportunities for growth. It requires interventions in labour market policies and
programmes, social insurance programmes, and social assistance. Thus, the promotion of
socially inclusive approaches provides the labour force required for productive purposes and
the process reinforces itself through enhancement of a structure that requires the extended use
of labour resources, meaning the build-up of sustained capacity to create employment.
Despite rapid growth in Ethiopia, there is widespread concern that the current growth
has not created sufficient productive employment to lift a large proportion of the population
out of poverty (ILO, 2013; McKinsey, 2012). For growth to be sustainable in the long run, it
should be broad-based across sectors, inclusive of the large part of the labour force, and pro-
poor.

27
Similarly, environmentally sustainable economic activities will enable long-term
progress in structural transformation. Under a green economy, processes that lead to rapid
depletion and uncontrolled degradation of environmental and natural resources are not
expected to take place, meaning that structural transformation is not expected to yield
unsustainable outcomes. Although the motivation for green economy policies are inherently
linked to environmental issues, the centrality of the environment in driving economic
transformation in Ethiopia is well recognized as it directly and indirectly affects economic and
social sectors (OECD, 2012). This cuts across different socioeconomic groups and actors in
the economy and calls for the building of political and institutional coalitions within
government. Mobilizing mass support has also been critically important to the success of
green economy policies and strategies in assisting and shaping the structural transformation
process.
3.1 Growth and Transformation Plan as Ethiopia’s main structural
transformation framework
In the early 1990s, the Government of Ethiopia introduced an agriculture-based
development strategy known as the Agricultural Development Led Industrialization Strategy.
The basis for the adoption of this strategy was the recognition of the strategic importance and
centrality of the agricultural sector for the overall economy, and the advantage in using the
available resources of land and labour, while progressively increasing capital share in
resource endowment. The focus on agriculture stems from the predominantly agrarian nature
of the economy and from the premise that “it is difficult to trigger economic development
without rural development” in the Ethiopian context (Ministry of Finance and Economic
Development, 2014). All subsequent plans recognize the abovementioned strategy as the
overall development framework.
The most recent endeavour to advance the structural transformation agenda is the
Growth and Transformation Plan, which was adopted in 2010/11. The main objectives of Plan
include to: sustain and achieve double digit growth (average real GDP growth rate of 11 per
cent); achieve the Millennium Development Goals, expand and improve the quality of
education and health services; maintain stable macroeconomic conditions; and ensure
sustainable nation building through a stable democratic and developmental State. The Plan‟s
growth goals are ambitious and include achieving an average real GDP growth rate of 11.2
per cent under the base case scenario and of 14.9 per cent under the high case scenario
between 2010/11 and 2014/15. In terms of sectoral structure, the agriculture (14.9 per cent)
and industry (21.3 per cent) sectors are expected to drive the overall growth under the high
case scenario, while industry (20.0 per cent) and services (10.8 per cent) sectors would boost
the overall growth under the base case scenario(Ministry of Finance and Economic
Development, 2010).This would enable Ethiopia to achieve the Millennium Development
Goals by 2015 and to raise the country to middle-income status by 2025. The proportion of
poor population (total poverty headcount ratio) is also projected to decline to 22.2 per cent by
the end of the plan period. In addition, other macroeconomic goals include maintaining stable
price conditions and generating significant increases in the share of GDP accounted for by
exports and imports, domestic savings and investment, and fiscal revenues.
The Growth and Transformation Plan is based on a number of pillars to achieve the
main goals and objectives, including sustaining faster and equitable economic growth,
maintaining agriculture as a major source of economic growth, enhancing expansion and
quality of infrastructure development, improving the coverage and quality of social
28
development, creating favourable conditions for industry to play a key role in the economy,
enhancing capacity development and good governance and promoting gender and youth
empowerment and equity.
The Plan is a continuation of the five-year plans within the poverty reduction strategy
programme framework and beyond. It recognizes the weaknesses and builds on the
achievements of the Plan for Accelerated and Sustained Development to End Poverty, the
preceding five-year plan. The Growth and Transformation Plan targets economic sectors such
as agriculture and rural development, industry, trade, mining, and infrastructure development.
The social sector section comprises education and training, and health sector development.
The emphasis laid on infrastructural development is also notable in the Plan. Roads, railways,
energy, telecommunication, potable water and irrigation development, transport services,
maritime transport, air transport services, and construction and urban development are the
main components of the infrastructure development section. Achievements in the
development of these sectors could indeed create a solid foundation for the transformation
process by reducing the transaction costs for society and enable a smoother economic
interaction. Table 10 provides a summary of the key elements of the Growth and
Transformation Plan. The main areas of focus of the Plan are discussed in the subsection
below.
3.1.1 Agriculture and rural development
Maintaining agriculture as a major source of economic grow this among the main
strategic pillars of the Growth and Transformation Plan. The strategy identifies agricultural
development as the basis to create favourable conditions for industry. The strategic direction
of agricultural and rural development is strengthening agricultural development led
industrialization, which takes agriculture as a leading sector by virtue of its labour intensity,
linkages and being the sector where the poor largely reside. The components of the strategy
are smallholder agricultural development, pastoral development, and private sector
development (large-scale commercial agriculture). Smallholder agricultural development is
planned to scale up best practices, expand irrigation, conserve natural resources, and produce
high value crops. Water and irrigation development, and resettlement are the main policy
targets for pastoral development. Development of private commercial farms, as exemplified in
floriculture, is the other strategic direction. With a new additional emphasis on
commercialization, the Plan continues to achieve the objectives and goals of the Agricultural
Development Led Industrialization Strategy. From an inclusive green economy perspective, it
is possible to discern the implications of both the Plan and the Strategy. Agricultural
development remains at the centre of the development strategy to be implemented in the five-
year plan. Hence, the inclusive green economy implications of the Growth and
Transformation Plan are largely found in the agricultural and rural development initiatives,
which are largely based on natural resources and constitute the livelihood of the majority of
rural population.
3.1.2 Industrial sector and industrialization
The Plan emphasizes the importance of a large commercial sector and improvement of
the productivity of smallholder agriculture through improved access to suitable and affordable
farm technologies, and agriculture-industry linkages, among others. Identifying and
supporting industries that provide improved technologies to the agricultural sector and are
closely linked to research centres is therefore crucial. These insights point to the need to

29
promote agriculture and industry simultaneously as industrialization is difficult without a
robust agricultural sector in an agriculture-dominated economy.
Agriculture can develop with the use of modern technologies. Thus, the strategic
importance of directly or indirectly promoting a domestic manufacturing sector that has
linkages with agriculture should be recognized. The strategic direction during the Growth and
Transformation Plan timeframe is creating favourable conditions for faster industrial
development through the development of micro and small enterprises, large and medium scale
industries, industrial zone development, and effective public enterprise management and
privatization.
The Plan specifically identifies the following large and medium scale manufacturing
subsectors that are strategically important to the realization of growth and transformation
goals (Ministry of Finance and Economic Development, 2010): the textile and garment
industry; the leather and leather products industry; sugar and sugar-related industries; the
cement industry; the metal and engineering industry; the chemical industry; the
pharmaceutical industry; and the agro processing industry. The focus on the development of
industries that demand agricultural inputs such as textiles, leather, sugar and agro-processing
manufacturing helps to strengthen the link between the agriculture and manufacturing sectors.
With a renewed focus on industry in general and manufacturing in particular,
development and production of capital and consumer goods using green technologies should
be emphasized. Development or adoption of green technologies requires the evolution of a
new direction of production and consumption patterns, shaping the structural transformation
process along a different path. Scientific and technological knowledge are key factors in
developing and adopting green technologies that will be part of the structural transformation
to modern economic and social life.
3.1.3 Trade
The Government of Ethiopia has introduced reforms including liberalizing trade in
general and expanding export trade in particular in the past two decades. This has continued
to have an impact on the country‟s economic performance and business environment. In the
Growth and Transformation Plan period, the strategic direction in the trade sector is
strengthening domestic and foreign trade, promoting efficiency and competitiveness,
improving domestic trade and distribution systems, ensuring consumer rights, and
strengthening the legal framework for trade practices (Ministry of Finance and Economic
Development, 2010). To this end, the Government of Ethiopia issued two proclamations in
2010: The Trade Practice and Consumers‟ Protection Proclamation No 685/2010, and the
Commercial Registration and Business Licensing Proclamation No.686/2010, through which
a uniform and harmonized system of trade registration and licensing has been introduced in
the country. Key innovations of the second proclamation include use of a single identification
number for commercial and tax registration, one-time registration, and a centralized
commercial register. Reducing informality and dealing with illegal activities by putting in
place a robust regulatory mechanism is another objective of enacting the Proclamations. In so
doing, the trade registration and licensing system ensures fair and transparent transactions,
easy access to services and focus on the professional efficiency and competency of services
provided to the business community, thereby enhancing inclusiveness.

30
3.1.4 Development of social sectors
The Growth and Transformation Plan specifies the strategic directions in social sectors
such as education and health that are key to reducing poverty and inequality, and enhancing
the country‟s capacity to advance structural transformation. The Government‟s focus on these
sectors has been demonstrated through the expanded budget allocation to these sectors.
Expanding general education, ensuring the quality of technical and vocational education and
training, and improving the quality and relevance of higher education are among the strategic
directions in education and training. The health sector development programme during the
Growth and Transformation Plan period prioritizes maternal and newborn care, child health,
and halting and reversing the spread of major communicable diseases, including malaria,
tuberculosis and HIV/AIDS.
In addition, the integrated urban development and renewal programme is one of the
key components of the transformation agenda of the country. This programme involves
housing provision, urban upgrading, job creation, and infrastructure development in major
urban centres in the country. The aim of the Plan is to achieve the Millennium Development
Goal target of halving extreme poverty and hunger by 2014/15. Accordingly, the total poverty
and food poverty headcount ratios are expected to decline from 29.6 per cent and 33.6 per
cent in 2009/10 to 22.2 per cent and 21.2 per cent in 2014/15, respectively (Ministry of
Finance and Economic Development, 2014).
3.1.5 Natural resources management
The Growth and Transformation Plan addresses natural resource management issues
such as environmental conservation and building a climate-resilient green economy. The Plan
recognizes that accelerated and sustainable agricultural growth can be achieved through the
conservation of natural resources; development of water resources and the improvement of
their utilization (both surface and underground water); and expansion of irrigation coverage.
The enhanced implementation of environmental laws, targeting degradation, pollution and
natural resource depletion, and the undertaking of adaptation and mitigation measures to
counter climate change constitute important resource management strategies. Implementing
soil and water conservation activities through organized community participation and forestry
development, protection and utilization are other important natural resource conservation and
management approaches. To that end, capacity-building for farmers and government support
structures is considered crucial.
3.1.6 Urban-rural linkages
Structural transformation through a rapid shift in the location of economic activities
from rural to urban areas is closely linked with the speed of expansion of the manufacturing
and service sectors and their employment potential. The shift towards manufacturing has been
sluggish. The share in output and employment of the manufacturing sector has not shown a
remarkable change both during Plan for Accelerated and Sustained Development to End
Poverty and Growth and Transformation Plan periods (Ministry of Finance and Economic
Development, 2010). The ongoing process under the Growth and Transformation Plan is
largely intended to create favourable conditions for the industrial sector. The service sector
has expanded substantially, especially in the Growth and Transformation Plan period, but its
employment potential is limited. The participation of the private sector, especially in the
manufacturing sector has remained weak. Further investigation is required to ascertain
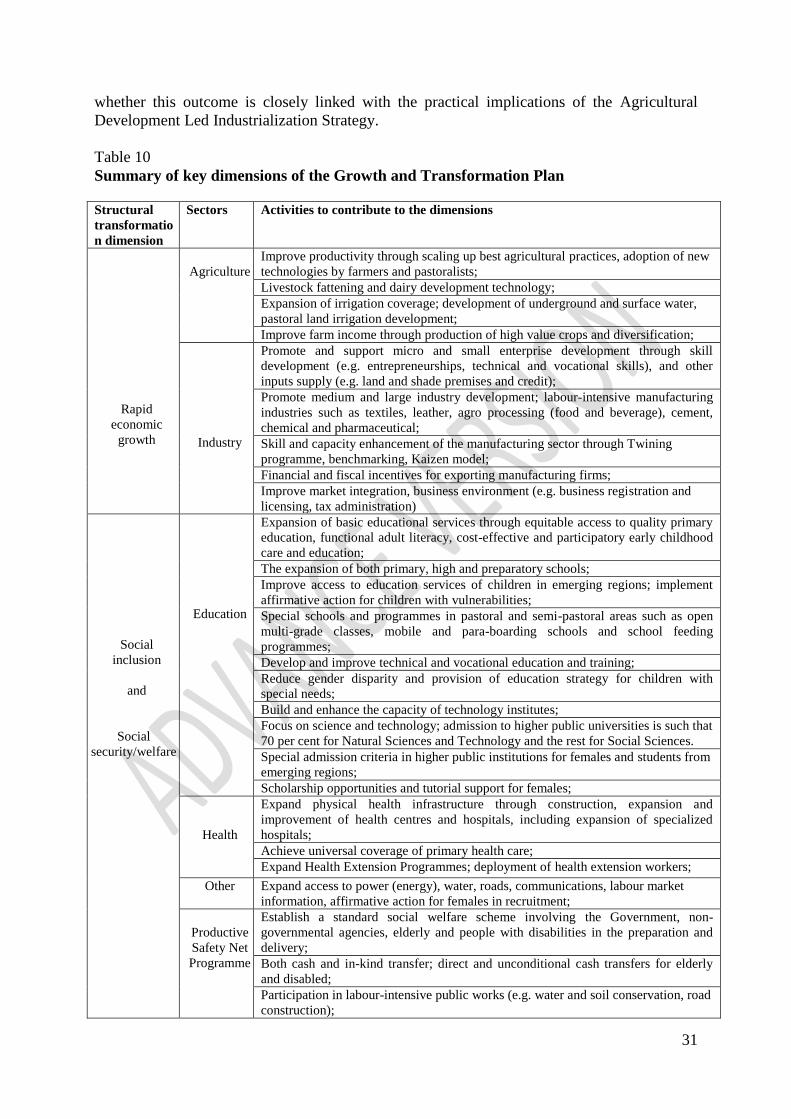
31
whether this outcome is closely linked with the practical implications of the Agricultural
Development Led Industrialization Strategy.
Table 10
Summary of key dimensions of the Growth and Transformation Plan
Structural
transformatio
n dimension
Sectors Activities to contribute to the dimensions
Rapid
economic
growth
Agriculture
Improve productivity through scaling up best agricultural practices, adoption of new
technologies by farmers and pastoralists;
Livestock fattening and dairy development technology;
Expansion of irrigation coverage; development of underground and surface water,
pastoral land irrigation development;
Improve farm income through production of high value crops and diversification;
Industry
Promote and support micro and small enterprise development through skill
development (e.g. entrepreneurships, technical and vocational skills), and other
inputs supply (e.g. land and shade premises and credit);
Promote medium and large industry development; labour-intensive manufacturing
industries such as textiles, leather, agro processing (food and beverage), cement,
chemical and pharmaceutical;
Skill and capacity enhancement of the manufacturing sector through Twining
programme, benchmarking, Kaizen model;
Financial and fiscal incentives for exporting manufacturing firms;
Improve market integration, business environment (e.g. business registration and
licensing, tax administration)
Social
inclusion
and
Social
security/welfare
Education
Expansion of basic educational services through equitable access to quality primary
education, functional adult literacy, cost-effective and participatory early childhood
care and education;
The expansion of both primary, high and preparatory schools;
Improve access to education services of children in emerging regions; implement
affirmative action for children with vulnerabilities;
Special schools and programmes in pastoral and semi-pastoral areas such as open
multi-grade classes, mobile and para-boarding schools and school feeding
programmes;
Develop and improve technical and vocational education and training;
Reduce gender disparity and provision of education strategy for children with
special needs;
Build and enhance the capacity of technology institutes;
Focus on science and technology; admission to higher public universities is such that
70 per cent for Natural Sciences and Technology and the rest for Social Sciences.
Special admission criteria in higher public institutions for females and students from
emerging regions;
Scholarship opportunities and tutorial support for females;
Health
Expand physical health infrastructure through construction, expansion and
improvement of health centres and hospitals, including expansion of specialized
hospitals;
Achieve universal coverage of primary health care;
Expand Health Extension Programmes; deployment of health extension workers;
Other Expand access to power (energy), water, roads, communications, labour market
information, affirmative action for females in recruitment;
Productive
Safety Net
Programme
Establish a standard social welfare scheme involving the Government, non-
governmental agencies, elderly and people with disabilities in the preparation and
delivery;
Both cash and in-kind transfer; direct and unconditional cash transfers for elderly
and disabled;
Participation in labour-intensive public works (e.g. water and soil conservation, road
construction);
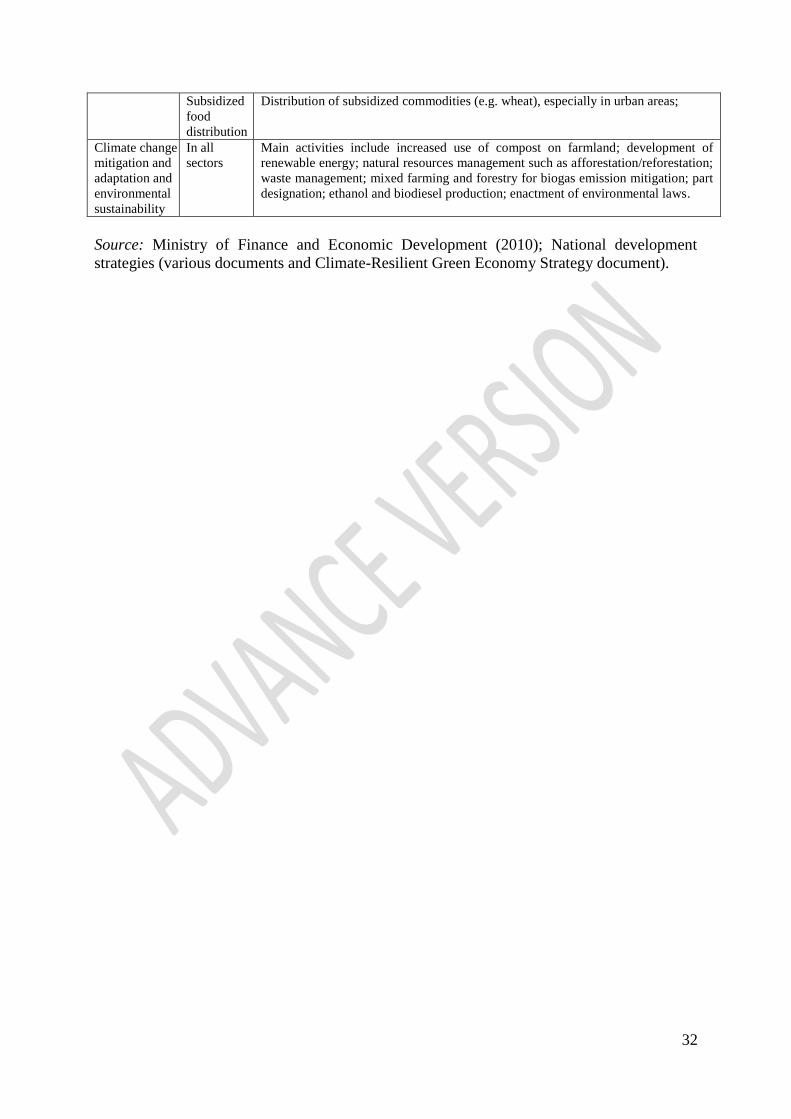
32
Subsidized
food
distribution
Distribution of subsidized commodities (e.g. wheat), especially in urban areas;
Climate change
mitigation and
adaptation and
environmental
sustainability
In all
sectors
Main activities include increased use of compost on farmland; development of
renewable energy; natural resources management such as afforestation/reforestation;
waste management; mixed farming and forestry for biogas emission mitigation; part
designation; ethanol and biodiesel production; enactment of environmental laws.
Source: Ministry of Finance and Economic Development (2010); National development
strategies (various documents and Climate-Resilient Green Economy Strategy document).

33
4. Analysis of inclusive green economy policies and their role and
significance in fostering structural transformation
4.1 Rationale for inclusive green economy policies in Ethiopia
Ethiopia has been combating climate-related disasters for decades. Disaster risk
management planning and implementation have been significant concerns for the country
since the 1970s. The genesis of environmental and social protection in Ethiopia has been
associated with the occurrence of natural disasters and risks, and subsequent establishment of
institutions responsible for managing nature-induced disasters and risks (Abebe, 2009). In
2013, the Government of Ethiopia adopted a national policy and strategy on disaster risk
management to address the root causes of the problem (Federal Democratic Republic of
Ethiopia, 2013). The Environmental and Social Management Framework was among the
latest country plans intended to address climate-related risks. Its objective was to strengthen
institutions in terms of disaster risk reduction, improve early warning capacity and improve
disaster recovery efforts. Additionally, a strategy towards climate change mitigation and
adaptation has been adopted.
Key driving forces behind the transition to a green economy in Ethiopia include
growing concerns about environmental degradation arising from past and current economic
growth patterns, and increased awareness of potential climate change impacts that necessitate
a substantial transformation of behaviour. The adoption and implementation of an inclusive
green economy provides the basis for a modern and sustainable economic structure that takes
into account social and environmental concerns.
Ethiopia„s economy is highly vulnerable to climate change. In Ethiopia, greenhouse
gases are released mainly through combustion of fossil fuels, animal husbandry, nitrogenous
fertilizers, biomass burning, irrigated fields, and deforestation (Uzawa, 2003). The level of
carbon emissions in Ethiopia was about 150 Mt CO2 per annum in 2010, half of which is
generated by the agricultural sector. Under a business as usual development path, greenhouse
gas emissions will increase to 400 Mt CO2 in 2030, with agriculture (including livestock),
forests and industry estimated to contribute 46.3 per cent, 11.3 per cent and 17.8 per cent of
the total greenhouse gas emissions, respectively (see table 11). Other sectors such as
transport, buildings and power, together, would create to 24.7 per cent of the total greenhouse
gas emissions by 2030. Under the business as usual scenario, the livestock and industrial
sectors, together, would contribute up to 49 per cent of total greenhouse emissions by 2030.
The business as usual scenario would have significant economic, environmental and social
costs in the form of reduced and unsustainable economic growth, loss of biodiversity,
deforestation, soil degradation, lower quality of life and health problems. Population pressure
would exacerbate the situation, particularly in rural areas.
Therefore, the challenge confronting Ethiopia is not only to enhance growth along a
green trajectory, but to also translate the rapid economic growth into sustained and inclusive
development through economic diversification that creates jobs, reduces poverty and
inequality, and enhances access to basic services. Cognizant of these imperatives, the
Government of Ethiopia adopted the Climate-Resilient Green Economy Strategy in 2011.
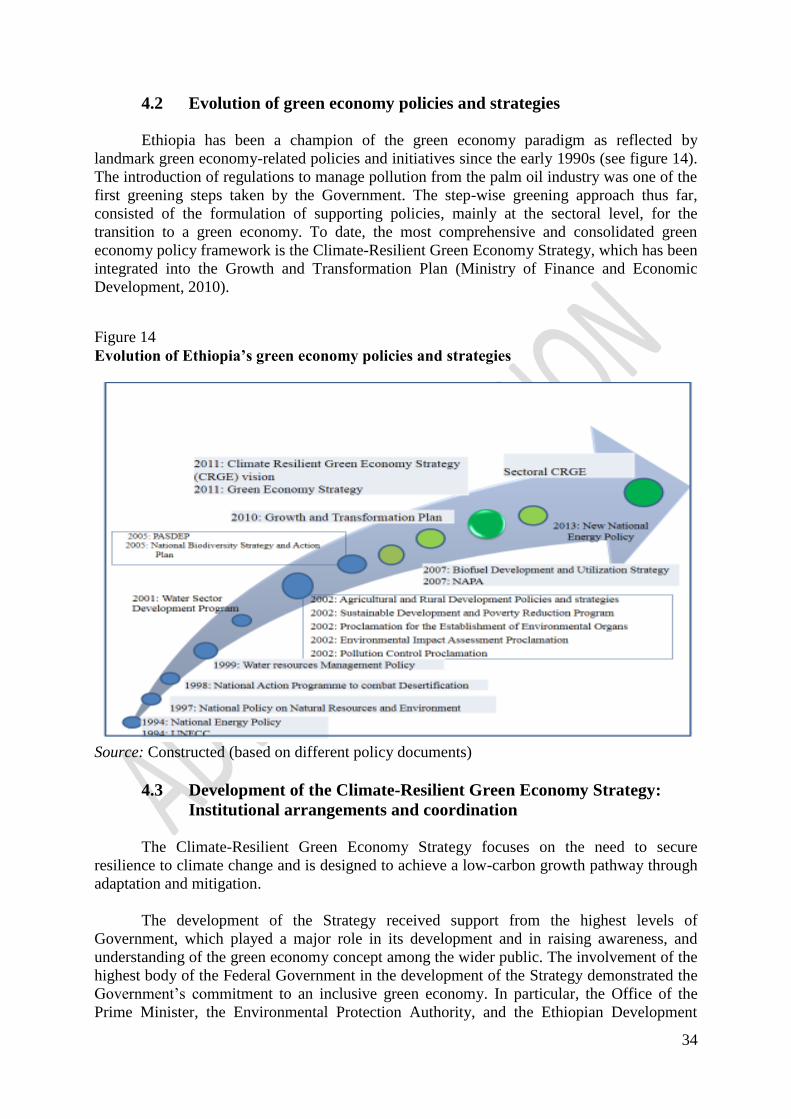
34
4.2 Evolution of green economy policies and strategies
Ethiopia has been a champion of the green economy paradigm as reflected by
landmark green economy-related policies and initiatives since the early 1990s (see figure 14).
The introduction of regulations to manage pollution from the palm oil industry was one of the
first greening steps taken by the Government. The step-wise greening approach thus far,
consisted of the formulation of supporting policies, mainly at the sectoral level, for the
transition to a green economy. To date, the most comprehensive and consolidated green
economy policy framework is the Climate-Resilient Green Economy Strategy, which has been
integrated into the Growth and Transformation Plan (Ministry of Finance and Economic
Development, 2010).
Figure 14
Evolution of Ethiopia’s green economy policies and strategies
Source: Constructed (based on different policy documents)
4.3 Development of the Climate-Resilient Green Economy Strategy:
Institutional arrangements and coordination
The Climate-Resilient Green Economy Strategy focuses on the need to secure
resilience to climate change and is designed to achieve a low-carbon growth pathway through
adaptation and mitigation.
The development of the Strategy received support from the highest levels of
Government, which played a major role in its development and in raising awareness, and
understanding of the green economy concept among the wider public. The involvement of the
highest body of the Federal Government in the development of the Strategy demonstrated the
Government‟s commitment to an inclusive green economy. In particular, the Office of the
Prime Minister, the Environmental Protection Authority, and the Ethiopian Development

35
Research Institute played an instrumental role in the development of the Strategy (see figure
15). Other Ministries were also involved in the process. Although the preparation of the
Strategy was guided by the Growth and Transformation Plan, its participatory nature features
two dimensions: horizontally across sectors, and vertically from federal level down to local
communities and back up to the federal level (OECD, 2013). Discussions with selected
stakeholders also indicate that the preparation of the Strategy was informed by consultations
with representatives drawn from various public organizations and academia. Ethiopia‟s
institutional arrangements with respect to the green economy reflect the interlinkages between
a number of institutions. The preparation of the Strategy was coordinated by the then
Ethiopian Environmental Protection Agency, which also led the technical committee, while
the Ministry of Finance and Economic Development provided financial support.
Figure 15
Preparation of Climate-Resilient Green Economy Strategy
Source: Federal Democratic Republic of Ethiopia (2011).
Ethiopia has introduced the Strategy at the sectoral level and many sectors have been
incorporated into the country‟s medium-term plan. Sector reduction mechanisms are being
developed to guide the integration and implementation of climate-resilient green economy
investments within federal and regional plans (Fikreyesus Szirmai and others, 2014). At the
sectoral level, climate resilience strategies are being developed for the following sectors:
agriculture and forestry, water and energy, transport, and urban development, housing and
construction.13
The development of the Climate-Resilient Green Economy Strategy exhibited
good practices, which are described in box 1.
13
In the draft climate–resilient green economy strategy for the water and energy sectors, eleven strategic
priorities have been identified. The strategic priorities are clustered in five areas: power production; energy
access; irrigation; access to water, sanitation and hygiene; and cross-cutting issues (e.g. data systems and
delivery). Similarly, about 41 key options have been identified (from 350 distinct options) in the agriculture and
forestry sector to address the negative impact of current weather variability and future climate change.
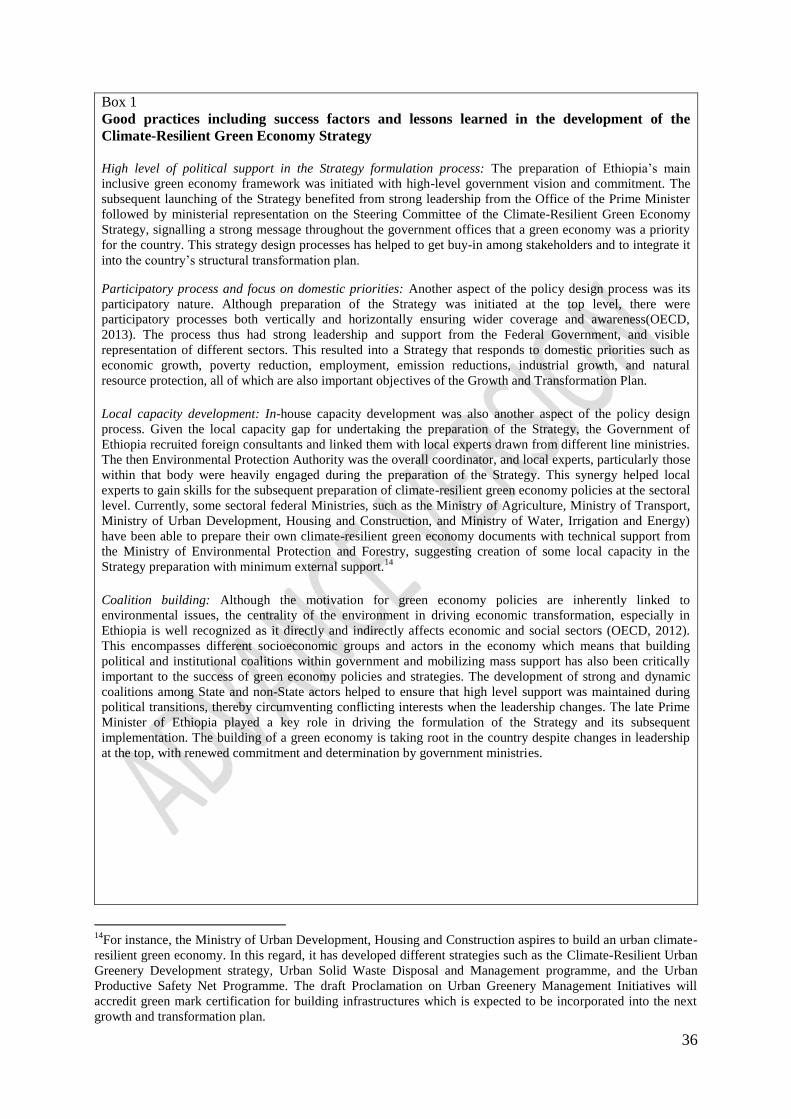
36
Box 1
Good practices including success factors and lessons learned in the development of the
Climate-Resilient Green Economy Strategy
High level of political support in the Strategy formulation process: The preparation of Ethiopia‟s main
inclusive green economy framework was initiated with high-level government vision and commitment. The
subsequent launching of the Strategy benefited from strong leadership from the Office of the Prime Minister
followed by ministerial representation on the Steering Committee of the Climate-Resilient Green Economy
Strategy, signalling a strong message throughout the government offices that a green economy was a priority
for the country. This strategy design processes has helped to get buy-in among stakeholders and to integrate it
into the country‟s structural transformation plan.
Participatory process and focus on domestic priorities: Another aspect of the policy design process was its
participatory nature. Although preparation of the Strategy was initiated at the top level, there were
participatory processes both vertically and horizontally ensuring wider coverage and awareness(OECD,
2013). The process thus had strong leadership and support from the Federal Government, and visible
representation of different sectors. This resulted into a Strategy that responds to domestic priorities such as
economic growth, poverty reduction, employment, emission reductions, industrial growth, and natural
resource protection, all of which are also important objectives of the Growth and Transformation Plan.
Local capacity development: In-house capacity development was also another aspect of the policy design
process. Given the local capacity gap for undertaking the preparation of the Strategy, the Government of
Ethiopia recruited foreign consultants and linked them with local experts drawn from different line ministries.
The then Environmental Protection Authority was the overall coordinator, and local experts, particularly those
within that body were heavily engaged during the preparation of the Strategy. This synergy helped local
experts to gain skills for the subsequent preparation of climate-resilient green economy policies at the sectoral
level. Currently, some sectoral federal Ministries, such as the Ministry of Agriculture, Ministry of Transport,
Ministry of Urban Development, Housing and Construction, and Ministry of Water, Irrigation and Energy)
have been able to prepare their own climate-resilient green economy documents with technical support from
the Ministry of Environmental Protection and Forestry, suggesting creation of some local capacity in the
Strategy preparation with minimum external support.14
Coalition building: Although the motivation for green economy policies are inherently linked to
environmental issues, the centrality of the environment in driving economic transformation, especially in
Ethiopia is well recognized as it directly and indirectly affects economic and social sectors (OECD, 2012).
This encompasses different socioeconomic groups and actors in the economy which means that building
political and institutional coalitions within government and mobilizing mass support has also been critically
important to the success of green economy policies and strategies. The development of strong and dynamic
coalitions among State and non-State actors helped to ensure that high level support was maintained during
political transitions, thereby circumventing conflicting interests when the leadership changes. The late Prime
Minister of Ethiopia played a key role in driving the formulation of the Strategy and its subsequent
implementation. The building of a green economy is taking root in the country despite changes in leadership
at the top, with renewed commitment and determination by government ministries.
14
For instance, the Ministry of Urban Development, Housing and Construction aspires to build an urban climate-
resilient green economy. In this regard, it has developed different strategies such as the Climate-Resilient Urban
Greenery Development strategy, Urban Solid Waste Disposal and Management programme, and the Urban
Productive Safety Net Programme. The draft Proclamation on Urban Greenery Management Initiatives will
accredit green mark certification for building infrastructures which is expected to be incorporated into the next
growth and transformation plan.
37
Lessons learnt:
(i) High-level commitment and support was instrumental in the formulation and implementation of the
Strategy: The development of the Strategy was supported by strong leadership from the Office of the
Prime Minister, followed by ministerial representation on the various Committees, thus sending a
strong message to government offices that green economy planning and implementation was indeed
the country‟s priority. The key areas of focus of the Strategy are investments in low carbon economic
infrastructure; investments in high-potential low-carbon sectors; expanding access to services and new
economic opportunities; improving social services and economic opportunities for the wider
population; and investments in climate change adaptation infrastructure.
(ii) Informed by baselines, establishment of short- and long-term economic, environmental and social
targets and their alignment with domestic economic, environmental, and social priorities help to
advance green economy objectives. Such integration of green economy long-term objectives into the
country‟s medium-term economic development plan helps to cascade economy-wide and sectoral
targets and to monitor their progress against the set targets. The Strategy has been partially
mainstreamed into the medium-term transformation plan of the country, with economic, environmental
and social targets.
4.4 Vision, goal and objectives of the Climate-Resilient Green Economy
Strategy and its importance in structural transformation
Ethiopia is making great strides towards building a green economy. Its vision is to
become a middle-income country by 2025, without increasing its greenhouse gas emissions.
This commitment is expressed in the Climate-Resilient Green Economy Strategy adopted in
2011. The strategy contains two-pronged goals, including achieving high income and
sustainability in powering the country to graduate to a middle-income country by 2025. It
aims to reduce carbon emissions by about 62.5 per cent in 2030 compared with the business
as usual development path. The Strategy is linked to the five-year Growth and Transformation
Plan.
The overriding objectives of the Strategy include the following:
(i) Fostering growth and economic development;
(ii) Managing greenhouse gas emissions; and
(iii) Improving resilience to climate change.
These objectives are to be achieved through two complementary strategies: the Green
Economy Strategy and the Climate Resilience Strategy. While the former focuses on
mitigation (e.g. greenhouse gas reduction), the latter is on adaptation (anticipating and
adjusting to climate change risks). Specifically, the Climate Resilience Strategy focuses on
the agriculture sector, due to its strategic importance to the national economy and livelihoods
of a large segment of the society.
According to the Green Economy Strategy, GDP per capita would increase to more
than US$ 1,800 by 2030, while at the same time greenhouse gas emissions on a per capita
basis would decrease to 1.1t CO2e (Federal Democratic Republic of Ethiopia, 2011; OECD,
2013). Improving agricultural productivity and developing the industrial sector are essential to
achieving this goal (see table 11). It should be noted that the Climate Resilience Strategy
supplements the Green Economy Strategy by enhancing its key recommendations in terms of
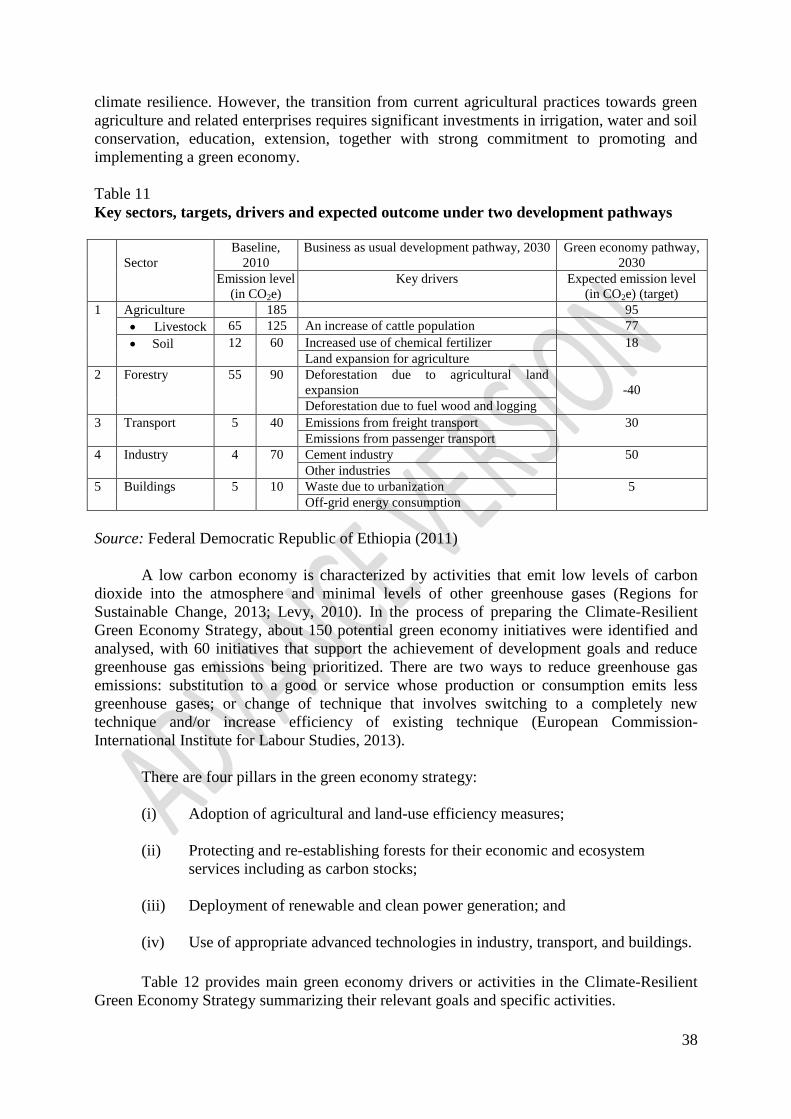
38
climate resilience. However, the transition from current agricultural practices towards green
agriculture and related enterprises requires significant investments in irrigation, water and soil
conservation, education, extension, together with strong commitment to promoting and
implementing a green economy.
Table 11
Key sectors, targets, drivers and expected outcome under two development pathways
Sector
Baseline,
2010
Business as usual development pathway, 2030 Green economy pathway,
2030
Emission level
(in CO2e)
Key drivers Expected emission level
(in CO2e) (target)
1 Agriculture 185 95
Livestock 65 125 An increase of cattle population 77
Soil 12 60 Increased use of chemical fertilizer 18
Land expansion for agriculture
2 Forestry 55 90 Deforestation due to agricultural land
expansion
-40
Deforestation due to fuel wood and logging
3 Transport 5 40 Emissions from freight transport 30
Emissions from passenger transport
4 Industry 4 70 Cement industry 50
Other industries
5 Buildings 5 10 Waste due to urbanization 5
Off-grid energy consumption
Source: Federal Democratic Republic of Ethiopia (2011)
A low carbon economy is characterized by activities that emit low levels of carbon
dioxide into the atmosphere and minimal levels of other greenhouse gases (Regions for
Sustainable Change, 2013; Levy, 2010). In the process of preparing the Climate-Resilient
Green Economy Strategy, about 150 potential green economy initiatives were identified and
analysed, with 60 initiatives that support the achievement of development goals and reduce
greenhouse gas emissions being prioritized. There are two ways to reduce greenhouse gas
emissions: substitution to a good or service whose production or consumption emits less
greenhouse gases; or change of technique that involves switching to a completely new
technique and/or increase efficiency of existing technique (European Commission-
International Institute for Labour Studies, 2013).
There are four pillars in the green economy strategy:
(i) Adoption of agricultural and land-use efficiency measures;
(ii) Protecting and re-establishing forests for their economic and ecosystem
services including as carbon stocks;
(iii) Deployment of renewable and clean power generation; and
(iv) Use of appropriate advanced technologies in industry, transport, and buildings.
Table 12 provides main green economy drivers or activities in the Climate-Resilient
Green Economy Strategy summarizing their relevant goals and specific activities.
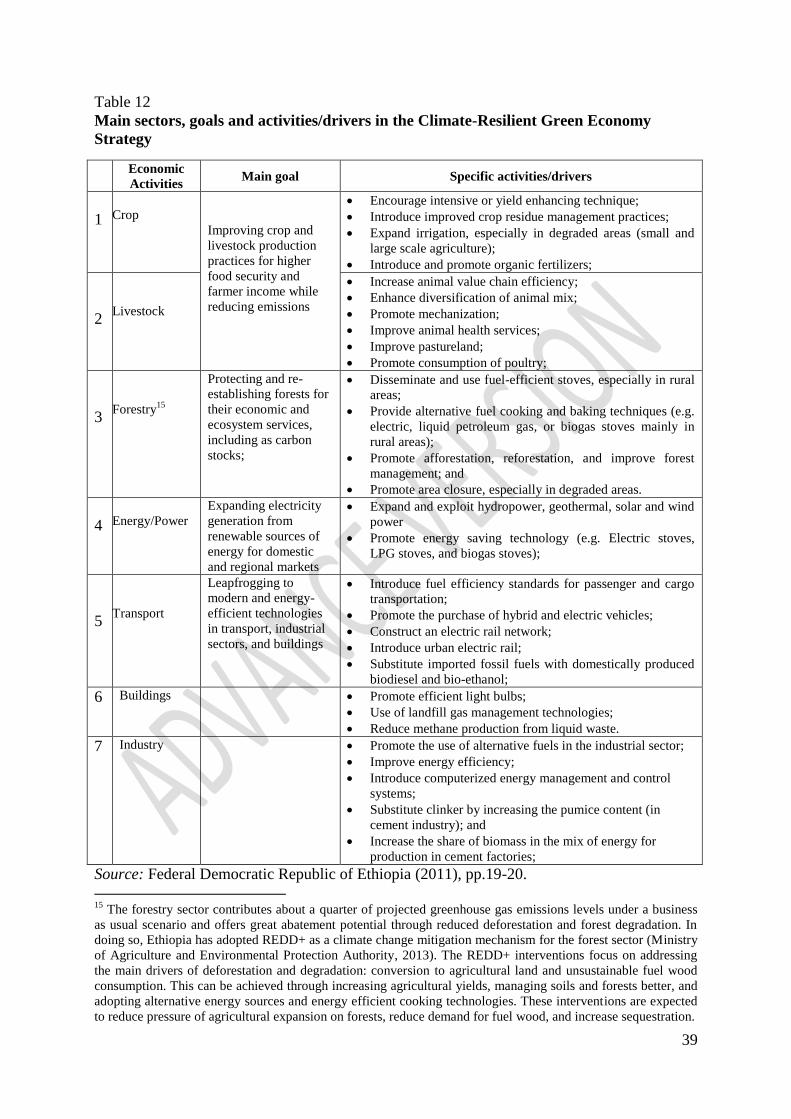
39
Table 12
Main sectors, goals and activities/drivers in the Climate-Resilient Green Economy
Strategy
Economic
Activities Main goal Specific activities/drivers
1
Crop
Improving crop and
livestock production
practices for higher
food security and
farmer income while
reducing emissions
Encourage intensive or yield enhancing technique;
Introduce improved crop residue management practices;
Expand irrigation, especially in degraded areas (small and
large scale agriculture);
Introduce and promote organic fertilizers;
2
Livestock
Increase animal value chain efficiency;
Enhance diversification of animal mix;
Promote mechanization;
Improve animal health services;
Improve pastureland;
Promote consumption of poultry;
3
Forestry15
Protecting and re-
establishing forests for
their economic and
ecosystem services,
including as carbon
stocks;
Disseminate and use fuel-efficient stoves, especially in rural
areas;
Provide alternative fuel cooking and baking techniques (e.g.
electric, liquid petroleum gas, or biogas stoves mainly in
rural areas);
Promote afforestation, reforestation, and improve forest
management; and
Promote area closure, especially in degraded areas.
4
Energy/Power
Expanding electricity
generation from
renewable sources of
energy for domestic
and regional markets
Expand and exploit hydropower, geothermal, solar and wind
power
Promote energy saving technology (e.g. Electric stoves,
LPG stoves, and biogas stoves);
5
Transport
Leapfrogging to
modern and energy-
efficient technologies
in transport, industrial
sectors, and buildings
Introduce fuel efficiency standards for passenger and cargo
transportation;
Promote the purchase of hybrid and electric vehicles;
Construct an electric rail network;
Introduce urban electric rail;
Substitute imported fossil fuels with domestically produced
biodiesel and bio-ethanol;
6 Buildings Promote efficient light bulbs;
Use of landfill gas management technologies;
Reduce methane production from liquid waste.
7 Industry Promote the use of alternative fuels in the industrial sector;
Improve energy efficiency;
Introduce computerized energy management and control
systems;
Substitute clinker by increasing the pumice content (in
cement industry); and
Increase the share of biomass in the mix of energy for
production in cement factories;
Source: Federal Democratic Republic of Ethiopia (2011), pp.19-20.
15
The forestry sector contributes about a quarter of projected greenhouse gas emissions levels under a business
as usual scenario and offers great abatement potential through reduced deforestation and forest degradation. In
doing so, Ethiopia has adopted REDD+ as a climate change mitigation mechanism for the forest sector (Ministry
of Agriculture and Environmental Protection Authority, 2013). The REDD+ interventions focus on addressing
the main drivers of deforestation and degradation: conversion to agricultural land and unsustainable fuel wood
consumption. This can be achieved through increasing agricultural yields, managing soils and forests better, and
adopting alternative energy sources and energy efficient cooking technologies. These interventions are expected
to reduce pressure of agricultural expansion on forests, reduce demand for fuel wood, and increase sequestration.
40
The Green Economy Strategy follows a sectoral approach. It identifies, and prioritizes
different initiatives to reduce greenhouse gas emissions. The Government of Ethiopia used
policy-screening criteria to prioritize and select a small suite of priority options. These criteria
were: local relevance and feasibility; alignment with Growth and Transformation Plan; and
low cost abatement potential. In implementing the Climate-Resilient Green Economy
strategy, four initiatives have been selected to fast-track implementation of the Strategy:
hydropower development, rural cooking technologies, the livestock value chain, and forestry
development (Ministry of Environmental Protection and Forestry, 2014).16
These initiatives
offer the prospect of immediate economic growth, large carbon abatement potential, and have
the potential to attract international climate finance (Eshetu Szirmai and others, 2014).
4.5 Inclusiveness and the Climate-Resilient Green Economy Strategy
A green economy development pathway entails substantial restructuring of the overall
economy in terms of both output and employment shares. This type of structural change needs
to be both green and inclusive, leading to a green economy and green society. This differs
from the earlier structural transformation model, in which urbanization and industrialization
was achieved through a carbon-dependent process with heavy environmental and social costs
(Cook and others, 2012). During a green economy transition, jobs could be lost in certain
sectors, while others can change in nature, and yet others could be created (United Nations
Research Institute for Social Development (UNRISD), 2012; ILO, 2011).17
The skill
composition of workers in high and low carbon intensive sectors matter for employment
transition, as some workers may need skills upgrading as sectors move to lower carbon
emissions, while workers in the high carbon intensive sectors will shift to a completely new
employment that might be completely unrelated to their previous employment (ILO, 2011).
The Government of Ethiopia is committed to building a green economy as a means of
lowering carbon emissions and promoting social inclusion through employment opportunities.
There are already various initiatives to support the green economy transition and achieve
social goals. Although not clearly spelled out in the Climate-Resilient Green Economy
Strategy, certain aspects of the social dimension feature in the strategy (see table 14). Some
green interventions, such as the dissemination of fuel-efficient cooking stoves and use of
mechanization in farming, would enhance social inclusion by benefiting the economically
disadvantaged groups of society, especially rural women, by improving their health and
reducing their workload. Similarly, green investments such as local production of fuel-
efficient stoves and investment in infrastructure (e.g. railway and waste recycling) would also
encourage creation of green jobs, which mainly benefit the unskilled young population (both
women and men). However, employment generated from infrastructural investments (e.g.
roads) is largely temporary in nature, and social protection and job security have remained an
issue. This indicates that further efforts are required to determine the social impact of the
climate-resilient green economy interventions; identify losers and winners; and identify
mechanisms to compensate those adversely affected by green interventions.
16
Information obtained from the Climate-Resilient Green Economy Facility indicates that about US$ 21 million
has been allocated to fast-track investment in selected priority sectors such as agriculture, water, irrigation and
energy, forests, industry, transport and urban development (Climate-Resilient Green Economy Facility Briefing,
2014). 17
Bastos (2012) indicates the adverse effect of biofuel farming in Brazil, India and Indonesia as it displaces
people from their livelihood. Similarly, conservation of carbon sinks in Australia constrains the livelihood
opportunities of indigenous peoples and has excluded traditional owners from participation in green economy
(Winer and others, 2012).

41
Table 13
Social dimensions of selected activities in the Climate-Resilient Green Economy Strategy
Green economy
activities
Potential
impact on
women
Potential impact on youth Remark
Encourage intensive or
yield enhancing
techniques (e.g. use of
carbon-
and nitrogen-efficient
crop cultivators)
Reduce
workload of rural
women on the
farm; generate
better income;
Training and employment
opportunities; more time for
other activities (e.g. schooling);
Enhances crop
productivity. But whether
or not this improves
household income depends
on relative prices, i.e. how
the prices of food crops
change compared with
non-food items, especially
prices of crop inputs
Expand irrigation,
especially in degraded
areas
Enhance food
security;
employment
Training and employment
opportunities;
Provides stable food
production enhances food
security
Promote mechanization Reduce
workload of rural
women
Training and employment
opportunities; more time for
other activities such as
schooling, other business
activities (e.g. maintenance
services and supply of spare
parts)
Encourages development
of other services activities
in rural areas
Dissemination and usage
of fuel-efficient stoves
Improve health;
save time;
Training and employment
opportunities; more time for
schooling;
Physical infrastructure
investments (e.g. roads,
urban housing
development, and railway)
Better living
conditions (e.g.
housing);
employment;
income;
Training and employment
opportunities; income
Employment opportunities
created in the
infrastructure are mainly
temporary in nature, with
limited social protection.
Both job security and
quality of jobs have
remained a concern.
Green rural electrification
(e.g. hydropower, solar
and geothermal)
Improve health
and living
conditions;
reduce workload
of rural women
Training and employment
opportunities; more time for
other activities (e.g. schooling);
Source: Constructed from the Climate Resilient Green Economy Strategy.
The social dimensions of a green economy need to address key issues, such as impact
of green economy initiatives and strategies on different social groups and patterns of
inequality, mechanisms to avoid adverse effects of green economy policies and strategies, and
whether or not adequate compensation mechanisms are in place.
Although the climate-resilient green economy interventions focus on sectors on which
the majority of the poor depend, poverty impacts on different segments of the population,
such as women, youth, and persons with disabilities, and consequences of such interventions
for those groups have not been estimated. Moreover, the Strategy does not provide any
quantitative targets and indicators on key social dimensions.
Without measurable targets and indicators, it is difficult to track the social dimensions
of green economy interventions. It seems that the social issues are seen as secondary to
economic and environmental concerns, and that poverty reduction is often assumed to follow
42
from employment and other aspects of well-being associated with a low-carbon development
path (Cook and others, 2012; OECD, 2010). Hence, integration of social concerns into
economic and environmental policy design and implementation is crucial to enhance social
inclusion. Efforts are being made to integrate social and distributional issues in the project
selection stage in the sectoral climate-resilient green economy strategies. For instance, in the
preparation of the Climate Resilience Strategy for agriculture and forestry, equity and
distributional issues have been explicitly used as one of the criteria to select climate
adaptation options.18
There is still a need for social, economic and environmental policies to be more
integrated, complementary and synergistic with other sectoral climate-resilient green
economy strategies (UNRSID, 2012). Labour market regulation for “decent work” is another
crucial area that needs close attention. From an inclusive green economy perspective, there is
a need to pay attention to not only the number of jobs created but also the quality of jobs and
working conditions. For instance, the country does not report green jobs separately in any of
its major surveys or statistics of employment, such as National Labour Force Surveys, nor
does it measure or report the size or growth of green industries. This highlights a glaring need
to continuously monitor the growth of the green economy and to report green industries and
jobs as part of the country‟s statistics.
Many of the social dimensions that are not explicitly indicated in the Climate-Resilient
Green Economy Strategy have been incorporated into the Growth and Transformation Plan
(see Chapter 3). Even then, it is not clear whether or not targets, indicators and outcomes
related to social dimensions in the Growth and Transformation Plan are due to green economy
interventions; and the impact of green economy interventions on key social dimensions has
remained unclear.
4.6 Implementation of the Climate-Resilient Green Economy Strategy
Implementation of the Climate-Resilient Green Economy Strategy and sectoral
environmental policy reforms that support both green industries and the greening of the
economy as a whole fall under the mandate of the various sectoral institutions, such as the
Ministries of Agriculture, Industry, and Water, Irrigation and Energy.
While the Ministry of Finance and Economic Development provides financial support
for sectoral climate-resilient green economy activities, the Ministry of Environmental
Protection and Forestry is responsible for technical coordination and provides technical
support to other Ministries. However, not all Federal Ministries are currently implementing
the Climate-Resilient Green Economy Strategy as a guiding framework. Stakeholder
consultations indicate that the depth of information on the green economy strategy has been
limited in some government offices.
The overall responsibility for and oversight of the Climate-Resilient Green Economy
Strategy lies with the Environmental Council chaired by the Prime Minister and comprises
members drawn from Federal Ministries, Presidents of National Regional States, and
representatives of non-governmental bodies, the private sector, and trade unions.
18
In the draft Climate Resilience Strategy for agriculture and forestry, about 350 adaptation options in
agriculture have been identified from a long-list of 1000 potential adaptation options. Next, the 350 unique
options were filtered down to 41 promising options based on feasibility, contribution to economic growth,
contribution to equity and distributional issues, and the extent to which they address the current weather
variability and future impacts of climate change (Federal Democratic Republic of Ethiopia, n.d.).
43
The Climate-Resilient Green Economy Strategy is coordinated and supervised by the
Climate-Resilient Green Economy Strategy Ministerial Steering Committee and units have
been established in key implementing line Ministries and regions to translate the Strategy into
sectoral programmes and investment plans. The Government of Ethiopia has established a
national financing mechanism, the Climate-Resilient Green Economy Facility, to support the
implementation of the priorities set out in the Strategy and the subsequent development and
implementation of relevant investment plans. The Ministry of Finance and Economic
Development together with the Ministry of Environmental Protection and Forestry has been in
charge of soliciting financial support from international sources and of administrating climate-
resilient green economy-related funds. The Facility, where bilateral and multilateral donors
channel climate funds for green activities, needs to conform to the overall goals and strategic
directions set by the Environmental Council and the Climate-Resilient Green Economy
Strategy Ministerial Steering Committee. Currently, the Facility is coordinated by the
Ministry of Finance and Economic Development. The Ministerial Committee governs the
Facility and sets criteria and scope for approving investment plans, and determines the
overarching priorities for the Facility. Given that the Ministry of Finance and Economic
Development is in charge of soliciting finance for development programmes and projects, the
placement of the Facility within Ministry of Finance and Economic Development helps to
prioritize and direct allocation of funds among different development programmes.
Awareness and implementation of the Strategy has yet to spread to the lower levels of
government, NGOs and private actors. Financing the implementation schemes has to be
worked out beforehand to gain momentum and enable self-reinforcement. Reports indicate the
readiness of Ethiopia for climate finance. In a consultative meeting hosted by Ethiopia in
Addis Ababa in February 2014 on the readiness of Ethiopia for climate finance, it was
indicated that there is a high level of “readiness and understanding of climate finance in
Ethiopia, strong institutional arrangements and political commitment to support Ethiopia‟s
aspiration to gain accreditation to the Global Adaptation Fund and consequently, the newly
established Green Climate Fund (UNDP, 2014) The readiness of the government will be
strengthened if a strong readiness is built across public institutions and other stakeholders.
Ethiopian public enterprises and businesses have to be assessed for their awareness of global
opportunities and assistance provisions or for their readiness for climate finance. It is
necessary to have an institution responsible for guiding and directing inclusive green
economy actors to available sources of funding, such as the Sustainable Energy Fund for
Africa, the Global Environment Fund the Climate Investment Funds, and the Green Climate
Fund (African Development Bank-OECD, 2013).
44
5. Linkages and coherence between inclusive green economy policies and those
directly addressing structural transformation in Ethiopia
The transformation agenda of the Government of Ethiopia crucially depends on the
development of the agricultural and industrial sectors. In the process of structural
transformation, the relative importance of sectors changes in the economy, in terms of
production and utilization of production factors. This would usually require shifting labour
and other resources from subsistence agriculture to commercial agriculture, manufacturing
and modern services. Structural transformation is a key driver for sustained growth,
productive employment creation and poverty reduction. Economic and social policies have
the potential to alter not just the pace of structural transformation, but also the greenness and
inclusiveness of that transformation. The success of the Growth and Transformation Plan
partly depends on how natural resources are managed, which requires integrated cross-
sectoral solutions that promote sustainable economic, environmental and social development.
5.1 Synergies between inclusive green economy and structural
transformation policies
Overall, the main inclusive green economy policy (the Climate-Resilient Green
Economy Strategy) is coherent with and reinforces the country‟s structural transformation
plan (the Growth and Transformation Plan). This has been achieved through policy
integration during formulation. Integrated programme development has also been used to
enhance coherence in that regard. The green economy vision, as articulated in the Climate-
Resilient Green Economy Strategy, is not only consistent with the Growth and
Transformation Plan, but also reinforces the country‟s long-term economic vision as stated in
that Plan.
“building an economy which has a modern and productive agricultural sector with
enhanced technology and an industrial sector that plays a leading role in the
economy, sustaining economic development and securing social justice and
increasing per-capita income of the citizens so as to reach the level of those in
middle-income countries” (Ministry of Finance and Economic Development,
2010:21).
5.1.1 Policy integration
There are at least two possible ways to integrate green economy targets into national
transformation policies (Green Growth Best Practice Initiative (GGBPI), 2013; OECD, 2012;
Energy Sector Management Assistance Programme, 2009). The first approach involves
mainstreaming a green economy strategy into national transformation plans and strategies.
The second approach relates to preparing a stand-alone strategy for a green economy, which
focuses on key technologies and investments and develops a time-bound plan with associated
targets. The Ethiopian experience illustrates a combination of the two approaches: the stand-
alone Climate-Resilient Green Economy Strategy was prepared and then integrated into the
existing Growth and Transformation Plan and institutions so that they work together and
reinforce each other. The development of the Strategy was informed by the country‟s
medium-term growth and transformation plan (see figure 16). The Strategy in turn needs to be
aligned with domestic priorities as reflected in the Growth and Transformation Plan, since
national priorities determine whether it is feasible to target all major sectors or just specific
areas of interest. Next, sectoral strategies have been adjusted accordingly to make them
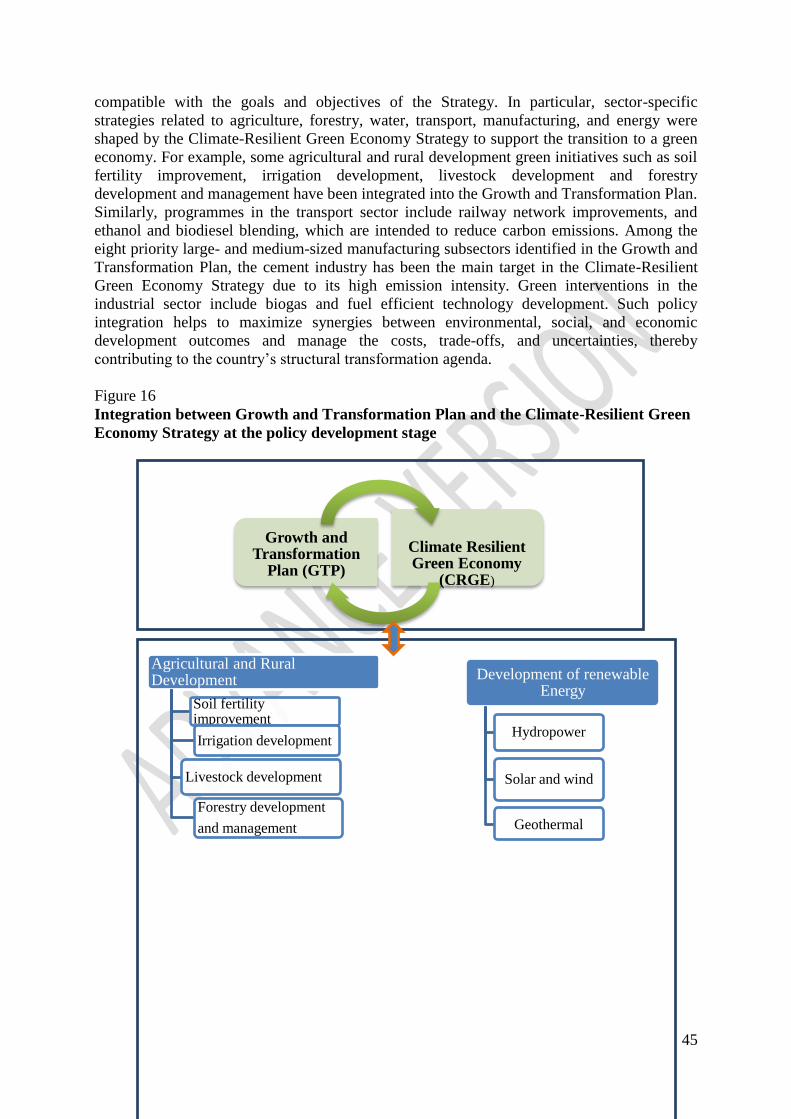
45
compatible with the goals and objectives of the Strategy. In particular, sector-specific
strategies related to agriculture, forestry, water, transport, manufacturing, and energy were
shaped by the Climate-Resilient Green Economy Strategy to support the transition to a green
economy. For example, some agricultural and rural development green initiatives such as soil
fertility improvement, irrigation development, livestock development and forestry
development and management have been integrated into the Growth and Transformation Plan.
Similarly, programmes in the transport sector include railway network improvements, and
ethanol and biodiesel blending, which are intended to reduce carbon emissions. Among the
eight priority large- and medium-sized manufacturing subsectors identified in the Growth and
Transformation Plan, the cement industry has been the main target in the Climate-Resilient
Green Economy Strategy due to its high emission intensity. Green interventions in the
industrial sector include biogas and fuel efficient technology development. Such policy
integration helps to maximize synergies between environmental, social, and economic
development outcomes and manage the costs, trade-offs, and uncertainties, thereby
contributing to the country‟s structural transformation agenda.
Figure 16
Integration between Growth and Transformation Plan and the Climate-Resilient Green
Economy Strategy at the policy development stage
Growth and Transformation
Plan (GTP)
Climate Resilient Green Economy
(CRGE)
Agricultural and Rural Development
Soil fertility improvement
Irrigation development
Livestock development
Forestry development
and management
Development of renewable Energy
Hydropower
Solar and wind
Geothermal
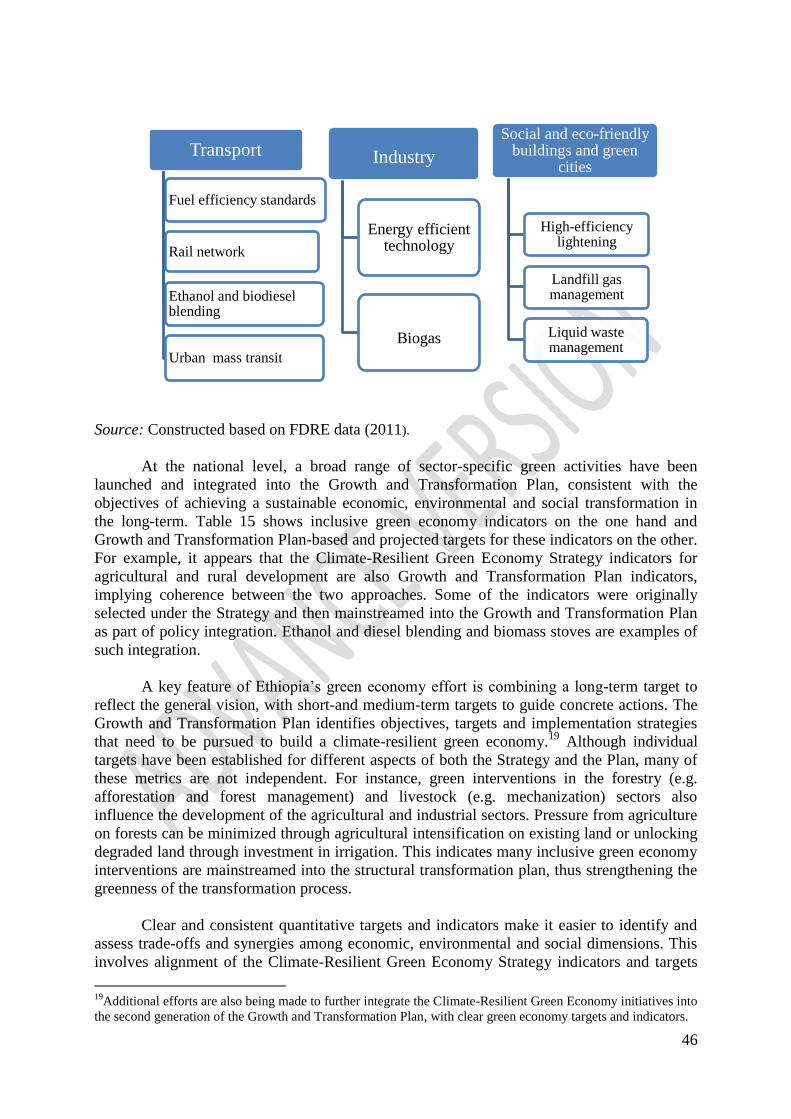
46
Source: Constructed based on FDRE data (2011).
At the national level, a broad range of sector-specific green activities have been
launched and integrated into the Growth and Transformation Plan, consistent with the
objectives of achieving a sustainable economic, environmental and social transformation in
the long-term. Table 15 shows inclusive green economy indicators on the one hand and
Growth and Transformation Plan-based and projected targets for these indicators on the other.
For example, it appears that the Climate-Resilient Green Economy Strategy indicators for
agricultural and rural development are also Growth and Transformation Plan indicators,
implying coherence between the two approaches. Some of the indicators were originally
selected under the Strategy and then mainstreamed into the Growth and Transformation Plan
as part of policy integration. Ethanol and diesel blending and biomass stoves are examples of
such integration.
A key feature of Ethiopia‟s green economy effort is combining a long-term target to
reflect the general vision, with short-and medium-term targets to guide concrete actions. The
Growth and Transformation Plan identifies objectives, targets and implementation strategies
that need to be pursued to build a climate-resilient green economy.19
Although individual
targets have been established for different aspects of both the Strategy and the Plan, many of
these metrics are not independent. For instance, green interventions in the forestry (e.g.
afforestation and forest management) and livestock (e.g. mechanization) sectors also
influence the development of the agricultural and industrial sectors. Pressure from agriculture
on forests can be minimized through agricultural intensification on existing land or unlocking
degraded land through investment in irrigation. This indicates many inclusive green economy
interventions are mainstreamed into the structural transformation plan, thus strengthening the
greenness of the transformation process.
Clear and consistent quantitative targets and indicators make it easier to identify and
assess trade-offs and synergies among economic, environmental and social dimensions. This
involves alignment of the Climate-Resilient Green Economy Strategy indicators and targets
19
Additional efforts are also being made to further integrate the Climate-Resilient Green Economy initiatives into
the second generation of the Growth and Transformation Plan, with clear green economy targets and indicators.
Transport
Fuel efficiency standards
Rail network
Ethanol and biodiesel blending
Urban mass transit
Industry
Energy efficient technology
Biogas
Social and eco-friendly buildings and green
cities
High-efficiency lightening
Landfill gas management
Liquid waste management

47
with those of the Growth and Transformation Plan. However, there is some disconnect
between the Strategy and the Plan in terms of targets. While the Strategy targets are expressed
in terms of emissions reductions in carbon dioxide equivalent (CO2e) (see table 11), the Plan
targets are expressed in different ways and do not include emissions reductions. This suggests
a need to harmonize targets and indicators to effectively monitor the actual contribution of the
Strategy towards the realization of the Plan. The overarching Strategy targets are expressed in
terms of emissions reductions to measure and track the progress of the green economy
strategy, but clear monitoring and evaluation mechanisms are lacking. This highlights an area
where a lack of institutional capacity and data are likely limiting the ability to establish
adequate measurement and feedback mechanisms.

48
Table 14
Inclusive green economy indicators compared to those of the Growth and
Transformation Plan
Inclusive green economy indicators
Growth and
Transformation
Plan Baseline
2009/10
Growth and
Transformation
Plan targets
(2014/15)
Agriculture and rural development
Supply of improved seeds (mnqt) 3.6
Use of bio-fertilizers (organic fertilizer) na
Areas under Vertisol development (mn ha) 3
Acidic land treated with lime (ha) 37850
Area of land rehabilitated (mn ha) 3.208 10.21
Land developed under community based watershed development
programme (mn ha) 3.772 7.78
Total area of land subjected to soil fertility research (mn ha) 0.89 2.82
Total area of land covered with forest and forest master plan (mn ha) 0.70 2.20
Area of land covered with multi-purpose trees (mn ha) 6.06 16.21
Forest coverage (mn ha) 13.0 18.23
Increase multipurpose trees (ha) 10154
Natural resources conservation activities in pastoral areas (ha) 350,000
Area covered by major food crops (mn ha) 12.2
Cereal productivity (qt/ha) 22
Improved cattle feed production (qt) 50000 145,000
Improved cattle breeds (%) 10.37 37
Production and distribution of improved livestock gene (mn dose) 2
Proportion of livestock vaccinated (%) 65
Proportion of women and youth benefited from agricultural extension
services (%) 40
Number of households participating in safety net programmes (mn) 7.1 1.3
Male/female headed farmers certified with first level land owner ship
certification (in million) 8.02 Not indicated
Male headed/female headed farmers certified with second level land owner
ship certification (in million) 0.99 3.69
Industry
Upgrade priority manufacturing sectors in terms of technological capacity
and industrial structure na
Energy efficiency na
Environmental performance/compliance na
Development of SMEs na
Foster diversification of strategic manufacturing sectors na
Construction and Urban Development
Jobs created to reduce urban unemployment rate in towns under integrated
housing development (000)
176 182
Job created through SMEs (mln) 3.0
Provision of housing and basic services (number of housing units) 213,000 370,000
Reduction of slum areas (%) 60 30
Road constructed with cobblestone (km) 3738
Development of solid waste landfills sites (no)
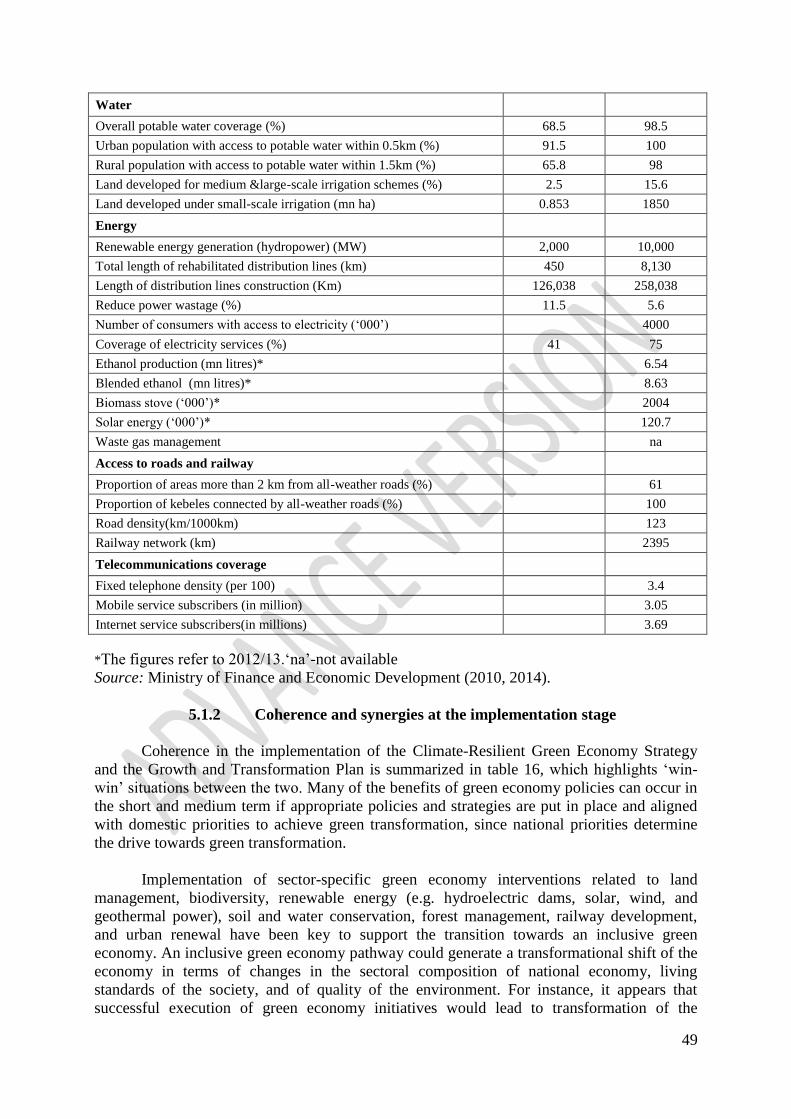
49
Water
Overall potable water coverage (%) 68.5 98.5
Urban population with access to potable water within 0.5km (%) 91.5 100
Rural population with access to potable water within 1.5km (%) 65.8 98
Land developed for medium &large-scale irrigation schemes (%) 2.5 15.6
Land developed under small-scale irrigation (mn ha) 0.853 1850
Energy
Renewable energy generation (hydropower) (MW) 2,000 10,000
Total length of rehabilitated distribution lines (km) 450 8,130
Length of distribution lines construction (Km) 126,038 258,038
Reduce power wastage (%) 11.5 5.6
Number of consumers with access to electricity („000‟) 4000
Coverage of electricity services (%) 41 75
Ethanol production (mn litres)* 6.54
Blended ethanol (mn litres)* 8.63
Biomass stove („000‟)* 2004
Solar energy („000‟)* 120.7
Waste gas management na
Access to roads and railway
Proportion of areas more than 2 km from all-weather roads (%) 61
Proportion of kebeles connected by all-weather roads (%) 100
Road density(km/1000km) 123
Railway network (km) 2395
Telecommunications coverage
Fixed telephone density (per 100) 3.4
Mobile service subscribers (in million) 3.05
Internet service subscribers(in millions) 3.69
*The figures refer to 2012/13.„na‟-not available
Source: Ministry of Finance and Economic Development (2010, 2014).
5.1.2 Coherence and synergies at the implementation stage
Coherence in the implementation of the Climate-Resilient Green Economy Strategy
and the Growth and Transformation Plan is summarized in table 16, which highlights „win-
win‟ situations between the two. Many of the benefits of green economy policies can occur in
the short and medium term if appropriate policies and strategies are put in place and aligned
with domestic priorities to achieve green transformation, since national priorities determine
the drive towards green transformation.
Implementation of sector-specific green economy interventions related to land
management, biodiversity, renewable energy (e.g. hydroelectric dams, solar, wind, and
geothermal power), soil and water conservation, forest management, railway development,
and urban renewal have been key to support the transition towards an inclusive green
economy. An inclusive green economy pathway could generate a transformational shift of the
economy in terms of changes in the sectoral composition of national economy, living
standards of the society, and of quality of the environment. For instance, it appears that
successful execution of green economy initiatives would lead to transformation of the
50
economy where the share of natural-resource dependent sectors such as agriculture in national
output would decline from 45.5 per cent in 2010 to 27 per cent by 2030 (Federal Democratic
Republic of Ethiopia, 2011). Similarly, the share of industry would increase to 34 per cent.
5.1.3 Agriculture and rural development
Efforts have been made to transform the large subsistence and smallholder agriculture
towards increased productivity and growth trajectory in Ethiopia. In this respect, two flagship
programmes can demonstrate how climate-resilient green economy activities have been linked
to the structural transformation plan: the Sustainable Land Management Programme and the
Productive Safety Net Programme. Both programmes were prepared and are being executed
by the Ministry of Agriculture to achieve the objectives of the Climate-Resilient Green
Economy and the Growth and Transformation Plan, with Ministry of Finance and Economic
Development mobilizing and coordinating the financial aspect of the programmes. The first
Sustainable Land Management Programme (2008-2013) focused on sustainable land
management practices and covered 45 districts, also called woredas, in six regions: Tigray,
Amhara, Oromia, the Southern Nations, Nationalities and Peoples‟ Region, Gambella, and
Benishangul-Gumz. Based on good practices of the first phase, the second phase of the
Sustainable and Management Programme (2014-2019) integrates key climate-related issues
(see table 16). It covers six regions and 135 woredas (90 new and 45 existing) (Ministry of
Agriculture, 2013). Similar to the first Sustainable Land Management Programme, the second
phase consists of four interrelated components: integrated watershed and landscape
management; institutional strengthening, capacity development and knowledge management;
rural land administration, certification and land use; and project management.
On social protection, the Productive Safety Net Programme is a national social safety
net programme that responds to chronic food insecurity and short-term shocks and integrates
climate-resilient green economy initiatives into existing institutional set-ups. The Government
of Ethiopia, together with donors, established the Productive Safety Net Programme in 2005.
It is a multi-year programme, focusing on households that are both chronically food insecure
and poor in drought prone areas of Ethiopia (see box 2). It focuses on landscape restoration
and infrastructural development in rural areas. As one of the components of the food security
programme, the Programme provides support to households in the form of direct cash and
food transfers to food insecure households. It provides two types of social protection: social
assistance and social insurance. While social assistance involves unconditional transfers (e.g.
cash, and food for the elderly and persons with disabilities), social insurance is often tied to
the labour market. It involves participation of households in public work projects such as
environmental rehabilitation, water control, and road construction and maintenance. This
entails benefits in either cash, in-kind or both in return for their labour contribution.
Social protection supplements economic growth by shielding people from income
swings, sustaining investment in human capital, and compensating those who are placed at a
disadvantage due to economic, social and environmental distress, thereby increasing the
resilience of households (Coudouel and others, 2002). Natural resource management, such as
soil and water conservation, works through mobilization of community participation and is a
key feature of Ethiopia‟s climate-resilient green economy implementation. For instance,
environmental conservation through community participation was undertaken in 13.7 million
ha of land in the country in 2012/13 (Ministry of Finance and Economic Development, 2014).
This participation was on a voluntary basis, indicating society‟s growing awareness of the
risks of climate change. Together, these two green flagship programmes not only reinforce the
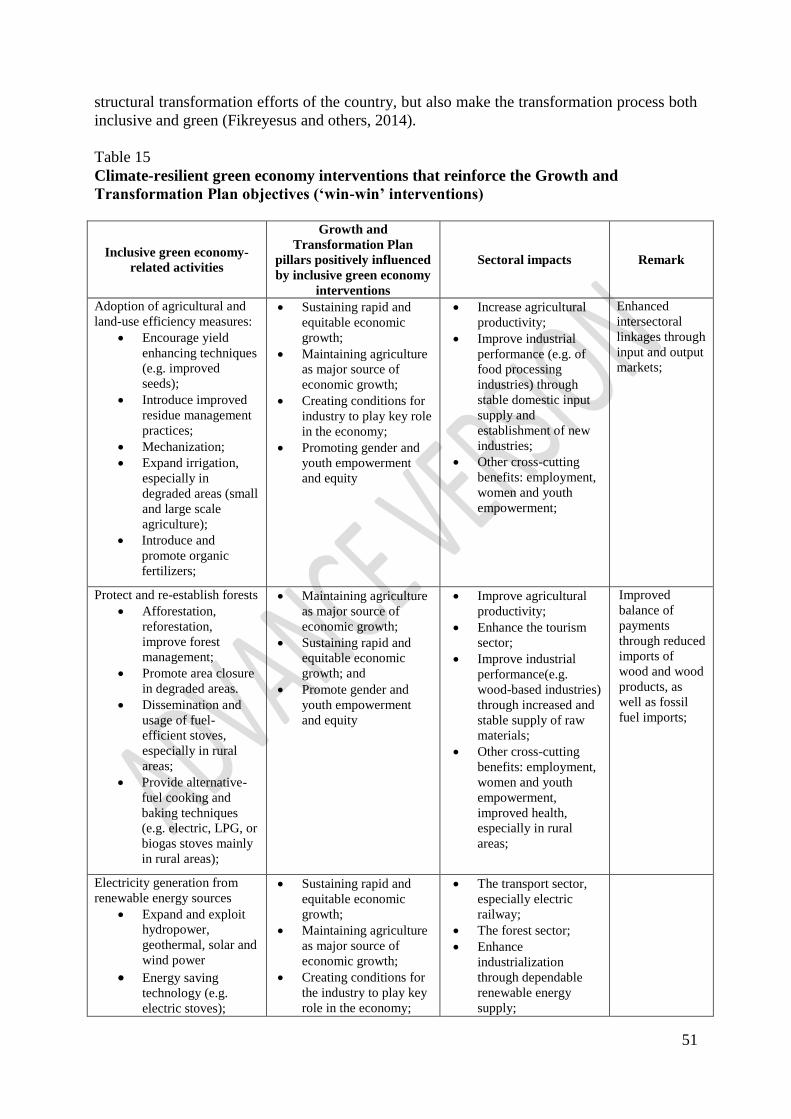
51
structural transformation efforts of the country, but also make the transformation process both
inclusive and green (Fikreyesus and others, 2014).
Table 15
Climate-resilient green economy interventions that reinforce the Growth and
Transformation Plan objectives (‘win-win’ interventions)
Inclusive green economy-
related activities
Growth and
Transformation Plan
pillars positively influenced
by inclusive green economy
interventions
Sectoral impacts Remark
Adoption of agricultural and
land-use efficiency measures:
Encourage yield
enhancing techniques
(e.g. improved
seeds);
Introduce improved
residue management
practices;
Mechanization;
Expand irrigation,
especially in
degraded areas (small
and large scale
agriculture);
Introduce and
promote organic
fertilizers;
Sustaining rapid and
equitable economic
growth;
Maintaining agriculture
as major source of
economic growth;
Creating conditions for
industry to play key role
in the economy;
Promoting gender and
youth empowerment
and equity
Increase agricultural
productivity;
Improve industrial
performance (e.g. of
food processing
industries) through
stable domestic input
supply and
establishment of new
industries;
Other cross-cutting
benefits: employment,
women and youth
empowerment;
Enhanced
intersectoral
linkages through
input and output
markets;
Protect and re-establish forests
Afforestation,
reforestation,
improve forest
management;
Promote area closure
in degraded areas.
Dissemination and
usage of fuel-
efficient stoves,
especially in rural
areas;
Provide alternative-
fuel cooking and
baking techniques
(e.g. electric, LPG, or
biogas stoves mainly
in rural areas);
Maintaining agriculture
as major source of
economic growth;
Sustaining rapid and
equitable economic
growth; and
Promote gender and
youth empowerment
and equity
Improve agricultural
productivity;
Enhance the tourism
sector;
Improve industrial
performance(e.g.
wood-based industries)
through increased and
stable supply of raw
materials;
Other cross-cutting
benefits: employment,
women and youth
empowerment,
improved health,
especially in rural
areas;
Improved
balance of
payments
through reduced
imports of
wood and wood
products, as
well as fossil
fuel imports;
Electricity generation from
renewable energy sources
Expand and exploit
hydropower,
geothermal, solar and
wind power
Energy saving
technology (e.g.
electric stoves);
Sustaining rapid and
equitable economic
growth;
Maintaining agriculture
as major source of
economic growth;
Creating conditions for
the industry to play key
role in the economy;
The transport sector,
especially electric
railway;
The forest sector;
Enhance
industrialization
through dependable
renewable energy
supply;

52
Promote gender and
youth empowerment
and equity
Other services sector
(e.g. maintenance
services);
Other cross-cutting
benefits: employment,
women and youth
empowerment,
improved health,
especially in rural
areas;
National Flagship Programmes
Sustainable Land Management
Programme (e.g. REDD+ ,
Climate Smart Agriculture,
and Great Green Wall
Initiative for the Sahara and
the Sahel
mulching,
intercropping,
conservation
agriculture,
zero-tillage,
crop rotation,
cover cropping,
integrated crop-
livestock
management,
agroforestry and
reforestation,
water management,
and
skills and training
Sustaining rapid and
equitable economic
growth;
Maintaining agriculture
as major source of
economic growth;
Promote gender and
youth empowerment
and equity;
Enhancing expansion
and quality of
infrastructure
development;
Enhancing expansion
and quality of social
development;
Increase agricultural
productivity;
Livestock sector;
Improved road
development;
The forest sector;
Improved water
management and
utilization;
Enhanced input supply
to the industrial sector;
Other cross-cutting
benefits: employment,
women and youth
empowerment,
improved farmers‟
resilience to climate
change, improved skill
acquisition and human
capital formation (e.g.
improved access to
education); better
environment;
Productive Safety Net
Programme including
Household Asset Building
Programme
Public works (e.g.
soil and water
conservation)
Food and cash
transfers to most
climate-vulnerable
community members
Risk financing
facility
Sustaining rapid and
equitable economic
growth;
Maintaining agriculture
as major source of
economic growth;
Promote gender and
youth empowerment
and equity;
Enhancing expansion
and quality of
infrastructure
development;
Enhancing expansion
and quality of social
development;
Increase agricultural
productivity;
Other cross-cutting
benefits: employment,
women and youth
empowerment,
improved farmers‟
resilience to climate
change, improved skill
acquisition and human
capital formation (e.g.
improved access to
education); better
environment; improved
household resilience
Scaling-up Renewable Energy
Programme
(e.g. National Biogas
Programme and Community
and the Community Managed
Renewable Energy
Programme for Rural
Ethiopia)
Sustaining rapid and
equitable economic
growth;
Promote gender and
youth empowerment
and equity;
Increase agricultural
productivity;
The service sector (e.g.
improved access to
electricity helps to
stimulate businesses);
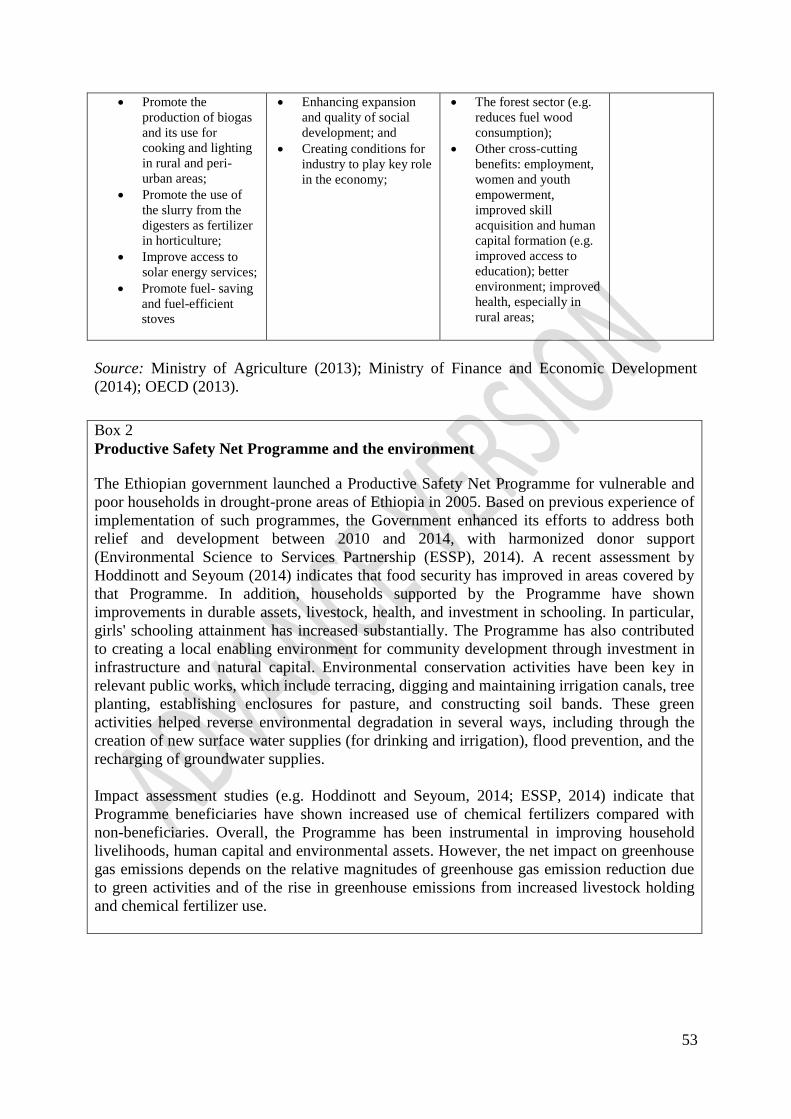
53
Promote the
production of biogas
and its use for
cooking and lighting
in rural and peri-
urban areas;
Promote the use of
the slurry from the
digesters as fertilizer
in horticulture;
Improve access to
solar energy services;
Promote fuel- saving
and fuel-efficient
stoves
Enhancing expansion
and quality of social
development; and
Creating conditions for
industry to play key role
in the economy;
The forest sector (e.g.
reduces fuel wood
consumption);
Other cross-cutting
benefits: employment,
women and youth
empowerment,
improved skill
acquisition and human
capital formation (e.g.
improved access to
education); better
environment; improved
health, especially in
rural areas;
Source: Ministry of Agriculture (2013); Ministry of Finance and Economic Development
(2014); OECD (2013).
Box 2
Productive Safety Net Programme and the environment
The Ethiopian government launched a Productive Safety Net Programme for vulnerable and
poor households in drought-prone areas of Ethiopia in 2005. Based on previous experience of
implementation of such programmes, the Government enhanced its efforts to address both
relief and development between 2010 and 2014, with harmonized donor support
(Environmental Science to Services Partnership (ESSP), 2014). A recent assessment by
Hoddinott and Seyoum (2014) indicates that food security has improved in areas covered by
that Programme. In addition, households supported by the Programme have shown
improvements in durable assets, livestock, health, and investment in schooling. In particular,
girls' schooling attainment has increased substantially. The Programme has also contributed
to creating a local enabling environment for community development through investment in
infrastructure and natural capital. Environmental conservation activities have been key in
relevant public works, which include terracing, digging and maintaining irrigation canals, tree
planting, establishing enclosures for pasture, and constructing soil bands. These green
activities helped reverse environmental degradation in several ways, including through the
creation of new surface water supplies (for drinking and irrigation), flood prevention, and the
recharging of groundwater supplies.
Impact assessment studies (e.g. Hoddinott and Seyoum, 2014; ESSP, 2014) indicate that
Programme beneficiaries have shown increased use of chemical fertilizers compared with
non-beneficiaries. Overall, the Programme has been instrumental in improving household
livelihoods, human capital and environmental assets. However, the net impact on greenhouse
gas emissions depends on the relative magnitudes of greenhouse gas emission reduction due
to green activities and of the rise in greenhouse emissions from increased livestock holding
and chemical fertilizer use.
54
5.1.3.1 Energy and transport
The transportation sector is also expected to experience energy demand changes,
especially mass transport in urban areas such as railways, which heavily depend on electricity,
generated from renewable sources (e.g. hydropower). National railway projects covering close
to 5,000 km are currently being implemented and are expected to be completed by the end of
the second generation Growth and Transformation Plan. Other projects under implementation
include the light railway and rapid bus transit systems, which would replace the large number
of diesel buses in Addis Ababa. Given that the transport system being established will be
powered by renewable energy, it will reduce the dependence on fossil energy, increase
savings from reduced expenditure on fossil energy, and reduce congestion, thereby improving
environmental quality (Omilola, 2014).
There will be a major shift from fossil to renewable sources in the energy sector, as a
large share of energy is expected to be generated from hydropower, wind, and geothermal
energy. For example, several renewable energy projects are being implemented in the country,
including ten hydropower projects (with a total capacity of close to 5,500 MW) to be
completed by 2015, seven wind power projects (with a total of 764 MW) and six geothermal
projects (with a total of 450 MW) to be completed by 2018 (Eshetu and others, 2014).
Furthermore, the national Scaling-up Renewable Energy Programme is expected to lead to a
change in the energy mix of households, as a large share of households, especially in rural
areas will benefit from renewable energy and energy-efficient cooking/baking stoves. In
particular, the latter will help rural households save up to 10 per cent of their income, thereby
increasing domestic savings, and thus resulting in improved domestic finance for investment
(Ministry of Water and Energy, 2012). The industrial sector will also experience a change in
energy mix, as an increasing number of local manufacturing industries will use renewable
energy sources.
Wood is the most important energy source for household cooking, particularly in rural
areas where alternative fuel sources are either unavailable or unaffordable. In Ethiopia, over
90 per cent of households are estimated to cook with biomass, which has resulted in
significant environmental degradation such as depletion of forests and related consequences
(Beyene and others, 2013). In rural areas, cooking is done using open fires, which are
inefficient and hazardous for health. Ethiopia‟s energy mix strategy focuses on the
development of alternative energy from renewable sources such as wind, geothermal, solar
and biomass power and on energy efficiency measures. Fuel-efficient cooking stoves, and the
development of renewable energy programmes are worthy of mention. The Government of
Ethiopia is promoting fuel-efficient biomass cook stoves, such as mirtinjer a cookstoves and
Lakech stoves, as a key part of its effort to reduce emissions from deforestation and forest
degradation and beyond (REDD+), and promote environmental and health agendas.
Accordingly, the Government has planned to distribute 9.4 million stoves across the country
by 2015. Studies (Gebreegziabher and others, 2014; Beyene and Koch, 2013) indicated that
fuel-efficient stoves have three-fold benefits, namely saving carbon, reducing the workload
of women, and improving air quality. Fuel-efficient cooking stoves reduce fuel-wood
consumption substantially compared to traditional cooking stoves.
Furthermore, the Ministry of Water, Irrigation and Energy has been promoting solar
panels in rural households and institutions like rural telecommunications stations, health
centres, and health posts (Mohamed, 2014). Rural households and service centres are now
beneficiaries of solar energy technology, which provides power for lighting, mobile phones,

55
computers and solar fridges. The target of the solar energy expansion programme is to install
solar panels in 30,000 households by the end of the Growth and Transformation Plan period.
Ethiopia‟s ambition is to become a powerhouse for regional green transformation,
particularly in East Africa. The hydropower sub-sector is responsible for the vast majority of
the multiple-fold growth of Ethiopia's energy generating capacity. The country is aggressively
developing hydropower plants under the Growth and Transformation Plan20
not only to fulfil
the domestic needs but also to export electricity to surrounding countries. Exports of
renewable energy to neighbouring countries such as Djibouti and Sudan have already
started.21
Electric power transmission lines are also being extended to Kenya. The
transmission line between Ethiopia and Sudan is part of the East African Power Pool, which
envisages interconnection projects between: Ethiopia and Kenya; United Republic of
Tanzania, Zambia, Kenya and Uganda; and Ethiopia, Sudan and Egypt (Africa Review,
2014). In addition, Ethiopia plans to establish grid links to Rwanda, South Sudan, Uganda,
United Republic of Tanzania and even to Yemen across the Red Sea, thereby making Ethiopia
the energy superpower in East Africa. Since energy is the major input for industries, the future
of East Africa‟s industrialization is on the green trajectory, with limited greenhouse gas
emissions from renewable and new energy sources.22
Ethiopia could influence the transition to a green economy in Africa through its
advocacy for investment in green industries on the continent. The country shares the view that
for Africa to benefit from the transition to a green economy, countries should be guided by
national objectives, as well as social, economic and environmental development imperatives.
The establishment of appropriate institutional frameworks is essential in that regard.
5.1.3.2 Integrated Housing and Infrastructure Development
Programme and green jobs
The Government of Ethiopia has been taking major steps to generate green jobs in
both rural and urban areas. The Integrated Housing Development Programme and the
Infrastructural Development Programme provide good examples. While the latter focuses on
landscape restoration and infrastructural development, for example through productive safety
net programmes in rural areas, the focus of the former is on urban renewal (see box 3).
Households are benefiting from the programmes through active participation in natural
resources conservation and infrastructural development, especially rural roads. The Integrated
Housing Development Programme, which has been implemented across urban centres in the
country to upgrade slum urban areas, generates green jobs. Between 2010/11 and 2012/13,
about 481,000 jobs were created through housing and related projects (Ministry of Finance
and Economic Development, 2014). Although the Programme creates green job opportunities
for both skilled and unskilled labour, it is essential to assess whether or not these jobs are
decent, and benefit the poor meaningfully.
20
Even before the Growth and Transformation Plan, the Government of Ethiopia built three major hydropower
plants: the Tekeze, Gilgel Gibe II and Tana Belese plants. 21
Ethiopia has earned close to US$ 33 million during the past nine months. Currently, Ethiopia provides 100
megawatts electricity to Sudan and up to 50 megawatts to Djibouti. 22
The Government signed a contract to build the largest geothermal power station in Ethiopia with Reykjavik
Geothermal, a European company from Iceland. Under the agreement, Reykjavik Geothermal is to build the
plant in two different stages, with each part providing 500 MW, meaning an overall planned capacity of 1,000
MW (Mohamed, 2014).
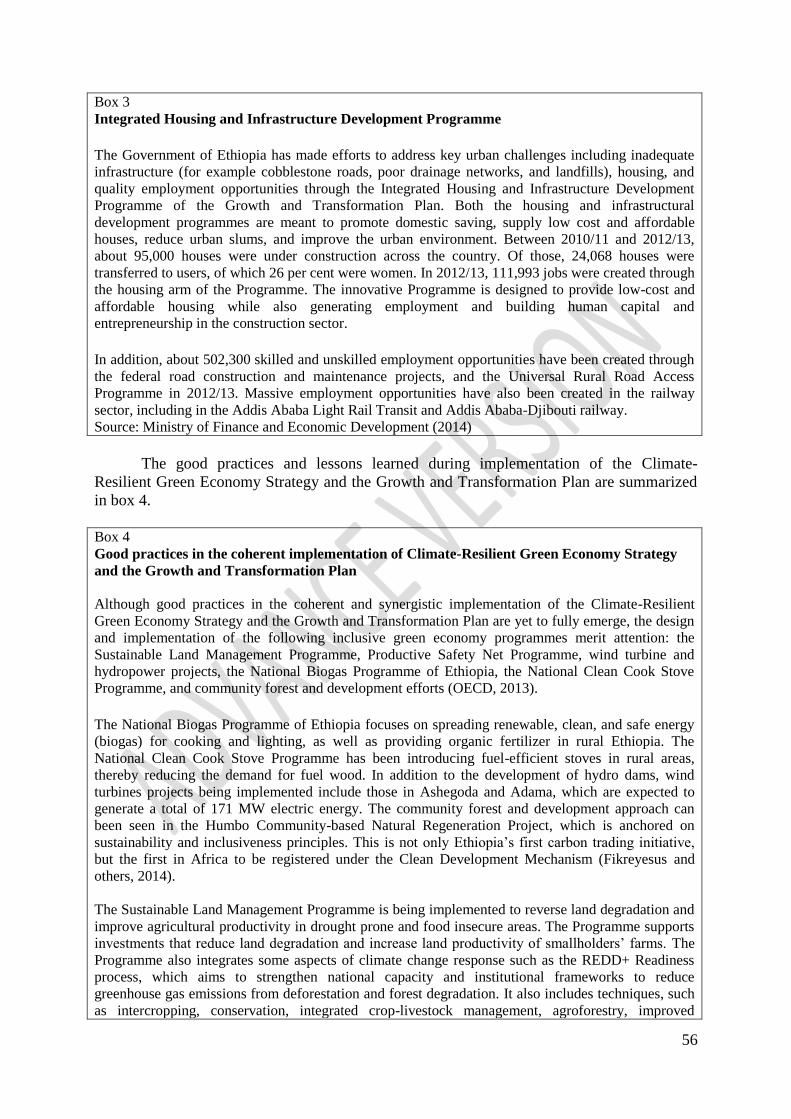
56
Box 3
Integrated Housing and Infrastructure Development Programme
The Government of Ethiopia has made efforts to address key urban challenges including inadequate
infrastructure (for example cobblestone roads, poor drainage networks, and landfills), housing, and
quality employment opportunities through the Integrated Housing and Infrastructure Development
Programme of the Growth and Transformation Plan. Both the housing and infrastructural
development programmes are meant to promote domestic saving, supply low cost and affordable
houses, reduce urban slums, and improve the urban environment. Between 2010/11 and 2012/13,
about 95,000 houses were under construction across the country. Of those, 24,068 houses were
transferred to users, of which 26 per cent were women. In 2012/13, 111,993 jobs were created through
the housing arm of the Programme. The innovative Programme is designed to provide low-cost and
affordable housing while also generating employment and building human capital and
entrepreneurship in the construction sector.
In addition, about 502,300 skilled and unskilled employment opportunities have been created through
the federal road construction and maintenance projects, and the Universal Rural Road Access
Programme in 2012/13. Massive employment opportunities have also been created in the railway
sector, including in the Addis Ababa Light Rail Transit and Addis Ababa-Djibouti railway.
Source: Ministry of Finance and Economic Development (2014)
The good practices and lessons learned during implementation of the Climate-
Resilient Green Economy Strategy and the Growth and Transformation Plan are summarized
in box 4.
Box 4
Good practices in the coherent implementation of Climate-Resilient Green Economy Strategy
and the Growth and Transformation Plan
Although good practices in the coherent and synergistic implementation of the Climate-Resilient
Green Economy Strategy and the Growth and Transformation Plan are yet to fully emerge, the design
and implementation of the following inclusive green economy programmes merit attention: the
Sustainable Land Management Programme, Productive Safety Net Programme, wind turbine and
hydropower projects, the National Biogas Programme of Ethiopia, the National Clean Cook Stove
Programme, and community forest and development efforts (OECD, 2013).
The National Biogas Programme of Ethiopia focuses on spreading renewable, clean, and safe energy
(biogas) for cooking and lighting, as well as providing organic fertilizer in rural Ethiopia. The
National Clean Cook Stove Programme has been introducing fuel-efficient stoves in rural areas,
thereby reducing the demand for fuel wood. In addition to the development of hydro dams, wind
turbines projects being implemented include those in Ashegoda and Adama, which are expected to
generate a total of 171 MW electric energy. The community forest and development approach can
been seen in the Humbo Community-based Natural Regeneration Project, which is anchored on
sustainability and inclusiveness principles. This is not only Ethiopia‟s first carbon trading initiative,
but the first in Africa to be registered under the Clean Development Mechanism (Fikreyesus and
others, 2014).
The Sustainable Land Management Programme is being implemented to reverse land degradation and
improve agricultural productivity in drought prone and food insecure areas. The Programme supports
investments that reduce land degradation and increase land productivity of smallholders‟ farms. The
Programme also integrates some aspects of climate change response such as the REDD+ Readiness
process, which aims to strengthen national capacity and institutional frameworks to reduce
greenhouse gas emissions from deforestation and forest degradation. It also includes techniques, such
as intercropping, conservation, integrated crop-livestock management, agroforestry, improved
57
grazing, and improved water management, that enhance the productivity of agricultural land and
conservation of natural resources, thereby generating „win-win‟ outcomes (Fikreyesus and others,
2014). An assessment of the first phase of the Sustainable Land Management Programme indicates
that improvements have been observed in terms of natural resources conservation and household
income. For example, the Programme has made remarkable progress in rehabilitating degraded areas
targeted for intervention by adopting physical and biological measures (Ministry of Agriculture,
2013). By the end of 2012, close to 37,000 hectares of communal lands had been put under enclosures
for natural regeneration. In addition, households have benefited from various income generating
activities including beekeeping and honey production using modern beehives and livestock fattening.
They have also benefitted from a supply of better breeds of small ruminants and poultry. Therefore,
the implementation of the Sustainable Land Management Programme demonstrates the synergies
between the Climate-Resilient Green Economy Strategy and the Growth and Transformation Plan.
Lessons learned from implementation:
Some of the useful lessons that can be drawn from the different levels of implementation of the
Strategy and the Plan include:
• Long-term national goals need to be linked to local development initiatives;
• Piloting green initiatives allows for the identification of appropriate interventions and adjustments
that may be needed before scaling up;
• Awareness creation and mass participation is a prerequisite for the success of inclusive green
economy interventions;
• Local and national green economy programmes should be linked to regional and global initiatives;
• Strong institutional arrangements are necessary to lead, coordinate and effectively implement
green economy initiatives; and
• Green economy strategies and programmes need to be effectively mainstreamed into national
development and sectoral plans.
.
5.2 Trade-offs between inclusive green economy and structural
transformation policies
While in general, the transition to a green economy reinforces structural
transformation, it also involves trade-offs, at least in the short-term. Despite commendable
efforts accorded to green economy as part of the transformation agenda, environmental and
social inclusiveness components have remained a concern. It should be noted that Ethiopia‟s
current comparative advantage lies in its favourable agroecological conditions. Given the
scarcity of land, the sustainability of an agriculture-led development strategy requires a more
intensive use of available land. In this regard, the Government of Ethiopia has increasingly
been promoting the use of chemical fertilizers. However, chemical fertilizers can be highly
detrimental to water sources and generates high levels of greenhouse gases) (Resnick and
others, 2012). Studies, for example, by Stern in 2006, indicated that chemical fertilizers can
adversely affect the environment. First, chemical fertilizers are the largest single source of
greenhouse gas emissions from the agricultural sector, and nitrous oxide possesses a global
warming potential that is 300 times greater than carbon dioxide. Second, fertilized land puts
significant pressure on scarce water resources, as it requires more water. Third, high levels of
chemical fertilizer use can increase toxins in groundwater, which is harmful for fishery stocks
and human health (Tilman and others, 2002).
The application of modern inputs in the form of fertilizers and other chemicals in
greater quantity can cause environmental hazards. Given that chemical fertilizers dramatically
increase crop yields, and that a reduction in food production is not an option, it is not possible
to abandon the use of chemical fertilizers, at least in the short-run. The Government of

58
Ethiopia is exploring other options such as greater use of organic fertilizers and conservation
farming techniques that aim to conserve soil and water use by employing mulch and
minimum tillage to minimize run-off and erosion.23
Another policy option, from a long-term
perspective, is to promote research and development of alternative and less harmful fertilizers.
The economic imperative of attaining agricultural output and productivity growth,
which enjoys paramount importance in the Growth and Transformation Plan, comes at a cost.
Area expansion and land productivity growth contribute significantly to total crop output
growth (see box 5). Nevertheless, expansion into marginal land and into the remaining forest
and woody land areas could be a threat to the environment. Moreover, the direction towards
the establishment of large-scale agricultural development zones could have undesirable
environmental impacts if proper environmental and social impact assessments are not
undertaken.
Agricultural mechanization and subsequent replacement of draught oxen with farm
machines are other aspects of agricultural transformation strategy as indicated in the Growth
and Transformation Plan. These farm machines consume fossil fuels and release emissions
into the atmosphere. The large number of smallholder farmers in Ethiopia means that the
quantity of emissions generated from the use of a large number of farm machines would be
substantial. Of course, keeping large number of oxen for draught power for the agricultural
sector will also entail emissions. It is thus necessary to weigh the relative benefits and costs of
each of these interventions.
Box 5
Crop productivity, farm input and natural resource management
Negative environmental impacts could occur during the process of agricultural output and
productivity growth, especially in settings where agricultural practices are traditional and
subsistence-oriented. These costs are reflected in terms of clearing of forests for farming,
expansion to marginal areas and intensive use of chemical fertilizers. Between 2003/4 and
2011/12, area expansion and land productivity growth contributed to 43 per cent and 56 per
cent of total crop output growth, respectively (Ministry of Finance and Economic
Development, 2014). Crop productivity increased by about 5.9 per cent between 2011/12 and
2012/13 due to an increased utilization of high yield variety inputs (for example, chemical
fertilizers and improved seeds), and area expansion. Conversion of forests, woodland and
shrub land into agricultural land is by far the largest driver of deforestation in Ethiopia,
causing the emission of an estimated 40 Mt of CO2 from deforestation in 2010 (Ministry of
Agriculture and Environmental Protection Authority, 2013). While land under small-scale
irrigation and the use of chemical fertilizer increased in 2012/13, use of organic fertilizer,
which is essential for reducing greenhouse gas emissions, declined in 2012/13. Expansion
into marginal land and to the remaining forest and woody land areas could be a threat to the
environment. There is a need for more clarity on operational/implementation frameworks for
climate proofing in sector plans and investments and the establishment of climate-resilient
institutional and regulatory frameworks.
23
The Ethiopian Agricultural Transformation Agency is developing soil mapping for different agro-ecology
areas, which will be used for developing location-specific fertilizers. Soil mapping will guide fertilizer
application based on soil fertility and suitability for major crop types.
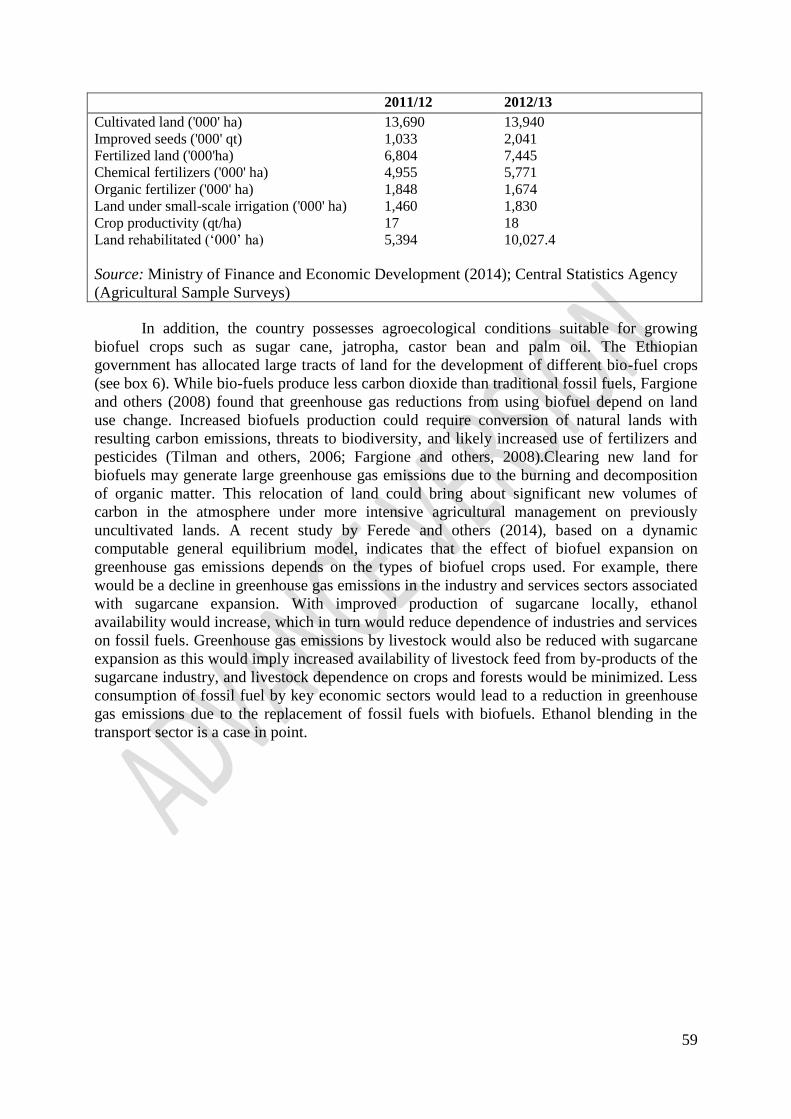
59
2011/12 2012/13
Cultivated land ('000' ha) 13,690 13,940
Improved seeds ('000' qt) 1,033 2,041
Fertilized land ('000'ha) 6,804 7,445
Chemical fertilizers ('000' ha) 4,955 5,771
Organic fertilizer ('000' ha) 1,848 1,674
Land under small-scale irrigation ('000' ha) 1,460 1,830
Crop productivity (qt/ha) 17 18
Land rehabilitated („000‟ ha) 5,394 10,027.4
Source: Ministry of Finance and Economic Development (2014); Central Statistics Agency
(Agricultural Sample Surveys)
In addition, the country possesses agroecological conditions suitable for growing
biofuel crops such as sugar cane, jatropha, castor bean and palm oil. The Ethiopian
government has allocated large tracts of land for the development of different bio-fuel crops
(see box 6). While bio-fuels produce less carbon dioxide than traditional fossil fuels, Fargione
and others (2008) found that greenhouse gas reductions from using biofuel depend on land
use change. Increased biofuels production could require conversion of natural lands with
resulting carbon emissions, threats to biodiversity, and likely increased use of fertilizers and
pesticides (Tilman and others, 2006; Fargione and others, 2008).Clearing new land for
biofuels may generate large greenhouse gas emissions due to the burning and decomposition
of organic matter. This relocation of land could bring about significant new volumes of
carbon in the atmosphere under more intensive agricultural management on previously
uncultivated lands. A recent study by Ferede and others (2014), based on a dynamic
computable general equilibrium model, indicates that the effect of biofuel expansion on
greenhouse gas emissions depends on the types of biofuel crops used. For example, there
would be a decline in greenhouse gas emissions in the industry and services sectors associated
with sugarcane expansion. With improved production of sugarcane locally, ethanol
availability would increase, which in turn would reduce dependence of industries and services
on fossil fuels. Greenhouse gas emissions by livestock would also be reduced with sugarcane
expansion as this would imply increased availability of livestock feed from by-products of the
sugarcane industry, and livestock dependence on crops and forests would be minimized. Less
consumption of fossil fuel by key economic sectors would lead to a reduction in greenhouse
gas emissions due to the replacement of fossil fuels with biofuels. Ethanol blending in the
transport sector is a case in point.
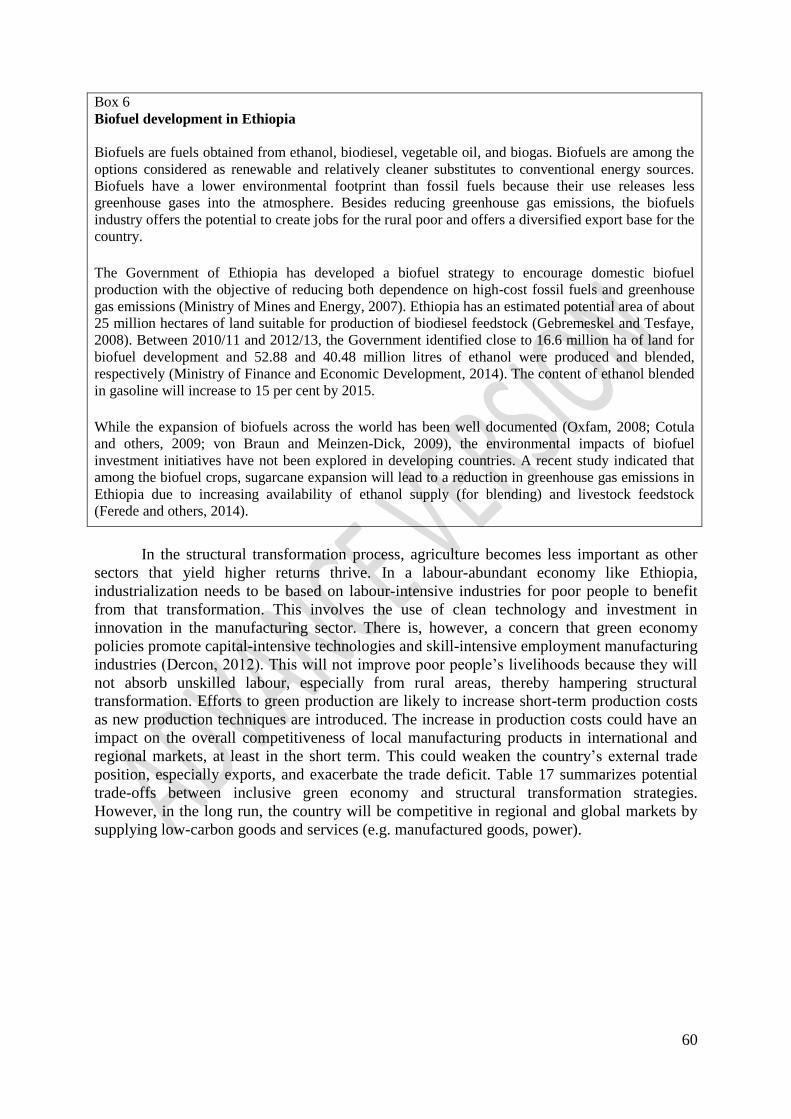
60
Box 6
Biofuel development in Ethiopia
Biofuels are fuels obtained from ethanol, biodiesel, vegetable oil, and biogas. Biofuels are among the
options considered as renewable and relatively cleaner substitutes to conventional energy sources.
Biofuels have a lower environmental footprint than fossil fuels because their use releases less
greenhouse gases into the atmosphere. Besides reducing greenhouse gas emissions, the biofuels
industry offers the potential to create jobs for the rural poor and offers a diversified export base for the
country.
The Government of Ethiopia has developed a biofuel strategy to encourage domestic biofuel
production with the objective of reducing both dependence on high-cost fossil fuels and greenhouse
gas emissions (Ministry of Mines and Energy, 2007). Ethiopia has an estimated potential area of about
25 million hectares of land suitable for production of biodiesel feedstock (Gebremeskel and Tesfaye,
2008). Between 2010/11 and 2012/13, the Government identified close to 16.6 million ha of land for
biofuel development and 52.88 and 40.48 million litres of ethanol were produced and blended,
respectively (Ministry of Finance and Economic Development, 2014). The content of ethanol blended
in gasoline will increase to 15 per cent by 2015.
While the expansion of biofuels across the world has been well documented (Oxfam, 2008; Cotula
and others, 2009; von Braun and Meinzen-Dick, 2009), the environmental impacts of biofuel
investment initiatives have not been explored in developing countries. A recent study indicated that
among the biofuel crops, sugarcane expansion will lead to a reduction in greenhouse gas emissions in
Ethiopia due to increasing availability of ethanol supply (for blending) and livestock feedstock
(Ferede and others, 2014).
In the structural transformation process, agriculture becomes less important as other
sectors that yield higher returns thrive. In a labour-abundant economy like Ethiopia,
industrialization needs to be based on labour-intensive industries for poor people to benefit
from that transformation. This involves the use of clean technology and investment in
innovation in the manufacturing sector. There is, however, a concern that green economy
policies promote capital-intensive technologies and skill-intensive employment manufacturing
industries (Dercon, 2012). This will not improve poor people‟s livelihoods because they will
not absorb unskilled labour, especially from rural areas, thereby hampering structural
transformation. Efforts to green production are likely to increase short-term production costs
as new production techniques are introduced. The increase in production costs could have an
impact on the overall competitiveness of local manufacturing products in international and
regional markets, at least in the short term. This could weaken the country‟s external trade
position, especially exports, and exacerbate the trade deficit. Table 17 summarizes potential
trade-offs between inclusive green economy and structural transformation strategies.
However, in the long run, the country will be competitive in regional and global markets by
supplying low-carbon goods and services (e.g. manufactured goods, power).
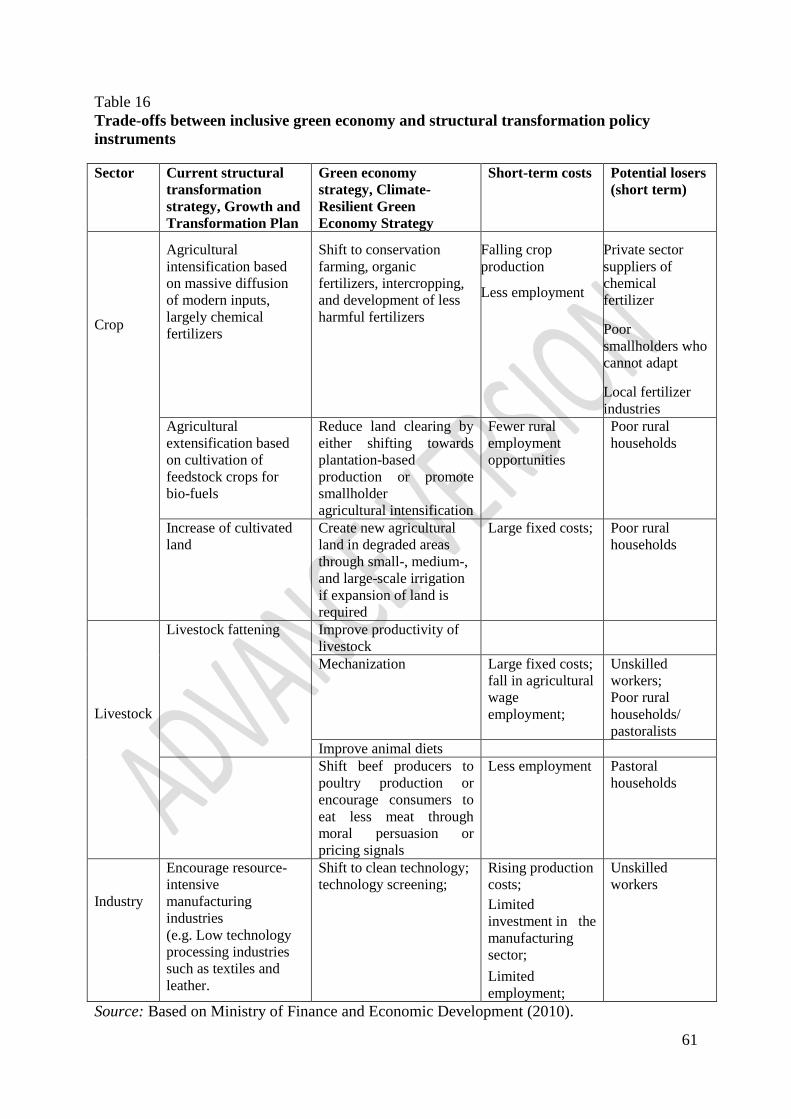
61
Table 16
Trade-offs between inclusive green economy and structural transformation policy
instruments
Sector Current structural
transformation
strategy, Growth and
Transformation Plan
Green economy
strategy, Climate-
Resilient Green
Economy Strategy
Short-term costs Potential losers
(short term)
Crop
Agricultural
intensification based
on massive diffusion
of modern inputs,
largely chemical
fertilizers
Shift to conservation
farming, organic
fertilizers, intercropping,
and development of less
harmful fertilizers
Falling crop
production
Less employment
Private sector
suppliers of
chemical
fertilizer
Poor
smallholders who
cannot adapt
Local fertilizer
industries
Agricultural
extensification based
on cultivation of
feedstock crops for
bio-fuels
Reduce land clearing by
either shifting towards
plantation-based
production or promote
smallholder
agricultural intensification
Fewer rural
employment
opportunities
Poor rural
households
Increase of cultivated
land
Create new agricultural
land in degraded areas
through small-, medium-,
and large-scale irrigation
if expansion of land is
required
Large fixed costs; Poor rural
households
Livestock
Livestock fattening Improve productivity of
livestock
Mechanization Large fixed costs;
fall in agricultural
wage
employment;
Unskilled
workers;
Poor rural
households/
pastoralists
Improve animal diets
Shift beef producers to
poultry production or
encourage consumers to
eat less meat through
moral persuasion or
pricing signals
Less employment Pastoral
households
Industry
Encourage resource-
intensive
manufacturing
industries
(e.g. Low technology
processing industries
such as textiles and
leather.
Shift to clean technology;
technology screening;
Rising production
costs;
Limited
investment in the
manufacturing
sector;
Limited
employment;
Unskilled
workers
Source: Based on Ministry of Finance and Economic Development (2010).

62
6 Analysis of other enabling measures in place and needed to facilitate
the transition to an inclusive green economy and contribute to
structural transformation.
In addition to the inclusive green economy strategy, there are other enabling measures
at national and international levels that facilitate the transition to achieve structural
transformation goals. These enabling measures reinforce processes already set in motion. The
national level enabling measures take precedence over those at the international level. This is
because the former has more influence on access to, or the readiness to use the processes,
compared with the international level enabling measures.
6.1 Enabling measures at the national level
In order to build an inclusive green economy, communities and stakeholders across the
country need to take full ownership and responsibility for the attainment of economic, social
and environmental sustainability. Pertinent to this is consensus building, cooperation and
collaboration, a favourable macroeconomic environment and other policy frameworks, and
organizational and human resource capacity. Science, technology and innovation and
financial resources are equally important. The following sections provide a brieg review of
enabling measures that have facilitated the greening of Ethiopia‟s economy.
6.1.1 High-level commitment and leadership
Discussions with stakeholders consulted during the preparation of this report indicate
that strong commitment and high-level political leadership during the development of the
Climate-Resilient Green Economy Strategy, and subsequent formulation of regulatory
frameworks were the key enablers that laid the foundation for building a green economy in
Ethiopia. Strong commitment has been demonstrated through investments in agriculture and
industrial sectors with greening at the core of activities (see chapter 2 of this report).
6.1.2 Appropriate policy and institutional frameworks and effective
implementation mechanisms at national level
6.1.2.1 A favourable macroeconomic framework
Ethiopia‟s macroeconomic framework has been crucial in advancing inclusive green
economy objectives in the country. As discussed elsewhere in this report, economic growth
has been robust in the last decade and was pegged at more than 10 per cent. Inflation has
shown a declining trend recently. Export diversification has eased the risk of reliance on few
commodities. The Government‟s fiscal and monetary policies support green activities in
agriculture, natural resources, energy, and other infrastructure. Domestic revenue has shown
an increasing trend although it has remained low as a share of GDP. These are favourable
conditions for advancing inclusive green economy policies.

63
6.1.2.2 Supportive green economy-related policy instruments
A mix of policy instruments has also been important in the greening of Ethiopia‟s
economy. These instruments include the following:
(i) Economic instruments for incentivizing green or sustainable practices;
(ii) Measures to enhance institutional capacity and regulatory capabilities;
(iii) Green, information‐based investment across key sectors,;
(iv) Voluntary measures and complementary social policies to drive inclusion;
(v) Investment in infrastructure, in particular in the energy and transport sectors; and
(vi) Regulations such as technical and performance standards, environmental
regulations, and mandatory targets.
As an example, the Government of Ethiopia provides fiscal incentives in the form of
duty free privileges for importing wood products, particularly raw wood and logs, in order to
protect the forest sector in the country.24
While firewood consumption contributes to about 46
per cent of total greenhouse gas emissions, both formal and informal wood logging
contributes to about 4 per cent. Allowing duty free importation of wood and related products
into the country could benefit wood industries that use wood and wood products as key inputs
for the manufacture of furniture. Although this would minimize deforestation due to reduced
demand pressures from wood industries, the impact of duty free incentives on household
firewood consumption is not immediately clear as the majority of firewood users are located
in rural areas, with limited access to alternative sources of energy (see Chapter 2). Similarly,
rural land registration and certification were launched in the early 2000s to increase security
of tenure among farmers. Land tenure rights, especially in rural areas are meant to provide
incentives for investment, remove uncertainty, and assure the holder that rights will not be
arbitrarily taken away.25
Studies indicate that Ethiopia‟s land certification encourages long-
term investment in land, thereby improving land productivity (Deininger and others, 2009;
Hagos and Holden, 2014).
However, policy instruments do not incorporate measures for investment in
innovation, including research and development, instead measuring progress through targets
and indicators and establishing institutional arrangements to monitor progress and coordinate
follow up actions as required.
This clearly highlights potential gaps associated with institutional capacities.
24
Unless exempted by law, items imported into Ethiopia are subject to a number of taxes. The Government
levies five types of taxes on import items: customs duty, excise tax, VAT, surtax and withholding tax. The term
customs duty denotes taxes imposed on goods entering or leaving the country. While the Ethiopian Revenue and
Customs Authority is in charge of collecting customs duty from international trade, the Ministry of Finance and
Economic Development designs and introduces taxes including foreign trade taxes. Although there are no taxes
on exports, there is a 150 per cent export tax particularly on certain hides and skins of animals to encourage
value addition. 25
The land reform proclamation of 1975 nationalized all land, abolished landlordism, and tenancy and
redistributed land to peasants in proportion to household size (Demeke and others, 2006). Since then all land is
owned by the Government and individuals are given only use rights.
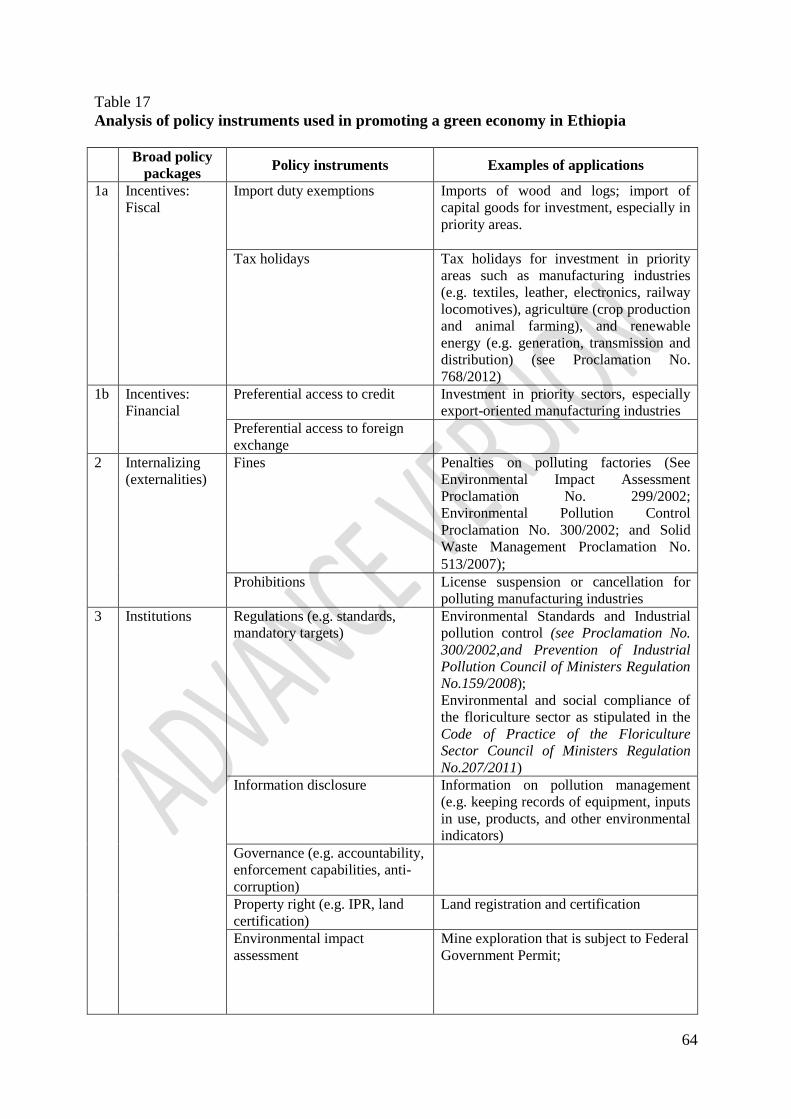
64
Table 17
Analysis of policy instruments used in promoting a green economy in Ethiopia
Broad policy
packages Policy instruments Examples of applications
1a Incentives:
Fiscal
Import duty exemptions Imports of wood and logs; import of
capital goods for investment, especially in
priority areas.
Tax holidays Tax holidays for investment in priority
areas such as manufacturing industries
(e.g. textiles, leather, electronics, railway
locomotives), agriculture (crop production
and animal farming), and renewable
energy (e.g. generation, transmission and
distribution) (see Proclamation No.
768/2012)
1b Incentives:
Financial
Preferential access to credit Investment in priority sectors, especially
export-oriented manufacturing industries
Preferential access to foreign
exchange
2 Internalizing
(externalities)
Fines Penalties on polluting factories (See
Environmental Impact Assessment
Proclamation No. 299/2002;
Environmental Pollution Control
Proclamation No. 300/2002; and Solid
Waste Management Proclamation No.
513/2007);
Prohibitions License suspension or cancellation for
polluting manufacturing industries
3 Institutions Regulations (e.g. standards,
mandatory targets)
Environmental Standards and Industrial
pollution control (see Proclamation No.
300/2002,and Prevention of Industrial
Pollution Council of Ministers Regulation
No.159/2008); Environmental and social compliance of
the floriculture sector as stipulated in the
Code of Practice of the Floriculture
Sector Council of Ministers Regulation
No.207/2011) Information disclosure Information on pollution management
(e.g. keeping records of equipment, inputs
in use, products, and other environmental
indicators)
Governance (e.g. accountability,
enforcement capabilities, anti-
corruption)
Property right (e.g. IPR, land
certification)
Land registration and certification
Environmental impact
assessment
Mine exploration that is subject to Federal
Government Permit;

65
Dam and reservoir construction (Dam
height 15 meter or more, or Reservoir
storage capacity 3 million m3
or more, or
power generation capacity 10 MW or
more);
Irrigation development (Irrigated area of
3000 ha or more);
Construction of roads (Design Standard
DS1, DS2 and DS3) with a traffic flow of
1000 or more;
Railway construction
Fishing from lakes for commercial
purposes;
Horticulture and floriculture development
for export;
Manufacturing industries (e.g. textiles,
leather, cement);
Others (see Directive No. 2/ 2008).
Disaster risk reduction,
prevention and preparedness
Agriculture and pastoral
4 Investment Investment in natural capital Soil and water conservation, investment in
protected areas, and rehabilitation
Investment in human capital Capacity-building, skill formation, and
awareness creation.
Investment in infrastructure Energy, transport, water, and waste
management
5 Social
inclusion
Insurance Health care
Direct cash transfer Productive Safety Net Programme for the
elderly and persons with disabilities
Support for price increase Subsidized distribution of commodities in
urban areas
Labour market policies: skills
(re‐)training, job search
assistance
Expansion of technical and vocational
education and training centres;
recruitment of university graduates
through small and micro enterprises;
Source: Federal Democratic Republic of Ethiopia (2011); Extracted from different
proclamations and directives.
6.1.2.3 Institutional architecture for an inclusive green
economy and structural transformation
In the aftermath of the Copenhagen Climate Change Conference, the Environmental
Protection Authority was designated to lead and oversee the development of the Climate-
Resilient Green Economy Strategy, which has shaped Ethiopia‟s approach to climate change.
In 2014, the Government moved the Environmental Protection Authority to the Ministry of
Environmental Protection and Forestry, indicating its determination to consider climate
change as one of the priority areas in dealing with the country‟s structural transformation
needs. Together with Ministry of Finance and Economic Development, which mobilizes and
coordinates local and international funds, the new Ministry has enhanced powers to play a

66
leading role in matters relating to climate-resilient green economy issues both nationally and
internationally. Such marriage of institutional arrangement is helpful in terms of
synchronizing activities across sectors and maintaining links with sources of financing for
climate-resilient green economy programmes.
Ethiopian laws on environmental impact assessments26
state that documents should be
accessible to the public and that such perpetual act of disclosure serves as instrument of
maintaining transparency and building trust and confidence, which are necessary ingredients
of consensus building
Consensus building, cooperation and collaboration are facilitated through information
sharing that engender understanding, ownership, conviction and collective action for the
common good. However, discussions with stakeholders revealed that a low level of
awareness, particularly at the grass-roots level, and an absence of regular and coordinated
follow-up action have affected the implementation of inclusive green economy programmes.
In this regard, it is important to map stakeholders and ensure their participation at every
planning phase of project implementation in order to assess and factor in issues related to
consensus building and cooperation (World Bank, 2011). Organizational capacity and human
resource development are long-term processes with long-term returns and should be
complemented with capacity retention for continuity and sustainability.
6.1.2.4 Science and technological advancement
Technological advancement and innovation are important aspects of structural
transformation and diversification as they facilitate a shift from an agriculture-based economy
towards manufacturing and modern services sectors. The manner in which the pool of
scientific and traditional knowledge and practices are employed in a given country can
constitute an inclusive green economy enabler. Knowledge of science to understand and
interpret observed changes, scientific approaches in addressing problems, and explorative,
discovery-oriented and inventive approaches are characteristics to be fostered for promoting
an inclusive green economy. Scientific knowledge and approaches provide an enabling
environment for research and development.
The Government has introduced a new rule for public university entrants to address
the skill needs of the economy: 70 per cent of all new entrants to public universities will be
allocated to engineering and natural science programmes, while 30 per cent will be placed in
social science and business programmes. The number of graduates from engineering and
science spheres has increased since the adoption of the 70:30 rule. This will go a long way in
developing technological capability in the country. However, the overall approach to science
and technology needs to be supported by availing practical technical facilities to design,
construct, and test new ideas and initiatives on the ground.
In order to support the transfer and diffusion of clean technology, Ethiopia has
established a new Climate Innovation Centre with support from the World Bank. The Centre
is expected to support pioneering clean technology enterprises that address climate change
while creating jobs and improving livelihoods, thereby contributing to the country‟s effort to
build an inclusive green economy. In this regard, the Centre provides financial support and
26
Environmental impact assessment incorporates social and economics dimensions.
67
mentoring and advisory services to the growing number of local clean-technology
entrepreneurs working in agribusiness, energy efficiency, renewable energy and biofuels.
Given that green economy sectors will require new skills, there is a need for renewed
efforts to invest and attract trained personnel in these areas. In this regard, active involvement
of academia, business partners Government and NGOs is necessary (African Development
Bank – OECD, 2013).
Wide-scale acquisition of hands-on based technical skills (skill to imitate, reverse
engineer, maintain and invent) should focus on capacity development to cope with the
technological needs of an inclusive green economy and to reduce dependence on outside
support. Technological capability development requires fast learning and the leapfrogging of
existing technology. In light of this, Ethiopia in 2010 adopted a science, technology and
innovation policy to support technology adoption (e.g. leveraging technology transfer through
public procurement, foreign direct investment inflows, and intellectual property protection).
Implementation of the policy framework is overseen by the Science, Technology and
Innovation Council, which is headed by the Prime Minister. The Council evaluates annual
progress in the area of technology and innovation and provides awards and recognition
certificates. The science, technology and innovation policy considers universities, government
research institutes, and industries as major actors in the national innovation system. Mapping
of green technologies at the national level is required to support the development and
diffusion of existing green technologies.
6.1.2.5 Access to financial support
Credit infrastructure for the creation of broad-based credit facilities, and easing credit
access for those who genuinely require credit is of paramount importance in supporting green
initiatives. In this regard, budget allocation and policy design have been closely linked in
order to provide the necessary resources, incentives, and enabling conditions to achieve the
targets set out in the Climate-Resilient Green Economy Strategy. Additionally, Ethiopia has
designed an innovative national funding mechanism, the Climate-Resilient Green Economy
Facility, within the Ministry of Finance and Economic Development, to support the
implementation of green initiatives in the country. The Facility is intended not only to make
the administration of climate-resilient green economy-related funds easier, but also to help
coordinate donor funds, international climate funds within the framework of the United
Nations Framework Convention on Climate Change, local and international bonds for
renewable energy (dams), and other domestic funds (Eshetu and others, 2014). Given that
many sectors are involved in green activities, inter-ministerial collaboration between Ministry
of Finance and Economic Development and the Ministry of Environmental Protection and
Forestry in managing the Facility is an important institutional arrangement that helps maintain
close links between the implementation and financing of green programmes. The housing of
the Facility within the Ministry of Finance and Economic Development also creates an
opportunity to integrate both the green programmes and climate-resilient green economy-
related finance into the national development plan of the country. Discussions between
relevant actors and the Facility also indicate that the second generation Growth and
Transformation Plan envisages full integration of both climate-resilient green economy
activities and finance, and this will help monitor and evaluate performance across sectors.
Ethiopia has gathered invaluable experience in microfinance services. This needs to be
further developed to enhance financial inclusion and meet the financing requirements for

68
building an inclusive green economy. However, the issue of financial inclusion and
mechanisms of addressing it have not been covered in the Climate-Resilient Green Economy
Strategy.27
Given that technology and innovation are key instruments in triggering green
transformation, a special financing mechanism is required to support technology development
and innovation.
With regard to access to international financing opportunities, Ethiopia has started
interacting with the World Bank, United Kingdom Department for International
Development, Climate and Development Knowledge Network and with UNDP at high levels
of the Government to identify the country‟s needs, priorities and progress made on climate
financing. While this is quite encouraging, it is important to carry out similar consultations
with lower government structures, and at the grass-roots level to enable them to understand
the costs and benefits of their actions or inaction, and available opportunities. This will create
awareness of inclusive green economy issues, engender buy-in and meaningful involvement
and ensure the effective implementation of inclusive green economy policies.
6.2 Institutional and strategic frameworks for sustainable
transformation and development at the regional and subregional
levels
Outcomes and decisions reached at the regional level in preparation for, and as follow
up to Rio+20 provide an enabling environment to promote the adoption and implementation
of inclusive green economy policies in Africa.
During the Africa Regional Implementation Meeting for the Post-Rio+20 follow-up
processes held in 2012, African countries committed to putting in place an enabling
environment that would strengthen partnerships with civil society, the private sector and other
stakeholders, and enable business and industry to ensure that green growth contributes to the
overarching goal of poverty eradication. They also called upon the international community
“to mobilize additional financial resources to support African countries that so decide to
develop and implement inclusive green economy strategies and plans.” In addition, African
countries called on ECA, the African Union Commission, the African Development Bank,
UNEP, UNDP and other regional partners to support Africa‟s sustainable development
efforts, including through supporting the development of inclusive green economy policies
and strategies in the context of sustainable development and poverty eradication.
The African Union Assembly, at its Nineteenth Ordinary Session, adopted a decision
on Rio+20, which calls for the development of a roadmap for the effective implementation of
the outcomes in the region. In response to this decision, the Fourteenth Regular Session of
African Ministerial Conference on the Environment adopted a decision to develop and
implement Regional Flagship Programmes. The Fifth Special Session of the African
Ministerial Conference on the Environment launched the African Green Economy
Partnership, as part of the five Regional Flagship Programmes to be developed for the
implementation of Rio+20 outcomes in the Region, and with the purpose of providing a more
coordinated support for green economy activities in the region.
27
Although the Climate-Resilient Green Economy Facility under the Ministry of Finance and Economic
Development provides financial support for green projects, especially those projects from line ministries,
inadequate funding has remained a problem in financing green projects (Eshete and others, 2014).
69
Moreover, Africa countries have also adopted Agenda 2063, which provides a
strategic framework for the pursuit of structural transformation that promotes inclusiveness
and the sustainable management of natural resources. The main elements of Agenda 2063 are:
(i) Promoting science, technology and innovation in the areas of education, health,
biosciences, agriculture, and clean energy;
(ii) Investing in human capital;
(iii) Managing natural resource endowment;
(iv) Pursuing climate-conscious development requires pursuing a green path to
industrialization based on low energy intensity, low carbon, and clean
technology;
(v) Good governance that ensures participatory and accountable governance
institutions; and
(vi) Harnessing regional integration to enhance development cooperation, and to
ensure peace and security.
Agenda 2063 is based on existing strategic frameworks, including the Abuja Treaty,
the Plan of Action for Accelerated Industrial Development in Africa (AIDA), and Africa‟s
(Accelerated) Agribusiness and Agro-Industries Development Initiative (3ADI). It provides
favourable conditions for advancing inclusive green economy and structural transformation in
the region.
6.3 Enabling measures at the international level
Existence of regional and subregional institutional and strategic frameworks for
sustainable development, regional sustainable development indicator frameworks, regional
and subregional review mechanisms on progress towards sustainable development,
international conventions and protocols on global issues and awareness of global conventions
and opportunities, as well as access to global funds and technology will facilitate the
transition to an inclusive green economy that fosters structural transformation.
6.3.1 Existence and adoption of international agreements and
conventions at the global level
Among the international enabling measures are the conventions and protocols that
embody the aspirations of the global village. They serve as guides and in some cases
mandatory requirements for actions affecting current and future well-being. Ethiopia has
signed a number of international conventions and protocols on environment, social and
economic development matters. Being a party to a convention requires States to meet their
obligations and, as necessary and applicable, support other parties through international
cooperation to do the same. Ethiopia, like most developing countries, requires capacity
strengthening in all areas to effectively implement its obligations under various Conventions.
The list of existing conventions and protocols, which Ethiopia has signed, can inform the
selection of instruments that are relevant to building a green economy in Ethiopia (see
annexes 2-4).

70
The United Nations Conference on Sustainable Development, referred to as Rio+20,
which was held in 2012, undertook to secure renewed political commitment to sustainable
development, assess the progress and implementation gaps, and address new and emerging
challenges. The conference agreed:
(i) That a green economy in the context of sustainable development and poverty
eradication is one of the important tools available for achieving sustainable
development, and that there is a need for specific actions to support countries in
developing and implementing green economy policies;
(ii) To develop sustainable development goals to be integrated into the post-2015
development agenda;
(iii) To establish an intergovernmental process under the auspices of the United
Nations General Assembly to propose options on an effective sustainable
development financing strategy;
(iv) To establish a facilitation mechanism that promotes the development, transfer
and dissemination of clean and environmentally sound technologies;
(v) To launch a programme of work on broader measures of progress to complement
the GDP measure;
(vi) To adopt the global 10-year framework of programmes on sustainable
consumption and production; and
(vii) To make voluntary commitments to implement concrete policies, plans,
programmes, projects and actions to promote sustainable development and
eradicate poverty.
The implementation of these measures will go a long way in facilitating the building
of green economies and achieving sustainable development.
6.3.2 Communication and awareness of the public on processes,
conventions and opportunities related to an inclusive green
economy at the international level
Citizens‟ access to information on inclusive green economy processes and
opportunities at the international level will inspire them and enable them to be part of, and
benefit from such processes and opportunities. An environmental education programme for
the public is necessary to enhance citizens‟ awareness on the environmental and climate
issues, and the associated global conventions and provisions. Access to environmental
information as a right of citizens and transparent and timely disclosure by public authorities
enhances participation in the environmental protection effort. With environmental information
at hand and with the inalienable right to participate, citizens can make informed decisions on
environmentally sensitive issues and they can legally and administratively react to violations
(GGBPI, 2014). The same works for social conventions. This is an important enabling
measure for long-term effects on the green and inclusiveness aspects of inclusive green
economy policies and strategies. Consultations with selected public and private stakeholders
suggest that there is lot to be done in this respect to enhance the awareness of global processes
and local responsibilities.
71
7 Existing analytical tools for integrated assessment of inclusive green
economy policies and strategies
Development activities could generate unintended repercussions for the economy,
society and environment, which were not the target of policies, plans, or programmes. Private
or public undertakings in economic and social sectors have to be vetted for their desirable and
undesirable impacts. This is necessary for the development and implementation of
mechanisms that offset undesirable and unintended impacts. This requires analytical
frameworks, including tools and methodologies that allow for integrated assessments of the
economic, social and environmental aspects inclusive green economy. Table 18 provides a
summary of selected integrated assessment tools and their applications in Ethiopia.
7.1 Analytical tools applied in Ethiopia
7.1.1 Analytical tools for environment and social assessment
The two most used environmental and social assessment tools to guide national
decision-making in Ethiopia are the environmental impact assessment and the integrated
environmental and social assessment tools.
7.1.1.1 Environmental Impact Assessment
This obtained a legal foundation with the Environmental Impact Assessment
Proclamation No. 299/2002. The proclamation stipulates that without authorization from the
Environmental Protection Authority or from the relevant regional environmental agency, no
person may commence implementation of any project that requires environmental impact
assessment. The environmental impact assessment process allows project developers to have
sufficient information regarding environmental impact so that they can make sound
development choices. However, the Environmental Protection Authority (now a Ministry) no
longer retains power to exercise this mandate at the inception of investment projects.
Investment Proclamation No. 280/2002 and, after its repeal, Investment Proclamation
No. 769/2012, do not require environmental impact assessment reports or environmental
clearance certificates to review applications for investment permits or for renewals.
Investment Proclamation No.769/2012 alludes to environmental impact assessments as the
obligation of investors to observe the environmental protection laws of the country in which
they plan to carry out investment activities. As in the previous proclamation, it does not make
environmental impact assessments a requirement for an investment permit. Discussions with
stakeholders showed that investors who need loans from banks, such as the Development
Bank of Ethiopia, are required to present an environmental impact assessment study.
However, the Development Bank of Ethiopia does not require a social impact assessment
study when assessing projects for consideration of loans.
Furthermore, since May 2010, conducting environmental impact assessments has been
delegated to six government Ministries (Addis Fortune, 2010). This seems to have continued
even after the Environmental Protection Authority was upgraded to the Ministry of
Environmental Protection and Forestry with higher capacity and responsibility.28
The
28
The Ministry of Agriculture requires environmental impact assessment reports after implementation of
projects has been started. This is a kind of ex post environmental impact assessment of agriculture-related
projects.
72
delegation of authority to bodies that have interests in realizing their own projects and who
may succumb to self-excuse creates a legitimate concern about the reliability of an
environmental impact assessment performed by such bodies. However, many public
institutions lack the required resources, including human and other resources and skills to
evaluate and assess the environmental and social impacts of investment projects or
programmes. Thus, the environmental impact assessment process in Ethiopia is constrained
by weak enforcement capacity emanating from lack of trained human resources and an
absence of scientifically founded standards to measure compliance. Stakeholders consulted
during the preparation of this report indicated the absence of procedures to address non-
compliance, appeals and grievances are among the weaknesses. For these and many other
reasons, effective implementation of environmental impact assessment has remained limited.
The weaknesses are reported in various contexts, including the assessment of floriculture
industry (Getu, 2013).29
7.1.1.2 Integrated Environmental and Social Assessment
This is often applied to both private and government projects. The Ministry of Finance
and Economic Development has guidelines to appraise development projects; the criteria to
evaluate projects include:
Policy alignment: whether or not the proposed project is in line with the
Government‟s priority activities; reference has often been made to the
Government‟s development strategies;
Economic viability: this indicator provides information about the proposed
project in terms of its contribution to the economy; whether or not it is
economically feasible to implement the project (e.g. economic rate of return;
cost-benefit analysis); and
Environmental and social impacts: whether or not the intended project has
adverse environmental and social consequences, and whether mechanisms are
put in place to address both environmental and social issues.
Apart from the abovementioned tools, it appears that the application of analytical
tools, such as the Strategic Environmental Assessment and the Poverty and Social Impact
Assessment, has remained limited. These analytical tools are mainly used by international
organizations such as the World Bank and African Development Bank for assessing
environmental and social impacts of inclusive green economy policies and strategies.
7.1.1.3 Strategic Environmental Assessment
This can be considered as a second generation environmental impact assessment and is
one of the main tools available to achieve environmental sustainability by integrating the
principles of sustainable development into country policies and programmes (OECD, 2006;
DEAT and Council for Scientific and Industrial Research, 2000). It is a proactive instrument
for addressing environmental consequences before practical action is taken. The World Bank
29
Malefia (2009) indicates that the Ethiopian floriculture sector features some aspects that do not go follow an
inclusive green economy development path, such as unregulated and high consumption of pesticide, fungicides,
insecticides, and of chemical fertilizers as well as unsafe waste disposal and unsafe working conditions.
73
often uses this method in its lending operations to member countries. By so doing, it aims to
include economic, environmental, and social objectives in policies, plans and programmes,
and includes the identification of macro-level development outcomes (Fischer, 2002). It
considers a broad range of alternative scenarios, and focuses on policy, plan and programme
implications for future lower-level decisions. According to UNEP (2002), a strategic
environmental assessment involves a systematic analysis of the environmental effects of
development policies, plans, programmes and other proposed strategic actions. Unlike the
environmental impact assessment, it extends the aims and principles of that tool beyond the
project level and creates a framework against which impacts and benefits can be measured.
7.1.1.4 Poverty and Social Impact Assessment
This helps to analyze the link between policy reforms and their distributional impacts.
It helps to identify alternative reforms to address the issues of concern, considers trade-offs
among reforms on the basis of their distributional impacts, enhances the positive impacts of
reforms and minimizes their adverse impacts, and helps to design mitigating measures and
risk management systems (OECD, 2006). It also assesses policy reforms and implementation
risks. In particular, it examines the distributional impact of policy reforms on the well-being
or welfare of different stakeholder groups, and has an important role in the elaboration and
implementation of poverty reduction strategies in developing countries. It has evolved out of
awareness of the need to have better understanding of the implications of the policies
recommended by and the conditions required by the International Monetary Fund and World
Bank in their lending programmes (see www.worldbank.org/psia). The tool focuses on
economic, social, political and institutional analysis, thereby providing useful information for
inclusive policymaking.
7.1.2 Integrated development planning and policy analysis models
An integrated assessment involves consideration of the full range of impacts, both
direct and indirect, that policy reforms may have on the environment, the economy and
society. Integrated development planning and policy analysis models serve this purpose. A
mix of models can be applied, depending on the type of policy being analysed and the impacts
being measured (Abaza, 2003).Model choice depends on, among others, technical capacity,
availability of model types, adaptability to country circumstances, and data availability
(GGBP, 2013). In settings with limited capacity and inadequate data, simple tools can be
employed.
Available and commonly used modelling tools in Ethiopia include simple projections
based on emission factors; sector-specific models and macroeconomic models based on key
macroeconomic variables, such as GDP; and population projections. In light of this, a cost-
benefit analysis of different green policy options and a simple Excel-based analysis have been
employed in Ethiopia to assess sector specific benefits. However, application of other
modelling tools, such as system-wide and general equilibrium models has not been commonly
used in key public institutions due to lack of capacity and skills. The application of these
modelling techniques are common in research institutes and academia, where there is better
capacity in terms of executing these models for different green policy interventions (Ferede
and others, 2013).
74
7.1.2.1 System-wide modelling tools
These are dynamic simulation tools used for long-term development policy analysis
and planning purposes. The Threshold 21 (T21) is an example of such a model. It was
developed by the Millennium Institute for an integrated assessment of economic, environment
and social dimensions, thereby providing foresight about potential impacts of development
programmes and policies across sectors. This model not only captures the interactions of
economic, environmental, and social attributes of sustainable development into a single
framework, but also generates scenarios for long-term analysis. Another feature of the model
is that it integrates the analysis of the risks and impacts of climate change across sectors, and
allows quantification of adaptation costs.30
7.1.2.2 Computable general equilibrium model
This is also another economy-wide model, which can be used to integrate economic,
environment and social factors in the analysis, and help to simulate both the static and
dynamic effects of inclusive green economy policies and strategies. Unlike T21, computable
general equilibrium models are based on a consistent benchmark database for calibration. This
model requires a social accounting matrix or an extended social accounting matrix that
includes environmental indicators, and presents socioeconomic and environmental
information in a consistent and coherent way for a given period. Construction of an extended
social accounting matrix requires detailed socioeconomic and environmental data, which is
lacking in many developing countries, including Ethiopia.
7.1.2.3 Sector or partial equilibrium models
These models can also be used to quantify the effects of inclusive green economy
policy changes on a sector or ecosystem, while ignoring the effects on other sectors, on the
assumption that the sector being examined is too small to have any significant impact on the
rest of the economy. Since these models focus on individual markets or sectors, this makes
their predictions easy to verify. In addition, data constraints are also less significant at this
level of analysis. However, given that everything depends on everything else, the results of a
partial equilibrium analysis may be of limited use. For instance, sector-based or partial
equilibrium models do not take into account the full range of policy effects, resulting in over-
or under-estimation of policy changes.
7.1.3 Methodologies for governance analysis
Although there are different tools for governance analysis, such as the System of
Environmental and Economic Accounting , life cycle analysis, and sustainable development
indicators, these are rarely used in key public institutions in Ethiopia as part of assessing
30
Some African countries (e.g. Ghana, Kenya, Malawi, and Mozambique) have already developed the T21
model to guide their long-term visions and medium-term development plans. In 2014, the Ministry of Finance
and Economic Development of Ethiopia, in collaboration with the Millennium Institute, provided sensitization
workshop and training on the T21 model. Subsequently, a group of experts drawn from Ministry of Finance and
Economic Development and the National Planning Commission attended a month-long training on T21 model in
Norway in 2014. As of writing this report, the development of the T21 model is in progress, with experts from
the National Planning Commission are actively involved in the development of the model. However, it is not
clear whether or not the National Planning Commission is using this model in designing the second-generation
Growth and Transformation Plan, in assessing policies and strategies.
75
economic, environmental and social aspects of inclusive green economy policies and
strategies. Nevertheless, the development of key sustainable development indicators and
application of the system of environmental and economic accounting are of paramount
importance for tracking progress towards an inclusive green economy.
7.1.3.1 System of Environmental-Economic Accounting
The System applies the accounting concepts, structures and rules of the System of
National Accounts and allows the organization of environmental and economic information
that covers the stocks and flows that are relevant to the analysis of environmental and
economic resources. Natural resource accounts and environmental indicators are widely
recognized as providing a framework for the information and analysis needed to support
macroeconomic policy analysis for sustainable economic development. The System is a
multipurpose conceptual framework that describes the interactions between the economy and
the environment, and the stocks and changes in stocks of environmental assets. As additional
accounts in the System of National Accounts, the System of Environmental-Economic
Accounting helps to adjust the existing System of National Accounts by including the
following accounts: physical data relating to flows of materials and energy (e.g. emissions);
environment-related transactions (e.g. expenditures made by government, businesses, and
households to protect the environment); and environmental assets expressed in both physical
and monetary terms (e.g. timber stocks and changes over a fiscal year) (United Nations and
others, 2003). Hence, the System of Environmental-Economic Accounting adjusts the System
of National Accounts by taking into account the interaction of the economy and environment.
It does so by explicitly including depletion, defensive expenditures and degradation in the
existing System of National Accounts. It enables the development of aggregates, indicators
and trends across a broad spectrum of environmental and economic issues such as the
assessment of trends in the use and availability of natural resources, the extent of emissions
and discharges into the environment resulting from economic activity, and the amount of
economic activity undertaken for environmental purposes (UNSTATS, 2012). It should be
noted that the System of Environmental-Economic Accounting is the basis for statistical
standards for collecting and integrating economic and environmental data for analysis of the
green economy and sustainability (UNEP, 2012).
7.1.3.2 Sustainable development indicators
ECA has identified a list of sustainable development themes and indicators (ECA,
2015b). The framework contains fourteen priority themes, namely governance, poverty,
demographic change, state of the economy, sustainable consumption and production, social
equity and opportunities, education, health, agriculture and food security and nutrition, the
natural resources base, energy, climate change and natural disasters, and financing sustainable
development. Corresponding to the priority themes, ECA has also identified 43 core
indicators and 23 other indicators. These indicators help to track the progress towards an
inclusive green economy. The large number of indicators suggests that the data requirements
are huge, and some indicators may demand new surveys. However, the sustainable
development indicator set has been reviewed regularly since its adoption in 2011. Since the
indicator set embodies the three dimensions of sustainable development, and governance
aspects, it could form the basis for developing an inclusive green economy indicator set for
Africa.
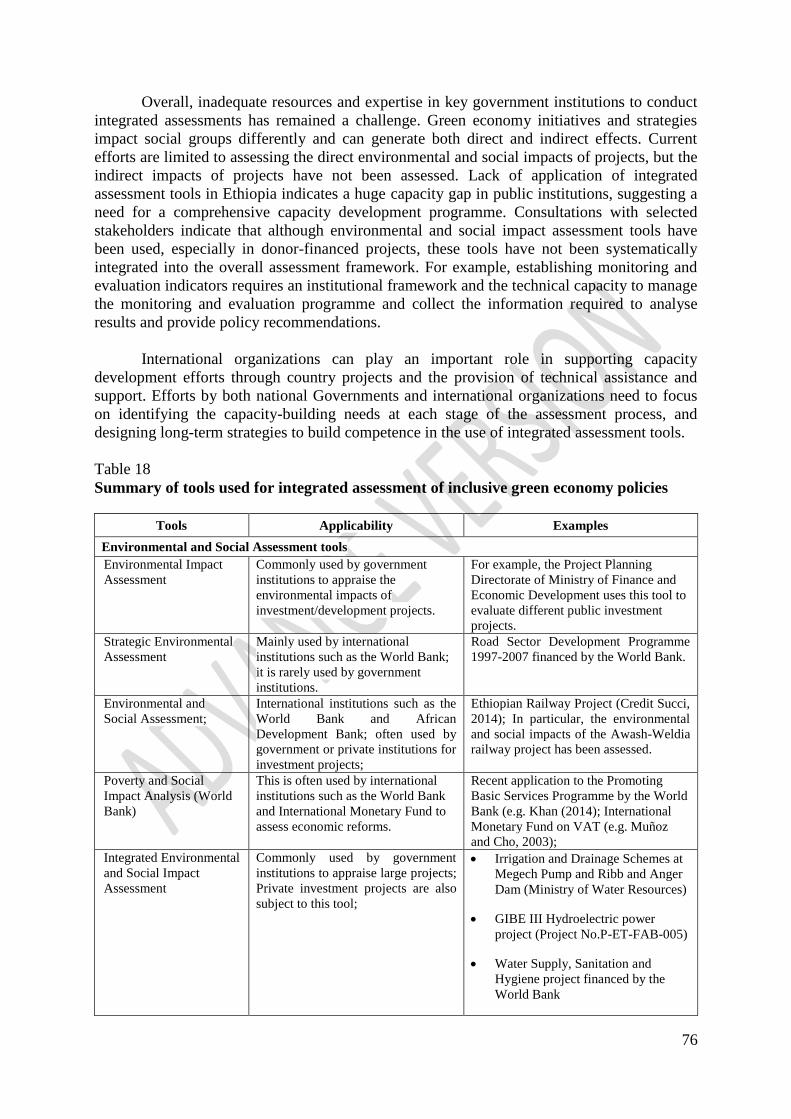
76
Overall, inadequate resources and expertise in key government institutions to conduct
integrated assessments has remained a challenge. Green economy initiatives and strategies
impact social groups differently and can generate both direct and indirect effects. Current
efforts are limited to assessing the direct environmental and social impacts of projects, but the
indirect impacts of projects have not been assessed. Lack of application of integrated
assessment tools in Ethiopia indicates a huge capacity gap in public institutions, suggesting a
need for a comprehensive capacity development programme. Consultations with selected
stakeholders indicate that although environmental and social impact assessment tools have
been used, especially in donor-financed projects, these tools have not been systematically
integrated into the overall assessment framework. For example, establishing monitoring and
evaluation indicators requires an institutional framework and the technical capacity to manage
the monitoring and evaluation programme and collect the information required to analyse
results and provide policy recommendations.
International organizations can play an important role in supporting capacity
development efforts through country projects and the provision of technical assistance and
support. Efforts by both national Governments and international organizations need to focus
on identifying the capacity-building needs at each stage of the assessment process, and
designing long-term strategies to build competence in the use of integrated assessment tools.
Table 18
Summary of tools used for integrated assessment of inclusive green economy policies
Tools Applicability Examples
Environmental and Social Assessment tools
Environmental Impact
Assessment
Commonly used by government
institutions to appraise the
environmental impacts of
investment/development projects.
For example, the Project Planning
Directorate of Ministry of Finance and
Economic Development uses this tool to
evaluate different public investment
projects.
Strategic Environmental
Assessment
Mainly used by international
institutions such as the World Bank;
it is rarely used by government
institutions.
Road Sector Development Programme
1997-2007 financed by the World Bank.
Environmental and
Social Assessment;
International institutions such as the
World Bank and African
Development Bank; often used by
government or private institutions for
investment projects;
Ethiopian Railway Project (Credit Succi,
2014); In particular, the environmental
and social impacts of the Awash-Weldia
railway project has been assessed.
Poverty and Social
Impact Analysis (World
Bank)
This is often used by international
institutions such as the World Bank
and International Monetary Fund to
assess economic reforms.
Recent application to the Promoting
Basic Services Programme by the World
Bank (e.g. Khan (2014); International
Monetary Fund on VAT (e.g. Muñoz
and Cho, 2003);
Integrated Environmental
and Social Impact
Assessment
Commonly used by government
institutions to appraise large projects;
Private investment projects are also
subject to this tool;
Irrigation and Drainage Schemes at
Megech Pump and Ribb and Anger
Dam (Ministry of Water Resources)
GIBE III Hydroelectric power
project (Project No.P-ET-FAB-005)
Water Supply, Sanitation and
Hygiene project financed by the
World Bank
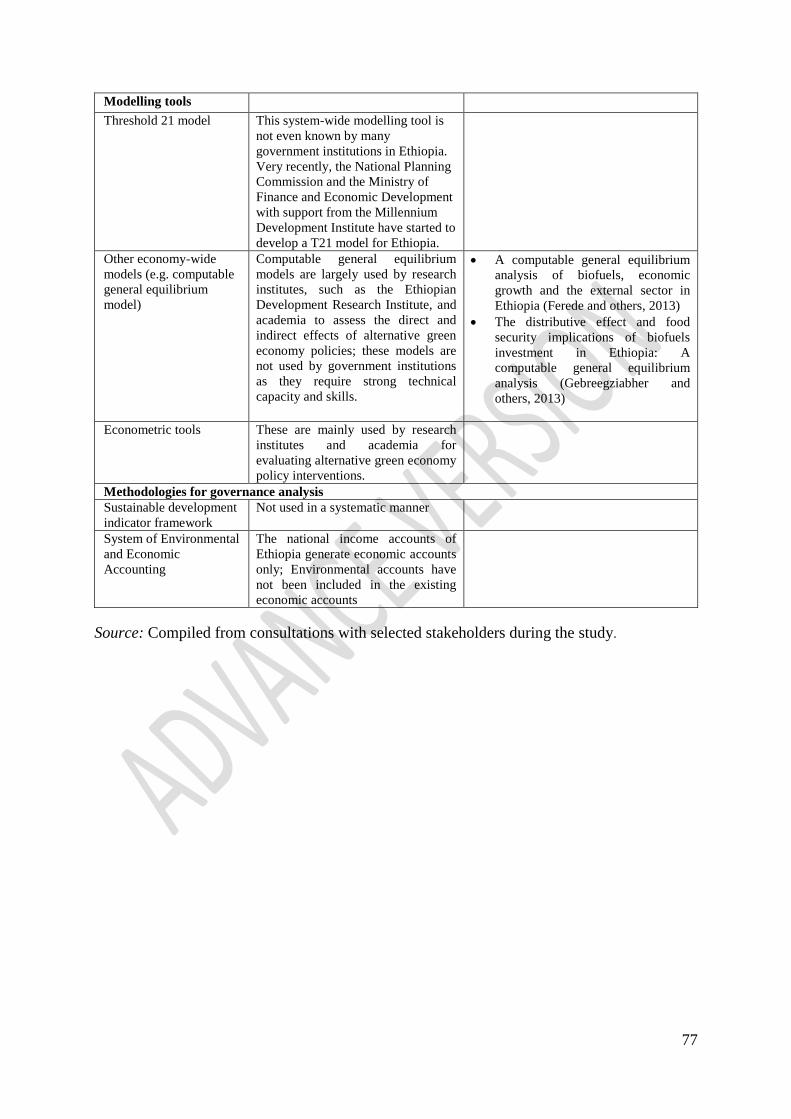
77
Modelling tools
Threshold 21 model This system-wide modelling tool is
not even known by many
government institutions in Ethiopia.
Very recently, the National Planning
Commission and the Ministry of
Finance and Economic Development
with support from the Millennium
Development Institute have started to
develop a T21 model for Ethiopia.
Other economy-wide
models (e.g. computable
general equilibrium
model)
Computable general equilibrium
models are largely used by research
institutes, such as the Ethiopian
Development Research Institute, and
academia to assess the direct and
indirect effects of alternative green
economy policies; these models are
not used by government institutions
as they require strong technical
capacity and skills.
A computable general equilibrium
analysis of biofuels, economic
growth and the external sector in
Ethiopia (Ferede and others, 2013)
The distributive effect and food
security implications of biofuels
investment in Ethiopia: A
computable general equilibrium
analysis (Gebreegziabher and
others, 2013)
Econometric tools These are mainly used by research
institutes and academia for
evaluating alternative green economy
policy interventions.
Methodologies for governance analysis
Sustainable development
indicator framework
Not used in a systematic manner
System of Environmental
and Economic
Accounting
The national income accounts of
Ethiopia generate economic accounts
only; Environmental accounts have
not been included in the existing
economic accounts
Source: Compiled from consultations with selected stakeholders during the study.

78
8 Challenges and opportunities in adopting inclusive green economy
policies to achieve structural transformation
8.1 Challenges
The main challenges confronting Ethiopia in the development and implementation of
inclusive green economy policies to reinforce structural transformation include the following:
8.1.1 Lack of coherent monitoring indicators
Indicators for both horizontal coherence and vertical consistency across sectoral
inclusive green economy and Growth and Transformation Plan policies and strategies are
important in tracking the synergies and trade-offs between an inclusive green economy and
structural transformation in the country. However, there is a mismatch between the Climate-
Resilient Green Economy Strategy and the Growth and Transformation Plan in terms of
targets. For example, the Strategy targets are expressed in terms of emission reductions, while
the targets in the Growth and Transformation Plan vary greatly. The Strategy also lacks
indicators to be used across sectors for monitoring and evaluation. Together, these pose
challenges in fostering the synergies between the Climate-Resilient Green Economy Strategy
and structural transformation, suggesting that there is a need to harmonize targets and
indicators to monitor the progress towards an inclusive green economy. This highlights an
area where a lack of institutional capacity and data are likely limiting the ability to establish
adequate measurement and feedback mechanisms.
8.1.2 Lack of timely and adequate data and information
Lack of adequate data and information for the development of indicators to monitor
inclusive green economy policies at both the national and regional levels remains a challenge.
In the absence of relevant inclusive green economy indicators and monitoring and evaluation
mechanisms, it is difficult to track progress, thus hampering subsequent plan formulation and
implementation. This can be considered as another capacity problem in data development and
management. However, the current initiatives undertaken by the Ministry of Environmental
Protection and Forestry and other Ministries in terms of developing their respective
monitoring, reporting and verification systems with support from Climate-Resilient Green
Economy Facility are expected to reduce the data and information problem both at macro and
sectoral levels.
8.1.3 Inadequate funding and investment
Ethiopia has embarked on a plan of rapid growth with structural transformation, which
requires huge resources. Ethiopia foresees an average expenditure of about US$ 7.5 billion
per year to implement its Climate-Resilient Green Economy Strategy. Recent studies have
shown that there are finance challenges in implementing the Strategy (Eshetu and others,
2014).31
The savings-investment gap has shown a large resource deficit; the difference
between domestic savings and domestic investment was about 15.3 per cent of GDP in
2012/13. As a result, the country has been heavily dependent on international assistance to
31
Between 2008/09 and 2011/12, Federal Government expenditure on climate-related activities has been low: at
approximately US$ 440 million per year, representing about 5.8 per cent of the required budget (Eshetu and
others, 2014). However, this expenditure does not include sub-national government expenditures on climate-
related activities financed from extra budgetary sources.
79
support its fiscal and external positions. Ethiopia‟s overall revenue generation performance
has remained low, though improving over time. In particular, tax revenue has remained low,
and the pace of tax revenue growth has been only moderately elastic with respect to GDP
(Derk and others, 2014). In addition, other sources of revenue have shown a declining trend as
a share of GDP. Aid flows have declined as a share of GDP and are likely to remain low due
to spending cuts by donors in the face of the severe budget deficits. Unlocking and attracting
the foreign financing required to transition to an inclusive green development pathway are
crucial.32
However, consultations with stakeholders indicate that limited access to funds, the
complexity of procedures, and delays in releasing funds have remained a challenge in
implementing inclusive green economy policies and strategies. Donor-supported expenditure
on climate change-related development activities accounted for only 20 per cent of total
climate-related expenditure in 2011/12 (Eshetu and others, 2014). At the microenterprise
level, financial inclusion has remained a concern in Ethiopia, as firms do not have access to
adequate credit to support their business, which hinders efforts aimed at fostering an inclusive
green economy and structural transformation.
Consultations with stakeholders indicate a lack of finance as one of the key constraints
for implementing green projects. Although the bank branches to population ratio has shown
improvement, it remains low: the population per commercial bank branch was 49,819 in
2012/13. Ethiopia has shown improvements in the World Bank‟s Ease of Doing Business
rank, rising from 152 in 2012 to 104 in 2013 out of 185 countries. However, both access to
and the cost of finance have remained critical problems for firms (see box 7). This is not only
limited to inadequate availability of finance, but also the provision of services to the right
activity in the right quantity and at the right time. This indicates that financial inclusion has
remained a concern in Ethiopia, as reflected by credit-starved firms.
32
Close to US$ 21 million has been allocated to fast-track investment for six priority sectors: agriculture
(e.g. climate smart agriculture and landscape restoration), water, irrigation and energy (e.g., fuel testing, solar
lighting, biogas and rainfall data), forests (e.g. bamboo production, wood fuel microenterprise, watershed
rehabilitation, urban parks, and research), industry (e.g. greening industrial zones), transport (e.g. pedestrian
infrastructure and off-street parking), and urban development (e.g. solid waste management and urban greenery)
(Climate-Resilient Green Economy Facility Briefing, 2014). Piloting of systems is underway: US$ 21 million
has been allocated for disbursement through fast track investments across the economy.
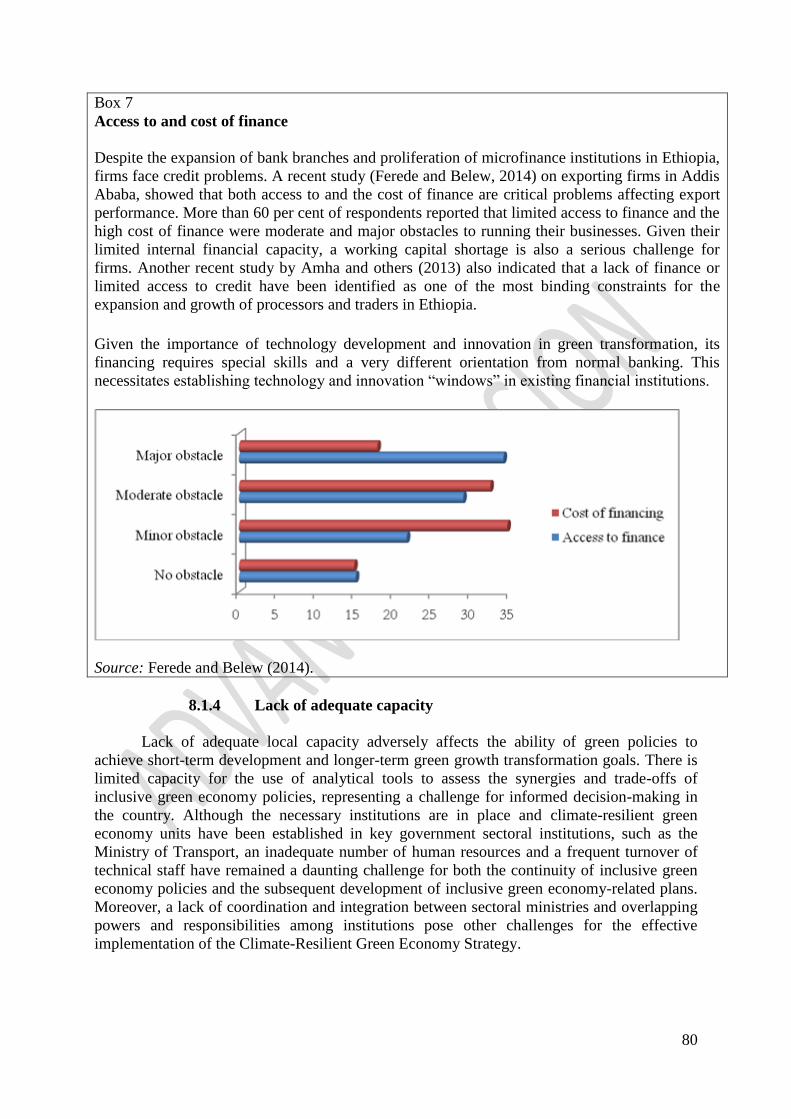
80
Box 7
Access to and cost of finance
Despite the expansion of bank branches and proliferation of microfinance institutions in Ethiopia,
firms face credit problems. A recent study (Ferede and Belew, 2014) on exporting firms in Addis
Ababa, showed that both access to and the cost of finance are critical problems affecting export
performance. More than 60 per cent of respondents reported that limited access to finance and the
high cost of finance were moderate and major obstacles to running their businesses. Given their
limited internal financial capacity, a working capital shortage is also a serious challenge for
firms. Another recent study by Amha and others (2013) also indicated that a lack of finance or
limited access to credit have been identified as one of the most binding constraints for the
expansion and growth of processors and traders in Ethiopia.
Given the importance of technology development and innovation in green transformation, its
financing requires special skills and a very different orientation from normal banking. This
necessitates establishing technology and innovation “windows” in existing financial institutions.
Source: Ferede and Belew (2014).
8.1.4 Lack of adequate capacity
Lack of adequate local capacity adversely affects the ability of green policies to
achieve short-term development and longer-term green growth transformation goals. There is
limited capacity for the use of analytical tools to assess the synergies and trade-offs of
inclusive green economy policies, representing a challenge for informed decision-making in
the country. Although the necessary institutions are in place and climate-resilient green
economy units have been established in key government sectoral institutions, such as the
Ministry of Transport, an inadequate number of human resources and a frequent turnover of
technical staff have remained a daunting challenge for both the continuity of inclusive green
economy policies and the subsequent development of inclusive green economy-related plans.
Moreover, a lack of coordination and integration between sectoral ministries and overlapping
powers and responsibilities among institutions pose other challenges for the effective
implementation of the Climate-Resilient Green Economy Strategy.
81
8.1.5 Stability and predictability of policies and regulations
The country has experienced inflationary pressures since 2005/06, which caused
appreciation of the real exchange rate and hampers competitiveness of export commodities
(BKP, 2013). In addition, real interest rates have been generally negative, creating a challenge
for domestic resource mobilization. Although inflation has fallen recently, there are signs of
resurging price escalations in some commodities, threatening the stability of the
macroeconomy.33 A coherent and consistent macroeconomic environment is key for
stimulating investment in green activities by building investors‟ confidence (The Global
Commission on the Economy and Climate, 2014). In addition, frequent changes in
government proclamations and regulations result in unproductive speculations and
unpredictable behaviour of the private sector, both of which trigger instability of the economy
(see box 8).34 According to the World Justice Project (Agrast, Botero and Ponce, 2010, 2011;
Ponce, 2014), the state of rule of law in Ethiopia requires attention to make it satisfactory and
to bring it up to a level that would create the right environment for an inclusive green
economy and for structural transformation.
Box 8
Changes in government rules and regulations
Stability and predictability of government policies and regulations can promote or retard
green transformation. In particular, frequent changes in policy and regulations discourage
businesses from undertaking profitable economic activities. Recent studies (Ferede and
Belew, 2014; Amha and others, 2012) indicated that the lack of predictability of and
frequent changes in policies and regulations are problems affecting businesses. For
instance, close to 60 per cent of respondents reported that government regulations are
unpredictable. Without predictable government policies and regulations, it is very difficult
for firms to undertake investment activities and expand their businesses. A priority for the
Government should therefore be to reduce instability through better economic management
and governance.
Source: Ferede and Belew (2014).
8.1.6 High population growth
Population pressure, especially in rural areas is a significant challenge as it puts
pressure on natural resources. In particular, rapid growth of the labour force means that the
need to generate more green jobs will be a challenge for the country. The economically active
population increased from 32.4 million in 2005 to 44.4 million in 2013, representing an
increase of 1.5 million persons per year. This rate of growth poses a challenge in terms of
creating more productive employment opportunities in green activities.
33
For instance, following the Government‟s announcement of a general increase in the salary of civil servants in
2014, prices of goods and services have increased, questioning the stability of the macroeconomy. Although the
pay rise is lower than expected, it may trigger inflation as suppliers of goods and services tend to revise their
prices upwards in anticipation of the increase in disposable income of public workers (see
www.allafrica.com/stories/201408060369.html). Following the pay rise of civil servants, price hikes have been
observed in many commodities including edible oil, vegetables, beer, and bottled water. 34
For example, the Ministry of Mines officially banned the export of rough precious stones to encourage value
addition in late 2012. However, around mid-2013, the Ministry retracted the decision and allowed the export of
the raw precious stones (gemstones) (Ethiopian Inclusive Finance Training and Research Institute, 2014).
Similarly, the Investment Proclamation No. 769/2012, which has been in place since 2012, is being revised.
82
8.1.7 Technological inadequacy
Accessing green technology presents another challenge for framing green economy
policies as part of the overall transformation plan. There is a growing concern that green
economy policies favour capital-intensive technologies and skill-intensive employment in
selected sectors such as the manufacturing sector. This not only limits employment
generation, but also stops sectoral labour mobility and promotes social exclusion, thereby
retarding the pace of structural transformation.
8.1.8 Inadequate knowledge and awareness of the Climate-Resilient
Green Economy Strategy
Although high-level government officials are aware of inclusive green
economy/climate-resilient green economy, discussions with selected stakeholders demonstrate
a seemingly inadequate awareness of the issues among middle and lower level government
officials and at the regional government level. This is another important challenge that needs
to be tackled given the critical role of middle and lower level government and grass-roots
levels in the design and implementation, including the scaling up and out scaling of relevant
programmes and activities.
8.2 Opportunities
Despite the number of challenges faced by the country in advancing inclusive green
transformation, there are also quite a number of opportunities that can be capitalized on to
develop and implement inclusive green economy policies to foster inclusive green
transformation in Ethiopia.
8.2.1 Commitment and long-term vision
The development of the framework for a green economy in the country was overseen
and supported by top government officials, led by the Office of the Prime Minister. This has
helped to bring together not only the various government offices, but also selected non-State
actors. In addition, driven by support from high-level political leadership, the inclusive green
economy vision, goals and objectives have also been integrated into the country‟s
transformation plan and sectoral strategies, which give additional impetus to ownership,
implementation, and monitoring. This is an opportunity to push the inclusive green economy
agenda forward with a view to attaining inclusive green structural transformation.
8.2.2 Agriculture and rural development
The Government of Ethiopia is strongly committed to pro-poor development policies,
as laid out in its national development plan. In particular, agriculture is one of the main
drivers of the economy with a huge potential, but at the same time, it is the least developed
sector. This opens an opportunity to transform the old and traditional agricultural sector and
to reduce poverty through improved and environmentally friendly and inclusive technologies.
8.2.3 Early stage of industrial development
Given the low levels of industrialization and infrastructure, Ethiopia is positioning
itself to leapfrog environmentally detrimental processes and promote green investment in the
83
manufacturing industries through deployment of clean and resource efficient technologies.
This can be considered as the advantage of late industrialization in the era of climate change.
The country can seize this opportunity by quickly designing the necessary incentives to
encourage green industrialization.
8.2.4 Huge renewable energy potential
Ethiopia has a huge potential for renewable energy, especially hydropower, which has
an exploitable potential of about 45,000 MW. Currently, massive investment endeavour is
taking place in the development of hydropower and other renewable energy sources. The
majority of Ethiopian households, especially in rural areas do not have access to modern
energy, indicating an opportunity to expand renewable and affordable energy sources in rural
areas. Studies indicate that the lowest income quintiles spend the most on energy in Africa,
highlighting the opportunity to attract profitable ventures in the sector (Bacon and others,
2010). In addition, the improved availability of power and the lower cost of energy compared
with other countries makes the country an attractive place for investment.35
8.2.5 Low urbanization
Currently, only 18 per cent of the population of Ethiopia lives in cities and towns.
However, with transformation, more people will move to cities and towns. This provides an
opportunity for Ethiopia to craft a roadmap to invest in green urbanization, including energy-
efficient buildings, mass transport, and green parks.
8.2.6 Trainable workforce, training opportunities and low labour cost
The rapidly growing young population can also be an opportunity for the country to
attract and encourage labour-intensive green activities, especially in the manufacturing sector.
The quality of human development is improving in Ethiopia owing to improved access to
education and to health services. Ethiopia is experiencing rising skill intensity, especially in
the skilled and semi-skilled labour force, due to expanding technical and vocational education
and training and tertiary education across the country. There are ongoing long-term
collaborative training programmes and other initiatives between some government institutions
and local universities, which need to be strengthened and expanded. Examples include the
graduate training programme in railway engineering at the Addis Ababa Science and
Technology University, and other similar initiatives in sectors such as the leather industry.
Wages are also relatively lower compared to other neighbouring countries such as
Kenya and Uganda; wages in Ethiopia are about 60 per cent lower than the regional average
(Maasho, 2014). Given that wages are increasing in Asia and the so-called BRICS countries
(Brazil, Russia, India, China and South Africa) owing to robust economic growth, this opens
an opportunity for foreign investors in selected labour-intensive and green activities. There
are ongoing examples of green activities already taking place in Ethiopia such as production
of improved cooking stoves, land and soil conservation, integrated housing and urban
development, afforestation, and land and environmental management practices.
35
Ethiopia supplies renewable energy at US$0.05 per kilowatt hour, compared with $0.24 cents in neighbouring
Kenya (see http://www.africancapitalmarketsnews.com/2420).

84
8.2.7 Access to global finance and technology
Availability of assistance and access to environmental funds are opportunities for the
country in building an inclusive green economy. Development assistance as a catalysing
factor, or as a factor necessary for big push, or as a necessary factor for reaching the ladder of
development has been upheld (Easterly and Pfutze, 2007; Sachs, 2005). A report by the
African Development Bank and OECD (2013) identifies three ways in which countries can be
supported in transitioning towards a green economy: development assistance, technology
transfer, and research and development. If wisely and transparently used, Official
Development Assistance (ODA) can play a substantive role in supporting a transition towards
a green economy. Countries with low capacity in research and development can benefit from
ODA targeting green economy best practices (GGBPI, 2014). Adoption and development of
green technologies and the production of green technologies could be facilitated with
international assistance.
The actual flow of funds and technologies to public bodies, communities and
businesses has to be ensured for inclusive green economy policies and strategies to take root
and be sustained. By maintaining the effective flow of funds and assistance, stakeholder
confidence and actual participation can be enhanced. Ethiopia has to review its success in
ensuring access to global funds and technology to the public, community and business
stakeholders to further the implementation of inclusive green economy policies and strategies.
Following the launching of the Climate-Resilient Green Economy Strategy and the
subsequent establishment of the Climate-Resilient Green Economy Facility, reports indicate
that Ethiopia has received external assistance, such as financial and technical assistance for
promoting and implementing inclusive green economy policies and strategies.36 For instance,
Ethiopia received over US$ 3.5 billion from the ODA and other financial flows in 2011/12.
Financial support from donors for climate-related activities include US$ 393 million for
ongoing projects, US$ 19 million for pipeline (agreed but not commenced) projects and an
additional US$ 20 million pledged in forthcoming projects (Eshetu and others, 2014).37It
appears that donor support for inclusive green economy-related activities could complement
the government budget in terms of fostering the synergies between an inclusive green
economy and structural transformation.38
Funds For NGOs (2012) indicate that corporate
social responsibility could be considered as a source of funding for inclusive green economy
projects. Big businesses want to redeem their public relations profile by caring for the
environment that has been affected by the uncontrolled profit-driven actions of corporate
36
For example, the Global Green Growth Institute, based in the Ethiopian Environmental Protection Authority,
has been operating in Ethiopia and providing technical support to that body and other relevant institutions in
Ethiopia. 37
Following a series of conferences in Copenhagen in 2009, Cancun in 2010, and Durban 2011, it has been
agreed that developed countries will provide climate finance to developing countries in the amount of US$30
billion between 2010 and 2012 and US$100 billion per annum by 2020 (Ministry of Environmental Protection
and Forestry, 2014). 38
Donors channel funds through the Climate-Resilient Green Economy Facility for pilot projects: Secured Grant
un ear marked finance from the Department for International Development (US$ 25 million); Secured earmarked
finance from Austria (US$800,000); Secured finance from Norway in the form of result based payment (US$ 10
million); and others (Climate-Resilient Green Economy Facility Briefing, 2014).
85
agencies. Tax benefits are other incentives to encourage investments in social welfare and
environmental projects.39
UNDP facilitates and uses its position as a „knowledge broker‟ to promote
cooperation, enable exchange visits between China and Ethiopia, and support interventions
targeted at capacity development collaboration (UNDP, 2014). The aim of such collaboration
is to assess new technologies to enhance soil testing for dry lands management, introduce
innovative agricultural technologies, including farmland management, introduce solar and
wind energy-based solutions, test new information and communication technology tools for
disaster assessment and prediction and foster technology transfer between the two countries.
39
International corporations and their international grant support programmes, often channelled through NGOs,
include: Cisco‟s Cash Grants, Social Investments and Support for Nonprofits; IBM‟s Smarter Cities Challenge;
Intel Foundation‟s International Grants; Microsoft Grants, Donations and Training to NGOs; Nestlé‟s Creating
Shared Value to address Social and Environmental Issues; Nike, Inc.‟s Foundation focuses on improving the
lives of Adolescent Girls; Swiss Re‟s Corporate Responsibility and Resource Award; Starbucks Coffee
Company‟s Starbucks Foundation; Toyota Motor Corporation‟s Grants; and ViiV Healthcare‟s Positive Action
Grants.

86
9 Conclusion and recommendation
9.1 Conclusion
Ethiopia has experienced solid progress in key economic, social and environmental
indicators. Ethiopia‟s economic growth has been the result of an expansion of the services and
agricultural sectors. The services sector has become a key driver of growth and accounts for a
large share of GDP. Social indicators have also improved, as evidenced by achievements in
enrolment at all levels, improved gender parity in education, falling maternal and infant
mortality rate, and improving access to health services. On environmental performance,
interventions by the Government and other stakeholders have helped reverse the degraded
environment through terracing, digging and maintaining irrigation canals, tree planting,
establishing enclosures for pasture, and constructing a soil band. As a result, forest and
vegetation cover improved, the area of rehabilitated land increased, new surface water
supplies (for drinking and irrigation) were created, flood prevention measures were taken, and
groundwater supplies were recharged. In addition, slum areas were reduced and urban waste
management improved.
Despite changes in the sectoral composition of the national economy in favour of the
services sector, indicators suggest that there is a need to transform the economy to ensure that
growth is sustained and inclusive. This could be attained through economic diversification
that creates productive jobs with decent pay and working conditions, reduces poverty and
inequality, and enhances access to basic services. Accordingly, the Government of Ethiopia
has embarked on structural transformation agenda through its Growth and Transformation
Plan. The Plan places emphasis on promoting the agricultural and manufacturing sectors.
While maintaining the emphasis accorded to the agroprocessing and construction industries,
the Plan also gives priority to the chemical and metallurgical industries with the aim of
enabling the industrial sector to play a leading role in the economy. It also recognizes the
importance of environmental issues and of the conservation and management of natural
resources for sustainable structural transformation.
The Government of Ethiopia recognizes the significance of both structural
transformation and an inclusive green economy in achieving its long-term vision. In this
regard, it has also embarked on building a green economy through the adoption of the
Climate-Resilient Green Economy Strategy. This Strategy represents a critical juncture in the
country‟s development trajectory, given the emphasis placed on achieving a transformation
path that embodies the three dimensions of sustainable development: economic,
environmental and social development. The Strategy serves as a comprehensive framework to
help the country accelerate its transition, in a coordinated manner, towards a green,
competitive and inclusive economy. The Strategy development processes and subsequent
implementation have been driven by high-level government leadership, which together with
the policy design process, has been instrumental in garnering support and buy-in from various
stakeholders. The Strategy, which has already been integrated into the Growth and
Transformation Plan, seeks to limit emissions, improve resource efficiency, increase
productivity, and achieve the Millennium Development Goals, thereby lifting the country to
climate-resilient middle-income status by 2025. A key feature of Ethiopia‟s inclusive green
economy effort is combining a long-term target to reflect the general vision, with short-and
medium-term transformation targets to guide concrete actions and reforms to live up to the
visions of a green economy.
87
Alignment of the Strategy targets and indicators with those of the Growth and
Transformation Plan is important to enable the identification and assessment of synergies and
trade-offs among the economic, environmental and social dimensions. For example, despite
the fact that there are social elements in the Strategy, this has not been clearly spelled out in
terms of targets and indicators. In addition, clear monitoring and evaluation mechanisms are
lacking in the Strategy. This highlights an area where a lack of data is likely limiting the
ability to establish adequate measurement and feedback mechanisms. Without monitoring and
evaluation systems in place, it would be difficult to conduct credible analysis to build a strong
case for promoting an inclusive green economy and communicate the results to the wider
public.
Despite some progress in mainstreaming the inclusive green economy policies and
strategies of selected sectors into the Growth and Transformation Plan, integrating inclusive
green economy indicators into the existing System of National Accounts is yet to be realized.
The focus of policy design towards an inclusive green economy means that there is a need to
go beyond the conventional measurement of economic performance by expanding economic
development indicators to account for environmental goods and services and value natural
capital. Currently, the national accounts do not factor in environmental services and costs,
thus resulting in an under- or overestimation of overall economic, environmental and social
progress. This necessitates the establishment of effective mechanisms to measure inclusive
green economy policies in order to integrate them into the national accounts so as to better
inform economic and environmental management decisions.
Besides inclusive green economy strategies, policies and instruments and institutional
frameworks, there are other enabling measures both at national and international levels that
can reinforce processes already set in motion towards an inclusive green economy. These
include high-level commitment and leadership, appropriate policy frameworks and effective
implementation mechanisms at the national level, emerging institutional and strategic
frameworks for sustainable transformation and development at the regional and subregional
levels; and international agreements and conventions at the global level..
Integrated assessment tools and methodologies relevant to an inclusive green economy
in Ethiopia include environmental impact assessment and the integrated environmental and
social assessment. However, their practical application has been hampered by weak
enforcement capacity arising from inadequate human resource capacity. Similarly, the use of
quantitative modelling tools such as econometrics, and partial and general equilibrium models
are limited in key public institutions due to capacity constraints. Current efforts are limited to
direct environmental and social impacts of projects, but the indirect impacts of projects are yet
to be fully assessed.
Although inclusive green economy policies and strategies have the potential to
reinforce structural transformation, there are significant challenges confronting the country in
promoting and building an inclusive green economy. These include inadequate financing,
limited capacity, lack of coherent monitoring indicators and lack of timely and adequate data
and information. These limit the country‟s capability to harness the current economic
momentum and comparative advantage to build an inclusive green economy that supports
structural transformation. Despite the challenges in advancing an inclusive green
transformation in the country, there are quite a number of positive factors that could be
harnessed to foster this form of transformation. They include strong commitment at the
88
highest level of leadership, low level of industrialization, low urbanization, huge renewable
energy potential, low labour costs, and international cooperation and support.
9.2 Recommendations
In light of the findings of the report, the following general and specific
recommendations are made for the further development and implementation of inclusive
green economy strategies that are coherent with and reinforce structural transformation in
Ethiopia. The specific recommendations focus on policy coherence and the regulatory
environment; inclusive green economy incentive systems; metrics for measuring and
monitoring inclusive green economy progress; capacity development; financing; and
coordination, networking and information sharing.
9.2.1 General
In order to ensure that the Climate-Resilient Green Economy Strategy further
accelerates the pace, and influences the character, of structural transformation, there is a need
to conduct, a thorough integrated assessment of the range of economic, environmental and
social benefits and costs of an inclusive green economy development pathway.
From an inclusive green economy perspective, there is a need to continuously assess
and track performance towards realizing an inclusive green economy; and indicators relevant
to green industries and jobs should be reported on as part of the country‟s statistics. Efforts to
regularly monitor progress in the implementation of the Climate-Resilient Green Economy
Strategy and the Growth and Transformation Plan in a coordinated manner should be
mainstreamed into the country‟s monitoring and evaluation system to maximize their positive
synergies.
The Strategy should be revised and expanded to explicitly incorporate targets and
indicators for the social dimension. Integration of social concerns into the Strategy will ensure
its comprehensiveness. As part of the social indicators, the number of green jobs created, the
quality of the jobs and working conditions in green activities should be considered. This
requires better alignment of the social dimension of the Strategy with the country‟s structural
transformation plan to identify potential „winners‟ and possible „losers‟ as well as necessary
compensation mechanisms. Therefore, the Strategy should go beyond emissions reduction
targets to include relevant economic, social and environmental targets that can indicate
progress towards an inclusive green economy. The next generation of Strategy and Plan
should be fully harmonized in terms of targets and indicators.
9.2.2 Specific recommendations
9.2.2.1 Policy coherence and the regulatory environment
Coherent sectoral inclusive green economy-related policies and strategies need to be
developed to complement the Climate-Resilient Green Economy Strategy and engender
concerted actions towards building an inclusive green economy that supports structural
transformation in Ethiopia. In this regard, it is particularly important to develop an inclusive
green economy strategy for the industrial sector to include the strategic subsectors identified
in the Government‟s transformation plan. To this end, a detailed inclusive green economy
roadmap should be developed for each priority manufacturing sub-sector, taking into account
89
the country‟s static and dynamic comparative advantage in the international and regional
markets.
The Climate-Resilient Green Economy Strategy targets and indicators should be
aligned with those of Growth and Transformation Plan to foster linkages between them and
also identify and assess synergies and trade-offs not only among the economic, environmental
and social dimensions, but also across sectors and Strategy priorities. Thus, the Strategy
should expand its objectives and targets to cover relevant economic, social and environmental
variables, following which, these could be factored into the country‟s subsequent medium-
term plans such as the second generation Growth and Transformation Plan. Furthermore,
there is a need to ensure that policy instruments are selected based on their dynamic net
benefits to society and their capacity to trigger inclusive green structural transformation and
transparent and robust mechanisms and methodologies for monitoring and evaluating
inclusive green economy policies and interventions should be established.
The design of regulations and related interventions on an inclusive green economy
should be informed by relevant studies prior to their adoption. The implementation of such
studies should be monitored and evaluated to assess their effectiveness and make necessary
adjustments.
9.2.2.2 Inclusive green economy incentive schemes
A thorough assessment of the various inclusive green economy incentive schemes
across sectors needs to be carried out to establish whether these are compatible with
Ethiopia‟s structural transformation objectives. Such incentives should vary across sectors
and be based on the agreed terms of reference (between the incentive provider and recipient),
with associated targets and indicators that are clear and transparent. Thus, effective inclusive
green economy-related incentives are essential, and it should be ensured that public and
private actors are adequately informed.
Making structural transformation compatible with inclusive green economy objectives
requires improving resource productivity, and reducing the environmental impact and
enhancing the inclusiveness of industrialization. In this respect, the Government should
provide incentives such as subsidies for the adoption of clean or environmentally sound
technologies, promoting green foreign direct investment and providing the labour force with
the requisite skills for newly introduced technologies.
9.2.2.3 Metrics for measuring inclusive green economy
progress
Clear, simple and measurable inclusive green economy indicators across sectors
should be developed. It is also crucial to design and implement comprehensive and clear
monitoring and evaluation mechanisms for adequate measurement, reporting and feedback.
New and broad metrics that track economic, social and environmental progress and well-
being should be developed for measuring an inclusive green economy.
There is a need to go beyond the current measurement of economic performance,
which focuses on economic accounting. Integrated economic and environmental accounting
represents one of the emerging tools and approaches to generate additional relevant inclusive
green economy indicators that could be integrated into the standard national accounting
90
system in Ethiopia. In particular, integrated economic and environmental accounting
framework is used to account for both stocks and flows of natural resources relevant to
environmental and economic issues. Therefore such a framework would enhance the capacity
of policymakers and development planners to properly evaluate the synergies and trade-offs
between the various inclusive green economy and structural transformation policies and
assess progress towards an inclusive green economy.
9.2.2.4 Capacity development
A comprehensive capacity development programme should be developed and
implemented to strengthen the capability of key government, non-governmental and private
sector institutions for inclusive green economy policy design and implementation. The
capacity of government institutions to develop and use analytical tools for integrated
assessment of inclusive green economy policies and strategies should also be strengthened.
Examples of these tools and methodologies include the integrated indicator framework, the
environmental and social assessment, development planning and policy analysis models, and
governance analysis tools.
Capacity development measures such as on-the-job training and short-and long-term
training, which can be implemented in collaboration with (local) universities and research
institutes, should be promoted. In addition, continuous capacity development programmes
need to be designed to enhance awareness and knowledge of inclusive green
economy/climate-resilient green economy concepts for middle and lower level government
officials.
Extensive awareness creation activities regarding inclusive green economy/climate-
resilient green economy programmes for the general public and grass-roots level communities
should be implemented. These programmes can be integrated into the ongoing mass
mobilization and training efforts, which can be organized and delivered through Farmer
Training Centres in rural areas.
The capacity of the Central Statistical Agency should be strengthened to enable it to
design and implement a system to collect, manage and disseminate inclusive green economy-
related data and information covering a wide range of economic, environmental and social
issues taking into consideration synergies and trade-offs among the various dimensions.
9.2.2.5 Finance
Access to inclusive green economy financing should be enhanced through, among
other measures, establishing a special window for private firms engaged in green initiatives.
Loans or credit facilities need to be used not only for investments, but also for working capital
for green initiatives.
The cost of inclusive green economy financing should be reduced through the
promotion of financial inclusion mechanisms. Direct funds at reduced interest rates should be
extended to firms engaged in green programmes that use domestic resources, to encourage
inter-sectoral linkages.
This involves preferential treatment of firms that use local resources as inputs in their
manufacturing processes.
91
The development of green financing should be supported and promoted. Given the
weak domestic revenue sources, financing should have a particular strategic focus on
supporting the development of science, technology and innovation-based firms.
9.2.2.6 Coordination, networking and information sharing
Platforms and networks for the management and sharing of knowledge, including
good practices and lessons learned in inclusive green economy and structural transformation
policy formulation and implementation, should be strengthened and expanded. Such platforms
and networks could, for example entail online accessibility of relevant information on
inclusive green economy programmes, and indicators, and targets for economic agents. This
will minimize transaction costs and enhance competitiveness.
Inclusive green economy champions should be identified and supported; and their
knowledge and experience shared with other actors to attract and influence other actors and
stakeholders to enhance green investment.

92
References
Abaza, H. (2003).The Role of Integrated Assessment in Achieving Sustainable Development.
Geneva, Switzerland: Economics and Trade Branch, Division of Technology, Industry
and Economics, United Nations Environment Programme (UNEP).
Abebe, W.B and others (2007).EIA implementation and follow up: a case study of Koga
irrigation and watershed management project- Ethiopia. Thesis for Master of Science
degree at the UNESCO-IHE Institute for Water Education, Delft, the Netherlands.
Access Capital (2011) Ethiopia: Macroeconomic Hand Book 2011/12.Available rom
http://www.portaldecomert.ro/Files/01.12%20-%20Info%20A%20A%20nr%2080_
10%2001%202012%20ANEXA%20Ethiopia%20.pdf (2010). EPA Loses
Environmental Impact Assessment Authority to Ministries. Addis Fortune: Agenda,
March.
African Development Bank – Organization for Economic Cooperation and Development
(2013). Enabling Green Growth in Africa: A joint report from the workshop held in
Lusaka in Jan-15-16, 2013.
African Development Bank (2001). Environmental And Social Assessment Procedures For
African Development Bank’s Public Sector Operations.
Amha, W., Demeke, M. and Ferede, T. (2012).Improving Financial Access to Expand the
Activities and Growth of Grain Traders and Millers: Evidence from Ethiopia.
Research report for the Food and Agriculture Organization of the United Nations.
African Union Commission (2014).The Future We Want for Africa: Shared Strategic
Framework for Inclusive Growth and Sustainable Development and a Global Strategy
to Optimize the Use of Africa’s Resources for the Benefit of all Africans, DRAFT
Framework.
Ashenafi, A. (2011). Evaluation of the Implementation of Environmental Impact Assessment
in Dam Projects: The Case of Ribb and Dire Dams. A Master‟s degree thesis, Addis
Ababa University.
Bastos L.M. (2012). An Institutional Analysis of Biofuel Policies and their Social
Implications: Lessons from Brazil, India and Indonesia. Social Dimensions of Green
Economy and Sustainable Development, Occasional Paper No. 9.Geneva,
Switzerland. United Nations Research Institute for Social Development.
Broussard, N., Tekleselassie, T. and Page, J., Ferede, T. and Reda, H. (2012). Youth
Unemployment: Ethiopia Country Study Japan International Cooperation Agency
scoping study.
BKP Development, Research and Consulting (2013).East Africa’s manufacturing sector:
promoting technology, innovation, productivity and linkages: Country Report-
Ethiopia, submitted to the African Development Bank, East Africa Resource Center,
Nairobi, Kenya.
93
Cook, S., Smith, K. and Utting, P. (2012).Green Economy or Green Society? Contestation
and Policies for a Fair Transition, Occasional Paper Ten, United Nations Research
Institute for Social Development and Friedrich Ebert Stifftung, Social Dimensions of
Green Economy and Sustainable Development.
Deininger, K., Ayalew, D. and Alemu, T. (2009).Impacts of Land Certification on Tenure
Security, Investment, and Land Markets: Evidence from Ethiopia. Discussion Paper
Series 09-11, Environment for Development.
Deininger, K., and Jin, S. (2006). Tenure Security and Land-Related Investment: Evidence
from Ethiopia. European Economic Review, 50(5):1245–77.
Demeke, M., Guta, F. and Ferede, T. (2003). Growth, employment and poverty in Ethiopia:
An empirical investigation. Issues in Employment and Poverty Discussion Paper 12.
Geneva, Switzerland.: Employment Strategy Department, International Labour Office.
Demeke, M., Guta, F. and Ferede, T. (2006).Towards a more employment-intensive and pro-
poor economic growth in Ethiopia: Issues and policies, Issues in Employment and
Poverty Discussion Paper 22. Geneva, Switzerland: Employment Strategy
Department, International Labour Office.
Derk, B., Ciuriak, and Ferede, T. (2014).Financing Ethiopia‟s Development: Confronting the
Gap between Ambition and Means, a research report (unpublished).
Djankov, S., Montalvo, J. G., Reynal-Querol, M. (2005).The Curse of Aid. Available from:
http://www.econ.upf.edu/docs/papers/downloads/870.pdf
Easterly, W. and Pfutze, T. (2008). Where Does the Money Go? Best and Worst Practices in
Foreign Aid. Journal of Economic Perspectives, Volume 22 (2).
Economic and Social Commission for Asia and the Pacific (ESCAP) (2013), Shifting from
quantity to quality: Growth with equality, efficiency, sustainability and dynamism,
Greening of Economic Growth Series, ST/ESCAP/2675, (Bangkok, United Nations).
Economic Commission for Africa (2015a). Achieving sustainable Development in Africa
through Inclusive Green Growth. Agriculture, Ecosystems, Energy, Industry and
Trade. The Sustainable Development Report on Africa. Fifth Edition.
Economic Commission for Africa (2015b). Sustainable Development Indicator Framework or
Africa and Initial Compendium of Indicators
Economic Commission for Africa (2014). Side event: Greening Africa‟s economies and
Structural Transformation. Background paper for the Seventh Joint Annual Meetings
of the ECA Conference of African Ministers of Finance, Planning and Economic
Development and African Union Conference of Ministers of Economy and Finance,
Abuja, Nigeria.
Economic Commission for Africa (2012). Sustainable Development Report on Africa.
Sustainable Consumption and Production (SCP) for Sustainable Growth and Poverty
Reduction.
94
Eshetu, Z. and others (2014).Climate finance in Ethiopia.Overseas Development Institute,
London and the Climate Science Centre, Addis Ababa University, Addis Ababa.
Ethiopian Government (2000). Interim Poverty Reduction Strategic Paper. Available from:
http://www.imf.org/external/NP/prsp/2000/eth/01/INDX.HTM
Ethiopia, Central Statistical Agency (2012). Statistical Report on the 2012 Urban
Employment-Unemployment Survey. Addis Ababa.
Ethiopia, Ministry of Water and Energy (2012). Scaling-Up Renewable Energy Programme
Ethiopia Investment Plan, (Draft Final). Addis Ababa.
Ethiopia, Ministry of Agriculture and Environmental Protection Authority (2013).Terms of
Reference for Developing Capacities for a National Measuring, Monitoring,
Reporting and Verification System to 4 support REDD+ participation of Ethiopia:
Background, Capacity Assessment and Roadmap. Version 2.0. Addis Ababa.
Ethiopia, Ministry of Agriculture (2013). Sustainable Land Management Project Phase-II:
Social Impact Assessment Report. Addis Ababa.
Ethiopia, Ministry of Environmental Protection and Forestry (2014).CRGE highlights,
Volume 1, No. 7. Addis Ababa.
Ethiopia, Ministry of Finance and Economic Development (2013). Annual Progress Report
for F.Y. 2011/12: Growth and Transformation Plan. Addis Ababa.
Ethiopia, Ministry of Finance and Economic Development (2010). Growth and
Transformation Plan 2010/11-2014/15, Vol. I (main text). Addis Ababa.
Ethiopia, Ministry of Finance and Economic Development (2002).Ethiopia: Sustainable
Development and Poverty Reduction Programme. Addis Ababa.
Ethiopia, Ministry of Finance and Economic Development (2006).A Plan for Accelerated and
Sustained Development to End Poverty (2005/06-2009/10) Volume I: Main Text.
Addis Ababa
Ethiopia, Ministry of Finance and Economic Development (2014).Ethiopia: An Assessment of
Macroeconomic Developments (1992-2012). Addis Ababa.
Ethiopia, Ministry of Mines and Energy (2007). The Biofuel Development and Utilization
Strategy of Ethiopia. Addis Ababa.
Ethiopian Inclusive Finance Training and Research Institute (2014). Data Collection Survey
on export promotion in Ethiopia. A research report submitted to The Japan
International Cooperation Agency Ethiopia Office.
European Commission-International Institute for Labour Studies (EC-IILS) (2013). Policy
options and instruments for a green economy.EC-IILS Joint Discussion Paper Series
No. 12.
95
Fargione, J., and others (2008), Land clearing and the agrofuel carbon debt. Science,
319(5867): 1235–8.
Government of Ethiopia (2011), Ethiopia’s Climate‐Resilient Green Economy: Green
Economy Strategy. Available at:
http://www.undp.org/content/dam/ethiopia/docs/Ethiopia%20CRGE.pdf
Government of Ethiopia (n.d.), Ethiopia’s Climate‐Resilient Green Economy: Climate
Resilient Strategy: Agriculture and Forestry, Addis Ababa, Ethiopia.
Federal Negarit Gazeta (2002). Environmental Impact Assessment Proclamation No.
299/2002, 9thYear No. 11-3rd December 2002. Addis Ababa
Ferede, T. and F.Belew (2014). Ethiopia’s Export Status: Challenges and opportunities for
export competitiveness and diversification. A research report for the National Planning
Commission of the Federal Democratic Republic of Ethiopia, Addis Ababa.
Ferede, T., and others (2013). Biofuels, economic growth and the external sector in Ethiopia:
A computable general equilibrium analysis. EfD Discussion Paper Series. EfD DP 13-
08. Washington DC: a joint publication of the Environment for Development Initiative
and Resources for the Future.
Fischer, T. (2003).Strategic environmental assessment in post-modern times. Environmental
Impact Assessment Review, vol. 23, no. 2, pp.155-170.
Fikreyesus, D., and others (2014).Public Policy Responses for a climate resilient green
economy in Ethiopia. International Institute for Environment and Development
Research Report. International Institute for Environment and Development, London.
Available from: http://pubs.iied.org/10066IIED
Global Green Growth Initiative (2014). Green Growth Best Practice, synthesis of key
findings.
Hagos, H. and S. Holden (2014).Efficiency and productivity differential effects of land
certification programme in Ethiopia: Quasi-experimental evidence from Tigray.
Discussion Paper No. 01295. Washington, DC: International Food Policy Research
Institute
International Labour Organization (2013). Global Employment Trends 2013. Recovering from
a Second Jobs Dip. Geneva.
International Labour Organization (2011). Towards a greener economy: The social
dimensions. Geneva.
Khan, Q. (2014). Improving basic services for the bottom forty per cent: results of the poverty
and social impact assessment of decentralized basic service delivery in Ethiopia.
Washington, DC: World Bank Group. Available from:
http://documents.worldbank.org/curated/en/2014/01/19374010/improving-basic-
services-bottom-forty-percent-results-poverty-social-impact-assessment-decentralized-
basic-service-delivery-ethiopia.
96
Lane P. R., and G.M. Milesi-Ferretti (2000). “The External Wealth of Nations: Measures of
Foreign Assets and Liabilities for Industrial and Developing Countries. Journal of
International Economics, 55(2001), 263–294.
Levy, C. (2010). A 2020 Low Carbon Economy: A Knowledge Economy Programme Report.
London: The Work Foundation.
Lipman, G., T. Delacy, and P. White law (2013).Competiveness, Jobs, and Green Growth: A
“Glocal” Model. The Travel & Tourism Competitiveness Report 2013. Geneva,
Switzerland: World Economic Forum.
Mason, M. (2011). Information Disclosure and Environmental Rights: The Aarhus
Convention. Global Environmental Politics Vol 10, No. 3, Pages 10-31. Available at:
http://www.mitpressjournals.org/doi/pdf/10.1162/GLEP_a_00012
Maasho, A. (2014). Garment-making finds new low-cost home in Ethiopia. Reuters.
September, 2014.
Mahiber, M. and Sheka Forest Alliance (2008). Environmental Impact Assessment
Implementation and Challenges, Addis Ababa, Ethiopia.
Muñoz, S. and S Cho (2003), Social Impact of a Tax Reform: The Case of Ethiopia. IMF
Working Paper, Washington D.C.: Fiscal Affairs Department, International Monetary
Fund.
Musyoki, A (2012). Emerging Policy for a Green Economy and Social Development in
Limpopo. South Africa. Paper No. 8. Geneva: United Nations Research Institute for
Social Development.
Getu, M. (2013). Defiance of environmental governance: environmental impact assessment in
Ethiopian floriculture industry. E3 Journal of Environmental Research and
Management Vol. 4(4), pp. 0219-0229. Available at: http://www.e3journals.org
Organization for Economic Cooperation and Development (2013).Making Growth Green and
Inclusive, the case of Ethiopia.
Organization for Economic Cooperation and Development (2012). Applying Strategic
Environmental Assessment: Good practices guidance for Development co-operation.
DAC Guidelines and Reference Series. Paris.
Omilola, B. (2014). Inclusive Green Growth in Africa: Rationale, Challenges and
Opportunities. South Africa: United Nations Development Programme.
Poverty-Environment Partnership (2012). Building an Inclusive Green Economy for All:
Opportunities and Challenges for Overcoming Poverty and Inequality. Joint Agency
Paper. Available at: http://www.unep.org/pdf/PEP_Paper-Final_2.pdf.
97
Private Sector Development Hub (2012).Assessment of the trade practices and consumer
protection, and the commercial registration and business licensing proclamations.
Addis Ababa, Ethiopia.
Regions for Sustainable Change (2013).Indicators toolkit. Available at:
http://www.rscproject.org/indicators/index.php?page=low-carbon-economy.
Resnick, D., F. Tarp, and J. Thurlow (2012).The Political Economy of Green Growth:
Illustrations from Southern Africa. WIDER Working Paper No. 2012/11.United
Nations University-WIDER. Available at:
http://www.wider.unu.edu/publications/working-papers/2012/en_GB/wp2012-011/
Rodenhoff, V. (2002). The Aarhus Convention and its implications for the “institutions” of
the European community . Blackwell Publishers Ltd.
Spiegel Online International (2005). Interview with African Economics Expert: "For God's
Sake, Please Stop the Aid! Available at:
http://www.spiegel.de/international/spiegel/spiegel-interview-with-african-economics-
expert-for-god-s-sake-please-stop-the-aid-a-363663.html
Stern, N. (2006). Stern Review on the Economics of Climate Change. Cambridge, United
Kingdom: Cambridge University Press.
Stuart, E. (2011). Making Growth Inclusive: Some Lessons for Countries and the Literature.
Oxfam Research Report. Working Paper. Oxford: Oxfam International.
Szirmai, A., M. Gebreeyesus, F. Guadagno, B. and Verspagen (2014). Promoting Productive
Employment in Sub-Saharan Africa: A Review of the Literature. Maastricht: UNU-
MERIT
The Global Commission on the Economy and Climate (2014). The New Climate Economy:
Better growth and better climate Synthesis Report. Washington D.C.
Tilman, D., K. Cassman, P. Matson, R. Naylor, and S. Polasky. (2002). Agricultural
Sustainability and Intensive Production Practices, Nature, 418(6898): 671–77.
Tregenna, F. (2013). Deindustrialisation and Reindustrialisation. in A. Szirmai, W. Naudé and
L. Alcorta (eds.), Pathways to Industrialisation in the 21st Century, Oxford: Oxford
University Press.
United Nations Development Programme (2014). Ethiopia Sets Sight on Access to Climate
Financing. Available at:
http://www.et.undp.org/content/ethiopia/en/home/presscenter/articles/2014/02/21/ethi
opia-sets-sight-on-access-to-climate-financing/
United Nations Environment Programme (2011). Towards a Green Economy: pathways to
sustainable development and poverty eradication. Nairobi.
United Nations Environment Programme. (2012). Measuring progress towards an inclusive
green economy. Nairobi.

98
United Nations Environment Programme (2002). UNEP Environmental Impact Assessment
Training Resource Manual – Second Edition: UNEP Briefs on Economics, Trade and
Sustainable Development: Information and Policy Tools. Nairobi.
United Nations, European Commission, International Monetary Fund, Organization for
Economic Cooperation and Development and World Bank (2003), Handbook of
National Accounting: Integrated Environmental and Economic Accounting, Studies in
Methods series F, No.61, Rev.1.
United Nations Research Institute for Social Development (2012). Social Dimensions of
Green Economy, UNRISD Research and Policy Brief 12, Geneva, Switzerland.,.
USAID/Catholic Relief Service (1999). Programmatic Environmental Assessment of Small-
Scale Irrigation in Ethiopia. Catholic Relief Service.
Uzawa, H. (2003). Economic Theory and Global Warming. Cambridge, United Kingdom:
Cambridge University Press.
Winer, M., H. Murphy and H. Ludwick. (2012). PES Markets on Aboriginal Land in Cape
York Peninsula: Potential and Constraints. Social Dimensions of Green Economy and
Sustainable Development. Occasional Paper No. 6.Geneva: United Nations Research
Institute for Social Development
World Bank (2011) Ethiopia Disaster Risk Management Country Plan Project Phase I:
Environmental and Social Management Framework. Available at: http://www-
wds.worldbank.org/external/default/WDSContentServer/WDSP/IB/2011/11/29/00038
6194_20111129004522/Rendered/PDF/E28930EA0P1291024B0AFR0EA0P129151v
1.pdf
World Bank (2014). Doing Business: ease of doing business in Ethiopia. Available at:
www.doingbusiness.org/data/exploreeconomies/ethiopia
World Bank Forest Carbon Partnership Facility Readiness Fund(2011). Common Approach to
environmental and Social Safeguards for Multiple Delivery Partners. Washington D.C.
World Justice Project (2014).Rule of Law Index (2010,2011,2012,2014). Washington D.C.

99
Annexes
Annex 1
List of stakeholders consulted
Name Institution/Organization
Ato Temesgen Walleligne National Planning Commission
Mr. Berhanu Assefa Ministry of Agriculture
Dr. Yegremachew Seyoum Ministry of Environmental Protection and Forestry
W/t Selam Kidane Acting Director, Law and Standards, Ministry of
Environmental Protection and Forestry
Ms. Selamawit Desta Ministry of Environmental Protection and Forestry
Ato Mezgebu Amha Ministry of Finance and Economic Development
Mr. Zerihun Getu CRGE Facility Assistant Coordinator, Ministry of
Finance and Economic Development
Mr. Admassu Gedamu
Mr. Mulay Woldu
Director, United Nations Agencies and Regional
Economic Cooperation, Ministry of Finance and
Economic Development
Expert, Ministry of Finance and Economic
Development
Mr. Solomon Tesfaselassie Expert, National Planning Commission
Ato Desta Lambebo Ministry of Finance and Economic Development
Ato Ahmed Nuru Ministry of Industry
Mr. Mulugeta Wube Ministry of Science and Technology
Mr. Assefa Mulugeta Ministry of Trade
Mr. Yetsedaw Emagne Ministry of Trade
Mr. Mekonnen Assega Ministry of Transport
Mr. Robel Meseret Ministry of Transport
Mr. Fekadu Sahle Ministry of Urban Development and Housing
Construction
Mr. Eyob Amerga Ministry of Urban Development and Housing
Construction
Mr. Teshome Atnafie Ministry of Water, Irrigation and Energy
Mr. Messeret Mengestu Addis Ababa Environmental Protection Agency
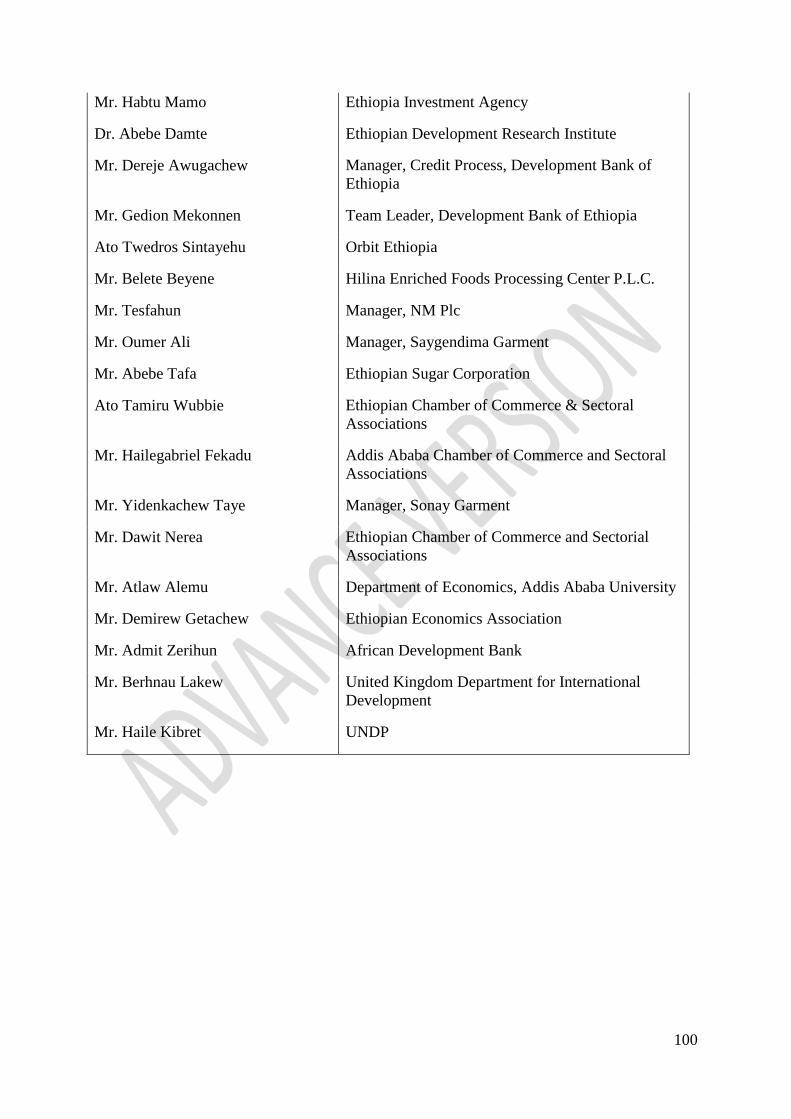
100
Mr. Habtu Mamo Ethiopia Investment Agency
Dr. Abebe Damte Ethiopian Development Research Institute
Mr. Dereje Awugachew Manager, Credit Process, Development Bank of
Ethiopia
Mr. Gedion Mekonnen Team Leader, Development Bank of Ethiopia
Ato Twedros Sintayehu Orbit Ethiopia
Mr. Belete Beyene Hilina Enriched Foods Processing Center P.L.C.
Mr. Tesfahun Manager, NM Plc
Mr. Oumer Ali Manager, Saygendima Garment
Mr. Abebe Tafa Ethiopian Sugar Corporation
Ato Tamiru Wubbie Ethiopian Chamber of Commerce & Sectoral
Associations
Mr. Hailegabriel Fekadu Addis Ababa Chamber of Commerce and Sectoral
Associations
Mr. Yidenkachew Taye Manager, Sonay Garment
Mr. Dawit Nerea Ethiopian Chamber of Commerce and Sectorial
Associations
Mr. Atlaw Alemu Department of Economics, Addis Ababa University
Mr. Demirew Getachew Ethiopian Economics Association
Mr. Admit Zerihun African Development Bank
Mr. Berhnau Lakew United Kingdom Department for International
Development
Mr. Haile Kibret UNDP
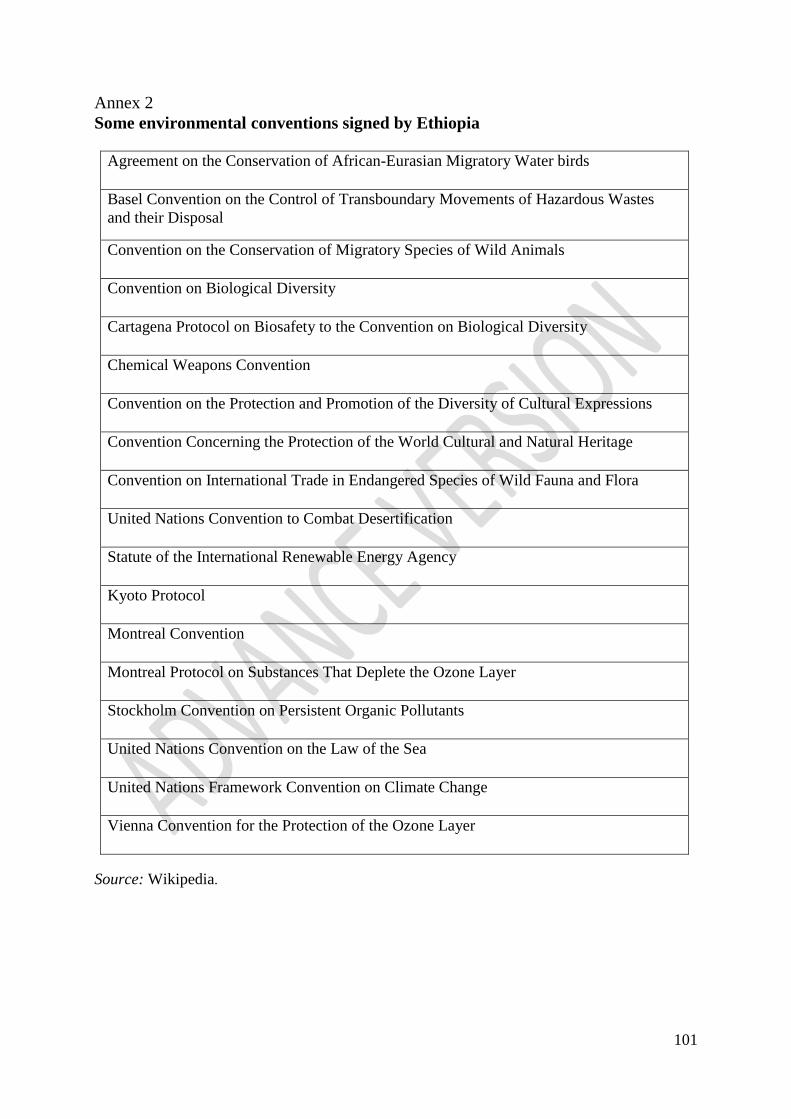
101
Annex 2
Some environmental conventions signed by Ethiopia
Agreement on the Conservation of African-Eurasian Migratory Water birds
Basel Convention on the Control of Transboundary Movements of Hazardous Wastes
and their Disposal
Convention on the Conservation of Migratory Species of Wild Animals
Convention on Biological Diversity
Cartagena Protocol on Biosafety to the Convention on Biological Diversity
Chemical Weapons Convention
Convention on the Protection and Promotion of the Diversity of Cultural Expressions
Convention Concerning the Protection of the World Cultural and Natural Heritage
Convention on International Trade in Endangered Species of Wild Fauna and Flora
United Nations Convention to Combat Desertification
Statute of the International Renewable Energy Agency
Kyoto Protocol
Montreal Convention
Montreal Protocol on Substances That Deplete the Ozone Layer
Stockholm Convention on Persistent Organic Pollutants
United Nations Convention on the Law of the Sea
United Nations Framework Convention on Climate Change
Vienna Convention for the Protection of the Ozone Layer
Source: Wikipedia.
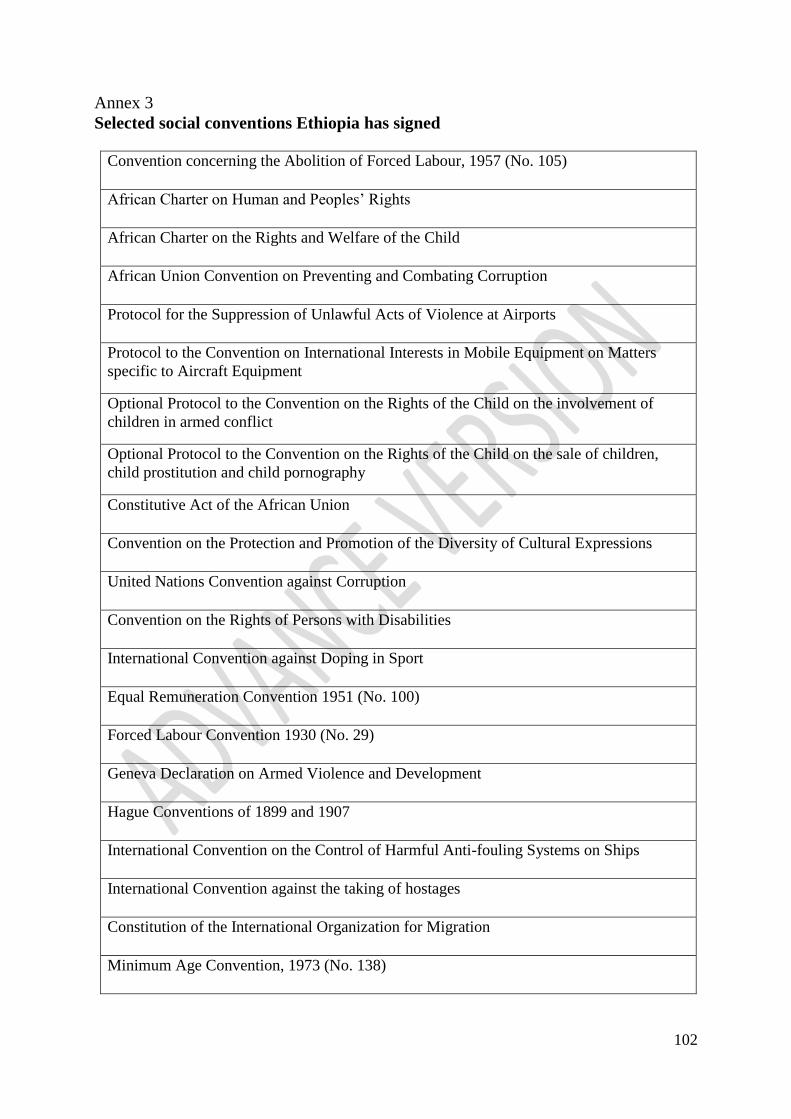
102
Annex 3
Selected social conventions Ethiopia has signed
Convention concerning the Abolition of Forced Labour, 1957 (No. 105)
African Charter on Human and Peoples‟ Rights
African Charter on the Rights and Welfare of the Child
African Union Convention on Preventing and Combating Corruption
Protocol for the Suppression of Unlawful Acts of Violence at Airports
Protocol to the Convention on International Interests in Mobile Equipment on Matters
specific to Aircraft Equipment
Optional Protocol to the Convention on the Rights of the Child on the involvement of
children in armed conflict
Optional Protocol to the Convention on the Rights of the Child on the sale of children,
child prostitution and child pornography
Constitutive Act of the African Union
Convention on the Protection and Promotion of the Diversity of Cultural Expressions
United Nations Convention against Corruption
Convention on the Rights of Persons with Disabilities
International Convention against Doping in Sport
Equal Remuneration Convention 1951 (No. 100)
Forced Labour Convention 1930 (No. 29)
Geneva Declaration on Armed Violence and Development
Hague Conventions of 1899 and 1907
International Convention on the Control of Harmful Anti-fouling Systems on Ships
International Convention against the taking of hostages
Constitution of the International Organization for Migration
Minimum Age Convention, 1973 (No. 138)
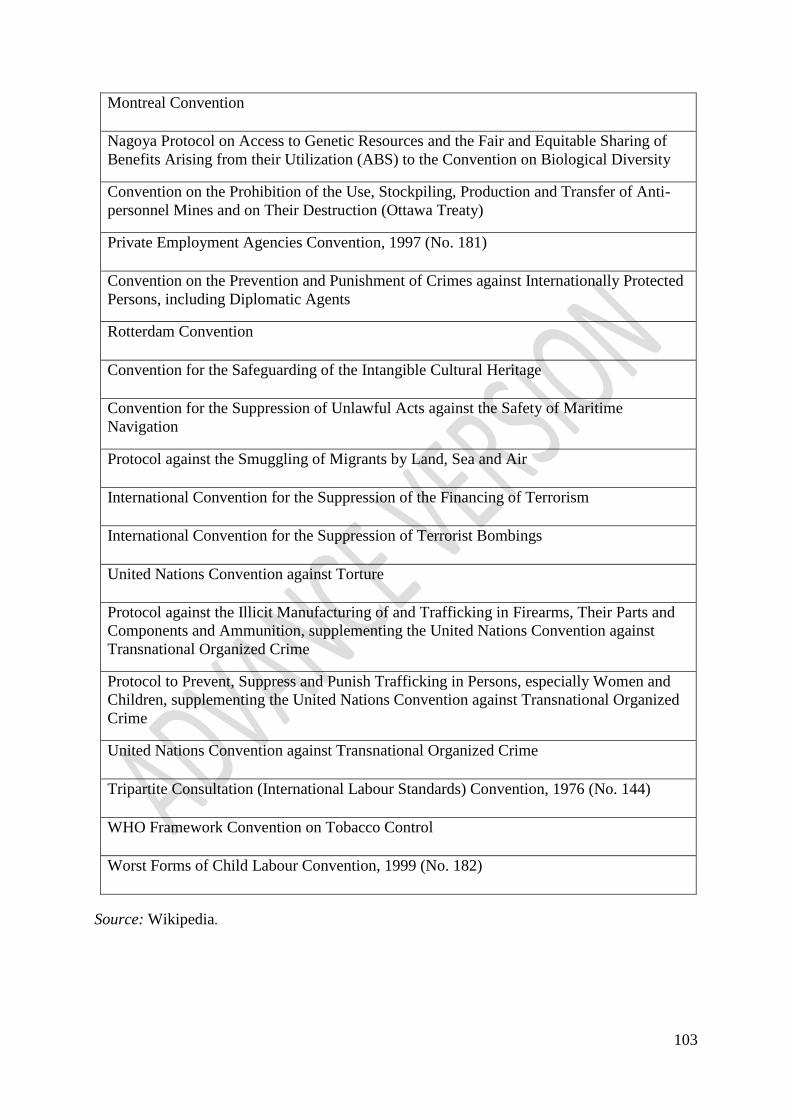
103
Montreal Convention
Nagoya Protocol on Access to Genetic Resources and the Fair and Equitable Sharing of
Benefits Arising from their Utilization (ABS) to the Convention on Biological Diversity
Convention on the Prohibition of the Use, Stockpiling, Production and Transfer of Anti-
personnel Mines and on Their Destruction (Ottawa Treaty)
Private Employment Agencies Convention, 1997 (No. 181)
Convention on the Prevention and Punishment of Crimes against Internationally Protected
Persons, including Diplomatic Agents
Rotterdam Convention
Convention for the Safeguarding of the Intangible Cultural Heritage
Convention for the Suppression of Unlawful Acts against the Safety of Maritime
Navigation
Protocol against the Smuggling of Migrants by Land, Sea and Air
International Convention for the Suppression of the Financing of Terrorism
International Convention for the Suppression of Terrorist Bombings
United Nations Convention against Torture
Protocol against the Illicit Manufacturing of and Trafficking in Firearms, Their Parts and
Components and Ammunition, supplementing the United Nations Convention against
Transnational Organized Crime
Protocol to Prevent, Suppress and Punish Trafficking in Persons, especially Women and
Children, supplementing the United Nations Convention against Transnational Organized
Crime
United Nations Convention against Transnational Organized Crime
Tripartite Consultation (International Labour Standards) Convention, 1976 (No. 144)
WHO Framework Convention on Tobacco Control
Worst Forms of Child Labour Convention, 1999 (No. 182)
Source: Wikipedia.
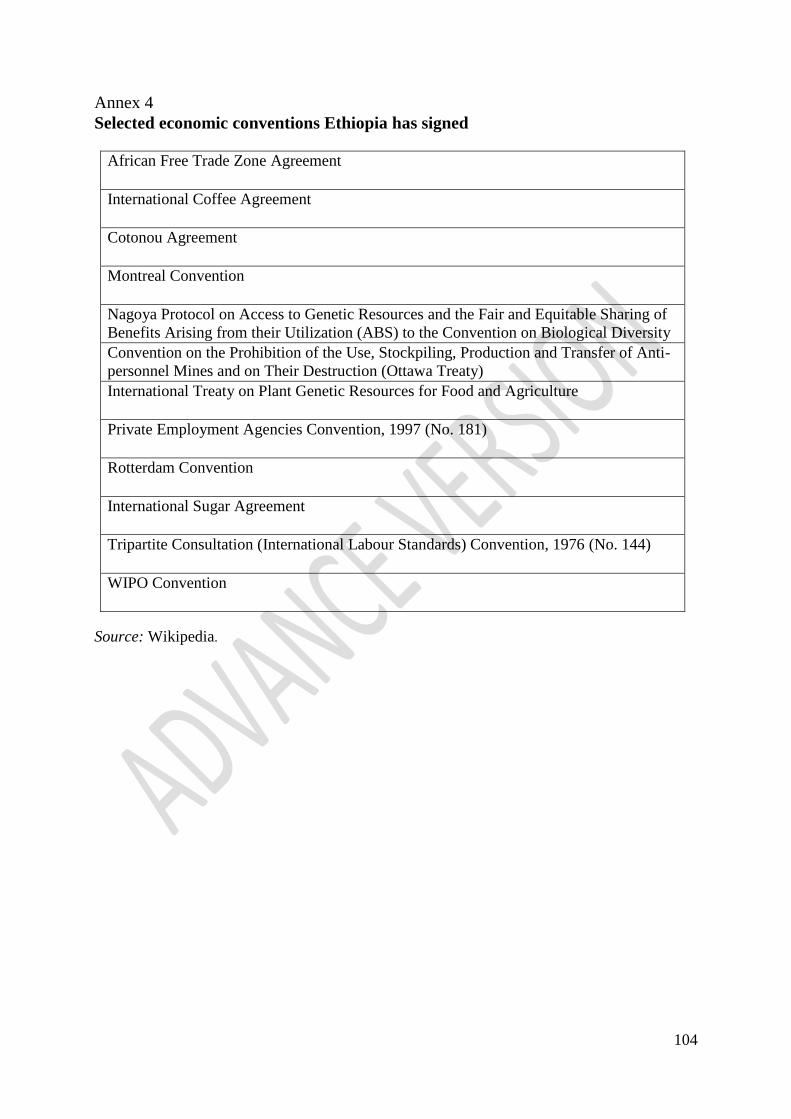
104
Annex 4
Selected economic conventions Ethiopia has signed
African Free Trade Zone Agreement
International Coffee Agreement
Cotonou Agreement
Montreal Convention
Nagoya Protocol on Access to Genetic Resources and the Fair and Equitable Sharing of
Benefits Arising from their Utilization (ABS) to the Convention on Biological Diversity
Convention on the Prohibition of the Use, Stockpiling, Production and Transfer of Anti-
personnel Mines and on Their Destruction (Ottawa Treaty)
International Treaty on Plant Genetic Resources for Food and Agriculture
Private Employment Agencies Convention, 1997 (No. 181)
Rotterdam Convention
International Sugar Agreement
Tripartite Consultation (International Labour Standards) Convention, 1976 (No. 144)
WIPO Convention
Source: Wikipedia.