Inclusion in College Savings Plans: Participation and · PDF file ·...
83
C E N T E R F O R S O C I A L D E V E L O P M E N T Inclusion in College Savings Plans: Participation and Saving in Maine’s Matching Grant Program April 2006 Center for Social Development George Warren Brown School of Social Work Washington University in St. Louis
Transcript of Inclusion in College Savings Plans: Participation and · PDF file ·...

C E N T E R F O R S O C I A L D E V E L O P M E N T
Inclusion in College Savings Plans: Participation and Saving
in Maine’s Matching Grant Program
April 2006
Center for Social Development George Warren Brown School of Social Work
Washington University in St. Louis

Inclusion in College Savings Plans: Participation and Saving
in Maine’s Matching Grant Program
Margaret Clancy
Chang-Keun Han
Lisa Reyes Mason
Michael Sherraden
April 2006
Center for Social Development George Warren Brown School of Social Work
Washington University in St. Louis gwbweb.wustl.edu/csd
(314) 935-7433

Table of Contents
Acknowledgements.......................................................................................................................... i
Executive Summary ....................................................................................................................... iii
Introduction and Overview ............................................................................................................. 1
Background..................................................................................................................................... 1
Methodology ................................................................................................................................... 8
Survey Descriptive Statistics ........................................................................................................ 10
Account and Savings Data ............................................................................................................ 22
Determining Associations with Regression Analysis ................................................................... 24
Discussion and Conclusions ......................................................................................................... 37
Tables and Figures
Table 1 Institutional Theory of Saving Applied to 529 Savings Plans………………….……...... 6 Table 2 NextGen® Initial and Annual Matching Grant Eligibility Criteria and Awards…….…... 7 Table 3 NextGen Account and Savings Data as of December 31, 2005 (N=343)………...…….10 Table 4 Account Owner Characteristics………………………..……………………….……… 11 Table 5 Financial Products Owned by Each Household…………………………….………..…14 Table 6 Internet Access and Use of Online Financial Tools………………………...……….…. 14Table 7 How Education Helps Job-Related Pursuits……………………………….……......…. 15 Table 8 How Account Owners Heard About NextGen……………………………….……..…..16Table 9 Account Owner Enrollment Method……...…………………………..…….………….. 16 Table 10 Account Owner Deposit Patterns in NextGen Account………………………………. 16Table 11 Importance of NextGen Features to Account Owners…………………….………….. 18 Table 12 Reasons for Not Using Automated Funding Service …………..……………….…… 18 Table 13 NextGen Feature with the Greatest Influence on Making Additional Deposits….…... 19 Table 14 NextGen Feature with the Least Influence on Making Additional Deposits.……..….. 19Table 15 Program Features and Saving……………………..……………………….…………. 20 Table 16 Money and Saving…...……………..……………………………………….………... 21 Table 17 Household Saving Strategies…………………..………………………….………….. 21 Table 18 NextGen Account and Savings Data as of December 31, 2005 (N=137)…..…………22 Table 19 Account and Mean Savings Variables by Different Saving Patterns (N=137)…..........24 Table 20 Summary of Regression Models and Significant Findings………………...…………. 26Table 21 Predictors of Automated Funding Service Use (N=137)………..…..………..………. 27


Table 22 Predictors of Annual Matching Grant Receipt (N=137)……....…………….……….. 29 Table 23 Predictors of Total Number of Matching Grants (N=137)……………..…….………. 30 Table 24 Predictors of the Total Value of Matching Grants (N=137)….……..…………...…… 32 Table 25 Predictors of the Annual Deposit Frequency Ratio (N=137)……….……...…..……...33Table 26 Predictors of Average Annual Contributions (N=137)…….………...………..……… 35 Table 27 Predictors of Average Annual Account Value (N=137)…………..…..…….……….. 36 Figure 1 Residence of All NextGen Matching Grant Account Owners (N=802)…..…..………...9 Figure 2 Residence of Survey Participants (N=137)……………………………………...……... 9 References….…............................................................................................................................ 45 Appendices
Appendix A State 529 Savings Plans Lowest Minimum Contribution Levels for New Account Owners………………………………..…………………...……………... 48
Appendix B Access for Low-Income Families: Comparison of 529 and IRA Minimum Contribution Levels for New Account Owners at Selected Providers……... 49 Appendix C State 529 Savings Plan Matching Grant Programs…………………………….….. 50 Appendix D Maine NextGen College Investing Plan Matching Grant Telephone Survey.……. 53 Appendix E Variables Specification from FAME NextGen Account and Savings Data….….... 69


Acknowledgements The authors wish to thank Lumina Foundation for Education for their support of this work. We are especially grateful to Karen Vigue and Katryn Gabrielson of the Finance Authority of Maine (FAME) for clarifying plan details, reviewing the consent form and invitation letter for account owners to participate in this study, and preparing and releasing NextGen College Investing Plan® account and savings records after participant consents were secured. Their contributions made this study possible. Thanks also to FAME staff for assisting in testing the survey instrument and phoning the potential study participants who did not respond to the initial study invitation letters distributed by FAME. We are also appreciative of the survey interviewers, Richard LaRock and William Elliott III, and the survey database programmer, Dan Kelley. This paper has benefited from Margaret Sherraden’s contributions to survey design and from comments by Amanda Moore McBride. We also thank Kathy McCabe who prepared the tables and formatted the final report, and Brian McKean who prepared the Geographic Information System maps.
Center for Social Development Washington University in St. Louis
i


Executive Summary Higher education provides a pathway for personal development and economic stability. Although the United States population is more highly educated than ever, lower income students face significant challenges in affording post-secondary education or training and are less likely to pursue schooling as a result. Paying for higher education has become increasingly difficult for moderate income families as well. State 529 savings plans have emerged as a tax-advantaged tool for accumulating college savings. In their current form, however, 529 savings plans provide greater benefits to individuals with higher incomes and tax liabilities. Institutional saving theory and evidence from research on matched savings programs for low-income families suggest that individuals can and will save when appropriate structural features are present. This paper focuses on participants in the NextGen College Investing Plan® Matching Grant Program, an innovation in Maine’s 529 savings plan designed to increase plan participation and post-secondary education savings among low-to-moderate income state-resident families. To date, there is little research regarding who benefits from inclusive 529 program features and how effectively these features help participants save. To understand saving among low-to-moderate income individuals in 529s, this study asks three primary research questions:
1. Who is saving in the NextGen® Matching Grant Program? 2. What factors led them to open an account and save in NextGen? 3. What factors are associated with successful saving performance?
Data for this study come from: (1) NextGen account and savings data from the Finance Authority of Maine for 137 participants in the NextGen Matching Grant Program; (2) a telephone survey of the 137 participants; and (3) interviews with a subsample of 10 of the 137. Regression analyses examine how saving performance is related to possible explanations. Results from the telephone survey indicate that individuals of different age, educational, and income backgrounds are participating in the NextGen Matching Grant Program. Most account owners are parents, but grandparents and others save as well. While a majority (61%) of account owners has at least a college degree, some have a high school diploma or less. At the sample selection date, the income eligibility threshold for the program was $50,000. In this study, 46% of respondents report 2004 adjusted gross income (AGI) below $40,000; 26% below $30,000; and 11% below $20,000. The median AGI is $40,000 to $50,000. The NextGen plan has provided access for a majority of account owners in the study to begin accumulating post-secondary education savings. Two-thirds of account owners had not saved in any way for their beneficiaries’ college education prior to enrolling in NextGen. NextGen provides information to potential participants via television, newspaper, radio, and more. Over half of account owners heard about NextGen from more than one source.
Center for Social Development Washington University in St. Louis
iii

Perhaps the most important results of this study are that low-to-moderate income individuals save in NextGen, and save through the Matching Grant Program. It appears that low-to-moderate income families respond positively to saving opportunities. About 80% of respondents are active savers in NextGen, defined as having made deposits beyond the initial contribution. Regression findings indicate that matching incentives, including both initial and annual grants, appear strongly to influence saving performance. Controlling for other factors, neither educational level nor income level is statistically associated with saving performance—on any of the outcome measures tested. However, use of automated deposits is positively linked to saving outcomes. The goal of this study is to build knowledge about features of 529 savings plans that aim to encourage saving among low-to-moderate income families. Findings shed light on how institutional structures may explain participation and saving in the NextGen Matching Grant Program. The 529 program features such as automated deposits and matching grants should be examined further to expand the reach of college savings plans.
Center for Social Development Washington University in St. Louis
iv

Introduction and Overview The United States population is more highly educated than ever. Over the past 30 years, high school graduation, college enrollment, and college graduation rates have increased. However, disparities among ethnic, racial and income groups persist (Bauman & Graf, 2003; McNeil, 1998; National Center for Education Statistics, 2005). Ability to pay for post-secondary education is a significant factor in higher education access. Over the past 20 years, the affordability of higher education has significantly declined. Lower income students, in particular, face the greatest challenges in affording higher education and are more likely not to pursue post-secondary education as a result (National Center for Public Policy and Higher Education, 2002, 2004; Parrish, 2004). Precursors to the current state 529 plans emerged in the 1990s as a tax-advantaged, higher education savings tool. In 2001, section 529 of the Internal Revenue Code authorized two types of 529 plans: prepaid tuition plans and savings plans. In this paper, we focus on 529 savings plans, in which individuals save money in an account dedicated to the future higher education expenses of a beneficiary. Although 529 savings plan awareness and participation have increased in recent years, the majority of people saving in these plans have greater incomes and financial assets than those not saving in 529s (Hurley, 2002; Investment Company Institute, 2003). There is potential for 529 savings plans to serve a broader population and increase access to higher education. Some states have implemented inclusive 529 savings plan features that facilitate the participation and savings of low-to-moderate income families (Clancy & Sherraden, 2003). To date, there is little research into how plan participation is affected by these features or how effectively these features help participants save. In order to better understand saving among low-to-moderate income individuals in 529 savings plans, this study examines the characteristics, saving performance, and viewpoints of matching grant recipients in the NextGen College Investing Plan® (NextGen®),1 the state of Maine’s 529 savings plan. The study focuses on adults saving for a child’s education in the NextGen Matching Grant Program, a state innovation designed to increase 529 participation and college savings among low-to-moderate income Maine residents. Three research questions are asked: Who is saving in the NextGen Matching Grant Program? What factors led them to open an account and save in NextGen? What factors are associated with successful saving performance?
Background The Benefits of Higher Education Higher education provides individuals with personal, social and economic benefits. College graduates have more career options, more opportunities for promotion, and lower unemployment rates than individuals who do not complete college. Occupations that mainly employ college 1 NextGen was selected for this study because of the duration of its match program and the types of incentives provided.
Center for Social Development Washington University in St. Louis
1

graduates are the fastest growing in the United States, a trend expected to continue as millions of Baby Boom workers with college degrees enter retirement (Dohm & Wyatt, 2002). Individuals who complete higher education are less likely to become poor and more likely to accumulate wealth than those with less education (Aizcorbe, Kennickell & Moore, 2003). The earnings differential by education has grown over the past 30 years, and this trend is expected to continue. Over a lifetime, college graduates and people with advanced degrees have greater earnings potential than those without a college degree. For full-time, year-round workers, projected 40-year earnings are 75% greater for those with a bachelor’s degree than for those with a high school diploma ($2.1 million versus $1.2 million, in 1999 dollars) (Day & Newburger, 2002). Race is also substantially related to earnings potential in the United States. White non-Hispanic workers have the greatest earnings potential in all educational attainment groups except advanced degrees (where they share the highest earnings potential with Asian and Pacific Islanders). In fact, White non-Hispanic high school graduates are projected to have the same or greater lifetime earnings than Blacks, Asian and Pacific Islanders, and Hispanics who have completed some college. However, at the level of completing a bachelor’s degree or higher, earnings for all racial groups begin to exceed the earnings of all racial groups with less education. For example, although projected lifetime earnings of individuals with a bachelor’s degree or more are still disparate by race, all workers in this educational category have greater estimated lifetime earnings than all workers with an associate’s degree or less (Day & Newburger, 2002). Higher Education Affordability High school students in the United States are better prepared for college than in the past, but affording a college education has become increasingly difficult. Over the past 20 years, tuition and fees at public and private colleges and universities have outpaced inflation and increases in family income. In addition, policies that had broadened access to higher education shifted focus to helping middle and upper income families pay for college (National Center for Public Policy and Higher Education, 2002, 2004; Roth, 2001). The cost of attending college has risen sharply since the 1980s. Recent increases have been greatest at public institutions. For the 2005-2006 academic year, the average total cost of tuition, fees and room and board at public, four-year institutions is $12,127. In constant dollars, this represents a 42% increase from total costs in 1995-1996 and a 78% increase from 1985-1986. The current average total annual cost at private, four-year institutions is $29,026, representing a 32% increase from 1995-1996 and an 81% increase from 1985-1986 (College Board, 2005a). As tuition and fees have risen, public and private financial aid have directed funds away from those least able to afford college and toward middle and upper income families. The purchasing power of the federal Pell Grant—an important source of funding for low-income families—has continued to decline. When established in the 1970s, the Pell Grant helped low-income families cover approximately 75% of expenses at four-year, public colleges and universities. In 2004-2005, the maximum Pell Grant covered 36% of these expenses (College Board, 2005b; Parrish,
Center for Social Development Washington University in St. Louis
2

2004). Meanwhile, new federal tax credits and deductions for education expenses have emerged. In 2004-2005, these credits and deductions constituted six percent of all types of student financial aid (College Board, 2005b). Because low-income families have little or no tax burden, most are ineligible to apply for this new higher education subsidy. Higher education is increasingly financed by public and private loans, and less so by need-based grants. The cost of higher education and trends in student aid discourage many low-income students from applying to college. For low-income students who do apply and receive financial aid packages, many are fearful of debt, turn down student loans, and postpone enrollment or do not enroll in four-year institutions (Giegerich, 2005; National Center for Public Policy and Higher Education, 2002). For middle and upper income families, ability to pay for college may influence where the student enrolls. For low-income families, ability to pay may influence whether the student applies to college or, once accepted, decides to enroll at all. Saving for College and 529 Savings Plans Trends in higher education affordability have led many families to start saving for college. While this type of saving is most common among families with higher household incomes, families of all income levels are saving for future higher education expenses (Investment Company Institute, 2003). In a 2003 phone survey of United States households with children under age 18, about 67% of those surveyed were saving to pay for their children’s college education.2 College saving rates by household income were as follows: 72% of households with annual income over $75,000, 65% of households with annual income between $50,000 and $74,999, and 40% of households with annual income less than $50,000 (Investment Company Institute, 2003). The 529 savings plans allow individuals to make after-tax deposits into an account dedicated to future higher education expenses. The account owner designates a beneficiary, which can be changed at the owner’s discretion (e.g., if the beneficiary decides to postpone higher education). State administrators offer a limited selection of funds within a range of risk and return characteristics. This selection typically includes a principal preservation fund that guarantees a minimum rate of return, equity and fixed income options, and balanced allocation options based on the beneficiary’s age. Earnings and qualified withdrawals for higher education are free from federal3 and state taxes.4 In addition, contributions are tax deductible in many states for state-resident contributions to the 529 savings plans.
2 The survey oversampled households with higher income. Thus, the national rate of saving for college is probably less than 67%. The sample consisted of a random digit dial sample of United States households with children under age 18 (40%), and a targeted sample randomly selected from households with children under age 18 and annual household income of $50,000 or more (60%). 3 Unless extended by Congress, the provisions relating to federal tax-free withdrawals will expire after December 31, 2010, and the earnings portions of qualified withdrawals would be taxed at the designated beneficiary’s tax rate. 4 For out-of-state plan participation, several states impose taxes on qualified withdrawals, and a few states tax earnings.
Center for Social Development Washington University in St. Louis
3

By 2003, an estimated 8% of United States households had opened one or more 529 savings plan accounts. Among households that did not own a 529 savings plan, 61% were aware of 529s. Among households with annual income under $50,000 and without a 529 savings plan, almost half were aware of 529s (Investment Company Institute, 2003). At the end of 2005, total assets in 529 savings plans were $68.4 billion, a 31% increase from total assets at the end of 2004 (Hurley, 2006). Compared with 2004, cash flows into the plans fell slightly, but the estimated number of accounts grew by about two million to seven million (Chaker, 2006). Inclusion in 529 Savings Plans 529 savings plans are a tool for accumulating private savings for post-secondary education, but are regressive in their current form. Tax incentives provide greater benefit to individuals with higher incomes. People with lower incomes have little or no tax liability and may have little wealth to transfer into 529s to accumulate tax-free earnings. Yet, 529 plans have beneficial features that are distinctive from other non-plan investments such as mutual funds, certificates of deposits, savings bonds, and saving vehicles such as IRAs, Roth IRAs and Coverdell Education Savings Accounts. Families of all income levels are able to access 529s through the following features (Clancy, Cramer & Parrish, 2005; Clancy, Orszag & Sherraden, 2004; Clancy & Sherraden, 2003): 1) Public sector oversight and coordination. Each state controls its savings plan, and the state has the ability to incorporate into the plan design low minimum opening deposits, low minimum contribution requirements for automated deposits,5 and state income tax deductions. Initial investment requirements vary by state, with a median of $25. These requirements are much lower than mutual funds and IRAs offered as an investment product by the same institution. (Appendix A contains state-by-state information on 529 initial investment and automated deposit requirements. Appendix B compares minimum contribution levels in 529 plans and IRAs managed by the same institutions.) Thus, public oversight increases access. 2) A centralized custodial and accounting system. The central custody of plan assets facilitates the financial accounting of a savings match by the state, and tracking contributions, investments, earnings, and some demographic information for all plan participants. The centralized accounting system provides states the ability to assess state-resident participation and saving, and add appropriate incentives or marketing outreach to target under-represented segments of the state population. 3) Limited investment options. This feature allows families to focus on a set of funds to simplify enrollment and investment product selection. Research has shown that people feel less overwhelmed with fewer investment choices (Agnew & Szykman, 2004), and having a few investment options helps control plan costs. 4) Viability of small accounts. The plan structure allows for larger profitable accounts to help offset costs of smaller unprofitable accounts within the same state plan. Regarding inclusion, this feature of savings plans may be the most important of all. 5 Electronic participation is encouraged in 529 plans, and individuals can contribute every pay period or through automatic transfers from other accounts.
Center for Social Development Washington University in St. Louis
4

Inclusive Innovations in the States Seven state 529 savings plans offer innovative savings matches for state-resident account owners or beneficiaries. While some states provide only a one-time initial match, others offer annual matches to a limited number of low-to-moderate income families, or matches to all eligible state-resident families. The match sometimes increases as household adjusted gross income decreases (Appendix C provides an overview of the state matching provisions). In addition, state partnerships with public and non-profit organizations allow families to learn about 529 savings plans and gain general information about saving for post-secondary education in non-traditional venues, such as school systems, public libraries, the State Department of Human Resources (e.g., mailing 529 savings plan information with every birth certificate), child care centers, and other settings (Ferguson, 2004). To broaden the reach of 529s and improve the effectiveness of the policy, states should expand or implement principles of transparency, inclusiveness, and incentives. More states should mandate low-cost investment options. States can review existing account and savings data and could collect additional data about account owners to evaluate participation of state-resident families, more fully develop strategic communications and outreach efforts, offer matching grants to low-income families, and inform public policy (Clancy, Cramer & Parrish, 2005; Clancy & Sherraden, 2003). Research on 529 savings plans with inclusive features, and studies of account owners receiving matching grants—such as this study—can inform development of inclusive 529 savings policies at federal and state levels. Will Low-Income Families Save in 529s? Institutional saving theory and evidence from research on matched savings programs suggest that low-income families can and will save for higher education (Schreiner & Sherraden, 2005; Sherraden, Schreiner & Beverly, 2003; Zhan & Schreiner, 2004). In contrast to theories that favor individual preferences and characteristics, an institutional theory of saving focuses on structural determinants of saving. These may include access, information, incentives, facilitation, expectations, restrictions, and security (Beverly & Sherraden, 1999; Sherraden & Barr, 2005; Sherraden, Schreiner & Beverly, 2003). Examples of each, in relation to saving in 529s, are presented in Table 1. NextGen Matching Grant Program NextGen, the state of Maine’s 529 savings plan, was launched in 1999. The plan is administered by the Finance Authority of Maine (FAME), with financial oversight provided by the Maine State Treasurer. Merrill Lynch is the Program Manager and underwriter of the plan. As of December 2004, NextGen account assets exceeded $3.2 billion in 152,520 accounts nationwide. Maine accounts (i.e., either the account owner or beneficiary is a Maine resident) numbered 6,414 and held assets in excess of $68 million (Finance Authority of Maine, 2006).
Center for Social Development Washington University in St. Louis
5
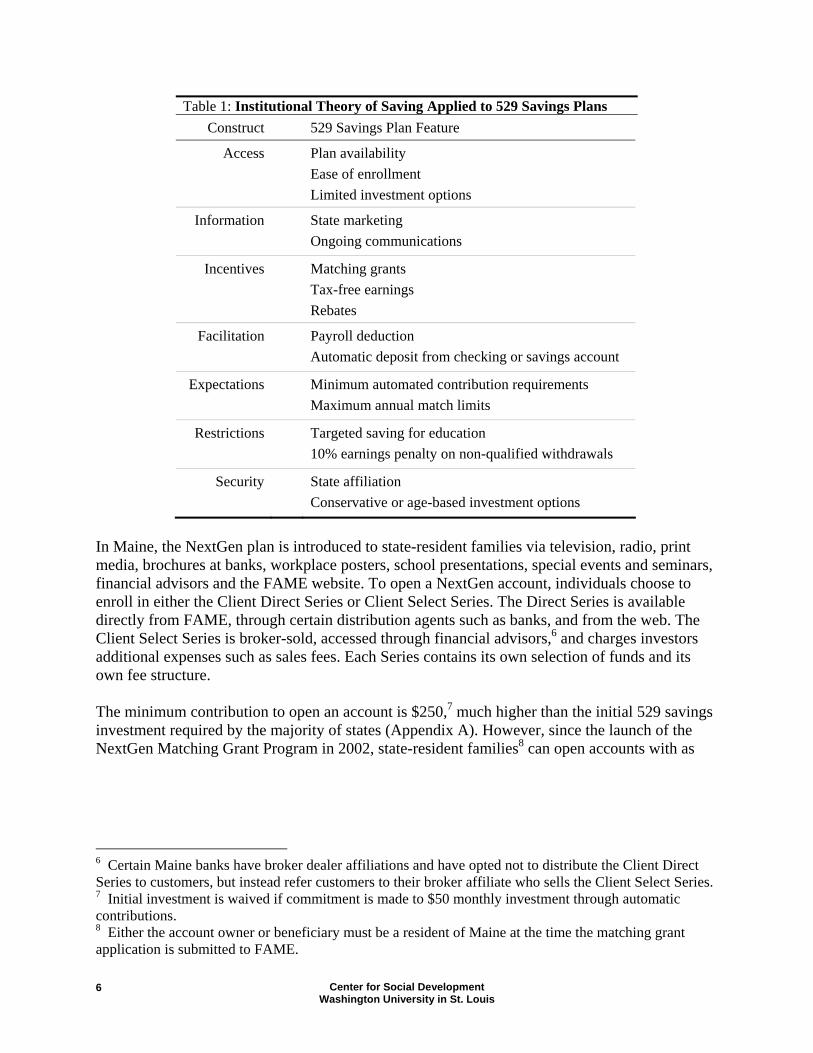
Table 1: Institutional Theory of Saving Applied to 529 Savings Plans Construct 529 Savings Plan Feature
Access Plan availability Ease of enrollment Limited investment options
Information State marketing Ongoing communications
Incentives Matching grants Tax-free earnings Rebates
Facilitation Payroll deduction Automatic deposit from checking or savings account
Expectations Minimum automated contribution requirements Maximum annual match limits
Restrictions Targeted saving for education 10% earnings penalty on non-qualified withdrawals
Security State affiliation Conservative or age-based investment options
In Maine, the NextGen plan is introduced to state-resident families via television, radio, print media, brochures at banks, workplace posters, school presentations, special events and seminars, financial advisors and the FAME website. To open a NextGen account, individuals choose to enroll in either the Client Direct Series or Client Select Series. The Direct Series is available directly from FAME, through certain distribution agents such as banks, and from the web. The Client Select Series is broker-sold, accessed through financial advisors,6 and charges investors additional expenses such as sales fees. Each Series contains its own selection of funds and its own fee structure. The minimum contribution to open an account is $250,7 much higher than the initial 529 savings investment required by the majority of states (Appendix A). However, since the launch of the NextGen Matching Grant Program in 2002, state-resident families8 can open accounts with as
6 Certain Maine banks have broker dealer affiliations and have opted not to distribute the Client Direct Series to customers, but instead refer customers to their broker affiliate who sells the Client Select Series. 7 Initial investment is waived if commitment is made to $50 monthly investment through automatic contributions. 8 Either the account owner or beneficiary must be a resident of Maine at the time the matching grant application is submitted to FAME.
Center for Social Development Washington University in St. Louis
6
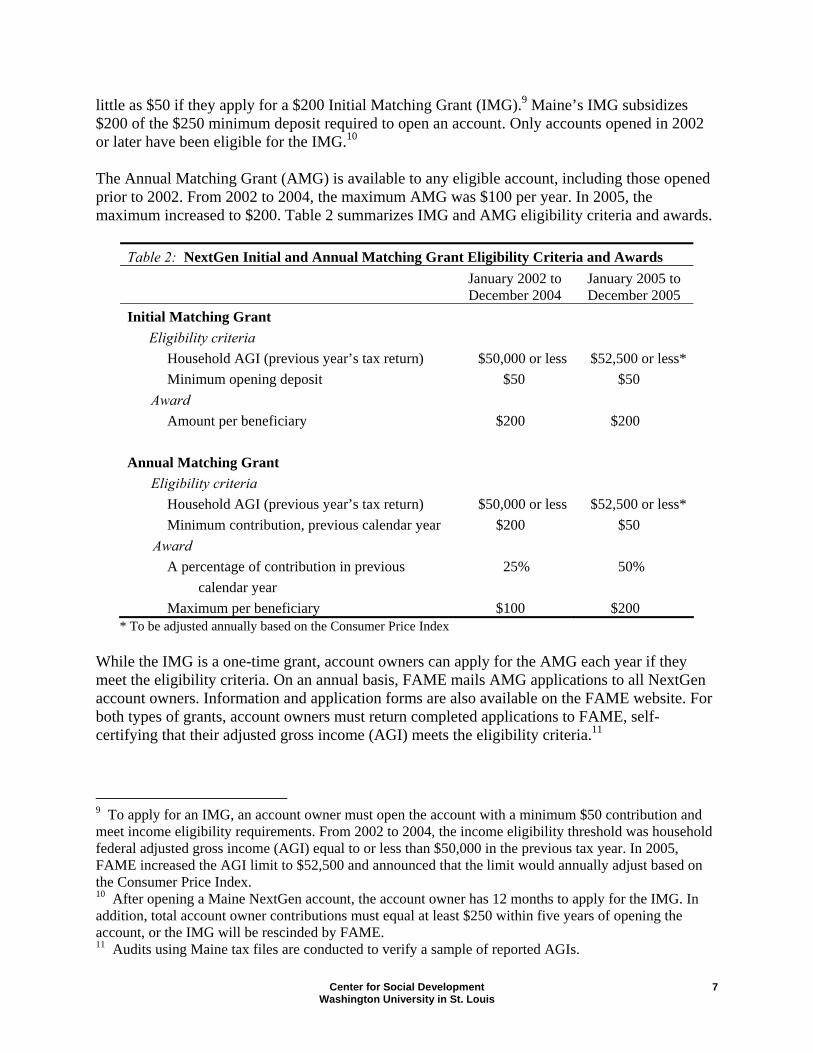
little as $50 if they apply for a $200 Initial Matching Grant (IMG).9 Maine’s IMG subsidizes $200 of the $250 minimum deposit required to open an account. Only accounts opened in 2002 or later have been eligible for the IMG.10
The Annual Matching Grant (AMG) is available to any eligible account, including those opened prior to 2002. From 2002 to 2004, the maximum AMG was $100 per year. In 2005, the maximum increased to $200. Table 2 summarizes IMG and AMG eligibility criteria and awards.
Table 2: NextGen Initial and Annual Matching Grant Eligibility Criteria and Awards
January 2002 to December 2004
January 2005 to December 2005
Initial Matching Grant Eligibility criteria Household AGI (previous year’s tax return) $50,000 or less $52,500 or less* Minimum opening deposit $50 $50 Award Amount per beneficiary $200 $200 Annual Matching Grant Eligibility criteria Household AGI (previous year’s tax return) $50,000 or less $52,500 or less* Minimum contribution, previous calendar year $200 $50 Award A percentage of contribution in previous 25% 50% calendar year Maximum per beneficiary $100 $200
* To be adjusted annually based on the Consumer Price Index While the IMG is a one-time grant, account owners can apply for the AMG each year if they meet the eligibility criteria. On an annual basis, FAME mails AMG applications to all NextGen account owners. Information and application forms are also available on the FAME website. For both types of grants, account owners must return completed applications to FAME, self-certifying that their adjusted gross income (AGI) meets the eligibility criteria.11
9 To apply for an IMG, an account owner must open the account with a minimum $50 contribution and meet income eligibility requirements. From 2002 to 2004, the income eligibility threshold was household federal adjusted gross income (AGI) equal to or less than $50,000 in the previous tax year. In 2005, FAME increased the AGI limit to $52,500 and announced that the limit would annually adjust based on the Consumer Price Index. 10 After opening a Maine NextGen account, the account owner has 12 months to apply for the IMG. In addition, total account owner contributions must equal at least $250 within five years of opening the account, or the IMG will be rescinded by FAME. 11 Audits using Maine tax files are conducted to verify a sample of reported AGIs.
Center for Social Development Washington University in St. Louis
7

Methodology Data for this study come from: (1) NextGen account and savings data from FAME for 137 participants in the NextGen Matching Grant Program; (2) a telephone survey of the 137 participants; and (3) interviews with a subsample of 10 of the 137. FAME provided annual and cumulative savings data for the plan years beginning in 1999 and ending in 2005, as well as the birth date of the beneficiary and Client Select or Direct portfolio type. The savings data include account owner contributions, withdrawals, matching grant awards (in total dollars) and matching grant distributions for each year since the account was opened, as well as the total account value, total contributions and awards, and total withdrawals and distributions. From the NextGen data, variables were specified to conduct more detailed analyses. These variables are identified and defined in Appendix E. To create the telephone survey sample, FAME provided a file of 1,335 NextGen accounts that were open as of December 31, 2004 and had received at least one matching grant award (IMG or AMG). Accounts were removed if the account owner and beneficiary were the same person, since this study focuses on saving for children’s higher education. Accounts were also removed if state residence requirements prohibited the account owner from receiving future matching grants. These criteria narrowed the number of accounts to 1,310. Many individuals owned more than one of the 1,310 accounts. For these account owners, one account was randomly selected for inclusion in the study, yielding 802 accounts owned by different account owners. Researchers then randomly selected 350 accounts for potential participation in the study. The final survey sample size was 137, an overall response rate of 39%. Figures 1 and 2 show the distribution of all matching grant account owners (N=802) and survey participants (N=137) throughout the State of Maine. Multiple attempts were made to contact the 350 account owners by mail and phone to invite participation in the study. Signed informed consent forms were returned by 143 account owners, and phone surveys were conducted with 141. Seven account owners were removed from the study (four of them post-survey) because they were initially identified incorrectly as having received at least one matching grant award. Thus, of the matching grant recipients who agreed to participate in the study, the response rate was 99%. The phone survey took approximately 20 minutes to complete and asked for information on demographics, household composition, income, ownership of other financial products, and internet use. The survey also asked about the account owner’s expectations for the beneficiary’s future and views on education. Focusing on NextGen, the survey asked about the account, savings activity, participation in the Matching Grant Program, views of different program features, and saving strategies. Appendix D contains the survey instrument.
Center for Social Development Washington University in St. Louis
8

G(rsoyfp6gttdp
1
r
* Four account owners live outside of Maine.
Figure 1: Residence of All NextGen Matching Grant Account Owners (N=802*)
Number of Participants within Zip Code Areas
iven the limited information available in the accounTable 3; see Appendix E for variable definitions), thepresentative of the 343 account owners invited to pignificant differences were found between survey paf total account value, total contributions and awardsear contribution values, or age of the beneficiary. Surom non-participants on three measures: annual depoortfolio type. Survey participants had an average an8% for non-participants. Survey participants had alsrant dollars than non-participants. Although statisticotal matching grant dollars was just $35 between theerms. Finally, non-participants are more likely to useistribution of portfolio type is 61% Select Series forarticipants.
2 Seven potential survey participants did not receive any andomly-selected sample was reduced to 343.
Center for Social DevWashington University
Number of Participants within Zip Code Areas
Figure 2: Residence of Survey Participants (N=137)
t and savings data file 137 survey participarticipate in the studyrticipants and non-pa, how long the accounrvey participants didsit frequency, total m
nual deposit frequenco received slightly hially significant, the d two groups, which is the Select Series por survey participants a
matching grant awards
elopment in St. Louis
e from FAME ants are generally .12 No statistically rticipants on measures t has been open, first
differ significantly atching dollars, and
y of 81% compared to gher total matching ifference in average not large in practical tfolio. The ownership nd 72% for non-
; thus, the 350 original
9

Table 3: NextGen Account and Savings Data as of December 31, 2005 (N=343) Minimum Maximum Mean MedianAge of beneficiary (in years) 1 38 9.64 9.00Age of account (in years) 2.0 7.0 3.36 3.00First year contributions* $50 $50,000 $1,742 $500Total value of matching grants $62 $600 $268 $200Total number of matching grants 1 4 1.69 1.00Annual deposit frequency (1999-2005) 25% 100% 73% 80%Annual deposit frequency (2002-2005) 25% 100% 72% 75%Total contributions $50 $51,200 $3,139 $1,400Average annual contributions $12 $12,800 $901 $475Total account value $0 $70,453 $3,964 $1,858Average annual account value $0 $17,613 $1,159 $661Total investment earnings -$588 $18,753 $725 $269* Outliers in the first year contributions variable suggest that some account owners transferred lump sums from other accounts into NextGen. Therefore, this variable is used as a control in the regression analysis.
Survey Descriptive Statistics This section summarizes the self-report responses of the 137 NextGen account owners surveyed by telephone. All descriptive statistics describe the adult account owner unless noted. Missing values are not reported unless more than 1% of account owner responses are missing. Account owner characteristics are summarized in Table 4. Demographics Age. The average age of account owners is 49, with a low of 27 and a high of 87. About 67% are between 30 and 55 years old. Race/ethnicity of beneficiary. Account owners identify account beneficiaries as Caucasian (90%), African-American (1%), Asian Indian (1%), or Other/Multiple Origins (8%). Relationship to beneficiary. Most account owners are the parent of the beneficiary (64%). Twenty-nine percent are grandparents, and seven percent have some other relationship to the beneficiary. Among grandparents and account owners with some other relationship, none are the beneficiary’s legal guardian. Language. Ninety-eight percent of account owners indicate that English is spoken most at home. In homes where other languages are spoken most, English is also used.
Center for Social Development Washington University in St. Louis
10

Table 4: Account Owner Characteristics Demographics Household Composition Housing, continued
Age Marital Status % Monthly Mortgage/Rent Minimum 27 Married 61 Payment Maximum 87 Divorced 25 Mean 49 Widowed 7
Average mortgage $861 Average rent $476
Median 46 Never married 4 Separated 2 Household Income Race/Ethnicity of Beneficiary % Working Adults in Household % Caucasian 90 Children in Household % One 85 African-American 1 None 40 None 15 Asian Indian 1 One 23 If no adult working, income source
Other/Multiple Origins 8 Two or more 36 Retirement 95
Disability 5
Relationship to Beneficiary % Household Type % Parent 64 One adult, no children 17 2004 Adjusted Gross Income ** % Grandparent (not legal guardian) 29 One adult, one child 8 Less than $20,000 11 Other (not legal guardian) 7 One adult, two children 5 $20,000 to $29,999 15
One adult, three or more children 1 $30,000 to $39,999 20 Language Spoken at Home % Two or more adults, no children 23 $40,000 to $49,999 26 English 98 Two or more adults, one child 15 $50,000 to $59,999 18 Other (and English) 2 Two or more adults, two children 26 More than $60,000 7
Two or more adults, three or more 4 Education % children Other Sources of Income (2004) % Less than high school diploma 1 Investments 39 High school diploma 12 Housing Retirement, pensions or Social 29 Post-secondary vocational/ 1 Housing Situation % Security technical training (no degree) Homeowner 89 Disability 5 Post-secondary vocational/ 1 Renter 8 Food stamps 2 technical training (degree) If renter, type of rental Temporary Assistance for Needy 1 Some college (no degree) 9 Private apartment 73 Families (TANF) Associate degree 14 Section 8/subsidized 18 Bachelor degree 34 Other 3 Income in Households % Graduate/professional school 6 with No Children
(no degree) Home Value* Earned income 62 Graduate/professional school 21 Mean value $251,196 If no earned income, source
(degree) Retirement income 95
Mortgage % Mortgage holders (among 67
homeowners) * Mean value among homeowners who report an exact figure. ** AGI data is missing for six account holders; three report an AGI greater than $37,000, but do not specify the amount.
Center for Social Development Washington University in St. Louis
11

Education. Account owners have the following education levels: less than a high school diploma (1%), high school diploma (12%), post-secondary vocational or technical training but no degree (1%), post-secondary vocational or technical training degree (1%), some college but no degree (9%), associate degree (14%), bachelor degree (34%), graduate or professional school but no degree (6%), and graduate or professional degree (21%). Most account owners (61%) have a bachelor degree or beyond. Household Composition Marital status. Account owners are married (61%), divorced (25%), widowed (7%), never married (4%), or separated (2%). Children. Over half of all households (59%) have at least one child living in the home. Forty percent have no children present. Among the 40% of households with no children present, 82% of account owners are grandparents or have a relationship to the beneficiary other than parent. In addition, 62% of households with no children have earned income. Among those without anyone working for pay, almost all (95%) receive retirement income. Adults. Most households (69%) have at least two adults living in the home. The number of reported household adults and children were combined to determine the account owner’s household type. The most common household type is two or more adults with two children (26%). Housing Housing situation. Most account owners (89%) are homeowners; 8% are renters, and 3% have other living arrangements. Among renters, three-quarters live in a private apartment (73%); other renters live in Section 8 or subsidized housing (18%), or some other type of rental housing (9%). Home value. The mean home value among homeowners who report an exact figure is $251,196.13
Mortgage. Most homeowners (67%) currently have a mortgage. Mortgage/rent payment. The average monthly payment among homeowners with a mortgage is $861. The average monthly payment among renters is $476. Household Income Working adults. Most households have at least one adult working for pay (85%). Of the 15% who do not have an adult working for pay, almost all receive retirement income (95%), and the remaining 5% receive disability income.
13 Home value is missing for three account owners. Of these three, one account owner reports a home value of $150,000 or more, but does not specify the amount.
Center for Social Development Washington University in St. Louis
12

Adjusted gross income (AGI). Income data were collected in $10,000 increments. Account owners report 2004 household AGI as follows: less than 20,000 (11%), $20,000 to $29,999 (15%), $30,000 to $39,999 (20%), $40,000 to $49,999 (26%), $50,000 to $59,999 (18%), and more than $60,000 (7%).14 15 Direct deposit. Over three-quarters (77%) of all households have all or part of an adult’s paycheck or government payment directly deposited into a checking or savings account. Retirement income. Some 29% of households receive income from retirement, pensions or Social Security. Investment income. About 39% of households receive investment income. Government Assistance. About 1% of households receive Temporary Assistance for Needy Families (TANF), and 2% of households receive food stamps. Disability income. Some 5% of households receive disability income. Financial Products Account owners were asked whether they owned various financial products. All have either a checking or savings account. Ownership of other financial products varies. Table 5 summarizes household ownership of each financial product listed. Ownership of other NextGen matching grant accounts. Half (50%) of account owners hold other NextGen matching grant accounts. Most of these account owners (75%) own one other account, although responses ranged from one to ten accounts. Of the additional accounts, 43% are held by parents and 52% by grandparents.
14 AGI is missing for six account owners. Of these six, three account owners report an AGI greater than $37,000, the approximate Maine median household income from the 2000 Census (U.S. Census Bureau, 2006b), but do not specify the amount. 15 Although 25% of account owners report an AGI of at least $50,000 (the previous AGI threshold for the Matching Grant Program), some may still be eligible to receive the AMG, given that (1) FAME increased the income threshold to $52,500 for the 2005 calendar year and (2) household AGI may fluctuate over time.
Center for Social Development Washington University in St. Louis
13
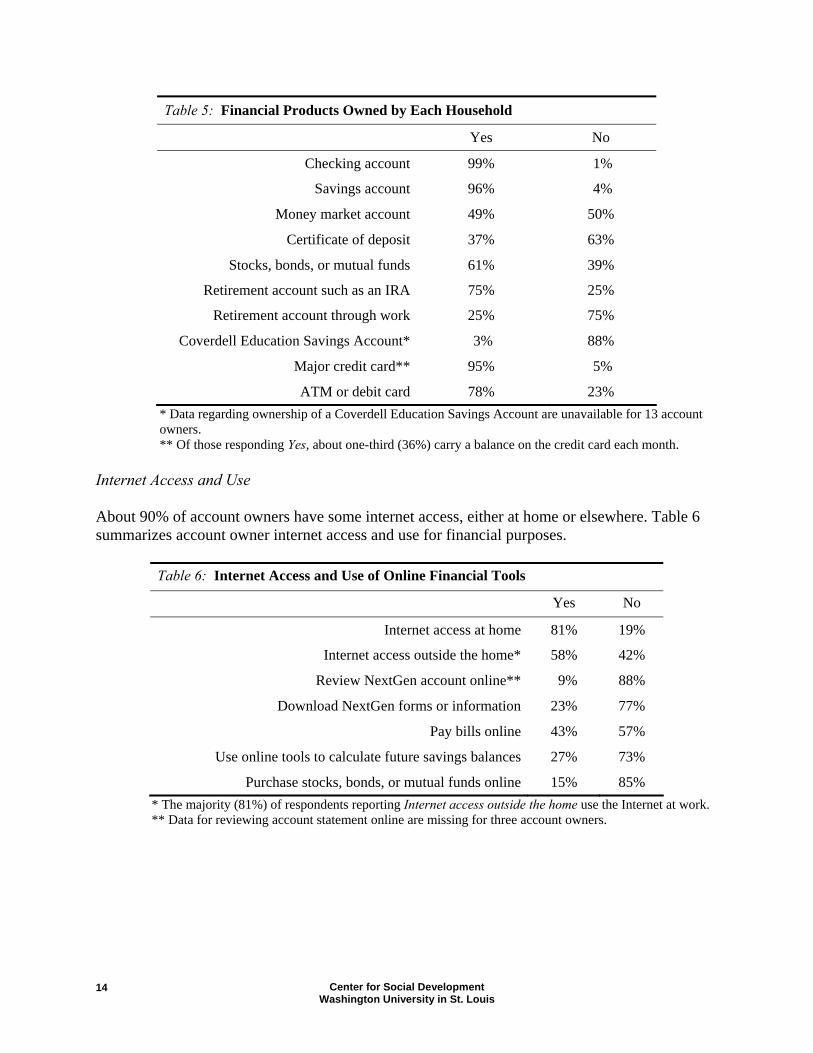
Table 5: Financial Products Owned by Each Household
Yes No
Checking account 99% 1%
Savings account 96% 4%
Money market account 49% 50%
Certificate of deposit 37% 63%
Stocks, bonds, or mutual funds 61% 39%
Retirement account such as an IRA 75% 25%
Retirement account through work 25% 75%
Coverdell Education Savings Account* 3% 88%
Major credit card** 95% 5%
ATM or debit card 78% 23% * Data regarding ownership of a Coverdell Education Savings Account are unavailable for 13 account owners. ** Of those responding Yes, about one-third (36%) carry a balance on the credit card each month.
Internet Access and Use About 90% of account owners have some internet access, either at home or elsewhere. Table 6 summarizes account owner internet access and use for financial purposes.
Table 6: Internet Access and Use of Online Financial Tools
Yes No
Internet access at home 81% 19%
Internet access outside the home* 58% 42%
Review NextGen account online** 9% 88%
Download NextGen forms or information 23% 77%
Pay bills online 43% 57%
Use online tools to calculate future savings balances 27% 73%
Purchase stocks, bonds, or mutual funds online 15% 85% * The majority (81%) of respondents reporting Internet access outside the home use the Internet at work. ** Data for reviewing account statement online are missing for three account owners.
Center for Social Development Washington University in St. Louis
14

Expectations for the Beneficiary Beneficiary’s education. Almost all account owners expect their beneficiary to receive a four-year college degree or study beyond a four-year degree (96%). Beneficiary’s financial situation. Account owners expect their beneficiary’s financial situation in the future to be better (72%), about the same (21%), or worse (6%) than their financial situation. Views on Education Importance of education beyond high school. Almost all account owners think that education beyond high school is very important (95%). How education helps job-related pursuits. Account owners were asked their view on how education helps with job-related pursuits such as finding employment, improving job performance, improving the chances of promotion, and improving the ability to change jobs or careers. Table 7 presents account owner responses for each question.
Table 7: How Education Helps Job-Related Pursuits
A Great Deal Somewhat Not at All
Helps to find employment 91% 9%
Improves job performance 64% 34% 1%
Improves chances of promotion 77% 23% 1%
Improves ability to change jobs or careers 88% 11% 1%
NextGen Account Importance to beneficiary going to school. Account owners state that the NextGen account is very important (53%), somewhat important (39%), or not very important (8%) to the beneficiary pursuing an education beyond high school. Source of NextGen information. Account owners have learned about NextGen from a variety of sources, as summarized in Table 8. The five most common sources are from a financial advisor, television, bank or credit union, newspaper, and friend or family member. Year account opened. Account owners report opening the NextGen account in 1999 (5%), 2000 (9%), 2001 (15%), 2002 (20%), 2003 (27%), or 2004 (24%).16
16 Account owner self-report may vary from the actual year the account was opened. For the regression analyses, the year the account was opened is determined using actual account data provided by FAME.
Center for Social Development Washington University in St. Louis
15

Table 8: How Account Owners Heard About NextGen*
Financial advisor 35% Employer 10%
Television 33% Magazine 4%
Bank or credit union 20% Print ad or flyer 4%
Newspaper 20% Event 3%
Friend or family member 15% Website 1%
Radio 11% Other 9% * About half (51%) of account owners have learned about NextGen from more than one source. Since some account owners give more than one response, the total percentage exceeds 100%.
Enrollment. To open the account, most account owners used an enrollment kit from FAME. Table 9 summarizes different ways that account owners enrolled in NextGen.
Table 9: Account Owner Enrollment Method
Enrollment kit from FAME 37%
Financial advisor 31%
Enrollment kit from financial institution 28%
Downloaded application online 2%
Other 1%
Deposit pattern. Account owners report that they have typically made NextGen deposits bi-weekly, monthly, several times a year, annually, one single time, or in some other way. Table 10 summarizes the percentage of account owners reporting each deposit pattern.
Table 10: Account Owner Deposit Patterns in NextGen Account
Bi-weekly 7%
Monthly 24%
Several times per year 21%
Annually 23%
One-time deposit 16%
Other 8%
Deposit in previous 12 months. Eighty percent of account owners report making a deposit into the account in the previous 12 months. Among the 20% of account owners who did not make a deposit in the previous 12 months, many (43%) found it difficult to save. One account owner lost interest in the program (4%), and another account owner’s beneficiary no longer plans to attend
Center for Social Development Washington University in St. Louis
16

college (4%). Among account owners who report some other reason for not depositing (54%), many state that they are saving or investing elsewhere (40%).17
Non-qualified withdrawals. One account owner reports a non-qualified withdrawal from the account (i.e., a withdrawal for something other than higher educational expenses). Expected total savings. Account owner expectations for total savings in the account by the time money is withdrawn for education are as follows: less than $5,000 (15%), $5,000 to $9,999 (20%), $10,000 to $14,999 (15%), $15,000 to $19,999 (15%), $20,000 or more (31%).18
Program Features Initial Matching Grant receipt. Most account owners (80%) report receiving a $200 Initial Matching Grant (IMG) from FAME. Of the 20% who report not receiving an IMG or who did not know, about half (52%) were ineligible for the IMG because their accounts were open prior to 2002 when the IMG was launched.19
Annual Matching Grant receipt. About two-thirds (66%) of account owners report ever receiving a NextGen Annual Matching Grant (AMG).20 Among account owners who report ever receiving an AMG, most (71%) are currently in the Matching Grant Program and applied for an annual grant based on deposits made in the most recent year.21
Reasons not currently in Annual Matching Grant program. Among the 21 account owners no longer receiving the Annual Matching Grant, their reasons for not participating include: income too high to qualify (52%), did not apply (10%), did not save enough to be eligible (10%), and cannot save (5%). Other responses (totaling 29%) include: did not hear about it, did not receive the paperwork, did not make the deadline, did not add money to the account, filed income taxes late, and overwhelmed with paperwork.22
Knowledge that investment earnings are tax-free. When opening the account, almost all account owners (99%) knew that the investment earnings would be tax-free if used for education.
17 Since account owners could provide more than one response, the total percentage exceeds 100%. 18 Expected total savings is missing for four account owners. 19 Receipt of $200 Initial Matching Grant is missing for nine account owners. Reported receipt of IMG and actual receipt of IMG vary for some account owners. Regression analyses use actual account data provided by FAME to determine whether the account owner received an IMG. 20 Receipt of Annual Matching Grant is missing for 10 account owners. Reported receipt of AMG and actual receipt of AMG vary for some account owners. Regression analyses use actual account data provided by FAME to determine whether the account owner ever received an AMG. 21 Whether currently in Annual Matching Grant program is missing for five account owners. Like IMG receipt and AMG receipt, reported and actual values for this variable may vary. 22 Since account owners could provide more than one response, the total percentage exceeds 100%.
Center for Social Development Washington University in St. Louis
17

Importance of NextGen features to account owners. Based on their responses to whether they had received an IMG, received an AMG, or knew that investment earnings were tax-free, account owners were asked separate questions about the importance of the IMG, AMG and tax-free earnings on their decision to open the account and/or their continuing to save. Account owner responses are presented in Table 11.
Table 11: Importance of NextGen Features to Account Owners
Very Important
Somewhat Important
Not Important
Initial Matching Grant*
In decision to open the account 51% 32% 17%
Annual Matching Grant**
In continuing to save 47% 37% 16%
Tax-free earnings
In decision to open the account 71% 27% 1%
In continuing to save 71% 26% 3% * Data are for account owners who report receiving an Initial Matching Grant. ** Data are for account owners who report that they are still in the Annual Matching Grant program.
Automated Funding Service (AFS) use. Thirty-one percent of account owners are enrolled in NextGen’s AFS, through payroll deduction or transfer from a bank account into the NextGen account. For these account owners, electronic deposits are made bi-weekly (19%), monthly (74%), or quarterly (7%). The 69% of account owners not using AFS provide a variety of reasons for why they are not enrolled, as presented in Table 12.23
Table 12: Reasons for Not Using Automated Funding Service*
Irregular paychecks 28% Other priority savings vehicles 4%
Did not know feature was available 13% Prefer annual contribution 3%
Insufficient funds to make deposit 11% Gift deposits only 3%
Minimum deposit amounts are too high 9% Deposit only enough for minimum match 2%
Prefer not to use AFS for anything 7% Lack of initiative 2%
Retired 6% Employer does not have electronic deduction 1%
Prefer/need to control funds 6% Other 11% * Since account owners could provide more than one response, the total percentage exceeds 100%.
23 NextGen has a higher monthly automated deposit requirement that most other states. See Appendix A for state-by-state comparison.
Center for Social Development Washington University in St. Louis
18

NextGen feature with greatest influence on making additional deposits. Account owners emphasized tax-free earnings (51%), the annual match (31%), or a variety of mutual funds to select from (11%) as the features with the greatest influence on their decision to keep saving in the account. Table 13 presents responses.
Table 13: NextGen Feature with the Greatest Influence on Making Additional Deposits
Tax-free earnings 51%
Annual Matching Grant 31%
Investment selection from many mutual funds 11%
Automated deposits 7%
Other 1%
NextGen feature with least influence on making additional deposits. Account owners emphasize automated deposits (55%), a variety of mutual funds to select from (34%), or the annual match (8%) as the features with the least influence on the decision to keep saving in the account. Responses are presented in Table 14.
Table 14: NextGen Feature with the Least Influence on Making Additional Deposits
Automated deposits 56%
Investment selection from many mutual funds 34%
Annual Matching Grant 8%
Tax-free earnings 1%
Other 1%
Effect of program features on saving. Account owners were asked how specific program features affect their saving in the account. The three most common features that make saving easier are: (1) knowing the account is dedication to the beneficiary’s education; (2) the $200 Initial Matching Grant; and (3) the Annual Matching Grant. Account owner responses are presented in Table 15.
Center for Social Development Washington University in St. Louis
19
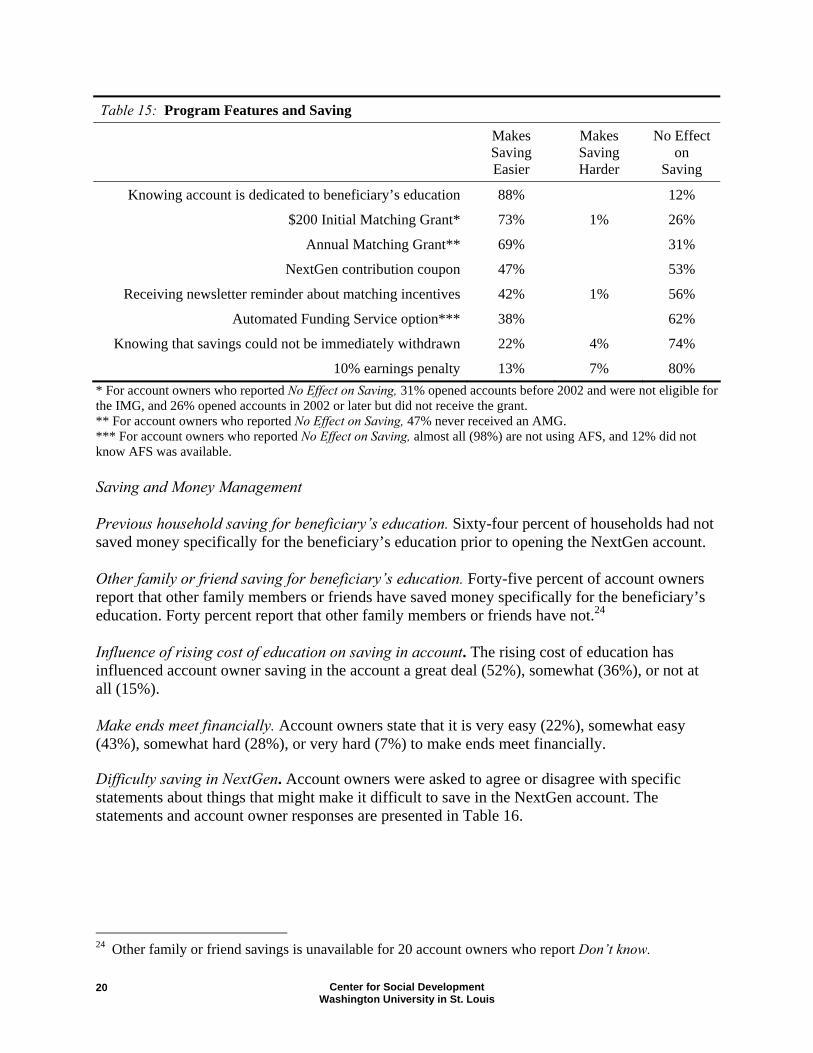
Table 15: Program Features and Saving
Makes Saving Easier
Makes Saving Harder
No Effect on
Saving
Knowing account is dedicated to beneficiary’s education 88% 12%
$200 Initial Matching Grant* 73% 1% 26%
Annual Matching Grant** 69% 31%
NextGen contribution coupon 47% 53%
Receiving newsletter reminder about matching incentives 42% 1% 56%
Automated Funding Service option*** 38% 62%
Knowing that savings could not be immediately withdrawn 22% 4% 74%
10% earnings penalty 13% 7% 80% * For account owners who reported No Effect on Saving, 31% opened accounts before 2002 and were not eligible for the IMG, and 26% opened accounts in 2002 or later but did not receive the grant. ** For account owners who reported No Effect on Saving, 47% never received an AMG. *** For account owners who reported No Effect on Saving, almost all (98%) are not using AFS, and 12% did not know AFS was available. Saving and Money Management Previous household saving for beneficiary’s education. Sixty-four percent of households had not saved money specifically for the beneficiary’s education prior to opening the NextGen account. Other family or friend saving for beneficiary’s education. Forty-five percent of account owners report that other family members or friends have saved money specifically for the beneficiary’s education. Forty percent report that other family members or friends have not.24
Influence of rising cost of education on saving in account. The rising cost of education has influenced account owner saving in the account a great deal (52%), somewhat (36%), or not at all (15%). Make ends meet financially. Account owners state that it is very easy (22%), somewhat easy (43%), somewhat hard (28%), or very hard (7%) to make ends meet financially. Difficulty saving in NextGen. Account owners were asked to agree or disagree with specific statements about things that might make it difficult to save in the NextGen account. The statements and account owner responses are presented in Table 16.
24 Other family or friend savings is unavailable for 20 account owners who report Don’t know.
Center for Social Development Washington University in St. Louis
20

Table 16: Money and Saving
Agree Disagree
All or most of your money purchases necessities. 56% 44%
It is hard to save enough to make a real difference.* 36% 61%
It is hard to resist temptations to spend money now. 31% 69%
Saving isn’t that important to you. 1% 99% * Four account owner responses are missing.
Saving strategies. Account owners were asked whether their household used any of eight specific strategies to save in the NextGen account. Table 17 summarizes how many account owners report using each strategy. The three most common saving strategies are: (1) shopped more carefully or bought generic or second hand items; (2) received contributions from family or friends; and (3) resisted or delayed spending.
Table 17: Household Saving Strategies
Yes No
Shopped more carefully or bought generic or second hand items 42% 58%
Received contributions from family or friends* 37% 63%
Resisted or delayed spending 35% 65%
Transferred money from other accounts** 20% 80%
Used some or all of your federal tax refund 15% 85%
Worked more hours or jobs 12% 88%
Used some or all of your state tax refund 9% 91%
Borrowed money 1% 99% * For the 50 account owners who responded Yes, family or friend contributions constitute one-quarter or less (60%), about half (16%), about three-quarters (6%) or almost all (18%) of total NextGen savings. ** For the 27 account owners who responded Yes, transfers constitute one-quarter or less (41%), about half (26%), about three-quarters (15%), or almost all (15%) of total savings in the account. Amount of money transferred is missing for one account owner.
Center for Social Development Washington University in St. Louis
21

Account and Savings Data This section summarizes NextGen account and savings data from FAME for the 137 survey participants. Table 18 presents the minimum value, maximum value, mean, and median for account and savings variables. Table 18: NextGen Account and Savings Data as of December 31, 2005 (N=137)
Minimum Maximum Mean Median
Age of beneficiary (in years) 1 25 8.7 8
Age of account (in years) 2.0 7.0 3.4 3.0
First year contributions* $50 $50,000 $1,832 $530
Total value of matching grants $62 $600 $288 $300
Total number of matching grants 1.0 4.0 1.9 2.0
Annual deposit frequency (1999-2005) 25% 100% 81% 100%
Annual deposit frequency (2002-2005) 25% 100% 81% 100%
Total contributions $50 $51,150 $3,430 $1,550
Average annual contributions $12 $12,800 $933 $500
Total account value $0 $70,453 $4,371 $2,221
Average annual account value $0 $17,613 $1,214 $703
Total investment earnings -$588 $18,753 $818 $281* Outliers in the first year contributions variable suggest that some account owners transferred lump sums from other accounts into NextGen. Therefore, this variable is used as a control in the regression analysis. Age of beneficiary. Beneficiaries range in age from one to 25 years old. The mean beneficiary age is 8.7. Age of account. The age of account is the number of years that the account was open at the time of the survey. Accounts were opened from 1999 through 2004, and savings data is available from 1999 through 2005. Thus, age of account ranges from two to seven years. Account open 2002 or later. This variable describes when an account owner opened the account in relation to the Matching Grant Program launch. About 83% of account owners opened their account in 2002 or later. Portfolio type. Account owners are invested in the Client Direct (39%) or Select (61%) portfolios. About 36% of assets are in Direct portfolios, and 64% are in Select portfolios.25 First year contributions. First year contributions is the total account owner deposits during the first year the account was open. Values range from $50 to $50,000, with a mean value of $1,832 25 For this study, the data indicate whether a portfolio is FAME Direct, Bank Direct, or Select. The Select Series is also available from brokers affiliated with banks, which opt not to distribute the Direct Series.
Center for Social Development Washington University in St. Louis
22

and median value of $530. Due to the variance in contributions, this variable is used as a control in the regression analysis. Initial Matching Grant receipt. About 72% of account owners received the $200 IMG. Annual Matching Grant receipt. About 73% of account owners received at least one AMG. Matching grant awards. Total number of matching grants received by a participant ranges from one to four, and the total value of matching grants received by a participant ranges from $62 to $600. Annual deposit frequency. Annual deposit frequency captures annual savings behavior. It is the percentage of years that the account has been open in which the account owner has made a contribution to the account. Annual deposit frequency is measured in two ways: (1) from 1999 through 2005 (since inception of NextGen); and (2) from 2002 through 2005 (since inception of the Matching Grant Program). On both measures of annual deposit frequency, account owners have made deposits in 25% to 100% of the years in which the account is open. Total and average annual contributions. Two measures of contributions are provided: total and average annual. Total contributions is the sum of all account owner contributions to the account, and ranges from $50 to $51,200. Total contributions does not consider the age of the account, and therefore cannot be used to compare savings among account owners who opened their accounts in different years. Average annual contributions is the total contribution divided by the age of account. Values range from $12 to $12,800. Total and average annual account value. Two measures of account value are provided: total and average annual. Total account value is the account balance on December 31, 2005, and ranges from zero to $70,453.26 Total account value does not consider how long the account has been open. Average annual account value is the total account value divided by the age of account, and ranges from zero to $17,613. Investment earnings. Investment earnings are total account value minus net contributions and matching grants. Investment earnings range from a loss of $588 to a gain of $18,753. Average investment earnings are $818, and the median earnings are $281. As expected, saving patterns vary for the 137 account owners. To better understand Matching Grant account owners’ saving, four patterns are identified and described in Table 19. The majority of account owners deposited more than the initial requirement of $50 in the first year, and they continue to make regular contributions to NextGen. Eighty percent of account owners made contributions after their first year of enrollment.
26 Four accounts have been adjusted by adding qualified withdrawals and matching grant distributions back into the account balance on December 31, 2005, since these account owners had college age beneficiaries.
Center for Social Development Washington University in St. Louis
23

Table 19: Account and Mean Savings Variables by Different Saving Patterns (N=137)
Mean Findings
Saving patterns N
AFS Use (N)
No. of Matching
Grants
Value of Matching
Grants Contributions
Average Annual
Contributions Account
Value
$50 first year and no subsequent year contributions
7 0 1.0 $200 $50 $17 $304
$50 first year and one or more subsequent year contributions
9 3 1.4 $234 $1,063 $378 $1,463
More than $50 first year and no subsequent year contributions
20 0 1.3 $230 $3,608 $1,021 $4,592
More than $50 first year and one or more subsequent year contributions
101 39 2.1 $312 $3,840 $1,029 $4,869
Total 137 42 1.9 $289 $3,430 $933 $4,371
Determining Associations with Regression Analysis
Regression analysis examines how an outcome of interest (a dependent variable) is related to possible explanations (independent variables). Regression analysis estimates the direction, size, and statistical significance of the association between dependent and independent variables. Regression analysis also controls for correlations among more than one variable. In other words, the overlapping effects of all independent variables are statistically sorted out, and the reported effect size for a given independent variable is distinct from all other independent variables in the regression model. Seven regression models have been constructed. The first two models examine which factors are related to use of Automated Funding Service (AFS) and Annual Matching Grant (AMG) receipt. The remaining five models analyze which factors are related to the following indicators of saving performance: (1) total number of matching grants; (2) total value of matching grants; (3) annual deposit frequency; (4) average annual contributions; and (5) average annual account value.27 28
27 In the last two regression models, dependent variables underwent log transformation due to their skewed distribution. These transformations may introduce bias into model results. 28 Appendix E defines each indicator of saving performance.
Center for Social Development Washington University in St. Louis
24

Independent variables differ across the regression models for two reasons. First, each model has been shaped by different theoretical backgrounds and hypotheses. Second, the small sample size (N=137) prevents inclusion of all relevant variables in a model. Regressions have been constructed to meet the best model fit. All models include age of beneficiary, age of account owner, educational attainment of account owner, first year contributions and adjusted gross income. In the logistic regression models, the sign of coefficients of independent variables indicates the direction of the effects of an independent variable on a dependent variable. A positive coefficient means that one unit increase in an independent variable is associated with the increase in the probability of a dependent variable. The odds ratio is interpreted as the magnitude of the effects of the independent variable on the dependent variable, controlling for the other independent variables in a model. Values of the odds ratios greater than 2.5 are considered to be the lower limits of a strong association (Fleiss, 1981). The p-value indicates the significance level of the association between an independent variable and a dependent variable. The p-value gives the probability of the statistical effect being due to chance. Therefore, a lower p-value is more significant. By convention, a p-value below .05 is considered a significant result. With small sample size, as in this study, a p-value below .10 may be considered marginally significant. In multivariate regressions, the beta in the table explains a direction and a magnitude of a predictor. The sign of the beta coefficient indicates the direction of the relationship between an independent variable and a dependent variable. The beta ranges from -1 to 1. A large absolute value indicates a stronger influence of an independent variable on a dependent variable. The meaning of the p-value is the same as in logistic regression. Table 20 presents a summary of the seven regression models and significant findings. These findings are discussed in greater detail in the sections that follow, and full regression models are presented. Automated Funding Service Use Automated deposit features in 529s are theorized to facilitate regular, and ultimately, higher savings for account owners. A regression is constructed in which Automated Funding Service (AFS) use is regressed on participant characteristics, account-related variables, and participant views. Results are presented in Table 21. The overall regression model is statistically significant. Age of the beneficiary has a statistically significant association with AFS use. As the age of the beneficiary increases by one year, the probability of account owners using AFS increases 1.15 times. In addition, there is a marginally significant association between the account owner view of automated deposits as the greatest influence on their making additional deposits in the NextGen plan and AFS use. Account owners with this view are 49 times more likely to use AFS than account owners who said other plan features (tax-free earnings, Annual Matching Grant, or investment selection from funds; see Table 13) are the greatest influence. Account owners with high expected total savings are more likely to use AFS, with marginal statistical significance. As expected, annual deposit frequency (since 1999) is positively associated with AFS use, given that AFS users make regular and ongoing deposits into the account while using AFS.
Center for Social Development Washington University in St. Louis
25
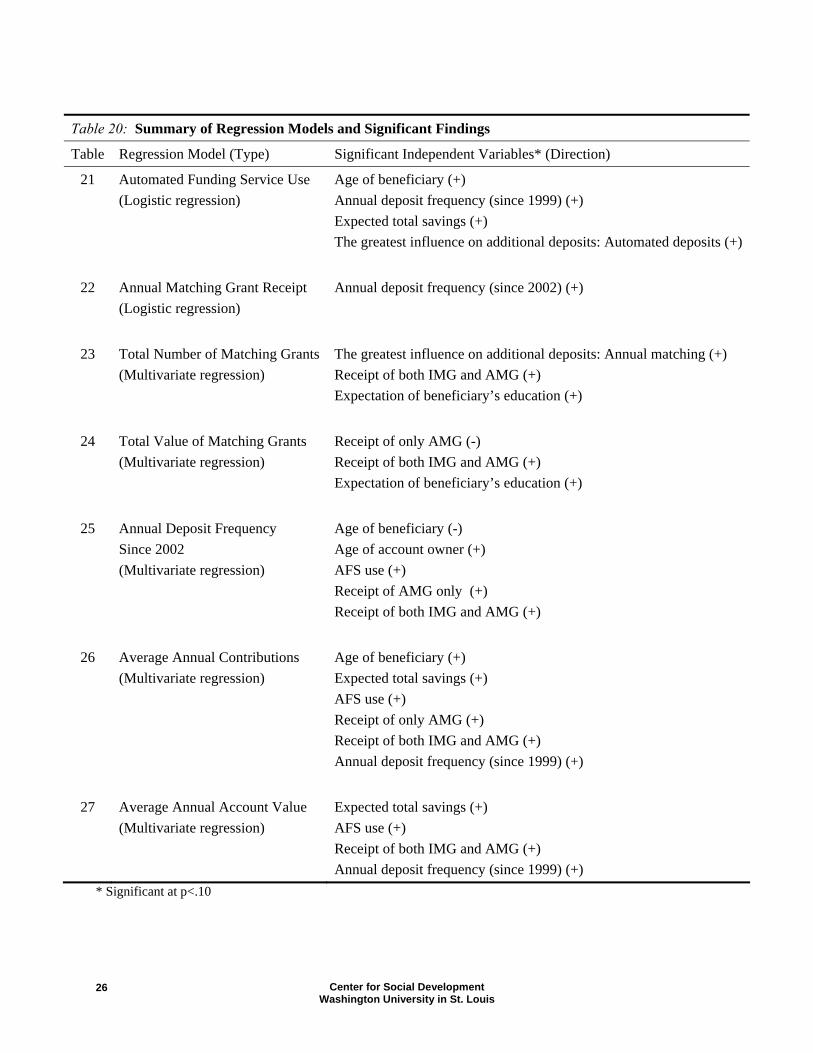
Table 20: Summary of Regression Models and Significant Findings
Table Regression Model (Type) Significant Independent Variables* (Direction)
21 Automated Funding Service Use (Logistic regression)
Age of beneficiary (+) Annual deposit frequency (since 1999) (+) Expected total savings (+) The greatest influence on additional deposits: Automated deposits (+)
22 Annual Matching Grant Receipt (Logistic regression)
Annual deposit frequency (since 2002) (+)
23 Total Number of Matching Grants (Multivariate regression)
The greatest influence on additional deposits: Annual matching (+) Receipt of both IMG and AMG (+) Expectation of beneficiary’s education (+)
24 Total Value of Matching Grants (Multivariate regression)
Receipt of only AMG (-) Receipt of both IMG and AMG (+) Expectation of beneficiary’s education (+)
25 Annual Deposit Frequency Since 2002 (Multivariate regression)
Age of beneficiary (-) Age of account owner (+) AFS use (+) Receipt of AMG only (+) Receipt of both IMG and AMG (+)
26 Average Annual Contributions (Multivariate regression)
Age of beneficiary (+) Expected total savings (+) AFS use (+) Receipt of only AMG (+) Receipt of both IMG and AMG (+) Annual deposit frequency (since 1999) (+)
27 Average Annual Account Value (Multivariate regression)
Expected total savings (+) AFS use (+) Receipt of both IMG and AMG (+) Annual deposit frequency (since 1999) (+)
* Significant at p<.10
Center for Social Development Washington University in St. Louis
26

AFS use is not significantly related to the account owner’s age, educational attainment, or household adjusted gross income. Although there may be a positive relationship between AFS use and AGI, the association is not statistically significant. It was expected that internet users would be more likely to use AFS than non-internet users, but a significant association is not found. Table 21: Predictors of Automated Funding Service Use (N=137)
Independent Variables Coefficient Odds Ratio p-valueAge of beneficiary 0.14 1.15 <.01Age of account owner -0.03 0.97 0.24Educational attainment of account owner Up to high school diploma or GED (reference) Some college, voc/tech, associate -0.43 0.65 0.69 Bachelor degree -0.67 0.51 0.56 More than Bachelor degree 0.22 1.25 0.84Adjusted gross income 0.30 1.35 0.19Age of account 0.19 1.21 0.57Number of NextGen accounts 0.06 1.06 0.80Portfolio type FAME Direct or Bank Direct (reference) Select 0.49 1.64 0.37Expected total savings 0.00 1.00 0.09Direct deposit of paycheck No (reference) Yes -0.05 0.95 0.94Internet use at home or work No (reference) Yes 0.86 2.37 0.38Receipt of matching grants Receipt of only IMG (reference) Receipt of only AMG -1.34 0.26 0.25 Receipt of both IMG and AMG -1.29 0.28 0.12The greatest influence on additional deposits Other program features* (reference) Automated deposits 3.89 48.92 0.07Annual deposit frequency (since 1999) 11.69 >999.99 <.001First year contributions -0.00 1.00 0.46χ2 (df) 73.32 (17) p-value <.001 * Other program features are AMG, tax-free earnings, and investment selection.
Center for Social Development Washington University in St. Louis
27

Annual Matching Grant Receipt The Annual Matching Grant (AMG) provides an incentive for account owners to save each year. Account owner receipt of at least one AMG is regressed on participant characteristics, account-related variables, participant views, AFS use, and control variables. Table 22 presents the results of this regression, and the overall model is statistically significant. Account owners with higher annual deposit frequency (since 2002) are about 65.81 times more likely to receive at least one AMG than account owners who deposit less frequently. There is no association between receipt of at least one AMG and any of the participant characteristics included in the model. These participant characteristics are age of the beneficiary, age of the account owner, relationship to the beneficiary, educational attainment, and adjusted gross income. In addition, AFS use is not significantly related to AMG receipt. Total Number of Matching Grants All account owners in the sample received at least one matching grant, a $200 IMG, and/or an AMG of varying amounts, prior to the survey. The total number of matching grants received is an indicator of Matching Grant Program participation as well as saving performance, since AMG receipt is a function of additional deposits in the account. The dependent variable is regressed on participant characteristics, account-related variables, participant views, AFS use, and control variables. Results for this regression are shown in Table 23. The model is statistically significant and explains about 74% of the variance in total number of matching grants received by account owners. Age of beneficiary, participant age, educational attainment, and adjusted gross income are not significantly associated with total number of matching grants received. In addition, average annual contributions is not significantly related to the number of matching grants received. Among the remaining variables, account owners with higher expectation of the beneficiary’s future education are likely to receive more matching grants. However, the association is marginally significant. Account owners who report that the AMG is the greatest influence on making additional deposits in NextGen are more likely to have a higher total number of matching grants received than those who reported other program features as the greatest influence (see Table 13). The type of matching grant received is significantly related to the total number of matching grants received. While those who received only an AMG do not have significant differences in the number of matching grants received than those receiving only the IMG, participants receiving both the IMG and an AMG have significantly more matching grants compared to those with only the IMG.
Center for Social Development Washington University in St. Louis
28
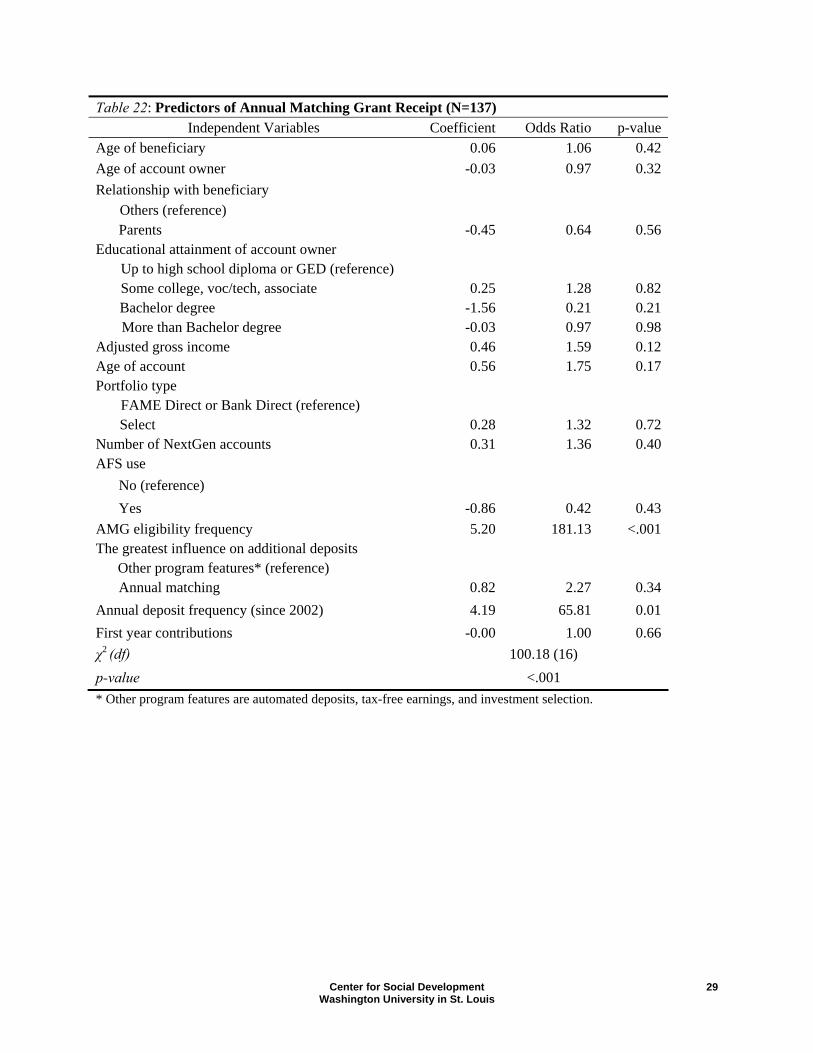
Table 22: Predictors of Annual Matching Grant Receipt (N=137) Independent Variables Coefficient Odds Ratio p-value
Age of beneficiary 0.06 1.06 0.42Age of account owner -0.03 0.97 0.32Relationship with beneficiary Others (reference) Parents -0.45 0.64 0.56Educational attainment of account owner Up to high school diploma or GED (reference) Some college, voc/tech, associate 0.25 1.28 0.82 Bachelor degree -1.56 0.21 0.21 More than Bachelor degree -0.03 0.97 0.98Adjusted gross income 0.46 1.59 0.12Age of account 0.56 1.75 0.17Portfolio type FAME Direct or Bank Direct (reference) Select 0.28 1.32 0.72Number of NextGen accounts 0.31 1.36 0.40AFS use No (reference) Yes -0.86 0.42 0.43AMG eligibility frequency 5.20 181.13 <.001The greatest influence on additional deposits Other program features* (reference) Annual matching 0.82 2.27 0.34Annual deposit frequency (since 2002) 4.19 65.81 0.01First year contributions -0.00 1.00 0.66χ2 (df) 100.18 (16) p-value <.001 * Other program features are automated deposits, tax-free earnings, and investment selection.
Center for Social Development Washington University in St. Louis
29

Table 23: Predictors of Total Number of Matching Grants (N=137) Independent Variables Beta p-value
Age of beneficiary 0.01 0.84Age of account owner -0.03 0.55Educational attainment of account owner Up to high school diploma or GED (reference) Some college, voc/tech, associate 0.00 0.95 Bachelor degree 0.02 0.80 More than Bachelor degree 0.03 0.66Adjusted gross income 0.02 0.61Account open 2002 or later No (reference) Yes 0.11 0.09The greatest influence on additional deposits Other program features* (reference) Annual matching 0.10 0.05Expectation of beneficiary’s education Graduate from vocational or trade school (reference) 4-year college degree 0.20 0.06 More than 4-year college degree 0.21 0.06Average annual contributions 0.04 0.75AFS use No (Reference) Yes 0.02 0.75Receipt of matching grants Receipt of only IMG (reference) Receipt of only AMG 0.01 0.90 Receipt of both IMG and AMG 0.44 <.001AMG eligibility frequency 0.65 <.001First year contributions 0.02 0.90F value (df) 24.79 (16) R2 0.7677 Adjusted R2 0.7367 p-value <.001 * Other program features are automated deposits, tax-free earnings, and investment selection. Total Value of Matching Grants Like total number of matching grants, the total value of matching grants is an indicator of participation in the Matching Grant Program and saving performance. This variable is also
Center for Social Development Washington University in St. Louis
30

regressed on participant characteristics, account-related variables, participant views, AFS use, and control variables. Table 24 presents the regression results. The model explains about 68% of the variance in total value of matching grants among account owners, and is statistically significant. Participant characteristics related to age, education and income are not associated with the total value of matching grants received. AFS use and average annual contributions are also not significantly related to the total value of matching grants received. Like the regression model on the total number of matching grants received, higher expectation of beneficiary’s future education is positively related to the total value of matching grants received, with marginal statistical significance. There are two noticeable differences compared to the previous model. First, account owners who report that the AMG is the greatest influence on making additional deposits in NextGen have no difference in the total value of matching grants received than with those who report other program features as the greatest influence. In addition, the type of matching grant received has different patterns. Compared to account owners who received only the IMG, those who received at least one AMG (but did not receive an IMG) have a significantly lower total value of matching grants. As expected, those who received both the IMG and at least one AMG have a significantly higher total value of matching grants than account owners who only received the IMG. Annual Deposit Frequency (since 2002) Annual deposit frequency (since 2002) measures how frequently account owners have made at least one annual deposit since the launch of the Matching Grant Program, as a percentage of the number of years the account was open from 2002 through 2005. Annual deposit frequency is regressed on participant characteristics, account-related variables, participant views and expectations, and AFS use. The model results are presented in Table 25. The regression is statistically significant, and the model explains about 37% of the variance. Age of the beneficiary and age of the account owner have statistically significant, but opposite, relationships with annual deposit frequency. Account owners with older beneficiaries are more likely to have a lower annual deposit frequency than those with younger beneficiaries. However, older account owners are more likely to have higher annual deposit frequency than younger account owners. As expected, account owners who use AFS are more likely to have a higher annual deposit frequency than those who do not use AFS. In addition, those who received at least one AMG (but not IMG) and those who received both the IMG and AMG are more likely to have a higher annual deposit frequency than account owners who only received the IMG. Relationship with beneficiary, participant race, education, and income are not associated with annual deposit frequency.
Center for Social Development Washington University in St. Louis
31

Table 24: Predictors of the Total Value of Matching Grants (N=137) Independent Variables Beta p-value
Age of beneficiary -0.00 0.98Age of account owner -0.03 0.55Educational attainment of account owner Up to high school diploma or GED (reference) Some college, voc/tech, associate -0.00 0.98 Bachelor degree -0.06 0.43 More than Bachelor degree -0.02 0.75Adjusted gross income 0.02 0.71Account open 2002 or later No (reference) Yes 0.14 0.06The greatest influence on additional deposits Other program features* (reference) Annual matching 0.02 0.71Average annual contributions 0.07 0.65Expectation of beneficiary’s education Graduate from vocational or trade school (reference) 4-year college degree 0.21 0.09 More than 4-year college degree 0.21 0.08AFS use No (reference) Yes 0.04 0.54Receipt of matching grants Receipt of only IMG (reference) Receipt of only AMG -0.26 <.01 Receipt of both IMG and AMG 0.43 <.001AMG eligibility frequency 0.53 <.001First year contributions -0.05 0.73F value (df) 19.28 (16) R2 0.7200 Adjusted R2 0.6826 p-value <.001 * Other program features are automated deposits, tax-free earnings, and investment selection.
Center for Social Development Washington University in St. Louis
32

Table 25: Predictors of the Annual Deposit Frequency Ratio (N=137) Independent Variables Beta p-value
Age of beneficiary -0.22 <.01Age of account owner 0.17 0.03Race of beneficiary White (reference) Others 0.11 0.12Relationship with beneficiary Others (reference) Parents -0.09 0.21Educational attainment of account owner Up to high school diploma or GED (reference) Some college, voc/tech, associate 0.13 0.22 Bachelor degree 0.10 0.40 More than Bachelor degree 0.15 0.17Adjusted gross income -0.02 0.75Importance of NextGen for beneficiary’s going to school Not very important and somewhat important (reference) Very important 0.02 0.79AFS use No (reference) Yes 0.43 <.001Number of NextGen accounts -0.04 0.59Receipt of matching grants Receipt of only IMG (reference) Receipt of only AMG 0.35 <.001 Receipt of both IMG and AMG 0.41 <.001First year contributions -0.07 0.30F value (df) 6.78 (14) R2 0.4377 Adjusted R2 0.3732 p-value <.001
Center for Social Development Washington University in St. Louis
33

Average Annual Contributions Average annual contributions measures gross account owner deposits, with consideration for the length of time the account has been open. In this regression, the dependent variable is logged to compress its distribution and then regressed on participant characteristics, account-related variables, participant views and expectations, and AFS use. Findings are presented in Table 26. The model explains about 58% of variance in average annual contributions and is statistically significant. Participant age, education and adjusted gross income are not associated with average annual contributions. In addition, there is no significant association between the view of tax-free earnings as the greatest influence on continued saving and average annual contributions. However, there is a marginally significant association between age of beneficiary and average annual contributions. Account owners with older beneficiaries are more likely to contribute larger average annual amounts to the account. AFS users are likely to save more in terms of average annual contributions. Annual deposit frequency (since 1999) and expected total savings both have positive and significant associations with average annual contributions. Compared to account owners who only received the IMG, those who received only an AMG are marginally more likely to have higher average annual contributions. Account owners who received an IMG and AMG are more likely to make higher average annual contributions than those who received only an IMG. Average Annual Account Value Average annual account value measures net account value, taking into consideration how long the account has been open. Net account value includes net contributions, net matching grant awards, and investment earnings or losses. Like average annual contributions, this variable is logged and regressed on participant characteristics, account-related variables, participant views and expectations, and AFS use. Table 27 presents the regression results. The model is statistically significant and explains about 42% of the variance in average annual account value. Findings are similar to the regression on average annual contributions, with some key differences. Participant age, income, and education of account owners are not significantly associated with the dependent variable. In this regression, beneficiary’s age is not a significant predictor of average annual account value. Similar to the previous model, AFS use and annual deposit frequency since 1999 have positive and significant associations with average annual account value. However, levels of significance change. While the significance level of AFS use increases, the influence of annual deposit frequency (since 1999) decreases. Influence of expected total savings also decreases and has a marginally significant association with average annual account value. In addition, account owners who received only the AMG have no difference in average annual account value with those who received just the IMG. Those with both the IMG and AMG are more likely to have higher average account value than those who received only the IMG.
Center for Social Development Washington University in St. Louis
34

Table 26: Predictors of Average Annual Contributions (N=137)
Independent Variables Beta p-valueAge of beneficiary 0.12 0.07Age of account owner 0.01 0.89Educational attainment of account owner Up to high school diploma or GED (reference) Some college, voc/tech, associate 0.08 0.35 Bachelor degree -0.07 0.47 More than Bachelor degree -0.04 0.67Adjusted gross income 0.10 0.13Annual deposit frequency (since 1999) 0.32 <.001The greatest influence on additional deposits Other program features* (reference) Tax-free earnings 0.06 0.29Importance of NextGen for beneficiary’s going to school Not very important and somewhat important (reference) Very important -0.04 0.51Number of NextGen account 0.04 0.47AFS use No (reference) Yes 0.18 0.01Expected total savings 0.17 <.01Receipt of matching grants Receipt of only IMG (reference) Receipt of only AMG 0.32 <.001 Receipt of both IMG and AMG 0.25 <.01First year contributions 0.42 <.001F value (df) 13.55 (15) R2 0.6268 Adjusted R2 0.5805 p-value <.001 * Other program features are AMG, automated deposits, and investment selection.
Center for Social Development Washington University in St. Louis
35

Table 27: Predictors of Average Annual Account Value (N=137)
Independent Variables Beta p-value Age of beneficiary 0.06 0.40Age of account owner -0.05 0.48Educational attainment of account owner Up to high school diploma or GED (reference) Some college, voc/tech, associate 0.11 0.27 Bachelor degree -0.11 0.31 More than Bachelor degree -0.00 0.96Adjusted Gross Income -0.01 0.83Annual deposit frequency (since 1999) 0.19 0.03The greatest influence on additional deposits Other program features* (reference) Tax-free earnings 0.04 0.59Importance of NextGen for beneficiary’s going to school Not very important and somewhat important (reference) Very important -0.11 0.12Number of NextGen accounts 0.09 0.22AFS use No (reference) Yes 0.27 <.01Expected total savings 0.13 0.09Receipt of matching grants Receipt of only IMG (reference) Receipt of only AMG 0.14 0.12 Receipt of both IMG and AMG 0.21 0.02First year contribution 0.44 <.001F value (df) 7.68 (15) R2 0.4879 Adjusted R2 0.4244 p-value <.001 * Other program features are AMG, automated deposits, and investment selection.
Center for Social Development Washington University in St. Louis
36
Discussion and Conclusions Who Is Saving in the NextGen Matching Grant Program? Results from the telephone survey indicate that individuals of different age, educational, and income backgrounds are participating in the NextGen Matching Grant Program.29 The program has attracted individuals ranging in age from 27 to 87. Most account owners are parents, but grandparents and others save through the program as well. While a majority of account owners have at least a college degree, some have a high school diploma or less. In addition, even very low-income families are saving in the program. Although different kinds of individuals are saving in the Matching Grant Program, a comparison of study participants with the general population of Maine shows that matching grant recipients are more educated. About 61% of account owners have at least a bachelor’s degree, compared to 26% of the Maine population over age 25. In addition, the homeownership rate for respondents in this study is 89%, compared to 73% in Maine overall. Median household income is similar between matching grant account owners and the general Maine population. Median household adjusted gross income (AGI) in this study is $40,000 to $50,000, and the median household income in Maine was $42,163 in 2004 (U.S. Census Bureau, 2006a). Given that the matching grant application has income eligibility requirements, it is expected that median household income in this study would be less than $50,000. Almost all account owners have very positive views about education and expectations for their 529 beneficiary. About 95% of all account owners say that education beyond high school is very important, and 91% say that education helps people find employment. In addition, 96% of account owners expect their beneficiary to receive at least a four-year college degree. These results may not be caused by the NextGen program, but instead may reflect self-selection into NextGen, as well as the relatively high educational attainment of study participants. Not all families in the United States share optimistic views and expectations for their children, and may be less likely to save for post-secondary education as a result. There is an opportunity for 529 savings plan sponsors to reach out to families who do not currently expect their children to complete college, in ways that may generate positive expectations about higher education and improve educational attainment (Zhan & Sherraden, 2003). Findings from the NextGen matching grant interviews suggest that the knowledge that savings are set aside for post-secondary education can positively impact a child’s grades in school and educational plans (Mason et al., 2006). In our view, the Matching Grant Program could reach a larger segment of Maine’s population. The 2005 income threshold for the program is $52,500, and approximately 59% of Maine households report 2004 income less than $50,000 (U.S. Census Bureau, 2006a).30 Individuals of different backgrounds are already saving for post-secondary education in NextGen. As of December 2004, at least 802 families had participated in the Matching Grant Program. 29 As expected, findings for race and ethnicity do not reflect the United States population, given that Maine’s general population is 98% Caucasian (U.S. Census Bureau, 2006a). 30 Not all households with income below $50,000 have reason to save for higher education.
Center for Social Development Washington University in St. Louis
37

Opening the Account and Continuing to Save The NextGen plan has provided access for a majority of account owners in the study to begin accumulating post-secondary education savings. Two-thirds of account owners had not saved in any way for their beneficiaries’ college education prior to enrolling in NextGen. NextGen provides information to potential participants via television, newspaper, radio, and more. Over half of account owners heard about NextGen from more than one source. As revealed in interviews, it may be important for low-to-moderate income families to hear multiple and repeated messages before deciding to open an account. NextGen should continue to reach out to prospective account owners in multiple ways. About one-third of matching grant participants (35%) learned about NextGen from a financial advisor, and the majority of study participants (61%) opened broker-sold Select portfolios through a financial advisor or broker affiliated with a bank. About 39% opened Direct portfolios through FAME or a NextGen distribution agent. In this study, 64% of assets are invested in Select portfolios, and 37% are invested in Direct portfolios. In all Maine accounts, assets are distributed almost evenly between the two portfolio types. Finally, in all NextGen accounts nationwide, 82% of assets are Select, and 18% are Direct (Finance Authority of Maine, 2006).31 Interestingly, whether a participant holds Direct or Select Series portfolios has no relationship with any measures of program or saving outcomes in this study. Future analyses could compare matching grant recipients who own Direct portfolios with all other Direct portfolio owners in Maine, to determine if an expansion in direct-marketed 529 savings plans could further increase participation among low-to-moderate income families. Some state 529 savings plans are only sold directly, without the assistance of a broker. Since the presence of a broker increases fees for participants, it will be important also to study low-to-moderate income families’ participation in other state plans. To open an account, NextGen requires a $250 minimum deposit, or $50 if the account owner is eligible and applies for the Initial Matching Grant (IMG), with a commitment to deposit an additional $200 within five years. The majority of account owners deposited more than the initial requirement of $50 in the first year, and most account owners continue to make regular contributions to NextGen, as reflected in the 81% mean annual deposit frequency finding. While the $50 minimum initial deposit, available only to IMG recipients, may be feasible for many families, this minimum is higher than opening deposits in many other states. Studies comparing states with lower deposit minimums with the NextGen plan might reveal whether these deposit requirements are a barrier to participation for some families. About 72% of account owners received the $200 IMG, and 73% of account owners received at least one Annual Matching Grant (AMG). Initial and Annual Matching Grant incentives are important features to account owners when enrolling in NextGen. Among those who have 31 Data for assets in all Maine and all nationwide NextGen accounts are as of December 2004. Brokers have targeted a national market in selling NextGen.
Center for Social Development Washington University in St. Louis
38
received an IMG, about 83% say the incentives were very or somewhat important in their decision to open an account. This telephone survey finding is highlighted by account owner comments in interviews. For one account owner, the availability of matching grants led her to “go to the bank and inquire about” NextGen. The financial incentive of tax-free earnings also emerges as an important feature to account owners. Almost all participants report knowing about the tax-free feature when opening the account, and about 98% say it was very or somewhat important in their decision to enroll in NextGen and in their decision to continue to save. This finding is noteworthy given that Matching Grant Program participants are medium to low income, and hence have less to gain from tax-free features than more wealthy 529 participants. Indeed, some matching grant participants receive no current tax benefit at all due to their low incomes. Perhaps they anticipate that their incomes may improve in the future and therefore have a positive view of the tax-free feature. The IMG appears to have strong influence on account owners saving in NextGen, cited by 73% of study participants as making saving easier. The AMG also appears to have strong influence on account owners continuing to save in NextGen, cited by 69% of study participants as making saving easier, and by 31% as having the greatest influence on making additional deposits. These results together provide strong support for targeted incentives in 529 savings plans. Given that tax incentives benefit the wealthy much more than others, it may appropriate in all 529 plans to “level the playing field” by providing targeted incentives in the form of IMGs and AMGs to parents or legal guardians (not extended family or others) with low to moderate incomes. It is in the public’s interest to promote educational achievement across the board. Participation in NextGen’s Automated Funding Service (AFS) can facilitate regular and increased savings among account owners. However, just one-third of matching grant recipients are using AFS. Remaining account owners give a variety of reasons for why they are not using automated deposits. After irregular pay (28%), the most frequently reported reason is that they do not know the feature is available (13%). The State of Maine can examine ways to increase AFS use by further promoting this plan feature. Maine can also consider lowering the $50 minimum monthly automatic investment required to use AFS, which is higher than the minimum in most other states and impedes some families from utilizing the service. In interviews, this barrier is discussed by 3 of the 10 interviewees. One account owner saving for more than one child said she would “jump right into it” and “immediately start saving” if the AFS minimum was lowered to $10 per month. Account owners in this study respond favorably to restrictions of 529 savings plans. About 88% say that the dedication of the account to the beneficiary’s education makes saving easier. In addition, the 10% penalty on earnings for non-qualified withdrawals does not appear to discourage most account owners from saving; 80% say this penalty has no effect on saving. In the words of one account owner, NextGen provides “a way to put money aside and not be able to get hold of it…” According to another, NextGen helps ensure “the money was going to be used
Center for Social Development Washington University in St. Louis
39

for education, and…wouldn’t be taken out and used for other petty things.” These results may be in response to state marketing aimed at saving for post-secondary education rather than solely on an investment product.
One area for future policy development might be greater use of federal and/or state income tax refunds or credits as a source of deposits into 529 savings. In this study, 91% of respondents say they do not use their state tax refund for NextGen deposits, and 85% say they do not use their federal tax refund for this purpose. Because saving is much easier from lump sums than from normal income streams, tax refund checks represent special opportunities to capture resources for future education. One tax proposal may include adding 529s to the list of savings products eligible for the Saver’s Credit. The Saver’s Credit currently provides a 50% match—in the form of a non-refundable tax credit—to low and moderate income people who contribute to a retirement account such as a 401(k) or IRA (Clancy & Parrish, 2006). Saving Performance Perhaps the most important results of this study are the simple facts that low-to-moderate income individuals save in NextGen, and save through the Matching Grant Program. In this study of matching grant participants, 46% report adjusted gross income below $40,000; 26% below $30,000; and 11% below $20,000. Moreover, income level is not statistically associated with saving performance when controlling for other factors. Although 56% of respondents agree with the statement that “all or most of your money purchases necessities,” and 36% agree that “it is hard to save enough to make a difference,” many of these same people are still saving in NextGen. How do account owners manage to save? Two of the highest ranking responses on NextGen saving strategies are: “shopped more carefully or bought generic or second hand items” (ranked first at 42%), and “resisted or delayed spending” (ranked third at 35%). Thus, self-report evidence indicates that greater consumption efficiency contributes to saving success among these Matching Grant Program participants. This thrift-oriented finding could be welcomed on both sides of the political aisle as a successful outcome of the Matching Grant Program. Results indicate that most Matching Grant Program participants are active savers, not one-time depositors. By self report, 75% of respondents deposit at least once per year. More than half (52%) report that they deposit several times a year or more; 24% report depositing monthly; and 7% bi-weekly. From NextGen savings and account data, the average annual deposit frequency is 81%. In addition, nine account owners (6%) made $50 first year deposits with subsequent year contributions (for a mean account value of $1,463), and 101 account owners (74%) made more than $50 first year deposits with subsequent year contributions (for a mean account value of $4,869). What can we learn from these saving patterns? The most important point is that about 80% of respondents are active savers in NextGen. If influencing regular saving or creating a “saving habit” is a policy goal, then NextGen seems to achieve this goal.
Center for Social Development Washington University in St. Louis
40

Total contributions are a mean of $3,430 and a median of $1,550 (median indicates that half are above and half are below this amount). The total Next Gen account value as of December 31, 2005 is a mean of $4,371 and a median of $2,221. Given the relatively short saving period (median 3 years) among this population of low-to-moderate income households, these savings amounts are not trivial, and not irrelevant to future educational opportunity. Perhaps more importantly, as savings are accumulating, both parents and child (if 529 savings are for a child’s education) are more likely to plan ahead for post-secondary education or training, and behave accordingly. At the end of the day, it is not only the money for education that matters, but also the cognitive changes and future orientation that savings can create (Sherraden, 1991). Given these results, it appears that low-to-moderate income families can and will respond positively to saving opportunities. Findings indicate successes in the level of engagement in saving, and also in amounts saved. Not every policy initiative to support low-to-moderate income families can claim such successes. The NextGen Matching Grant Program can be proud of these outcomes—yet it should not be satisfied. The challenge for 529 policy is to build on these successes and find ways to attract and include more families. What Explains Saving Performance? Through regression analyses we are able statistically to sort out various influences on saving outcomes, and discern more clearly what may explain saving performance among Matching Grant Program participants in NextGen. In this overall assessment of possible explanations of saving performance, we are most interested in pronounced associations and the strongest patterns in the data. In this regard, several results from the study are informative: First, it is noteworthy that, controlling for other factors, neither educational level nor income level is statistically associated with saving performance—on any of the outcome measures tested. This result would not be predicted by mainstream economic analysis, which focuses on individual characteristics. Instead, these results are more consistent with an institutional view of saving, wherein individuals respond to structured opportunities to save, particularly features such as access, information, incentives, facilitation, expectations, restrictions, and security (e.g., Sherraden and Barr, 2005), discussed previously. Related to this, we hypothesized that, as the number of accounts in one household increase, account owners are likely to make smaller contributions. However, the number of NextGen accounts is found to have no significant relationship to Average Annual Contributions or Average Annual Account Value. This unexpected finding may be another expression of the primacy of institutional characteristics (program features) over individual characteristics (in this case, resources for depositing). This is similar to the finding that income is unrelated to saving performance.
Center for Social Development Washington University in St. Louis
41

In our view, it is a very hopeful and inclusive result that key individual characteristics (including education level, income, and usually age) do not appear to affect participation and saving performance in the NextGen plan. These results suggest that the matching grant participants, regardless of these key personal characteristics, might benefit somewhat equally from program features of 529 saving plans. One individual characteristic may stand out. Age of the beneficiary is positively associated with saving performance in regression models where the outcomes are Automated Funding Service (AFS) Use and Average Annual Contributions. Perhaps these results reflect increased seriousness about saving as beneficiaries get closer to post-secondary education. (On the other hand, we do not have an explanation of why age of beneficiary is negatively associated with Annual Deposit Frequency.) Turning to NextGen Matching Grant Program features, receipt of both the IMG and AMG is positively associated with outcomes of interest in several regression models. These are the Total Number of Matching Grants, Total Value of Matching Grants, Annual Deposit Frequency, Average Annual Contributions, and Average Annual Account Value. These pronounced results strongly suggest that receipt of matching grants, controlling for many other factors, is associated with successes in NextGen savings. Some observers might opine that these results are nearly obvious, but really they are not. Indeed, it would be very possible for some savvy participants to accept the matching grants and then do little or nothing more in the way of additional saving, but this is not what we find. To be sure, we cannot conclude in this study that receipt of matching grants causes additional saving successes. (It could be that savings-oriented participants are also the ones who take most advantage of matching grants. Very likely the actual explanation is some of both.) Regardless, the results affirm that matching grant receipt is associated with additional savings. No one can conclude that Matching Grant Program participants are just taking the matching money and doing little else. Automated Funding Service (AFS) is positively linked to Annual Deposit Frequency, Average Annual Contributions, and Average Annual Account Value. These pronounced results strongly support the use of automated deposits. Internet users are hypothesized to have greater probability of employing AFS. However, in this study there is no statistically significant association between internet use and AFS use. Despite non-significance, however, internet users are 2.37 times more likely to use AFS. If the sample size for the study were larger, this relationship might prove to be statistically significant. Annual deposit frequency (either since 1999 or since 2002) is positively associated with AFS Use, Annual Matching Grant Receipt, Average Annual Contributions, and Average Annual Account Value. Not surprisingly, depositing matters. States sponsoring 529 plans may want to ask themselves how depositing, in every respect, can be encouraged. Turning to expectations of participants, we find that expected total savings is positively associated with AFS Use, Average Annual Contributions, and Average Annual Account Value. On one hand, these results may be a glimpse of the effects of cognition and future orientation on saving performance. On the other hand, it may be savings successes lead to more positive future
Center for Social Development Washington University in St. Louis
42

expectations. We cannot discern from these data, but very likely this causality works in both directions, which might be an example of a virtuous cycle of cognition and asset building outcomes (Yadama & Sherraden, 1996). Regarding another form of expectation, results suggest that expectation of beneficiary’s education is positively associated with Total Number of Matching Grants and Total Value of Matching Grants. Thus, it may be that educational expectations lead to more efficient use of matching grants, or perhaps the other way around. Again, we are unable to say based on these data. Directions for the Future In closing, we offer a few brief suggestions for future 529 savings plan policy and research. Turning first to policy, the first and most important point is that plan features matter. State 529 plans have beneficial features that are distinctive from other non-plan investments in reaching families of all income levels: (1) Public oversight of 529 plans may increase access to saving for low-to-moderate families through low minimum opening deposits, low minimum contribution requirements for automated deposits, and a marketing focus on saving for education rather than on an investment product. (2) The centralized custody of plan assets permits the accounting of a savings match, and tracking of contributions, investments, earnings, and some demographic information for all plan participants. This centralized system provides states the ability to assess state-resident participation and saving, and add appropriate incentives or marketing outreach to target under-represented segments of the state population. (3) Limited investment options allow families to focus on a set of funds to simplify enrollment and investment decisions. (4) Small accounts are viable because costs can be offset by large accounts within the same state plan. Regarding inclusion, this last feature of savings plans may be the most important of all. Since matching incentives, especially initial and annual grants together, appear strongly to influence saving performance, one area for future policy development might be greater use of federal and/or state income tax refunds or credits as a source of deposits into 529 savings. It may be desirable to ask what matching grant awards might lead to the most effective use of public funds and greater post-secondary education savings for low-to-moderate income families. For example, what information and outreach strategies might increase the use of matching grants? What is the ideal income, relationship to the beneficiary, or other eligibility criteria for matching? Could online submission of matching grant applications further facilitate receipt and distribution of these awards? Sherraden, Schreiner and Beverly (2003) point to facilitation as a key feature of most contractual saving programs. A key type of facilitation in 529 savings plans is automated contributions, through which account owners make deposits very conveniently. Since AFS use is positively related to Annual Deposit Frequency, Average Annual Contributions, and Average Annual Account Value, it appears to be one of the crucial factors influencing saving performance. Given the importance of Automated Funding Service (AFS) in this study, policymakers and state plan sponsors might ask how to increase AFS use among 529 savings plan participants. The logistic regression finds that beneficiary’s age, expected total savings, and perception of automated
Center for Social Development Washington University in St. Louis
43

deposits influence on additional deposits are significant factors. These may provide clues to increasing AFS use. Turning to research, our main point is that more is needed. At minimum, states should review existing account and savings data to inform their plan administration. In order to assess how the NextGen Matching Grant Program expands access and use of 529s, future research could compare matching grant recipients to all other NextGen account owners, and all NextGen account owners to participants in other 529 savings plans. Such comparisons would require Maine and other states to gather additional demographic information about account owners at enrollment, to lay the groundwork for cross-plan and cross-state comparisons. This study may be the most detailed analysis of any group of 529 participants in the United States. Given the importance of post-secondary education, the increasing difficulty that many families face in affording higher education, and the widespread use of 529 plans, the current low level of research knowledge is a drag on policy and program improvements. As can be seen from the results of this one study, research can inform and point to key areas for policy and program improvement. The research agenda on 529s—especially related to inclusive features—should be expanded. One key area for research will be the potential use of inclusive 529 features as a model platform for a universal children’s savings account policy in the United States. Testing this potential through systematic research should be a high priority.
Center for Social Development Washington University in St. Louis
44
References Agnew, J. & Szykman, L. R. (2004). Asset allocation and information overload: the influence of
information display, asset choice and investment experience (Working Paper 2004-15). Chestnut Hill, MA: Boston College, Center for Retirement Research.
Aizcorbe, A. M., Kennickell, A. B. & Moore, K. B. (2003). Recent changes in U.S. family
finances: evidence from the 1998 and 2001 Survey of Consumer Finances. Federal Reserve Bulletin 89(1), 1-37.
Bauman, K. J. & Graf, N. L. (2003). Educational attainment: 2000. Census 2000 Brief, C2KBR-
24, 1-12. Beverly, S. G. & Sherraden, M. (1999). Institutional determinants of saving: implications for
low-income households and public policy. Journal of Socio-Economics 28, 457-473. Chaker, A. M. (2006, February 28). 529 plans lose their luster. Wall Street Journal, p. D1. Clancy, M., & Parrish, L. (2006). Improving the effectiveness of 529 college savings plans.
Washington, DC: New America Foundation. http://www.assetbuilding.org/AssetBuilding/Download_Docs/Doc_File_1443_1.pdf
Clancy, M., Cramer, R. & Parrish, L. (2005). Section 529 saving plans, access to post-secondary
education, and universal asset-building. Washington, DC: New America Foundation. http://www.newamerica.net/Download_Docs/pdfs/Doc_File_2246_1.pdf
Clancy, M., Orszag, P. & Sherraden, M. (2004). College savings plans: a platform for inclusive
saving policy? St. Louis, MO: Washington University, Center for Social Development. http://gwbweb.wustl.edu/csd/Publications/2004/Perspective-529andInclusion.pdf
Clancy, M. & Sherraden, M. (2003). The potential for inclusion in 529 savings plans: report on
a survey of states (CSD Report). St. Louis, MO: Washington University, Center for Social Development. http://gwbweb.wustl.edu/csd/Publications/2003/ResearchReport-529savingsplansurvey.pdf
College Board (2005a). Trends in college pricing. Washington, DC: Author. College Board (2005b). Trends in student aid. Washington, DC: Author. Day, J. C. & Newburger, E. C. (2002). The big payoff: educational attainment and synthetic
estimates of work-life earnings. Current Population Reports P23-210, 2-13. Dohm, A. & Wyatt, I. (2002). College at work: outlook and earnings for college graduates, 2000-
2010. Occupational Outlook Quarterly 46(3), 3-15.
Center for Social Development Washington University in St. Louis
45

Ferguson, S. (2004). Increasing Participation in Your 529 Plan: Grassroots Marketing & Non-paid Media. Presentation at the National Association of State Treasurers (NAST) Treasury Management Conference, Scottsdale, Arizona.
Finance Authority of Maine (2006). NextGen college savings plan data. Augusta, ME: Author. Fleiss, J. (1981). Statistical Methods for Rates and Proportions. New York: John Wiley. Giegerich, S. (2005). Dreams detoured: rising college costs alter plans and threaten futures.
Lumina Foundation Focus, Fall 2005, 2-20. Hurley, J. F. (2002). The Best Way to Save for College. Pittsford, NY: BonaCom Publications. Hurley, J. F. (2006). 529 program assets rise 31% in 2005. Retrieved March 21, 2006 from
http://www.savingforcollege.com/529_news/index.php?page=plan_news&plan_news_id=596
Investment Company Institute (2003). Profile of households saving for college. Washington, DC:
Author. Mason, L. R., Clancy, M., Sherraden, M. & Han, C. (2006). Saving for college in Maine’s
Matching Grant Program: account owner experiences (CSD Research Report 06-04). St. Louis, MO: Washington University, Center for Social Development. http://gwbweb.wustl.edu/csd/Publications/2006/RP06-04.pdf
McNeil, J. (1998). Changes in median household income. Current Population Reports, P23-196,
1-9. National Center for Education Statistics (2005). The condition of education 2005, NCES 2005-
094. Washington, DC: US Government Printing Office. National Center for Public Policy and Higher Education (2002). Losing ground: a national status
report on the affordability of higher education. San Jose, CA: Author. National Center for Public Policy and Higher Education (2004). Measuring up 2004: the
national report card on higher education. San Jose, CA: Author. Parrish, L. (2004). Building assets through post-secondary education: policy recommendations
to broaden access to higher education for low-income Americans. Washington, DC: New America Foundation.
Roth, A. P. (2001). Saving for College and the Tax Code: A New Spin on the “Who Pays for
Higher Education?” Debate. New York: Garland Publishing, Inc. Schreiner, M. & Sherraden, M. (2005). IDAs and drop-out: prediction and prevention. Financial
Services Review, 14(1): 37-54.
Center for Social Development Washington University in St. Louis
46

Center for Social Development Washington University in St. Louis
47
Sherraden, M. (1991). Assets and the Poor. New York: M.E. Sharpe, Inc. Sherraden, M. & Barr, M. S. (2005). Institutions and inclusion in saving policy. In N. Retsinas &
E. Belsky (Eds.), Building Assets, Building Credit: Creating Wealth in Low-Income Communities. Washington, DC: Brookings Institution Press.
Sherraden, M., Schreiner, M. & Beverly, S. (2003). Income, institutions, and saving performance
in Individual Development Accounts. Economic Development Quarterly, 17(1), 95-112. U.S. Census Bureau. (2006a). 2004 American community survey. Retrieved from
http://factfinder.census.gov/servlet/DatasetMainPageServlet?_program=ACS&_submenuId=datasets_2&_lang=en&_ts=
U.S. Census Bureau. (2006b). Census 2000 summary file 3. Retrieved from
http://factfinder.census.gov/home/saff/main.html?_lang=en Yadama, G., & Sherraden, M. (1996). Effects of assets on attitudes and behaviors: Advance test
of a social policy proposal. Social Work Research, 20(1), 3-11. (Reprinted in Social policy: Reform, research, and practice, by P. Ewalt, et al., Eds., 1997, Washington, DC: NASW Press; and in Community building: Renewal, well-being, and shared responsibility, pp. 58-70, P. Ewalt, et al., Eds., 1998, Washington, DC: NASW Press)
Zhan, M. & Schreiner, M. (2004). Saving for post-secondary education in Individual
Development Accounts (CSD Working Paper 04-11). St. Louis, MO: Washington University, Center for Social Development. http://gwbweb.wustl.edu/csd/Publications/2004/WP04-11.pdf
Zhan, M. & Sherraden, M. (2003). Assets, expectations, and children’s educational achievement
in female-headed households. Social Service Review, 77(2), 191-211.

Center for Social Development Washington University in St. Louis
48
Appendix A
State 529 Savings Plans Lowest Minimum Contribution Levels* for New Account Owners
State Automatic Investment**
Initial Investment State Automatic
Investment** Initial
Investment
Nebraska $0.00 $0.00 Virginia*** $25.00 $25.00
Utah $0.00 $0.00 North Dakota**** $25.00 $30.00
North Carolina $5.00 $5.00 Indiana $25.00 $50.00
Louisiana $10.00 $10.00 District of Columbia $25.00 $100.00
Hawaii $15.00 $15.00 Alabama $25.00 $250.00
Ohio $15.00 $15.00 Florida $25.00 $250.00
California $15.00 $25.00 Maryland $25.00 $250.00
Colorado $15.00 $25.00 New Mexico $25.00 $250.00
Connecticut $15.00 $25.00 Oregon $25.00 $250.00
Georgia $15.00 $25.00 Arizona $25.00 $500.00
Idaho $15.00 $25.00 Kansas $25.00 $500.00
Illinois $15.00 $25.00 Alaska $50.00 $250.00
Kentucky $15.00 $25.00 Arkansas $50.00 $250.00
Michigan $15.00 $25.00 Maine***** $50.00 $250.00
Minnesota $15.00 $25.00 Nevada $50.00 $250.00
Mississippi $15.00 $25.00 New Jersey $50.00 $250.00
Missouri $15.00 $25.00 Rhode Island $50.00 $250.00
New York $15.00 $25.00 South Carolina $50.00 $250.00
Tennessee $15.00 $25.00 South Dakota $50.00 $250.00
Texas $15.00 $25.00 Wyoming $50.00 $250.00
Vermont $15.00 $25.00 Delaware $50.00 $500.00
Oklahoma $15.00 $100.00 Montana $50.00 $500.00
West Virginia $15.00 $100.00 Massachusetts $50.00 $1,000.00
Wisconsin $15.00 $250.00 New Hampshire $50.00 $1,000.00
Iowa $25.00 $25.00 Pennsylvania $50.00 $1,000.00* If a state offers more than one 529 savings plan, the plan requiring the lowest contribution is reported. ** Initial investment is waived if commitment is made to monthly investment through automatic contributions. *** Virginia requires a $250 minimum account balance in the first 12 months of participation. **** Account is subject to termination if the account balance is not $300 after 12 months. ***** The initial minimum investment is $50 with application for Maine’s $200 Initial Matching Grant and satisfaction of income eligibility requirements. Source: The online resource SavingforCollege.com

Center for Social Development Washington University in St. Louis
49
Appendix B
Access for Low-Income Families: Comparison of 529 and IRA Minimum Contribution Levels for New Account Owners at Selected Providers
529 Savings Plan IRA
Initial Investment
Monthly Commitment*
Initial Investment
Monthly Commitment*
TIAA-CREF $25 $15 $2,500 $25
Vanguard $25 $25 $3,000 Not allowed**
Merrill Lynch $250 $50 $250 $50
Fidelity $1,000 $50 $2,500 $200 * Initial investment is waived if commitment is made to monthly investment through automatic contributions. ** Vanguard does not allow new account holders to contribute via an automatic investment without an initial investment.

Center for Social Development Washington University in St. Louis
50
Appendix C State 529 Savings Plan Matching Grant Programs
State and Plan Name Funding Match Criteria Eligibility Application Method Matching Account Distribution and Forfeiture
Provisions Colorado Subject to
annual appropriation; first come, first served
$1 to $1 match up to $500/year for a maximum of 5 years
Income of up to 200% of poverty; dependent beneficiary must not be older than 12 at the time of initial application.
Application can be made February 1-May 15 for the previous calendar year contributions. Must submit application and federal income tax return or similar evidence of income only in years which applicant wants to receive a match.
Matches go to separate account, owned by CollegeInvest and set up in the beneficiary’s name.
CollegeInvest makes payment directly to a higher education institution based on beneficiary request. Matching funds will be revoked if beneficiary fails to make a qualified withdrawal by approximately age 22.
Louisiana
Subject tosufficient appropriations from the state legislature. The match rate may be reduced, if needed.
2%-14% match All state residents are eligible for at least a 2% match, but the match rate is progressive, based on adjusted gross income. For example, residents with AGI up to $29,999 are eligible for a 14% match.
The state reviews tax return filed for the prior year or the accountholder can submit their return. The accountholder can provide notarized proof of income and proof that tax filing was not required. Otherwise, accountholder will receive the minimum 2% match rate.
Earning enhancement is credited directly to the accountholder.
If savings used for a non-designated purpose, the state will recover the earning enhancements and the interest accrued from those matching funds.
Maine User feescharged to national accountholders. Terms and availability can change at any time.
With $50 deposit, $200 Initial Match (provides $250 required to open account). With min. $50 deposit in calendar year, Annual Match of 50% of contributions, up to $200/year.
Family adjusted gross income of $52,500 or less (adjusted annually through the Consumer Price Index).
Application for initial $200 match can be made up to one full year after account opened. Application for annual match can be made through 12/31 for the previous calendar year. Participants self-certify income; the Finance Authority of Maine (FAME) audits income eligibility through Maine Revenue Services.
Matches go to participant account, although owned and invested by FAME, and set up in the beneficiary’s name.
After waiting for at least twelve months from when the beneficiary receives a match, they may apply for matching funds to be used to pay for qualified expenses. There is no minimum waiting period to apply for use of annual matching funds.
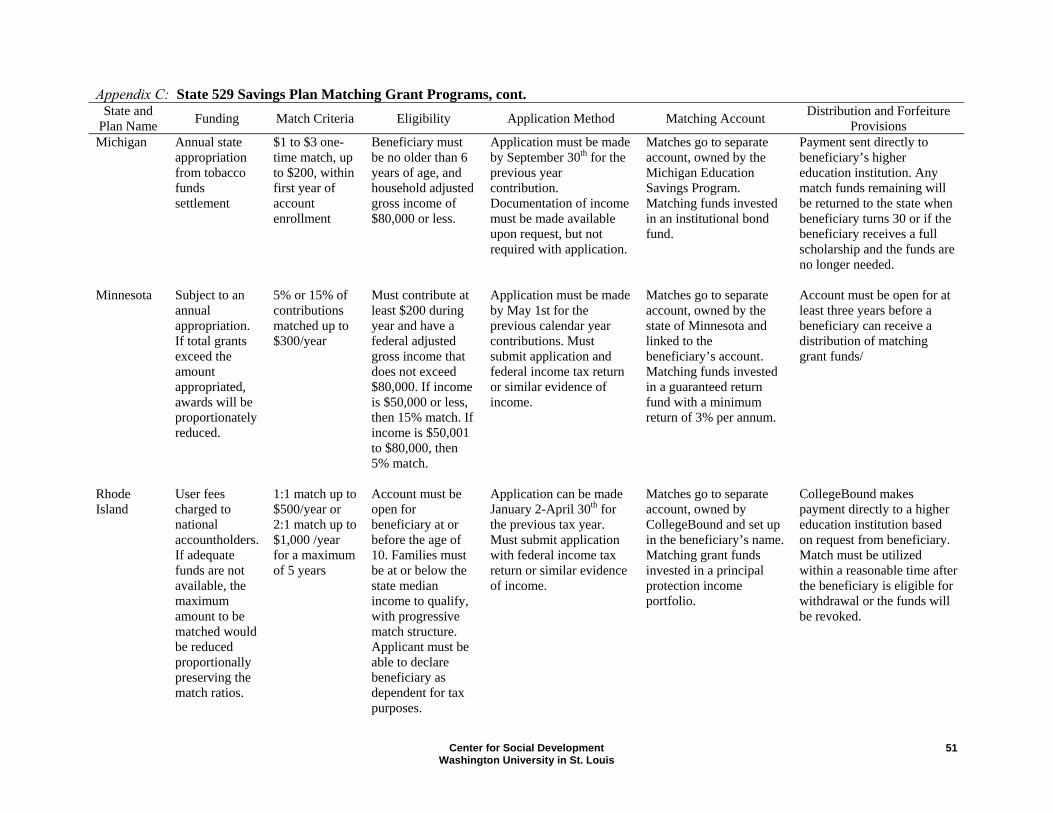
Center for Social Development Washington University in St. Louis
51
Appendix C: State 529 Savings Plan Matching Grant Programs, cont.
State and Plan Name Funding Match Criteria Eligibility Application Method Matching Account Distribution and Forfeiture
Provisions Michigan Annual state
appropriation from tobacco funds settlement
$1 to $3 one-time match, up to $200, within first year of account enrollment
Beneficiary must be no older than 6 years of age, and household adjusted gross income of $80,000 or less.
Application must be made by September 30th for the previous year contribution. Documentation of income must be made available upon request, but not required with application.
Matches go to separate account, owned by the Michigan Education Savings Program. Matching funds invested in an institutional bond fund.
Payment sent directly to beneficiary’s higher education institution. Any match funds remaining will be returned to the state when beneficiary turns 30 or if the beneficiary receives a full scholarship and the funds are no longer needed.
Minnesota Subject to an annual appropriation. If total grants exceed the amount appropriated, awards will be proportionately reduced.
5% or 15% of contributions matched up to $300/year
Must contribute at least $200 during year and have a federal adjusted gross income that does not exceed $80,000. If income is $50,000 or less, then 15% match. If income is $50,001 to $80,000, then 5% match.
Application must be made by May 1st for the previous calendar year contributions. Must submit application and federal income tax return or similar evidence of income.
Matches go to separate account, owned by the state of Minnesota and linked to the beneficiary’s account. Matching funds invested in a guaranteed return fund with a minimum return of 3% per annum.
Account must be open for at least three years before a beneficiary can receive a distribution of matching grant funds/
Rhode Island
User fees charged to national accountholders. If adequate funds are not available, the maximum amount to be matched would be reduced proportionally preserving the match ratios.
1:1 match up to $500/year or 2:1 match up to $1,000 /year for a maximum of 5 years
Account must be open for beneficiary at or before the age of 10. Families must be at or below the state median income to qualify, with progressive match structure. Applicant must be able to declare beneficiary as dependent for tax purposes.
Application can be made January 2-April 30th for the previous tax year. Must submit application with federal income tax return or similar evidence of income.
Matches go to separate account, owned by CollegeBound and set up in the beneficiary’s name. Matching grant funds invested in a principal protection income portfolio.
CollegeBound makes payment directly to a higher education institution based on request from beneficiary. Match must be utilized within a reasonable time after the beneficiary is eligible for withdrawal or the funds will be revoked.

Center for Social Development Washington University in St. Louis
52
Appendix C: State 529 Savings Plan Matching Grant Programs, cont. State and
Plan Name Funding Match Criteria Eligibility Application Method Matching Account Distribution and Forfeiture Provisions
Utah* Stateappropriation for matches to families participating in this pilot program
1:1 match up to $300/year for a maximum of 4 years or until high school graduation, whichever comes first
Income up to 200% of poverty or eligible for TANF, must commit to saving at least $25/month in an Option 1 UESP account (money market fund).
Must submit copies of past two income tax returns, proof of TANF participation (if applicable), or equivalent documentation.
Matches go to separate account owned by the Utah Educational Savings Plans and set up in the beneficiary’s name.
Beneficiary gains access to matching funds once enrolled in college. Funds paid directly to the higher education institution.
* This is currently a pilot demonstration project. In the first phase, 50 families will be able to take advantage of the match. Phase two will include 100 additional families. After this, an assessment will be conducted to determine whether to continue or expand the program. Source: Table prepared by Leslie Parrish, New America Foundation, and Margaret Clancy, Center for Social Development, using individual state information and the online resource SavingforCollege.com.

Appendix D
Maine NextGen College Investing Plan Matching Grant Telephone Survey
A. Introduction Hello, this is (CALLER NAME), from Washington University in St. Louis. May I speak to (NAME FROM ROSTER)? {ONCE R IS ON PHONE} Hello, this is (CALLER NAME), calling from Washington University in St. Louis. A little while ago you agreed to participate in a research study of NextGen College Investing Plan participants. We are interviewing people in Maine because we want to learn what works and what doesn’t work in the NextGen program. Our interview with you and other account holders will help us understand this better. The interview will take about 20 minutes. For your time, you will be paid $25. Do you have time now?
YES NO SCHEDULE CALLBACK WANT TO THINK ABOUT IT SCHEDULE CALLBACK NOT AVAILABLE NOW SCHEDULE CALLBACK REF
{IF REF} Thank you for you time. Would you like a phone number in case you change your mind? (1-877-660-9072) {IF CALLBACK} What day and time would be good for me to call back?
Date: __/__/__; Time: ___: ___ am/pm [NOTE: ENTER CENTRAL TIME INTO SYSTEM; R IS IN THE ET ZONE.] Thank you. We will call back then. INTERVIEWER INITIALS {XXX}
Before we begin, I would like to tell you a few things:
1. I’m going to ask you questions about different topics, but most of the questions will be about the NextGen program;
2. Your decision to be part of this study and the answers you give will not affect any services you receive from the Finance Authority of Maine;
3. Your responses are very important, but you don’t have to answer questions you don’t want to, and you are free to end the interview at any time;
4. All personal information you give us is confidential.
If you have any questions about your rights in this research, I can give you a telephone number to call for the office that oversees research at Washington University. [PROMPT: If respondent wants, give number for WU HHSC]
Center for Social Development 53Washington University in St. Louis

B. Education Let’s begin by talking about (BENEFICIARY), your account beneficiary. 1. What is your relationship to (BENEFICIARY)?
[NOTE: DO NOT READ LIST] MOTHER FATHER STEPMOTHER STEPFATHER GRANDMOTHER GRANDFATHER GREAT GRANDMOTHER GREAT GRANDFATHER SISTER/STEPSISTER BROTHER/STEPBROTHER OTHER RELATIVE OR IN-LAW
FOSTER PARENT OTHER NON-RELATIVE (ADULT) OTHER NON-RELATIVE (CHILD) R’S HUSBAND R’S WIFE R’S PARTNER R’S NIECE R’S NEPHEW SELF OTHER (Specify:_____________) DK
REF 2. {IF R IS NOT MOTHER, FATHER, HUSBAND, WIFE, PARTNER OR SELF}
Are you (BENEFICIARY’S) legal guardian? YES NO
DK REF
3. In the future, do you expect (BENEFICIARY’S) financial situation will be…?
BETTER THAN YOURS, ABOUT THE SAME AS YOURS WORSE THAN YOURS
DK REF
Now I’d like to ask you some questions about education. In this survey, when I say school or education, I’m referring to education beyond high school. 4. How far in school do you expect (BENEFICIARY) to go? [PROMPT: READ CATEGORIES IF NECESSARY.]
GRADUATE FROM VOCATIONAL OR TRADE SCHOOL ATTEND SOME COLLEGE 2-YEAR COLLEGE DEGREE 4-YEAR COLLEGE DEGREE
STUDY BEYOND A 4-YEAR COLLEGE DEGREE OTHER (Specify: ___________________) DK RE
5. How important is the NextGen account to (BENEFICIARY) going to school? Is it…?
VERY IMPORTANT SOMEWHAT IMPORTANT NOT VERY IMPORTANT
DK REF
Center for Social Development Washington University in St. Louis
54

6. In general, do you think education beyond high school is…? VERY IMPORTANT SOMEWHAT IMPORTANT NOT VERY IMPORTANT
DK REF
For each of the following questions, please answer whether you think education beyond high school helps a great deal, somewhat, or not at all. 7. How much do you think education helps to improve the chances of finding a job?
A GREAT DEAL SOMEWHAT NOT AT ALL
DK REF
8. Improve performance on the job?
A GREAT DEAL SOMEWHAT NOT AT ALL
DK REF
9. Improve the chances of getting a promotion?
A GREAT DEAL SOMEWHAT NOT AT ALL
DK REF
10. Improve the ability to make a job or career change?
A GREAT DEAL SOMEWHAT NOT AT ALL
DK REF
C. Maine NextGen Account I would like to ask some questions about specific features of your NextGen account. 11. How did you learn about Maine’s NextGen account? [NOTE: SELECT ALL THAT APPLY] [PROMPT: READ CATEGORIES IF NECESSARY.] [PROMPT: Anywhere else?]
EMPLOYER BANK OR CREDIT UNION ACCOUNTANT OR ATTORNEY FINANCIAL ADVISER FRIEND OR FAMILY MEMBER TELEVISION RADIO MAGAZINE
NEWSPAPER STATE OF MAINE WEBSITE NEXTGEN PRINT AD OR FLYER EVENT OR SEMINAR OTHER (SPECIFY: ________________) DK REF
11A. In what year did you open (BENEFICIARY’S) NextGen account?
__________________ YEAR ACCOUNT OPENED
DK REF
Center for Social Development 55Washington University in St. Louis

12. How did you open (BENEFICIARY’S) NextGen account? Did you use…? NEXTGEN ENROLLMENT KIT FROM FAME NEXTGEN ENROLLMENT KIT FROM A BANK OR OTHER FINANCIAL INSTITUTION APPLICATION DOWNLOADED FROM THE INTERNET FINANCIAL ADVISER WHO PROVIDED ENROLLMENT FORM OTHER (SPECIFY: _______________) DK REF
13. Did you receive a $200 initial matching grant from FAME?
YES GO TO Q25 NO GO TO Q26
DK GO TO Q26 REF GO TO Q26
14. {IF YES TO Q24} How important was this initial matching grant in your decision to
open a NextGen account? Would you say…? VERY IMPORTANT SOMEWHAT IMPORTANT NOT VERY IMPORTANT
DK REF
15. When you decided to open your NextGen account, did you know that investment
earnings would be tax free if used for education? YES GO TO Q22 NO GO TO Q23
DK GO TO Q23 REF GO TO Q23
16. {IF YES TO Q21} Thinking back to when you signed up, how important was this tax-
free feature in your decision to open a NextGen account? Would you say…? VERY IMPORTANT SOMEWHAT IMPORTANT NOT VERY IMPORTANT
DK REF
17. And now, how important is this tax-free feature in your decision to continue saving in
your NextGen account? Would you say…? VERY IMPORTANT SOMEWHAT IMPORTANT NOT VERY IMPORTANT
DK REF
18. Since your NextGen account was opened, how often would you say you have typically
made deposits? [NOTE: DO NOT READ LIST]
WEEKLY BI WEEKLY MONTHLY SEVERAL TIMES A YEAR ONCE A YEAR
A SINGLE CONTRIBUTION OTHER METHOD (Specify: __________________) DK REF
Center for Social Development Washington University in St. Louis
56
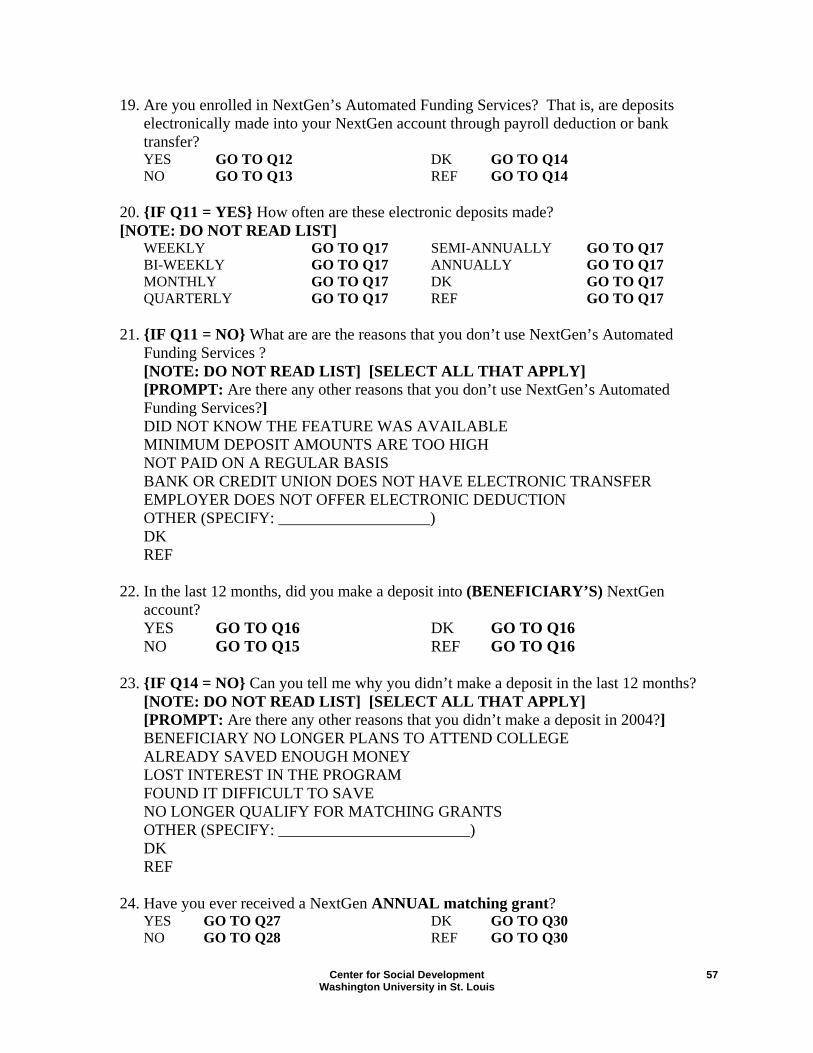
19. Are you enrolled in NextGen’s Automated Funding Services? That is, are deposits electronically made into your NextGen account through payroll deduction or bank transfer? YES GO TO Q12 NO GO TO Q13
DK GO TO Q14 REF GO TO Q14
20. {IF Q11 = YES} How often are these electronic deposits made? [NOTE: DO NOT READ LIST]
WEEKLY GO TO Q17 BI-WEEKLY GO TO Q17 MONTHLY GO TO Q17 QUARTERLY GO TO Q17
SEMI-ANNUALLY GO TO Q17 ANNUALLY GO TO Q17 DK GO TO Q17 REF GO TO Q17
21. {IF Q11 = NO} What are are the reasons that you don’t use NextGen’s Automated
Funding Services ? [NOTE: DO NOT READ LIST] [SELECT ALL THAT APPLY] [PROMPT: Are there any other reasons that you don’t use NextGen’s Automated Funding Services?] DID NOT KNOW THE FEATURE WAS AVAILABLE MINIMUM DEPOSIT AMOUNTS ARE TOO HIGH NOT PAID ON A REGULAR BASIS BANK OR CREDIT UNION DOES NOT HAVE ELECTRONIC TRANSFER EMPLOYER DOES NOT OFFER ELECTRONIC DEDUCTION OTHER (SPECIFY: ___________________) DK REF
22. In the last 12 months, did you make a deposit into (BENEFICIARY’S) NextGen
account? YES GO TO Q16 NO GO TO Q15
DK GO TO Q16 REF GO TO Q16
23. {IF Q14 = NO} Can you tell me why you didn’t make a deposit in the last 12 months?
[NOTE: DO NOT READ LIST] [SELECT ALL THAT APPLY] [PROMPT: Are there any other reasons that you didn’t make a deposit in 2004?] BENEFICIARY NO LONGER PLANS TO ATTEND COLLEGE ALREADY SAVED ENOUGH MONEY LOST INTEREST IN THE PROGRAM FOUND IT DIFFICULT TO SAVE NO LONGER QUALIFY FOR MATCHING GRANTS OTHER (SPECIFY: ________________________) DK REF
24. Have you ever received a NextGen ANNUAL matching grant?
YES GO TO Q27 NO GO TO Q28
DK GO TO Q30 REF GO TO Q30
Center for Social Development 57Washington University in St. Louis

25. {IF Q26 = YES} Are you currently in the NextGen annual matching program? That is, did you apply or do you plan to apply for the annual grant based on deposits made in 2004? YES GO TO Q29 NO GO TO Q28
DK GO TO Q28 REF GO TO Q28
26. Can you tell me why you do not currently receive the NextGen annual matching grant?
[SELECT ALL THAT APPLY] [NOTE: DO NOT READ LIST] CANNOT SAVE GO TO Q30 DID NOT APPLY FOR THE ANNUAL GRANT GO TO Q30 $200 MINIMUM CONTRIBUTION IS TOO HIGH/ DIDN’T SAVE ENOUGH GO TO Q30 INCOME TOO HIGH TO QUALIFY GO TO Q30 NEW ACCOUNT/NOT YET ELIGIBLE GO TO Q30 OTHER (Specify: _______________) GO TO Q30 DK GO TO Q30 REF GO TO Q30
27. How important is the annual matching grant in your decision to continue saving in
your NextGen account? Is it…? VERY IMPORTANT SOMEWHAT IMPORTANT NOT VERY IMPORTANT
DK REF
28. I am going to read a list of NextGen Plan features. Please choose the feature that has the
GREATEST INFLUENCE on your decision to make additional deposits. [NOTE: Do not read “OTHER.”] PROMPT: (READ PROMPT ONLY IF R HAS CHOSEN MORE THAN ONE ANSWER): If you could only pick one feature, which feature would that be? ANNUAL MATCH INVESTMENT SELECTION FROM MANY MUTUAL FUND COMPANIES TAX-FREE EARNINGS AUTOMATED DEPOSITS OTHER (Specify: ___________________) DK REF
Center for Social Development Washington University in St. Louis
58

29. Now, please choose the feature that has the LEAST AMOUNT OF INFLUENCE on your decision to make additional deposits. [NOTE: Do not read “OTHER.”] PROMPT: (READ PROMPT ONLY IF R HAS CHOSEN MORE THAN ONE ANSWER): If you could only pick one feature, which feature would that be? ANNUAL MATCH INVESTMENT SELECTION FROM MANY MUTUAL FUND COMPANIES TAX-FREE EARNINGS AUTOMATED DEPOSITS OTHER (Specify: ___________________) DK REF
30. Approximately how much do you expect to have saved in (BENEFICIARY’S) NextGen
account by the time you start withdrawing money for education? [NOTE: If participant provides a range, enter into “OTHER.”]
[PROMPT: (If already withdrawing) Approximately how much had you saved before you began withdrawing money from (BENEFICIARY’S) NextGen account?] _______________ AMOUNT SAVED GO TO Q19 OTHER (SPECIFY: _______________) GO TO Q19
DK GO TO Q18 REF GO TO Q19
31. {IF Q17 = DK } Could you please give me your best guess?
_______________ AMOUNT SAVED DK REF
32. Have you ever made a non-qualified withdrawal from (BENEFICIARY’S) NextGen
account? A non-qualified withdrawal is a withdrawal for something other than educational expenses. YES GO TO Q20 NO GO TO Q21
DK GO TO Q21 REF GO TO Q21
33. {IF Q19 = YES} Can you tell me why you made the non-qualified withdrawal(s)?
Remember your answers are all confidential. [NOTE: RECORD RESPONDENT’S REASONS (UP TO 3)] PROMPT: Any other reasons? REASON #1: _____________________ REASON #2: _____________________
REASON #3: _____________________ REF
34. Do you own other NextGen matching grant accounts?
YES GO TO Q33 NO GO TO Q35
DK GO TO Q35 REF GO TO Q35
Center for Social Development 59Washington University in St. Louis

35. {IF Q32 = YES} How many other NextGen matching grant accounts do you own and what is your relationship to these other beneficiaries?
A. # OF BENEFICIARIES (Drop down list of answers from Q45) DK REF B. # OF BENEFICIARIES (Drop down list of answers from Q45) DK REF C. # OF BENEFICIARIES (Drop down list of answers from Q45) DK REF D. # OF BENEFICIARIES (Drop down list of answers from Q45) DK REF E. # OF BENEFICIARIES (Drop down list of answers from Q45) DK REF
D. Money Management and Saving It is important for understand the things that might make it easier or harder to save in the NextGen account. Let’s turn to some questions about saving and money management. 36. Before opening your NextGen account, had you or anyone in your household ever saved
any money specifically for (BENEFICIARY’S) education? YES NO
DK REF
37. Have any other family members or friends saved any money specifically for
(BENEFICIARY’S) education? YES NO
DK REF
38. How much do you think the rising cost of education influences your saving in
(BENEFICIARY’S) NextGen account? Would you say…? A GREAT DEAL SOMEWHAT NOT AT ALL
DK REF
Center for Social Development Washington University in St. Louis
60

39. Please say whether each of the following makes saving easier, harder, or has no effect on saving in your NextGen account. [PROMPT; Read list of possible answers after A, D, and G.
A. Knowing that FAME deposits $200 as an
initial matching contribution. SAVING EASIER
SAVING HARDER
NO EFFECT
ON SAVING DK REF
B. Knowing that the NextGen account is dedicated to BENEFICIARY’s education.
SAVING EASIER
SAVING HARDER
NO EFFECT
ON SAVING DK REF
C. Using the NextGen contribution coupon included in mailings. PROMPT: Contribution Coupon is similar to a deposit slip.
SAVING EASIER
SAVING HARDER
NO EFFECT
ON SAVING DK REF
D. Knowing that there is a 10% penalty on account earnings if the money is not used for education.
SAVING EASIER
SAVING HARDER
NO EFFECT
ON SAVING DK REF
E. Knowing that FAME matches your annual contributions.
SAVING EASIER
SAVING HARDER
NO EFFECT
ON SAVING DK REF
F. Having an automated contribution option. SAVING EASIER
SAVING HARDER
NO EFFECT
ON SAVING DK REF
G. Knowing that you can’t immediately withdraw savings, unlike a bank account.
SAVING EASIER
SAVING HARDER
NO EFFECT
ON SAVING DK REF
H. Receiving a reminder about matching incentives from the NextGen newsletter.
SAVING EASIER
SAVING HARDER
NO EFFECT
ON SAVING DK REF
I. Is there anything I left out? PROMPT: That is, can you think of anything else that makes it easier for you to save in your NextGen account?
Specify:_______________________________ ______________________________________ ______________________________________
40. Next I’m going to list some things that might make it difficult to save money in your
NextGen account. Do you agree or disagree with the following statements? A. Saving isn’t that important to you. AGREE DISAGREE DK REF B. It is hard to resist temptations to spend money now. AGREE DISAGREE DK REF C. All or most of your money goes to buy “necessities.” AGREE DISAGREE DK REF D. It’s hard to save enough to make a real difference. AGREE DISAGREE DK REF E. Is there anything else that makes it hard for you to
save in your NextGen Account? Specify:__________________________ _________________________________
Center for Social Development 61Washington University in St. Louis

41. I’d like to know how you managed to set aside money for your NextGen deposits. Please answer yes or no to the following questions. To set aside money for NextGen deposits did you or someone in your household…
A. Work more hours or jobs? YES NO DK REF B. Resist or delay spending? YES NO DK REF C. Shop more carefully or buy
generic or second hand items?
YES NO DK REF
D. Use a portion or all of your federal tax refund? YES NO DK REF
E. Use a portion or all or your state tax refund? YES NO DK REF
F. Transfer money from any other account into the NextGen account?
YES GO TO F_2 NO DK REF
F_2. {IF Q39F = YES} How much of your savings in NextGen comes from other accounts?
1/4 OR
LESS
ABOUT HALF
ABOUT 3/4
ALMOST ALL DK REF
G. Borrow money to make deposits into the NextGen account?
YES GO TO G_2 NO DK REF
G_2. {IF Q39G = YES}How much of your savings in NextGen is borrowed?
1/4 OR
LESS
ABOUT HALF
ABOUT 3/4
ALMOST ALL DK REF
H. Receive contributions from friends or family members?
YES GO TO H_2 NO DK REF
H_2. {IF Q39H = YES} How much of your savings in NextGen is from family and friends?
1/4 OR
LESS
ABOUT HALF
ABOUT 3/4
ALMOST ALL DK REF
I. Is there anything else you have done to set aside money for NextGen deposits?
Specify:________________________________________ _______________________________________________
E. Internet Access The next few questions are about your Internet use. 42. Do you have Internet service in your home?
YES NO
DK REF
Center for Social Development Washington University in St. Louis
62

43. Do you use the Internet somewhere outside of your home? YES GO TO Q42 NO GO TO Q43
DK GO TO Q43 REF GO TO Q43
44. {IF YES TO Q41} Where do you use the Internet outside of your home?
[NOTE: DO NOT READ LIST] [NOTE: Select all that apply.] [PROMPT: Anywhere else?] WORK LIBRARY SCHOOL FRIEND FAMILY
INTERNET CAFÉ/COFFEE SHOP OTHER (Specify: _________________) DK REF
45. Have you ever used the Internet to…?
[NOTE: Read each question in the list below.] [PROMPT: Read answers, YES, NO, or DIDN’T KNOW THIS FEATURE WAS AVAILABLE after A.] A. Review your NextGen account statement? YES NO DK REFB. Pay bills? YES NO DK REFC. Download NextGen forms or information? YES NO DK REFD. Purchase stocks, bonds, or mutual funds? YES NO DK REFE. Use online tools to calculate future savings balances? YES NO DK REF
F. Demographics It’s important that we know a little more about you and others in your household. 46. Are you currently...?
[READ LIST] MARRIED WIDOWED DIVORCED SEPARATED
NEVER MARRIED DK REF
46A. In what year were you born?
________________ YEAR OF BIRTH GO TO Q45 DK GO TO Q44B REF GO TO Q44B
46B. {IF Q44A = DK or REF} I’m going to read a list of age ranges, please stop me when I
have read your age. LESS THAN 25 25 TO 35 35 TO 45 45 TO 55
55 TO 65 OVER AGE 65 DK REF
Center for Social Development 63Washington University in St. Louis

47. What is the highest grade or year of school you have completed? [NOTE: DO NOT READ LIST] [NOTE: SELECT ONLY ONE RESPONSE.] PROMPT: How far did you go in school? Did you complete that year/grade/degree?
NO FORMAL SCHOOLING 7TH GRADE OR LESS 8TH GRADE 9TH GRADE 10TH GRADE 11TH GRADE 12TH GRADE BUT NO DIPLOMA HIGH SCHOOL DIPLOMA GED OR EQUIVALENT VOC/TECH PROGRAM AFTER HIGH SCHOOL BUT NO VOC/TECH DIPLOMA VOC/TECH DIPLOMA AFTER HIGH SCHOOL SOME COLLEGE BUT NO DEGREE ASSOCIATE DEGREE BACHELOR DEGREE, GRADUATE FROM 4-YEAR COLLEGE OR UNIVERSITY GRADUATE OR PROFESSIONAL SCHOOL BUT NO DEGREE MASTERS DEGREE (MA, MS) DOCTORATE DEGREE (PHD, EDD) PROFESSIONAL DEGREE AFTER BACHELOR’S DEGREE (MD, DDS, JD, ETC.) DK REF
48. How many children age 17 and younger live in your household?
______ NUMBER OF CHILDREN DK REF
49. What is [BENEFICIARY’S] race or ethnic origin?
[NOTE: SELECT ALL THAT APPLY.] PROMPT: READ CATEGORIES IF NECESSARY. PROMPT: {IF R SAYS “NATIVE AMERICAN,” VERIFY BY ASKING} I am recording this as ‘American Indian’-is that right? WHITE BLACK/AFRICAN-AMERICAN/NEGRO ARAB OR ARAB-AMERICAN AMERICAN INDIAN/ALASKAN NATIVE ASIAN INDIAN HISPANIC OR LATINO/LATINA HMONG
JAPANESE CHINESE KOREAN FILIPINO VIETNAMESE OTHER ASIAN/PACIFIC ISLANDER OTHER (Specify: _________________) DK REF
Center for Social Development Washington University in St. Louis
64

50. Including you, how many adults age 18 and older live in your household? ______ NUMBER OF ADULTS [CHECK: Can never equal zero.] DK REF
51. What language is spoken most in your home?
ENGLISH GO TO Q53 SPANISH FRENCH
OTHER (Specify: _________________) DK REF
52. Is English also spoken in your home?
YES NO
DK REF
G. Financial Products I’d like to ask you some questions about how you manage your finances. Remember that all of your answers are confidential. 53. Do you have a checking account at a bank or credit union?
YES NO
DK REF
54. Do you have a savings account at a bank or credit union?
YES NO
DK REF
55. Other than a checking or savings account, do you have a…
NOTE: READ EACH QUESTION IN THE LIST BELOW. PROMPT: Read answers, YES, NO, or DON’T KNOW after A.
A. Money market account? YES NO DK REF B. Coverdell Education Savings Account? YES NO DK REF C. Retirement account, like an IRA? YES NO DK REF D. Certificate of deposit (CD)? YES NO DK REF E. 401(k), 403(b), or other pension account through work? YES NO DK REF F. Other stocks, bonds, or mutual funds? YES NO DK REF 56. Do you have one or more major credit cards, like Visa, MasterCard, Discover, or
American Express? PROMPT: A major credit card can be used at many different stores.
YES GO TO Q62 NO GO TO Q63
DK GO TO Q63 REF GO TO Q63
Center for Social Development 65Washington University in St. Louis

57. Do you usually carry a balance on at least one of your credit cards? This means you are not paying off the whole amount each month.
YES, I USUALLY CARRY A BALANCE NO, I USUALLY PAY OFF THE WHOLE AMOUNT EACH MONTH
DK REF
58. {IF Q53 OR Q54 = YES} Do you have an ATM (or debit) card for withdrawing money
from a bank or credit union account? YES NO
DK REF
H. Housing We are almost finished with the interview. I would like to remind you that your answers will remain completely confidential. Now, I have some questions about your housing arrangements. 59. What is your current housing situation? Do you:
[NOTE: IF HOUSE IS OWNED IN SPOUSE’S OR PARTNER’S NAME, CODE AS OWN.] Own GO TO Q60 Rent, or GO TO Q64
DK REF
OTHER (Specify: _________________) GO TO Q66 60. {IF Q59 = OWN} Could you tell me what the value of your home is - I mean about how
much would it bring if you sold it today? PROMPT: For this question, we are not concerned about whether or not you have a mortgage. We’d just like to know what your house would sell for. $ ____________ VALUE OF HOME GO TO Q63 DK REF
61. {IF Q60 = DK OR REF} I’m going to read a list of housing values. Stop me when I’ve
read the number your house is worth. If you don’t know the exact number please tell me your best guess: Less than $50,000 GO TO Q63 $50,000 to $75,000 GO TO Q63 $75,000 to $100,000 GO TO Q63 $100,000 to $125,000 GO TO Q63
$125,000 to $150,000 GO TO Q63 $150,000 or more GO TO Q63 DK GO TO Q62 REF GO TO Q62
62. {IF Q61 = DK OR REF} Could you give me a ballpark figure?
$ __________________ VALUE OF HOME DK REF
Center for Social Development Washington University in St. Louis
66

63. Do you have a mortgage on this property? YES GO TO Q65 NO GO TO Q66
DK GO TO Q66 REF GO TO Q66
64. {IF Q59 = RENT} Do you live in a …
[NOTE: READ LIST; READ PROMPT ONLY IF NECESSARY} PROMPT: In Section 8 housing, a person receives a rent subsidy or pays a lower rent because the government pays part of the cost PRIVATELY OWNED APARTMENT PUBLIC HOUSING
DK REF
RENT SUBSIDIZED OR SECTION 8 HOUSING, OR SOME OTHER TYPE OF RENTAL HOUSING (SPECIFY: ____________________________________).
65. Last month, what was the amount of your mortgage payment/rent?
__________ AMOUNT OF PAYMENT DK REF
I. Household Income 66. How many adults in the household are currently working for pay?
_________________ NUMBER OF ADULTS DK REF
67. Do you or any of the adults in the household have all or part of your paycheck or
government payment directly deposited into a checking or savings account? PROMPT: Direct deposit means that the money is automatically transferred. YES NO
DK REF
68. On average, how easy or hard is it to make ends meet financially for you and your
family? Is it… VERY EASY SOMEWHAT EASY SOMEWHAT HARD
VERY HARD DK REF
69. I’m going to read a list of adjusted gross income ranges. Stop me when I’ve read the
income for your household as reported on your 2004 federal tax return. If you don’t know the exact number, please tell me your best guess: LESS THAN $20,000 BETWEEN $20,000 AND $30,000 BETWEEN $30,000 AND $40,000 BETWEEN $40,000 AND $50,000 BETWEEN $50,000 AND $60,000
BETWEEN $60,000 AND $70,000 MORE THAN $70,000 DK GO TO Q70 REF GO TO Q70
Center for Social Development 67Washington University in St. Louis

70. {IF Q69 = DK OR REF} As reported on your 2004 federal tax return, was your family’s adjusted gross income above or below $37,000? ABOVE BELOW DK REF
71. In 2004, did you or any member of your household receive any income from…?
NOTE: READ EACH QUESTION IN THE LIST BELOW] A. Retirement income, including pensions or social security? YES NO DK REF B. Investment income? YES NO DK REF C. TANF, which is also called welfare or public assistance? YES NO DK REF D. Food stamps? YES NO DK REF E. Disability income? YES NO DK REF
J. Conclusion We’re finished with our questions. I want to thank you for your time and your patience with the interview. We want to let you know that your responses may help to positively influence the NextGen Plan. 72. You may choose how you want to receive the $25 payment for this interview. Would you
rather have the money:
DEPOSITED INTO (BENEFICIARY’S) NEXTGEN ACCOUNT SENT DIRECTLY TO YOU GO TO Q73
73. Will you please provide the address where the $25 should be mailed?
ADDRESS 1: _______________________________________ ADDRESS 2: _______________________________________ CITY/TOWN: _______________________________________ STATE: _______________________________________ ZIP CODE: _______________________________________
[NOTE: Run QC check now.] 74. Do you have any general thoughts or comments for me? _______________________________________ [NOTE: If respondent asks any FAME- or NextGen-related questions, please say: I’m sorry, but I cannot answer your question. I can give you an 800 number for the Finance Authority of Maine and someone there would be more than able to answer your question(s). (1-800-228-3734)] If you think of any other questions concerning this study, I can provide you with a toll-free number to call. Would you like that phone number? (1-877-660-9072) Again – Thank you! INTERVIEWER INITIALS {XXX}
Center for Social Development Washington University in St. Louis
68

Appendix E
Variables Specification from FAME NextGen Account and Savings Data Account open 2002 or later. This variable measures when an account owner opened the account, in relation to the launch of the Matching Grant Program in 2002. The variable is determined by which year an account owner first contributed to the account. If the first contribution was in 1999-2001, the account was not open in 2002 or later. If the first contribution was in 2002-2005, the account was open in 2002 or later. Age of account. The year of the account owner’s first contribution is subtracted from 2005 then increased by one to create an age of account variable (e.g., if the year of first contribution was 2002, then [(2005-2002) + 1] is the age of account). Age of beneficiary. The year of the beneficiary’s birth date is subtracted from 2005 to create the age of beneficiary variable. Annual deposit frequency. Annual deposit frequency captures annual savings behavior and is the percentage of years that the account has been open in which the account owner made a contribution to the account. Annual deposit frequency is measured in two ways: (1) from 1999 through 2005 (since inception of NextGen); and (2) from 2002 through 2005 (since inception of the Matching Grant Program). For each time period, the number of years in which an account owner made a contribution to the account is divided by the number of years the account has been open, providing a ratio from 0 to 1.0. This ratio is then multiplied by 100% to obtain a deposit frequency percentage. Annual Matching Grant (AMG) eligibility frequency. To control for potential bias, a variable for eligibility to receive an Annual Matching Grant (AMG) has been constructed. This variable covers AMG eligibility in contribution years 2002 through 2004. AMG eligibility is based on two factors: (1) the account owner’s contribution to the account in the calendar year prior to AMG application; and (2) the account owner’s annual household income in the calendar year prior to AMG application. For contribution years 2002 and 2003, if an account owner contributed at least $200, the first eligibility criterion is met. For contribution year 2004, the first criterion is met if the accountholder contributed at least $50. To determine eligibility for the second criterion, annual household income as reported in the phone survey is used. For contribution years 2002 and 2003, the annual household income limit for AMG eligibility was $50,000. Although FAME increased this limit to $52,500 for contribution year 2004, the constructed AMG eligibility variable uses $50,000 as the threshold in all contribution years, because income data was captured in ranges rather than exact amounts (e.g., $40,000 to $49,999; $50,000 to $59,999). In addition, because the survey captured only 2004 annual household income, the AMG eligibility variable assumes that income is constant in all contribution years, unless the account owner stated that he or she was not eligible for the matching grant because household annual income was too high to qualify.
Center for Social Development 69Washington University in St. Louis
The number of years that an account owner was eligible for an AMG in contribution years 2002 through 2004 is summed to create an eligibility score with values between 0 and 3. Annual Matching Grant (AMG) receipt. Annual Matching Grant (AMG) receipt describes whether an account owner has ever received an AMG. FAME data report Initial Matching Grant (IMG) and Annual Matching Grant awards as one total. Thus, yearly award totals were examined to determine if an account owner received an IMG, AMG or both. In award years 2003-2004, no account owner received more than a $200 award. Thus, account owners who received a $200 matching grant award in these years received the IMG, since the maximum AMG was $100 during this time. All other account owners with matching grant awards in these years received an AMG. In award year 2005, the maximum AMG increased to $200. While no account owner received more than a $200 award, some received exactly $200. If these account owners had previously received an IMG or had opened their accounts in 2003 or earlier, it was assumed that they received an AMG in 2005. Average annual account value. To control for time, the variable for total account value (see specification below) is divided by the age of the account. The variable is then logged to compress the distribution and control for heteroskedasticity. Average annual contributions. To control for time, the variable for total account owner contributions (see specification below) is divided by the age of the account. The variable is then logged to compress the distribution and control for heteroskedasticity. First year contributions. First year contributions is the sum of gross account owner deposits during the first year of contribution, reported as a yearly amount for each account owner. Initial Matching Grant (IMG) receipt. Initial Matching Grant (IMG) receipt describes whether an account owner received the $200 IMG. As described in Annual Matching Grant receipt above, FAME data report matching grants awards as a yearly total. These totals were examined to determine if an account owner received an IMG, AMG, or both. In award years 2002-2004, no account owner received more than a $200 award. Thus, account owners who received a $200 matching grant award in these years received the IMG, since the maximum AMG was $100 during this time. In award year 2005, the maximum AMG increased to $200. Although no account owner received greater than $200 in matching grant awards in 2005, some received exactly $200. However, it was determined that these account owners received AMGs, not IMGs. Total account value. This variable is the value of the participant’s NextGen account, including all participant contributions, withdrawals, matching grant awards and distributions, and investment performance as of December 31, 2005. If an account owner made a withdrawal from the account, it is treated as a qualified withdrawal if the account beneficiary was at least 17 years old during the year of the withdrawal. Total contributions. This variable is created to analyze participation in the NextGen plan, controlling for matching grant award dollars and return on investment. Using the account data, this variable is the sum of the amount of account owner contributions from 1999 through 2005.
Center for Social Development Washington University in St. Louis
70

Total investment earnings. Net contributions and matching grants are subtracted from the total account value to create the investment earnings variable. Total number of matching grants. This variable is created to measure participation in the NextGen Matching Grant program, controlling for the dollar amount of matching grant awards, which are highly correlated with participant contributions. Total number of matching grant awards is determined from FAME account data, which present the value of matching grant awards as an annual amount. A breakdown by IMG, AMG, and number of matching grants received each year are not available. Thus, assumptions are made from the data to calculate a sum of number of matching grant awards received for each account owner. In matching grant award years 2002 through 2005, the IMG was $200 and the maximum AMG was either $100 or $200. No account owner received more than $200 in matching grants in one of these years. Thus, account owners who received a matching grant distribution in a given year are treated as having received just one award that year (IMG or AMG, not both). It is possible that as of December 31, 2005, matching grants had not posted for some account owners who applied for an IMG or AMG in 2005, based on their 2004 contributions. Total value of matching grants. This variable is created to measure participation in the NextGen Matching Grant program. The amounts of matching grant awards are summed for matching grant award years 2002 through 2005. Type of matching grant received. To understand how different types of matching grants received are related to program features and saving performance, three categories are identified: participants receiving only IMG, participants receiving only AMG, and participants receiving both IMG and AMG. In the regression models, the group with only IMG is a reference group.
Center for Social Development 71Washington University in St. Louis

Center for Social Development George Warren Brown School of Social Work
Washington University in St. Louis http://gwbweb.wustl.edu/csd/