Inclusion engineering in Mn-Si de-oxidized steel for thin ...
178
Scholars' Mine Scholars' Mine Doctoral Dissertations Student Theses and Dissertations Spring 2015 Inclusion engineering in Mn-Si de-oxidized steel for thin-strip Inclusion engineering in Mn-Si de-oxidized steel for thin-strip casting casting Vivek Thapliyal Follow this and additional works at: https://scholarsmine.mst.edu/doctoral_dissertations Part of the Materials Science and Engineering Commons Department: Materials Science and Engineering Department: Materials Science and Engineering Recommended Citation Recommended Citation Thapliyal, Vivek, "Inclusion engineering in Mn-Si de-oxidized steel for thin-strip casting" (2015). Doctoral Dissertations. 2397. https://scholarsmine.mst.edu/doctoral_dissertations/2397 This thesis is brought to you by Scholars' Mine, a service of the Missouri S&T Library and Learning Resources. This work is protected by U. S. Copyright Law. Unauthorized use including reproduction for redistribution requires the permission of the copyright holder. For more information, please contact [email protected].
Transcript of Inclusion engineering in Mn-Si de-oxidized steel for thin ...

Scholars' Mine Scholars' Mine
Doctoral Dissertations Student Theses and Dissertations
Spring 2015
Inclusion engineering in Mn-Si de-oxidized steel for thin-strip Inclusion engineering in Mn-Si de-oxidized steel for thin-strip
casting casting
Vivek Thapliyal
Follow this and additional works at: https://scholarsmine.mst.edu/doctoral_dissertations
Part of the Materials Science and Engineering Commons
Department: Materials Science and Engineering Department: Materials Science and Engineering
Recommended Citation Recommended Citation Thapliyal, Vivek, "Inclusion engineering in Mn-Si de-oxidized steel for thin-strip casting" (2015). Doctoral Dissertations. 2397. https://scholarsmine.mst.edu/doctoral_dissertations/2397
This thesis is brought to you by Scholars' Mine, a service of the Missouri S&T Library and Learning Resources. This work is protected by U. S. Copyright Law. Unauthorized use including reproduction for redistribution requires the permission of the copyright holder. For more information, please contact [email protected].
INCLUSION ENGINEERING IN Mn-Si DE-OXIDIZED STEEL FOR
THIN-STRIP CASTING
by
VIVEK THAPLIYAL
A DISSERTATION
Presented to the Faculty of the Graduate School of the
MISSOURI UNIVERSITY OF SCIENCE AND TECHNOLOGY
In Partial Fulfillment of the Requirements for the Degree
DOCTOR OF PHILOSOPHY
in
MATERIALS SCIENCE AND ENGINEERING
2015
Approved Dr. Jeffrey D. Smith, Advisor
Dr. David G. C. Robertson Dr. Simon N. Lekakh
Dr. Ronald J. O'Malley Dr. William G. Fahrenholtz

2015
Vivek Thapliyal
All Rights Reserved
iii
PUBLICATION DISSERTATION OPTION
This dissertation was prepared in the style utilized by ISIJ International – The
iron and Steel Institute of Japan. The introduction and literature review present pertinent
background on inclusions in Mn-Si killed steels, focusing on application in thin-strip
casting process. Paper 1 (page 34-70) has been published in Ironmaking & Steelmaking
under the title “Transient Inclusion Formation and Evolution in Silicon-Killed Steels”.
Paper 2 (page 71-105) has been published in ISIJ International under the title “Inclusion
Modification in Si-Mn Killed Steels using Titanium Addition”. Paper 3 (page 106-131)
was submitted for publication in February, 2015 in ISIJ International under the title “A
Kinetic Model for Vacuum Tank Degassing”.

iv
ABSTRACT
The focus of this research was to understand inclusion formation and evolution in
Mn-Si de-oxidized steels used in thin-strip casting. Inclusions formation and evolution in
ultra-low carbon low-alloyed steels were studied. Inclusion engineering can be used to
remove or modify detrimental inclusions, which cause casting issues.
The first part of this study focused on inclusion formation as a result of ferro-alloy
addition. De-oxidation reaction in steels are the primary source of the typical oxide
inclusion formed in steel. For Mn-Si de-oxidized steels ferro-silicon and ferro-manganese
are the two ferro-alloys used for de-oxidation. Inclusion formation and evolution during
the early stages of dissolution of these ferro-alloys was experimentally studied. The
mechanism for inclusion formation in their transient phase was proposed.
The second part of this study shows the results of modification of inclusions
observed in Mn-Si killed steel as a result of ferro-titanium addition. MnO-SiO2-Al2O3
based inclusions were modified by ferro-titanium addition to form inclusions of lower
melting points. These inclusions would cause fewer issues during casting.
In the third part of this study a comprehensive dynamic model for vacuum tank
degasser (VTD) was developed. VTD is used in the industry to obtain ultra-low carbon
steels. Further, VTD processing typically removes gaseous species from liquid steel
which is essential for thin-strip casting. Inclusion content in the steel is further reduced
by this process. The VTD model calculated thermodynamic equilibrium under different
conditions within steel in a ladle during VTD processing. The model successfully
predicted composition change in steel over time under VTD processing.

v
ACKNOWLEDGMENTS
It has been four and a half years, since I started on this journey towards one
objective, during which I have seen highs and lows in life. It wouldn’t have been
possible without the support of so many people. First and foremost thanks to Dr. Jeffrey
Smith, my advisor, for his support, guidance, motivation and his belief in me. Thanks for
all the advice, both personal and professional, of which I will be forever indebted.
Thanks to Dr. Robertson for the guidance and numerous discussions. I would
also like to thank Dr. Lekakh, Dr. O'Malley and Dr. Fahrenholtz for their time and
valuable inputs to this work. Thanks to the Materials Science and Engineering
Department for helping me throughout my stay at Missouri S&T.
I would like to thank Nucor for giving me the opportunity of working on the
Castrip projects which have funded my stay at Missouri S&T.
I would like to thank Abhishek Kumar, for his help in conducting all the
experiments, publications and setting up the tempo for continuous hard-work. I would
like to thank Sean Padgett and Brad Osmonson for all the sample preparations. Thanks
goes to my friends Manoj, Sid, Priyatham and Samrat for their support.
I would like to thank my parents, my sisters, brother-in-laws and my friends
Hemant and Preeti for their understanding and unconditional support during my PhD.
Lots of love to my nephew Atiksh for bringing smile to my face during the tough times
and being the ball of happiness.
Finally, I would like to thank late Dr. Kent Peaslee for giving me the opportunity
to start on this path and for always being an inspiration to me. Special thanks to Mary
Peaslee for being a family to us.
vi
TABLE OF CONTENTS
Page PUBLICATION DISSERTATION OPTION……………………………………………iii ABSTRACT……………………………………………………………………………...iv ACKNOWLEDGMENTS………………………………………………………………...v LIST OF ILLUSTRATIONS……………………………………………………………...x LIST OF TABLES……………………………………………………………………...xiii SECTION 1. INTRODUCTION……………………………………………………………………...1 1.1. THIN-STRIP CASTING……………………………………………………..1 1.2. INCLUSIONS………………………………………………………………...4 1.2.1. Inclusion Sources…………………………………………………...6 1.2.2. Problems Due to Inclusions……………………………………….10 1.2.3. Benefits of Inclusions……………………………………………..12 1.3. INCLUSION REMOVAL…………………………………………………..13 1.3.1. Degassing Treatment……………………………………………...13 1.3.2. Floatation………………………………………………………….15 1.3.3. Inclusion Entrapment by Slag……………………………………..17 1.3.4. Inclusion Entrapment by Refractory………………………………18 1.3.5. Gas Bubbling……………………………………………………...20 1.3.6. Electromagnetic Stirring……………………………………….….22 1.4. INCLUSION MODIFICATION………………….………………………...23
vii
1.5. INCLUSION ENGINEERING……………………………………………...25 1.6. INCLUSIONS IN Mn-Si KILLED STEEL…………………………………26 1.7. SCOPE OF WORK………………………………………………………….33 PAPER I. TRANSIENT INCLUSION FORMATION AND EVOLUTION IN SILICON- KILLED STEELS………………………………………………………....34 ABSTRACT……………………………………………………….……………..35 1. INTRODUCTION…………………………………………………………….36 2. EXPERIMENTAL PROCEDURE……………………………………………38 3. THERMODYNAMIC MODELING OF STEEL-INCLUSION SYSTEM……………………………………………………………………...43 4. RESULTS AND DISCUSSIONS……………………………………………..44 4.1. Type 1: Fe75Si Addition…………………………………………….46 4.2. Type 2: FeMn Addition……………………………………………..54 4.3. Type 3: Fe75Si + FeMn Addition…………………………………...61 5. CONCLUSIONS……………………………………………………………...67 ACKNOWLEDGEMENT……………………………………………………….68 REFERENCES…………………………………………………………………..69 II. INCLUSION MODIFICATION IN Si-Mn KILLED STEELS USING TITANIUM ADDITION……………………………………………………...……...71 ABSTRACT……………………………………………………………………...72 1. INTRODUCTION…………………………………………………………….73 2. EXPERIMENTAL PROCEDURE……………………………………………76 3. THERMODYNAMIC MODELING OF INCLUSION TRANSFORMATION………………………………………………………..78
viii
4. RESULTS AND DISCUSSIONS……………………………………………..80 4.1. Inclusions in Mn-Si Deoxidized Steel………………………………80 4.2. Effect of FeTi Addition on Mn-Si Based Inclusions………………..86 5. CONCLUSIONS…………………………………………………………….102 ACKNOWLEDGEMENT……………………………………………………...103 REFERENCES…………………………………………………………………104 III. A KINETIC MODEL FOR VACUUM TANK DEGASSING…………………….106 ABSTRACT…………………………………………………………………….107 1. INTRODUCTION…………………………………………………………...108 2. VTD MODEL CONCEPT…………………………………………………...109 2.1. Determination of Zone Volumes and Mixing in the Ladle………...112 2.2. Model Design………………………………………………………114 2.3. Spontaneous Bubble Formation……………………………………116 2.4. Reactions at Gas Bubble Interface…………………………………118 2.5. Reactions at the Steel/Slag/Gas Interface………………………….121 3. MODEL VERIFICATION…………………………………………………..123 4. CONCLUSIONS…………………………………………………………….128 ACKNOWLEDGEMENT……………………………………………………...129 REFERENCES…………………………………………………………………130 SECTION 2. SUMMARY………………………………………………………………………….132 3. PROPOSED FUTURE WORK……………………………………………………...134

ix
APPENDICES A. DATA FROM AUTOMATED SCANNING ELECTRON MICROSCOPE……………………………………………………………...136 B. CALCULATION OF SOLIDIFICATION TIME IN THE CERAMIC SAMPLER……………………………………………………...144 C. MnS PRECIPITATES ON TITANIUM-OXIDE INCLUSIONS…………...148 D. MACRO PROCESSING USING FACTSAGE……………………………..150 REFERENCES…………………………………………………………………………156 VITA……………………………………………………………………………………163

x
LIST OF ILLUSTRATIONS Page SECTION Figure 1.1. A representation of the main components of the CASTRIP process………...3 Figure 1.2. Equilibrium relations for de-oxidation of steel with Si and Mn……………..27 Figure 1.3. MnO-SiO2-Al2O3 system…………………………………………………….30 Figure 1.4. Liquidus temperatures in MnO-SiO2-Al2O3 system as a function of Al2O3 concentration for MnO/SiO2 ratios 0.5, 1.0 and 2.0…………………………………….31 PAPER I Figure 1. Schematic diagram of the samplers used for dissolution studies……………...39 Figure 2. Schematic diagram showing the dissolution/diffusion sequence expected inside the sampler for a ferro-alloy lighter than steel ……………………………………41 Figure 3. Representation of the sampler volume used for the solidification time calculation………………………………………………………………………………..42 Figure 4. Types of inclusions observed before the ferro-alloy addition………………....45 Figure 5. Results of inclusion analysis across the spherical sampler cross-section after Fe75Si dissolution………...………………………………………………………..49 Figure 6. Types of inclusion observed after Fe75Si dissolution………………………...51 Figure 7. (a) Phase diagram for FeO-SiO2-MnO system using FactSage with PO2= 1 x 10⁻⁴ MPa showing the starting composition of inclusion predicted by thermodynamic equilibrium calculation, (b) Mechanism of inclusion evolution………..53 Figure 8. Results of inclusion analysis after FeMn dissolution and micro-mixing across the spherical sampler cross-section………………………………………………56 Figure 9. Types of inclusion observed after FeMn dissolution………………………….57 Figure 10. (a) Phase diagram for FeO-SiO2-MnO system using FactSage with PO2= 1 x 10⁻⁴ MPa showing the starting composition of inclusion predicted by thermodynamic equilibrium calculation, (b) Mechanism of inclusion evolution ……60
xi
Figure 11. Inclusion population fractions in different concentration ranges for Fe75Si + FeMn addition……………………………………………………………...61 Figure 12. Results of inclusion analysis after FeMn+Fe75Si dissolution and micro-mixing across the spherical sampler cross-section……………..…..………..........63 Figure 13. Types of inclusion observed after FeMn+Fe75Si dissolution………………..64 Figure 14. Characteristic X-ray map of constituent elements one of the typical inclusions observed in the Fe75Si+FeMn dissolution………………………...…………66 PAPER II Figure 1. MnO-SiO2-TiO2 phase diagram plotted at 1250°C and PO2 = 10-5 atm using FToxid – FACT oxide database of FactSage……………………………………...75 Figure 2. Representation of thermodynamic FactSage model (a) to determine inclusion-steel equilibrium and (b) to determine inclusion transformation with FeTi addition for n = 1, 2 or 3…………………………………………………...…79 Figure 3. Inclusion composition map after Fe75Si + FeMn addition shown on Mn-S-Si ternary with Al concentration on the color scale for inclusions with low Ca (<10%)……………………………………………………………………...……82 Figure 4. Typical Mn-Si-Al-O based oxide inclusion obtained 5 minutes after Fe75Si + FeMn addition…………………………………………………………………83 Figure 5. Distribution of inclusion composition (wt. %) with time after first FeTi addition for inclusions with low Ca and Al (<10%)……………………………………..88 Figure 6. Typical Ti-Mn-Al-Si-O oxide inclusion, with Ti rich phase as precipitates, observed 5 minutes after first FeTi addition……………………………………………..91 Figure 7. Distribution of inclusion composition (wt. %) with time after second FeTi addition for inclusions with low Ca and Al (<10%)……………………………….93 Figure 8. SiO2 precipitate in Si-Mn-Ti-Al-O inclusion observed 5 minutes after second FeTi addition……………………………………………………………………..94 Figure 9. Distribution of inclusion composition (wt. %) with time after third FeTi addition for inclusions with low Ca and Al (<10%)……………………………………..97 Figure 10. Inclusion variations at different stages in the experiment: (a) inclusion count per mm2 and area of inclusions per mm2 (coverage) and (b) amount (in ppm) of each element in the inclusions……………………………………………………….101

xii
PAPER III Figure 1. Illustration of the VTD multi-zone model……………………………………111 Figure 2. Illustration of a) vector velocity in ladle domain and b) cross section, and c) position of iso-lines Vz=0 in different cross sections…………………………...113 Figure 3. Mixing time for different Ar flow rates for different mixing models………..114 Figure 4. Illustration of general structure of each zone of the model.……………….....115 Figure 5. Profiles for applied pressure and total argon flow-rate (through two porous plugs) during de-carburization for Heat 1………………………………………124 Figure 6. Comparison of C concentration in different zones of the ladle as predicted by the model for Heat 1………………………………………………………125 Figure 7. Comparison of de-carburization by the three mechanisms…………………..126 Figure 8. Comparison of total inclusion mass in ppm in different zones………………127
xiii
LIST OF TABLES Page
SECTION Table 1.1. Typical steel cleanliness requirements for various steel products……………..6 PAPER I Table 1. Composition of ferro-alloys added……………………………………………..40 Table 2. Initial steel chemistry…………………………………………………………...40 Table 3. Data used for solidification calculations………………………………………..43 Table 4. Chemical analysis result (wt. %) after dissolution experiment for different ferro-alloy additions……………………………………………………………………...44 Table 5. Average SiO2 and FeO concentration in inclusions (wt. %) formed after Fe75Si dissolution and micro-mixing …………………………………………………... 47 Table 6. Average MnO and FeO concentration in inclusions (wt. %) formed after FeMn dissolution and micro-mixing……………………………………………………..55 Table 7. Average SiO2, MnO and FeO concentration in inclusions (wt. %) formed after Fe75Si + FeMn dissolution and micro-mixing…………………………….62 PAPER II Table 1. Initial chemistry of induction iron and steel (after Mn-Si addition) used for the experiment (balance Fe) measured using arc-spectroscopy……………………...76 Table 2. Ferro-alloy compositions used for this study (balance Fe)……………………..76 Table 3. Sampling Chart…………………………………………………………………77 Table 4. Type of inclusions with analysis (wt. %) observed after 5 minutes of Fe75Si + FeMn addition (balance O, with Ca and Ti as minor species)………………...81 Table 5. A representative result for the thermodynamic calculations for steel-inclusion equilibrium at 1600°C…………………………………………………...85

xiv
Table 6. Steel chemistry after different additions with C - 0.032, P - 0.039, S - 0.009, Cr - 0.064, Ni - 0.04, Al - <0.001, Cu - 0.042 and Fe – balance (all values in wt. %)……………………………………………………………………...87 Table 7. Type of inclusions and their analysis (wt. %) observed after 5 minutes of first FeTi addition (balance O with Ca as minor species)…………………………….90 Table 8. A representative result for the thermodynamic calculations to show inclusion transformation on FeTi addition at 1600°C…………………………………...92 Table 9. Type of inclusions and their analysis (wt. %) observed after 5 minutes of second FeTi addition (balance O with Al and Ca as minor species)……………….....95 Table 10. Type of inclusions and their analysis (wt. %) observed after 5 minutes of third FeTi addition (balance O with Ca and Si as minor species)………………….....98 PAPER III Table 1. Initial steel composition showing only the major constituents (Fe balance)……………………………………………………………………………..123 Table 2. EAF slag composition showing only the major constituents………………….123
1
1. INTRODUCTION
1.1. THIN-STRIP CASTING
Thin-strip casting is a technique in which steel strip (1-15 mm thickness) is cast
directly from liquid steel thus minimizing further size reduction and finishing steps. The
concept of strip casting was invented by Bessemer in 1846 where he used a twin-roll
caster to produce metallic strip from molten metal.1-3) In 1865, he patented a twin-roll
caster designed for iron and steel strips.3) The major difficulties identified by Bessemer
with his design were liquid metal feeding, edge containment, and strip quality.2)Even
though, this technique was invented as early as 1846, its commercial application
advanced only in the last decade or so because of technical difficulties such as roll wear,
low productivity, poor quality of the casts, variable solidification structures and
mechanical properties.2)
Twin-roll caster at Hikari (Nippon Steel Corporation and Mitsubishi Heavy
Industries - Japan), Eurostrip (Joint European R&D Effortof VAI, ThyssenKrupp and
ArcelorMittal - Germany), Castrip (Nucor Steel - USA, Broken Hill Proprietary
Company - Australia and Ishikawajima-Harima Heavy Industries - Japan) and Postrip
(POSCO -South Korea) are the few places where this technique was applied
commercially.2-7) Baostrip (Baosteel – China)and MAINSTRIP (SMS Demag -Germany,
MAIN AG/MTAG Marti-Technologie AG - Switzerland and Corus Research,
Development and Technology - UK) are other facilities where the twin-roll casting
technology is in full-scale testing or semi-production phase and is advancing towards full
commercialization.2) Nippon Steel terminated the commercial operation of the strip caster
at Hikari Works in September 2003.2) Since 2003, the Eurostrip consortium has also been

2
reluctant to release any information regarding its progress and it is believed that that the
project was terminated sometime in the mid 2000’s.2) Since 2002, Castrip plant at
Crawfordsville, Indiana, USA continues to produce thin-strip cast steel and is capable of
producing 500,000 ton steel annually.2,5-7) A second facility at Blytheville, Arkansas,
USA was commissioned in January, 2009 with similar production capacity.2,5,6) POSCO
started production using its commercial-scale twin-roll strip (Postrip) at Pohang Works in
July 2007 with annual capacity of 600,000 ton.2)
A schematic diagram depicting the major components of the CASTRIP process is
shown in Figure 1.1. The figure shows two counter rotating rolls which form two
individual shells that are formed into a continuous sheet, of thickness less than 2 mm, at
the roll nip. It has been reported that only Mn-Si de-oxidized steels are used in the
CASTRIP process to ensure that inclusions formed (MnO-SiO2 based) are liquid during
the casting process to avoid clogging.8-11) Also, Si-Mn deoxidization is utilized for
adequate heat transfer.8-11)

3
Figure 1.1. A representation of the main components of the CASTRIP process8)
Thin-strip casting is different from the traditional casting techniques having very
thin molds (1-2 mm) and very fast cooling rates (1700ºC/sec) compared to conventional
casting.8) The microstructure of steel (and hence the properties) obtained via thin-strip
casting are different due to the fast cooling rate. Finely dispersed inclusions formed
during solidification are helpful in achieving the microstructure.8-10) However, even very
small inclusions (< 10 µm)8-10) present in the liquid steel can cause casting issues and
defects in the final product. So, the control of inclusion chemistry and size is very
important for smooth casting operation (without clogging or strip-breaks) and achieving
desired properties in the final product.8-10)

4
1.2. INCLUSIONS
Inclusions are non-metallic compounds, solutions or mixtures (multi-phase
inclusions) found in steel. They comprise of metallic elements (Fe, Mn, Al, Si, Ti, Ca,
Mg etc.) and non-metallic elements (O, C, N, S etc.).
Inclusion type can be defined based on the inclusion chemistry as oxides, sulfides,
carbides or nitrides having oxygen, sulfur, carbon or nitrogen as the primary non-metallic
elements respectively. Inclusions can also be a combination of these compounds and can
be termed as complex inclusions.
Inclusions can also be categorized based on how they form. Indigenous
inclusions form within steel as a result of chemical reactions during de-oxidation, re-
oxidation, alloy-addition, ladle-refinement, slag-steel interaction, refractory-steel
interaction and solute-segregation. For example; Al2O3 inclusions form in Al-killed steel
during de-oxidation and can modify to CaO·Al2O3 inclusions during Ca treatment in the
ladle.12,13) Exogenous inclusions form in steel as a result of physical processes like slag-
entrapment or refractory wear. Inclusions formed as a result of de-oxidation, re-oxidation
and solute-segregation are generally primary oxides, sulfides, carbides or nitrides.
Secondary inclusions form as a result of heterogeneous nucleation of inclusions on the
primary inclusions.
In the 21st century the major challenges for the steel industry are (a) to develop
new steel grades with better properties; (b) to reduce energy consumption, and (c) to
reduce greenhouse gas emission. Developing new steel grades with improved properties
requires careful control of chemistry and cleanliness as inclusions are detrimental to
achieving the desired properties. Producing thin-strip directly from molten steel is an
5
effective way to reduce greenhouse gas emission and energy consumption. Thin-strip
casting reduces the greenhouse gas emission by 90% and reduces energy consumption by
75% as compared to traditional slab-casting.5-10) With processes such as thin-strip casting
even small inclusions can cause clogging and strip-breaks calling into question the
viability of the approach.
Steel cleanliness is generally defined by the inclusion content of the steel.
Inclusions are present in all steels and it is not possible to remove them as they form
throughout the steel-making process and during solidification and cooling. Thus, critical
inclusion size and content are defined to decide whether or not steel is clean. Typical
steel cleanliness requirements for various steel products were reported by Zhang at al.14)
and are summarized in Table 1.1. To make clean steel it is essential to understand how
inclusions form, how they evolve, and how they can be modified or removed from the
steel.

6
Table 1.1. Typical steel cleanliness requirements for various steel products
Steel Product Maximum impurity fraction (ppm) Maximum inclusion size (µm) Automotive and deep-drawing sheet
[C]≤30, [N] ≤30 100
Drawn and ironed cans
[C]≤30, [N]≤30, T.O.≤20 20
Line pipe [S]≤30, [N]≤50, T.O.≤30 100 Ball bearings T.O.≤10 15 Tire cord [H]≤2, [N]≤40, T.O.≤15 20 Heavy plate steel [H]≤2, [N]≤30-40, T.O.≤20 Single inclusion=13,
cluster=200 Wire [N]≤60, T.O.≤30 20
1.2.1. Inclusion Sources. Oxides and sulfide inclusions are the most common
inclusions observed in steel. De-oxidation reactions and alloying additions are
considered to be the primary sources of oxide inclusions. However, de-oxidation of steel
is essential to prevent the formation of blowholes (CO evolution) and FeO during steel
solidification.15) Aluminum, silicon and manganese are the most common deoxidizers
used in steel making. These de-oxidizers react with dissolved oxygen in steel to form
their primary oxides as shown in the following reactions:
2 3 (1)
2 (2)
(3)
Ferro-alloys like ferro-silicon, ferro-manganese and silico-manganese are used as
deoxidizers in Mn-Si killed steel. The dissolution (melting) behavior of different ferro-
alloys has been described in detail by Argyropoulos et al.16,17). They summarized the

7
expected dissolution times needed for assimilation of different ferro-alloys in liquid steel.
In this work, the author has used these dissolution mechanisms to study inclusion
formation immediately after ferro-alloy additions and prior to macro-
mixing/homogenization.
Ferro-alloys contain some (≤5%) impurities in the form of carbon, aluminum,
magnesium, and sulfur.18) The knowledge of these impurities is essential in determining
ferro-alloy quality which in turn provides information about nature of inclusions formed
in steel. Pande et al.19) characterized different ferro-alloys for their impurity content
through chemical and microstructural analysis. It was reported that ferro-silicon contains
impurities like Al (0.05 – 0.44%) and Ca (0.03 – 0.12) and ferro-manganese contains Al
(0.021 – 0.22 %), Mg (0.09 – 0.11 %) and P (0.02 – 0.15 %).19) These impurities under
equilibrium conditions are expected to form oxide inclusions of Al2O3, CaO, MgO or
combinations of these possibly in solution with MnO-SiO2.
It is a common practice to add calcium to steel to modify alumina inclusions to
form liquid calcium aluminates which can be shown through following chemical
reactions15):
(4)
(5)
(6)
13 ∙ 2 3 (7)
8
Magnesium oxides are also observed in steel and originate from ferro-alloys,
refractories or slag through following chemical reaction:
(8)
Titanium can be used in steel-making as deoxidizer or to modify the existing
inclusions to form titanium oxide (TiOx) inclusions (reaction 9).
(9)
Sulfur content in the steel leads to the formation of sulfide inclusions during de-
sulfurization or during cooling and solidification due to sulfur segregation. Additions of
CaO are made to the slag for de-sulfurization. Calcium sulfide inclusions are also known
to form during calcium treatment in steel (reaction 10).15) Manganese sulfide inclusions
are the commonly observed sulfide inclusions formed as a result of sulfur segregation
(reaction 11). These inclusions can also nucleate on top of existing oxide inclusions to
form complex inclusions.
(10)
(11)
Availability of nitride forming elements like aluminum, titanium, boron and
zirconium along with access to air or dissolved nitrogen from the steel can result in the
formation of nitride inclusions. Similarly, carbide forming elements like Cr, Ti etc. can
9
form carbide inclusions. The presence of other inclusions (oxides or sulfides) can act as
nucleation sites for these inclusions.
Exogenous inclusions found in steel are generally complex in chemistry and large
(>100 microns) in size. Industrially, ladle practices such as stirring (gas or
electromagnetic) and slag practices are well established to avoid entrapment of slag
droplets by steel. Researchers have studied inclusion formation due to slag entrapment.20-
23) Riboud et al.20) reported that gas bubbling as well as turbulence caused at slag-metal
interface due to non-equilibrium can lead to slag entrapment. Iguchi et al.21) studied slag
entrapment due to gas bubbling using water model to determine the critical gas flow rate.
They showed that the formation of slag droplets becomes difficult by increasing slag
viscosity. Formation of vortices during steel transfer operation between furnace, ladle,
tundish or mold can cause slag to be drawn from one vessel to another.24)
Ladle glaze is another source of inclusions as studied by various researchers.25-27)
Ladle glaze is formed due to adhering of the top slag as it flows down the ladle wall
during the draining of the ladle to the tundish. Song et al.27) studied inclusion from ladle
glaze by using BaO as a tracer in the slag in industrial trial. They observed BaO
containing inclusions in the samples from the ladle in the second and third heat after the
tracer addition.
Mold flux is another potential source of inclusions which can be trapped during
steel solidification or react with steel to form inclusions.21,28-30) Iguchi et al.21) studied
mold slag and steel interface in industrial continuous casting molds. They observed that
the formation of a wide range of inclusion sizes was possible by reduction of silica and
sodium oxide from the casting powder by the deoxidizing elements used in aluminum or
10
aluminum/titanium killed steels. Feng et al.30) used water and numerical modeling to
determine optimal outlet angle and immersion depth for a submerged entry nozzle in a
mold to minimize slag entrapment.
In thin-strip casting of steel, additional refractory components are required
compared to traditional ladle and tundish refractories. These refractory components
referred to as core-nozzles and side-dams and are typically made of zirconia-carbon and
boron-nitride materials and they can also be source of exogenous inclusions.31) The types
of inclusions formed through interaction of BN-ZrO2-SiC ceramic with Si-killed steel
were reported by Kumar et al.32,33). Further, Kumar et al.34) also studied behavior of
zirconia-graphite refractories in thin-strip casting of steel and reported the dislodging of
zirconia grains from the refractory into the steel.
1.2.2. Problems Due to Inclusions. Inclusions are detrimental to steel affecting
its mechanical, chemical and thermal properties.35-37) Zhang et al.36) have summarized
the different defects related to inclusions in steel. Maeda et al.38) highlighted the
importance of steel cleanliness to achieve high tensile strength for wire rods for tire cord
steel. Murtaza et al.39) report that non-metallic inclusions play a major role in crack
initiation affecting the fatigue life in spring steels.
Researchers have reported that large alumina particles (>30μm) are the major
source of fatigue problems in bearing steel.36,40) Bearing life can be extended (by almost
30 times) by reducing the amount of large inclusions by lowering the oxygen content
from 20 ppm to 3-6 ppm.36,40) Ginzburg et al.41) reviewed the defects in cast slabs and hot
rolled products such as slivers, surface defects (trapped scum) and segregation (causing

11
brittleness) related to inclusions. Frank42) provides a historical perspective of the
problem of castability of steel due to alumina, calcium sulfide and spinel inclusions.
In general, the number and distribution of inclusions in steel plays an important
role in initiation of fatigue cracks. Sulfide inclusions have high index of deformability at
all temperatures and are not usually harmful for fatigue properties.37) These inclusions
participate in hot/cold working of steel and change their shape in accordance with
surrounding steel matrix.43-45) In contrast, oxide inclusions are harmful to fatigue
properties depending upon their phase, size and position. Usually, spherical, non-
deformable Ca-aluminate inclusions and Al2O3 inclusions are most detrimental to the
fatigue properties.45,46) Both of these inclusions do not change their shape during steel
deformation. Large, exogenous oxide inclusions from slag or refractory origin are always
detrimental to fatigue properties due to their size and irregular shape.
Hot-shortness is a fracture phenomenon which involves tendency of steel to brittle
fracture in the hot forming temperature range.37) This phenomenon is frequently
attributed to sulfur content, and caused by the precipitation of FeS in the austenite grain
boundaries of the steel.47) Further, oxygen enhances the effect of sulfur, whereas
manganese counteracts hot-shortness due to formation of MnS.
Surface finish of steel is sensitive to surface irregularities, therefore presence of
different inclusions types influence the degree of surface-finish attainable. Schoberl et
al.48) reported the influence of deoxidation on the surface-finish of high chromium alloyed
steel. They practiced different deoxidation methods (such as Fe-Cr-Si, Fe-Si, Ca-Si, Ca-
Al, Al etc.) in the ladle and as a result inclusions of different compositions were formed.
The authors concluded that number of inclusions was of more importance compared to

12
inclusion types. The inclusion count was closely connected to oxygen content in steel and
deoxidation method which gave lowest oxygen content was more suitable for better
surface finish.
1.2.3. Benefits of Inclusions. It is not possible to remove all the inclusions from
steel. Steel with only 1 ppm of oxygen and sulfur contains 1010 -1012 inclusions per
tonne, with most of them being too small (<1 μm) to remove.49,50) Further, there are
economic considerations for removing inclusions from steel which must be optimized.
Very fine inclusions in small amounts can be beneficial to steel. They can be utilized in
grain refinement by Zener pinning effect of finely distributed particles which capture
grain boundary movement.51)
Inclusions can also be used to achieve desired microstructure in steel. Ti, Ce and
La based inclusions are known to affect steel microstructure.51) Inclusions such as Ti2O3,
Ti(C,N), and (La,Ce)2O3, CeS, and Ce2O3 are favorable nucleation sites for ferrite,
whereas, CeO2, La2O3, CeAlO3 are favorable cites for cementite and austenite.51-53) Ti-
Oxides were especially effective to nucleate acicular ferrite.51)
Pro-eutectoid ferrite can nucleate at inclusions within austenite grains which can
be utilized to achieve fine ferrite-pearlite microstructure within coarse austenite
grains.54,55) The generation of intra-granular ferrite at inclusions to refine grain structures
effectively improves the toughness of steel.54,55) Researchers at Castrip have found that
the non-metallic inclusion type (MnO-SiO2 based) and size distribution (0.5 – 5 μm) play
a very beneficial role in the development of the final microstructure by promoting the

13
intra-granular nucleation of acicular ferrite without adversely affecting the formability of
the strip.10)
Inclusions can be made useful through the oxide metallurgy process by forming
inclusions of the optimal chemistry, size, shape and distribution, although achievement is
difficult in practice.
1.3. INCLUSION REMOVAL
The benefits of removing inclusions far outweigh the negatives. Large inclusions
can be easily removed from the steel by utilizing good industrial practices. Following are
the common techniques utilized to remove inclusions:
1.3.1. Degassing Treatment. Inclusions content in steel can be reduced by
minimizing the content of sulfur, hydrogen, nitrogen and oxygen. This can be achieved
by degassing treatment of the steel. There are two principle types of degassers:
recirculating systems such as RH, RH-OB, RH-KTB and DH; and non-recirculating
systems such as ladle or tank degassers, including VAD (vacuum arc degassing) and
VOD (vacuum oxygen decarburization), and stream degassers.56) The type of degasser
used generally depends upon the target product mix. For example, to produce ultra-low
carbon steels, RH degassing is usually preferred.
In vacuum degassing, hydrogen, nitrogen, carbon, and oxygen are removed
through following reactions57):
2 (12)
14
2 (13)
(14)
(15)
1 2 (16)
Hydrogen and nitrogen dissolved in steel are removed by forming diatomic
molecules; whereas, carbon is removed by reaction with oxygen present as dissolved
oxygen, FeO in slag or gaseous oxygen (O2) to form CO. Due to reduction in pressure
the formation of CO and other gases (H2, N2 etc.) is favored.58)
Bannenberg et al.59) reported that in non-recirculating systems, the time required
to remove 50% of the carbon is approximately 7 minutes, whereas in the recirculating
system RH this time can be as short as 3 to 4 minutes. During degassing, rate of
hydrogen removal is controlled by mass transfer in the liquid steel.58) Nitrogen removal
is made possible in vacuum degassing, provided liquid steel is fully killed and has low
sulfur content. Bannenberg et al.60) reported that 50% of the nitrogen can be removed in
15 minutes with initial nitrogen greater than 50 ppm, for a killed steel containing 2 ppm
dissolved oxygen and 10 ppm sulfur and a tank pressure of 100 Pa.
In this work, a dynamic model for a vacuum tank degasser (VTD) has been
developed which utilizes mixing and fluid flow data from computational fluid dynamics
software (FLUENT)61) and calculates thermodynamic equilibrium at different locations in
the VTD by FactSage 6.462). The model also provides information about change in
inclusion composition and content as a result of VTD processing. A preliminary model
for the same system was designed using process simulation software (METSIM)63).
15
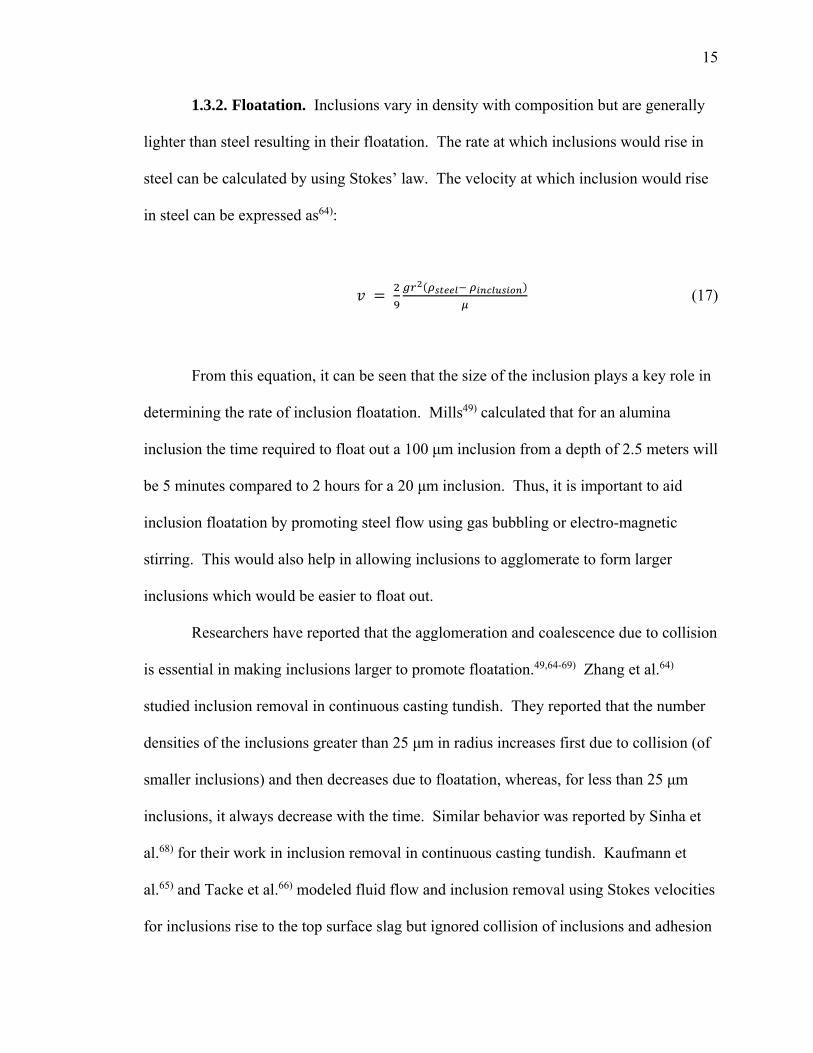
1.3.2. Floatation. Inclusions vary in density with composition but are generally
lighter than steel resulting in their floatation. The rate at which inclusions would rise in
steel can be calculated by using Stokes’ law. The velocity at which inclusion would rise
in steel can be expressed as64):
(17)
From this equation, it can be seen that the size of the inclusion plays a key role in
determining the rate of inclusion floatation. Mills49) calculated that for an alumina
inclusion the time required to float out a 100 μm inclusion from a depth of 2.5 meters will
be 5 minutes compared to 2 hours for a 20 μm inclusion. Thus, it is important to aid
inclusion floatation by promoting steel flow using gas bubbling or electro-magnetic
stirring. This would also help in allowing inclusions to agglomerate to form larger
inclusions which would be easier to float out.
Researchers have reported that the agglomeration and coalescence due to collision
is essential in making inclusions larger to promote floatation.49,64-69) Zhang et al.64)
studied inclusion removal in continuous casting tundish. They reported that the number
densities of the inclusions greater than 25 μm in radius increases first due to collision (of
smaller inclusions) and then decreases due to floatation, whereas, for less than 25 μm
inclusions, it always decrease with the time. Similar behavior was reported by Sinha et
al.68) for their work in inclusion removal in continuous casting tundish. Kaufmann et
al.65) and Tacke et al.66) modeled fluid flow and inclusion removal using Stokes velocities
for inclusions rise to the top surface slag but ignored collision of inclusions and adhesion

16
to the solid surface.64) Kaufmann et al.65) studied the separation of inclusions by
buoyancy in tundishes. They performed theoretical investigations for two different
tundishes one with a baffle and one without and did not find any significant difference in
the inclusion removal behavior for the two cases.
Tundishes are capable of appreciably diminishing the inclusions in the molten
steel especially when flow control devices such as dams, weirs, filters and baffles64-69) are
used. By means of these devices, the flow could be directed to the top surface to enhance
inclusion removal by floatation. A strong turbulent condition can be confined in the inlet
zone using flow control devices which promotes the collision of inclusions and improves
the inclusions removal.64,68) Collision of inclusions can occur by three possible
mechanisms64):
i. Brownian movement of the inclusions by which inclusions can contact,
collide and coagulate each other,
ii. Turbulent collision due to the movement of turbulent eddies in steel, and
iii. Stokes collision due to difference in Stokes velocity of rise of different
inclusions of different sizes.
Zhang et al.64) also reported that smaller inclusions have a much larger collision
removal rate but point out that not all inclusions colliding with each other will coalesce
and some aggregates of inclusions break up. As the smaller inclusions are much larger in
number than the large ones their collision number per unit time per unit volume is
high.49,50,64) Thus collision is a key way to remove smaller inclusions that are difficult to
remove by floatation for their small rising velocities.64,68) Lindborg and Torssell69)
17
reported that in a turbulent bath coalescence of small inclusions leads to larger inclusions
and that such a mechanism is very important in determining the rate of inclusion removal.
1.3.3. Inclusion Entrapment by Slag. The inclusions floating in the steel need
to be captured by the slag at the surface otherwise the inclusions would continue to
circulate with the steel. Therefore, one of key functions of the slag is to remove and
assimilate the non-metallic inclusions contained in liquid steel. A particle (inclusion)
reaching the slag/metal interface can pass into the slag layer with no-possibility of re-
entrainment or will reach an equilibrium state after some oscillation. The entrapment of
inclusions by the slag depends on the liquid flow at slag/metal interface and interfacial
energies involved.70) The following interfacial energy conditions enhance the inclusion
removal71-73): (i) high metal/inclusion interfacial energy, (ii) high metal/slag interfacial
energy, and (iii) low slag/inclusion interfacial energy. It implies that non-wetting solid
phases (such as alumina by steel) are easier to get removed at the interface than liquid
oxide inclusions.74) In addition, steel cleanliness is improved by using a liquid basic slag
that does not re-oxidize the steel and absorbs the oxide inclusions especially in the
tundish.75)
Rocabois et al.70) developed an experimental technique to study the rate of
entrapment of solid inclusions in liquid slag. In this technique, a steel rod with a slag
droplet inside was melted through induction heating and inclusion entrapment
phenomena were recoded. It was observed that slags with low alumina activity, high
basicity and low viscosity (CaF2 rich) were more efficient in assimilation of alumina
18
inclusions. In contrast, high slag viscosity is desirable for reduction of slag entrainment
into the casting product.76)
Researchers have shown that by maintaining the appropriate slag chemistry,
inclusion removal can be enhanced.77-79) Michelic et al.77) studied changes in Al2O3/CaO-
Al2O3 inclusions on interaction with CaO-Al2O3 and CaO-Al2O3-MgO slags. They
showed how initial alumina and calcium aluminate inclusions modify in presence of
different slags. The inclusions in contact with the CaO-Al2O3-MgO slag showed the
maximum modification. Inclusions were removed as a result of slag-entrapment with
maximum entrapment in the CaO-Al2O3 slags.
1.3.4. Inclusion Entrapment by Refractory. Another method by which
inclusions can be removed is attachment to the refractory walls in the ladle or the tundish.
The steel in the ladle is in contact with the large surface area of the refractory walls to
which inclusions can attach. Nozzle clogging is a known and widely studied problem
faced in the steel industry which occurs due to the attachment of inclusions to the
refractory walls in the nozzles.80-82) This attachment behavior of the inclusions to the
refractory can be utilized to remove the inclusions by using flow control devices or filters
in the tundish made of refractories which are prone to inclusion attachment.
Zhang et al.64) studied three-dimensional fluid flow in continuous casting
tundishes with and without flow-control devices using water-modeling and computational
fluid dynamics (FLUENT software) and used industrial experiment data for verification.
They report that for smaller inclusions the adhesion removal is especially effective and

19
stronger stirring energy is favorable for the adhesion. Also, flow control devices provide
surface for adhesion and improve inclusion adhesion to the walls and bottoms.
Sinha et al.68) studied inclusion removal in continuous casting tundish taking the
buoyancy, turbulent collision and adhesion to the solid surface into account. They
reported that near the walls of the tundish the liquid steel velocities are low so the
inclusions may move close and stick to the walls. The adherence of inclusions was more
prominent along the longer walls and bottom of the tundish. Inclusions also adhere more
to weirs than dams, and baffles provided the best results for inclusion removal than other
flow control devices.
Kawawa et al.83) measured the first order removal rate of inclusions in laboratory
experiments using induction furnace and Tammann furnace in MgO, SiO2, Al2O3 and
CaO-20%CaF2 crucibles with different deoxidizers. They showed that the crucible of a
material having a higher chemical reactivity with primary oxide inclusions lead to a
higher separation rate, confirming that inclusion separation by attachment to the
refractory is a key process.

20
1.3.5. Gas Bubbling. Floatation of the inclusions in the ladle can be enhanced by
bubbling gas into the ladle. Gas bubbles also provide an interface to which inclusions
can attach and float out. Researchers have studied the optimal usage of gas bubbling into
a ladle.
Single or multiple porous elements are used to purge inert gas such as argon into
molten steel in the ladle.84) The flow-rate of the gas is also very crucial and its
effectiveness for inclusion removal has been studied by researchers.85) Low gas flow
rates can result in poor stirring and mixing; whereas, high gas flow rates can lead to
emulsion between slag and metal and flushing-off of tiny inclusions from the refractory
of the ladle wall.85) Stirring energy as a function of gas flow rate can be expressed as86):
14.23 log 1.
(18)
where,
= Ar flow rate at standard temperature and pressure in m3/min
T = absolute steel temperature
M = steel mass in tonne
H = the total depth of the melt in m and Pa is in atmosphere.
Argon stirring in the ladle is applied to homogenize the steel, remove the
impurities and reduce the number of non-metallic inclusions. The homogenization of
steel is much faster compared to the removal of inclusions.85) Ek et al.85) studied
inclusion removal for different argon flow rates using water model (0.15 m3/h, 0.21 m3/h,
0.36 m3/h and 0.45 m3/h) but did not observe any significant change in the inclusion
21
removal rate. A necessary condition for the separation of the inclusions from the steel
bath to the slag is the direct contact between the inclusion and the slag.85-89) Higher
plume velocity brings more inclusion to the top per unit time but inclusions travelling
along the horizontal slag-metal interface don’t have enough time to separate.85,87,88) As a
result, smaller inclusions can return back to the metal bulk. The maximum number of
inclusions that have the possibility to meet the slag per second depends on the size of the
inclusions and the horizontal velocity of the liquid metal.87) The fraction of inclusions
brought into contact with the slag by the metal-gas plume is much higher than the
fraction due to buoyancy.87)
Researchers have also studied the optimal bubble size to remove inclusions both
by fluid flow models and water modeling techniques.89-91) Smaller bubbles appear to
enable more inclusion removal for the same gas flow rate. Zhang et al.91) used
computational models to study inclusion removal by bubble floatation in continuous
casting molds. They showed that bubbles smaller than 1 mm in diameter have high
inclusion attachment probabilities (30 %), while that for bubbles larger than 5 mm the
probability is less than 1 %.
22
1.3.6. Electromagnetic Stirring. Electromagnetic stirring (EMS) in the ladle,
tundish and mold is utilized to homogenize steel and inclusion floatation.92-97) Alexis et
al.94) observed that the induction stirrer results in high velocities close to the ladle walls.
They recommended that high velocities close to the wall should be avoided to minimize
refractory wear (ladle glaze removal) and hence non-metallic inclusions in the steel. The
ladle age plays an important role for induction stirring as the ladle lining thickness
decreases due to wear, making distance between stirrer and steel shorter.94)
Ilegbusi et al.95) studied the effect of electromagnetic force on inclusion removal
in a tundish for different inclusion sizes (20 - 100 µm). They reported that
electromagnetic fields minimize inclusion coalescence by minimizing turbulence but aids
with floatation of larger particles.
It is common practice to use EMS technique in continuous casting strand. It
causes the refinement of the solidification structure, reduction in inclusion content and
improvement in the quality of the surface, sub surface and the inner structure of the cast
products. There are three possible EMS applications in a continuous casting machine
according to the position and the requirement of the cast products namely mold (M-
EMS), secondary cooling zone (S-EMS) and the final solidification zone (F-EMS).96)
One or more EMS in combination is used depending upon the steel cleanliness
requirement and cast product quality. It was reported by Glaws et al.97) that EMS in the
strand improves the steel cleanliness by lowering the total oxygen in the billet from 30 to
20 ppm.

23
1.4. INCLUSION MODIFICATION
Even though there are different ways to remove inclusions from steel, all
inclusions cannot be removed. Inclusions floatation in steel is a function of inclusion
size, chemistry and density. Solid inclusions behave differently than liquid inclusions.
Further, liquid inclusions are known to cause fewer problems like clogging or strip
breaks. Liquid inclusions agglomerate more easily to form larger inclusions.
Researchers have pointed out that these issues (clogging) can be resolved even with a
portion of the inclusion being either solid or semi-solid (< 70% solid).98-101) According to
Fuhr et al.100), castability problems became more evident when the proportion of solid
inclusions was higher than 60-70%. Pistorius et al.101) suggested that clogging could be
avoided if the inclusions contain more than 50% liquid.
The main objective of inclusion modification is to transform solid inclusions to
liquid inclusions. In aluminum killed steel where solid alumina inclusions form as a
result of de-oxidation, calcium treatment of the steel is practiced to transform them into
liquid calcium aluminate inclusions.98-102) Alumina inclusions are known to form clusters
and cause nozzle clogging.81) So, making them liquid enhances agglomeration and
floatation, significantly reducing nozzle clogging.36,81,98-102)
Pretorius et al.98) showed that spinel inclusions can be modified by Ca treatment
by preferential reduction of the MgO component of spinel to Mg in solution in steel. This
is possible in low carbon aluminum killed steel where oxygen potentials are very low.98)
They also suggested that similar modification would not be possible in steels with higher
oxygen potential like Si killed steels. Verma et al.102,103) reported that spinel modification
by Ca treatment can occur preferentially by reduction of MgO as well as some Al2O3
24
components. Formation of an initial CaS phase was also predicted for steel containing 45
ppm S.
Titanium addition to aluminum killed steel has also been studied to form
aluminum-titanate inclusions.104-106) For silicon killed steel, manganese additions are
made along with silicon to aid in de-oxidation as well as form liquid manganese silicate
inclusions instead of solid silica inclusions.107-109) Thus, in thin-strip casting of steel, Si-
Mn de-oxidation is used over aluminum de-oxidation. With titanium addition to Si-Mn
de-oxidized steel, melting point of the inclusions can be further reduced.110,111) Effect of
titanium addition in Si-Mn de-oxidized steel has been presented in this work.
25
1.5. INCLUSION ENGINEERING
Tailoring non-metallic inclusions to achieve desired effect on steel properties is
known as “inclusion engineering”.112) Inclusion engineering involves achieving specific
de-oxidation inclusion composition, which are liquid at steelmaking temperatures and
deformable during casting and further processing. Apart from the chemistry the control
over population-density, size and distribution of inclusions in steel would define effective
inclusion engineering. Further, it would involve utilizing the inclusion population for
grain refinement and obtaining required microstructure using “oxide metallurgy”.
For effective inclusion engineering the following information is required: (a) how
inclusions form; (b) how they evolve during the steelmaking process; (c) whether the
primary inclusions formed require modification and if so, how to modify them; (d) how
to minimize inclusion population; (e) how to achieve a fine distribution of inclusions in
the final product; and (f) how inclusions would influence the properties of the final
product.112,113) The type of inclusions varies with steel chemistry and further different
type of inclusions can be formed in the same steel grade depending on different practices.
An understanding of the effect of each type of inclusions on the properties of steel to
determine the most desirable inclusion in a given product is required. With this
knowledge adjustments in the process parameters can be made to obtain these inclusions.
With good control of ladle steelmaking practices specific de-oxidation inclusion
compositions can be achieved.
26
1.6. INCLUSIONS IN Mn-Si KILLED STEEL
There are primarily three deoxidizers used in steelmaking: aluminum, silicon and
manganese.15) Out of these, Al is the strongest deoxidizer and results in solid – Al2O3 as
the primary inclusion at 1600°C. Mn is the weakest deoxidizer resulting in Mn(Fe)O
inclusions which can be liquid or solid at 1600 °C depending on the Mn content of steel.
Deoxidation by Si is much more effective than Mn and results in solid SiO2 inclusions.
However, simultaneous deoxidation by Mn and Si gives much lower dissolved oxygen in
steel and liquid MnO-SiO2 based inclusions. The equilibrium relation for Mn-Si
deoxidation can be represented by the following reaction15):
2 2 (19)
%
% (20)
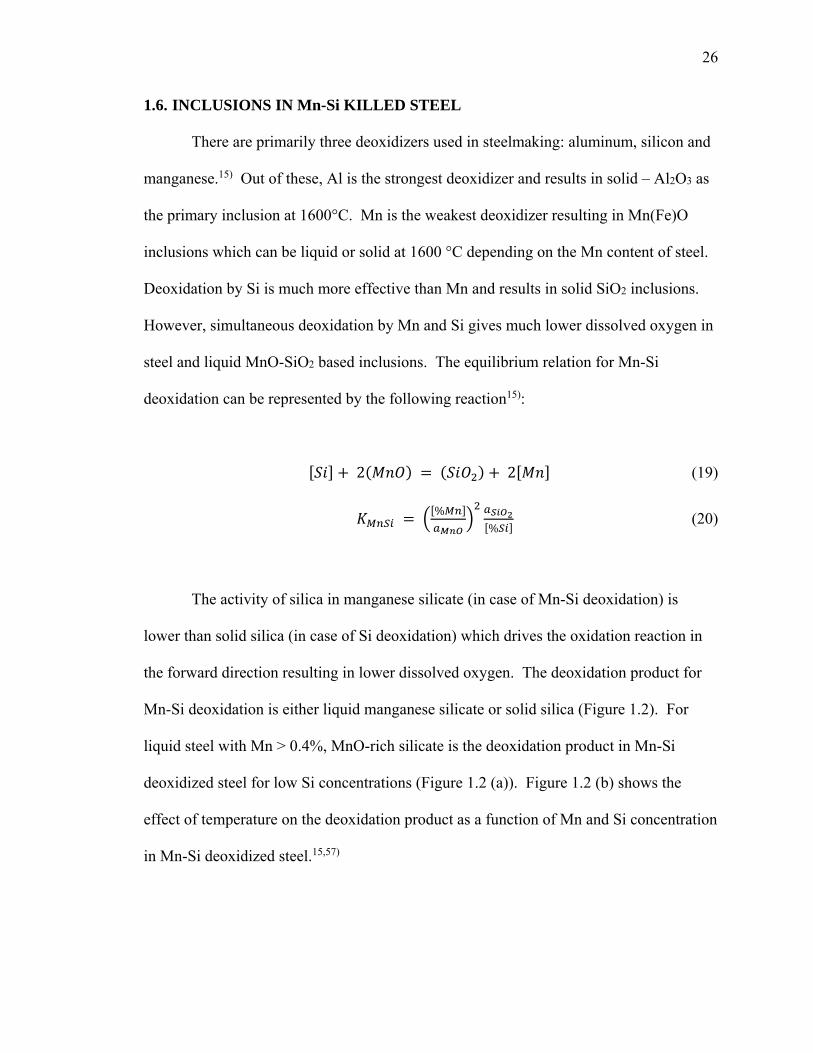
The activity of silica in manganese silicate (in case of Mn-Si deoxidation) is
lower than solid silica (in case of Si deoxidation) which drives the oxidation reaction in
the forward direction resulting in lower dissolved oxygen. The deoxidation product for
Mn-Si deoxidation is either liquid manganese silicate or solid silica (Figure 1.2). For
liquid steel with Mn > 0.4%, MnO-rich silicate is the deoxidation product in Mn-Si
deoxidized steel for low Si concentrations (Figure 1.2 (a)). Figure 1.2 (b) shows the
effect of temperature on the deoxidation product as a function of Mn and Si concentration
in Mn-Si deoxidized steel.15,57)
27
(a)
(b)
Figure 1.2. Equilibrium relations for deoxidation of steel with Si and Mn15,54)
28
MnO-SiO2-Al2O3 system is one of the most important systems for the study of
inclusions in modern steel type.114) Inclusions in Si-killed steels belong to this system.
As the ferro-alloys used for Mn-Si de-oxidation (ferro-manganese, ferro-silicon and
silico-manganese) contain some amount of Al, the inclusions have significant Al2O3
content.
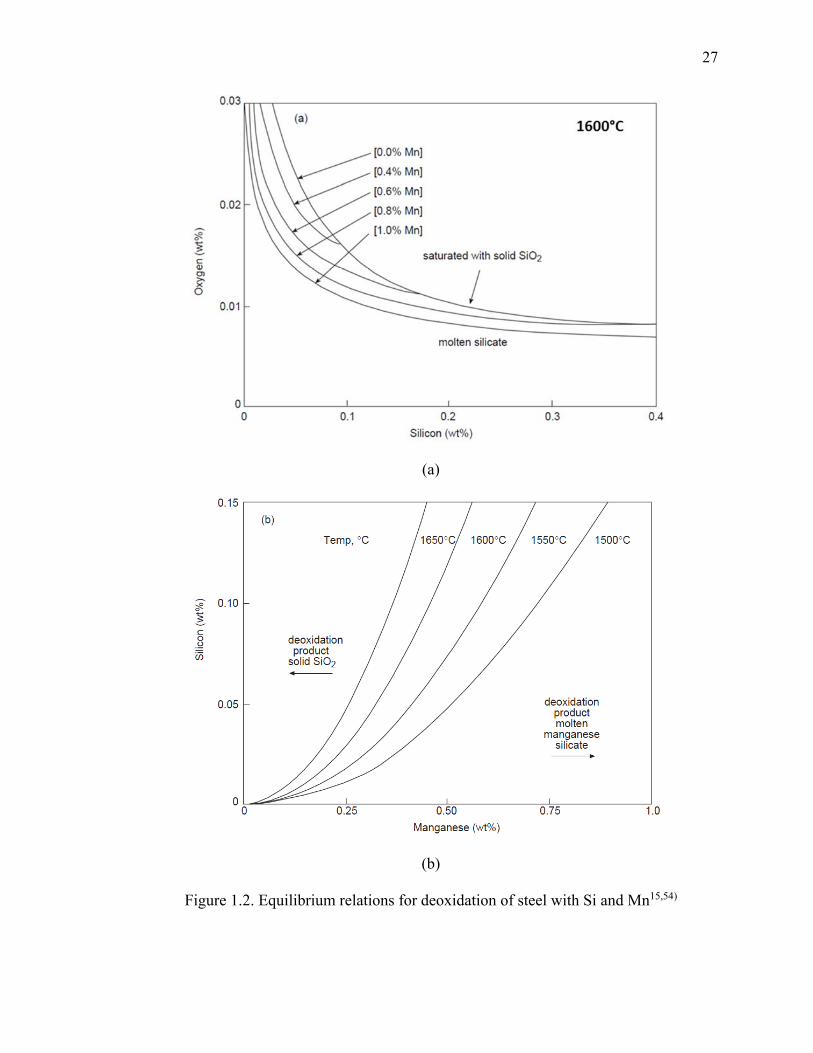
Inclusions of different compositions from the MnO-SiO2-Al2O3 system have been
observed in Si-killed steel. Corundum (Al2O3) inclusion are solid at steelmaking
temperature (melting point 2050°C) and very hard (Micro-hardness 3000-4500
Kgf/mm2).113) The primary oxide inclusion for Si-deoxidation (Cristobalite SiO2) has a
lower melting point (1723°C) and hardness (Micro-hardness 1600 Kgf/mm2).113) SiO2 is
also observed as layer around inclusions of iron and manganese oxides. These inclusions
are believed to be formed due to reduction of FeO/MnO at the surface by Si in steel
(Hultgren’s mechanism).113,114) This behavior was also observed in the author’s work.
Primary oxide for Mn-deoxidation (Manganosite, MnO) is also solid at steelmaking
temperature (melting point 1850°C) but is softer (Micro-hardness 400 Kgf/mm2).113)
These inclusions form solid solution with FeO and are generally observed as FeXMn1-XO.
Pure MnO only exists in high Mn containing steel. Galaxite (MnO·Al2O3) inclusions
have spinel type structure and are considered to be harmful due to their hardness (Micro-
hardness 1500-1700 Kgf/mm2).113) The melting point of MnO·Al2O3 is 1560°C and these
inclusions solidify before casting. Mullite (3Al2O3·2SiO2) inclusions have a comparable
hardness (Micro-hardness 1500 Kp/mm2) but a higher melting point (1850°C). The MnO
rich inclusions in the MnO-SiO2-Al2O3 system are softer and have much lower melting
points. Rhodonite (MnO·SiO2) inclusions solidify at 1291°C and have micro-hardness

29
around 750 Kgf/mm2.113) Similarly, for Tephorite (2MnO·SiO2) the melting point is
1345°C and micro-hardness is around 950 Kgf/mm2.113) With presence of some Al2O3 in
the inclusions the melting point drops even further. For Spessartite (3MnO·Al2O3·3SiO2)
the melting point is around 1195 °C and micro-hardness is around 1000-1100
Kgf/mm2.113,115,116) Mn-anorthite (MnO·Al2O3·2SiO2) and Mn-cordierite
(2MnO·2Al2O3·5SiO2) inclusions exist only with some amount of calcia.114) Roghani et
al.117) studied MnO-SiO2-Al2O3 melts containing up to 30 wt. % Al2O3 and measured
liquidus temperatures between 1075°C to 1245°C.They reported melting temperatures for
Mn-cordierite (2MnO·Al2O3·SiO2) and Mn-anorthite (MnO·Al2O3·2SiO2) as 1175°C and
1130°C, respectively. Different inclusion compositions are shown in the MnO-SiO2-
Al2O3 phase diagram (Figure 1.3). The dotted lines mark the boundary with MnO/SiO2
mass ratios of 0.5 and 2. These lines mark the boundary of the Spessartite region (lowest
melting point region) at 1200°C. This composition range is targeted to achieve glassy
inclusions in solid steel.118)
30
Figure 1.3. MnO-SiO2-Al2O3 system116)
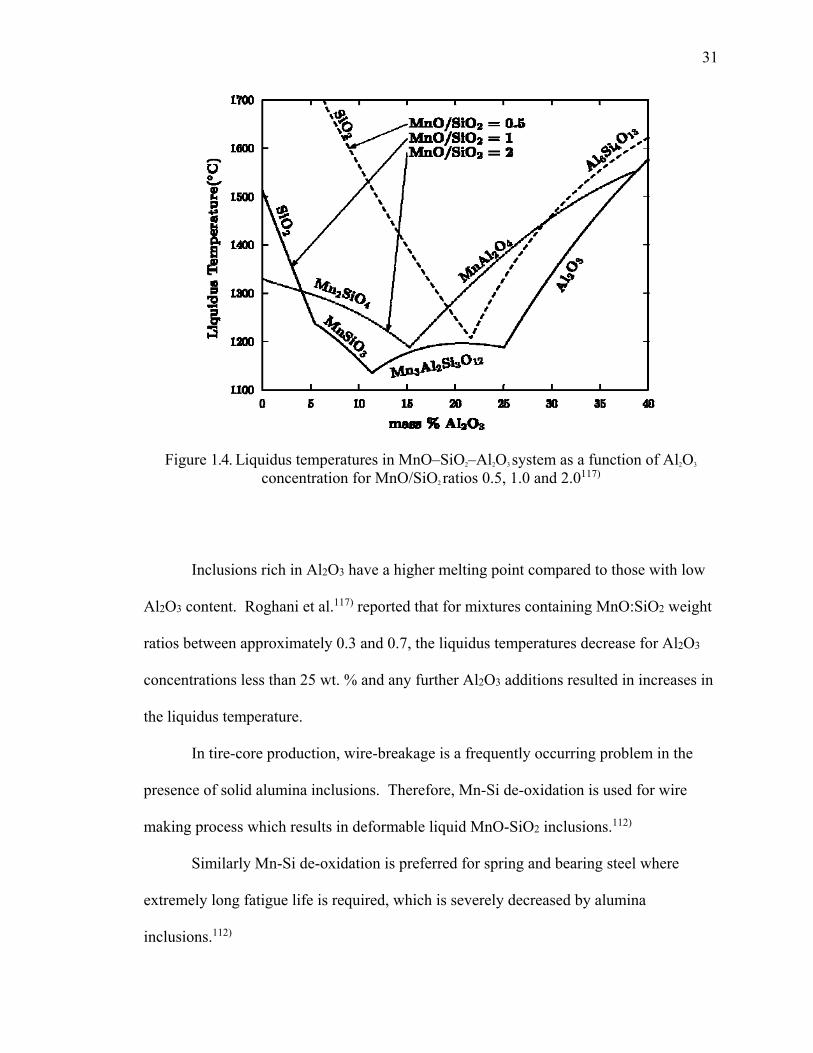
The MnO and SiO2 content in the inclusions has a direct relation with Mn:Si ratio
of the steel. Kiessling114) reported that for Mn:Si ratio of steel between 17 to 1.9 the
corresponding MnO:SiO2 ratio in inclusions is 1.7 to 0.47 respectively. Kang et al.118)
performed thermodynamic calculation and found that inclusions with low liquidus
temperature and a deformable phase on cooling can be obtained when the steel chemistry
is controlled in the range of [Mn] + [Si] = 1 wt.% and [Mn]/[Si] = 2-5. This relation is
shown in the Figure 1.4.
31
Figure 1.4. Liquidus temperatures in MnO–SiO2–Al2O3 system as a function of Al2O3
concentration for MnO/SiO2 ratios 0.5, 1.0 and 2.0117)
Inclusions rich in Al2O3 have a higher melting point compared to those with low
Al2O3 content. Roghani et al.117) reported that for mixtures containing MnO:SiO2 weight
ratios between approximately 0.3 and 0.7, the liquidus temperatures decrease for Al2O3
concentrations less than 25 wt. % and any further Al2O3 additions resulted in increases in
the liquidus temperature.
In tire-core production, wire-breakage is a frequently occurring problem in the
presence of solid alumina inclusions. Therefore, Mn-Si de-oxidation is used for wire
making process which results in deformable liquid MnO-SiO2 inclusions.112)
Similarly Mn-Si de-oxidation is preferred for spring and bearing steel where
extremely long fatigue life is required, which is severely decreased by alumina
inclusions.112)
32
For near net shape casting, where section reduction during rolling is too small to
cause sufficient microstructural refining, grain refinement by inclusion engineering is
achieved by de-oxidation products of Mn-Si de-oxidation. For thin strip casting at
Castrip, Mn and Si contents of the steel melt are controlled within certain limits (Mn >
0.55 wt. % and Si between 0.15-0.35 wt. %).2,11) This composition is also chosen to
ensure that liquid inclusions of MnO and SiO2 are present during casting. This also helps
to avoid clogging and to increase the rate of interfacial heat transfer.11)

33
1.7. SCOPE OF WORK
In this work, inclusion-formation in their early stages has been studied.
Inclusions first form during de-oxidation. Inclusion formation as a result of ferro-silicon
and ferro-manganese addition, which are the de-oxidizers used in silicon killed steel, has
been studied. Ferro-alloy particles were dissolved in a controlled volume of steel using a
ceramic sampler. This was followed by air-cooling of the steel in the sampler to quench
inclusions in their early stage of formation and evolution. During ferro-alloy dissolution
the concentration inhomogeneity of the alloying element in steel resulted in inclusions of
varying chemistry. Ferro-silicon with 75% silicon (Fe75Si), low carbon ferro-manganese
(FeMn) and a combination of both were used in this study. The procedure and results of
this study have been described in detail in chapter 3. The supporting data for inclusion
analysis has been presented in Appendix A. The supporting calculation for solidification
of the steel in the sampler has been described in Appendix B.
Inclusions formed in Mn-Si killed steel as a result of Fe75Si and FeMn additions
were transformed by adding ferro-titanium (FeTi) to the steel. Different amounts of FeTi
were added to the steel to study the extent of inclusion modification. Inclusion
modification with time was evaluated by analyzing steel samples taken from the
experimental crucible at different time intervals after each FeTi addition. In Appendix C
an example of MnS precipitation on titanium-oxide inclusion is presented.
A dynamic model for vacuum tank degasser (VTD) was developed to study
reactions in the VTD using METSIM software and FactSage macros. VTD is a key
operation used in thin strip casting to achieve low levels of oxygen, hydrogen and
nitrogen required for the process. A brief introduction to FactSage macro programming
has been provided in Appendix D.
34
PAPER
I. TRANSIENT INCLUSION FORMATION AND EVOLUTION IN SILICON-
KILLED STEELS
Vivek Thapliyal
Abhishek Kumar
David G. C. Robertson
Jeffrey D. Smith
Materials Science and Engineering
Missouri University of Science & Technology
Rolla, MO
Phone - 573-341-6469,
E-mail – [email protected]
Published in Ironmaking & Steelmaking

35
ABSTRACT
Transient inclusion formation in low-carbon silicon-killed steel as a result of
ferroalloy additions of ferro-silicon (Fe75Si) and ferro-manganese (FeMn) (for de-
oxidation and alloying) was studied in the laboratory using a novel experimental
technique. Inclusion chemistries and morphologies were analyzed using automated
scanning electron microscopy (ASPEX). Formation of these inclusions was studied using
thermodynamic software (FactSage) and a mechanism was proposed. Effect of solute
concentration gradients during alloy dissolution and mixing was observed. Inclusions
which formed initially, at low concentrations of ferro-alloy, were liquid phase with a high
concentration of FeO. Depending on the ferroalloy addition, initial inclusions become
richer in SiO2 or MnO. Inclusions also underwent further phase transformations on
cooling.
Key Words: transient; inclusions; ferro-alloy dissolution

36
1. INTRODUCTION
With recent developments of new steel grades, steel cleanliness has become
increasingly important. The presence of inclusions represents a formidable challenge for
achievement of the required properties of such steel. Inclusions originate from
indigenous or exogenous sources. Indigenous inclusions form as a result of de-oxidation
reactions, alloy additions, re-oxidation reactions and solute segregation during the casting
process.1-3) Exogenous inclusions enter steel from the slag or the refractory materials
used during the steelmaking process.3-5)
De-oxidation reactions and alloying additions are considered to be the primary
sources of inclusions. When Al and ferro-silicon are used as deoxidizers under
equilibrium conditions primary oxide inclusions of Al2O3 or SiO2 would be expected.
But inclusions observed after de-oxidation are frequently complex chemistries with
variable composition. Impurities in the ferroalloys and other components in steel are the
major contributors to this behavior. The effect of such impurities on inclusion formation
has been studied by a number of researchers6-8) and it is out of scope of this study.
In silicon-killed steel, ferro-alloys (Fe75Si, FeMn, etc.) are used as alloying
additions as well as de-oxidizers. Different ferro-alloys follow different dissolution
(melting) paths, which have been described in detail by Argyropoulos et al.9,10). Ferro-
alloys with lower melting points than steel immediately form a solid steel shell around
the ferroalloy lump upon immersion. The ferro-alloy lump then melts, followed by the
melting of the outer steel shell. In this paper, the word ‘dissolution’ will be used to
describe the above process. In normal practice ferro-alloys are primarily added as lumps
of different shapes and sizes. The time required for dissolution depends on the size of the
37
ferro-alloy particles as indicated in a study by Lee et al.11). The diffusion and micro-scale
mixing of the alloying element takes place after dissolution. For ferro-alloys with
melting points greater than the steel, the solidified steel shell melts after some time and
the solid ferroalloy particles take a much longer time to react.
Researchers have studied the macro-scale mixing (homogenization) of steel in
ladles due to argon purging or electromagnetic stirring.12-14) It has been reported that the
time required to homogenize the steel in a ladle after ferro-alloy addition is about 1-4
minutes depending on the gas flow rate or stirring power.12,13) During this
homogenization period, local steel chemistry can be significantly different than the final
expected bulk chemistry. Inclusion formation will take place at locations with high
concentrations of alloying elements and oxygen. These inclusions will have a range of
composition depending on the local chemistry. Most inclusion will further transform
during the steel-making process and may therefore be considered as transient inclusions.
Understanding the formation and evolution of inclusions composition and microstructure
can be of significant importance for the steel industry.
Studies of inclusion formation immediately after the addition of Al as a
deoxidizer and subsequent evolution with time have been investigated.15,16) These studies
suggest that diffusion of oxygen is the key mechanism for inclusion growth. Experiments
were set-up utilizing Fe-Al diffusion couples to identify the reaction mechanism at the
Fe/Fe-Al interface.17,18) It has been proposed that large angular Al2O3 inclusion form due
to heterogeneous nucleation of Al2O3 on FeOx inclusions after reduction by Al.
In this work, a new technique was developed to study the evolution of inclusion
formation in low alloyed Si/Mn de-oxidized steel. An experimental procedure was

38
designed to study inclusion formation immediately after deoxidizer addition and prior to
macro-mixing/homogenization. Additions of ferro-silicon, ferro-manganese and a
combination of both were made to steel to study the formation and morphology of the
transient inclusions.
2. EXPERIMENTAL PROCEDURE
Experiments were conducted to study the effect of ferroalloy dissolution and
micro-mixing on formation of inclusions. For these experiments, samplers were
fabricated as shown in Figure 1, using a plastic ball of diameter 40 mm, to which
styrofoam sections were attached to function as metal inlet and gas vent. To this
arrangement, ceramic coatings of silica and zircon were applied. These coatings were
dried for 48 hours before firing at 1173 K for 2 hours. After firing, the samplers had a
hollow spherical cavity of diameter 4 cm, with metal inlet and gas outlet of 1 cm by 1 cm
cross-section.

39
Figure 1. Schematic diagram of the samplers used for dissolution studies
Ferro-alloys are typically added to steel at a ratio on the order of 1:100 (10
kg/tonne). The amount of ferro-alloy added depends on the oxygen content of steel and
the target steel chemistry along with a recovery factor. In this work, a much smaller
volume of steel (as compared to the ladle) was used to replicate the industrial process
with a higher ferroalloy to steel ratio (1:50). This was done to cover the range of
chemistry variation that can be expected during the dissolution and micro-scale mixing
period in the ladle after ferroalloy addition. Keeping the ferroalloy/metal ratio high and
the solidification time short effectively quenches in the early stage inclusion
compositions that would presumably evolve to different compositions in a ladle with
lower Si or Mn in the steel. Any stable inclusions formed at this stage could also serve as
heterogeneous nucleation (and growth) sites for subsequent inclusion phases.

40
Ferro-alloy pieces of maximum dimension approximately 20 mm for Fe75Si and
10 mm for FeMn, with a weight of 5 gram were added to the sampler before filling with
steel. Table 1 shows the composition of the ferroalloys added for these experiments.
Three types of additions were made a) 5 gram ferro-silicon; b) 5 gram ferro-manganese
and c) 2.5 gram ferrosilicon + 2.5 gram ferro-manganese.
Table 1. Composition of ferro-alloys added
Wt % C Si S Mn P Ca Al Fe Fe75Si <0.1 73-78 <0.02 - <0.04 <0.6 <1.5 <27 FeMn 0.078 0.28 0.025 97.08 0.026 - - 2.5
The sampler was dipped into a crucible containing liquid steel, at 1873 K, under
induction heating. The crucible size was 10 cm internal diameter and 20 cm height
containing 7 kg of liquid steel. An inert atmosphere was maintained during the
experiments by blowing argon at the rate of 1 lit/min over the liquid steel in the crucible
to minimize oxidation.
The initial chemistry of the steel added to the sampler is shown in Table 2. After
the sampler was filled with liquid steel, it was taken out of the crucible and air cooled. A
filled sampler contained 240 gram of steel.
Table 2. Initial steel chemistry
Elements Fe C Si S Mn P Cu Cr Al Wt.% 99.65 0.05 0.07 0.0060 0.17 0.00 0.00 0.01 0.00

41
Figure 2 shows the sequence of events that presumably takes place in the sampler
during the experiment. A similar dissolution mechanism was described by
Argyropoulos9). The steel inside the sampler will solidify faster close to the edges as
compared to the center. Solidification will gradually progress towards the center. Ferro-
alloy particles will undergo dissolution and then micro-mix in the liquid steel. All these
processes compete with each other to provide for different composition and solidification
environments for inclusion formation and evolution. Further, inclusions will continue to
undergo phase transformation even after all the steel has solidified.
Figure 2. Schematic diagram showing the dissolution/diffusion sequence expected inside the sampler for a ferro-alloy lighter than steel
As the sampler is dipped into liquid steel, a layer of steel solidifies outside the
ceramic shell as shown in Figure 3. Based on the properties of the steel and the ceramic

42
shell (Table 3), the time required for the steel to completely solidify inside the sampler
was estimated to be about 70 seconds.
Figure 3. Representation of the sampler volume used for the solidification time calculation
The solidified spherical steel ball obtained from the sampler was cut along the
center in the vertical direction. The inclusion distribution across this cross-section was
studied using automated scanning electron microscope (ASPEX). Inclusions were
analyzed for size, shape, number-density and composition variation across the cross-
section. Samples were analyzed using arc spectroscopy for chemistry variation of the
steel. Total oxygen content in steel was measured using a Leco oxygen analyzer.
43
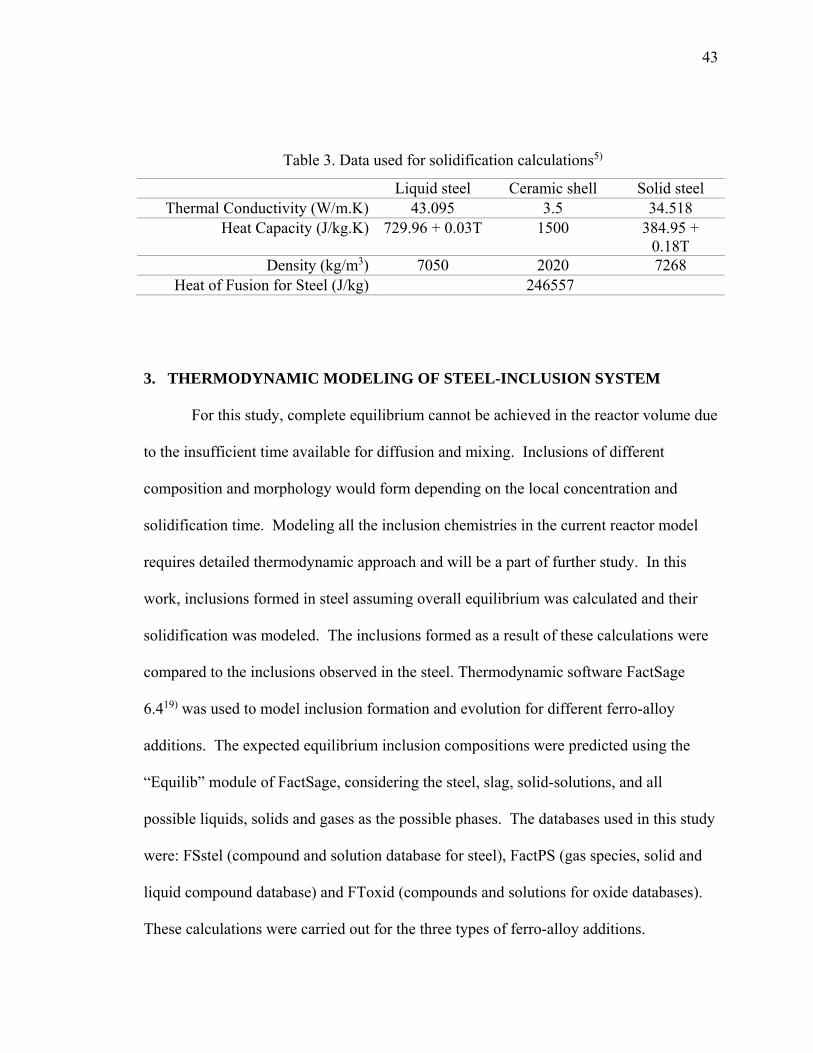
Table 3. Data used for solidification calculations5)
Liquid steel Ceramic shell Solid steel Thermal Conductivity (W/m.K) 43.095 3.5 34.518
Heat Capacity (J/kg.K) 729.96 + 0.03T 1500 384.95 + 0.18T
Density (kg/m3) 7050 2020 7268 Heat of Fusion for Steel (J/kg) 246557
3. THERMODYNAMIC MODELING OF STEEL-INCLUSION SYSTEM
For this study, complete equilibrium cannot be achieved in the reactor volume due
to the insufficient time available for diffusion and mixing. Inclusions of different
composition and morphology would form depending on the local concentration and
solidification time. Modeling all the inclusion chemistries in the current reactor model
requires detailed thermodynamic approach and will be a part of further study. In this
work, inclusions formed in steel assuming overall equilibrium was calculated and their
solidification was modeled. The inclusions formed as a result of these calculations were
compared to the inclusions observed in the steel. Thermodynamic software FactSage
6.419) was used to model inclusion formation and evolution for different ferro-alloy
additions. The expected equilibrium inclusion compositions were predicted using the
“Equilib” module of FactSage, considering the steel, slag, solid-solutions, and all
possible liquids, solids and gases as the possible phases. The databases used in this study
were: FSstel (compound and solution database for steel), FactPS (gas species, solid and
liquid compound database) and FToxid (compounds and solutions for oxide databases).
These calculations were carried out for the three types of ferro-alloy additions.
44
4. RESULTS AND DISCUSSIONS
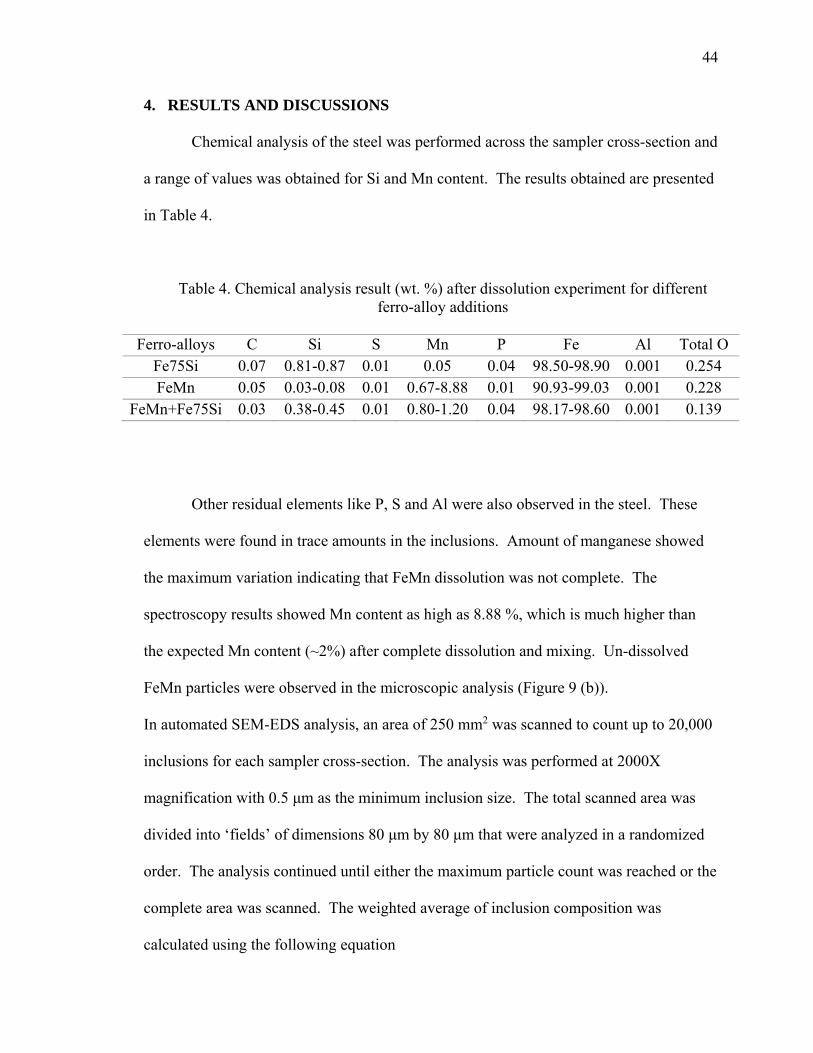
Chemical analysis of the steel was performed across the sampler cross-section and
a range of values was obtained for Si and Mn content. The results obtained are presented
in Table 4.
Table 4. Chemical analysis result (wt. %) after dissolution experiment for different ferro-alloy additions
Ferro-alloys C Si S Mn P Fe Al Total O
Fe75Si 0.07 0.81-0.87 0.01 0.05 0.04 98.50-98.90 0.001 0.254 FeMn 0.05 0.03-0.08 0.01 0.67-8.88 0.01 90.93-99.03 0.001 0.228
FeMn+Fe75Si 0.03 0.38-0.45 0.01 0.80-1.20 0.04 98.17-98.60 0.001 0.139
Other residual elements like P, S and Al were also observed in the steel. These
elements were found in trace amounts in the inclusions. Amount of manganese showed
the maximum variation indicating that FeMn dissolution was not complete. The
spectroscopy results showed Mn content as high as 8.88 %, which is much higher than
the expected Mn content (~2%) after complete dissolution and mixing. Un-dissolved
FeMn particles were observed in the microscopic analysis (Figure 9 (b)).
In automated SEM-EDS analysis, an area of 250 mm2 was scanned to count up to 20,000
inclusions for each sampler cross-section. The analysis was performed at 2000X
magnification with 0.5 μm as the minimum inclusion size. The total scanned area was
divided into ‘fields’ of dimensions 80 μm by 80 μm that were analyzed in a randomized
order. The analysis continued until either the maximum particle count was reached or the
complete area was scanned. The weighted average of inclusion composition was
calculated using the following equation

45
%∑ %
∑ (1)
where, Y represents any elemental constituent of the inclusion.
Effects of ferro-alloy dissolution on inclusion evolution were studied using
inclusion size and composition measurements from the SEM-EDS analysis. For
compositional analysis, inclusions greater than 2 µm were considered in order to
minimize the effect of matrix contribution. From the inclusion analysis data, the
composition variation of inclusions per mm along the height and the width was calculated
using the weighted average formula (equation 1).
Prior to the dissolution studies, a steel sample was acquired using an empty
reactor volume (sampler) to identify the type of inclusions present initially in the steel.
Typical inclusions observed in the sampler before any additions are included as Figure 4.
Most of these inclusions were FeO-MnO-SiO2 based liquid inclusions with about 6% (±
3) SiO2 and 10% (± 4) MnO.
(a) FeO-MnO based inclusions Figure 4. Types of inclusions observed before the ferro-alloy addition
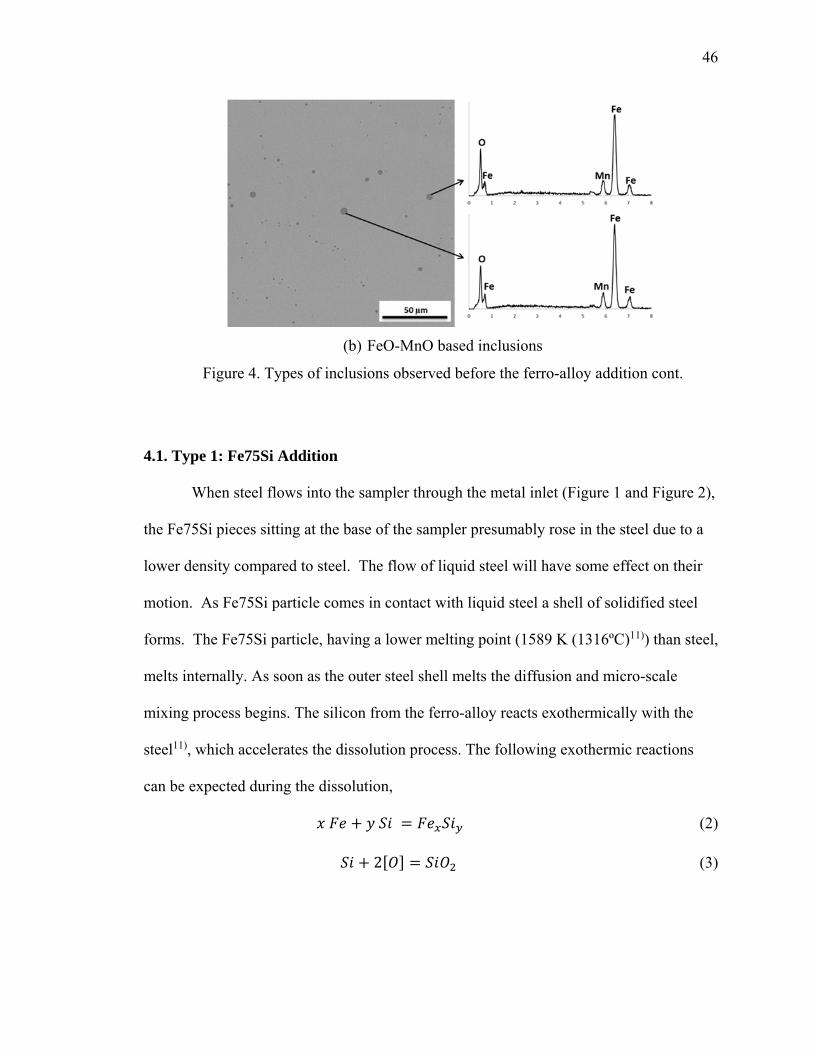
46
(b) FeO-MnO based inclusions
Figure 4. Types of inclusions observed before the ferro-alloy addition cont.
4.1. Type 1: Fe75Si Addition
When steel flows into the sampler through the metal inlet (Figure 1 and Figure 2),
the Fe75Si pieces sitting at the base of the sampler presumably rose in the steel due to a
lower density compared to steel. The flow of liquid steel will have some effect on their
motion. As Fe75Si particle comes in contact with liquid steel a shell of solidified steel
forms. The Fe75Si particle, having a lower melting point (1589 K (1316ºC)11)) than steel,
melts internally. As soon as the outer steel shell melts the diffusion and micro-scale
mixing process begins. The silicon from the ferro-alloy reacts exothermically with the
steel11), which accelerates the dissolution process. The following exothermic reactions
can be expected during the dissolution,
(2)
2 (3)

47
About 5 gram of Fe75Si was added to 240 gram of steel, which would result in a
final composition of 1.5% Si by weight on complete dissolution. At this composition, the
silicon should completely dissolve in the steel which was verified by the absence of any
un-dissolved particles. However, the measured chemistry (Table 4) was less than
expected due to overflow of the steel out of the gas outlet of the sampler during filling. A
change in the steel chemistry (Si up to 0.2% and Mn up to 0.05%) in the ladle was
observed after the experiment. The particles observed in the sampler due to Fe75Si
dissolution were mainly oxide inclusions with an average chemistry shown in Table 5.
Table 5. Average SiO2 and FeO concentration in inclusions (wt. %) formed after Fe75Si dissolution and micro-mixing. Other components (CaO, Al2O3, MnO and S) were less
than 2%.
Size range SiO2 FeO 2 -3 µm 23 ± 8 76 ± 5 3 - 5 µm 34 ± 12 64 ± 7 5 - 10 µm 44 ± 14 54 ± 9 >10 µm 49 ± 17 48 ± 10
The FeO to SiO2 ratio in the inclusions decreases strongly with increasing size. A
possible explanation is that the smaller inclusions formed first at higher oxygen potentials
and so the FeO-SiO2 phase was richer in FeO. Since the inclusions are two-phase (solid
SiO2 and FeO-SiO2 slag), this may reflect a higher fraction of solid SiO2 in the
inclusions.
To minimize the matrix effects, composition was only measured for inclusions
over 2 µm in size. For these inclusions, the average composition varied between 18-35%
of Si (Figure 5). In the vertical direction, larger inclusions with higher average Si content
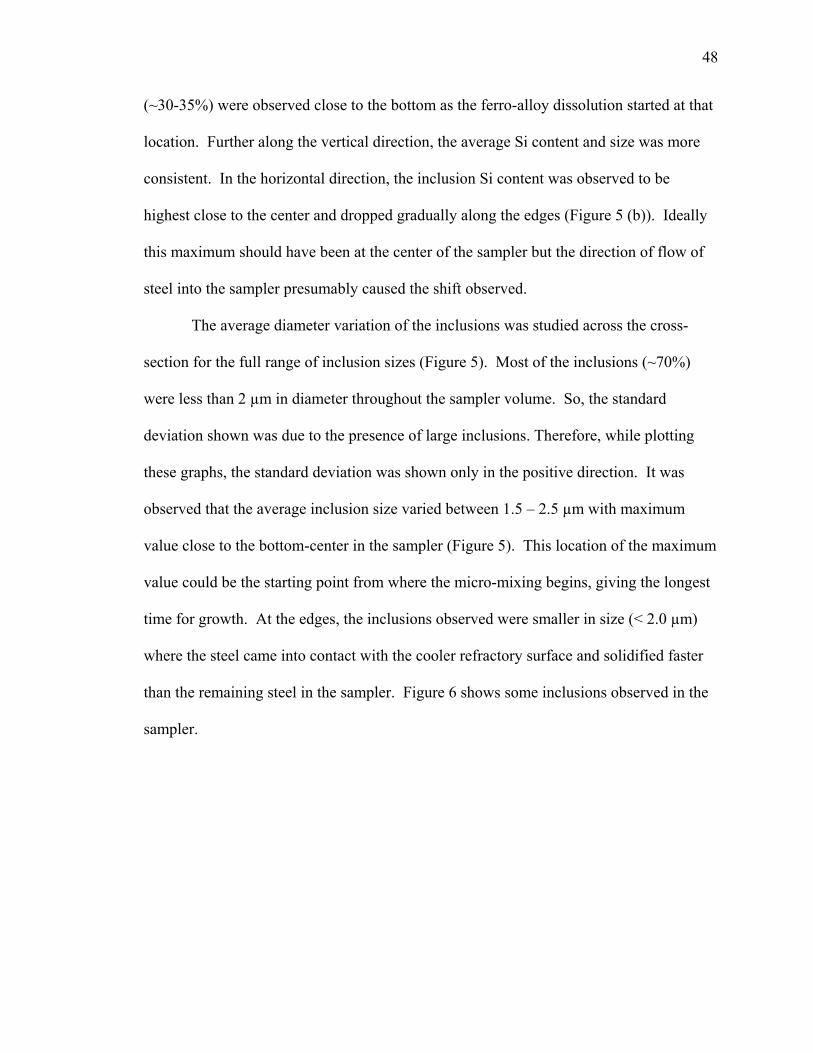
48
(~30-35%) were observed close to the bottom as the ferro-alloy dissolution started at that
location. Further along the vertical direction, the average Si content and size was more
consistent. In the horizontal direction, the inclusion Si content was observed to be
highest close to the center and dropped gradually along the edges (Figure 5 (b)). Ideally
this maximum should have been at the center of the sampler but the direction of flow of
steel into the sampler presumably caused the shift observed.
The average diameter variation of the inclusions was studied across the cross-
section for the full range of inclusion sizes (Figure 5). Most of the inclusions (~70%)
were less than 2 µm in diameter throughout the sampler volume. So, the standard
deviation shown was due to the presence of large inclusions. Therefore, while plotting
these graphs, the standard deviation was shown only in the positive direction. It was
observed that the average inclusion size varied between 1.5 – 2.5 µm with maximum
value close to the bottom-center in the sampler (Figure 5). This location of the maximum
value could be the starting point from where the micro-mixing begins, giving the longest
time for growth. At the edges, the inclusions observed were smaller in size (< 2.0 µm)
where the steel came into contact with the cooler refractory surface and solidified faster
than the remaining steel in the sampler. Figure 6 shows some inclusions observed in the
sampler.

49
(a)
(b)
Figure 5. Results of inclusion analysis across the spherical sampler cross-section after Fe75Si dissolution. Inclusion Si content (for >2.0 µm) and diameter variation (for
inclusions of all sizes) along the a) vertical and b) horizontal dimension of the sampler.
Theoretically, for a Fe75Si particle in the steel, a local maximum concentration of
75 wt. % Si can be achieved. However, as the particle dissolves this maximum decreases.

50
The final Si concentration achieved is about 0.9 wt. % (Table 4). Equilibrium
calculations can be performed for all the local concentrations to predict which inclusions
are expected. Thermodynamic predictions, with expected steel chemistry after Fe75Si
addition and assuming complete homogenization, showed the formation of predominantly
SiO2 (solid) with some liquid phase inclusions at 1873 K. These liquid phase inclusions
were predicted to have SiO2 (~70%) with Al2O3 (<10%), FeO (3-5%) and MnO (3-5%)
as the significant minor components. Majority of the inclusions were observed with this
liquid phase within SiO2 inclusions (Figure 6 (a) and Figure 6(c)). Also, as the
temperature drops, cristobalite (SiO2) phase precipitation was predicted within the
inclusions. An example of this can be seen in Figure 6 (a), where the SiO2 rich dark
phase precipitated in a glassy slag matrix. Further decrease in temperature would lead to
the precipitation of mullite (3Al2O3.2SiO2) at 1759 K and pure iron (Fe) precipitation at
1738 K. An example of Fe precipitation was observed as white globules in a slag matrix
(Figure 6 (c)). The equilibrium calculations also showed the presence of stable liquid
slag phase even at low temperatures (< 1673 K) resulting in rounded inclusions. Liquid
inclusions with varying FeO-SiO2 content were also observed in the analysis. The
evolution of these inclusions can be observed in Figure 7.

51
(a) Liquid phase (SiO2-MnO-FeO-Al2O3) within SiO2 inclusion
(b) High FeO within SiO2 inclusion
(c) Fe particle within SiO2-CaO-Al2O3 inclusion Figure 6. Types of inclusion observed after Fe75Si dissolution
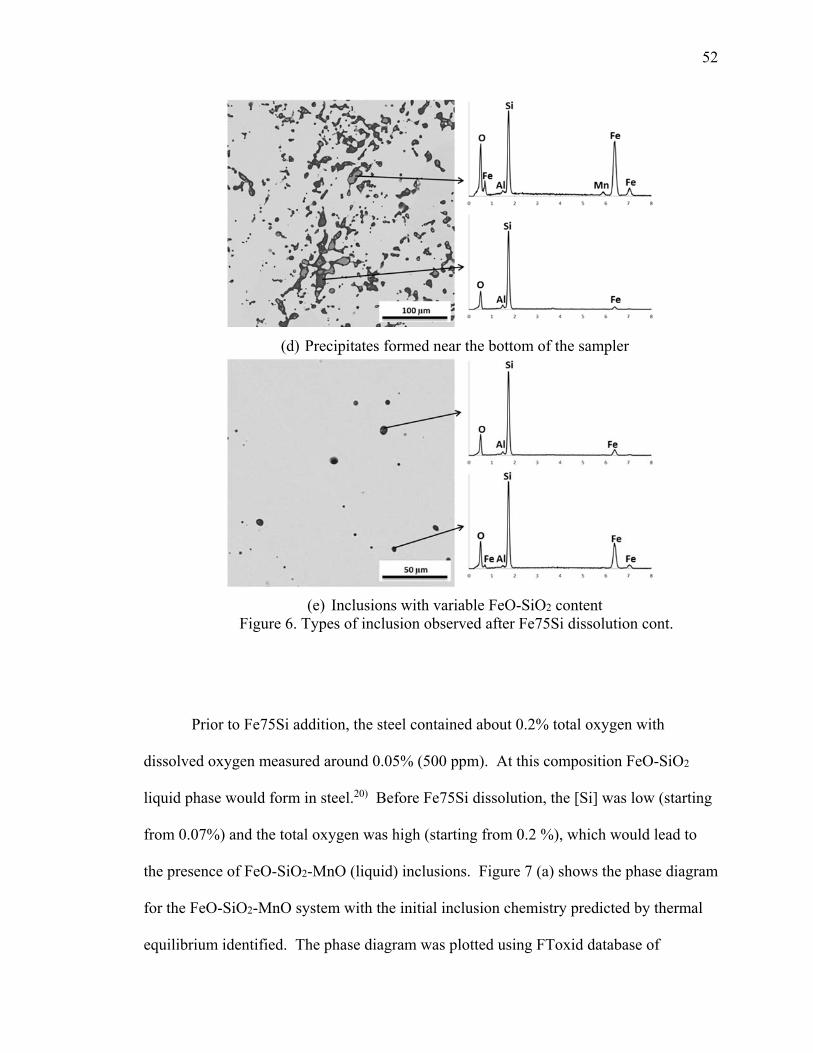
52
(d) Precipitates formed near the bottom of the sampler
(e) Inclusions with variable FeO-SiO2 content Figure 6. Types of inclusion observed after Fe75Si dissolution cont.
Prior to Fe75Si addition, the steel contained about 0.2% total oxygen with
dissolved oxygen measured around 0.05% (500 ppm). At this composition FeO-SiO2
liquid phase would form in steel.20) Before Fe75Si dissolution, the [Si] was low (starting
from 0.07%) and the total oxygen was high (starting from 0.2 %), which would lead to
the presence of FeO-SiO2-MnO (liquid) inclusions. Figure 7 (a) shows the phase diagram
for the FeO-SiO2-MnO system with the initial inclusion chemistry predicted by thermal
equilibrium identified. The phase diagram was plotted using FToxid database of
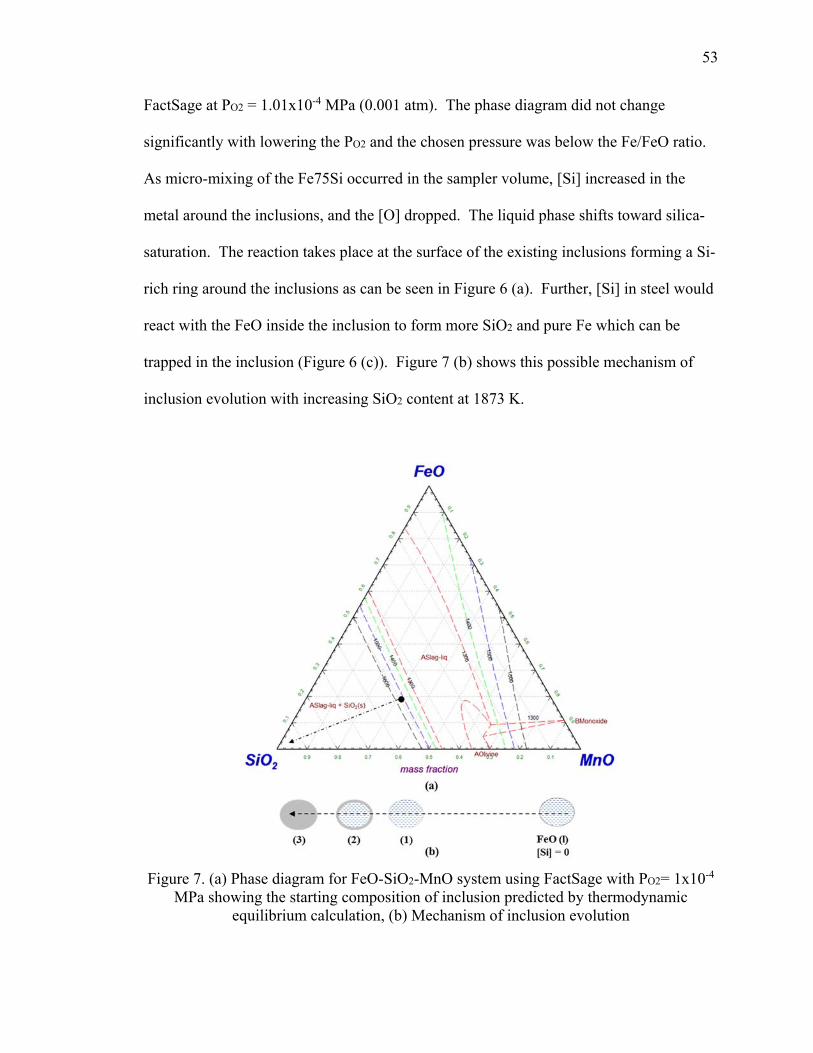
53
FactSage at PO2 = 1.01x10⁻⁴ MPa (0.001 atm). The phase diagram did not change
significantly with lowering the PO2 and the chosen pressure was below the Fe/FeO ratio.
As micro-mixing of the Fe75Si occurred in the sampler volume, [Si] increased in the
metal around the inclusions, and the [O] dropped. The liquid phase shifts toward silica-
saturation. The reaction takes place at the surface of the existing inclusions forming a Si-
rich ring around the inclusions as can be seen in Figure 6 (a). Further, [Si] in steel would
react with the FeO inside the inclusion to form more SiO2 and pure Fe which can be
trapped in the inclusion (Figure 6 (c)). Figure 7 (b) shows this possible mechanism of
inclusion evolution with increasing SiO2 content at 1873 K.
Figure 7. (a) Phase diagram for FeO-SiO2-MnO system using FactSage with PO2= 1x10⁻⁴ MPa showing the starting composition of inclusion predicted by thermodynamic
equilibrium calculation, (b) Mechanism of inclusion evolution
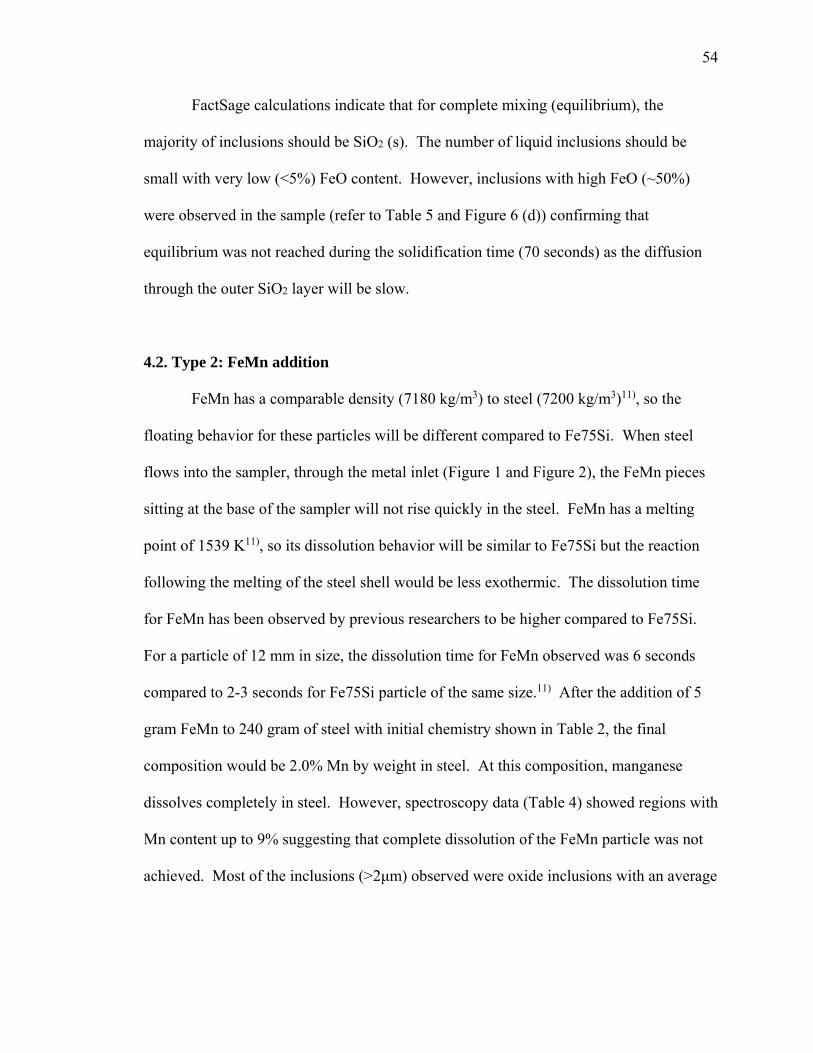
54
FactSage calculations indicate that for complete mixing (equilibrium), the
majority of inclusions should be SiO2 (s). The number of liquid inclusions should be
small with very low (<5%) FeO content. However, inclusions with high FeO (~50%)
were observed in the sample (refer to Table 5 and Figure 6 (d)) confirming that
equilibrium was not reached during the solidification time (70 seconds) as the diffusion
through the outer SiO2 layer will be slow.
4.2. Type 2: FeMn addition
FeMn has a comparable density (7180 kg/m3) to steel (7200 kg/m3)11), so the
floating behavior for these particles will be different compared to Fe75Si. When steel
flows into the sampler, through the metal inlet (Figure 1 and Figure 2), the FeMn pieces
sitting at the base of the sampler will not rise quickly in the steel. FeMn has a melting
point of 1539 K11), so its dissolution behavior will be similar to Fe75Si but the reaction
following the melting of the steel shell would be less exothermic. The dissolution time
for FeMn has been observed by previous researchers to be higher compared to Fe75Si.
For a particle of 12 mm in size, the dissolution time for FeMn observed was 6 seconds
compared to 2-3 seconds for Fe75Si particle of the same size.11) After the addition of 5
gram FeMn to 240 gram of steel with initial chemistry shown in Table 2, the final
composition would be 2.0% Mn by weight in steel. At this composition, manganese
dissolves completely in steel. However, spectroscopy data (Table 4) showed regions with
Mn content up to 9% suggesting that complete dissolution of the FeMn particle was not
achieved. Most of the inclusions (>2μm) observed were oxide inclusions with an average
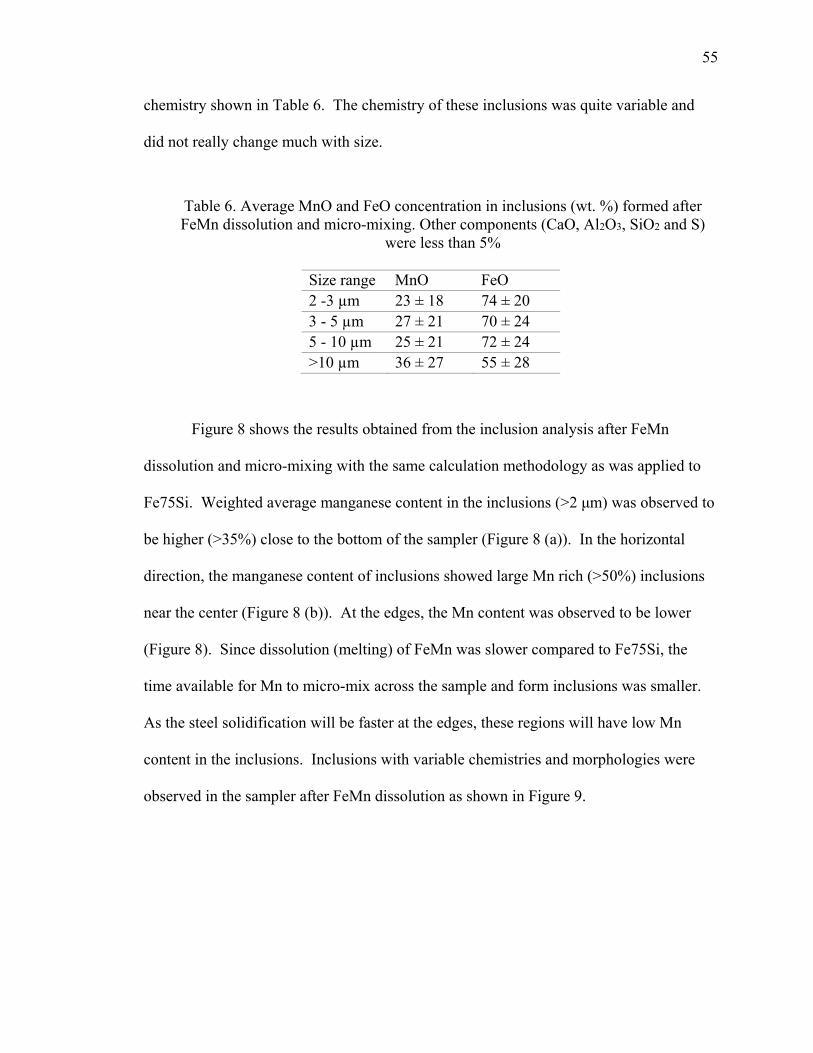
55
chemistry shown in Table 6. The chemistry of these inclusions was quite variable and
did not really change much with size.
Table 6. Average MnO and FeO concentration in inclusions (wt. %) formed after FeMn dissolution and micro-mixing. Other components (CaO, Al2O3, SiO2 and S)
were less than 5%
Size range MnO FeO 2 -3 µm 23 ± 18 74 ± 20 3 - 5 µm 27 ± 21 70 ± 24 5 - 10 µm 25 ± 21 72 ± 24 >10 µm 36 ± 27 55 ± 28
Figure 8 shows the results obtained from the inclusion analysis after FeMn
dissolution and micro-mixing with the same calculation methodology as was applied to
Fe75Si. Weighted average manganese content in the inclusions (>2 μm) was observed to
be higher (>35%) close to the bottom of the sampler (Figure 8 (a)). In the horizontal
direction, the manganese content of inclusions showed large Mn rich (>50%) inclusions
near the center (Figure 8 (b)). At the edges, the Mn content was observed to be lower
(Figure 8). Since dissolution (melting) of FeMn was slower compared to Fe75Si, the
time available for Mn to micro-mix across the sample and form inclusions was smaller.
As the steel solidification will be faster at the edges, these regions will have low Mn
content in the inclusions. Inclusions with variable chemistries and morphologies were
observed in the sampler after FeMn dissolution as shown in Figure 9.
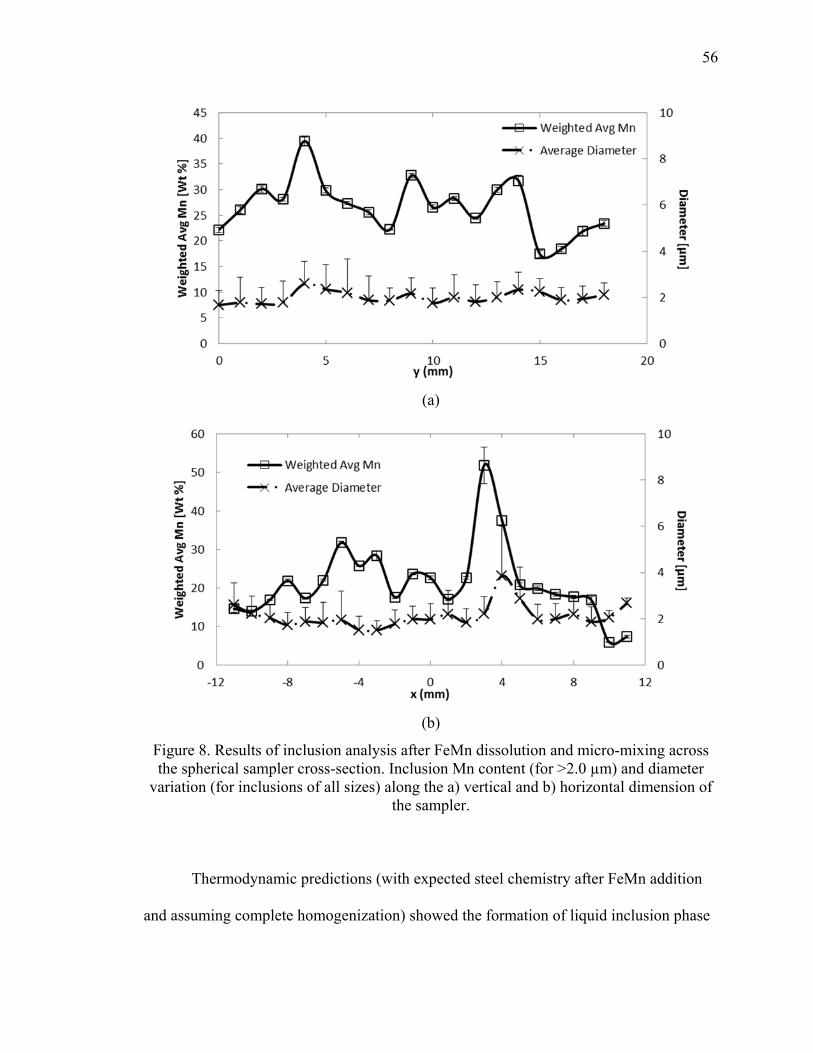
56
(a)
(b)
Figure 8. Results of inclusion analysis after FeMn dissolution and micro-mixing across the spherical sampler cross-section. Inclusion Mn content (for >2.0 µm) and diameter
variation (for inclusions of all sizes) along the a) vertical and b) horizontal dimension of the sampler.
Thermodynamic predictions (with expected steel chemistry after FeMn addition
and assuming complete homogenization) showed the formation of liquid inclusion phase
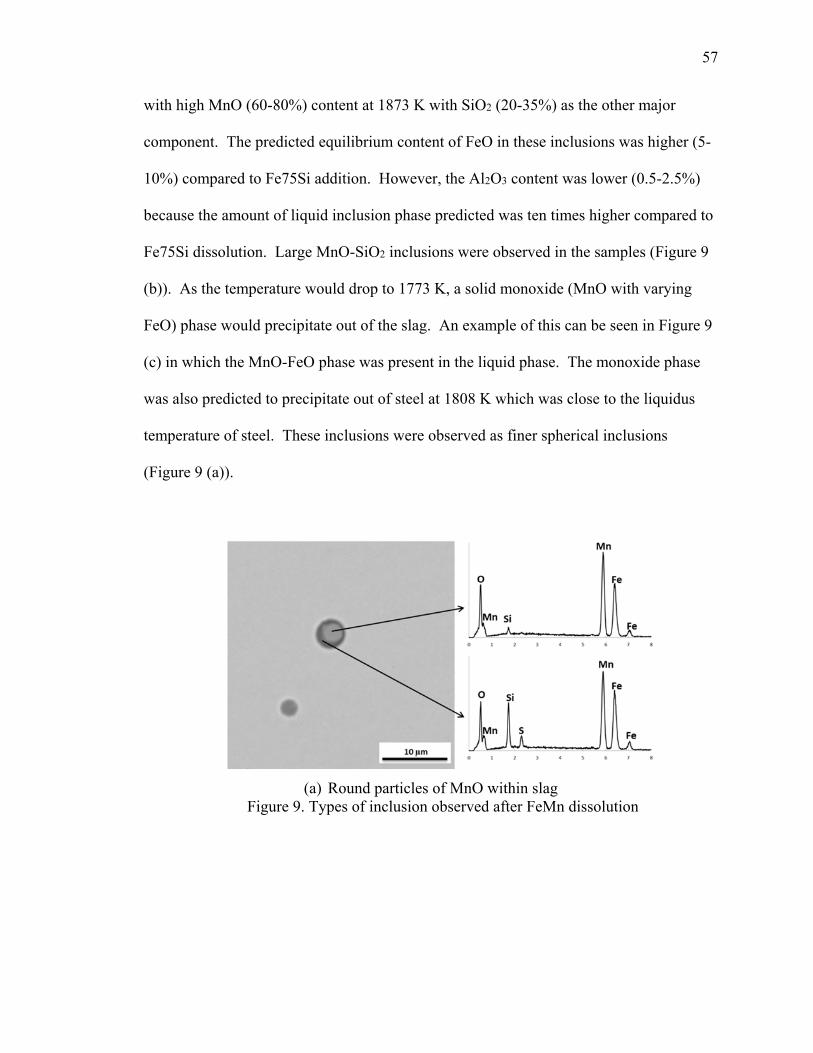
57
with high MnO (60-80%) content at 1873 K with SiO2 (20-35%) as the other major
component. The predicted equilibrium content of FeO in these inclusions was higher (5-
10%) compared to Fe75Si addition. However, the Al2O3 content was lower (0.5-2.5%)
because the amount of liquid inclusion phase predicted was ten times higher compared to
Fe75Si dissolution. Large MnO-SiO2 inclusions were observed in the samples (Figure 9
(b)). As the temperature would drop to 1773 K, a solid monoxide (MnO with varying
FeO) phase would precipitate out of the slag. An example of this can be seen in Figure 9
(c) in which the MnO-FeO phase was present in the liquid phase. The monoxide phase
was also predicted to precipitate out of steel at 1808 K which was close to the liquidus
temperature of steel. These inclusions were observed as finer spherical inclusions
(Figure 9 (a)).
(a) Round particles of MnO within slag Figure 9. Types of inclusion observed after FeMn dissolution
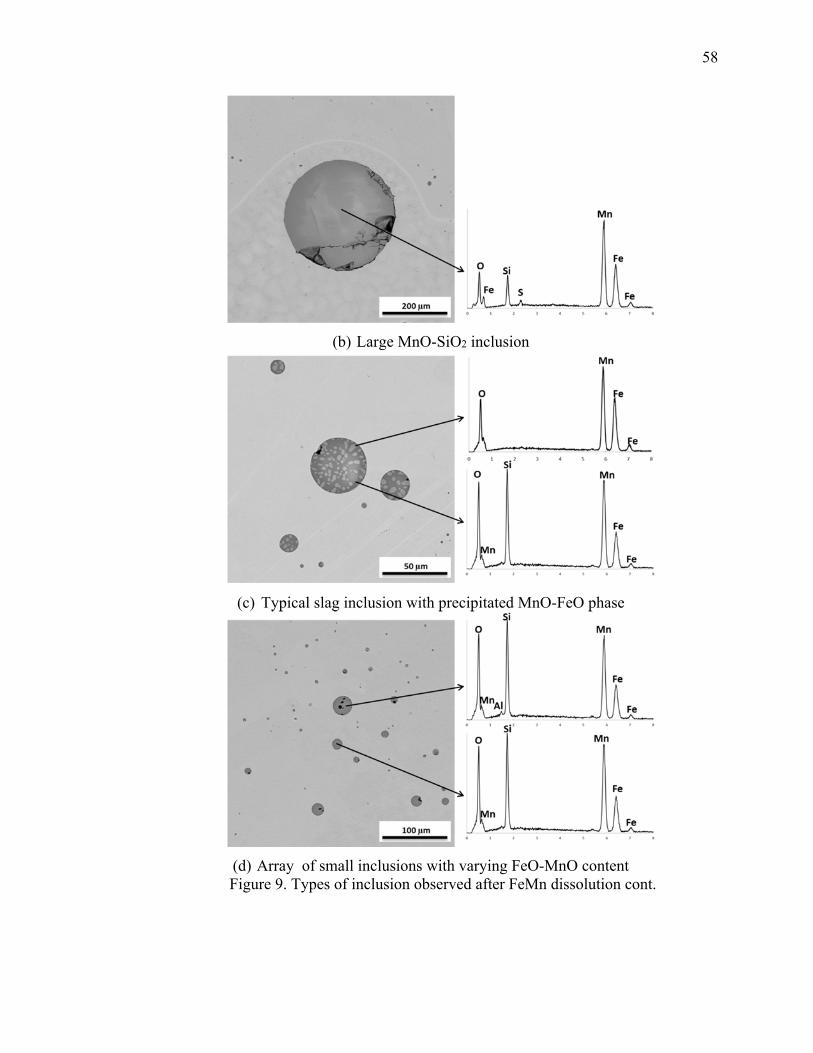
58
(b) Large MnO-SiO2 inclusion
(c) Typical slag inclusion with precipitated MnO-FeO phase
(d) Array of small inclusions with varying FeO-MnO content Figure 9. Types of inclusion observed after FeMn dissolution cont.
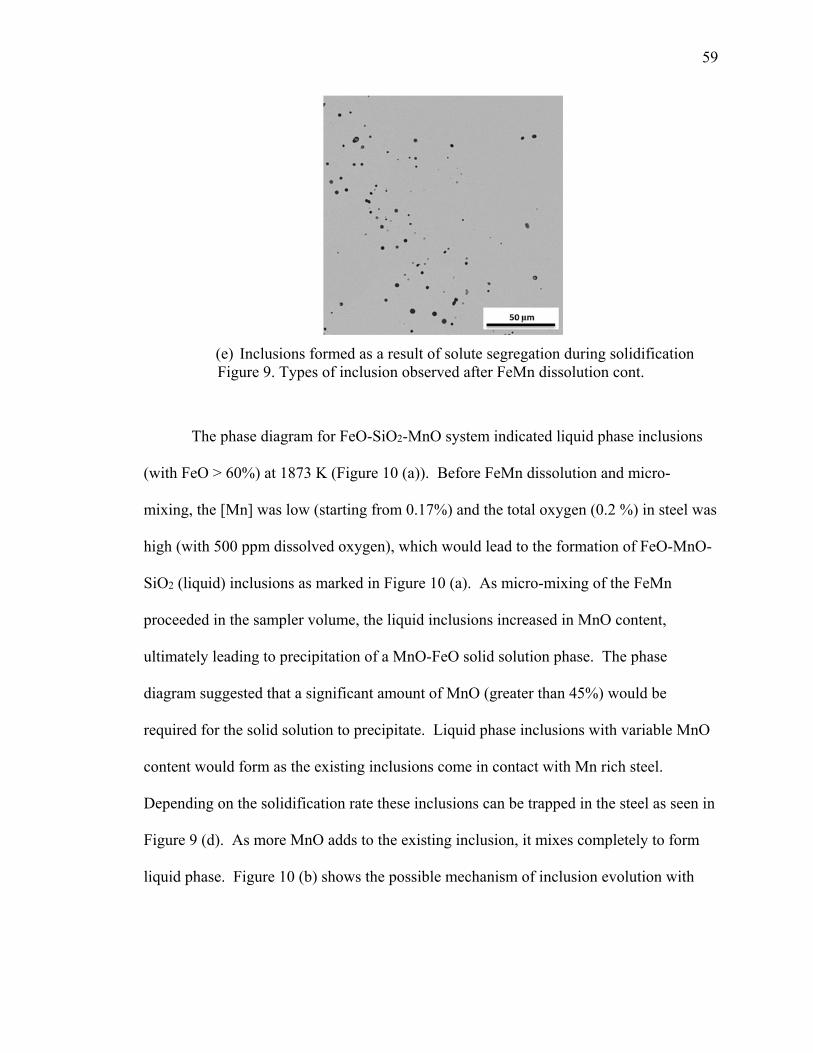
59
(e) Inclusions formed as a result of solute segregation during solidification Figure 9. Types of inclusion observed after FeMn dissolution cont.
The phase diagram for FeO-SiO2-MnO system indicated liquid phase inclusions
(with FeO > 60%) at 1873 K (Figure 10 (a)). Before FeMn dissolution and micro-
mixing, the [Mn] was low (starting from 0.17%) and the total oxygen (0.2 %) in steel was
high (with 500 ppm dissolved oxygen), which would lead to the formation of FeO-MnO-
SiO2 (liquid) inclusions as marked in Figure 10 (a). As micro-mixing of the FeMn
proceeded in the sampler volume, the liquid inclusions increased in MnO content,
ultimately leading to precipitation of a MnO-FeO solid solution phase. The phase
diagram suggested that a significant amount of MnO (greater than 45%) would be
required for the solid solution to precipitate. Liquid phase inclusions with variable MnO
content would form as the existing inclusions come in contact with Mn rich steel.
Depending on the solidification rate these inclusions can be trapped in the steel as seen in
Figure 9 (d). As more MnO adds to the existing inclusion, it mixes completely to form
liquid phase. Figure 10 (b) shows the possible mechanism of inclusion evolution with
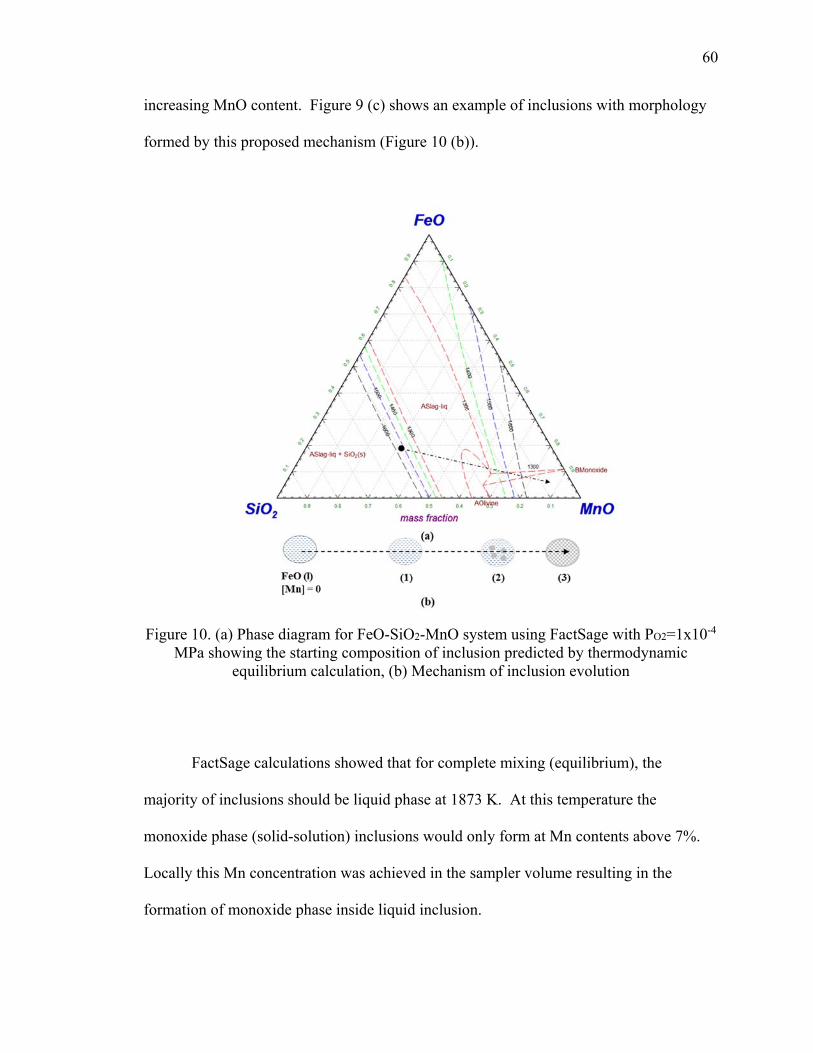
60
increasing MnO content. Figure 9 (c) shows an example of inclusions with morphology
formed by this proposed mechanism (Figure 10 (b)).
Figure 10. (a) Phase diagram for FeO-SiO2-MnO system using FactSage with PO2=1x10⁻⁴ MPa showing the starting composition of inclusion predicted by thermodynamic
equilibrium calculation, (b) Mechanism of inclusion evolution
FactSage calculations showed that for complete mixing (equilibrium), the
majority of inclusions should be liquid phase at 1873 K. At this temperature the
monoxide phase (solid-solution) inclusions would only form at Mn contents above 7%.
Locally this Mn concentration was achieved in the sampler volume resulting in the
formation of monoxide phase inside liquid inclusion.

61
4.3. Type 3: Fe75Si + FeMn addition
For the third type, equal amounts (2.5 gram each) of Fe75Si and FeMn were
placed in the sampler. As discussed in the previous sections, FeMn is of similar density
whereas Fe75Si has smaller density compared to steel. As steel flows, FeMn particles
should stay at the bottom and Fe75Si particles should rise in the steel. As the melting
points for both these alloys are much lower compared to that of steel, their dissolution
process is similar. However, FeMn particles take longer to dissolve than Fe75Si
particles. So, the micro-mixing of Si would start before Mn. Inclusion population
fraction as a function of concentration ranges is shown in Figure 11.
Figure 11. Inclusion population fractions in different concentration ranges for Fe75Si+FeMn addition
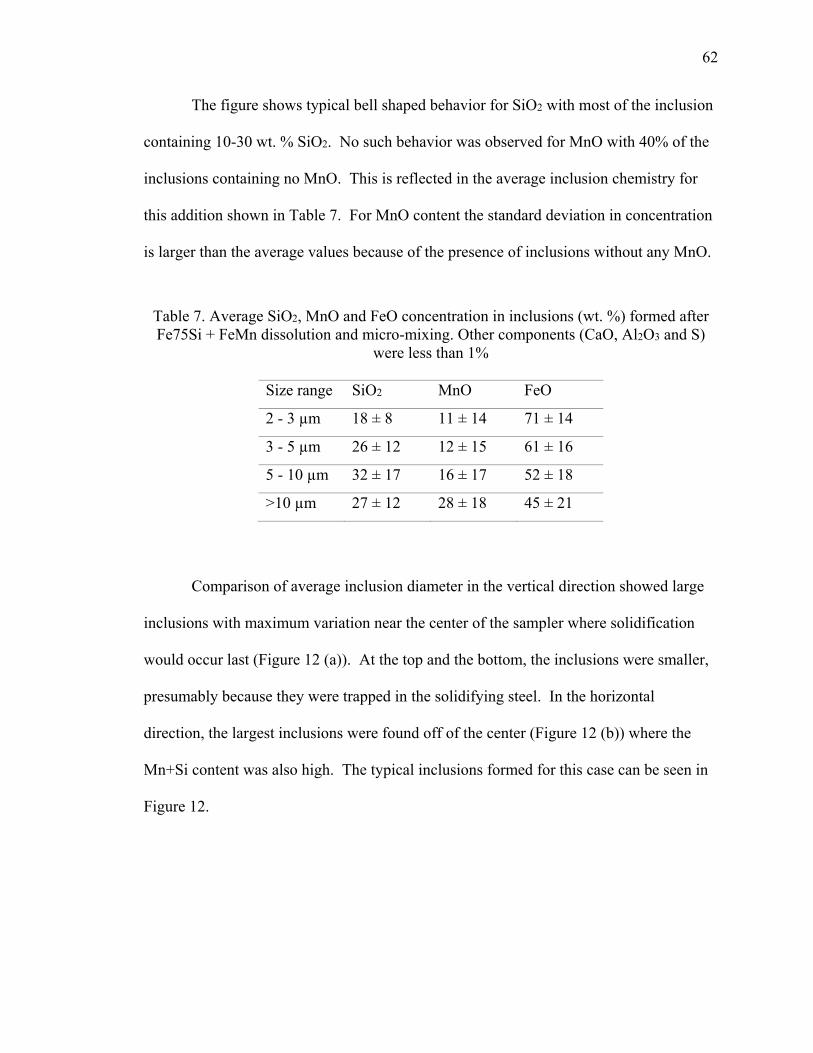
62
The figure shows typical bell shaped behavior for SiO2 with most of the inclusion
containing 10-30 wt. % SiO2. No such behavior was observed for MnO with 40% of the
inclusions containing no MnO. This is reflected in the average inclusion chemistry for
this addition shown in Table 7. For MnO content the standard deviation in concentration
is larger than the average values because of the presence of inclusions without any MnO.
Table 7. Average SiO2, MnO and FeO concentration in inclusions (wt. %) formed after Fe75Si + FeMn dissolution and micro-mixing. Other components (CaO, Al2O3 and S)
were less than 1%
Size range SiO2 MnO FeO
2 - 3 µm 18 ± 8 11 ± 14 71 ± 14
3 - 5 µm 26 ± 12 12 ± 15 61 ± 16
5 - 10 µm 32 ± 17 16 ± 17 52 ± 18
>10 µm 27 ± 12 28 ± 18 45 ± 21
Comparison of average inclusion diameter in the vertical direction showed large
inclusions with maximum variation near the center of the sampler where solidification
would occur last (Figure 12 (a)). At the top and the bottom, the inclusions were smaller,
presumably because they were trapped in the solidifying steel. In the horizontal
direction, the largest inclusions were found off of the center (Figure 12 (b)) where the
Mn+Si content was also high. The typical inclusions formed for this case can be seen in
Figure 12.

63
(a)
(b)
Figure 12. Results of inclusion analysis after FeMn+Fe75Si dissolution and micro-mixing across the spherical sampler cross-section. Inclusion Mn+Si content (for >2.0 µm) and
diameter variation (for inclusions of all sizes) along the a) vertical and b) horizontal dimension of the sampler.
Thermodynamic predictions, with expected steel chemistry after Fe75Si and
FeMn addition assuming complete homogenization, showed the formation of a liquid

64
phase with high SiO2 (55-60%) and MnO (25-35%) content at 1873 K. Other
constituents were FeO (~5%) and Al2O3 (5-7%). The solid cristobalite (SiO2) phase was
also predicted to form in steel at this temperature. The amount of the cristobalite phase
was predicted to increase with decreasing temperature. The SiO2-rich liquid phase itself
would precipitate out cristobalite phase at about 1738 K. This can be observed in the
elemental map shown in Figure 14 and the typical inclusions shown in Figure 13.
In Figure 13 (a) and Figure 13 (b), MnO-SiO2 inclusions with SiO2-rich phase around the
inclusions can be observed. These were the most common inclusions presumably formed
similar to the FeO-SiO2 inclusions shown in Figure 7 (b). Figure 13 (c) showed an
example of a MnO-SiO2 inclusion with an Fe metal droplet inside with a SiO2-rich outer
layer. This inclusion could possibly form as a result of the following reaction:
2 (4)
(a) MnO-SiO2 inclusions with of SiO2 rich region Figure 13. Types of inclusion observed after FeMn+Fe75Si dissolution
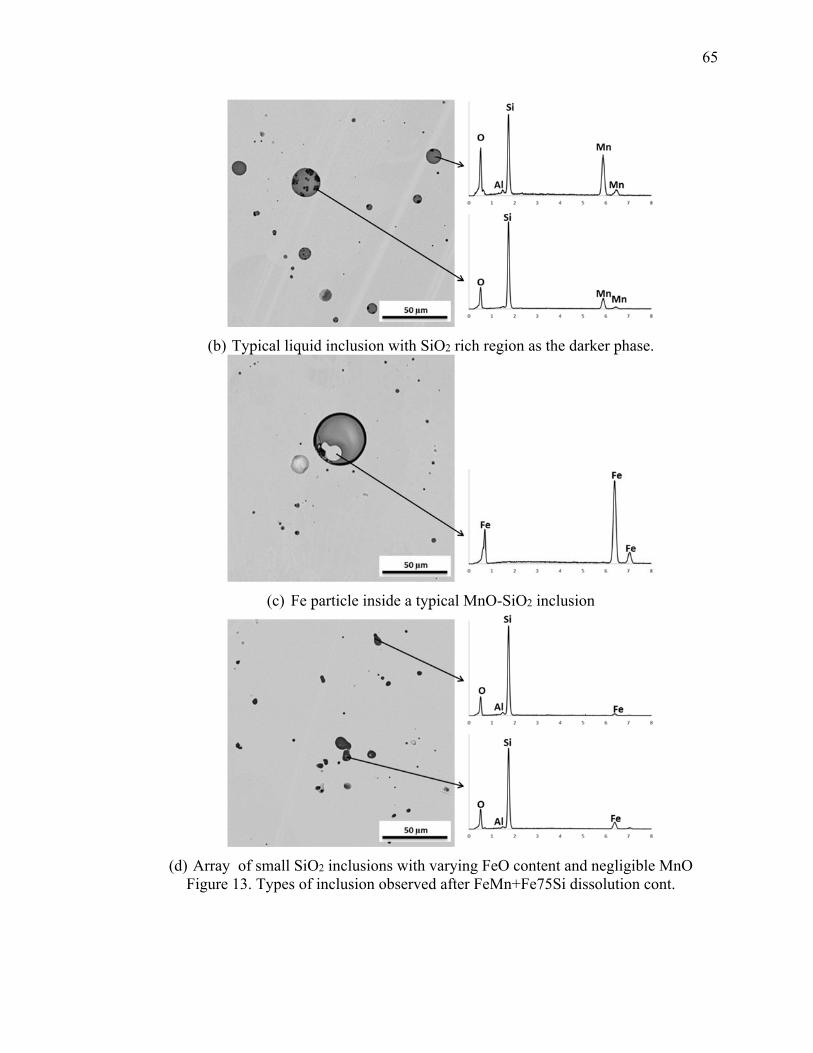
65
(b) Typical liquid inclusion with SiO2 rich region as the darker phase.
(c) Fe particle inside a typical MnO-SiO2 inclusion
(d) Array of small SiO2 inclusions with varying FeO content and negligible MnO Figure 13. Types of inclusion observed after FeMn+Fe75Si dissolution cont.
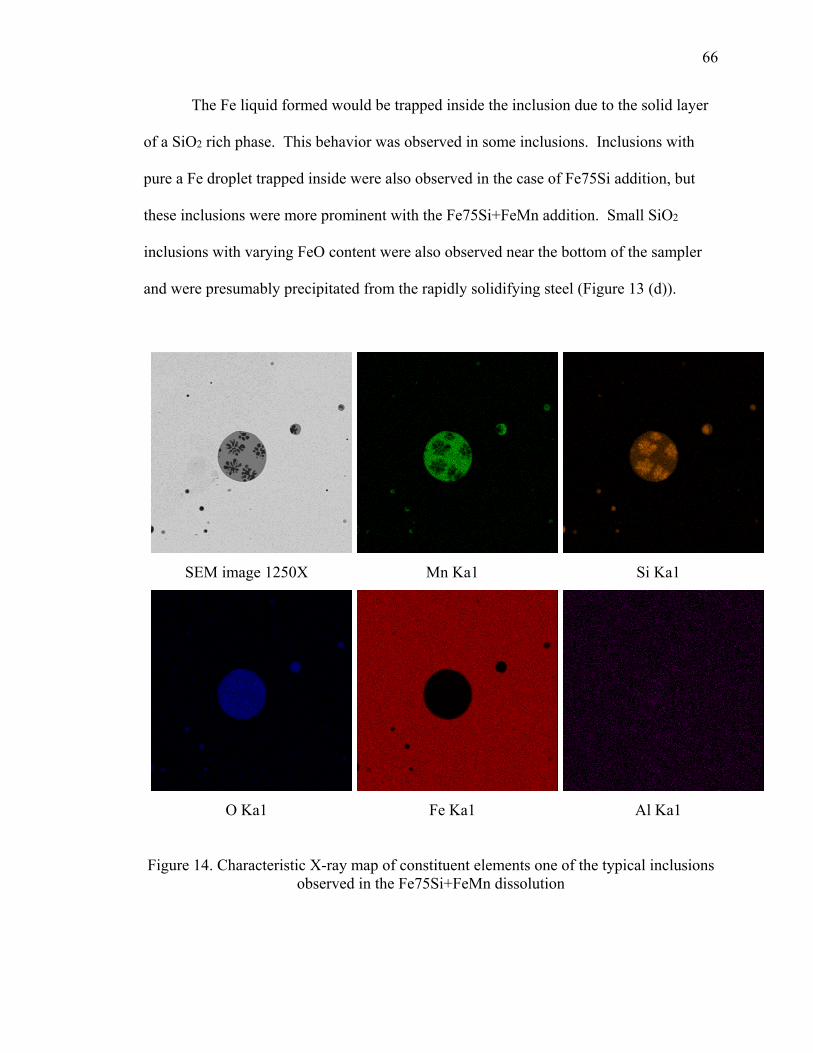
66
The Fe liquid formed would be trapped inside the inclusion due to the solid layer
of a SiO2 rich phase. This behavior was observed in some inclusions. Inclusions with
pure a Fe droplet trapped inside were also observed in the case of Fe75Si addition, but
these inclusions were more prominent with the Fe75Si+FeMn addition. Small SiO2
inclusions with varying FeO content were also observed near the bottom of the sampler
and were presumably precipitated from the rapidly solidifying steel (Figure 13 (d)).
SEM image 1250X Mn Ka1 Si Ka1
O Ka1
Fe Ka1
Al Ka1
Figure 14. Characteristic X-ray map of constituent elements one of the typical inclusions observed in the Fe75Si+FeMn dissolution

67
5. CONCLUSIONS
A methodology to study the formation and evolution of inclusions soon after ferroalloy
additions (for alloying or de-oxidation) has been developed. The present work revealed
the evolution of inclusions formed in low carbon steel during and immediately after
ferroalloy dissolution. The three cases studied were additions of ferro-silicon, ferro-
manganese and a combination of both. Different dissolution behaviors were presumed
based on work by Argyropolous9) for the ferroalloy additions. Ferro-silicon (less dense
than steel) floated in the bath and dissolved rapidly compared to ferro-manganese
(comparable density with steel) which took longer time to rise and dissolve.
The composition of liquid inclusions varied depending on the ferro-alloy used as
did the morphology. The results are summarized below:
1. For all three ferroalloy additions, inclusion formation began with an FeO-
rich phase due to the high initial oxygen content in steel. As the
deoxidizer was mixed into the liquid steel, it reacted with both the oxygen
dissolved in the steel and at the surface of FeO-rich inclusions.
2. For the Fe75Si addition, Si reacted at the surface of the inclusion forming
an SiO2 rich layer which can slow down the further transformation of
these inclusions.
3. For the FeMn addition, solid solution of FeO-MnO was precipitated inside
the liquid inclusions. As these inclusions are liquid and have no solid
interface, they will be easier to transform.

68
4. For the Fe75Si+FeMn addition, de-oxidation will be more effective
reducing the FeO in the existing inclusions to Fe. These inclusions form
liquid MnO-SiO2 layer on the outside.
5. All inclusions were liquid, with the possible exception of the ones that had
high SiO2 concentration on the surface. During processing the liquid
inclusions would have time to transform. However, the solid inclusions
would be difficult to transform but could serve as nucleation sites for later
stage inclusion growth.
Inclusions in their initial stage of evolution were quenched in a sampler volume
which resulted in the development of an understanding of mechanisms for inclusion
formation. In the case of de-oxidation or alloy addition in a ladle, most of these transient
inclusions would transform and equilibrate with steel, given sufficient time. The contact
time between steel and inclusions in a ladle is of the order of 30 minutes compared to the
70 second time scale of this work. However, the SiO2 layer (possibly solid) on the
outside of some small inclusions would prevent them from transforming. These
inclusions can further act as heterogeneous nucleation sites for secondary inclusions in
subsequent processes. An approach like this can help in predicting early stage inclusion
which will eventually help in understanding the nucleation and growth of inclusions in
the later stages.
ACKNOWLEDGEMENT
The authors would like to express their sincere appreciation and gratitude for the
late Professor Kent D. Peaslee for providing guidance and support for this research and
for always being an inspiration for us.

69
REFERENCES
1) R. Kiessling: “Non-metallic inclusions in steel”- Part III, 2nd edn, The Institute of Materials, London, (1978), O1.
2) L. F. Zhang and B. G. Thomas: Metall. Mater. Trans. B, 37 (2006), 733. 3) M. Nadif, J. Lehmann, M. Burty and J. F. Domgin: Proc. 7th Int. Conf. on Clean
Steel, Hungarian Mining and Metall. Soc., Balatonfured, Hungary, (2007), 38.
4) L. Zhang and B.G. Thomas: XXIV National Steelmaking Symp., Morelia, Mich, Mexico, (2003), 138.
5) L. Zhang: J. Iron Steel Res. Int., 13 (2006), 1. 6) M. M. Pande, M. Guo, X. Guo, D. Geysen, S. Devisscher, B. Blanpain and P
Wollants: Ironmaking and Steelmaking, 37 (2010), 502.
7) S. Abraham, R. Klein, R. Bodnar and O. Dremailova: MS&T, 2 (2006), 89.
8) S. Abraham, R. Klein, R. Bodnar and O. Dremailova: MS&T, 2 (2006), 109.
9) S. A. Argyropoulos: Electric Furnace Proc., Detroit, Mich., USA, 41 (1983), 81.
10) S. A. Argyropoulos and R. I. L. Guthrie: Steelmaking Conf. Proc, Iron & Steel Soc. of AIME, Pittsburgh, PA, USA, (1982), 156.
11) Y. E. Lee, H. Berg and B. Jensen: Ironmaking and Steelmaking, 22 (1995), 486.
12) L. Zhang and B. G. Thomas: ISIJ Int., 43 (2003), 271.
13) S. Ganguly and S. Chakraborty: Ironmaking and Steelmaking, 35 (2008), 524.
14) D. Mazumdar and R. Guthrie: ISIJ Int., 35 (1995), 1.
15) K. Wasai, K. Mukai and A. Miyanaga: ISIJ Int., 42 (2002), 459.
16) M. Wakoh and N. Sano: ISIJ Int., 47 (2007), 627.
17) M. Van Ende, M. Guo, J. Proost, B. Blanpain and P.Wollants: ISIJ Int., 50 (2010), 1552.

70
18) M. Van Ende, M. Guo, J. Proost, B. Blanpain and P.Wollants: ISIJ Int., 51 (2011), 27.
19) C.W. Bale, P. Chartrand, S.A. Degterov, G. Eriksson, K. Hack, R. Ben Mahfoud, J. Melancon, A.D. Pelton and S. Petersen: Calphad Journal, 26 (2002), 189.
20) E.T. Turkdogan: “Fundamentals of Steelmaking”, 1st edn, The Institute of Materials, London, (1996), 111.

71
II. INCLUSION MODIFICATION IN Si-Mn KILLED STEELS USING
TITANIUM ADDITION
Vivek Thapliyal
Abhishek Kumar
David G. C. Robertson
Jeffrey D. Smith
Materials Science and Engineering
Missouri University of Science & Technology
Rolla, MO
Phone - 573-341-6469,
E-mail – [email protected]
Published in ISIJ International

72
ABSTRACT
Modification of inclusions by titanium (Ti) additions in low-alloyed Si-Mn killed
steels was studied by measuring the inclusion count and chemistry. Mn-Si-Al-S-O based
inclusions were observed in the steel, after Si-Mn de-oxidation, to which ferro-titanium
(FeTi) additions were made. Thermochemical software (FactSage) was used to study the
equilibrium between steel and inclusions and subsequent modification due to Ti addition.
Inclusion count and chemistry in the steel were measured at different time intervals after
the FeTi additions. MnO-SiO2 inclusions transformed to TiO2-MnO-SiO2 based
inclusions with Ti replacing both Mn and Si in the inclusions. Si removal was more
prominent from the inclusions compared to Mn. When more FeTi was added to the steel
the inclusions further decreased in their Mn and Si content and Ti based inclusions with
Al and Mn content less than 10% and Si content less than 5% were formed. MnS
inclusions were also observed in the steel and formed as a result of segregation during
solidification.
Key Words: inclusion modification; ferro-titanium addition; thermodynamic modeling
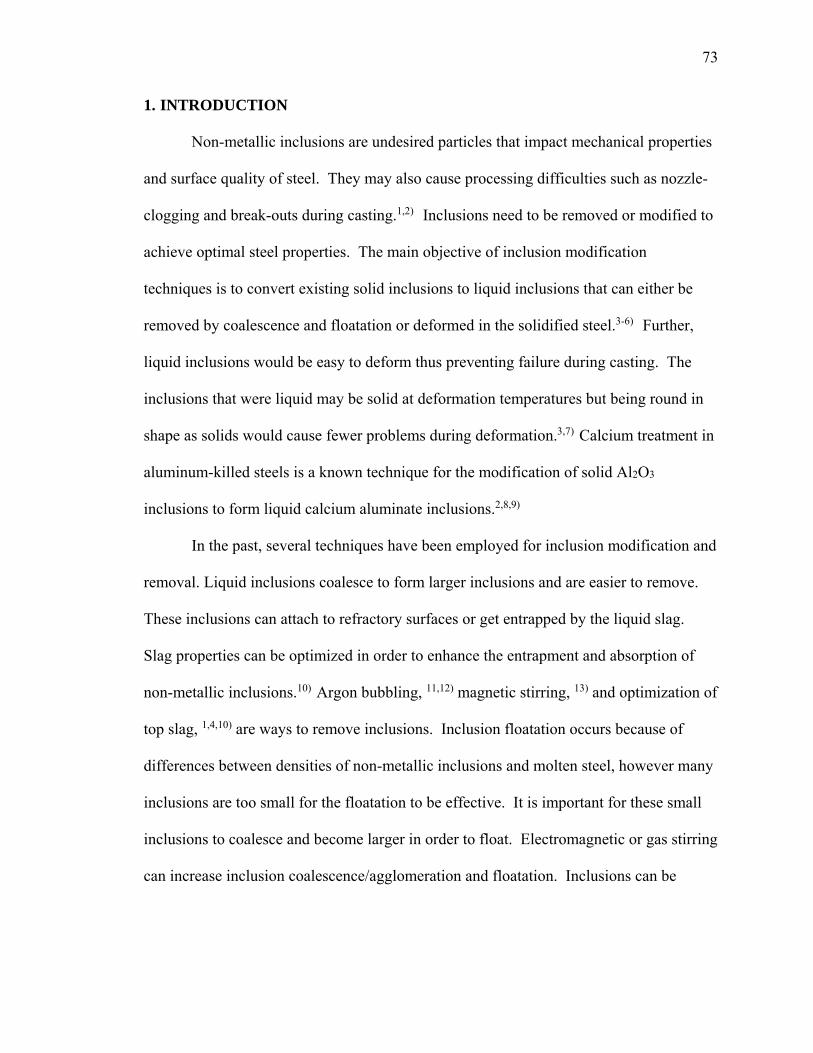
73
1. INTRODUCTION
Non-metallic inclusions are undesired particles that impact mechanical properties
and surface quality of steel. They may also cause processing difficulties such as nozzle-
clogging and break-outs during casting.1,2) Inclusions need to be removed or modified to
achieve optimal steel properties. The main objective of inclusion modification
techniques is to convert existing solid inclusions to liquid inclusions that can either be
removed by coalescence and floatation or deformed in the solidified steel.3-6) Further,
liquid inclusions would be easy to deform thus preventing failure during casting. The
inclusions that were liquid may be solid at deformation temperatures but being round in
shape as solids would cause fewer problems during deformation.3,7) Calcium treatment in
aluminum-killed steels is a known technique for the modification of solid Al2O3
inclusions to form liquid calcium aluminate inclusions.2,8,9)
In the past, several techniques have been employed for inclusion modification and
removal. Liquid inclusions coalesce to form larger inclusions and are easier to remove.
These inclusions can attach to refractory surfaces or get entrapped by the liquid slag.
Slag properties can be optimized in order to enhance the entrapment and absorption of
non-metallic inclusions.10) Argon bubbling, 11,12) magnetic stirring, 13) and optimization of
top slag, 1,4,10) are ways to remove inclusions. Inclusion floatation occurs because of
differences between densities of non-metallic inclusions and molten steel, however many
inclusions are too small for the floatation to be effective. It is important for these small
inclusions to coalesce and become larger in order to float. Electromagnetic or gas stirring
can increase inclusion coalescence/agglomeration and floatation. Inclusions can be
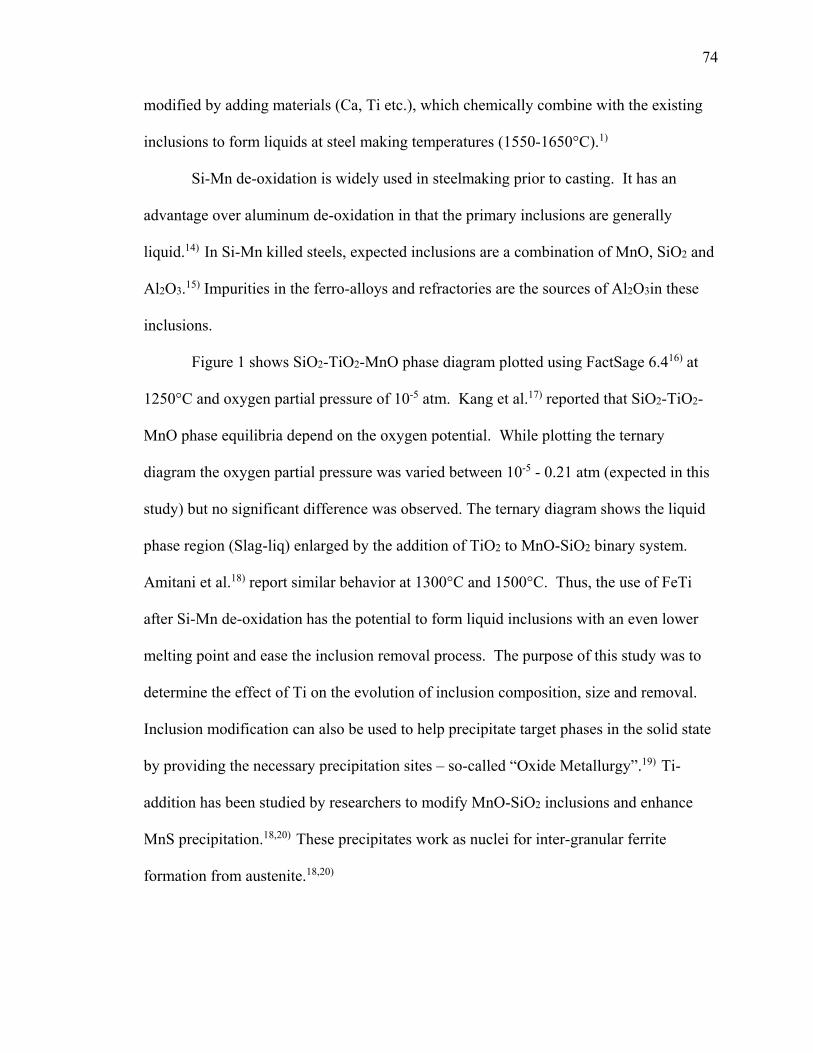
74
modified by adding materials (Ca, Ti etc.), which chemically combine with the existing
inclusions to form liquids at steel making temperatures (1550-1650°C).1)
Si-Mn de-oxidation is widely used in steelmaking prior to casting. It has an
advantage over aluminum de-oxidation in that the primary inclusions are generally
liquid.14) In Si-Mn killed steels, expected inclusions are a combination of MnO, SiO2 and
Al2O3.15) Impurities in the ferro-alloys and refractories are the sources of Al2O3in these
inclusions.
Figure 1 shows SiO2-TiO2-MnO phase diagram plotted using FactSage 6.416) at
1250°C and oxygen partial pressure of 10-5 atm. Kang et al.17) reported that SiO2-TiO2-
MnO phase equilibria depend on the oxygen potential. While plotting the ternary
diagram the oxygen partial pressure was varied between 10-5 - 0.21 atm (expected in this
study) but no significant difference was observed. The ternary diagram shows the liquid
phase region (Slag-liq) enlarged by the addition of TiO2 to MnO-SiO2 binary system.
Amitani et al.18) report similar behavior at 1300°C and 1500°C. Thus, the use of FeTi
after Si-Mn de-oxidation has the potential to form liquid inclusions with an even lower
melting point and ease the inclusion removal process. The purpose of this study was to
determine the effect of Ti on the evolution of inclusion composition, size and removal.
Inclusion modification can also be used to help precipitate target phases in the solid state
by providing the necessary precipitation sites – so-called “Oxide Metallurgy”.19) Ti-
addition has been studied by researchers to modify MnO-SiO2 inclusions and enhance
MnS precipitation.18,20) These precipitates work as nuclei for inter-granular ferrite
formation from austenite.18,20)

75
Figure 1. MnO-SiO2-TiO2 phase diagram plotted at 1250°C and PO2 = 10-5 atm using FToxid – FACT oxide database of FactSage
In the present study inclusion modification in low-alloy Si-Mn de-oxidized steel
using Ti addition was studied. Inclusion chemistry and morphology variation were
evaluated as a function of the amount of Ti added as well as time after addition. The
modification was modeled using thermodynamic software FactSage and the calculations
were compared to the experimental values.

76
2. EXPERIMENTAL PROCEDURE
Experiments were conducted in an induction furnace with a crucible of size 10 cm
internal diameter and 20 cm height. Induction iron (7 kg) was melted and ferro-alloy
additions were made. Temperature of liquid steel was maintained around 1600°C (±
5°C). Argon was blown at the rate of 1 liter/min over the liquid steel and under a
refractory blanket to minimize oxidation.
The initial chemistry of the induction iron is shown in Table 1. Ferro-silicon
(Fe75Si) and ferro-manganese (FeMn) additions were made to de-oxidize the induction
iron and form steel (Table 1) containing MnO-SiO2 based inclusions. Total oxygen in the
steel after the Fe75Si + FeMn addition was measured to be 170 ppm (0.017 wt. %) using
LECO O and N analyzer (TC 500).
Table 1. Initial chemistry of induction iron and steel (after Mn-Si addition) used for the experiment (balance Fe) measured using arc-spectroscopy
Wt. % C Si Mn P S Cr Ni Al Cu Ti
Induction iron - - 0.21 0.04 0.01 0.07 0.04 0.004 0.04 - Steel 0.03 0.13 0.68 0.04 0.01 0.06 0.04 - 0.04 -
FeTi additions were made to the deoxidized steel and the impact on inclusions
was analyzed. Compositions of all the ferro-alloys used in this study are shown in Table
2.
Table 2. Ferro-alloy compositions used for this study (balance Fe)
Wt. % C Si S Mn P Ca Al Ti Fe75Si <0.1 73-78 <0.02 - <0.04 <0.6 <1.5 - FeMn 0.078 0.28 0.025 97.08 0.026 - - - FeTi 0.1 0.1 0.01 0.2 0.01 - 0.2 70

77
Multiple FeTi additions were made to the liquid steel and samples were taken at
different time intervals. Table 3 shows the sampling chart for the samples taken during
the experiment along with additions made.
Table 3. Sampling Chart
Time of
addition
Additions Sample
A
Sample
B
Sample C
0 min 17 g Fe75Si+38 g FeMn
Si (0.18 wt. %), Mn (0.53 wt. %)
+2 min +5 min
10 min 2 g FeTi, Ti (0.02wt. %) +1 min +3 min +5 min
20 min 2 g FeTi, Ti (0.02 wt. %) +1 min +3 min +5 min
30 min 3 g FeTi, Ti (0.03 wt. %) +1 min +3 min +5 min
Samples were analyzed using arc spectroscopy to measure steel chemistry at each
sampling step. LECO analyzer was used to measure the oxygen and sulfur content of
steel. Inclusion chemistry and morphology were studied using automated scanning
electron microscopy (ASPEX).

78
3. THERMODYNAMIC MODELING OF INCLUSION TRANSFORMATION
Data for inclusion chemistry, obtained from SEM-EDS, was used for modeling
inclusion transformation with FeTi additions. Composition of the inclusions in terms of
Al, Ca, Mn, S, Si and Ti was obtained from SEM-EDS, whereas, Fe and O concentration
could not be measured accurately using this method. So, the oxygen was calculated
stoichiometrically assuming primary oxides for the elements selected. For Ti, a 2:1
molar combination of TiO2 and Ti2O3 (TiO1.75) was assumed, which was similar to that
calculated by thermodynamic software. The oxygen value was also adjusted for the
sulfur content in the inclusion by balancing oxygen and sulfur anions to the metal cations.
Inclusions were divided into major categories based on the prime components and
further sub-divided into sub-types based on the composition range. For each of the sub-
types, average inclusion chemistry was calculated. This averaged data was used along
with the steel chemistry for equilibrium calculations.
Equilibrium calculations were carried out at 1600°C using thermodynamic
software FactSage. To assess whether a given sub-type of inclusion was in equilibrium
with the steel, it was reacted with the steel and the composition change was monitored.
The stability (equilibrium with steel) of each inclusion sub-type was studied using the
“Equilib” module of FactSage, considering the steel, slag, solid-solutions, and all
possible liquids and solids as the possible phases. The databases used in this study were:
FSstel (compound and solution database for steel), FactPS (gas species, solid and liquid
compound database) and FToxid (compounds and solutions for oxide databases, with S in
the oxide slags). The ratio of steel used for the equilibrium calculation per 100 g of
inclusion was also varied. Based on the composition, steel to inclusion ratio of 1000:1

79
was selected. As Fe and O content of the inclusion were not measured accurately, any
transfer of Fe and O from the steel to inclusion was allowed. However, any significant
transfer from the inclusion phase to the steel indicated the non-equilibrium (instability) of
the inclusion phase. Figure 2 (a) shows a representation of the FactSage model used to
determine inclusion-steel equilibrium. To study inclusion modification with Ti addition,
its local equilibrium with steel was modeled. For each of these calculations 1 g of
inclusion, of chemistry measured before addition, was reacted with 1000 g of steel of
chemistry measured immediately after each addition as shown in Figure 2 (b)
(a)
(b)
Figure 2. Representation of thermodynamic FactSage model (a) to determine inclusion-steel equilibrium and (b) to determine inclusion transformation with FeTi addition for n =
1, 2 or 3

80
4. RESULTS AND DISCUSSIONS
Inclusion behavior and transformation were studied by plotting inclusion
chemistries obtained from SEM-EDS on a ternary diagram. The inclusion chemistries
had 6 major components namely Al, Ca, Mn, S, Si and Ti. To plot the inclusion
chemistries on a ternary diagram three major elements were selected. The fourth
significant element was plotted using color scale where the color corresponds to
concentration. The inclusions were plotted as circles where the size of each circle
represented the inclusion size.
4.1. Inclusions in Mn-Si Deoxidized Steel
In the case of samples taken after the Fe75Si + FeMn addition, Mn, Si and S were
chosen as the three components for the ternary plot. Al was chosen as the fourth element
for coloring the inclusion composition points. Few Ca rich inclusions (~ 3%) (Table 4)
were also observed in these samples, whereas Ti was observed as an impurity in the
samples.

81
Table 4. Type of inclusions with analysis (wt. %) observed after 5 minutes of Fe75Si + FeMn addition (balance O, with Ca and Ti as minor species)
Type Population% Diameter
(µm) S Mn Si Al
min max min max min max min maxOxide 3% 2.3 ± 1.6 0 5 0 5 0 5 0 15
1% 0.8 ± 0.5 0 5 0 5 35 45 5 15 8% 1.4 ± 0.5 0 5 15 55 5 35 0 5 10% 2.3 ± 1.5 0 5 15 45 15 35 5 15 6% Other Compositions
Mixed 9% 1.2 ± 0.6 5 15 15 45 15 25 0 5 3% 0.9 ± 0.2 5 15 15 25 25 35 0 5 1% 0.9 ± 0.3 5 15 15 25 25 35 5 15 18% 1.1 ± 0.4 5 15 25 45 15 25 0 5 5% 1.1 ± 0.5 5 15 35 55 5 15 0 5 6% Other Compositions
Sulfide 7% 0.9 ± 0.2 15 25 25 45 15 25 0 5 1% 0.6 ± 0.2 15 25 25 35 15 25 5 15 6% 0.9 ± 0.4 15 25 35 55 5 15 0 5 5% 0.8 ± 0.3 25 35 25 55 5 25 0 5 2% 0.7 ± 0.4 35 45 45 65 0 5 0 5 9% Other Compositions
On the Mn-Si-S ternary plots shown in Figure 3, inclusions measured after 2 and
5 minutes of the Mn-Si addition (Fe75Si + FeMn) are plotted. Minute difference can be
observed in these plots indicating that the inclusion distribution was stable after 2
minutes and behaved the same during mixing and solidification processes. There is also
a “scatter” towards MnS that is common to all times, presumably due to MnS
formation/precipitation in interdendritic liquid during solidification. This latter trend was
observed to be independent of the sampling time. Based on the ternary diagram, Mn
content in larger inclusions (>3 µm) was almost constant (50-60%). Most of these
inclusions were oxides (Mn-Al-Si-O). The sulfur-rich inclusions were observed to be
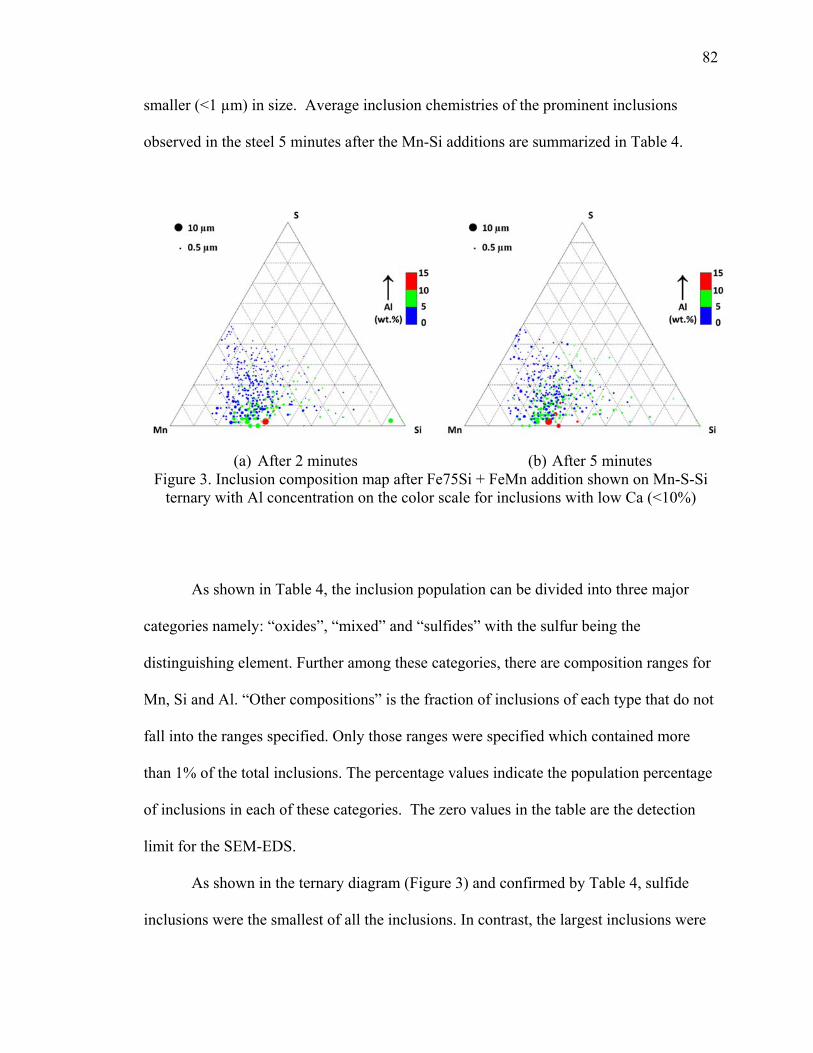
82
smaller (<1 µm) in size. Average inclusion chemistries of the prominent inclusions
observed in the steel 5 minutes after the Mn-Si additions are summarized in Table 4.
(a) After 2 minutes (b) After 5 minutes Figure 3. Inclusion composition map after Fe75Si + FeMn addition shown on Mn-S-Si
ternary with Al concentration on the color scale for inclusions with low Ca (<10%)
As shown in Table 4, the inclusion population can be divided into three major
categories namely: “oxides”, “mixed” and “sulfides” with the sulfur being the
distinguishing element. Further among these categories, there are composition ranges for
Mn, Si and Al. “Other compositions” is the fraction of inclusions of each type that do not
fall into the ranges specified. Only those ranges were specified which contained more
than 1% of the total inclusions. The percentage values indicate the population percentage
of inclusions in each of these categories. The zero values in the table are the detection
limit for the SEM-EDS.
As shown in the ternary diagram (Figure 3) and confirmed by Table 4, sulfide
inclusions were the smallest of all the inclusions. In contrast, the largest inclusions were
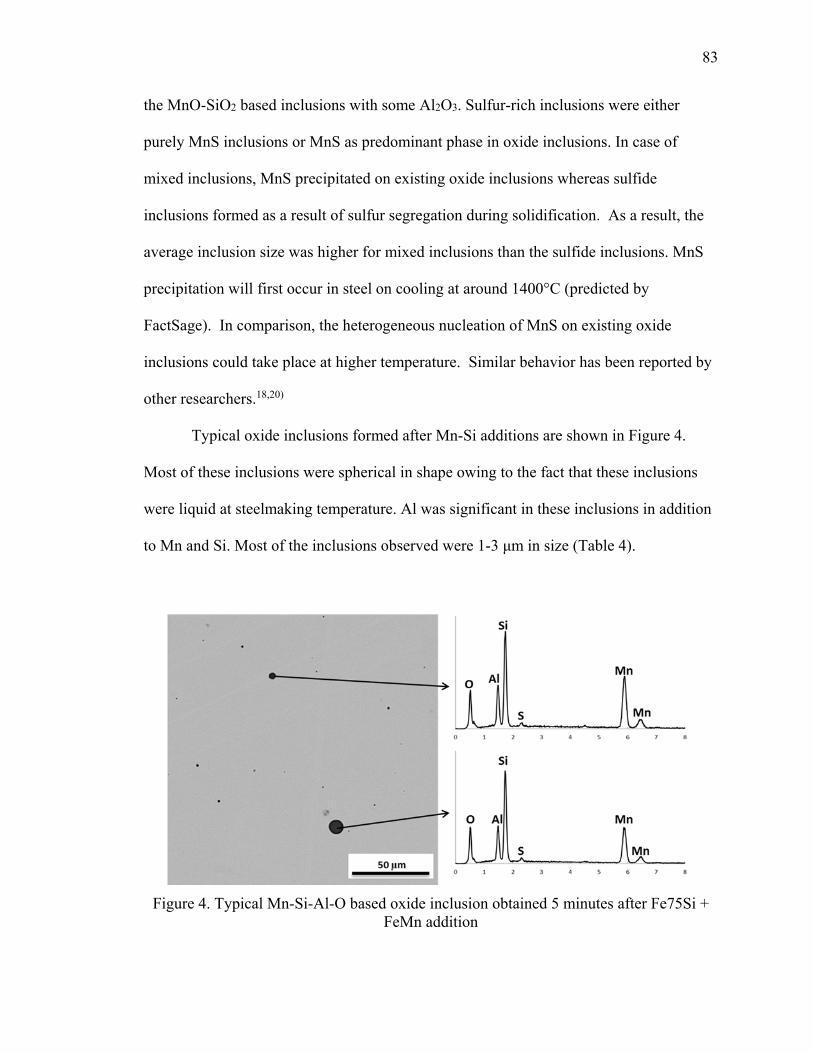
83
the MnO-SiO2 based inclusions with some Al2O3. Sulfur-rich inclusions were either
purely MnS inclusions or MnS as predominant phase in oxide inclusions. In case of
mixed inclusions, MnS precipitated on existing oxide inclusions whereas sulfide
inclusions formed as a result of sulfur segregation during solidification. As a result, the
average inclusion size was higher for mixed inclusions than the sulfide inclusions. MnS
precipitation will first occur in steel on cooling at around 1400°C (predicted by
FactSage). In comparison, the heterogeneous nucleation of MnS on existing oxide
inclusions could take place at higher temperature. Similar behavior has been reported by
other researchers.18,20)
Typical oxide inclusions formed after Mn-Si additions are shown in Figure 4.
Most of these inclusions were spherical in shape owing to the fact that these inclusions
were liquid at steelmaking temperature. Al was significant in these inclusions in addition
to Mn and Si. Most of the inclusions observed were 1-3 μm in size (Table 4).
Figure 4. Typical Mn-Si-Al-O based oxide inclusion obtained 5 minutes after Fe75Si + FeMn addition

84
Thermodynamic calculations based on the model described earlier (Figure 2(a))
were performed to determine steel-inclusion equilibrium. Table 5 shows the sample
results using steel and inclusion compositions obtained 5 minutes after Fe75Si + FeMn
addition (Table 1 and Table 4). The inclusion chemistries shown in Table 5 were from
four typical ranges of inclusion compositions observed in the steel. “Oxide (1)” and
“Oxide (2)” inclusions were chosen as two widely different oxide inclusion compositions
within the ranges observed in Table 4. When these inclusions are reacted with steel there
is only a small amount of reaction required to equilibrate the inclusions (Table 5), so that
despite their different compositions they can be considered to be close to equilibrium
with the steel. The calculation for the “Mixed” inclusion shows that the inclusion would
lose all its sulfur to steel and its overall mass reduces by about 30%. For the “Sulfide”
inclusion this reduction in mass is about 45%. Therefore, the inclusions in the categories
“Mixed” and “Sulfide” were not in equilibrium with steel at 1600°C.

85
Table 5. A representative result for the thermodynamic calculations for steel-inclusion equilibrium at 1600°C
Inclusion composition (wt. %)
Type Steel Oxide (1) Oxide (2) Mixed Sulfide Initial S 0.01 4.5 2.7 14.5 20.9
Mn 0.68 21.3 28.6 28.5 23.6 Si 0.13 27.9 23 22.1 16.9 Al - 4.4 5.6 2.8 3.4
100 g inclusion + 100,000 g steel Final Slag weight (g) 100.2 97.6 72.5 55.6
S 0.0 0.0 0.0 0.0 Mn 26.1 26.5 23.5 26.3 Si 21.5 20.3 22.2 20.1 Al 5.2 6.9 5.1 7.5
Prediction Equilibrium Equilibrium Non-equilibrium
Non-equilibrium
Change in inclusion
FeO gain MnO loss Sulfides dissolve
Dissolution
Oxide inclusions after the Fe75Si + FeMn addition were predicted to be in
equilibrium with steel. For the range of inclusions shown in Table 4, liquid phase (slag)
inclusions of composition MnO (25-50%), SiO2 (30-60%), Al2O3 (5-10%) and FeO (5-
10%) were predicted using the model. Mixed inclusions, were observed as liquid phase
inclusions with MnS and FeS as significant components. These inclusions were not at
equilibrium with the steel at 1600°C. Sulfide inclusions were observed to be liquid phase
inclusions with more than 50% FeS and MnS. For inclusions with greater than 40%
sulfur content, solid MnS inclusions were also observed. These inclusions were also not
at equilibrium with the steel at 1600°C and were predicted to dissolve completely. This
suggests that the mixed and sulfide inclusions formed in steel on cooling.
To study sulfur content in the inclusions of mixed and sulfide type, equilibrium
and Scheil-Gulliver cooling studies were done for these inclusions using FactSage. For

86
these calculations, the average chemistries were used. Solid MnS was predicted to form
at about 1375°C for equilibrium cooling. Above this temperature, the maximum sulfur
content in the slag in equilibrium with steel was 4%. So, to achieve the amount of S
observed in the inclusions solid MnS precipitation is required. Scheil-Gulliver cooling
suggested MnS formation started at about 1400°C for these inclusions.
4.2. Effect of FeTi Addition on Mn-Si Based Inclusions
FeTi additions were made to the Mn-Si containing steel to observe the changes in
the existing inclusions. The steel chemistry was measured and inclusion population was
analyzed at different time intervals after the FeTi additions as shown in Table 6. Ti
content in the steel was highest at one minute after the addition and it decreased with
time. This suggests that Ti content decreased in the steel by removal of Ti-based
inclusions.
To plot the ternary diagram for the inclusion population after FeTi addition, Ti,
Mn and S were chosen as the key elements based on concentration. The silicon content
of inclusions was selected for the color scale. Ca and Al were less significant (<10%)
components for the majority (~80%) of inclusions.
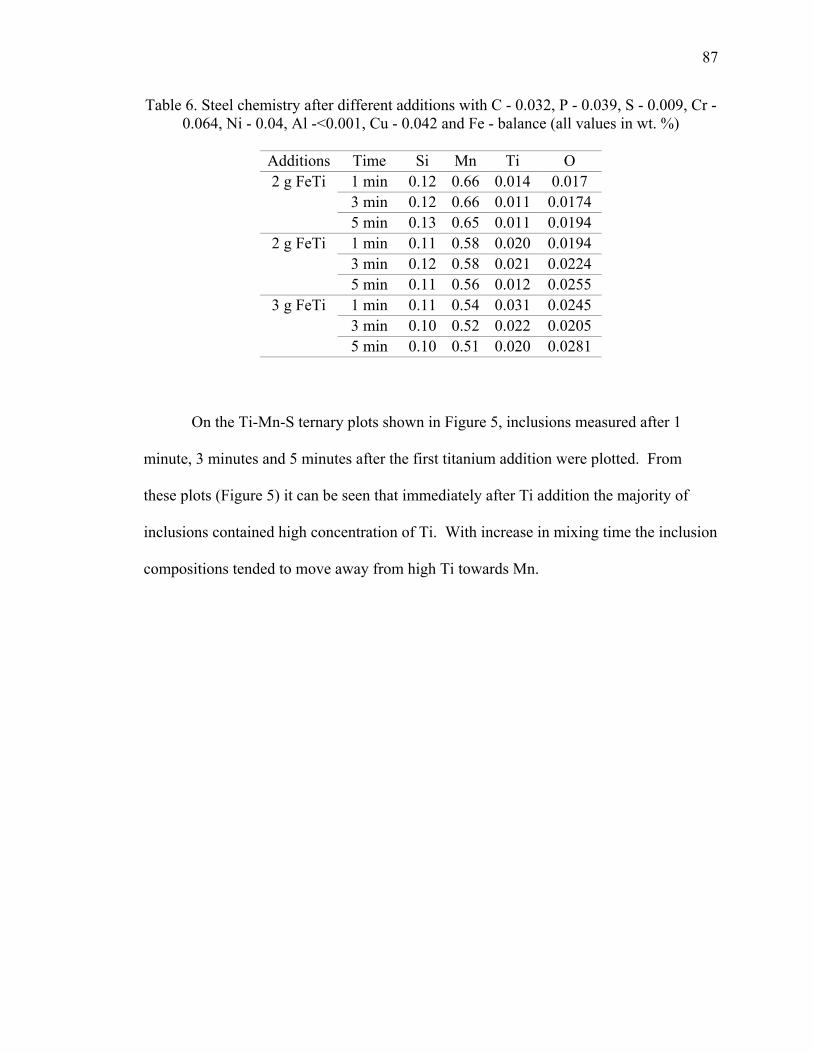
87
Table 6. Steel chemistry after different additions with C - 0.032, P - 0.039, S - 0.009, Cr - 0.064, Ni - 0.04, Al -<0.001, Cu - 0.042 and Fe - balance (all values in wt. %)
Additions Time Si Mn Ti O 2 g FeTi 1 min 0.12 0.66 0.014 0.017
3 min 0.12 0.66 0.011 0.0174 5 min 0.13 0.65 0.011 0.0194
2 g FeTi 1 min 0.11 0.58 0.020 0.0194 3 min 0.12 0.58 0.021 0.0224 5 min 0.11 0.56 0.012 0.0255
3 g FeTi 1 min 0.11 0.54 0.031 0.0245 3 min 0.10 0.52 0.022 0.0205 5 min 0.10 0.51 0.020 0.0281
On the Ti-Mn-S ternary plots shown in Figure 5, inclusions measured after 1
minute, 3 minutes and 5 minutes after the first titanium addition were plotted. From
these plots (Figure 5) it can be seen that immediately after Ti addition the majority of
inclusions contained high concentration of Ti. With increase in mixing time the inclusion
compositions tended to move away from high Ti towards Mn.
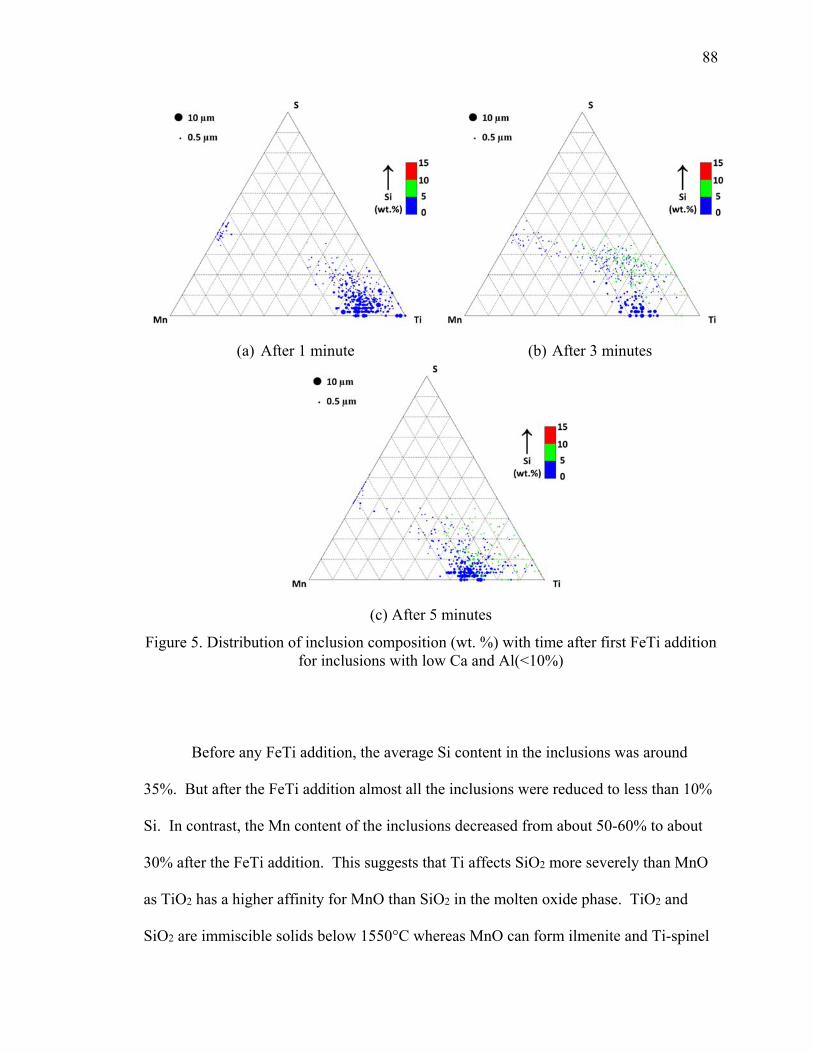
88
(a) After 1 minute (b) After 3 minutes
(c) After 5 minutes
Figure 5. Distribution of inclusion composition (wt. %) with time after first FeTi addition for inclusions with low Ca and Al(<10%)
Before any FeTi addition, the average Si content in the inclusions was around
35%. But after the FeTi addition almost all the inclusions were reduced to less than 10%
Si. In contrast, the Mn content of the inclusions decreased from about 50-60% to about
30% after the FeTi addition. This suggests that Ti affects SiO2 more severely than MnO
as TiO2 has a higher affinity for MnO than SiO2 in the molten oxide phase. TiO2 and
SiO2 are immiscible solids below 1550°C whereas MnO can form ilmenite and Ti-spinel

89
solid solutions showing higher affinity for TiO2.21,22) Also, MnS inclusions, containing
less than 10% Ti or in some cases negligible Ti, were observed, strengthening the
hypothesis that these inclusions were formed during solidification. The Mn to S ratio in
the inclusion is constant as can be seen from the ternary diagrams. This suggests that
MnS precipitation resulted in the formation of these inclusions. With increasing time
sulfide inclusions containing Ti also precipitate.
Some inclusions (~15%) with significant amount of Ca and Al (>10%) were also
present in the Mn-Si deoxidized steel. These inclusions had low sulfur concentration and
were liquid phase (spherical). After the Ti addition these inclusions decreased in number
with increasing mixing time. This behavior can be attributed to removal due to floatation
after coalescence.
The prominent inclusion types observed in the steel 5 minutes after the first FeTi
additions are summarized in Table 7. The oxide inclusions formed were the largest in
size, whereas the sulfide inclusions were the smallest inclusions similar to the previous
observations. Ti and Mn were the major components of these inclusions.

90
Table 7. Type of inclusions and their analysis (wt. %) observed after 5 minutes of first FeTi addition (balance O with Ca as minor species)
Type Population% Diameter
(µm) S Mn Ti Si Al
min max min max min max min max min maxOxide
3% 0.6 ± 0.2 0 5 0 5 35 55 5 15 5 15 1% 0.8 ± 0.2 0 5 0 5 45 55 0 5 0 5 8% 2.7 ± 1.4 0 5 5 25 25 45 5 15 0 5 8% 1.0 ± 0.4 0 5 5 15 35 55 0 5 0 5 1% 1.0 ± 0.6 0 5 5 15 35 45 5 15 5 15 11% 1.3 ± 0.5 0 5 15 25 35 45 0 5 0 5 8% Other Compositions
Mixed
3% 0.6 ± 0.2 5 15 0 15 35 45 5 15 5 15 3% 0.7 ± 0.2 5 15 5 25 25 45 5 15 0 5 7% 0.8 ± 0.3 5 15 5 15 35 55 0 5 0 5 11% 0.8 ± 0.3 5 15 15 25 25 45 0 5 0 5 2% 0.9 ± 0.5 5 15 25 35 25 35 0 5 0 5 10% Other Compositions
Sulfide
2% 0.5 ± 0.1 15 25 5 15 25 35 5 15 5 15 6% 0.6 ± 0.2 15 25 15 35 25 35 0 5 0 5 1% 0.6 ± 0.2 15 25 15 25 25 35 5 15 0 5 3% 0.7 ± 0.4 35 45 55 65 0 5 0 5 0 5 11% Other Compositions
A typical oxide inclusion formed after the first FeTi additions are shown in Figure
6. Ti was the major component in these inclusions along with Mn, Si and Al. These
inclusions were also spherical in shape having regions of varying Ti-Mn-Si-Al content.
This behavior was a result of precipitation of different phases during solidification. The
micrograph shows a Ti rich phase precipitated inside the Ti-Mn-Al-Si inclusion. This
was possibly pseudobrookite (Ti3O5), which were also predicted by thermodynamic
calculations.

91
Figure 6. Typical Ti-Mn-Al-Si-O oxide inclusion,with Ti rich phase as precipitates, observed 5 minutes after first FeTi addition
Thermodynamic model described in Table 2 (b) was used to study inclusion
transformation on FeTi addition. Table 8 shows a sample calculation using inclusion
compositions from different categories similar to Table 5. The inclusion chemistries
obtained 5 minutes after Fe75Si + FeMn addition (Table 4) and steel composition
obtained 1 minute after the first FeTi addition (Table 6) were used. The oxide inclusions
transformed by gaining TiOx and losing MnO, SiO2 or both. The drop in Si content of
the inclusion was more than the Mn content similar to the behavior observed
experimentally. Similar to the previous case mixed and sulfide inclusions were predicted
to dissolve at 1600°C.

92
Table 8. A representative result for the thermodynamic calculations to show inclusion transformation on FeTi addition at 1600°C
Avg. inclusion composition (wt. %)
Type Steel Oxide (1) Oxide (2) Mixed Sulfide Initial S 0.01 2.5 1.7 9 32.6
Mn 0.66 27.9 18.9 32.4 33.3 Si 0.13 26.6 29.9 20.8 13.7 Ti 0.02 0.2 0.5 0.3 0.1 Al - 3.2 6.3 5.7 7
100 g inclusion + 100,000 g steel Final Slag wt.
(gram) 91.7 99.8 74.5 30.7
S 0.0 0.0 0.0 0.0 Mn 20.7 20.1 17.7 4.0 Si 11.5 11.4 8.2 1.2 Ti 19.8 18.2 23.2 31.5 Al 4.5 7.2 8.7 19.0
Prediction Equilibrium Equilibrium Non-equilibrium
Non-equilibrium
Change in inclusion
MnO-SiO2 Loss/ TiOx
gain
SiO2 loss/ TiOx gain
Sulfides dissolve
Dissolution
As the oxide inclusions were reacted with steel containing higher Ti (0.02%),
after the first FeTi addition, they were predicted to form Mn-Ti-Si-Al type oxide
inclusions. The equilibrium calculations predicted TiOx content of about 30% with
Mn:Ti ratio close to 1:1, whereas, as per the experimental data (Table 6) Mn:Ti ratio was
close to 1:2 suggesting that complete equilibrium was not achieved after 5 minutes. For
the mixed inclusions, the sulfide concentration of the inclusions dropped to less than 1%
and their predicted behavior (after the sulfide loss) was similar to the oxide inclusions.
After the second FeTi addition, ternary plots were drawn using the same settings as were
used for the first additions. Figure 7 shows the mapping of the inclusions on the ternary
plot.
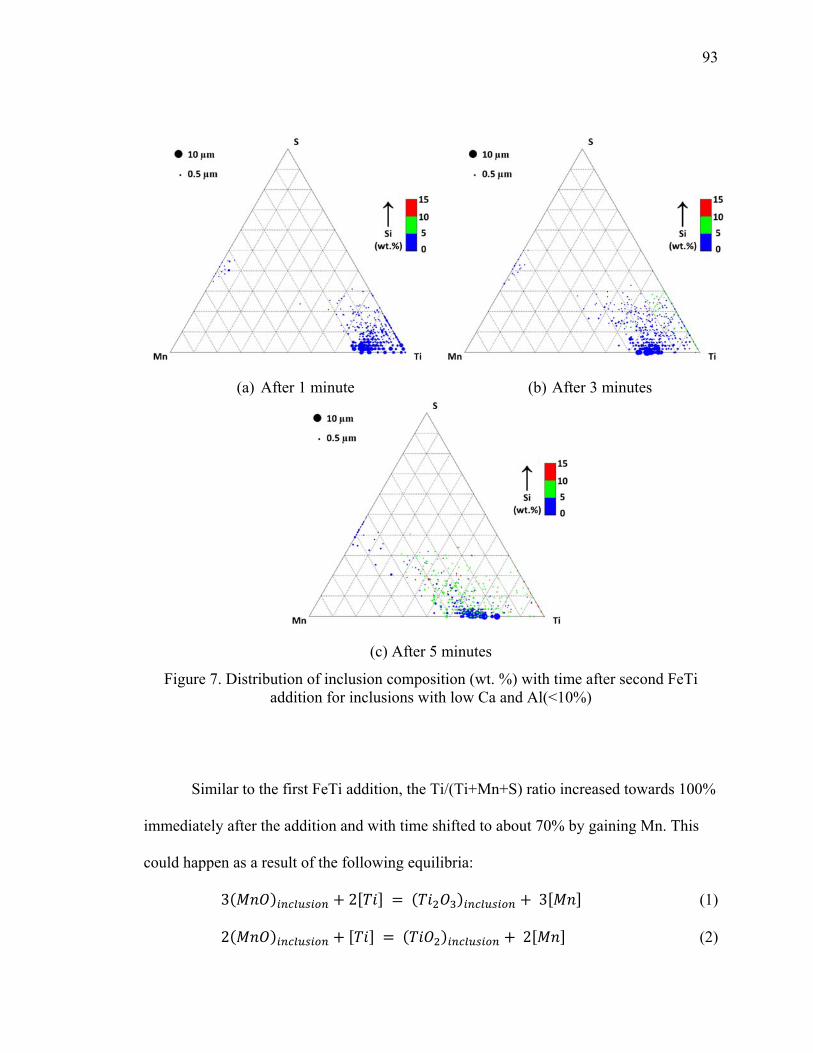
93
(a) After 1 minute (b) After 3 minutes
(c) After 5 minutes
Figure 7. Distribution of inclusion composition (wt. %) with time after second FeTi addition for inclusions with low Ca and Al(<10%)
Similar to the first FeTi addition, the Ti/(Ti+Mn+S) ratio increased towards 100%
immediately after the addition and with time shifted to about 70% by gaining Mn. This
could happen as a result of the following equilibria:
3 2 3 (1)
2 2 (2)
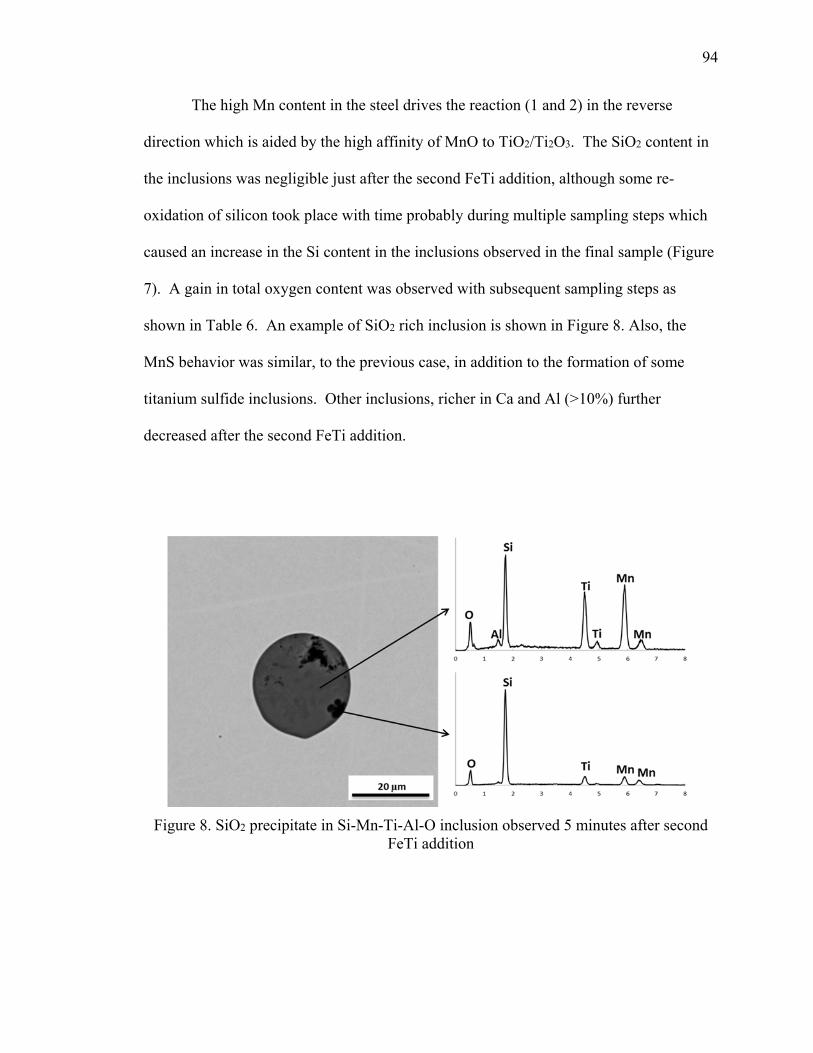
94
The high Mn content in the steel drives the reaction (1 and 2) in the reverse
direction which is aided by the high affinity of MnO to TiO2/Ti2O3. The SiO2 content in
the inclusions was negligible just after the second FeTi addition, although some re-
oxidation of silicon took place with time probably during multiple sampling steps which
caused an increase in the Si content in the inclusions observed in the final sample (Figure
7). A gain in total oxygen content was observed with subsequent sampling steps as
shown in Table 6. An example of SiO2 rich inclusion is shown in Figure 8. Also, the
MnS behavior was similar, to the previous case, in addition to the formation of some
titanium sulfide inclusions. Other inclusions, richer in Ca and Al (>10%) further
decreased after the second FeTi addition.
Figure 8. SiO2 precipitate in Si-Mn-Ti-Al-O inclusion observed 5 minutes after second FeTi addition
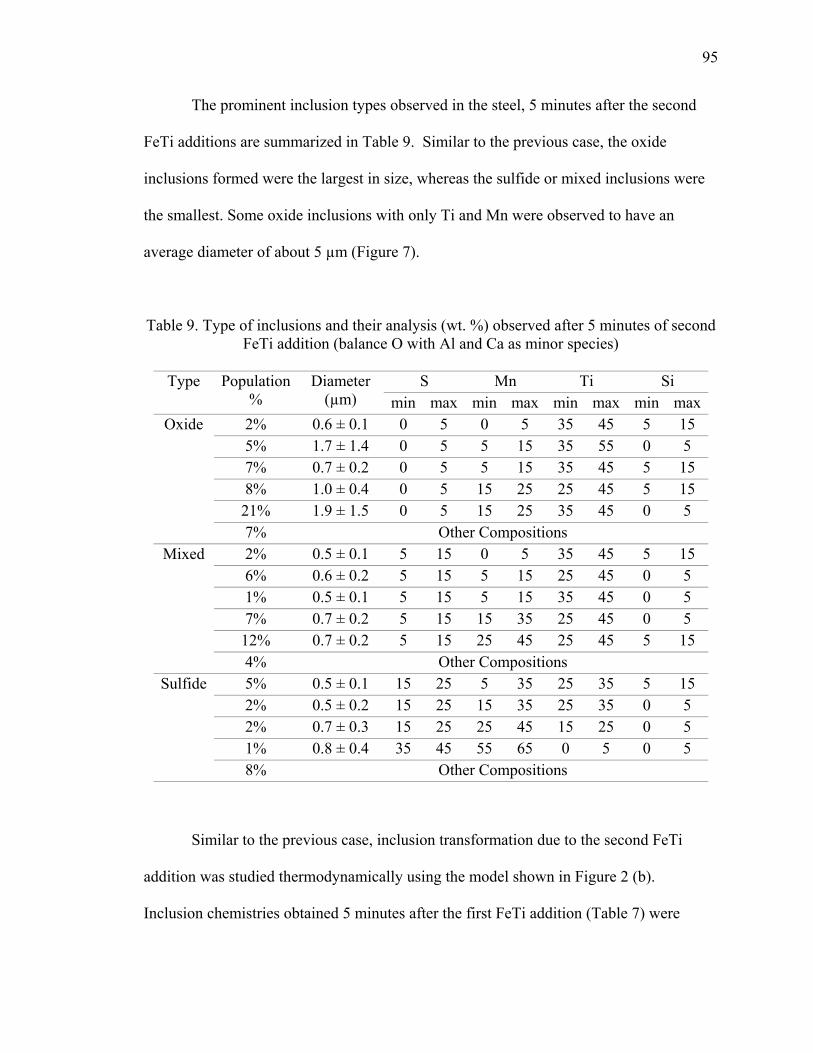
95
The prominent inclusion types observed in the steel, 5 minutes after the second
FeTi additions are summarized in Table 9. Similar to the previous case, the oxide
inclusions formed were the largest in size, whereas the sulfide or mixed inclusions were
the smallest. Some oxide inclusions with only Ti and Mn were observed to have an
average diameter of about 5 µm (Figure 7).
Table 9. Type of inclusions and their analysis (wt. %) observed after 5 minutes of second FeTi addition (balance O with Al and Ca as minor species)
Type Population
% Diameter
(µm) S Mn Ti Si
min max min max min max min maxOxide
2% 0.6 ± 0.1 0 5 0 5 35 45 5 15 5% 1.7 ± 1.4 0 5 5 15 35 55 0 5 7% 0.7 ± 0.2 0 5 5 15 35 45 5 15 8% 1.0 ± 0.4 0 5 15 25 25 45 5 15 21% 1.9 ± 1.5 0 5 15 25 35 45 0 5 7% Other Compositions
Mixed
2% 0.5 ± 0.1 5 15 0 5 35 45 5 15 6% 0.6 ± 0.2 5 15 5 15 25 45 0 5 1% 0.5 ± 0.1 5 15 5 15 35 45 0 5 7% 0.7 ± 0.2 5 15 15 35 25 45 0 5 12% 0.7 ± 0.2 5 15 25 45 25 45 5 15 4% Other Compositions
Sulfide
5% 0.5 ± 0.1 15 25 5 35 25 35 5 15 2% 0.5 ± 0.2 15 25 15 35 25 35 0 5 2% 0.7 ± 0.3 15 25 25 45 15 25 0 5 1% 0.8 ± 0.4 35 45 55 65 0 5 0 5 8% Other Compositions
Similar to the previous case, inclusion transformation due to the second FeTi
addition was studied thermodynamically using the model shown in Figure 2 (b).
Inclusion chemistries obtained 5 minutes after the first FeTi addition (Table 7) were
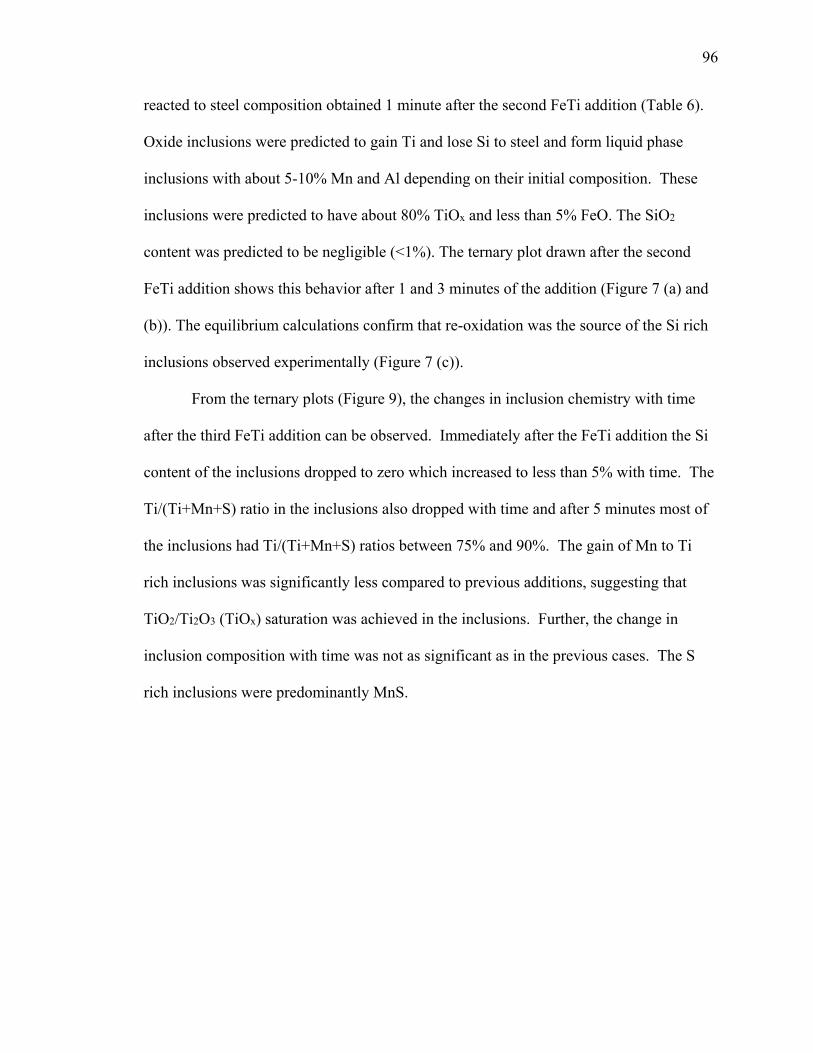
96
reacted to steel composition obtained 1 minute after the second FeTi addition (Table 6).
Oxide inclusions were predicted to gain Ti and lose Si to steel and form liquid phase
inclusions with about 5-10% Mn and Al depending on their initial composition. These
inclusions were predicted to have about 80% TiOx and less than 5% FeO. The SiO2
content was predicted to be negligible (<1%). The ternary plot drawn after the second
FeTi addition shows this behavior after 1 and 3 minutes of the addition (Figure 7 (a) and
(b)). The equilibrium calculations confirm that re-oxidation was the source of the Si rich
inclusions observed experimentally (Figure 7 (c)).
From the ternary plots (Figure 9), the changes in inclusion chemistry with time
after the third FeTi addition can be observed. Immediately after the FeTi addition the Si
content of the inclusions dropped to zero which increased to less than 5% with time. The
Ti/(Ti+Mn+S) ratio in the inclusions also dropped with time and after 5 minutes most of
the inclusions had Ti/(Ti+Mn+S) ratios between 75% and 90%. The gain of Mn to Ti
rich inclusions was significantly less compared to previous additions, suggesting that
TiO2/Ti2O3 (TiOx) saturation was achieved in the inclusions. Further, the change in
inclusion composition with time was not as significant as in the previous cases. The S
rich inclusions were predominantly MnS.

97
(a) After 1 minute (b) After 3 minutes
(c) After 5 minutes
Figure 9. Distribution of inclusion composition (wt. %) with time after third FeTi addition for inclusions with low Ca and Al(<10%)
The prominent inclusion types observed in the steel 5 minutes after the third FeTi
additions are summarized in Table 10. Almost all the Ti-based inclusions contained
small amounts of Mn or Al or both. A few pure TiOx inclusions were also observed. The
Si content in all the inclusions was reduced to less than 5%. The amount of Al or Mn in
the inclusions depended on the initial composition of the inclusions. With increasing Ti,
98
all the Mn can be removed from some of the inclusions. MnS precipitation on the
existing Ti-Al-O inclusions during solidification could be the cause of the higher Mn
content in the inclusions. Typical inclusions formed after the third FeTi addition, were
similar in morphology to the inclusions observed earlier except for their higher Ti
content.
Table 10. Type of inclusions and their analysis (wt. %) observed after 5 minutes of third FeTi addition (balance O with Ca and Si as minor species)
Type Population
% Diameter
(µm) S Mn Ti Al
min max min max min max min maxOxide
15% 0.8 ± 0.3 0 5 0 5 45 65 0 5 3% 0.8 ± 0.4 0 5 0 5 45 55 5 15 27% 1.9 ± 1.5 0 5 5 15 45 55 0 5 3% 3.8 ± 2.9 0 5 5 15 45 55 5 15 4% Other Compositions
Mixed
17% 0.6 ± 0.2 5 15 0 5 45 65 0 5 6% 0.5 ± 0.1 5 15 0 5 45 55 5 15 11% 0.7 ± 0.3 5 15 5 15 35 55 0 5 3% Other Compositions
Sulfide
1% 0.4 ± 0.1 15 25 0 5 45 55 0 5 1% 0.7 ± 0.5 35 45 55 65 0 5 0 5 9% Other Compositions
As per the thermodynamic calculations, when the oxide type inclusions were
reacted with steel of higher Ti concentration (third FeTi addition) liquid slag inclusions
with about 85% TiOx content were predicted confirming the experimental data
represented in Figure 9. MnO and Al2O3 content were predicted to be around 5%. In the
slag phase, SiO2 content was predicted to be less than 1%, MnO was around 5% and
TiOx was 85%. Oxide inclusions that initially had only Ti and Mn were predicted to
form solid Ti3O5.
99
Overall with increasing FeTi addition, the TiOx content increased in the inclusions
from 30% to 85%. The inclusions were predicted to form liquid phase at 1600°C and
solid Ti3O5 phase was predicted only after the third FeTi addition. Ti addition affected
the Si and Mn content of the inclusions but the Al content remained constant. The MnO
in inclusions decreased gradually with each step whereas the SiO2 content was calculated
to drop to less than 1% after the first FeTi addition. Sulfide content less than 1% was in
equilibrium with steel at 1600°C and would increase only on cooling.
The oxide inclusions increased from about 25% (after Fe75Si + FeMn addition) to
45% (after third FeTi addition) showing that all the inclusions were not affected by Mn
and S segregation. Presumably the oxide inclusions were not “pushed” by the
solid/liquid interface, and so were isolated in solid steel early in the solidification
process. Many inclusions were present in the solidified steel before significant
segregation occurred in the remaining liquid and therefore remained as oxide. The
mixed/sulfide inclusions must have formed at lower temperatures and in inter-dendritic
regions with Mn and S segregation. Hence only a fraction of the inclusions are of the
types mixed and sulfide. The high fraction of oxide inclusions after the third FeTi
addition and hence the formation of solid Ti3O5 inclusions suggests that too much FeTi
was added. So, to achieve inclusion modification (without any solid inclusions), adding a
small fraction of FeTi in steps would be more effective.
After each ferro-alloy addition and a mixing time of 5 minutes, number of
inclusions and coverage area were calculated and shown in Figure 10 (a). From the plot
it can be observed that the inclusion count dropped after the first FeTi addition along with
the inclusion coverage. This behavior would be a result of removal of larger inclusions.

100
After the second FeTi addition, the inclusion count increased slightly with a
greater increase in the inclusion coverage indicating increase in inclusion size. Increase
in inclusion size can be attributed to coalescence of liquid inclusions. The inclusions at
this stage were smaller in number and coverage than those observed after the initial
Fe75Si + FeMn addition. After the third addition, the number of inclusions dropped but
the coverage increased owing to similar coalescence behavior. The average inclusion
size would be much larger compared to the inclusions observed after Fe75Si + FeMn
addition. This behavior suggested that the inclusions were agglomerating to form larger
inclusions.
Figure 10 (b) shows the amount of the different elements in the inclusions divided
by the total elements in the samples in ppm values at 5 minutes after different ferro-alloy
additions. It was observed that the addition of FeTi resulted in drop of Mn and Si content
of the inclusions. The drop was more predominant in case of Si than Mn as explained
earlier. Mn and Si content in the inclusions would be replaced by the Ti from the FeTi
added which was also confirmed by the thermodynamic calculations. Thermodynamic
calculations showed no change in the Al and Ca component of inclusions due to the FeTi
addition. The sulfur content of the inclusions also dropped with addition of FeTi.
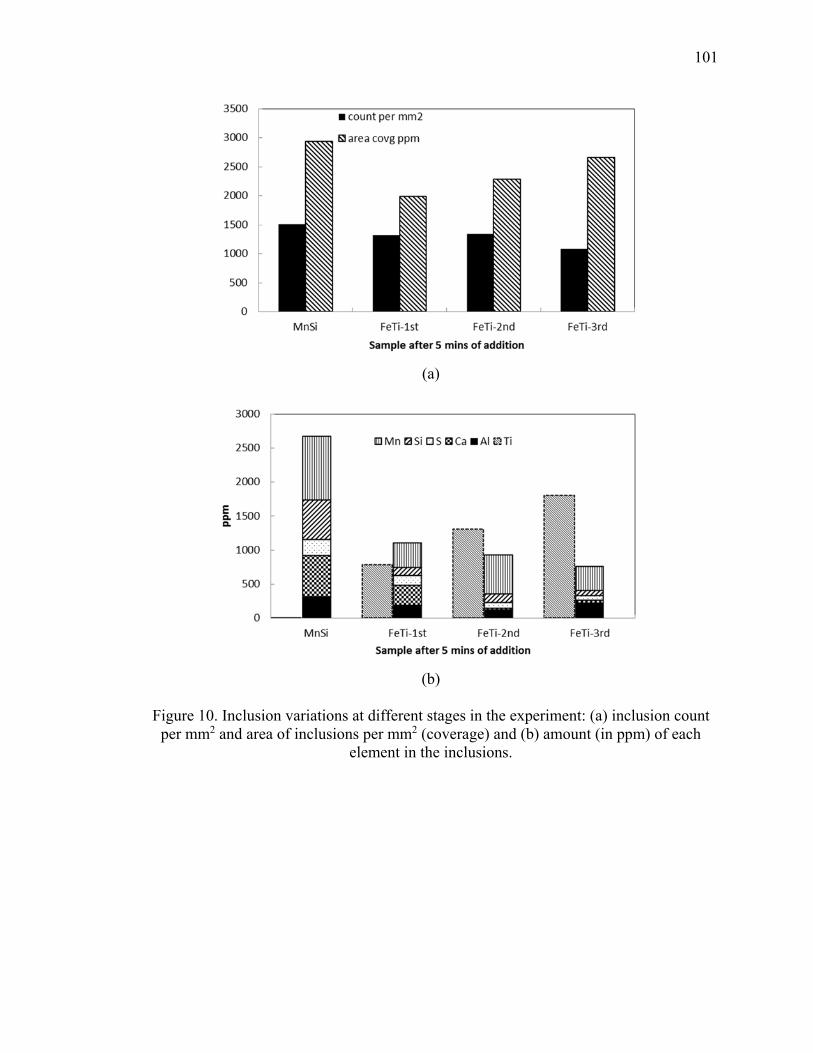
101
(a)
(b)
Figure 10. Inclusion variations at different stages in the experiment: (a) inclusion count per mm2 and area of inclusions per mm2 (coverage) and (b) amount (in ppm) of each
element in the inclusions.
102
5. CONCLUSIONS
In the present study, Mn-Si-Al-O based solid/liquid inclusions were modified
with Ti additions. Experiments and thermodynamic modeling was performed to assess
the effects of Ti addition on inclusions in Mn-Si killed steel. Inclusion composition was
plotted using a quaternary system to observe inclusion evolution with time. Inclusions
were divided into categories based on their compositions and these compositions further
used to study thermodynamic equilibrium with steel. The following conclusions can be
drawn from this study:
1. FeTi addition transformed all the existing inclusions in the Mn-Si killed
steel by enriching the inclusions with Ti to form liquid inclusions.
2. Both Si and Mn were removed from the inclusions with FeTi addition. Si
removal was more predominant than Mn. Si content was reduced to less
than 5% after the second FeTi addition and was almost negligible after the
third addition. However, Mn was not removed completely. This behavior
can be attributed to the higher affinity of Ti-oxide for MnO than SiO2.
FeTi addition should be added in small fraction to achieve effective
modification with the inclusions remaining liquid.
3. The Al content in the inclusions did not change compared to the initial
composition. Most of the inclusions formed at temperature were Ti-Al-
Mn-O based complex inclusions. These inclusions precipitated Ti-rich
phase on solidification. MnS also precipitates on these inclusions.
4. Sulfide inclusions were formed as a result of MnS formation during
solidification. This phase can precipitate on existing oxide inclusions to

103
form mixed inclusions, since MnS was observed in inclusions both as a
separate phase or in solution. Due to changes in composition on cooling
and solidification (with Mn and S segregation), about 1/3rd of the
inclusions were mixed and about 1/6th were sulfides. The relative amounts
of these inclusions would depend on the relative oxygen and sulfur levels
in the steel.
5. Ti addition can be used to modify inclusions in Si-Mn killed steels
especially low Mn steels where solid SiO2 inclusions are a major cause of
concern.
ACKNOWLEDGEMENTS
The authors would like to express their sincere appreciation and gratitude for the
late Professor Kent D. Peaslee for providing guidance and support for this research and
for always being an inspiration for us.
104
REFERENCES
1) L. Zhang and B.G. Thomas: ISIJ Int., 43 (2003), 271.
2) K. Rackers and B.G. Thomas: 78th Steelmaking Conf. Proc., Iron and Steel Society, Warrendale, PA, (1995), 723.
3) L. Zhang and B.G. Thomas: XXIV National Steelmaking Symp., Morelia, Mich, Mexico, (2003), 138.
4) L. Zhang, S. Taniguchi and K. Cai: Metall. Mater. Trans. B, 31 (2000), 253.
5) L. Zhang and S. Taniguchi: International materials reviews, 45 (2000), 59.
6) B. H. Yoon, K. H. Heo, J. S. Kim and H. S. Sohn: Ironmaking Steelmaking, 29 (2002), 214.
7) Y. Murakami, S. Kodama and S. Konuma: International Journal of Fatigue, 11 (1989), 291.
8) M. Lind and L. Holappa: Metall. Mater. Trans. B, 41 (2010), 359.
9) R. B. Tuttle, J. D. Smith and K. D. Peaslee: Metall. Mater. Trans. B, 36 (2005), 885.
10) S. Chakraborty and Y. Sahai: Metall. Mater. Trans. B, 23 (1992), 135.
11) L. Zhang, J. Aoki and B. G. Thomas: Metall. Mater. Trans. B, 37 (2006), 361.
12) B.G. Thomas, A. Dennisov, and H. Bai: 80th Steelmaking Conf., ISS, Warrendale, PA, (1997), 375.
13) Y. Miki, B.G. Thomas, A. Denissov and Y. Shimada: Iron & steelmaker, 24 (1997), 31.
14) E.T. Turkdogan: “Fundamentals of Steelmaking”, The Institute of Materials, London, (1996), 285.
15) E. B. Pretorius and R. Marr: 53rd Electric Furnace Conf. Proc., Iron and Steel Society, Orlando, (1995), 407.
16) C.W. Bale, P. Chartrand, S.A. Degterov, G. Eriksson, K. Hack, R. Ben Mahfoud, J. Melancon, A.D. Pelton and S. Petersen: Calphad Journal, 26 (2002), 189.
105
17) Y. Kanga, I. Jung and H. Lee: Calphad Journal, 30 (2006), 226.
18) H. Amitani, K. Morita and N. Sano: ISIJ Int., 36 (1996), S26.
19) Z.T. Ma and D. Janke: Acta Metallurgica Sinica, 11 (1998), 79.
20) H. Kim, H. Lee and K. Oh: ISIJ Int., 42 (2002), 1404.
21) M. Kiviö and L. Holappa: Metall. Mater. Trans. B, 43 (2012), 233.
22) G. Eriksson and A.D. Pelton: Metall. Mater. Trans. B, 24 (1993), 795.

106
III. A KINETIC MODEL FOR VACUUM TANK DEGASSING
Vivek Thapliyal
Simon N. Lekakh
David G. C. Robertson
Jeffrey D. Smith
Materials Science and Engineering
Missouri University of Science & Technology
Rolla, MO
Phone - 573-341-6469,
E-mail – [email protected]
To be submitted for publication in ISIJ International
107
ABSTRACT
Vacuum tank degassing is used as a unit process in secondary steelmaking to
remove nitrogen, hydrogen, carbon, sulphur, oxygen and other elements from steel. Even
though the pressure inside the vacuum tank degasser (VTD) is low, the actual pressure
felt by the liquid metal varies with depth of the ladle due to the metallo-static effects.
The melt is always stirred by argon, so that over time the whole volume of steel
experiences the low pressure at the top surface of the melt. The pressure in the vacuum
chamber and the argon flow rate both vary with time. A detailed kinetic model of the
process has been developed taking into account the stirring of the melt by argon, the mass
transfer into the rising argon bubbles, the steel/slag/gas reactions at the top surface of the
melt, and spontaneous formation of CO bubbles in the upper regions of the melt where
the pressure is low enough for CO bubble growth to occur. A particular feature of the
model was that the chemistry of the reactions was very accurately modelled by using
FactSage 6.4. This kinetic model provides a valuable tool to study the reactions
occurring at different local conditions in the VTD.
Key Words: Vacuum tank degassing, steel, modeling

108
1. INTRODUCTION
Vacuum degassing is widely used as a secondary steelmaking process to achieve
low concentrations of nitrogen, hydrogen, carbon, sulphur, and other elements in steel.
Ruhrstahl Heraeus (RH) degasser and vacuum tank degasser (VTD) are the two most
widely used reactors for this purpose. Researchers have used various models to study the
degassing process in both these reactors.1-8) Most of these models focus on the de-
carburization (de-C) process.
Previously, a dynamic model for the VTD using computational fluid dynamic
software (FLUENT 6.29)) and process simulator software (METSIM10)) was developed
by the authors.1) The databases and “extent of reaction” feature available in METSIM
were utilized for de-C reaction. It was identified that for a more sophisticated model the
following changes were required: (a) incorporation of changes in the flow pattern due to
spontaneous CO evolution, (b) variation of mass transfer rate to reaction interfaces, with
different argon (Ar) flow rates, (c) extension of the model to include non-metallic
inclusion formation and steel cleanliness, and (d) utilization of thermodynamic databases
available in FactSage 6.411).
In the present study, a dynamic model for the VTD has been developed by using
databases and macro-language available in FactSage software. This allowed to include
solid compounds and solid-solutions in the equilibrium calculations along with all the
possible gases. Van Ende et al.2) developed a kinetic model for the RH degassing process
by utilizing the macro-language feature available in FactSage to link thermodynamic
databases to the process parameters. A similar approach has been utilized by researchers
to study steel/refractory/inclusion and steel/refractory interactions.12,13)
109
Computational fluid dynamics (CFD) has been used to provide data for the melt
flow, which was driven by the injection of argon. Processing data from a typical heat in
industrial practice were used as input to the CFD calculations. The pressure above the
melt and the argon flow rate were important inputs which varied with time during a heat.
Sampling during VTD processing without disrupting the vacuum is difficult.
Therefore, a dynamic model which could predict steel chemistry during processing in the
VTD, would be very useful. The system was simplified by dividing the melt volume into
zones. The volume of the zones and the melt flow between the zones was determined
based on the CFD calculations. Thermodynamic calculations were performed for
different local conditions in these zones using FactSage. The results were compared to
industrial data for model verification.
2. VTD MODEL CONCEPT
In a VTD, vacuum is applied to liquid steel in a ladle. Even though the applied
pressure during the VTD processing can be as low as 1x10² Pa, the local pressure
(pressure applied + metallo-static pressure) in the melt is much higher. Also, the local
pressure is not the same throughout the ladle volume. At the bottom of a ladle (with
liquid metal height ~3 m) the metallo-static pressure is 2x10⁵ Pa. The effect of the
applied vacuum is observed only in the top region. During the degassing process, CO
gas-bubbles are generated in this top region which causes mixing. Mixing is further
increased by flowing Ar into the ladle through porous plugs at the bottom of the ladle.
The present model was designed to represent the conditions within the ladle by dividing
the ladle volume into multiple zones. Figure 1 shows a representation of the model
having the following zones:
110
(a) Zone-0 – Liquid steel in this zone was in contact with slag. This zone supplied
liquid steel to steel/slag/gas interface. Ferro-alloy additions were made in this
zone. Spontaneous de-C also occurred in this zone.
(b) Zone-1 – In this zone, degassing reactions occurred in steel under local pressure.
A fraction of material entering this zone was assumed to participate in the
spontaneous de-C reaction. The fraction of steel undergoing de-C was
equilibrated at the local pressure shown as FEM 1 (Figure 1). This zone was not
in line with the Ar plume and has predominantly downward flow.
(c) Zone-2, Zone-3 and Zone-4 – These were the regions without any spontaneous
degassing reactions due to high local pressure (>0.5x10⁵ Pa).
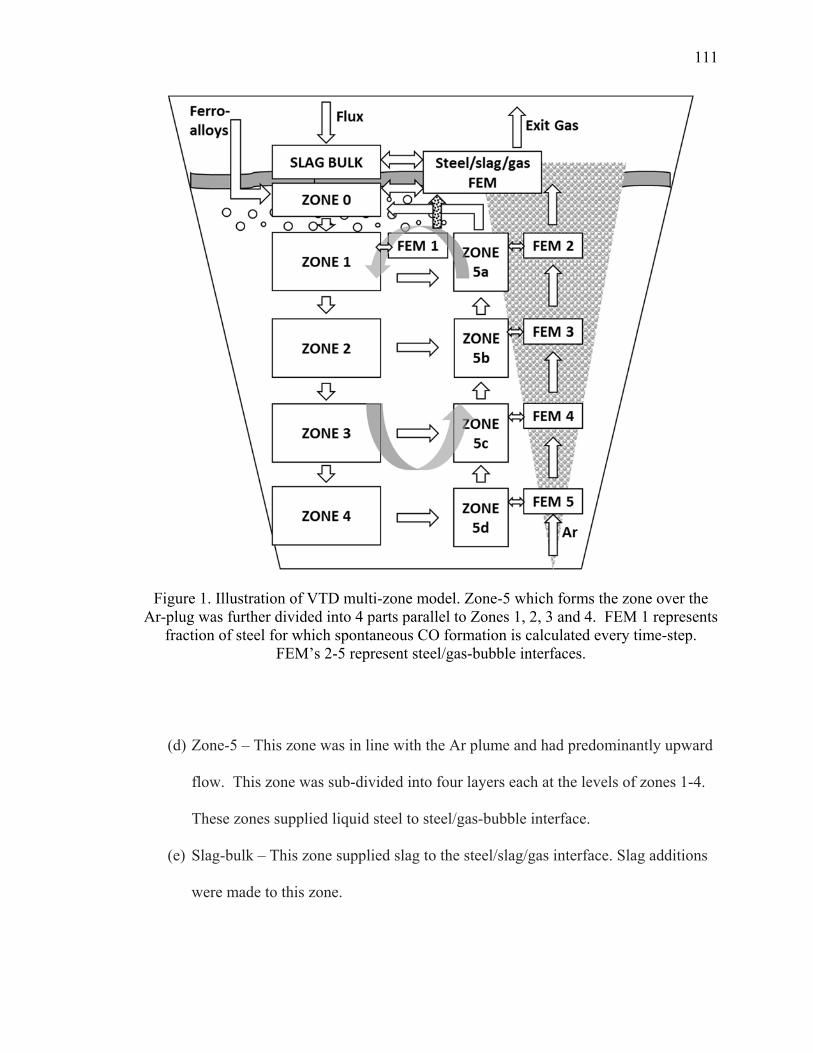
111
Figure 1. Illustration of VTD multi-zone model. Zone-5 which forms the zone over the Ar-plug was further divided into 4 parts parallel to Zones 1, 2, 3 and 4. FEM 1 represents
fraction of steel for which spontaneous CO formation is calculated every time-step. FEM’s 2-5 represent steel/gas-bubble interfaces.
(d) Zone-5 – This zone was in line with the Ar plume and had predominantly upward
flow. This zone was sub-divided into four layers each at the levels of zones 1-4.
These zones supplied liquid steel to steel/gas-bubble interface.
(e) Slag-bulk – This zone supplied slag to the steel/slag/gas interface. Slag additions
were made to this zone.
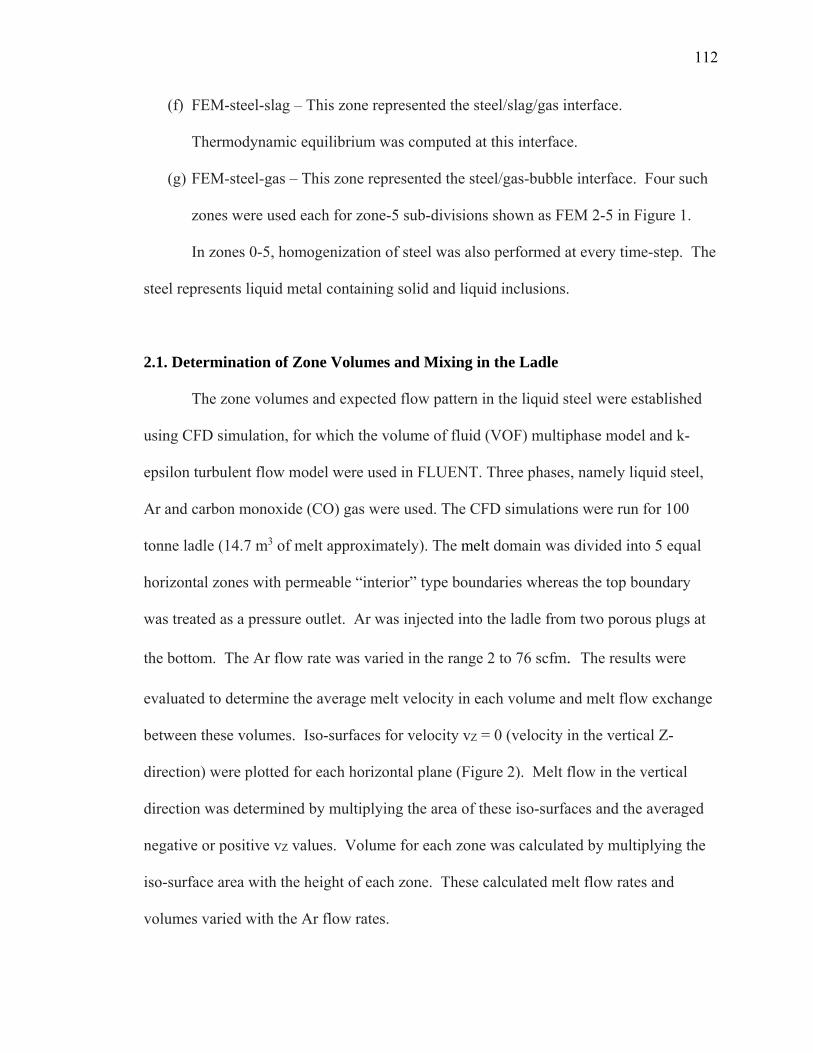
112
(f) FEM-steel-slag – This zone represented the steel/slag/gas interface.
Thermodynamic equilibrium was computed at this interface.
(g) FEM-steel-gas – This zone represented the steel/gas-bubble interface. Four such
zones were used each for zone-5 sub-divisions shown as FEM 2-5 in Figure 1.
In zones 0-5, homogenization of steel was also performed at every time-step. The
steel represents liquid metal containing solid and liquid inclusions.
2.1. Determination of Zone Volumes and Mixing in the Ladle
The zone volumes and expected flow pattern in the liquid steel were established
using CFD simulation, for which the volume of fluid (VOF) multiphase model and k-
epsilon turbulent flow model were used in FLUENT. Three phases, namely liquid steel,
Ar and carbon monoxide (CO) gas were used. The CFD simulations were run for 100
tonne ladle (14.7 m3 of melt approximately). The melt domain was divided into 5 equal
horizontal zones with permeable “interior” type boundaries whereas the top boundary
was treated as a pressure outlet. Ar was injected into the ladle from two porous plugs at
the bottom. The Ar flow rate was varied in the range 2 to 76 scfm. The results were
evaluated to determine the average melt velocity in each volume and melt flow exchange
between these volumes. Iso-surfaces for velocity vZ = 0 (velocity in the vertical Z-
direction) were plotted for each horizontal plane (Figure 2). Melt flow in the vertical
direction was determined by multiplying the area of these iso-surfaces and the averaged
negative or positive vZ values. Volume for each zone was calculated by multiplying the
iso-surface area with the height of each zone. These calculated melt flow rates and
volumes varied with the Ar flow rates.

113
(a)
(b)
(c)
Figure 2. Illustration of a) vector velocity in ladle domain and b) cross section, and c) position of iso-lines Vz=0 in different cross sections
Mixing times for different Ar flow rates (without internal CO evolution) were
evaluated for the CFD model by introducing tracers to the top region. The concentrations
at different levels were monitored. The time for complete mixing (mixing time) was
assumed to be the time at which the standard deviation of the tracer concentration about
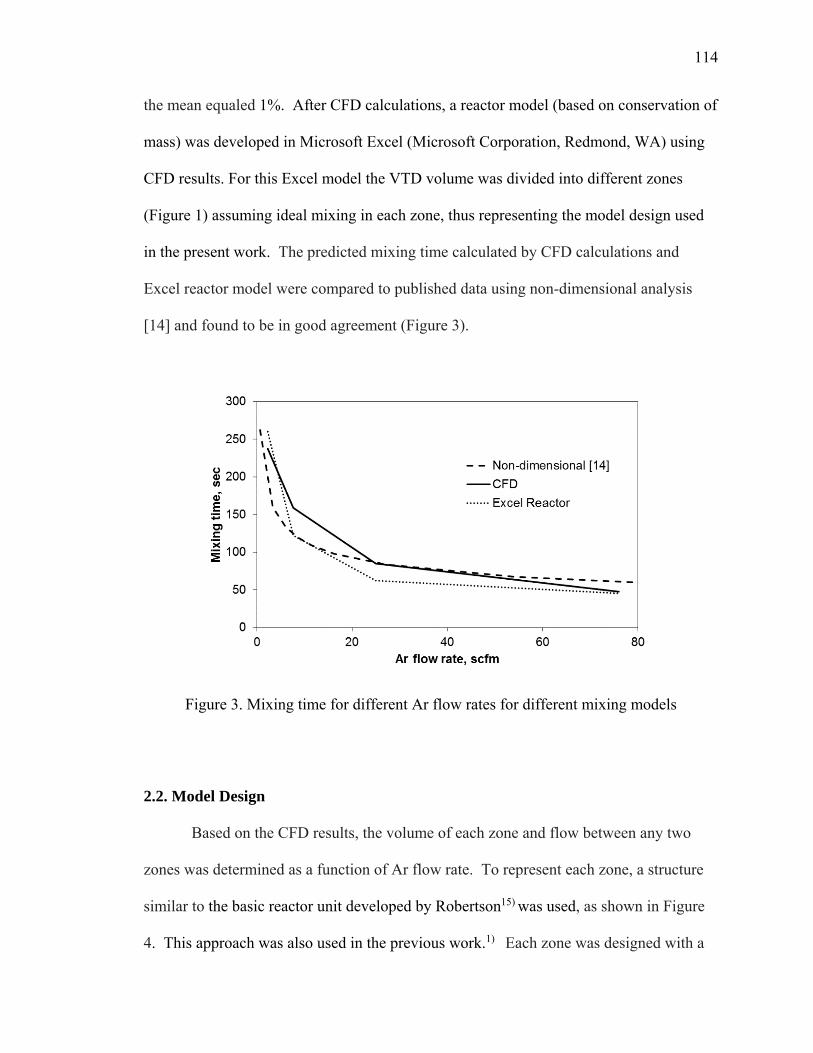
114
the mean equaled 1%. After CFD calculations, a reactor model (based on conservation of
mass) was developed in Microsoft Excel (Microsoft Corporation, Redmond, WA) using
CFD results. For this Excel model the VTD volume was divided into different zones
(Figure 1) assuming ideal mixing in each zone, thus representing the model design used
in the present work. The predicted mixing time calculated by CFD calculations and
Excel reactor model were compared to published data using non-dimensional analysis
[14] and found to be in good agreement (Figure 3).
Figure 3. Mixing time for different Ar flow rates for different mixing models
2.2. Model Design
Based on the CFD results, the volume of each zone and flow between any two
zones was determined as a function of Ar flow rate. To represent each zone, a structure
similar to the basic reactor unit developed by Robertson15) was used, as shown in Figure
4. This approach was also used in the previous work.1) Each zone was designed with a
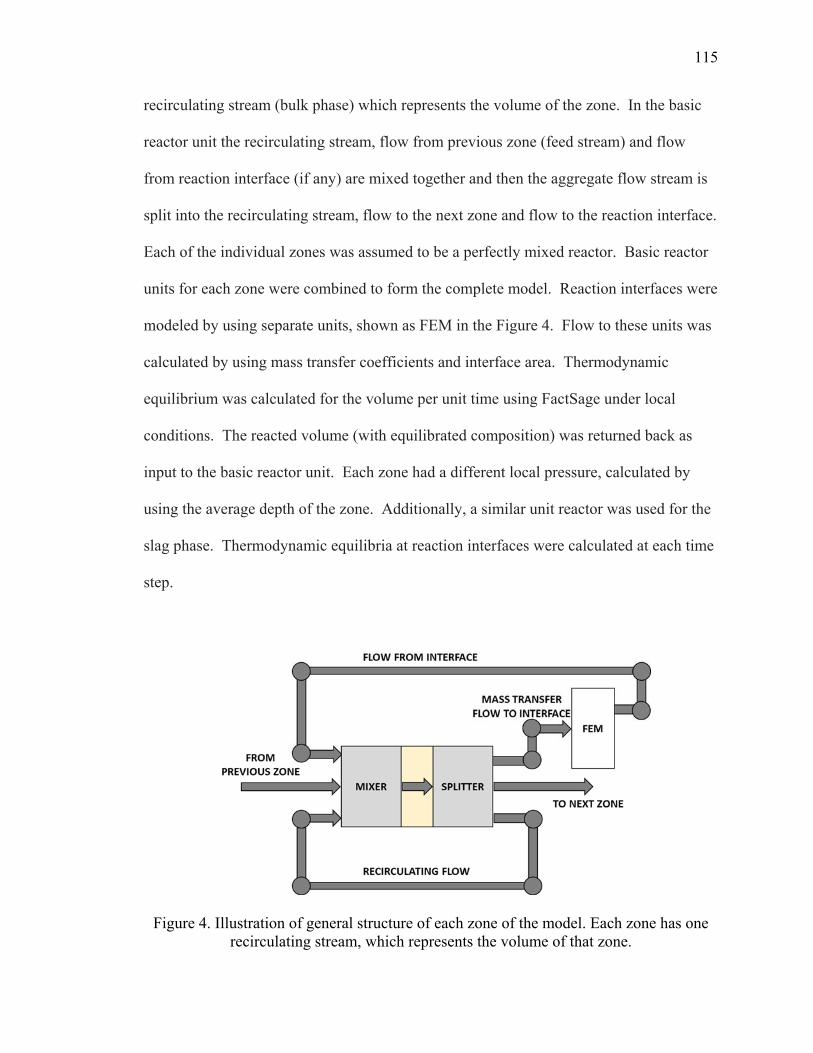
115
recirculating stream (bulk phase) which represents the volume of the zone. In the basic
reactor unit the recirculating stream, flow from previous zone (feed stream) and flow
from reaction interface (if any) are mixed together and then the aggregate flow stream is
split into the recirculating stream, flow to the next zone and flow to the reaction interface.
Each of the individual zones was assumed to be a perfectly mixed reactor. Basic reactor
units for each zone were combined to form the complete model. Reaction interfaces were
modeled by using separate units, shown as FEM in the Figure 4. Flow to these units was
calculated by using mass transfer coefficients and interface area. Thermodynamic
equilibrium was calculated for the volume per unit time using FactSage under local
conditions. The reacted volume (with equilibrated composition) was returned back as
input to the basic reactor unit. Each zone had a different local pressure, calculated by
using the average depth of the zone. Additionally, a similar unit reactor was used for the
slag phase. Thermodynamic equilibria at reaction interfaces were calculated at each time
step.
Figure 4. Illustration of general structure of each zone of the model. Each zone has one recirculating stream, which represents the volume of that zone.
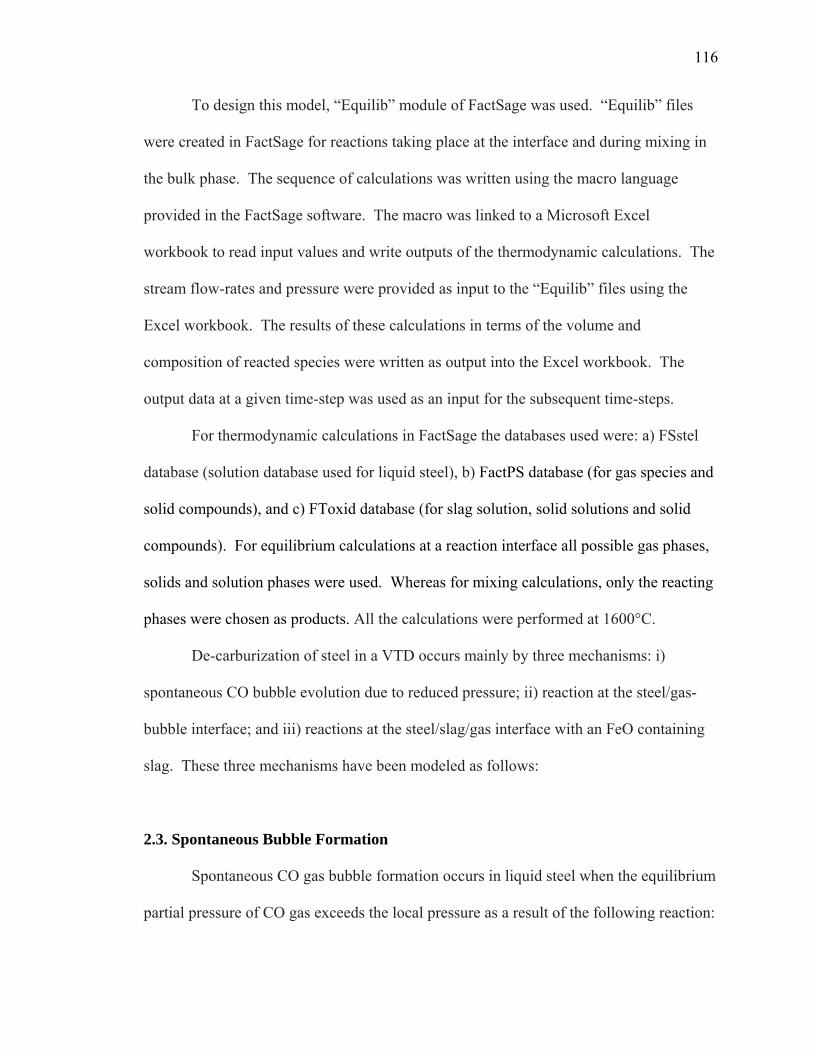
116
To design this model, “Equilib” module of FactSage was used. “Equilib” files
were created in FactSage for reactions taking place at the interface and during mixing in
the bulk phase. The sequence of calculations was written using the macro language
provided in the FactSage software. The macro was linked to a Microsoft Excel
workbook to read input values and write outputs of the thermodynamic calculations. The
stream flow-rates and pressure were provided as input to the “Equilib” files using the
Excel workbook. The results of these calculations in terms of the volume and
composition of reacted species were written as output into the Excel workbook. The
output data at a given time-step was used as an input for the subsequent time-steps.
For thermodynamic calculations in FactSage the databases used were: a) FSstel
database (solution database used for liquid steel), b) FactPS database (for gas species and
solid compounds), and c) FToxid database (for slag solution, solid solutions and solid
compounds). For equilibrium calculations at a reaction interface all possible gas phases,
solids and solution phases were used. Whereas for mixing calculations, only the reacting
phases were chosen as products. All the calculations were performed at 1600°C.
De-carburization of steel in a VTD occurs mainly by three mechanisms: i)
spontaneous CO bubble evolution due to reduced pressure; ii) reaction at the steel/gas-
bubble interface; and iii) reactions at the steel/slag/gas interface with an FeO containing
slag. These three mechanisms have been modeled as follows:
2.3. Spontaneous Bubble Formation
Spontaneous CO gas bubble formation occurs in liquid steel when the equilibrium
partial pressure of CO gas exceeds the local pressure as a result of the following reaction:

117
(1)
This reaction occurs in the top zone in the ladle where the local pressure is low.
At a given depth in the steel, local pressure is a sum of the applied pressure at the surface
and the metallo-static pressure due to steel and slag depth, given by:
(2)
where,
= local pressure in the melt
= applied pressure above the surface
= density of steel, 7200 kg/m3
g = acceleration due to gravity, 9.81 m/s2
= depth of steel column above the point at which local pressure is being calculated, m
= density of slag, 3500 kg/m3
= thickness of the slag layer above the melt, m
Researchers have suggested that CO bubbles can either self-nucleate
(homogeneous nucleation) or nucleate over inclusions in the steel or the ladle wall.16-19)
Researchers have reported that for spontaneous growth of CO bubbles supersaturation
pressure is required.16,17) Anghelina et al.16) have reported this supersaturation pressure to
be equivalent to that required to offset the surface tension for a 1.1 mm CO bubble
(~7x10³ Pa). El-Kaddah et al.19) reported the superstation required for CO bubble
nucleation in levitated iron drops to be as low as 1x10⁶ Pa at high oxygen potentials.

118
In the present work, it was assumed that CO bubble growth was the limiting
condition as there were enough heterogeneous nucleation sites (inclusions and refractory
surface). If the local pressure dropped below pCO (growth possible) then CO bubbles
formed ‘spontaneously’, by some undefined mechanism. The CO bubble generation
creates vigorous mixing in the top region. It was assumed that spontaneous CO bubble
formation only occurs in zone 1 where the local pressure is low. In the lower zones (zone
2 - 4, 5b - 5d), the local pressure was greater than 0.5x10⁵ Pa. The amount of CO bubble
formation would depend on the number of available nucleation sites and carbon diffusion
in the melt. To account for this, it was assumed that a fraction (1/5th) of liquid metal
under-goes spontaneous de-carburization in one time-step. Even though the choice of
this fraction is arbitrary it allows for an easy representation of this complicated process
which is still a subject of debate among researchers.16-19 This fraction can be varied and
made a function of carbon diffusivity, inclusion density, CO super-saturation required for
growth, stirring intensity and other such parameters which might affect spontaneous CO
gas bubble formation.
2.4. Reactions at Gas Bubble Interface
Ar gas is injected into the ladle in a VTD to mix the decarburized steel at the top
with the steel in the lower region. Ar stirring also enhances the steel/slag/gas reactions.
Further, Ar with zero partial pressure of CO at the bottom picks up C and O from the
liquid metal by providing a steel/gas-bubble interface for CO formation.
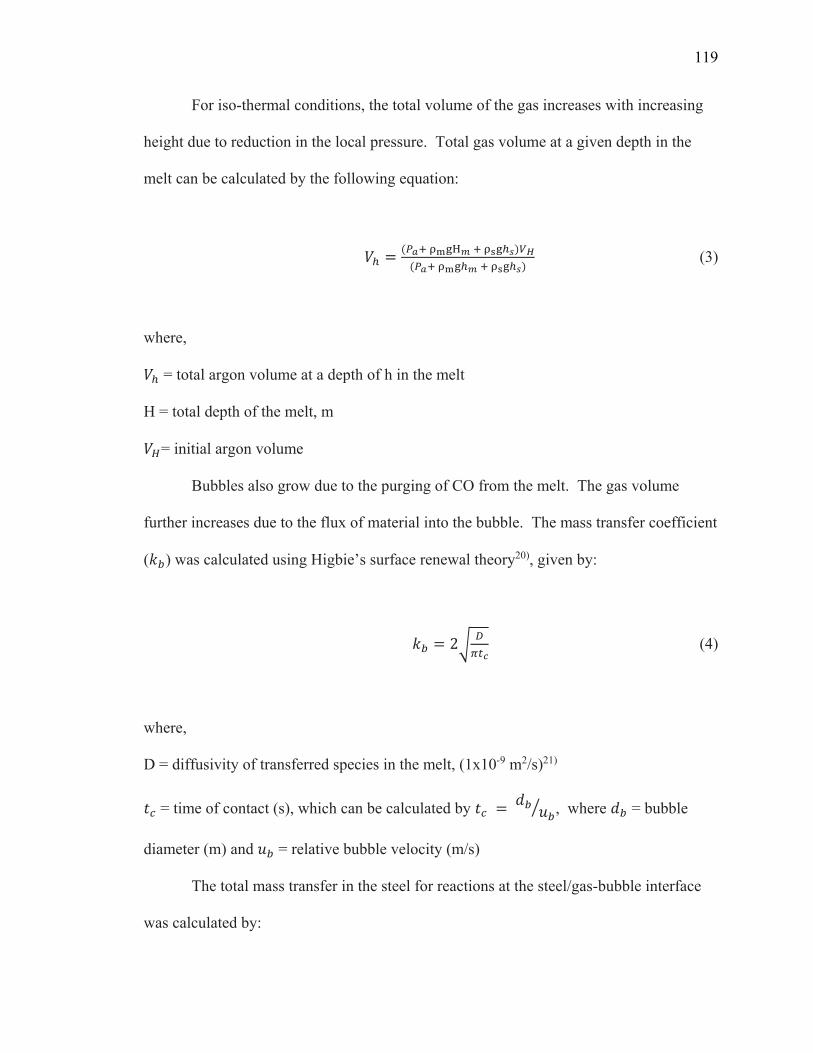
119
For iso-thermal conditions, the total volume of the gas increases with increasing
height due to reduction in the local pressure. Total gas volume at a given depth in the
melt can be calculated by the following equation:
(3)
where,
= total argon volume at a depth of h in the melt
H = total depth of the melt, m
= initial argon volume
Bubbles also grow due to the purging of CO from the melt. The gas volume
further increases due to the flux of material into the bubble. The mass transfer coefficient
( ) was calculated using Higbie’s surface renewal theory20), given by:
2 (4)
where,
D = diffusivity of transferred species in the melt, (1x10⁻⁹ m2/s)21)
= time of contact (s), which can be calculated by , where = bubble
diameter (m) and = relative bubble velocity (m/s)
The total mass transfer in the steel for reactions at the steel/gas-bubble interface
was calculated by:
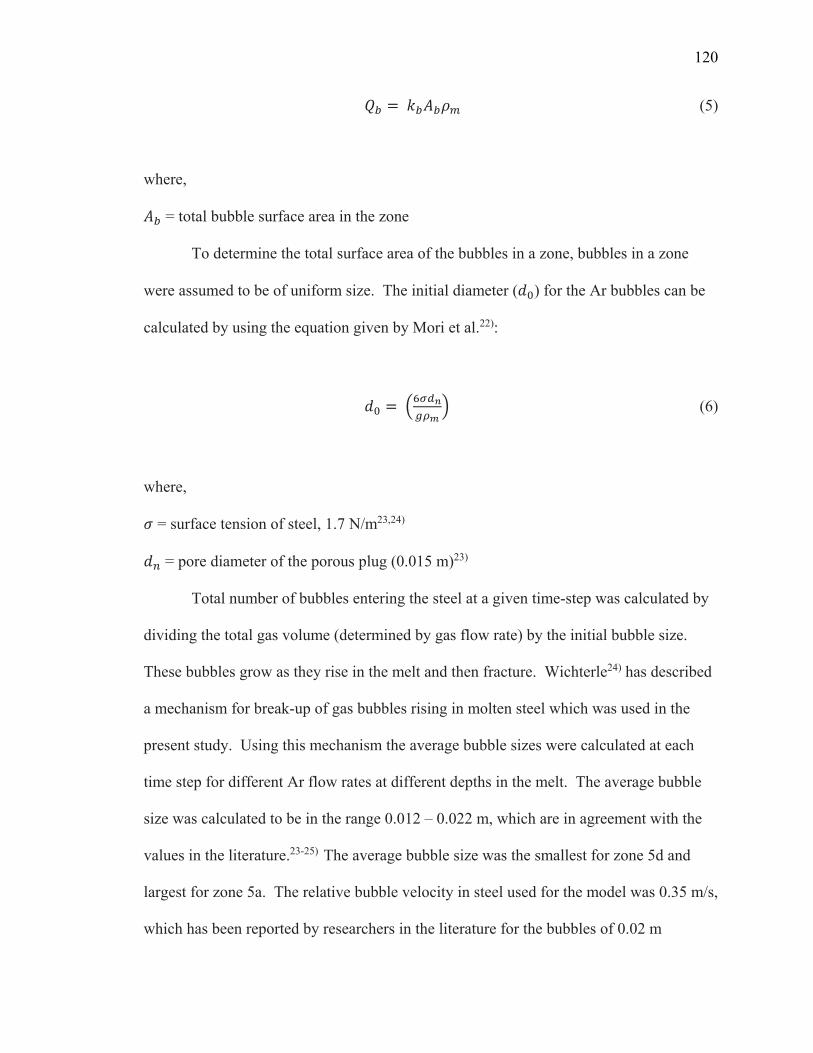
120
(5)
where,
= total bubble surface area in the zone
To determine the total surface area of the bubbles in a zone, bubbles in a zone
were assumed to be of uniform size. The initial diameter ( ) for the Ar bubbles can be
calculated by using the equation given by Mori et al.22):
(6)
where,
= surface tension of steel, 1.7 N/m23,24)
= pore diameter of the porous plug (0.015 m)23)
Total number of bubbles entering the steel at a given time-step was calculated by
dividing the total gas volume (determined by gas flow rate) by the initial bubble size.
These bubbles grow as they rise in the melt and then fracture. Wichterle24) has described
a mechanism for break-up of gas bubbles rising in molten steel which was used in the
present study. Using this mechanism the average bubble sizes were calculated at each
time step for different Ar flow rates at different depths in the melt. The average bubble
size was calculated to be in the range 0.012 – 0.022 m, which are in agreement with the
values in the literature.23-25) The average bubble size was the smallest for zone 5d and
largest for zone 5a. The relative bubble velocity in steel used for the model was 0.35 m/s,
which has been reported by researchers in the literature for the bubbles of 0.02 m

121
diameter.23,25) The total number of bubbles increased as the gas moved up in the ladle
thereby increasing the total steel/gas-bubble interface area.
Pure Ar was injected into zone 5d, where it reacted with steel and inclusions. The
reacted gas and inclusions were then carried to zone 5c forming the steel/gas-bubble
interface for this zone. This procedure was followed into zone 5b and 5a after which the
inclusions were carried to the steel/slag/gas interface.
2.5. Reactions at the Steel/Slag/Gas Interface
The bulk slag (which consisted of slag, solid-solutions and solid compounds) was
reacted with the steel present in the top layer (zone 0) and the reacted gases and
inclusions rising in the melt. No argon bubbles were reacted at the steel/slag/gas
interface as this gas was assumed to go out through the open eye. All the inclusions
coming in contact with the steel were assumed to be trapped in the slag phase. The total
mass transfer flow ( ) for the steel was calculated by the following equation:
(9)
where,
= mass transfer coefficient in steel, m/s
= total surface area of the interface, m2
The mass transfer coefficient ( ) varies with the changing Ar flow rate. Peter et
al.26) proposed the mass transfer rate constant ( , representing the fraction of steel
reacting with the slag during one time-step) to be a function of the stirring intensity. The

122
mass transfer coefficient ( ) would be proportional to this rate constant ( ). Their work
was performed for ladle of the same size (~110 metric tonnes) and similar gas flow rates
(0-15 scfm). Using this approach the mass transfer coefficient can be expressed as:
0.018 . (10)
where,
= mass transfer rate constant in min-1
= stirring power is in Watts per metric ton, which can further be calculated by the
following equation27):
ε = 14.23 log 1.
(11)
where,
= Ar flow rate at standard temperature and pressure in m3/min
T = absolute steel temperature
M = steel mass in tonne
H = the total depth of the melt in m and is in atmosphere.
The mass transfer coefficient for the slag phase was assumed to be the same as
that for the steel. The calculations for the varying mass transfer coefficients, total bubble
surface area and flows between zones as a function of pressure at the surface, Ar flow
rate and steel depth were calculated in the Excel workbook at every time-step.
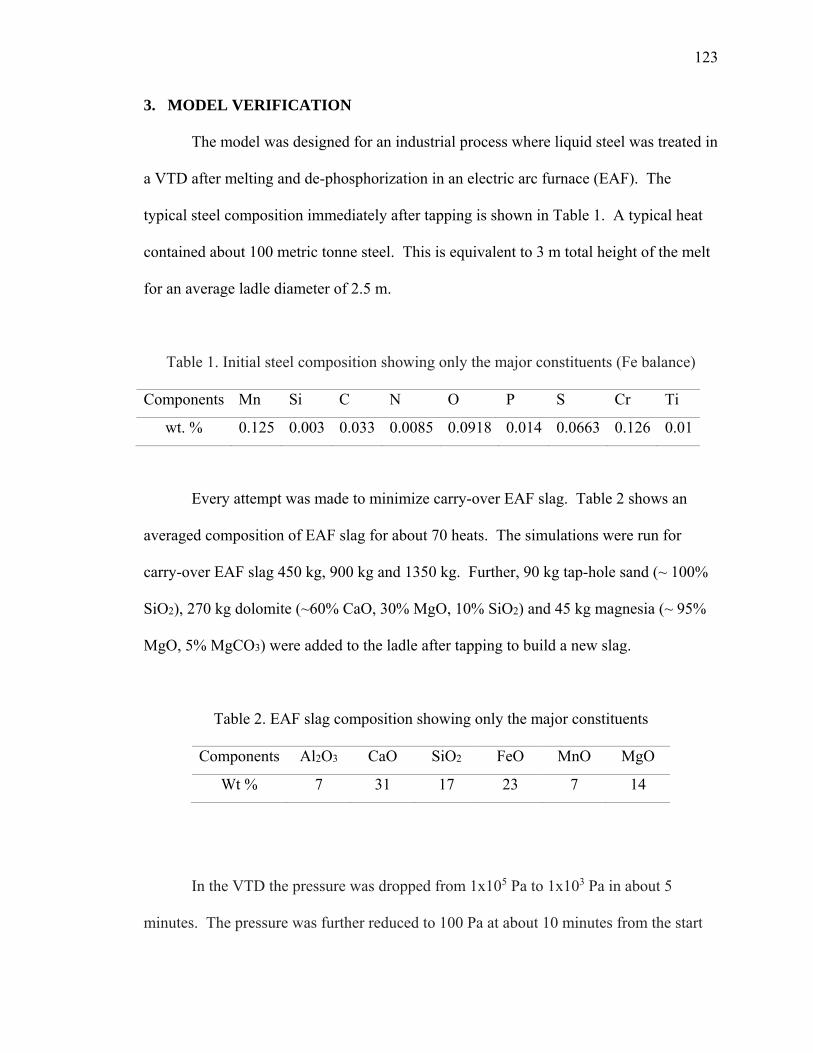
123
3. MODEL VERIFICATION
The model was designed for an industrial process where liquid steel was treated in
a VTD after melting and de-phosphorization in an electric arc furnace (EAF). The
typical steel composition immediately after tapping is shown in Table 1. A typical heat
contained about 100 metric tonne steel. This is equivalent to 3 m total height of the melt
for an average ladle diameter of 2.5 m.
Table 1. Initial steel composition showing only the major constituents (Fe balance)
Components Mn Si C N O P S Cr Ti
wt. % 0.125 0.003 0.033 0.0085 0.0918 0.014 0.0663 0.126 0.01
Every attempt was made to minimize carry-over EAF slag. Table 2 shows an
averaged composition of EAF slag for about 70 heats. The simulations were run for
carry-over EAF slag 450 kg, 900 kg and 1350 kg. Further, 90 kg tap-hole sand (~ 100%
SiO2), 270 kg dolomite (~60% CaO, 30% MgO, 10% SiO2) and 45 kg magnesia (~ 95%
MgO, 5% MgCO3) were added to the ladle after tapping to build a new slag.
Table 2. EAF slag composition showing only the major constituents
Components Al2O3 CaO SiO2 FeO MnO MgO
Wt % 7 31 17 23 7 14
In the VTD the pressure was dropped from 1x10⁵ Pa to 1x10³ Pa in about 5
minutes. The pressure was further reduced to 100 Pa at about 10 minutes from the start
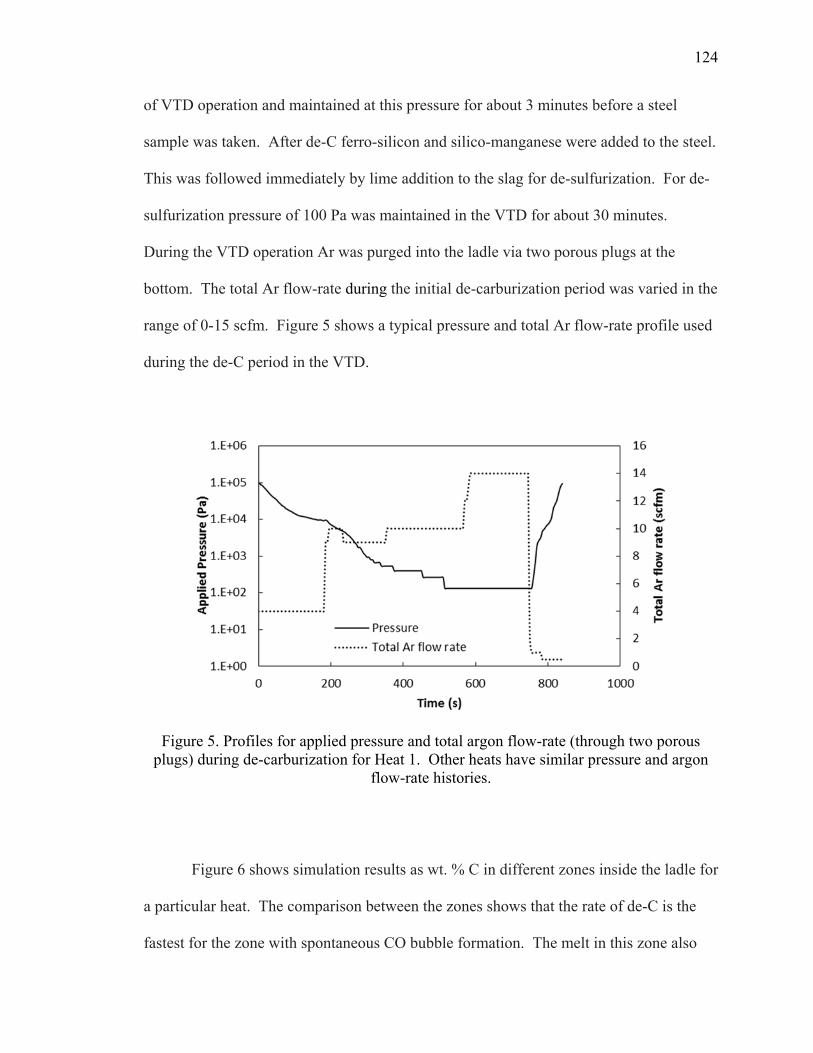
124
of VTD operation and maintained at this pressure for about 3 minutes before a steel
sample was taken. After de-C ferro-silicon and silico-manganese were added to the steel.
This was followed immediately by lime addition to the slag for de-sulfurization. For de-
sulfurization pressure of 100 Pa was maintained in the VTD for about 30 minutes.
During the VTD operation Ar was purged into the ladle via two porous plugs at the
bottom. The total Ar flow-rate during the initial de-carburization period was varied in the
range of 0-15 scfm. Figure 5 shows a typical pressure and total Ar flow-rate profile used
during the de-C period in the VTD.
Figure 5. Profiles for applied pressure and total argon flow-rate (through two porous plugs) during de-carburization for Heat 1. Other heats have similar pressure and argon
flow-rate histories.
Figure 6 shows simulation results as wt. % C in different zones inside the ladle for
a particular heat. The comparison between the zones shows that the rate of de-C is the
fastest for the zone with spontaneous CO bubble formation. The melt in this zone also
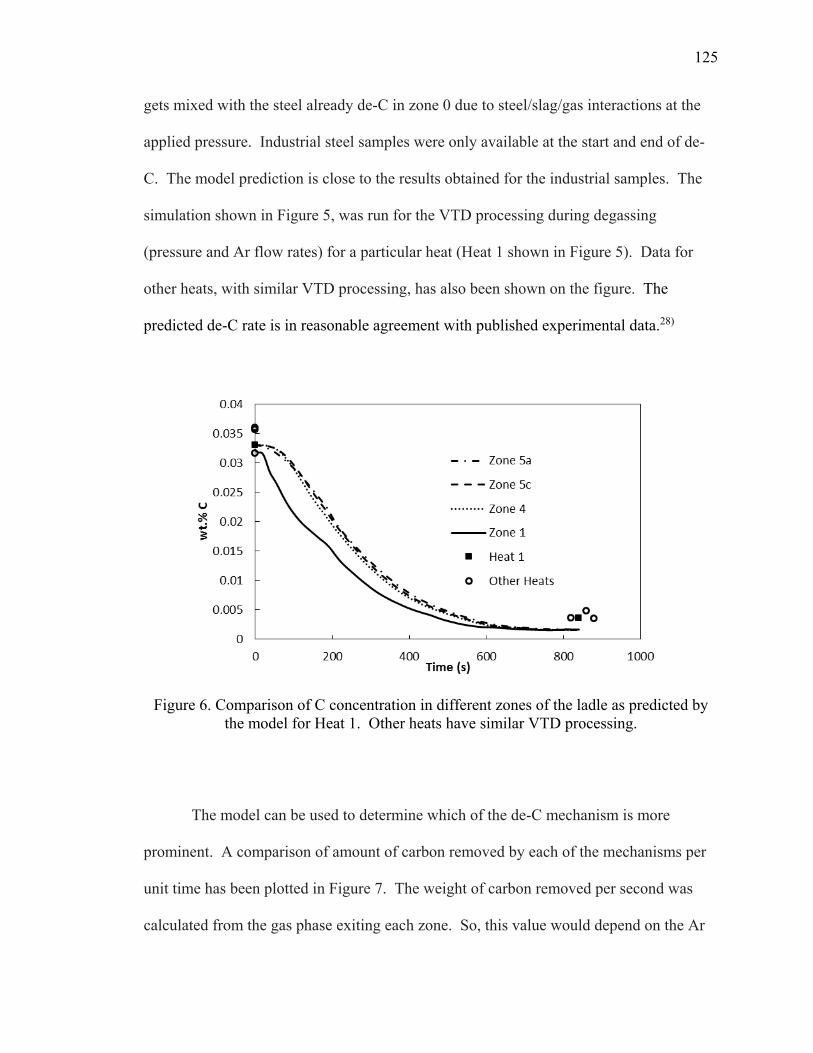
125
gets mixed with the steel already de-C in zone 0 due to steel/slag/gas interactions at the
applied pressure. Industrial steel samples were only available at the start and end of de-
C. The model prediction is close to the results obtained for the industrial samples. The
simulation shown in Figure 5, was run for the VTD processing during degassing
(pressure and Ar flow rates) for a particular heat (Heat 1 shown in Figure 5). Data for
other heats, with similar VTD processing, has also been shown on the figure. The
predicted de-C rate is in reasonable agreement with published experimental data.28)
Figure 6. Comparison of C concentration in different zones of the ladle as predicted by the model for Heat 1. Other heats have similar VTD processing.
The model can be used to determine which of the de-C mechanism is more
prominent. A comparison of amount of carbon removed by each of the mechanisms per
unit time has been plotted in Figure 7. The weight of carbon removed per second was
calculated from the gas phase exiting each zone. So, this value would depend on the Ar
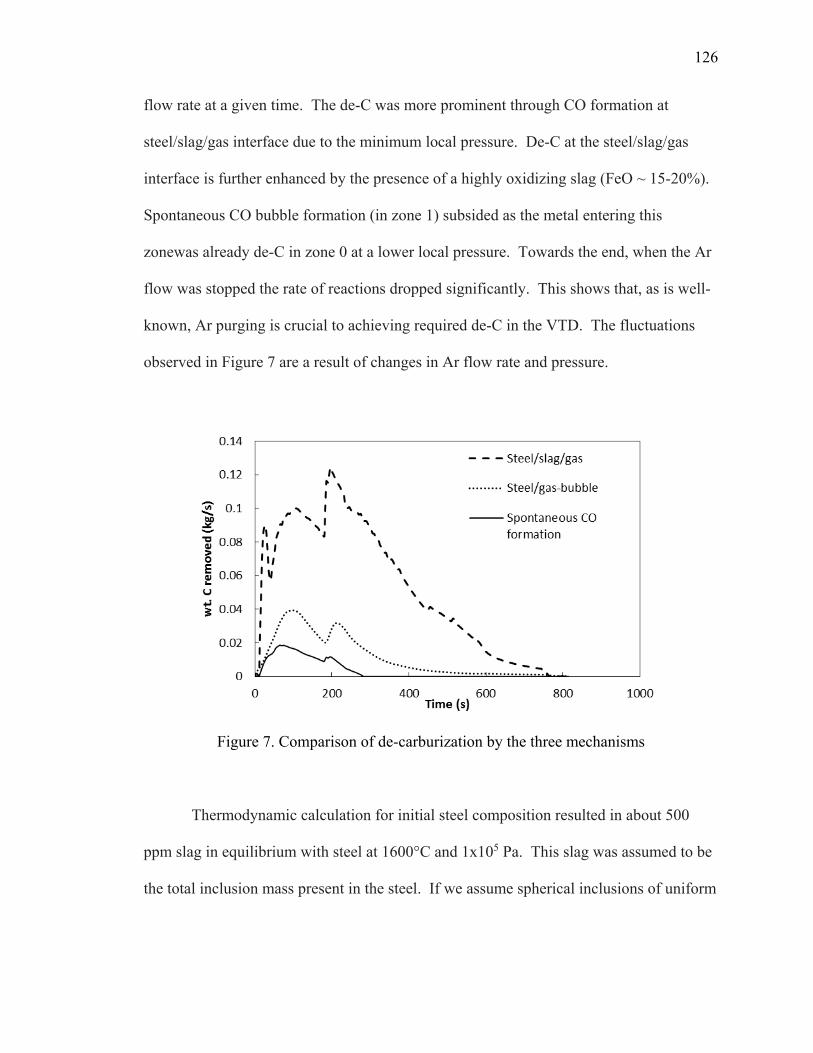
126
flow rate at a given time. The de-C was more prominent through CO formation at
steel/slag/gas interface due to the minimum local pressure. De-C at the steel/slag/gas
interface is further enhanced by the presence of a highly oxidizing slag (FeO ~ 15-20%).
Spontaneous CO bubble formation (in zone 1) subsided as the metal entering this
zonewas already de-C in zone 0 at a lower local pressure. Towards the end, when the Ar
flow was stopped the rate of reactions dropped significantly. This shows that, as is well-
known, Ar purging is crucial to achieving required de-C in the VTD. The fluctuations
observed in Figure 7 are a result of changes in Ar flow rate and pressure.
Figure 7. Comparison of de-carburization by the three mechanisms
Thermodynamic calculation for initial steel composition resulted in about 500
ppm slag in equilibrium with steel at 1600°C and 1x10⁵ Pa. This slag was assumed to be
the total inclusion mass present in the steel. If we assume spherical inclusions of uniform

127
size of 2 µm diameter, the number of inclusions per cm3 of steel volume is of the order of
108, which can act as nucleation sites for CO bubble nucleation.
The model calculates total inclusion mass and composition in each zone in the
ladle at every time-step. The inclusions were assumed to be perfectly mixed with the
steel and were involved in equilibrium calculation at each interface. Further, the
inclusions coming in contact with the gas bubbles were assumed to be carried along with
them finally separating at the top slag. This allows changes in the inclusion composition
to be tracked as the conditions change during the process (Figure 8). The model predicted
total inclusion mass to drop by 100 ppm in the zones 5 a-d and minimal change in zone 4.
For zone 0 and zone 1 maximum drop in the total inclusion content was predicted (250-
400 ppm).
Figure 8. Comparison of total inclusion mass in ppm in different zones

128
4. CONCLUSIONS
A comprehensive model was developed using FactSage to calculate the state of
the process under different conditions present during the operation in a VTD. All the
possible reactions have been considered by including metal, slag, solid-solutions, solid
compounds and all possible gases thus utilizing the full capabilities of the well-developed
FactSage software and its databases. This model predicts steel, slag and inclusion
composition in each zone throughout the VTD processing. The model also predicts the
total inclusion concentration with time.
The present model utilizes the previously developed theories of bubble
nucleation, growth and rupture during Ar purging to predict the mass transfer to the gas
bubbles. Change in mass transfer to the steel/slag/gas interface has also been
incorporated in the model. Even though a simple approach has been used for the
spontaneous CO bubble formation, the model provides a valuable tool in determining the
contribution of each mechanism towards overall de-carburization.
The model can be used as an online tool or run offline and used as a predictive
tool.
The model provides a tool to see how concentration in the ladle varies throughout
the whole volume. Parameters like mass transfer coefficients, rate constants, etc. can be
easily entered into the model. The model was coupled with an Excel file, which is used
for data entry, making the model flexible and easy to operate.
Steel/refractory interactions can also be added to the model. Further, the model
can be extended to study de-sulfurization reactions in the ladle during VTD processing.

129
ACKNOWLEDGMENT
The authors would like to express their sincere appreciation of the late Professor
Kent D. Peaslee for providing guidance and support for this research and for always
being an inspiration to us.

130
REFERENCES
1) V. Thapliyal, S.N. Lekakh, K.D. Peaslee and D.G.C. Robertson: AISTech conf. Proc., ISS, Warrendale, PA, USA, (2012), 118.
2) M.A. Van Ende, Y.M. Kim, M.K. Cho, J. Choi and I.H. Jung: Metallurgical and Materials Transactions B, 42 (2011), 477.
3) H. Gaye, D. Huin and N. Bannenberg: Eleventh International Conference on
Vacuum Metallurgy, ICVM 11, Antibes-Juan-les-Pins, France, (1992).
4) T. Kitamura, K. Miyamoto, R.Tsujino, S. Mizoguchi and K. Kato: ISIJ Int., 36 (1996), 395.
5) J.F. Domgin, P. Gardin, D. Huin, H. Saint-Raymond and F. Stouvenot: Progress
in Computational Fluid Dynamics An International Journal, 4 (2004), 20.
6) D. Anghelina and G.A. Irons: 58th Ironmaking Conference, Chicago, IL, USA, (1999).
7) D. Anghelina and G.A. Irons: Iron & Steel Society International Technology
Conference and Exposition 2003, Indianapolis, IN, USA, (2003).
8) H. Saint-Raymond, D. Huin and F. Stouvenot: Materials Transactions, JIM, 41 (2000), 17.
9) FLUENT 6.2: Fluent Inc., Lebanon, New Hampshire, Report, (2005).
10) METSIM Process Simulator: http://www.metsim.com, (2014).
11) C.W. Bale, P. Chartrand, S.A. Degterov, G. Eriksson, K. Hack, R. Ben Mahfoud, J. Melancon, A.D. Pelton and S. Petersen: Calphad Journal, 26 (2002), 189.
12) A. Kumar, V. Thapliyal and J. Smith: Int. J. of Applied Ceramic Tech., 11 (2014), 1001.
13) A. Kumar, V. Thapliyal, D.G.C. Robertson and J.D. Smith: J. Am. Ceram. Soc.,
(2015). doi: 10.1111/jace.13492.
14) K. Krishnapisharody and G. A. Irons: Steel Research Int., 81 (2010), 10.
15) D.G.C. Robertson: Proc. of the EPD Congress, T.M.S., Las Vegas, USA, (1995), 347.
16) D. Anghelina and G. A. Irons: AIST2003 Conf. Prof., ISS, Warrendale, PA, USA, (2003), 529.

131
17) T. Kitamura, K. Miyamoto, R. Tsujino, S. Mizoguchi and K. Kato: ISIJ Int., 36 (1996), 395.
18) S. Kitamura, M. Yano, K. Harashima and N. Tsutsumi: Tetsu-toHagané, 80 (1994), 213.
19) E. Kaddah and D.G.C. Robertson: Materials and Metallurgical Transactions B, 19
(1988), 831.
20) E. T. Turkdogan: “Physical Chemistry of High Temperature Technology”, Academic Press, NewYork, (1980), 251.
21) D.G.C. Robertson, S. Wei and A. Raman: Chemical Process Metallurgy: The
Elliott Symposium, G.R. St. Pierre, and P.J. Koros, Iron and Steel Society, Warrendale, PA, USA, (1990), 413.
22) K. Mori: ISIJ Int., 19 (1979), 552.
23) L. Zhang and S. Taniguchi: International Materials Review, 45 (2000), 59.
24) K. Wichterle: Steel Research International, 81 (2010), 356.
25) B.G. Thomas, A. Dennisov and H. Bai: 80th Steelmaking Conf., ISS, Warrendale, PA, 1997, 375.
26) J. Peter, K.D. Peaslee, D.G.C. Robertson and B.G. Thomas: AIST Tech 2004 Conf. Proc., ISS, Warrendale, PA, USA, (2004).
27) E.T. Turkdogan: “Fundamentals of Steelmaking”, The Institute of Materials,
London, (1996), 1.
28) J.F. Domgin, P. Gardin, D. Huin, H. Saint-Raymond and F. Stouvenot: Progress in Computational Fluid Dynamics, 4 (2004), 20.

132
2. SUMMARY
The present work discussed inclusion formation and evolution during the
processing of thin-strip casting process. Thin-strip casting technology is still in its early
phase of commercialization with many challenges including inclusion content of steel
which can lead to problems like clogging, strip-breaks and surface defects. Inclusion
engineering was studied for Mn-Si deoxidized steel focusing on inclusion evolution,
transformation and modification by ferro-alloy additions. An understanding of how
inclusions form and evolve during the process is key to finding possible methods of
inclusion modification and removal.
A methodology to study the formation and evolution of inclusions soon after
ferro-alloy additions (for alloying or deoxidation) has been developed. The knowledge of
inclusion evolution in the early stages can help to understand the nucleation and growth
of inclusions in the later stages. This methodology can be used for dissolution studies of
other ferro-alloys as well. It can also be used to study the effect of the alloy additions to
the inclusions already present in the steel. For thin-strip casting Mn-Si killed steels are
preferred to achieve MnO-SiO2 based liquid inclusions. In these steels ferro-silicon,
ferro-manganese and silico-manganese are used. The dissolution behavior of ferro-
silicon and ferro-manganese was studied in this work. Inclusions with solid SiO2 at the
interface were identified as possible heterogeneous nucleation sites for inclusions in the
later stage of processing.
FeTi addition to transform Mn-Si-Al-O based inclusions in Mn-Si killed steel was
studied. Even though most of the inclusions in Mn-Si killed steels are liquid at 1600ºC,
their solidification during casting can cause problems. Transforming these inclusions by
133
Ti addition lowers their melting point. Thus, Ti addition has the potential of keeping the
inclusions liquid during casting and rolling operation and by that, eliminating problems
of strip break during casting and cracking during rolling. Ti addition can be very helpful
in low Mn steels where solid SiO2 inclusions are a major cause of concern. The new
technique developed to represent inclusion composition (with more than three
components) and size on a ternary diagram provides better visualization of inclusion
population and can be used as a valuable tool to study inclusion evolution during steel
processing.
In addition, a comprehensive model for Vacuum Tank Degassing (VTD), which is
an essential component of thin-strip casting, was developed to estimate the removal of
gaseous species from liquid steel. Removal of these species further helps in lowering the
inclusion content of the steel. Using the model, compositional change in steel during
VTD processing as well as inclusion content could be tracked. The model was able to
replicate the industrial practice.
134
3. PROPOSED FUTURE WORK
Inclusion Formation Due to Ferro-Alloy Addition: Modification in the ping-pong
sampler can be made by restricting the location of ferro-alloy particle inside the sampler.
By restricting ferro-alloy motion, concentration variation of the alloying element in steel
can be observed avoiding any variability in the dissolution process. In addition,
thermodynamic modeling of inclusion formation can be performed for the range of
composition obtained for the alloying element. Data for the model can be generated from
the ferro-alloy dissolution experiment.
Inclusion Modification Using Ferro-Titanium Addition: In the previous experiments,
to study modification of Mn-Si based inclusions by FeTi addition, it has been observed
that too much FeTi was added which lead to their transformation to mainly Ti-Mn based
inclusions. So, lower amount of FeTi can be added in steps for inclusion modification in
Mn-Si killed steel. This experiment can also be used to determine the feasibility of FeTi
addition to modify the solid SiO2 inclusions observed in low Mn, Si-killed steels.
Inclusion Formation from Refractory Sources: To identify the inclusions from
refractory sources, interactions of Mn-Si killed steel and the refractories used in thin-strip
casting can be studied. Corrosion cup test can be performed by using the tundish
refractory lining (MgO), core nozzle refractory (Spinel-C) and side-dam refractory (BN-
ZrO2-SiC). Mn-Si killed steel of typical chemistry at the LMF can be reacted at 1600°C
with these refractories individually to study the formation of new inclusions as well as the
evolution of existing inclusions. Further, the steel already reacted with one of the

135
refractories could be tested against other refractories. The modified or newly formed
inclusions would be carried forward to interact with other refractories in the system.
VTD Model Verification: Trial heats can be run in the industry by varying argon and
pressure profile into the VTD. This data can then be used in the model for verification.
Such a study could be useful to determine the contribution of each mechanism towards
decarburization in the VTD.

136
APPENDIX A.
DATA FROM AUTOMATED SCANNING ELECTRON MICROSCOPE
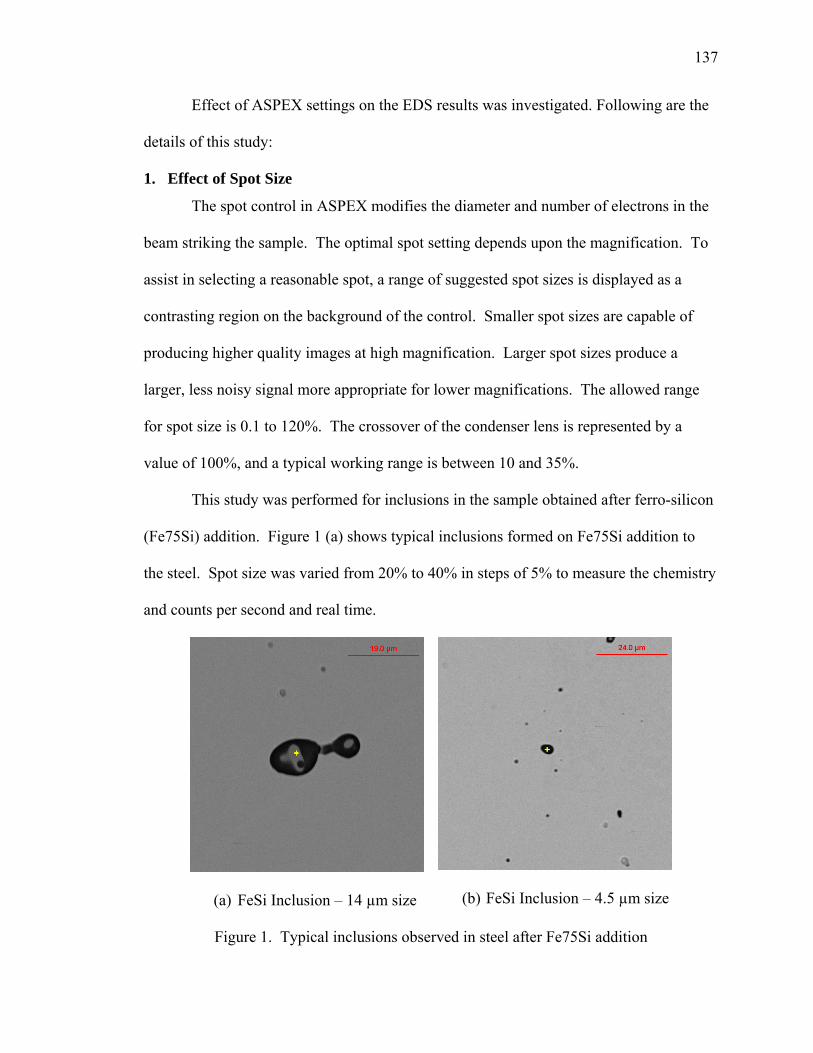
137
Effect of ASPEX settings on the EDS results was investigated. Following are the
details of this study:
1. Effect of Spot Size
The spot control in ASPEX modifies the diameter and number of electrons in the
beam striking the sample. The optimal spot setting depends upon the magnification. To
assist in selecting a reasonable spot, a range of suggested spot sizes is displayed as a
contrasting region on the background of the control. Smaller spot sizes are capable of
producing higher quality images at high magnification. Larger spot sizes produce a
larger, less noisy signal more appropriate for lower magnifications. The allowed range
for spot size is 0.1 to 120%. The crossover of the condenser lens is represented by a
value of 100%, and a typical working range is between 10 and 35%.
This study was performed for inclusions in the sample obtained after ferro-silicon
(Fe75Si) addition. Figure 1 (a) shows typical inclusions formed on Fe75Si addition to
the steel. Spot size was varied from 20% to 40% in steps of 5% to measure the chemistry
and counts per second and real time.
(a) FeSi Inclusion – 14 µm size (b) FeSi Inclusion – 4.5 µm size
Figure 1. Typical inclusions observed in steel after Fe75Si addition

138
Table 1. Inclusion composition for inclusion shown in Figure 1 (a) for different spot-sizes
Spot Size (%) O (%) Fe (%) Si (%)
20 48.1 35.2 12.7 25 46.8 37 12.9 30 47.1 37.4 12.2 35 46.4 37.3 12.8 40 47 36.7 12.6 47.08 ± 0.56 36.72 ± 0.80 12.64 ± 0.24
Table 2. Inclusion composition for inclusion shown in Figure 1 (b) for different spot-size
Spot Size (%) O (%) Fe (%) Si (%) 20 52.9 9.4 34.5 25 52.5 8 36.3 30 52.3 8.6 36 35 54.2 8.3 34.4 40 51.9 8.5 36.5 52.76 ± 0.79 8.56 ± 0.47 35.54 ± 0.90
Findings from the above analysis:
1. With the change in spot size, the composition of each element shows a minimal
(±1.5%) variation.
2. The real time (time for EDS analysis) does not change with spot size. A variation
of only 0.1 seconds was observed.
3. With increasing spot size the counts per second increases. It is advisable to have a
high count per second without exceeding dead time beyond 50%.
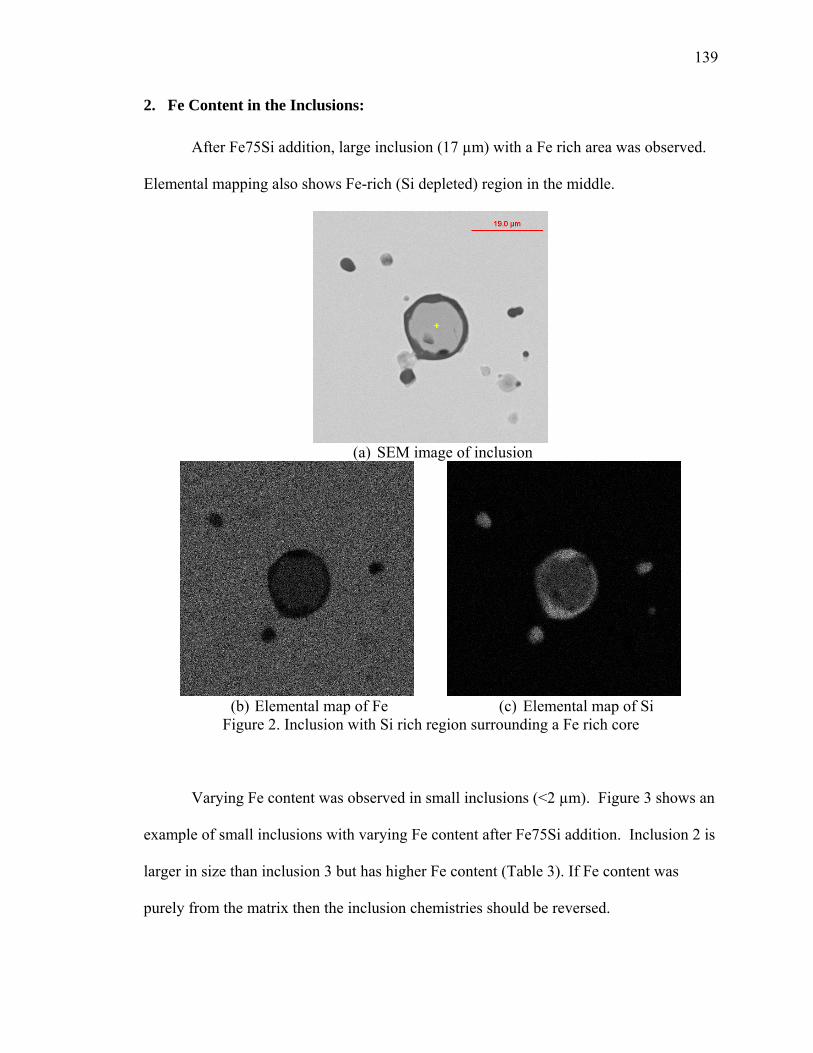
139
2. Fe Content in the Inclusions:
After Fe75Si addition, large inclusion (17 µm) with a Fe rich area was observed.
Elemental mapping also shows Fe-rich (Si depleted) region in the middle.
(a) SEM image of inclusion
(b) Elemental map of Fe
(c) Elemental map of Si
Figure 2. Inclusion with Si rich region surrounding a Fe rich core
Varying Fe content was observed in small inclusions (<2 µm). Figure 3 shows an
example of small inclusions with varying Fe content after Fe75Si addition. Inclusion 2 is
larger in size than inclusion 3 but has higher Fe content (Table 3). If Fe content was
purely from the matrix then the inclusion chemistries should be reversed.
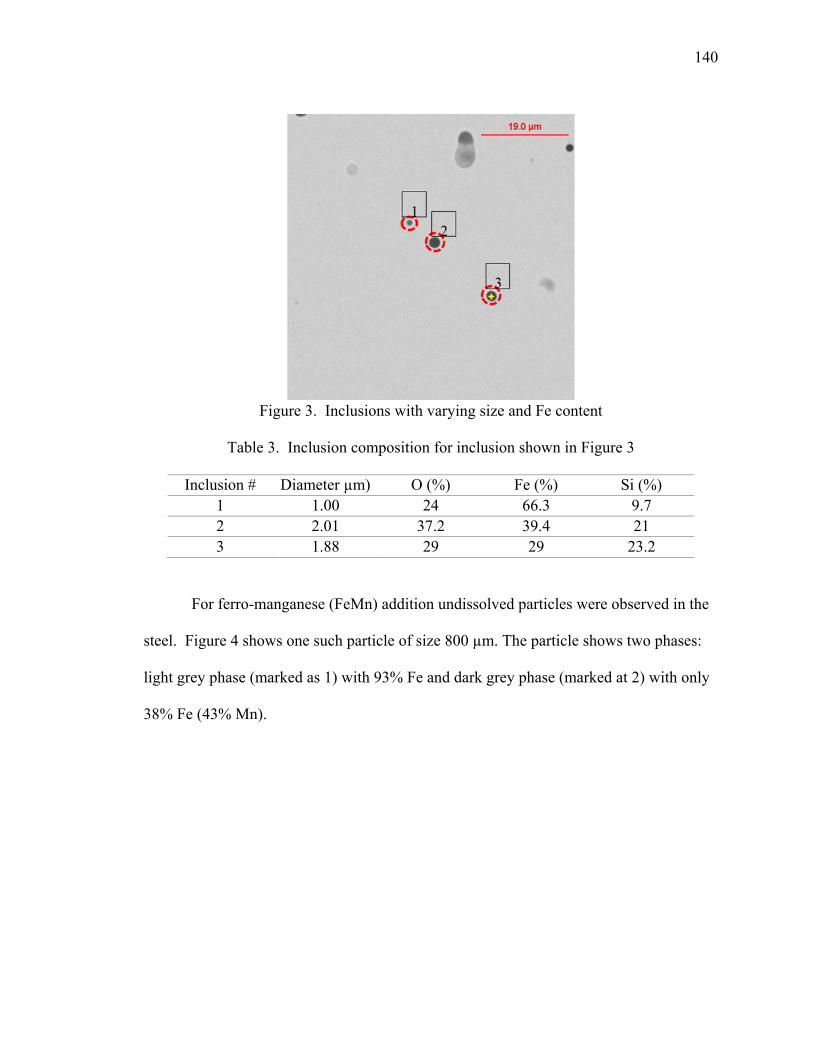
140
Figure 3. Inclusions with varying size and Fe content
Table 3. Inclusion composition for inclusion shown in Figure 3
Inclusion # Diameter µm) O (%) Fe (%) Si (%)
1 1.00 24 66.3 9.7 2 2.01 37.2 39.4 21 3 1.88 29 29 23.2
For ferro-manganese (FeMn) addition undissolved particles were observed in the
steel. Figure 4 shows one such particle of size 800 µm. The particle shows two phases:
light grey phase (marked as 1) with 93% Fe and dark grey phase (marked at 2) with only
38% Fe (43% Mn).
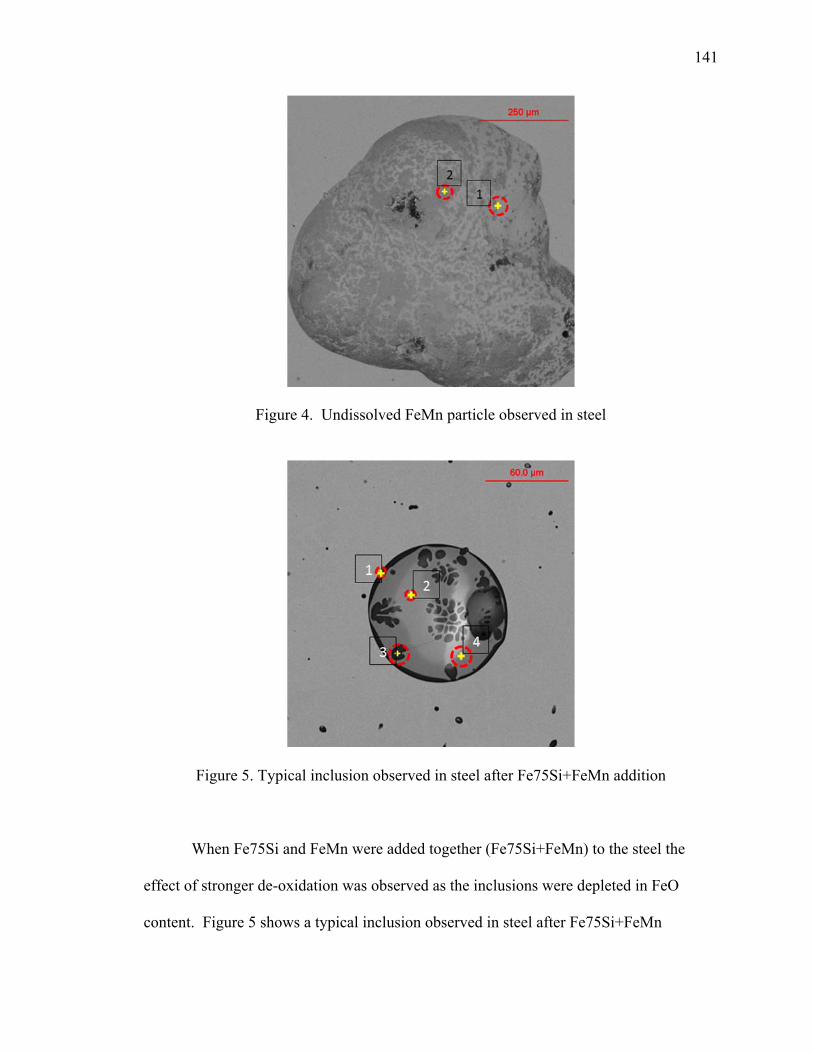
141
Figure 4. Undissolved FeMn particle observed in steel
Figure 5. Typical inclusion observed in steel after Fe75Si+FeMn addition
When Fe75Si and FeMn were added together (Fe75Si+FeMn) to the steel the
effect of stronger de-oxidation was observed as the inclusions were depleted in FeO
content. Figure 5 shows a typical inclusion observed in steel after Fe75Si+FeMn
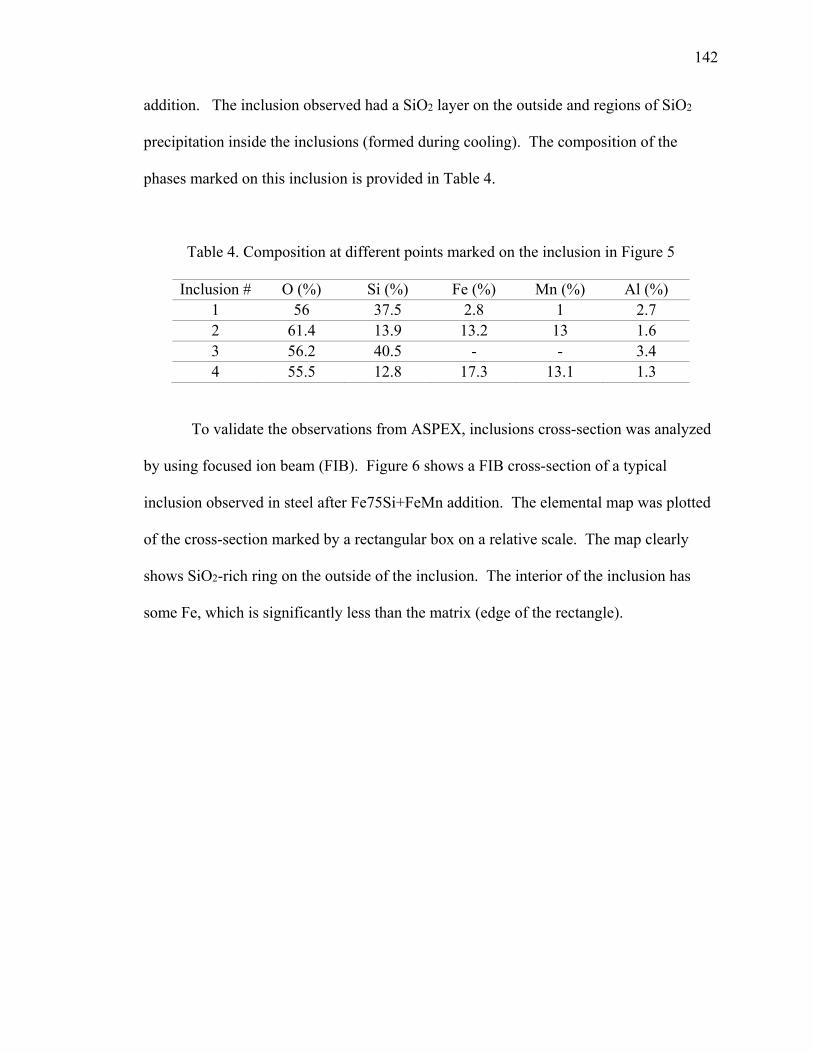
142
addition. The inclusion observed had a SiO2 layer on the outside and regions of SiO2
precipitation inside the inclusions (formed during cooling). The composition of the
phases marked on this inclusion is provided in Table 4.
Table 4. Composition at different points marked on the inclusion in Figure 5
Inclusion # O (%) Si (%) Fe (%) Mn (%) Al (%) 1 56 37.5 2.8 1 2.7 2 61.4 13.9 13.2 13 1.6 3 56.2 40.5 - - 3.4 4 55.5 12.8 17.3 13.1 1.3
To validate the observations from ASPEX, inclusions cross-section was analyzed
by using focused ion beam (FIB). Figure 6 shows a FIB cross-section of a typical
inclusion observed in steel after Fe75Si+FeMn addition. The elemental map was plotted
of the cross-section marked by a rectangular box on a relative scale. The map clearly
shows SiO2-rich ring on the outside of the inclusion. The interior of the inclusion has
some Fe, which is significantly less than the matrix (edge of the rectangle).
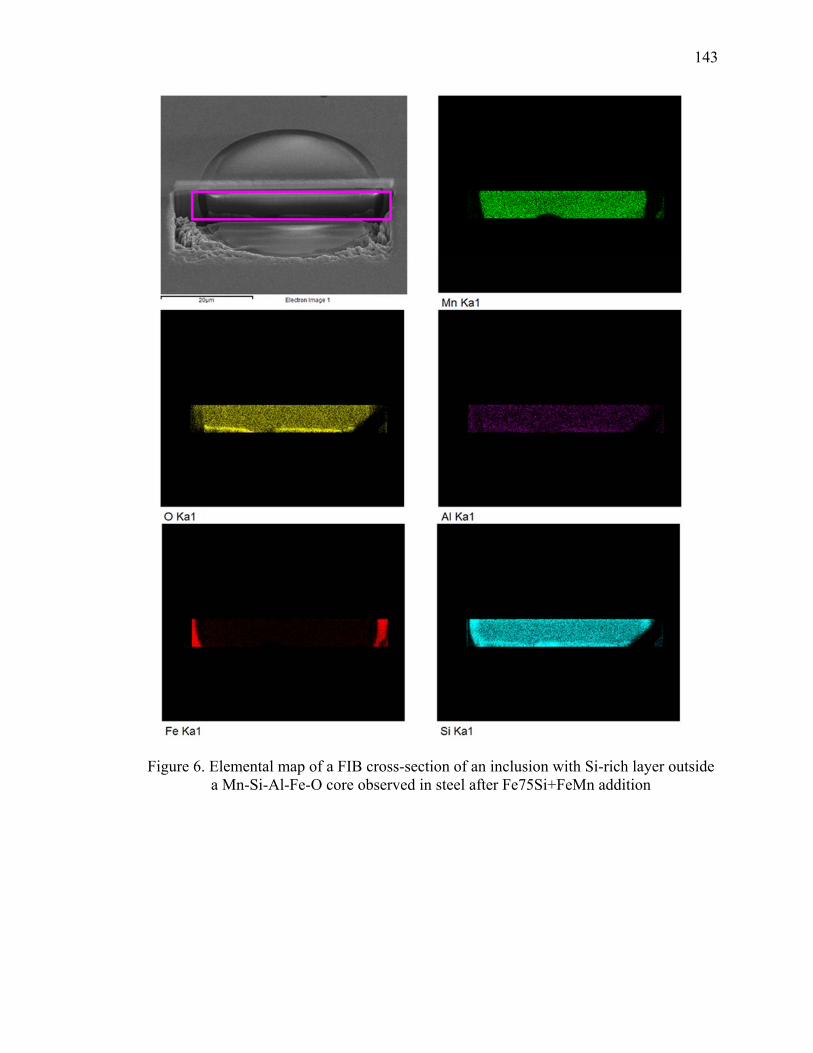
143
Figure 6. Elemental map of a FIB cross-section of an inclusion with Si-rich layer outside a Mn-Si-Al-Fe-O core observed in steel after Fe75Si+FeMn addition

144
APPENDIX B.
CALCULATION OF SOLIDIFICATION TIME IN THE CERAMIC SAMPLER
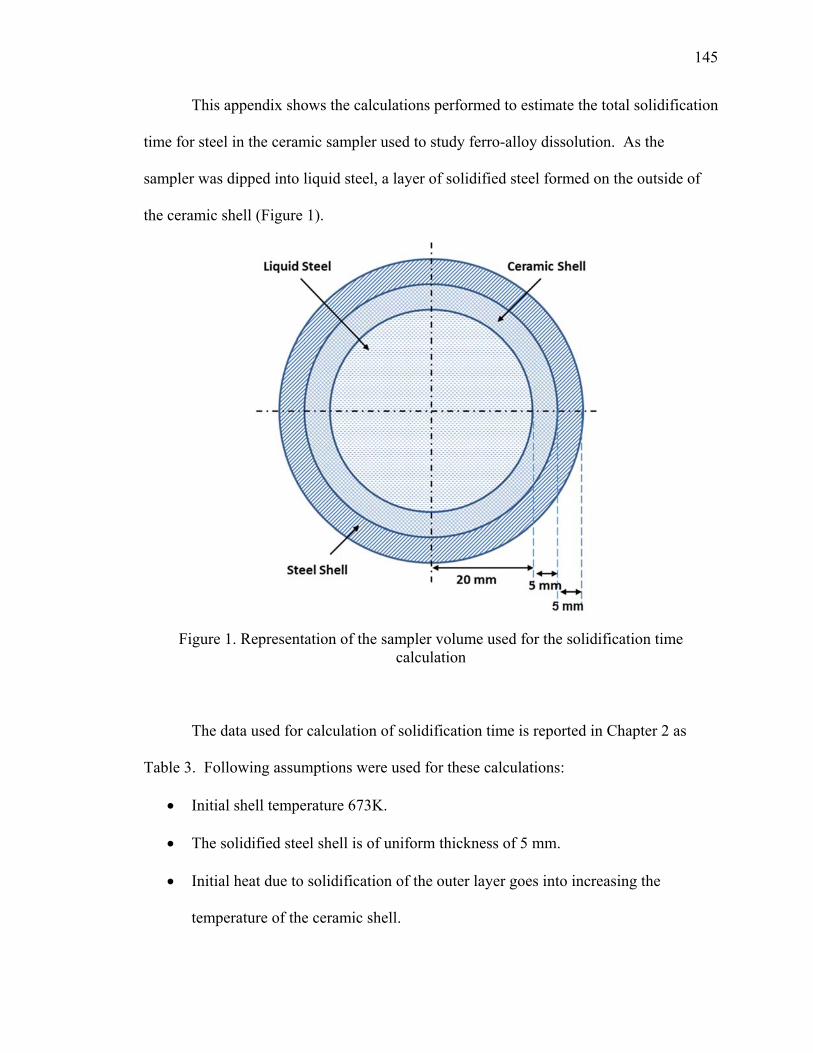
145
This appendix shows the calculations performed to estimate the total solidification
time for steel in the ceramic sampler used to study ferro-alloy dissolution. As the
sampler was dipped into liquid steel, a layer of solidified steel formed on the outside of
the ceramic shell (Figure 1).
Figure 1. Representation of the sampler volume used for the solidification time calculation
The data used for calculation of solidification time is reported in Chapter 2 as
Table 3. Following assumptions were used for these calculations:
Initial shell temperature 673K.
The solidified steel shell is of uniform thickness of 5 mm.
Initial heat due to solidification of the outer layer goes into increasing the
temperature of the ceramic shell.

146
Table 1 and Table 2 show the calculation results for heat released by steel and
change in temperature of the ceramic shell respectively.
Table 1. Calculation for heat released by the solidified steel layer
Inner Radius (mm)
Outer Radius (mm)
Density (kg/m3)
Heat of fusion for Steel (J/kg)
Total Heat (J)
25 30 7268 246557 85383.17
Table 2. Calculation for Temperature rise in the ceramic shell
Inner Radius (mm)
Outer Radius (mm)
Density (kg/m3)
Heat Capacity (J/kg.K)
∆T (K)
20 25 2020 1500 882.27
Using the above data, the total solidification time can be calculated as follows:
At t=0, o T = 1873 K for 0 < R < 20 mm. o T = 1555 K for 20 mm < R < 25 mm o T = 1758 K (solidus temperature) for 25 mm < R < 30 mm
For steady state, o T = 1758 K at R =20 mm.
For steady state heat loss,
Transfer due to conduction through (shell + solidified steel) = Rate of heat loss at the
outer surface (R=30 mm) of the solidified steel due to convection + radiation
1758 .
14
1. 02
1. 025
14
1. 025
1. 03
4 . 03 . 300 4 . 03 . 300
Using є = 0.5,
o T = 1414.5 K at R = 30 mm. o Rate of heat loss = 1415.9 Watts o T = 1436.3 K at R = 25 mm. o hair = 10.45 W/m2K

147
{ hc = 10.45 - v + 10 v1/2
where, v = the relative speed of the object through the air (m/s) }
To reach steady state,
o Heat required by ceramic shell,
1555 4.
.
Where, 1758 .
. ..02
On solving heat required = 2930.8 J
o Heat lost by solidified steel layer outside the shell
1758 4.
.
Where, 1436.3 . .
. ..025
On solving heat lost = 23665 J
For steel in the sampler to completely solidify (final T = 1758 K),
o Heat lost by liquid steel, 43
.02
On solving heat lost = 79221 J
Heat Balance
Total available heat ( -2930.8 + 23665 + 79221 ) = Rate of heat loss x time
Time = 70 .6 seconds

148
APPENDIX C.
MnS PRECIPITATES ON TITANIUM-OXIDE INCLUSIONS

149
Figure 1. Inclusions observed in steel after FeTi addition with MnS particles precipitated on the oxide inclusions
Table 1. Composition at points marked in Figure 1
Element Weight% #1 #2 #3
O K 25.29 26.46 31.67
Al K 0.7 0.78 0.74
Si K 5.44 4.8 5.81 S K 6.28 6.59 0.6 Ti K 26.02 24.35 28.01 Mn K 20.7 20.6 13.91 Fe K 15.57 15.98 19.26
150
APPENDIX D.
MACRO PROCESSING USING FACTSAGE

151
FactSage provides a macro language which can be used to treat large and lengthy
calculation. Macros can be used to automate the calculations which need to be repeated.
Users can write series of commands and functions as calculation steps which are repeated
by the macro processor. The macro processor loads “equilib” files, can read input
parameters from an Excel file (or built-in the code), calculates the equilibrium and save
the results. Then it moves on to the next step and repeats this procedure. Thus it enables
the user to automatically run “equilib” files in the background. However, if Excel file is
being used by the macro, it prevents the user from using Microsoft excel during the
course of the simulation.
The first step to writing a macro code is to create “equilib” files and save them in
a directory. FactSage macro processing looks for “equilib” and “stream” files in the
defined
“My Files” directory. The default “My Files” directory in FactSage is “C:\FactSage\”.
Macro files can be created/edited with text editor. The extension for these files is
“*.mac”. There are four principal macro commands:
– OPEN: Opens the “equilib” file.
– CALC: Runs the “equilib” file.
– SAVE: Saves stream/data
– SHOW: Shows the “equilib” file during processing.
Following are the steps to run a macro file
Go to the reactants window in the “Equilib” module
Go to File → Macro processing → Run macro → Browse →
Locate the “*.mac” file and open → ok
152
FactSage provides a feature called Object Linking and Embedding (OLE) to link
FactSage with an excel workbook. By creating OLE links, user can read or write data to
an excel workbook. Up to nine simultaneous dynamic links can be created (OLE1 to
OLE9) allowing users to read/write data from nine worksheets. This feature can be used
to read inputs and store intermediate Equilib calculation results into excel. Following are
some basic commands to use with OLE:
To create an OLE link – OLEn Excelfilename.xlsx sheetname (or .xls for older
versions of excel)
To clear cells – OLEn CELLS ALL CLEAR (for all cells in the worksheet)
– OLEn RANGE A1:C3 CLEAR (for a range of cells)
To read value from a cell – %var OLEn READ A1 or %var OLEn READ
R10C10 (where %var is a variable)
To write a value from a cell – %var OLEn WRITE A1 or %var OLEn WRITE
R10C10
To save and close excel link – OLEn CLOSE SAVE ‘Excelfilename’
To close worksheet without saving – OLEn QUIT
Variables can be defined in the macro language by using a “%” sign in front of
the variable name. There are nine pre-declared variables (built-in notations), %1 to %9,
which can be used without declaring them first. User variables can be declared by the
VARIABLE statement. Following are some basic commands used along with variables:
Value allocation – %var = 2 (with space before and after the “=” sign)
%var STEP value – adds ‘value’ to %var
%var STEP – adds 1 to %var
Variables are used in defining loops
%var = 'FirstValue' TO 'LastValue' STEP 'IncrementValue'
(macro lines)
153
%var LOOP // End of loop.
A LOOP is always executed at least once ('FirstValue'). Loops can be nested.
The end of a macro is identified by the command “END”. “END” indicates the
end of processing and all commands after that are ignored. User can create a jump to the
END (quit the macro program) by using the command “GOTO END”.
IF … GOTO END
The logical operators available in the macro language are: =, <, >, <> (not equal to), <=,
>=. Multiple operators AND or OR can also be used. These can be combined with IF
THEN ELSEIF operators.
IF … THEN … ELSEIF … ENDIF
Nested IFs are NOT permitted.
Users can use REM to write remarks within the code. Another option to write
comments within the code is to use “//”. The macro processor ignores anything written
after “//” in a line. The use of comments in the code by using “//” makes it easier to read
and understand the code. Following is a sample macro code:
REM // File VTD-Kinetics.mac - FactSage 6.4 (29Jan2015)
REM ================================
REM Remarks about the code.
REM ================================
HIDE // hide the Equilib window
PAUSE 1 // pause the execution for
// 1 sec to allow the
// user to read the comment
VARIABLE %Temp %row %col %dum // user defined variables
%DIR C:\FactSage\test3
// reset of default FactSage
// directory

154
OLE1 Model-data.xlsx Datatest // creation of OLE link
OLE2 Model-data.xlsx Results %row = 2 // position of row to
%col = 2 // read/print
%dum = 1 TO 10 // loop over max. time-step
// in excel
%dum OLE2 WRITE R%rowC1 // write time-step value into
// 1stcolumn of the current
// row
IF %dum = 1 THEN // Initiation
OPEN EquiCreate-Steel-t0.DAT // Open Equilib file to
// create steel with the
// initial composition
SET REACTANT 1 MASS 3534 // set the value of 1st
// reactant
// in the equilib file
SET FINAL P 1 // set Pressure at 1 atm
CALC // execute the equilib file
SAVE MixtSteel-Zone0.DAT FSstel-LIQU // Save the liquid steel
// stream
SAVE MixtLIncl-Zone0.DAT FToxid-SLAGA // Save the slag stream
SAVE MixtSIncl-Zone0.DAT SOLIDS // Save all the solids
ENDIF
OPEN EquiFEM-Zone-1.DAT
%2 OLE1 READ R%rowC2 // read from Excel
SET REACTANT 1 MASS %2 // SET reactant 1 mass
%2 OLE1 READ R%rowC3
SET REACTANT 2 MASS %2
%2 OLE1 READ R%rowC4
SET REACTANT 3 MASS %2
%2 OLE1 READ R%rowC5 // read from Excel
SET FINAL P %2 // SET final pressure

155
CALC
%1 = 1 to 3 // loop for values of
// variable%1 from 1 to 3
%results = $E_mg%1$ // store the weight of
// solution no.%1 into
// variable %results
%results OLE2 WRITE R%rowC%col // write the stored value in
// %results at currentrow
// and column
%col STEP // increment %col value by 1
%1 LOOP // continue loop until final
// value ‘3’ is achieved
%col STEP // increment %col value by 1
%1 = 128 TO 152 // loop from 128 to 152
%results = $E_sg%1$ // store the weight of
// species no.
// %1 into %results variable
%results OLE2 WRITE R%rowC%col // write in excel
%col STEP // increment %col value by 1
%1 LOOP // end of loop
%row STEP // increment %row value by 1
%dum LOOP // continue loop %dum until
// final
// value ‘10’ is achieved
END // end of macro
156
REFERENCES
1) J.P. Birat: Ironmaking & Steelmaking, 31 (2004), 183.
2) S. Ge, M. Isac and R.I.L. Guthrie: ISIJ Int., 52 (2012), 2109.
3) H. Bessemer: US Patent 49053, (1865).
4) Z. Zhang, F. Zhang and F. Wang: Research on Iron & Steel, 39 (2011), 57.
5) Nucor Corporation: Castrip Technology, Process and Product Information Brochure, Castrip LLC, Charlotte, NC, (2014).
6) D.J. Sosinsky, P. Campbell, W. Blejde, R. Mahapatra and F. Fisher: Metallurgist, 52 (2008), 691.
7) T. Smith: 4th European Continuous Casting Conf., Steel Times International, Birmingham, UK, (2003), 29.
8) P. Campbell, W. Blejde, R. Mahapatra, R. Wechsler and G. Gillen: Iron and Steel Technology, 2 (2005), 56.
9) D. G. Edelman, P. C. Campbell, C. R. Killmore, K. R. Carprnter, H.R. Kau, J. G. Williams and W. N. Blejde: Iron Steel Technol., 6 (2009), 47.
10) C.R. Killmore, H. Creely, A. Phillips, H. Kaul, P. Campbell, M. Schueren, J.G. Williams and W. Blejde: Materials Forum, 32 (2008), 13.
11) S. Ge, M. Isac and R.I.L. Guthrie: ISIJ Int., 53 (2013), 729.
12) L. Holappa, M. Hämäläinen, M. Liukkonen and M. Lind: Ironmaking &Steelmaking, 30 (2003), 111.
13) Y. Higuchi, M. Numata, S. Fukagawa and K. Shinme: ISIJ Int., 36 (1996), S151.
14) L. Zhang and B.G. Thomas: ISIJ Int., 43 (2003), 271.
15) E. T. Turkdogan: “Fundamentals of Steelmaking”, The Institute of Materials, London, (1996), 1.
16) S.A. Argyropoulos and R.I.L. Guthrie: Proc. Of the 65th Steelmaking Conf., ISS, Warrendale, PA, USA, (1982), 156.

157
17) S.A. Argyropoulos: Electric Furnace Proc., Detroit, Mich., USA, (1983), 81.
18) L. Holappa and S. Louhenkilpi: The 13th International Ferroalloys Congress, Almaty, Kazakhstan, (2013), 1083.
19) M.M. Pande, M. Guo, X. Guo, D. Geysen, S. Devisscher, B. Blanpain and Patrick Wollants: Ironmaking & Steelmaking, 37 (2010), 502.
20) P.V. Riboud, C. Gatellier, H. Gaye, J. Pontoire and P. Rocabois: ISIJ Int., 36 (1996), S22.
21) M. Iguchi, Y. Sumida, R. Okada and Z. Morita: ISIJ Int., 34 (1994), 164.
22) M.L. Yang, Z.S. Li, F.L. Wei, C.G. Cheng, X. Chen and S.B. Qi: Advanced Materials Research, 424-425 (2012), 811.
23) H. Solhed and L. Jonsson: Scandinavian Journal of Metallurgy, 32 (2003), 15.
24) “Treatise on Process Metallurgy”, Vol. 2, ed. by S. Seetharaman, Elsevier, (2014),
266.
25) K. Beskow and D. Sichen: Ironmaking & Steelmaking, 31 (2004), 393.
26) S. Riaz, K.C. Mills and K. Bain: Ironmaking & Steelmaking, 29 (2002), 107.
27) M. Song, M. Nzotta and D. Sichen: Steel Research Int., 80 (2009), 753.
28) J.W. Cho, T. Emi, H. Shibata and M. Suzuki: ISIJ Int., 38(1998), 834.
29) J.W. Cho, H. Shibata, T. Emi and M. Suzuki: ISIJ Int., 38 (1998), 440.
30) Z. Feng, M. Changsong and L. Guangqiang: Baosteel Technical Research, 9 (2012), 47.
31) B.R. Marple, S. Poudrette and F.G. Hamel: 75th Steelmaking Conference Proc., Toronto, Canada, (1992), 353.
32) A. Kumar, V. Thapliyal and J. Smith: Int. J. of Applied Ceramic Tech., 11 (2014), 1001.
33) A. Kumar, V. Thapliyal, D.G.C. Robertson and J.D. Smith: J. Am. Ceram. Soc.,
(2015). doi: 10.1111/jace.13492.

158
34) A. Kumar, V. Thapliyal and J. Smith: China’s Refractories, 0 (2015), 1.
35) “Treatise on Process Metallurgy”, Vol. 3, ed. By S. Seetharaman, Elsevier, (2014),
347.
36) L. Zhang and B.G. Thomas: XXIV National Steelmaking Symposium, Morelia, Mich, Mexico, (2003), 138.
37) R. Kiessling: “Non-metallic Inclusions in Steel”, The institute of Materials, London, (1968), Q87.
38) S. Maeda, T. Soejima, T. Saito, H. Matsumoto, H. Fujimoto and T. Mimura: Steelmaking Conference Proc., Vol. 77, ISS, Warrendale, PA, USA, (1989), 379.
39) G. Murtazaand R. Akid: Eng. Fract. Mech., 67(2000), 461.
40) 1997-2002 Kawasaki Steel 21st Century Foundation, 2003 JFE 21st Century Foundation in http://www.jfe-21st-cf.or.jp/chapter_1/1c_1.html
41) V. B. Ginzburg and R. Ballas: “Flat Rolling Fundamentals”, ed. by Marcel Dekker, Inc., New York, Basel, (2000), 354.
42) L.A. Frank: Steelmaking Conference Proc., Vol. 84, ISS, Baltimore, Maryland, (2001), 403.
43) C. E. Sims: Trans. Met. Soc. AIME, 215 (1959), 367.
44) L.O. Uhrus: “Clean Steel”, Special Report No. 77 of Iron and Steel Institute, London, 1962, 104.
45) J.D. Murray and R.F. Johnson: ISI Special Report 77, London, 1963, 110.
46) M. Atkinson: JISI, 195 (1960), 64.
47) A. Josefsson, Y. Koeneman and G. Lagerberg: JISI, 191 (1959), 240.
48) A. Schoberl: Radex-Rundschau, (1966), 170.
49) G. Hassal and K. Mills: “Fundamental Studies Related to the Mechanisms of Inclusion Removal from Steel”, Technical Steel Research, (1987), 31.
50) R. Kiessling: Met. Sci., 14(1980), 161.
159
51) “Treatise on Process Metallurgy”, Vol. 3, ed. By S. Seetharaman, Elsevier, (2014), 358.
52) J. Takamura and S. Mizoguchi: The 6th International Iron and Steel Congress, Vol. 1, IISC, Nagoya, Japan, (1990), 591.
53) S. Mizoguchi and J. Takamura: The 6th International Iron and Steel Congress, Vol. 1, IISC, Nagoya, Japan, (1990), 598.
54) Z. Ma and D. Janke: Acta Metallurgica Sinica, 11 (1998), 79.
55) Zhongting Ma : “Control of Nonmetallic Inclusions in Continuously Cast Steels in View of Macro-cleanliness, Castability, Precipitation Modification and Grain Refinement”, PhD Thesis, TU Bergakademie Freiberg, Germany, 2001.
56) “The Making, Shaping and Treating of Steel”, 11th edition, ed. By R.J. Fruehan, The AISE Steel Foundation, Pittsburg, PA, (1998), 693.
57) “The Making, Shaping and Treating of Steel”, 11th edition, ed. By R.J. Fruehan, The AISE Steel Foundation, Pittsburg, PA, (1998), 151.
58) R.J. Fruehan: “Vacuum Degassing of Steel”, ISS, Warrendale, PA, (1990), 1.
59) N. Bannenberg, P. Chapellier and M. Nadif: Steel Research, 113 (1993),75.
60) N. Bannenberg, B. Bergmann and H. Gaye: Steel Research, 63 (1992), 431.
61) FLUENT 6.2: Fluent Inc., Lebanon, New Hampshire, Report, (2005).
62) I.-H. Jung, S. Decterov and A.D. Pelton, "Computer Applications of Thermodynamic Databases to Inclusion Engineering", ISIJ Int., 44 (2004), 527.
63) METSIM Process Simulator, Available at http://www.metsim.com, (2014).
64) L. Zhang, S. Taniguchi and K.Cai: Metallurgical and Materials Transactions B, 31 (2000), 253.
65) B. Kaufmann, A. Niedermayr, H. Sattler, and A. Preuer: Steel Res., 64 (1993), 203.
66) K.-H. Tacke and J.C. Ludwig: Steel Res., 58 (1987), 262.
67) Y. Sahai and T. Emi: ISIJ Int., 36 (1996),166.
68) A.K. Sinha and Y. Sahai: ISIJ Int., 33 (1993), 556.
69) Lindborg and Torssell: Trans AIME, 242 (1968), 94.
160
70) P. Rocabois, C. Gatellier and J.P. Teres: Ironmaking and Steelmaking, 30 (2003), 95.
71) P. Kozakevitch and M. Olette: “Production and Application of Clean Steels”, The Iron and Steel Institute, London, (1972), 42.
72) A. W. Cramb and I. Jimbo: W. O. Philbrook Memorial Symposium Proc., ISS,Warrendale, PA, (1988), 259.
73) H. Gaye, L. D. Lucas, M. Olette and P. V. Riboud: Can. Metall. Q., 23 (1984), 179.
74) K. Nogi and K. Ogino: Can. Metall. Q., 22 (1983), 19.
75) J. Mancini and J. Stel: Rev. Métall., CIT, 89 (1992), 269.
76) D. Bourisa and G. Bergeles: Metallurgical and Materials Transactions B, 29 (1998), 641.
77) S.K. Michelic, M. Hartl, B. Mario and C. Bernhard: AISTech 2011 Proc., Vol. II, ISS, Warrendale, PA, USA, (2011), 617.
78) R. Dippenaar: Ironmaking & Steelmaking, 32(2005), 35.
79) S.H. Lee, C. Tse, K.W. Yi, P. Misra, V. Chevrier, C. Orrling, S. Sridhar and A. W. Cramb: Journal of non-crystalline solids, 282 (2001), 41.
80) K. G. Rackers and B. G. Thomas: 78thSteelmaking Conference Proc., ISS, Nashville, TN, (1995), 723.
81) R.B. Tuttle: “Innovative Refractories for Preventing Nozzle Clogging in Continuously Cast Aluminum-Killed Steels”, PhD Thesis, Missouri S&T, MO, (2004).
82) S. Ogibayashi: Taikabutsu Overseas, 15 (1995), 3.
83) T. Kawawa and M. Ohkkubo: Transactions ISIJ, 8 (1968), 203.
84) K. Krishnapisharody and G.A. Irons: Steel Research international, 81 (2010), 880.
85) M. Ek, P. Valentin and D. Sichen: Steel Research international, 81 (2010), 1056.
86) E.T. Turkdogan: “Fundamentals of Steelmaking”, The Institute of Materials, London, (1996), 251.
161
87) Y.J. Kang, L. Yu and D. Sichen: Ironmaking and Steelmaking, 34 (2007), 253.
88) V. Chevrier and A. Cramb: Proc. Prof. Holappa Conference on ‘Metal separation technology’, Copper Mountain, CO, (2004), 10.
89) J.P. Bellot, V.D. Felice, B. Dussoubs, A. Jardy and S. Hans: Metallurgical and Materials Transactions B, 45 (2014), 13.
90) B.G. Thomas, A. Dennisov and H. Bai: 80th Steelmaking Conference Proc., ISS, Chicago, IL, (1997), 375.
91) L. Zhang, J. Aoki and B.G. Thomas: Metallurgical and Materials Transactions B, 37 (2006), 361.
92) P. Cremer and J. Driole: Metallurgical and Materials Transactions B, 13 (1982), 45.
93) N. Kaddah: Conf. Records of IEEE on Industrial Applications, IEEE, Piscataway, NJ, (1988), 1162.
94) J. Alexis and J. Bjorkvall: AISTech 2011 Proc., ISS, Warrendale, PA, USA, (2011), 1389.
95) O.J. Ilegbusi and J. Szekely: ISIJ Int., 29 (1989), 1031.
96) L. Limoges and L. Beitelman: Iron Steelmaker, 24 (1997), 49.
97) P.C. Glaws, R.V. Fryan and D.M. Keener: 74th Steelmaking Conference Proc., ISS, Warrendale, PA, (1991), 247.
98) E. Pretorius, H. Oltman and T. Cash: AIST 2010 Conf. Proc, ISS, Warrendale, PA, USA, (2010), 31.
99) S. Yang, J. Li, Z. Wang, J. Li and L. Lin: International Journal of Minerals, Metallurgy, and Materials, 18 (2011), 18.
100) G. Walter, G. Torga, F. Fuhr and C. Cicutti: AISTech 2003 Conf. Proc., ISS, Warrendale, PA, USA, (2003), 165.
101) P.C. Pistorius, P. Presoly and K.G. Tshilombo: Proc. of TMS Annual Meeting and Exhibition, San Antonio, TX, (2006), 373. 102) N. Verma, M. Lind, P.C. Pistorius, R.J. Fruehan and M. Potter: Iron and steel
Technology, 7 (2010), 189.

162
103) N. Verma, P.C. Pistorius, R.J. Fruehan, M. Potter, H.G. Oltmann and E.B. Pretorious: Metallurgical and Materials Transactions B, 43 (2012), 830.
104) G. Yuming, X. Zhongbo and W. Haitao: Iron Steel Vanadium Titanium, 3(2007), 7.
105) I.H. Jung, G. Eriksson, P. Wu and A. Pelton: ISIJ Int., 49 (2009), 1290.
106) W.C. Doo, D.Y. Kim, S.C. Kang and K.W. Yi: Metals and Materials Int., 13 (2007), 249.
107) M. Fernandes, J.C. Pires, N. Cheung and A. Garcia: Materials Characterization, 51 (2003), 301.
108) P. Misra, V. Chevrier, S. Sridhar, and A.W. Cramb: Metall. Mater.Trans. B, 31
(2000), 1135. 109) Y. Kanga, I. Jung and H. Lee: Calphad, 30 (2006), 226.
110) H. Amitani, K. Morita and N. Sano: ISIJ Int., 36 (1996), S26.
111) A. Costa e Silva: Rare Metals, 25 (2006), 412.
112) C. Garlick, M. Griffiths, P. Whitehouse and C. Gore: Ironmaking and Steelmaking, 29 (2002), 140.
113) R. Kiessling: “Non-metallic Inclusions in Steel”, The Institute of Materials, London, (1978), I7.
114) A. Hultgren: Jernkont. Ann., 129 (1945), 633.
115) I.H. Jung, Y. Kang, S.A. Decterov and A.D. Pelton: Metallurgical and Materials Transactions B, 35 (2004), 259.
116) R.B. Snow: Journal of American Ceramic Society, 26 (1943), 11.
117) G. Roghani, E. Jak and P. Hayes: Metallurgical and Materials Transactions B, 33 (2002), 827.
118) Y.B. Kang, H.S. Kim, J. Zhang and H.G. Lee: Journal of Physics and Chemistry of Solids, 66 (2005), 219.

163
VITA
Vivek Thapliyal was born November, 7, 1984 at Chamoli, Uttrakhand, India. He
received his B.Tech. in Materials and Metallurgical Engineering in May 2007 from
Indian Institute of Technology (IIT), Kanpur, India. From November 2007 to May 2009,
he was a business analyst at marketRx, Gurgaon, India. Following that he worked with
Professor B. Deo as a senior research associate at IIT, Kanpur till May 2010. In August
2010, he started working as a graduate research assistant with Dr. Kent D. Peaslee at
Missouri S&T. He continued his research with Dr. Jeffrey D. Smith and received his
PhD in Material Science & Engineering in May 2015 from Missouri University of
Science and Technology. During his stay at Missouri S&T, he taught labs and lectures
on steelmaking for undergraduate courses.
Mr. Thapliyal was an active member of AIST since 2010 and has presented
posters and paper at AISTech conferences. Additionally, he was a member of Alpha
Sigma Mu since 2011.